4Q2025 | ||
| Supplemental Information | ||
| FURNISHED AS OF FEBRUARY 12, 2026 - UNAUDITED | ||
 | ||
4Q2025 | ||
| Supplemental Information | ||
| FURNISHED AS OF FEBRUARY 12, 2026 - UNAUDITED | ||
| ||
| FORWARD LOOKING STATEMENTS & RISK FACTORS | ||
| Table of Contents | ||
| 27 | |||||
HEALTHCARE REALTY | 4Q 2025 SUPPLEMENTAL INFORMATION 3 | |||||||
| Highlights | ||
HEALTHCARE REALTY | 4Q 2025 SUPPLEMENTAL INFORMATION 4 | |||||||
| Highlights | ||
| THREE MONTHS ENDED | YEAR ENDED | ||||||||||||||||||||||||||||
| DECEMBER 31, 2025 | DECEMBER 31, 2024 | DECEMBER 31, 2025 | DECEMBER 31, 2024 | ||||||||||||||||||||||||||
| (in thousands, except per share amounts) | AMOUNT | PER SHARE | AMOUNT | PER SHARE | AMOUNT | PER SHARE | AMOUNT | PER SHARE | |||||||||||||||||||||
| GAAP Net income (loss) | $14,391 | $0.04 | $(106,846) | $(0.31) | $(246,071) | $(0.71) | $(654,485) | $(1.81) | |||||||||||||||||||||
| NAREIT FFO, diluted | $126,981 | $0.36 | $105,642 | $0.30 | $490,048 | $1.38 | $193,257 | $0.52 | |||||||||||||||||||||
| Normalized FFO, diluted | $142,147 | $0.40 | $143,414 | $0.40 | $568,946 | $1.61 | $576,785 | $1.56 | |||||||||||||||||||||
HEALTHCARE REALTY | 4Q 2025 SUPPLEMENTAL INFORMATION 5 | |||||||
| Highlights | ||
| ACTUAL | 2026 GUIDANCE | ||||||||||
| 2025 | LOW | HIGH | |||||||||
| Earnings per share | $(0.71) | $(0.05) | $0.05 | ||||||||
| NAREIT FFO per share | $1.38 | $1.44 | $1.50 | ||||||||
| Normalized FFO per share | $1.61 | $1.58 | $1.64 | ||||||||
| Same Store Cash NOI growth | 4.8 | % | 3.5 | % | 4.5 | % | |||||
HEALTHCARE REALTY | 4Q 2025 SUPPLEMENTAL INFORMATION 6 | |||||||
| Highlights | ||
HEALTHCARE REALTY | 4Q 2025 SUPPLEMENTAL INFORMATION 7 | |||||||
Salient Facts 1 | ||
| Properties | 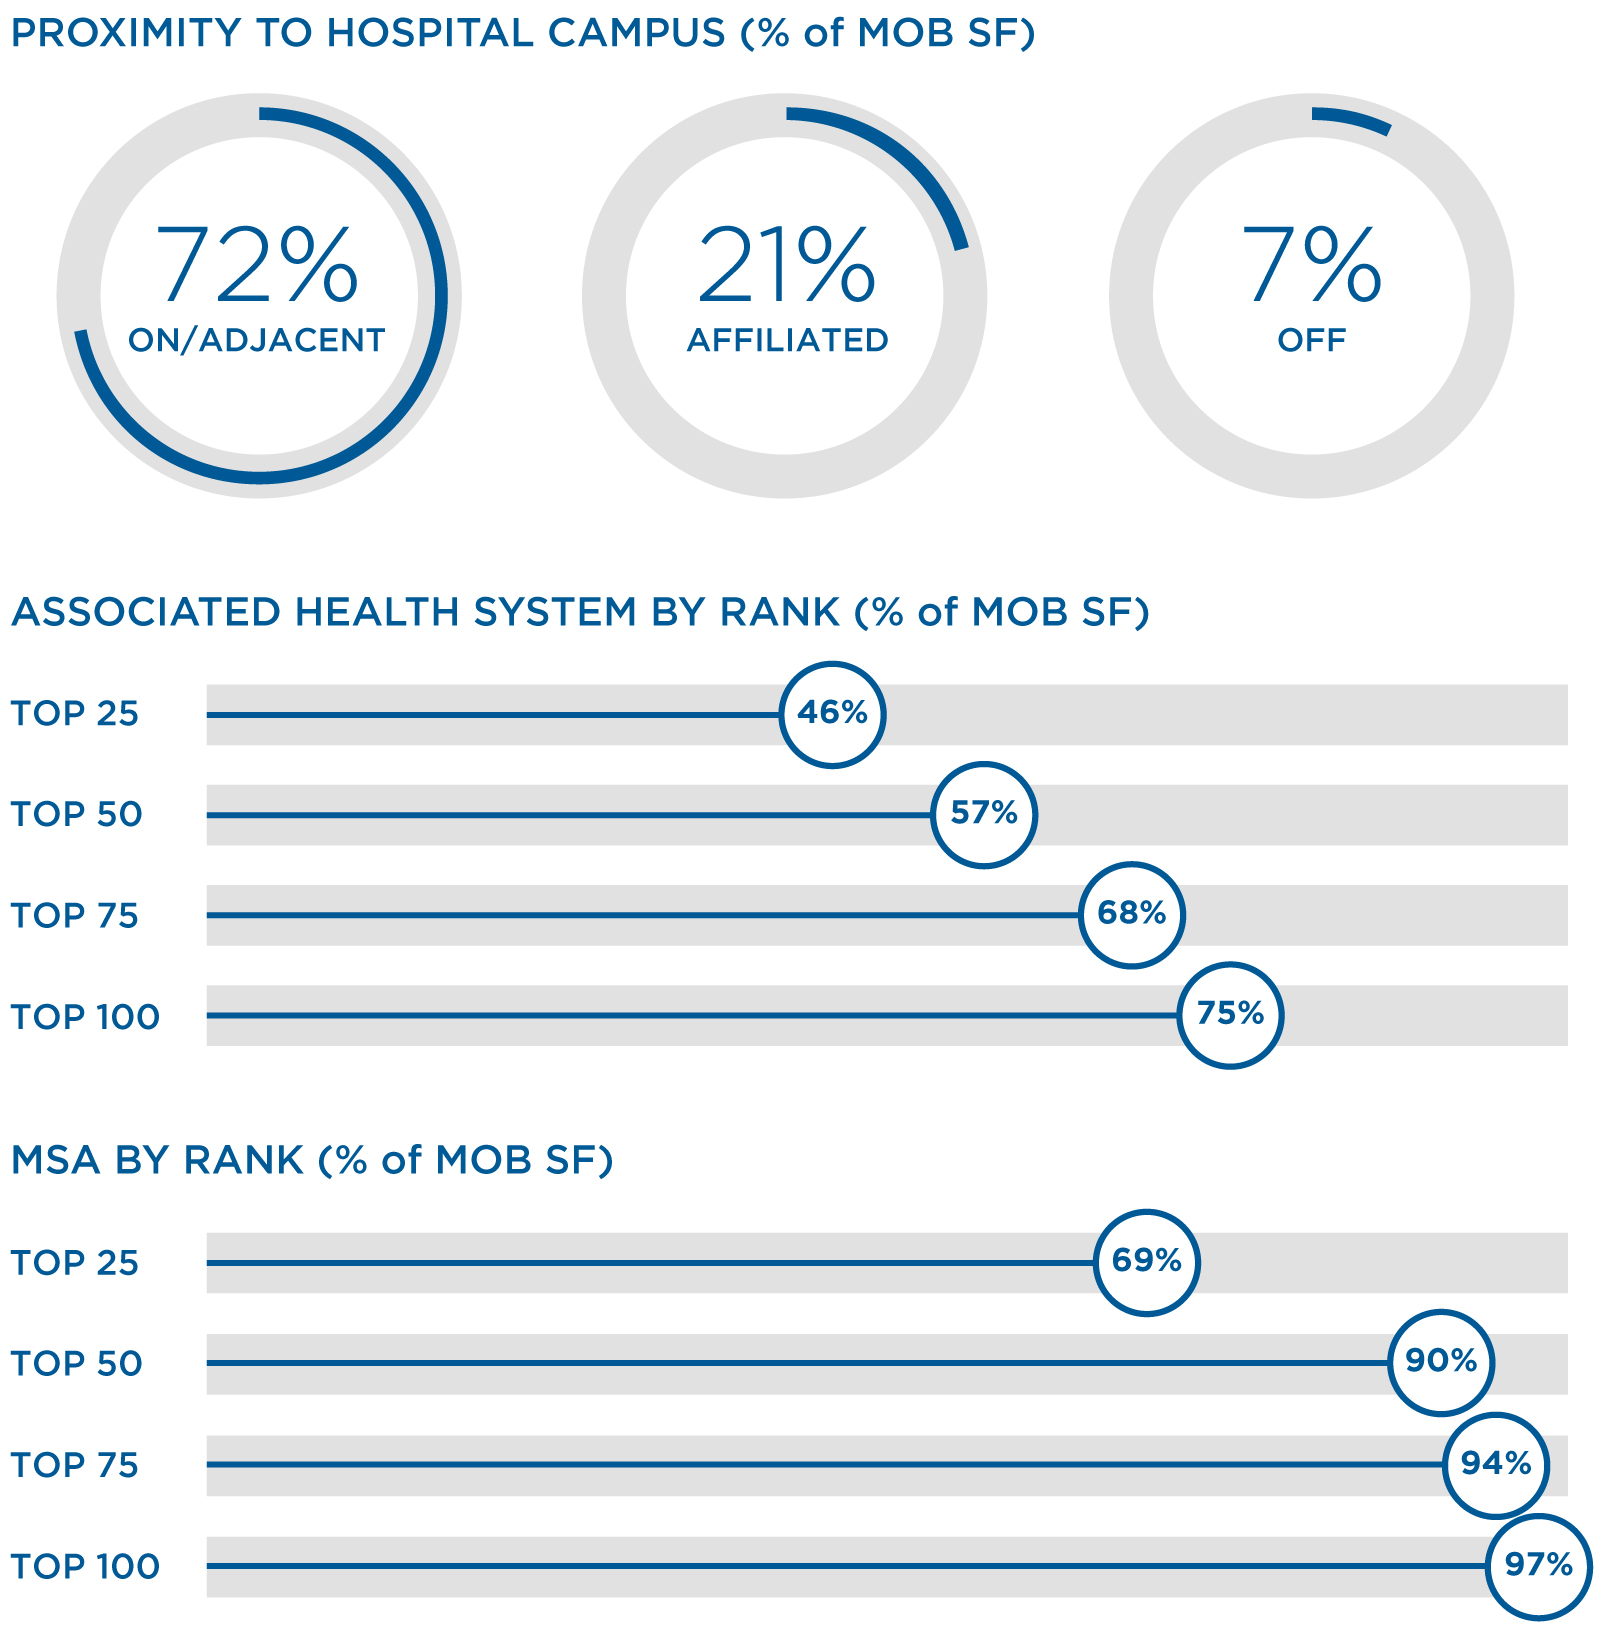 | ||||||||||
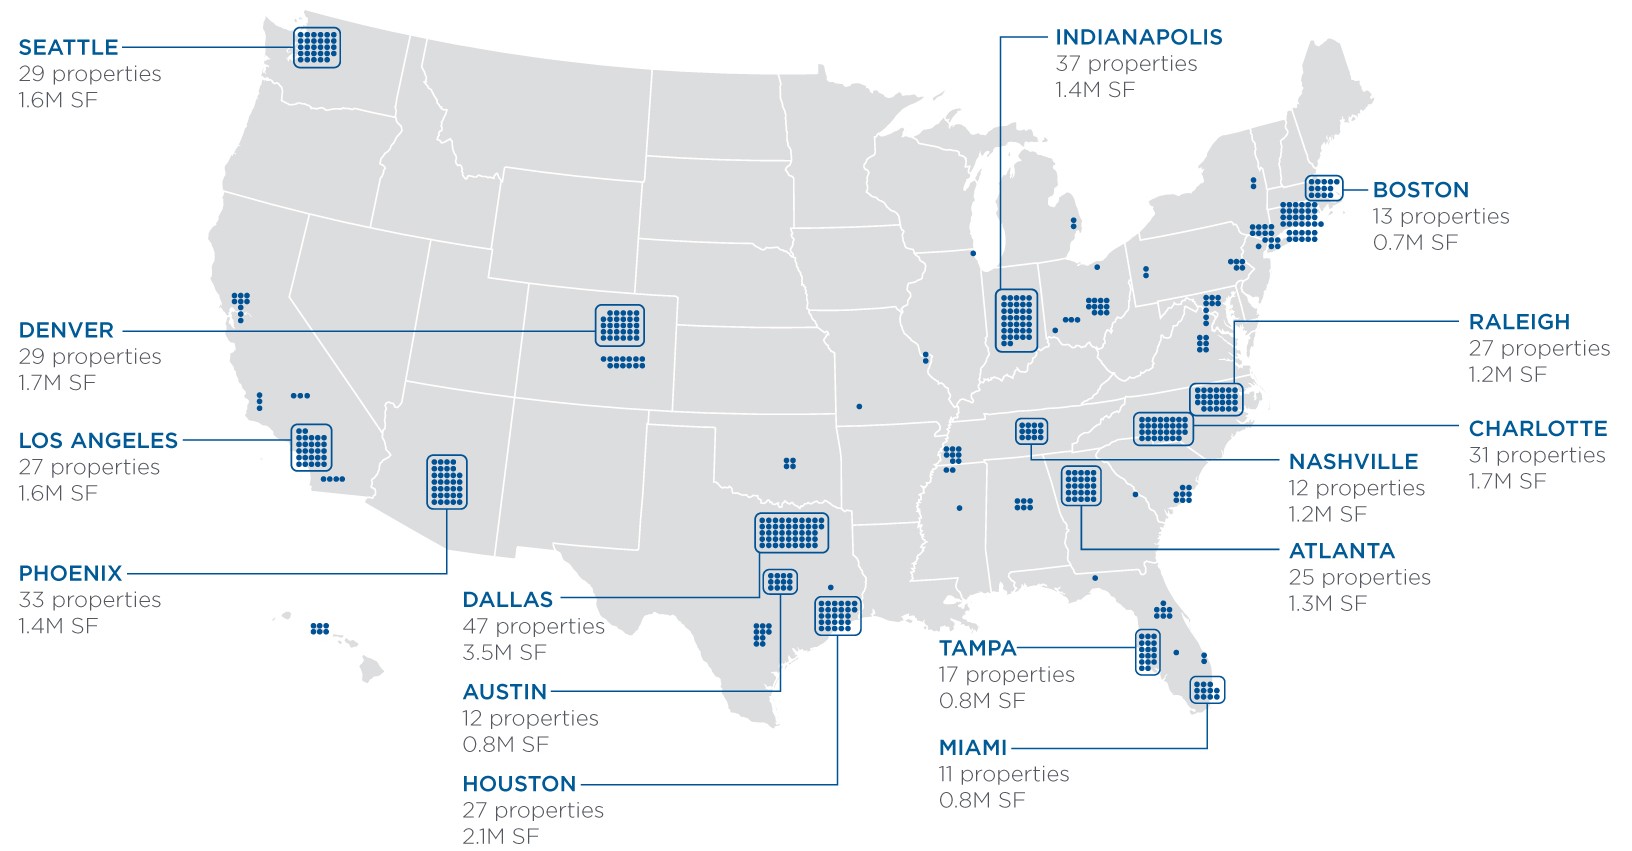
| 562 properties totaling 32.7M SF | |||||||||||
| 50 markets in 27 states | |||||||||||
| 65% of NOI in Top 15 Markets | |||||||||||
| Capitalization | |||||||||||
| $10.1B enterprise value as of 12/31/25 | |||||||||||
| $6.0B market capitalization as of 12/31/25 | |||||||||||
| 355.9M shares/units outstanding as of 12/31/25 | |||||||||||
| 354.9M diluted WA shares outstanding | |||||||||||
| BBB/Baa2 S&P/Moody's | |||||||||||
| 40.3% net debt to enterprise value at 12/31/25 | |||||||||||
| 5.4x net debt to adjusted EBITDA | |||||||||||
HEALTHCARE REALTY | 4Q 2025 SUPPLEMENTAL INFORMATION 8 | |||||||
| Corporate Information | ||
| EXECUTIVE OFFICERS | ||
| Peter A. Scott | ||
| President and Chief Executive Officer | ||
| Ryan E. Crowley | ||
| Executive Vice President and Chief Investment Officer | ||
| Daniel Gabbay | ||
| Executive Vice President and Chief Financial Officer | ||
| Robert E. Hull | ||
| Executive Vice President and Chief Operating Officer | ||
| Andrew E. Loope | ||
| Executive Vice President, General Counsel and Secretary | ||
| ANALYST COVERAGE | ||||||||
| BMO Capital Markets | J.P. Morgan Securities LLC | |||||||
| BTIG, LLC | Jefferies LLC | |||||||
| Cantor Fitzgerald & Co. | KeyBanc Capital Markets Inc. | |||||||
| Citi Research | RBC Capital Markets | |||||||
| Deutsche Bank Securities | Scotiabank | |||||||
| Green Street Advisors, Inc. | Wells Fargo Securities, LLC | |||||||
| BOARD OF DIRECTORS | |||||
HEALTHCARE REALTY | 4Q 2025 SUPPLEMENTAL INFORMATION 9 | |||||||
| Balance Sheet | ||
| AMOUNTS IN THOUSANDS, EXCEPT PER SHARE DATA | ||
| ASSETS | |||||||||||||||||
| 4Q 2025 | 3Q 2025 | 2Q 2025 | 1Q 2025 | 4Q 2024 | |||||||||||||
| Real estate properties | |||||||||||||||||
| Land | $1,060,254 | $1,066,616 | $1,105,231 | $1,134,635 | $1,143,468 | ||||||||||||
| Buildings and improvements | 8,514,165 | 8,557,270 | 9,199,089 | 9,729,912 | 9,707,066 | ||||||||||||
| Lease intangibles | 455,254 | 504,309 | 567,244 | 631,864 | 664,867 | ||||||||||||
| Personal property | 7,056 | 6,854 | 6,944 | 9,938 | 9,909 | ||||||||||||
| Investment in financing receivables, net | 123,249 | 123,346 | 124,134 | 123,813 | 123,671 | ||||||||||||
| Financing lease right-of-use assets | 75,083 | 75,462 | 76,574 | 76,958 | 77,343 | ||||||||||||
| Construction in progress | — | — | 40,421 | 35,101 | 31,978 | ||||||||||||
| Land held for development | 57,535 | 57,203 | 49,110 | 52,408 | 52,408 | ||||||||||||
| Total real estate investments | 10,292,596 | 10,391,060 | 11,168,747 | 11,794,629 | 11,810,710 | ||||||||||||
| Less accumulated depreciation and amortization | (2,397,795) | (2,381,297) | (2,494,169) | (2,583,819) | (2,483,656) | ||||||||||||
| Total real estate investments, net | 7,894,801 | 8,009,763 | 8,674,578 | 9,210,810 | 9,327,054 | ||||||||||||
| Cash and cash equivalents | 26,172 | 43,345 | 25,507 | 25,722 | 68,916 | ||||||||||||
| Assets held for sale, net | 143,580 | 604,747 | 358,207 | 6,635 | 12,897 | ||||||||||||
| Operating lease right-of-use assets | 204,906 | 209,291 | 243,910 | 259,764 | 261,438 | ||||||||||||
| Investments in unconsolidated joint ventures | 453,607 | 458,627 | 463,430 | 470,418 | 473,122 | ||||||||||||
| Other assets, net | 487,795 | 533,874 | 469,940 | 522,920 | 507,496 | ||||||||||||
| Total assets | $9,210,861 | $9,859,647 | $10,235,572 | $10,496,269 | $10,650,923 | ||||||||||||
| LIABILITIES, REDEEMABLE NON-CONTROLLING INTERESTS, AND STOCKHOLDERS' EQUITY | |||||||||||||||||
| 4Q 2025 | 3Q 2025 | 2Q 2025 | 1Q 2025 | 4Q 2024 | |||||||||||||
| Liabilities | |||||||||||||||||
| Notes and bonds payable | $3,911,423 | $4,485,706 | $4,694,391 | $4,732,618 | $4,662,771 | ||||||||||||
| Accounts payable and accrued liabilities | 211,071 | 173,784 | 194,076 | 144,855 | 222,510 | ||||||||||||
| Liabilities of properties held for sale | 15,160 | 69,808 | 30,278 | 422 | 1,283 | ||||||||||||
| Operating lease liabilities | 162,922 | 166,231 | 203,678 | 224,117 | 224,499 | ||||||||||||
| Financing lease liabilities | 73,130 | 72,654 | 73,019 | 72,585 | 72,346 | ||||||||||||
| Other liabilities | 160,530 | 146,618 | 158,704 | 174,830 | 161,640 | ||||||||||||
| Total liabilities | 4,534,236 | 5,114,801 | 5,354,146 | 5,349,427 | 5,345,049 | ||||||||||||
| Redeemable non-controlling interests | 3,252 | 4,332 | 4,332 | 4,627 | 4,778 | ||||||||||||
| Stockholders' equity | |||||||||||||||||
| Preferred stock, $0.01 par value; 200,000 shares authorized | — | — | — | — | — | ||||||||||||
| Common stock, $0.01 par value; 1,000,000 shares authorized | 3,516 | 3,516 | 3,516 | 3,510 | 3,505 | ||||||||||||
| Additional paid-in capital | 9,137,257 | 9,134,486 | 9,129,338 | 9,121,269 | 9,118,229 | ||||||||||||
| Accumulated other comprehensive (loss) income | (5,174) | (6,461) | (9,185) | (7,206) | (1,168) | ||||||||||||
| Cumulative net income attributable to common stockholders | 128,238 | 113,847 | 171,585 | 329,436 | 374,309 | ||||||||||||
| Cumulative dividends | (4,646,944) | (4,562,454) | (4,477,940) | (4,368,739) | (4,260,014) | ||||||||||||
| Total stockholders' equity | 4,616,893 | 4,682,934 | 4,817,314 | 5,078,270 | 5,234,861 | ||||||||||||
| Non-controlling interest | 56,480 | 57,580 | 59,780 | 63,945 | 66,235 | ||||||||||||
| Total equity | 4,673,373 | 4,740,514 | 4,877,094 | 5,142,215 | 5,301,096 | ||||||||||||
| Total liabilities, redeemable non-controlling interests, and stockholders' equity | $9,210,861 | $9,859,647 | $10,235,572 | $10,496,269 | $10,650,923 | ||||||||||||
HEALTHCARE REALTY | 4Q 2025 SUPPLEMENTAL INFORMATION 10 | |||||||
| Statements of Income | ||
| AMOUNTS IN THOUSANDS, EXCEPT PER SHARE DATA | ||
| 4Q 2025 | 3Q 2025 | 2Q 2025 | 1Q 2025 | 4Q 2024 | |||||||||||||
| Revenues | |||||||||||||||||
| Rental income | $274,731 | $287,399 | $287,070 | $288,857 | $300,065 | ||||||||||||
| Interest income | 3,614 | 3,480 | 3,449 | 3,731 | 4,076 | ||||||||||||
| Other operating | 7,958 | 6,886 | 6,983 | 6,389 | 5,625 | ||||||||||||
| 286,303 | 297,765 | 297,502 | 298,977 | 309,766 | |||||||||||||
| Expenses | |||||||||||||||||
| Property operating | 110,732 | 113,456 | 109,924 | 114,963 | 114,415 | ||||||||||||
| General and administrative | 13,787 | 21,771 | 23,482 | 13,530 | 34,208 | ||||||||||||
Normalizing items 1 | (3,469) | (12,046) | (10,302) | (502) | (22,991) | ||||||||||||
| Normalized general and administrative | 10,318 | 9,725 | 13,180 | 13,028 | 11,217 | ||||||||||||
| Transaction costs | 300 | 125 | 593 | 1,011 | 1,577 | ||||||||||||
| Depreciation and amortization | 127,408 | 137,841 | 147,749 | 150,969 | 160,330 | ||||||||||||
| 252,227 | 273,193 | 281,748 | 280,473 | 310,530 | |||||||||||||
| Other income (expense) | |||||||||||||||||
| Interest expense before merger-related fair value | (37,337) | (41,927) | (42,766) | (44,366) | (47,951) | ||||||||||||
| Merger-related fair value adjustment | (10,852) | (10,715) | (10,580) | (10,446) | (10,314) | ||||||||||||
| Interest expense | (48,189) | (52,642) | (53,346) | (54,812) | (58,265) | ||||||||||||
| Gain on sales of real estate properties and other assets | 135,711 | 76,771 | 20,004 | 2,904 | 32,082 | ||||||||||||
| Loss on extinguishment of debt | (165) | (286) | — | — | (237) | ||||||||||||
| Impairment of real estate assets and credit loss reserves | (105,806) | (104,362) | (142,348) | (12,081) | (81,098) | ||||||||||||
| Equity (loss) income from unconsolidated joint ventures | (634) | 287 | 158 | 1 | 224 | ||||||||||||
| Interest and other (expense) income, net | (402) | (2,884) | (366) | 95 | (154) | ||||||||||||
| (19,485) | (83,116) | (175,898) | (63,893) | (107,448) | |||||||||||||
| Net income (loss) | $14,591 | $(58,544) | $(160,144) | $(45,389) | $(108,212) | ||||||||||||
| Net (income) loss attributable to non-controlling interests | (200) | 806 | 2,293 | 516 | 1,366 | ||||||||||||
| Net income (loss) attributable to common stockholders | $14,391 | $(57,738) | $(157,851) | $(44,873) | $(106,846) | ||||||||||||
| Basic earnings per common share | $0.04 | $(0.17) | $(0.45) | $(0.13) | $(0.31) | ||||||||||||
| Diluted earnings per common share | $0.04 | $(0.17) | $(0.45) | $(0.13) | $(0.31) | ||||||||||||
| Weighted average common shares outstanding - basic | 350,052 | 349,964 | 349,628 | 349,539 | 351,560 | ||||||||||||
Weighted average common shares outstanding - diluted 2 | 350,052 | 349,964 | 349,628 | 349,539 | 351,560 | ||||||||||||
| STATEMENTS OF INCOME SUPPLEMENTAL INFORMATION | |||||||||||||||||
| 4Q 2025 | 3Q 2025 | 2Q 2025 | 1Q 2025 | 4Q 2024 | |||||||||||||
| Interest income | |||||||||||||||||
| Financing receivables | $2,023 | $2,029 | $1,956 | $1,950 | $2,103 | ||||||||||||
| Interest on mortgage and mezzanine loans | 1,591 | 1,451 | 1,493 | 1,781 | 1,973 | ||||||||||||
| Total | $3,614 | $3,480 | $3,449 | $3,731 | $4,076 | ||||||||||||
| Other operating income | |||||||||||||||||
| Parking income | $2,193 | $2,179 | $2,369 | $1,863 | $1,958 | ||||||||||||
| Management fee and miscellaneous income | 5,765 | 4,707 | 4,614 | 4,526 | 3,667 | ||||||||||||
| Total | $7,958 | $6,886 | $6,983 | $6,389 | $5,625 | ||||||||||||
HEALTHCARE REALTY | 4Q 2025 SUPPLEMENTAL INFORMATION 11 | |||||||
FFO, Normalized FFO, & FAD 1,2,3 | ||
| AMOUNTS IN THOUSANDS, EXCEPT PER SHARE DATA | ||
| 4Q 2025 | 3Q 2025 | 2Q 2025 | 1Q 2025 | 4Q 2024 | |||||||||||||
| Net income (loss) attributable to common stockholders | $14,391 | $(57,738) | $(157,851) | $(44,873) | $(106,846) | ||||||||||||
Net income (loss) attributable to common stockholders per diluted share 3 | $0.04 | $(0.17) | $(0.45) | $(0.13) | $(0.31) | ||||||||||||
| Gain on sales of real estate assets | (135,711) | (76,771) | (20,004) | (2,904) | (32,082) | ||||||||||||
| Impairments of real estate assets | 105,706 | 104,362 | 140,877 | 10,145 | 75,423 | ||||||||||||
| Real estate depreciation and amortization | 134,736 | 143,187 | 152,936 | 155,288 | 164,656 | ||||||||||||
| Non-controlling income (loss) from operating partnership units | 200 | (806) | (2,293) | (599) | (1,422) | ||||||||||||
| Unconsolidated JV depreciation, amortization and impairment | 7,659 | 6,688 | 6,706 | 6,717 | 5,913 | ||||||||||||
| FFO adjustments | $112,590 | $176,660 | $278,222 | $168,647 | $212,488 | ||||||||||||
| FFO adjustments per common share - diluted | $0.32 | $0.50 | $0.79 | $0.48 | $0.60 | ||||||||||||
| NAREIT FFO | $126,981 | $118,922 | $120,371 | $123,774 | $105,642 | ||||||||||||
| NAREIT FFO per common share - diluted | $0.36 | $0.34 | $0.34 | $0.35 | $0.30 | ||||||||||||
| Transaction costs | 300 | 125 | 593 | 1,011 | 1,577 | ||||||||||||
| Lease intangible amortization | (698) | (203) | (222) | (228) | (2,348) | ||||||||||||
| Non-routine tax and legal matters | (682) | 9 | 478 | 77 | 306 | ||||||||||||
Debt financing costs 4 | 1,614 | 3,493 | — | — | 237 | ||||||||||||
| Restructuring and severance-related charges | 3,469 | 12,046 | 10,302 | 502 | 22,991 | ||||||||||||
| Credit losses and (gains) losses on other assets, net | 100 | — | 1,471 | 1,936 | 4,582 | ||||||||||||
| Merger-related fair value adjustment | 10,852 | 10,715 | 10,580 | 10,446 | 10,314 | ||||||||||||
Unconsolidated JV normalizing items 5 | 211 | 233 | 163 | 204 | 113 | ||||||||||||
| Normalized FFO adjustments | $15,166 | $26,418 | $23,365 | $13,948 | $37,772 | ||||||||||||
| Normalized FFO adjustments per common share - diluted | $0.04 | $0.07 | $0.07 | $0.04 | $0.11 | ||||||||||||
Normalized FFO | $142,147 | $145,340 | $143,736 | $137,722 | $143,414 | ||||||||||||
| Normalized FFO per common share - diluted | $0.40 | $0.41 | $0.41 | $0.39 | $0.40 | ||||||||||||
| Non-real estate depreciation and amortization | 2,522 | 1,139 | 1,184 | 1,269 | 1,385 | ||||||||||||
Non-cash interest amortization, net 6 | 1,396 | 1,384 | 1,130 | 1,217 | 1,239 | ||||||||||||
| Rent reserves, net | 582 | 146 | 130 | 94 | (369) | ||||||||||||
| Straight-line amortization, net | (6,554) | (6,924) | (8,022) | (7,891) | (8,032) | ||||||||||||
| Stock-based compensation | 3,308 | 3,386 | 3,887 | 3,028 | 3,028 | ||||||||||||
Unconsolidated JV non-cash items 7 | (348) | (463) | (356) | (253) | (277) | ||||||||||||
Normalized FFO adjusted for non-cash items | $143,053 | $144,008 | $141,689 | $135,186 | $140,388 | ||||||||||||
| 2nd generation TI | (11,120) | (9,398) | (12,036) | (14,885) | (20,003) | ||||||||||||
| Leasing commissions paid | (7,645) | (7,438) | (5,187) | (11,394) | (11,957) | ||||||||||||
| Building capital | (10,413) | (10,319) | (9,112) | (6,687) | (8,347) | ||||||||||||
| Total maintenance capex | $(29,178) | $(27,155) | $(26,335) | $(32,966) | $(40,307) | ||||||||||||
| FAD | $113,875 | $116,853 | $115,354 | $102,220 | $100,081 | ||||||||||||
| Quarterly dividends and OP distributions | $85,506 | $85,536 | $110,486 | $109,840 | $110,808 | ||||||||||||
FFO wtd avg common shares outstanding - diluted 8 | 354,914 | 354,690 | 354,078 | 353,522 | 355,874 | ||||||||||||
HEALTHCARE REALTY | 4Q 2025 SUPPLEMENTAL INFORMATION 12 | |||||||
| Capital Funding & Commitments | ||
| DOLLARS IN THOUSANDS, EXCEPT PER SQUARE FOOT DATA | ||
| ACQUISITION AND RE/DEVELOPMENT FUNDING | |||||||||||||||||
| 4Q 2025 | 3Q 2025 | 2Q 2025 | 1Q 2025 | 4Q 2024 | |||||||||||||
Acquisitions 1 | $— | $— | $— | $— | $— | ||||||||||||
Re/development 2 | 29,352 | 36,031 | 42,040 | 33,436 | 39,611 | ||||||||||||
1st generation TI/LC/Capital & acquisition capex 3 | 34,207 | 24,480 | 33,369 | 15,139 | 14,794 | ||||||||||||
| MAINTENANCE CAPITAL EXPENDITURES FUNDING | |||||||||||||||||
| 4Q 2025 | 3Q 2025 | 2Q 2025 | 1Q 2025 | 4Q 2024 | |||||||||||||
| 2nd generation TI | $11,120 | $9,398 | $12,036 | $14,885 | $20,003 | ||||||||||||
| Leasing commissions paid | 7,645 | 7,438 | 5,187 | 11,394 | 11,957 | ||||||||||||
| Building capital | 10,413 | 10,319 | 9,112 | 6,687 | 8,347 | ||||||||||||
| $29,178 | $27,155 | $26,335 | $32,966 | $40,307 | |||||||||||||
| % of Cash NOI | |||||||||||||||||
| 2nd generation TI | 6.2 | % | 5.1 | % | 6.4 | % | 8.2 | % | 10.6 | % | |||||||
| Leasing commissions paid | 4.3 | % | 4.0 | % | 2.8 | % | 6.3 | % | 6.3 | % | |||||||
| Building capital | 5.8 | % | 5.6 | % | 4.9 | % | 3.7 | % | 4.4 | % | |||||||
| 16.3 | % | 14.7 | % | 14.1 | % | 18.2 | % | 21.3 | % | ||||||||
LEASING COMMITMENTS 4 | |||||||||||||||||
| 4Q 2025 | 3Q 2025 | 2Q 2025 | 1Q 2025 | 4Q 2024 | |||||||||||||
| Renewals | |||||||||||||||||
| Square feet | 656,712 | 682,626 | 642,797 | 794,857 | 783,975 | ||||||||||||
| 2nd generation TI/square foot/lease year | $1.96 | $3.13 | $1.66 | $1.90 | $2.20 | ||||||||||||
| Leasing commissions/square foot/lease year | $1.39 | $1.85 | $1.12 | $1.48 | $1.48 | ||||||||||||
| Renewal commitments as a % of annual net rent | 14.2 | % | 16.8 | % | 12.2 | % | 13.8 | % | 14.1 | % | |||||||
WALT (in months) 5 | 54.6 | 58.9 | 37.9 | 47.7 | 59.7 | ||||||||||||
| New leases | |||||||||||||||||
| Square feet | 137,873 | 132,079 | 195,266 | 172,371 | 299,950 | ||||||||||||
| 2nd generation TI/square foot/lease year | $7.54 | $6.94 | $7.12 | $6.08 | $7.30 | ||||||||||||
| Leasing commissions/square foot/lease year | $2.05 | $1.90 | $2.03 | $1.90 | $1.82 | ||||||||||||
| New lease commitments as a % of annual net rent | 48.2 | % | 42.0 | % | 44.6 | % | 40.4 | % | 40.7 | % | |||||||
WALT (in months) 5 | 71.2 | 65.2 | 63.3 | 65.9 | 78.3 | ||||||||||||
| All | |||||||||||||||||
| Square feet | 794,585 | 814,705 | 838,063 | 967,228 | 1,083,925 | ||||||||||||
| Leasing commitments as a % of annual net rent | 20.5 | % | 20.0 | % | 22.2 | % | 18.8 | % | 21.9 | % | |||||||
WALT (in months) 5 | 57.5 | 60.0 | 43.8 | 51.0 | 64.8 | ||||||||||||
HEALTHCARE REALTY | 4Q 2025 SUPPLEMENTAL INFORMATION 13 | |||||||
Debt Metrics 1 | ||
| DOLLARS IN THOUSANDS | ||
| SUMMARY OF INDEBTEDNESS AS OF DECEMBER 31, 2025 | |||||||||||||||||||||||||||||
| PRINCIPAL BALANCE | BALANCE 1 | MATURITY DATE 2 | MONTHS TO MATURITY 2 | 4Q 2025 INTEREST EXPENSE | CONTRACTUAL INTEREST EXPENSE | CONTRACTUAL RATE | EFFECTIVE RATE | FAIR VALUE MERGER ADJUSTED | |||||||||||||||||||||
| SENIOR NOTES | $600,000 | $595,026 | 8/1/2026 | 7 | $7,338 | $5,250 | 3.50 | % | 4.94 | % | Y | ||||||||||||||||||
| 500,000 | 492,693 | 7/1/2027 | 18 | 5,855 | 4,687 | 3.75 | % | 4.76 | % | Y | |||||||||||||||||||
| 300,000 | 298,652 | 1/15/2028 | 25 | 2,789 | 2,719 | 3.63 | % | 3.85 | % | ||||||||||||||||||||
| 650,000 | 597,188 | 2/15/2030 | 50 | 7,883 | 5,038 | 3.10 | % | 5.30 | % | Y | |||||||||||||||||||
| 299,500 | 297,610 | 3/15/2030 | 51 | 1,929 | 1,797 | 2.40 | % | 2.72 | % | ||||||||||||||||||||
| 299,785 | 296,866 | 3/15/2031 | 63 | 1,594 | 1,536 | 2.05 | % | 2.25 | % | ||||||||||||||||||||
| 800,000 | 685,874 | 3/15/2031 | 63 | 8,750 | 4,000 | 2.00 | % | 5.13 | % | Y | |||||||||||||||||||
| $3,449,285 | $3,263,909 | 39 | $36,138 | $25,027 | 2.90 | % | 4.47 | % | |||||||||||||||||||||
| TERM LOANS | $200,000 | $199,635 | 7/20/2029 | 42 | 2,525 | 2,525 | SOFR + 0.94% | 4.81 | % | ||||||||||||||||||||
| 300,000 | 299,055 | 1/20/2029 | 36 | 3,788 | 3,788 | SOFR + 0.94% | 4.81 | % | |||||||||||||||||||||
| — | — | 5/31/2027 3 | — | 131 | 131 | SOFR + 1.04% | 4.91 | % | |||||||||||||||||||||
| — | — | 6/1/2027 3 | — | 1,316 | 1,316 | SOFR + 1.04% | 4.91 | % | |||||||||||||||||||||
| — | — | 10/31/2027 3 | — | 1,650 | 1,650 | SOFR + 1.04% | 4.91 | % | |||||||||||||||||||||
| $500,000 | $498,690 | 38 | $9,410 | $9,410 | 4.81 | % | |||||||||||||||||||||||
| $1.5B CREDIT FACILITY | 120,000 | 120,000 | 7/25/2030 | 54 | $3,385 | $3,385 | SOFR + 0.84% | 4.61 | % | ||||||||||||||||||||
| MORTGAGES | $28,904 | $28,824 | various | 7 | $382 | $393 | 3.94 | % | 4.50 | % | |||||||||||||||||||
| $4,098,189 | $3,911,423 | 39 | $49,315 | $38,215 | 3.19 | % | 4.52 | % | $2,550,000 | ||||||||||||||||||||
| Less cash | (26,172) | (26,172) | |||||||||||||||||||||||||||
| Net debt | $4,072,017 | $3,885,251 | |||||||||||||||||||||||||||
| Interest rate swaps | (568) | (568) | |||||||||||||||||||||||||||
| Interest cost capitalization | (3,532) | — | |||||||||||||||||||||||||||
| Unsecured credit facility fee & deferred financing costs | 2,042 | 728 | |||||||||||||||||||||||||||
| Financing right-of-use asset amortization | 932 | — | |||||||||||||||||||||||||||
| $48,189 | $38,375 | ||||||||||||||||||||||||||||
DEBT MATURITIES SCHEDULE AS OF DECEMBER 31, 2025 2 | ||||||||||||||||||||
| PRINCIPAL PAYMENTS | ||||||||||||||||||||
| BANK LOANS | SENIOR NOTES | MORTGAGE NOTES | TOTAL | WA RATE | ||||||||||||||||
| 2026 | $0 | $600,000 | $28,904 | $628,904 | 3.52 | % | ||||||||||||||
| 2027 | — | 500,000 | — | 500,000 | 3.75 | % | ||||||||||||||
| 2028 | — | 300,000 | — | 300,000 | 3.63 | % | ||||||||||||||
| 2029 | 500,000 | — | — | 500,000 | 4.81 | % | ||||||||||||||
| Thereafter | 120,000 | 2,049,285 | — | 2,169,285 | 2.54 | % | ||||||||||||||
| Total | $620,000 | $3,449,285 | $28,904 | $4,098,189 | 3.19 | % | ||||||||||||||
Net debt (principal) | $4,072,017 | |||||||||||||||||||
Fixed rate debt balance | $500,000 | $3,449,285 | $28,904 | $3,978,189 | ||||||||||||||||
% fixed rate debt, net of cash | 97.7 | % | ||||||||||||||||||
Company share of JV net debt | $31,751 | |||||||||||||||||||
| ` | ||||||||||||||||||||
| INTEREST RATE SWAPS | ||||||||
| MATURITY | AMOUNT | WA FIXED SOFR RATE | ||||||
| May 2026 | $100,000 | 2.15 | % | |||||
| December 2026 | 150,000 | 3.84 | % | |||||
| June 2027 | 150,000 | 4.13 | % | |||||
| December 2027 | 100,000 | 4.13 | % | |||||
| As of 12/31/2025 | $500,000 | 3.65 | % | |||||
HEALTHCARE REALTY | 4Q 2025 SUPPLEMENTAL INFORMATION 14 | |||||||
| Debt Covenants & Liquidity | ||
| DOLLARS IN THOUSANDS | ||
SELECTED FINANCIAL DEBT COVENANTS YEAR ENDED DECEMBER 31, 2025 1 | |||||||||||
| CALCULATION | REQUIREMENT | PER DEBT COVENANTS | |||||||||
| Revolving credit facility and term loan | |||||||||||
| Leverage ratio | Total debt/total capital | Not greater than 60% | 36.8 | % | |||||||
| Secured leverage ratio | Total secured debt/total capital | Not greater than 30% | 0.3 | % | |||||||
| Unencumbered leverage ratio | Unsecured debt/unsecured real estate | Not greater than 60% | 40.0 | % | |||||||
| Fixed charge coverage ratio | EBITDA/fixed charges | Not less than 1.50x | 3.4x | ||||||||
| Unsecured coverage ratio | Unsecured EBITDA/unsecured interest | Not less than 1.75x | 3.3x | ||||||||
| Asset investments | Unimproved land, JVs & mortgages/total assets | Not greater than 35% | 10.3 | % | |||||||
| Senior Notes | |||||||||||
| Incurrence of total debt | Total debt/total assets | Not greater than 60% | 35.8 | % | |||||||
| Incurrence of debt secured by any lien | Secured debt/total assets | Not greater than 40% | 0.3 | % | |||||||
| Maintenance of total unsecured assets | Unencumbered assets/unsecured debt | Not less than 150% | 267.9 | % | |||||||
| Debt service coverage | EBITDA/interest expense | Not less than 1.5x | 3.5x | ||||||||
| Other | |||||||||||
Net debt to adjusted EBITDA 2 | Net debt (debt less cash)/adjusted EBITDA | Not required | 5.4x | ||||||||
Net debt to enterprise value 3 | Net debt/enterprise value | Not required | 40.3 | % | |||||||
| LIQUIDITY SOURCES | |||||
| Cash | $26,172 | ||||
| Unsecured credit facility availability | $1,380,000 | ||||
Consolidated unencumbered real estate assets (gross) 4 | $10,383,604 | ||||
HEALTHCARE REALTY | 4Q 2025 SUPPLEMENTAL INFORMATION 15 | |||||||
| Investment Activity | ||
| DOLLARS IN THOUSANDS | ||
| DISPOSITION ACTIVITY DETAIL | |||||||||||||||||
| LOCATION | COUNT | CLOSING | SQUARE FEET | OCCUPIED % | SALE PRICE | ||||||||||||
| Dispositions | |||||||||||||||||
| Boston, MA | 1 | 2/7/2025 | 30,304 | 41 | % | $4,500 | |||||||||||
| Denver, CO | 2 | 2/14/2025 | 69,715 | 54 | % | 8,600 | |||||||||||
Houston, TX 1 | 1 | 3/20/2025 | 127,933 | 35 | % | 15,000 | |||||||||||
| 1Q 2025 total | 4 | 227,952 | 42 | % | $28,100 | ||||||||||||
| Boston, MA | — | 4/30/2025 | — | — | % | 486 | |||||||||||
| Boston, MA | 1 | 5/23/2025 | 33,176 | 61 | % | 3,000 | |||||||||||
| Jacksonville, FL | 1 | 6/26/2025 | 53,169 | 12 | % | 8,100 | |||||||||||
| Yakima, WA | 2 | 6/26/2025 | 91,561 | 100 | % | 31,000 | |||||||||||
| Houston, TX | — | 6/27/2025 | — | — | % | 10,500 | |||||||||||
| 2Q 2025 total | 4 | 177,906 | 66 | % | $53,086 | ||||||||||||
| South Bend, IN | 1 | 7/15/2025 | 205,573 | 77 | % | 43,100 | |||||||||||
| Milwaukee, WI | 2 | 7/29/2025 | 147,406 | 100 | % | 42,000 | |||||||||||
| Naples, FL | 1 | 7/29/2025 | 61,359 | 81 | % | 19,250 | |||||||||||
| New York, NY | 1 | 7/30/2025 | 89,893 | 88 | % | 25,000 | |||||||||||
| Boston, MA | 1 | 8/25/2025 | 9,010 | 66 | % | 450 | |||||||||||
| Lakeland, FL | 4 | 8/27/2025 | 31,158 | 100 | % | 7,325 | |||||||||||
| Salem, OR | 1 | 8/29/2025 | 21,026 | 43 | % | 4,000 | |||||||||||
| Milwaukee, WI | 1 | 9/29/2025 | 220,747 | 74 | % | 60,000 | |||||||||||
| Tampa, FL | 2 | 9/30/2025 | 47,962 | 100 | % | 22,000 | |||||||||||
| Dallas, TX | 4 | 9/30/2025 | 448,879 | 62 | % | 58,800 | |||||||||||
| Chicago, IL | 1 | 9/30/2025 | 56,531 | 97 | % | 18,700 | |||||||||||
| Columbus, OH | 3 | 9/30/2025 | 117,060 | 100 | % | 33,750 | |||||||||||
| Miami, FL | 1 | 9/30/2025 | 152,976 | 95 | % | 62,000 | |||||||||||
| 3Q 2025 total | 23 | 1,609,580 | 80 | % | $396,375 | ||||||||||||
| New Haven, CT | 0 | 10/16/2025 | — | — | % | 725 | |||||||||||
| Des Moines, IA | 1 | 10/29/2025 | 152,655 | 79 | % | 7,225 | |||||||||||
| Jacksonville, FL | 2 | 11/17/2025 | 40,333 | 100 | % | 18,600 | |||||||||||
| Richmond, VA | 6 | 11/18/2025 | 405,945 | 93 | % | 171,000 | |||||||||||
| Boston, MA | 1 | 12/8/2025 | 10,380 | — | % | 278 | |||||||||||
| Atlanta, GA | 0 | 12/19/2025 | — | — | % | 3,000 | |||||||||||
| Multiple | 25 | 12/19/2025 | 1,522,500 | 83 | % | 348,900 | |||||||||||
| Memphis, TN | 1 | 12/29/2025 | 116,473 | 99 | % | 23,021 | |||||||||||
| Phoenix, AZ | 1 | 12/29/2025 | 89,980 | 92 | % | 22,275 | |||||||||||
| Phoenix, AZ | 1 | 12/29/2025 | 89,983 | — | % | 5,225 | |||||||||||
Houston, TX 2 | 1 | 12/30/2025 | 49,319 | 100 | % | 12,500 | |||||||||||
| 4Q 2025 total | 39 | 2,477,568 | 83 | % | $612,749 | ||||||||||||
| Total 2025 disposition activity | 70 | 4,493,006 | 79 | % | $1,090,310 | ||||||||||||
Average cap rate 3 | 6.7 | % | |||||||||||||||
| . | |||||||||||||||||
| Subsequent Disposition Activity | |||||||||||||||||
| Atlanta, GA | 1 | 1/14/2026 | 60,039 | 91 | % | 21,900 | |||||||||||
| Chicago, IL | 1 | Est. Feb | 139,200 | 95 | % | 47,000 | |||||||||||
HEALTHCARE REALTY | 4Q 2025 SUPPLEMENTAL INFORMATION 16 | |||||||
Joint Ventures 1 | ||
| DOLLARS IN THOUSANDS | ||
| PORTFOLIOS | |||||||||||||||||||||||
| WA OWNERSHIP INTEREST | 4Q 2025 | ||||||||||||||||||||||
| JOINT VENTURE | # OF PROPERTIES | SQUARE FEET | OCCUPANCY | NOI | NOI AT SHARE | SAME STORE NOI AT SHARE | |||||||||||||||||
| Nuveen | 41 | % | 26 | 1,386,043 | 87 | % | $7,361 | $2,775 | $2,172 | ||||||||||||||
| CBRE | 20 | % | 4 | 283,880 | 59 | % | 1,162 | 233 | 183 | ||||||||||||||
| KKR | 20 | % | 23 | 1,719,557 | 97 | % | 13,340 | 2,668 | — | ||||||||||||||
Other 2 | 58 | % | 10 | 723,632 | 90 | % | 5,241 | 2,780 | 1,886 | ||||||||||||||
| Total | 63 | 4,113,112 | 90 | % | $27,104 | $8,456 | $4,241 | ||||||||||||||||
| BALANCE SHEET | ||||||||||||||
| JOINT VENTURE | REAL ESTATE INVESTMENT 3 | DEBT 3 | DEBT AT SHARE | INTEREST RATE | ||||||||||
| Nuveen | $571,440 | $72,711 | $14,542 | 5.9 | % | |||||||||
| CBRE | 134,804 | — | — | — | ||||||||||
| KKR | 741,811 | — | — | — | ||||||||||
Other 2 | 343,622 | 68,117 | 27,247 | 5.3 | % | |||||||||
| Total | $1,791,677 | $140,828 | $41,789 | 5.6 | % | |||||||||
| Net debt at JV share | $31,751 | |||||||||||||
HEALTHCARE REALTY | 4Q 2025 SUPPLEMENTAL INFORMATION 17 | |||||||
| Re/development Activity | ||
| DOLLARS IN THOUSANDS | ||
| DEVELOPMENTS | |||||||||||||||||
| MARKET | ASSOCIATED HEALTH SYSTEM | SQUARE FEET | CURRENT LEASED % | BUDGET | COST TO COMPLETE | ||||||||||||
| Raleigh, NC | UNC REX Health | 122,991 | 51 | % | $58,000 | $9,526 | |||||||||||
Fort Worth, TX 1 | Baylor Scott & White | 101,279 | 72 | % | 48,200 | 3,840 | |||||||||||
| Total development | 224,270 | 60 | % | $106,200 | $13,366 | ||||||||||||
| Projected stabilized yield - 7.0%-8.5% | |||||||||||||||||
| Estimated stabilization period post completion - 12 - 36 months | |||||||||||||||||
| REDEVELOPMENTS | ||||||||||||||||||||
| MARKET | COUNT | SQUARE FEET | PROJECT SQUARE FEET | PROJECT LEASED % | BUDGET | COST TO COMPLETE | ||||||||||||||
| Charlotte, NC | 2 | 169,135 | 101,486 | 97 | % | $35,050 | $4,116 | |||||||||||||
| Houston, TX | 2 | 314,861 | 152,172 | 35 | % | 30,000 | 2,735 | |||||||||||||
| White Plains, NY | 1 | 65,851 | 44,634 | 85 | % | 24,900 | 1,366 | |||||||||||||
| Charlotte, NC | 1 | 122,388 | 83,581 | 40 | % | 19,200 | 19,012 | |||||||||||||
| Washington, DC | 1 | 57,323 | 24,034 | 82 | % | 15,200 | 1,015 | |||||||||||||
| Seattle, WA | 1 | 78,288 | 34,916 | 29 | % | 13,600 | 13,542 | |||||||||||||
| Raleigh, NC | 1 | 40,400 | 40,400 | 100 | % | 10,800 | 5,772 | |||||||||||||
| Houston, TX | 1 | 40,214 | 40,214 | 42 | % | 10,400 | 10,400 | |||||||||||||
| Denver, CO | 2 | 78,691 | 51,149 | 41 | % | 10,200 | 10,189 | |||||||||||||
| Port St. Lucie, FL | 1 | 31,466 | 31,466 | 20 | % | 9,400 | 8,942 | |||||||||||||
| Dallas, TX | 1 | 126,121 | 22,152 | 100 | % | 8,600 | 8,131 | |||||||||||||
| Denver, CO | 1 | 55,978 | 28,832 | 53 | % | 7,300 | 6,625 | |||||||||||||
Other 2 | 8 | 849,087 | 671,263 | 53 | % | 96,800 | 77,549 | |||||||||||||
| Total redevelopment | 23 | 2,029,803 | 1,326,299 | 55 | % | $291,450 | $169,394 | |||||||||||||
| Projected stabilized yield - 9.0%-12.0% | ||||||||||||||||||||
| Estimated stabilization period post completion - 12 - 36 months | ||||||||||||||||||||
| LAND HELD FOR DEVELOPMENT | |||||||||||
| MARKET | COUNT | ACREAGE | INVESTMENT TO DATE | ||||||||
| White Plains, NY | 1 | 3.1 | $3,440 | ||||||||
| Atlanta, GA | 1 | 2.5 | 2,602 | ||||||||
| Nashville, TN | 1 | 2.7 | 2,018 | ||||||||
| Round Rock, TX | 1 | 6.3 | 6,681 | ||||||||
| Nashville, TN | 1 | 0.4 | 4,653 | ||||||||
| Other | 14 | Various | 38,141 | ||||||||
| Total | 19 | $57,535 | |||||||||
HEALTHCARE REALTY | 4Q 2025 SUPPLEMENTAL INFORMATION 18 | |||||||
Portfolio 1,2 | ||
| DOLLARS IN THOUSANDS | ||
| MARKETS | |||||||||||||||||||||||||||||||||||||||||
| COUNT | SQUARE FEET | WHOLLY OWNED | |||||||||||||||||||||||||||||||||||||||
| MARKET | MSA RANK | MOB | INPATIENT | OFFICE | WHOLLY OWNED | JOINT VENTURES | TOTAL | % OF NOI | CUMULATIVE % OF NOI | ||||||||||||||||||||||||||||||||
| Dallas, TX | 4 | 47 | 2,527,868 | 146,519 | 199,800 | 2,874,187 | 581,096 | 3,455,283 | 9.9 | % | 9.9 | % | |||||||||||||||||||||||||||||
| Seattle, WA | 15 | 29 | 1,324,047 | 1,324,047 | 257,121 | 1,581,168 | 7.1 | % | 17.0 | % | |||||||||||||||||||||||||||||||
| Charlotte, NC | 21 | 31 | 1,699,765 | 1,699,765 | 1,699,765 | 5.6 | % | 22.6 | % | ||||||||||||||||||||||||||||||||
| Houston, TX | 5 | 27 | 1,747,673 | 67,500 | 1,815,173 | 249,158 | 2,064,331 | 5.3 | % | 27.9 | % | ||||||||||||||||||||||||||||||
| Denver, CO | 19 | 29 | 1,349,450 | 1,349,450 | 306,949 | 1,656,399 | 4.9 | % | 32.8 | % | |||||||||||||||||||||||||||||||
| Atlanta, GA | 6 | 25 | 1,222,606 | 1,222,606 | 96,108 | 1,318,714 | 4.3 | % | 37.1 | % | |||||||||||||||||||||||||||||||
| Los Angeles, CA | 2 | 27 | 787,715 | 63,000 | 850,715 | 786,520 | 1,637,235 | 4.0 | % | 41.1 | % | ||||||||||||||||||||||||||||||
| Boston, MA | 11 | 13 | 718,723 | 718,723 | 718,723 | 4.0 | % | 45.1 | % | ||||||||||||||||||||||||||||||||
| Raleigh, NC | 41 | 27 | 978,218 | 978,218 | 198,485 | 1,176,703 | 3.4 | % | 48.5 | % | |||||||||||||||||||||||||||||||
| Phoenix, AZ | 10 | 33 | 1,251,557 | 1,251,557 | 101,086 | 1,352,643 | 3.3 | % | 51.8 | % | |||||||||||||||||||||||||||||||
| Nashville, TN | 35 | 12 | 1,134,891 | 1,134,891 | 106,981 | 1,241,872 | 3.0 | % | 54.8 | % | |||||||||||||||||||||||||||||||
| Indianapolis, IN | 33 | 37 | 996,511 | 61,398 | 1,057,909 | 357,915 | 1,415,824 | 2.9 | % | 57.7 | % | ||||||||||||||||||||||||||||||
| Tampa, FL | 17 | 17 | 830,843 | 830,843 | 830,843 | 2.6 | % | 60.3 | % | ||||||||||||||||||||||||||||||||
| Washington, DC | 7 | 9 | 692,107 | 692,107 | 692,107 | 2.6 | % | 62.9 | % | ||||||||||||||||||||||||||||||||
| Austin, TX | 25 | 12 | 657,575 | 657,575 | 129,879 | 787,454 | 2.5 | % | 65.4 | % | |||||||||||||||||||||||||||||||
| Miami, FL | 8 | 11 | 746,463 | 746,463 | 52,178 | 798,641 | 2.4 | % | 67.8 | % | |||||||||||||||||||||||||||||||
| San Francisco, CA | 13 | 9 | 449,706 | 449,706 | 110,865 | 560,571 | 2.3 | % | 70.1 | % | |||||||||||||||||||||||||||||||
| Orlando, FL | 20 | 7 | 359,477 | 56,998 | 416,475 | 416,475 | 2.1 | % | 72.2 | % | |||||||||||||||||||||||||||||||
| New York, NY | 1 | 14 | 557,111 | 557,111 | 57,411 | 614,522 | 2.1 | % | 74.3 | % | |||||||||||||||||||||||||||||||
| Hartford, CT | 50 | 25 | 554,371 | 554,371 | 554,371 | 2.0 | % | 76.3 | % | ||||||||||||||||||||||||||||||||
| Other (30 Markets) | 121 | 6,066,696 | 473,636 | 895,708 | 7,436,040 | 721,360 | 8,157,400 | 23.7 | % | 100.0 | % | ||||||||||||||||||||||||||||||
| Total | 562 | 26,653,373 | 869,051 | 1,095,508 | 28,617,932 | 4,113,112 | 32,731,044 | 100.0 | % | ||||||||||||||||||||||||||||||||
| Number of properties | 481 | 14 | 4 | 499 | 63 | 562 | |||||||||||||||||||||||||||||||||||
| % of square feet | 93.2 | % | 3.0 | % | 3.8 | % | 100.0 | % | |||||||||||||||||||||||||||||||||
| % multi-tenant | 87.1 | % | — | % | 71.8 | % | 83.9 | % | |||||||||||||||||||||||||||||||||
Investment | $9,317,607 | $406,399 | $272,967 | $9,996,973 | |||||||||||||||||||||||||||||||||||||
Quarterly cash NOI 2 | $146,659 | $8,418 | $4,427 | $159,504 | |||||||||||||||||||||||||||||||||||||
| % of cash NOI | 91.9 | % | 5.3 | % | 2.8 | % | 100.0 | % | |||||||||||||||||||||||||||||||||
| BY OWNERSHIP AND TENANT TYPE | |||||||||||||||||
| WHOLLY OWNED | JOINT VENTURES | ||||||||||||||||
| MULTI-TENANT | SINGLE-TENANT | MULTI-TENANT | SINGLE-TENANT | TOTAL | |||||||||||||
| Number of properties | 397 | 102 | 47 | 16 | 562 | ||||||||||||
| Square feet | 24,010,566 | 4,607,366 | 3,383,096 | 730,016 | 32,731,044 | ||||||||||||
| % of square feet | 73.4 | % | 14.1 | % | 10.3 | % | 2.2 | % | 100.0 | % | |||||||
Investment 2 | $8,012,291 | $1,984,683 | $493,232 | $115,135 | $10,605,340 | ||||||||||||
Quarterly cash NOI 2 | $126,915 | $32,588 | $6,375 | $2,081 | $167,960 | ||||||||||||
| % of cash NOI | 75.6 | % | 19.4 | % | 3.8 | % | 1.2 | % | 100.0 | % | |||||||
HEALTHCARE REALTY | 4Q 2025 SUPPLEMENTAL INFORMATION 19 | |||||||
Health Systems 1,2 | ||
| MOB PORTFOLIO | ||||||||||||||||||||||||||||||||
| BUILDING SQUARE FEET | # OF BLDGS | LEASED BY HEALTH SYSTEM | % OF LEASED SF | # OF LEASES | ||||||||||||||||||||||||||||
| HEALTH SYSTEM | SYSTEM RANK 3 | CREDIT RATING | ON/ADJACENT 4 | OFF-CAMPUS AFFILIATED 5 | TOTAL | % OF NOI | ||||||||||||||||||||||||||
| HCA | 1 | BBB-/Baa2 | 2,046,423 | 769,842 | 2,816,265 | 41 | 9.6 | % | 720,231 | 2.6 | % | 127 | ||||||||||||||||||||
| Baylor Scott & White | 21 | AA-/Aa2 | 2,146,334 | 66,376 | 2,212,710 | 25 | 6.8 | % | 1,085,258 | 4.0 | % | 154 | ||||||||||||||||||||
| CommonSpirit | 4 | A-/A3 | 1,442,804 | 535,300 | 1,978,104 | 37 | 6.7 | % | 806,420 | 2.9 | % | 152 | ||||||||||||||||||||
| Ascension Health | 3 | AA/Aa3 | 1,601,286 | 97,551 | 1,698,837 | 17 | 4.4 | % | 739,365 | 2.7 | % | 104 | ||||||||||||||||||||
| Advocate Health | 14 | AA/Aa2 | 751,636 | 240,910 | 992,546 | 17 | 3.8 | % | 869,101 | 3.2 | % | 87 | ||||||||||||||||||||
| Wellstar Health System | 75 | A+/A2 | 918,394 | — | 918,394 | 18 | 3.2 | % | 607,220 | 2.2 | % | 82 | ||||||||||||||||||||
| UW Medicine (Seattle) | 91 | AA+/Aa1 | 461,363 | 169,709 | 631,072 | 10 | 3.0 | % | 294,971 | 1.1 | % | 32 | ||||||||||||||||||||
| Providence Health & Services | 5 | A/A3 | 602,834 | 31,601 | 634,435 | 12 | 2.7 | % | 247,064 | 0.9 | % | 45 | ||||||||||||||||||||
| AdventHealth | 11 | AA/Aa2 | 640,215 | 118,585 | 758,800 | 12 | 2.6 | % | 390,729 | 1.4 | % | 97 | ||||||||||||||||||||
| MultiCare Health System | 82 | A/-- | 492,623 | — | 492,623 | 8 | 2.5 | % | 233,700 | 0.9 | % | 28 | ||||||||||||||||||||
| Indiana University Health | 26 | AA/Aa2 | 416,978 | 269,320 | 686,298 | 10 | 2.1 | % | 387,649 | 1.4 | % | 51 | ||||||||||||||||||||
| Tenet Healthcare Corporation | 6 | BB-/Ba3 | 545,035 | 235,399 | 780,434 | 13 | 2.0 | % | 130,632 | 0.5 | % | 21 | ||||||||||||||||||||
| Tufts Medicine | None | BBB-/Aa3 | 252,087 | — | 252,087 | 2 | 1.9 | % | 260,784 | 1.0 | % | 5 | ||||||||||||||||||||
| Cedars-Sinai Health Systems | 51 | AA-/Aa3 | 199,701 | 90,607 | 290,308 | 5 | 1.8 | % | 90,515 | 0.3 | % | 20 | ||||||||||||||||||||
| WakeMed | 185 | --/A2 | 374,207 | 101,597 | 475,804 | 13 | 1.7 | % | 152,831 | 0.6 | % | 23 | ||||||||||||||||||||
| Banner Health | 24 | AA-/-- | 749,075 | 31,039 | 780,114 | 24 | 1.6 | % | 118,225 | 0.4 | % | 32 | ||||||||||||||||||||
| Hawaii Pacific Health | 181 | --/A1 | 173,502 | 124,925 | 298,427 | 3 | 1.6 | % | 104,915 | 0.4 | % | 41 | ||||||||||||||||||||
| Baptist Memorial Health Care | 89 | A-2/-- | 427,649 | 150,228 | 577,877 | 8 | 1.6 | % | 383,115 | 1.4 | % | 46 | ||||||||||||||||||||
| Sutter Health | 12 | A+/A1 | 175,591 | 96,987 | 272,578 | 4 | 1.4 | % | 110,448 | 0.4 | % | 24 | ||||||||||||||||||||
| Novant Health | 42 | A+/A1 | 473,471 | 138,035 | 611,506 | 10 | 1.4 | % | 193,957 | 0.7 | % | 26 | ||||||||||||||||||||
| MemorialCare Health Systems | 133 | A+/-- | 353,541 | 48,759 | 402,300 | 5 | 1.4 | % | 8,877 | — | % | 4 | ||||||||||||||||||||
| Other (60 Credit Rated) | 6,062,259 | 2,698,466 | 8,760,725 | 174 | 28.4 | % | 4,140,953 | 15.1 | % | |||||||||||||||||||||||
Subtotal - credit rated 6 | 21,307,008 | 6,015,236 | 27,322,244 | 468 | 92.2 | % | 12,076,960 | 44.1 | % | |||||||||||||||||||||||
Other non-credit rated 7 | 609,845 | 380,385 | 990,230 | 18 | 2.6 | % | 410,712 | 1.5 | % | |||||||||||||||||||||||
Off-campus non-affiliated 8 | — | 2,227,935 | 2,227,935 | 51 | 5.2 | % | — | — | % | |||||||||||||||||||||||
| Total | 21,916,853 | 8,623,556 | 30,540,409 | 537 | 100.0 | % | 12,487,672 | 45.6 | % | |||||||||||||||||||||||
| Joint ventures | 2,731,325 | 1,155,711 | 3,887,036 | |||||||||||||||||||||||||||||
| Wholly-owned | 19,185,528 | 7,467,845 | 26,653,373 | |||||||||||||||||||||||||||||
HEALTHCARE REALTY | 4Q 2025 SUPPLEMENTAL INFORMATION 20 | |||||||
MOB Proximity to Hospital 1,2,3 | ||
| MOB BY LOCATION | ||||||||||||||
| # OF PROPERTIES | SQUARE FEET | TOTAL | % GROUND LEASED | |||||||||||
| On campus | 206 | 15,964,097 | 52.3 | % | 69.9 | % | ||||||||
Adjacent to campus 4 | 137 | 5,952,756 | 19.5 | % | 14.1 | % | ||||||||
| Total on/adjacent | 343 | 21,916,853 | 71.8 | % | 54.7 | % | ||||||||
Off campus - affiliated 5 | 143 | 6,395,621 | 20.9 | % | 15.0 | % | ||||||||
| Off campus | 51 | 2,227,935 | 7.3 | % | 8.3 | % | ||||||||
| 537 | 30,540,409 | 100.0 | % | 43.0 | % | |||||||||
| Wholly-owned | 481 | 26,653,373 | ||||||||||||
| Joint ventures | 56 | 3,887,036 | ||||||||||||
MOB BY CLUSTER 6 | ||||||||||||||||||||
| TOTAL | HOSPITAL CENTRIC 7 | |||||||||||||||||||
| # OF PROPERTIES | SQUARE FEET | % OF SQUARE FEET | # OF PROPERTIES | SQUARE FEET | % OF SQUARE FEET | |||||||||||||||
| Clustered | 410 | 23,001,159 | 75.3 | % | 334 | 19,954,197 | 77.4 | % | ||||||||||||
| Non-clustered | 127 | 7,539,250 | 24.7 | % | 86 | 5,823,814 | 22.6 | % | ||||||||||||
| Total | 537 | 30,540,409 | 100.0 | % | 420 | 25,778,011 | 100.0 | % | ||||||||||||
HEALTHCARE REALTY | 4Q 2025 SUPPLEMENTAL INFORMATION 21 | |||||||
Lease Maturity & Occupancy 1,2 | ||
| LEASE MATURITY SCHEDULE | |||||||||||||||||||||||
| SQUARE FEET | # OF WHOLLY-OWNED LEASES | ||||||||||||||||||||||
| WHOLLY-OWNED AND JOINT VENTURE | |||||||||||||||||||||||
MULTI-TENANT 3 | SINGLE-TENANT | TOTAL | % OF TOTAL | JOINT VENTURES | WHOLLY-OWNED | ||||||||||||||||||
| Month-to-month | 223,247 | 59,427 | 282,674 | 1.0 | % | 44,126 | 238,548 | 85 | |||||||||||||||
| 1Q 2026 | 1,081,421 | 44,806 | 1,126,227 | 3.8 | % | 41,461 | 1,084,766 | 304 | |||||||||||||||
| 2Q 2026 | 860,539 | 66,250 | 926,789 | 3.1 | % | 111,354 | 815,435 | 272 | |||||||||||||||
| 3Q 2026 | 805,290 | 112,329 | 917,619 | 3.1 | % | 91,014 | 826,605 | 230 | |||||||||||||||
| 4Q 2026 | 914,602 | — | 914,602 | 3.1 | % | 33,986 | 880,616 | 256 | |||||||||||||||
| 2027 | 3,742,692 | 1,098,726 | 4,841,418 | 16.4 | % | 467,584 | 4,373,834 | 950 | |||||||||||||||
| 2028 | 3,158,421 | 585,199 | 3,743,620 | 12.6 | % | 287,966 | 3,455,654 | 904 | |||||||||||||||
| 2029 | 2,926,257 | 715,648 | 3,641,905 | 12.3 | % | 581,886 | 3,060,019 | 683 | |||||||||||||||
| 2030 | 2,702,344 | 641,922 | 3,344,266 | 11.3 | % | 329,213 | 3,015,053 | 630 | |||||||||||||||
| 2031 | 1,499,137 | 369,883 | 1,869,020 | 6.3 | % | 245,981 | 1,623,039 | 324 | |||||||||||||||
| 2032 | 1,934,968 | 395,932 | 2,330,900 | 7.9 | % | 361,685 | 1,969,215 | 301 | |||||||||||||||
| 2033 | 890,366 | 52,813 | 943,179 | 3.2 | % | 192,162 | 751,017 | 190 | |||||||||||||||
| 2034 | 1,170,299 | 142,581 | 1,312,880 | 4.4 | % | 251,688 | 1,061,192 | 190 | |||||||||||||||
| 2035 | 1,231,407 | 159,725 | 1,391,132 | 4.7 | % | 116,938 | 1,274,194 | 206 | |||||||||||||||
| Thereafter | 1,178,740 | 835,365 | 2,014,105 | 6.8 | % | 530,630 | 1,483,475 | 181 | |||||||||||||||
| Total occupied | 24,319,730 | 5,280,606 | 29,600,336 | 90.4 | % | 3,687,674 | 25,912,662 | 5,706 | |||||||||||||||
| Total building | 27,393,662 | 5,337,382 | 32,731,044 | 4,113,112 | 28,617,932 | ||||||||||||||||||
| Occupancy | 88.8 | % | 98.9 | % | 90.4 | % | 89.7 | % | 90.5 | % | |||||||||||||
WALTR (months) 4 | 51.0 | 69.2 | 54.3 | 52.1 | |||||||||||||||||||
WALT (months) 4 | 92.4 | 138.2 | 114.9 | 99.8 | |||||||||||||||||||
QUARTERLY LEASING ACTIVITY 5 | ||||||||||||||||||||
| MULTI-TENANT | SINGLE-TENANT | TOTAL | ||||||||||||||||||
| ABSORPTION ACTIVITY | SQUARE FEET | ABSORPTION ACTIVITY | SQUARE FEET | ABSORPTION ACTIVITY | SQUARE FEET | |||||||||||||||
| Occupied square feet, beginning of period | — | 24,644,200 | — | 5,377,288 | 30,021,488 | |||||||||||||||
| Dispositions, assets held for sale and corp office | — | (499,198) | — | (48,556) | (547,754) | |||||||||||||||
| Expirations and early vacates | (950,454) | — | (87,331) | — | (1,037,785) | |||||||||||||||
| Renewals, amendments, and extensions | 667,521 | — | 39,205 | — | 706,726 | |||||||||||||||
| New lease commencements | 457,661 | — | — | — | 457,661 | |||||||||||||||
| Absorption | 174,728 | (48,126) | 126,602 | |||||||||||||||||
| Occupied square feet, end of period | 24,319,730 | 5,280,606 | 29,600,336 | |||||||||||||||||
HEALTHCARE REALTY | 4Q 2025 SUPPLEMENTAL INFORMATION 22 | |||||||
Leasing Statistics 1,2 | ||
SAME STORE RENEWALS 2 | ||||||||
| 4Q 2025 | 2025 | |||||||
| Cash leasing spreads | 3.7 | % | 3.1 | % | ||||
| Cash leasing spreads distribution | ||||||||
| < 0% spread | 10.1 | % | 8.3 | % | ||||
| 0-3% spread | 7.0 | % | 13.2 | % | ||||
| 3-4% spread | 60.5 | % | 55.8 | % | ||||
| > 4% spread | 22.4 | % | 22.7 | % | ||||
| Total | 100.0 | % | 100.0 | % | ||||
| Tenant retention rate | 82.7 | % | 81.5 | % | ||||
AVERAGE IN-PLACE CONTRACTUAL INCREASES 3 | ||||||||||||||||||||||||||
| MULTI-TENANT | SINGLE-TENANT | TOTAL | ||||||||||||||||||||||||
| % INCREASE | % OF BASE RENT | % INCREASE | % OF BASE RENT | % INCREASE | % OF BASE RENT | |||||||||||||||||||||
Same store 2 | 2.97 | % | 70.6 | % | 2.50 | % | 16.3 | % | 2.88 | % | 86.8 | % | ||||||||||||||
| Acquisitions | 2.81 | % | 6.2 | % | 2.74 | % | 1.7 | % | 2.80 | % | 7.9 | % | ||||||||||||||
Other 4 | 2.86 | % | 5.0 | % | 3.00 | % | 0.3 | % | 2.86 | % | 5.3 | % | ||||||||||||||
| Total | 2.95 | % | 81.8 | % | 2.53 | % | 18.2 | % | 2.87 | % | 100.0 | % | ||||||||||||||
| Escalator type | ||||||||||||||||||||||||||
| Fixed | 2.96 | % | 98.1 | % | 2.57 | % | 87.6 | % | 2.90 | % | 96.1 | % | ||||||||||||||
| CPI | 2.50 | % | 1.9 | % | 2.22 | % | 12.4 | % | 2.33 | % | 3.9 | % | ||||||||||||||
SAME STORE TYPE AND OWNERSHIP STRUCTURE 2 | ||||||||||||||
| MULTI-TENANT | SINGLE-TENANT | TOTAL | ||||||||||||
| Tenant type | ||||||||||||||
| Hospital | 48.4 | % | 54.7 | % | 49.4 | % | ||||||||
| Physician and other | 51.6 | % | 45.3 | % | 50.6 | % | ||||||||
| Lease structure | ||||||||||||||
| Gross | 8.6 | % | 1.4 | % | 7.3 | % | ||||||||
| Modified gross | 32.9 | % | 9.3 | % | 28.7 | % | ||||||||
| Net | 58.5 | % | 65.2 | % | 59.7 | % | ||||||||
Absolute net 5 | — | % | 24.1 | % | 4.3 | % | ||||||||
| Ownership type | ||||||||||||||
| Ground lease | 46.2 | % | 34.9 | % | 44.4 | % | ||||||||
| Fee simple | 53.8 | % | 65.1 | % | 55.6 | % | ||||||||
# OF LEASES BY SIZE 6 | |||||||||||
| LEASED SQUARE FEET | # OF LEASES | WALT | WALTR | ||||||||
| 0 - 2,500 | 2,980 | 73.4 | 38.8 | ||||||||
| 2,501 - 5,000 | 1,431 | 81.3 | 43.1 | ||||||||
| 5,001 - 7,500 | 490 | 92.1 | 48.4 | ||||||||
| 7,501 - 10,000 | 280 | 100.3 | 52.0 | ||||||||
| 10,001 + | 525 | 117.5 | 60.9 | ||||||||
| Total Leases | 5,706 | 99.8 | 52.1 | ||||||||
HEALTHCARE REALTY | 4Q 2025 SUPPLEMENTAL INFORMATION 23 | |||||||
Same Store 1,2 | ||
| DOLLARS IN THOUSANDS | ||
| TOTAL CASH NOI | ||||||||
| % of Total NOI | 4Q 2025 | |||||||
| Multi-tenant | 68.1 | % | $ | 121,798 | ||||
| Single-tenant | 17.9 | % | 31,878 | |||||
| Joint venture | 2.4 | % | 4,241 | |||||
| Same store | 88.5 | % | $157,917 | |||||
| Developments | 0.2 | % | 268 | |||||
| Development completions | 0.5 | % | 839 | |||||
| Redevelopment | 2.9 | % | 5,153 | |||||
| Redevelopment completions | 0.3 | % | 511 | |||||
| Wholly-owned and joint venture acquisitions | 1.8 | % | 3,271 | |||||
| Completed dispositions & assets held for sale | 5.8 | % | 10,500 | |||||
| Total cash NOI | 100.0 | % | $178,459 | |||||
| PORTFOLIO OCCUPANCY AND ABSORPTION | |||||||||||||||||||||||
| OCCUPANCY % | ABSORPTION (square feet in thousands) | ||||||||||||||||||||||
| COUNT | SQUARE FEET | 4Q 2025 | 3Q 2025 | 4Q 2024 | SEQUENTIAL | Y-O-Y | |||||||||||||||||
| Multi-tenant | 377 | 22,032,311 | 90.8 | % | 90.5 | % | 89.5 | % | 66 | 279 | |||||||||||||
| Single-tenant | 96 | 4,271,051 | 99.9 | % | 99.9 | % | 100.0 | % | — | (6) | |||||||||||||
| Joint venture | 28 | 1,532,190 | 90.1 | % | 90.2 | % | 89.2 | % | (1) | 14 | |||||||||||||
| Same store | 501 | 27,835,552 | 92.1 | % | 91.9 | % | 91.1 | % | 65 | 287 | |||||||||||||
| Wholly owned and joint venture acquisitions | 30 | 2,192,560 | 95.3 | % | 95.1 | % | 94.0 | % | 3 | 28 | |||||||||||||
| Total stabilized portfolio | 531 | 30,028,112 | 92.4 | % | 92.1 | % | 91.3 | % | 68 | 316 | |||||||||||||
| Developments | 2 | 224,270 | 47.1 | % | 34.3 | % | 12.4 | % | 29 | 90 | |||||||||||||
| Development completions | 2 | 107,247 | 89.6 | % | 82.1 | % | 82.1 | % | 8 | 8 | |||||||||||||
Redevelopments 3 | 23 | 2,029,803 | 69.9 | % | 68.7 | % | 74.8 | % | 23 | (101) | |||||||||||||
| Redevelopment completions | 4 | 341,612 | 70.9 | % | 71.4 | % | 70.7 | % | (1) | 1 | |||||||||||||
| Total portfolio including re/developments | 562 | 32,731,044 | 90.4 | % | 90.0 | % | 89.8 | % | 127 | 314 | |||||||||||||
| Joint ventures | 63 | 4,113,112 | 89.7 | % | 89.5 | % | 87.3 | % | 8 | 98 | |||||||||||||
| Total wholly-owned | 499 | 28,617,932 | 90.5 | % | 90.1 | % | 90.1 | % | 118 | 216 | |||||||||||||
| Multi-tenant | 444 | 27,393,662 | 88.8 | % | 88.3 | % | 87.7 | % | 175 | 371 | |||||||||||||
HEALTHCARE REALTY | 4Q 2025 SUPPLEMENTAL INFORMATION 24 | |||||||
Same Store 1,2,3 | ||
| DOLLARS IN THOUSANDS, EXCEPT PER SQUARE FOOT DATA | ||
| SAME STORE CASH NOI | |||||||||||||||||||||||
| TOTAL | |||||||||||||||||||||||
| 4Q 2025 | 3Q 2025 | 2Q 2025 | 1Q 2025 | 4Q 2024 | 2025 | 2024 | |||||||||||||||||
| Base revenue | $186,609 | $184,806 | $182,406 | $179,492 | $178,148 | $733,313 | $704,762 | ||||||||||||||||
| Op. exp. recoveries | 58,697 | 57,556 | 54,847 | 55,683 | 55,627 | 226,783 | 216,707 | ||||||||||||||||
| Revenues | $245,306 | $242,362 | $237,253 | $235,175 | $233,775 | $960,096 | $921,469 | ||||||||||||||||
| Expenses | 87,389 | 86,433 | 82,722 | 85,005 | 84,045 | 341,549 | 331,280 | ||||||||||||||||
| Cash NOI | $157,917 | $155,929 | $154,531 | $150,170 | $149,730 | $618,547 | $590,189 | ||||||||||||||||
Revenue per occ SF 4 | $38.31 | $37.99 | $37.34 | $37.08 | $36.92 | $37.67 | $36.61 | ||||||||||||||||
| Margin | 64.4 | % | 64.3 | % | 65.1 | % | 63.9 | % | 64.0 | % | 64.4 | % | 64.0 | % | |||||||||
| Period end occupancy | 92.1 | % | 91.9 | % | 91.5 | % | 91.2 | % | 91.1 | % | 92.1 | % | 91.1 | % | |||||||||
| Number of properties | 501 | 501 | 501 | 501 | 501 | 501 | 501 | ||||||||||||||||
| Year-Over-Year Change | |||||||||||||||||||||||
| Revenues | 4.9 | % | 4.2 | % | |||||||||||||||||||
| Base revenue | 4.7 | % | 4.1 | % | |||||||||||||||||||
| Exp recoveries | 5.5 | % | 4.6 | % | |||||||||||||||||||
| Expenses | 4.0 | % | 3.1 | % | |||||||||||||||||||
| Cash NOI | 5.5 | % | 4.8 | % | |||||||||||||||||||
HEALTHCARE REALTY | 4Q 2025 SUPPLEMENTAL INFORMATION 25 | |||||||
NOI Reconciliations 1 | ||
| DOLLARS IN THOUSANDS | ||
| BOTTOM UP RECONCILIATION | |||||||||||||||||
| 4Q 2025 | 3Q 2025 | 2Q 2025 | 1Q 2025 | 4Q 2024 | |||||||||||||
| Net income (loss) | $14,591 | ($58,544) | ($160,144) | ($45,389) | ($108,212) | ||||||||||||
| Other expense (income) | 19,485 | 83,116 | 175,898 | 63,893 | 107,448 | ||||||||||||
| General and administrative expense | 13,787 | 21,771 | 23,482 | 13,530 | 34,208 | ||||||||||||
| Depreciation and amortization expense | 127,408 | 137,841 | 147,749 | 150,969 | 160,330 | ||||||||||||
Other expenses 2 | 9,535 | 7,290 | 7,821 | 7,564 | 7,059 | ||||||||||||
| Straight-line rent expense | 788 | 842 | 859 | 865 | 917 | ||||||||||||
| Straight-line rent revenue | (4,753) | (6,741) | (7,904) | (7,709) | (9,061) | ||||||||||||
Other revenue 3 | (10,998) | (9,542) | (9,345) | (9,907) | (11,194) | ||||||||||||
| Joint venture property cash NOI | 8,616 | 8,380 | 8,225 | 8,282 | 7,280 | ||||||||||||
| Cash NOI | $178,459 | $184,413 | $186,641 | $182,098 | $188,775 | ||||||||||||
| Developments | (268) | (84) | 74 | 64 | 69 | ||||||||||||
| Development completions | (839) | (799) | (788) | (854) | (276) | ||||||||||||
| Redevelopment | (5,153) | (5,878) | (6,754) | (6,552) | (6,968) | ||||||||||||
| Redevelopment completions | (511) | (380) | (389) | (106) | (278) | ||||||||||||
| Wholly owned and joint venture acquisitions | (3,271) | (3,160) | (3,072) | (3,065) | (2,441) | ||||||||||||
| Completed dispositions & assets held for sale | (10,500) | (18,183) | (21,181) | (21,415) | (29,151) | ||||||||||||
| Same store cash NOI | $157,917 | $155,929 | $154,531 | $150,170 | $149,730 | ||||||||||||
| Same store joint venture properties | (4,241) | (4,093) | (4,147) | (4,141) | (4,291) | ||||||||||||
| Same store excluding JVs | $153,676 | $151,836 | $150,384 | $146,029 | $145,439 | ||||||||||||
| TOP DOWN RECONCILIATION | |||||||||||||||||
| 4Q 2025 | 3Q 2025 | 2Q 2025 | 1Q 2025 | 4Q 2024 | |||||||||||||
| Rental income before rent concessions | $278,573 | $292,965 | $292,859 | $294,543 | $305,229 | ||||||||||||
| Rent concessions | (3,842) | (5,566) | (5,789) | (5,686) | (5,164) | ||||||||||||
| Rental income | $274,731 | $287,399 | $287,070 | $288,857 | $300,065 | ||||||||||||
| Parking income | 2,193 | 2,179 | 2,368 | 1,863 | 1,958 | ||||||||||||
| Interest from financing receivable, net | 2,023 | 2,029 | 1,956 | 1,950 | 2,103 | ||||||||||||
| Exclude straight-line rent revenue | (4,753) | (6,741) | (7,904) | (7,709) | (9,061) | ||||||||||||
Exclude other non-cash revenue 4 | (4,140) | (3,922) | (3,593) | (4,051) | (5,697) | ||||||||||||
| Cash revenue | $270,054 | $280,944 | $279,897 | $280,910 | $289,368 | ||||||||||||
| Property operating expense | (110,732) | (113,456) | (109,924) | (114,963) | (114,415) | ||||||||||||
Exclude non-cash expenses 5 | 10,521 | 8,545 | 8,443 | 7,869 | 6,542 | ||||||||||||
| Joint venture property cash NOI | 8,616 | 8,380 | 8,225 | 8,282 | 7,280 | ||||||||||||
| Cash NOI | $178,459 | $184,413 | $186,641 | $182,098 | $188,775 | ||||||||||||
| Developments | (268) | (84) | 74 | 64 | 69 | ||||||||||||
| Development completions | (839) | (799) | (788) | (854) | (276) | ||||||||||||
| Redevelopment | (5,153) | (5,878) | (6,754) | (6,552) | (6,968) | ||||||||||||
| Redevelopment completions | (511) | (380) | (389) | (106) | (278) | ||||||||||||
| Wholly owned and joint venture acquisitions | (3,271) | (3,160) | (3,072) | (3,065) | (2,441) | ||||||||||||
| Completed dispositions & assets held for sale | (10,500) | (18,183) | (21,181) | (21,415) | (29,151) | ||||||||||||
| Same store cash NOI | $157,917 | $155,929 | $154,531 | $150,170 | $149,730 | ||||||||||||
| Same store joint venture properties | (4,241) | (4,093) | (4,147) | (4,141) | (4,291) | ||||||||||||
| Same store excluding JVs | $153,676 | $151,836 | $150,384 | $146,029 | $145,439 | ||||||||||||
HEALTHCARE REALTY | 4Q 2025 SUPPLEMENTAL INFORMATION 26 | |||||||
NOI Reconciliations 1 | ||
| DOLLARS IN THOUSANDS | ||
| RECONCILIATION OF NOI TO FFO AND NORMALIZED FFO | |||||||||||||||||
| 4Q 2025 | 3Q 2025 | 2Q 2025 | 1Q 2025 | 4Q 2024 | |||||||||||||
| Cash NOI | $178,459 | $184,413 | $186,641 | $182,098 | $188,775 | ||||||||||||
| General and administrative expense | (13,787) | (21,771) | (23,482) | (13,530) | (34,208) | ||||||||||||
| Straight-line rent revenue | 4,753 | 6,741 | 7,904 | 7,709 | 9,061 | ||||||||||||
| Interest and other (expense) income, net | (402) | (2,884) | (366) | 95 | (154) | ||||||||||||
| Management fees and other income | 5,765 | 4,707 | 4,614 | 4,525 | 3,667 | ||||||||||||
| Note receivable interest income | 1,591 | 1,451 | 1,492 | 1,781 | 1,973 | ||||||||||||
Other non-cash revenue 2 | 3,642 | 3,385 | 3,239 | 3,601 | 5,554 | ||||||||||||
Other non-cash expenses 3 | (10,358) | (8,007) | (8,087) | (7,418) | (6,400) | ||||||||||||
| Non-real estate impairment | — | — | (1,471) | — | (1,600) | ||||||||||||
| Restructuring and severance-related costs | 588 | 9,010 | 7,060 | 114 | 19,288 | ||||||||||||
| Income taxes | 300 | 372 | 297 | 310 | 657 | ||||||||||||
| Unconsolidated JV adjustments | (894) | (1,031) | (683) | (1,155) | (720) | ||||||||||||
| Debt Covenant EBITDA | $169,657 | $176,386 | $177,158 | $178,130 | $185,893 | ||||||||||||
| Interest expense | (48,189) | (52,642) | (53,346) | (54,812) | (58,265) | ||||||||||||
| Transaction costs | (300) | (125) | (593) | (1,011) | (1,577) | ||||||||||||
Leasing commission amortization 4 | 8,418 | 6,519 | 6,404 | 5,621 | 5,744 | ||||||||||||
| Non-real estate depreciation and amortization | (1,091) | (1,173) | (1,217) | (1,301) | (1,418) | ||||||||||||
| Loss on non-real estate assets | — | — | — | (1,936) | (4,075) | ||||||||||||
| Non-controlling interest | — | — | — | (83) | (56) | ||||||||||||
| Restructuring and severance-related costs | (588) | (9,010) | (7,060) | (114) | (19,288) | ||||||||||||
| Income taxes | (300) | (372) | (297) | (310) | (657) | ||||||||||||
| Loss on extinguishment of debt | (165) | (286) | — | — | (237) | ||||||||||||
| Unconsolidated JV adjustments | (461) | (375) | (678) | (410) | (422) | ||||||||||||
| NAREIT FFO | $126,981 | $118,922 | $120,371 | $123,774 | $105,642 | ||||||||||||
| Transaction costs | 300 | 125 | 593 | 1,011 | 1,577 | ||||||||||||
| Lease intangible amortization | (698) | (203) | (222) | (228) | (2,348) | ||||||||||||
| Non-routine tax and legal matters | (682) | 9 | 478 | 77 | 306 | ||||||||||||
Debt financing costs 5 | 1,614 | 3,493 | — | — | 237 | ||||||||||||
| Restructuring and severance-related charges | 3,469 | 12,046 | 10,302 | 502 | 22,991 | ||||||||||||
| Merger-related fair value adjustment | 10,852 | 10,715 | 10,580 | 10,446 | 10,314 | ||||||||||||
| Credit losses and (gains) losses on other assets, net | 100 | — | 1,471 | 1,936 | 4,582 | ||||||||||||
| Unconsolidated JV normalizing items | 211 | 233 | 163 | 204 | 113 | ||||||||||||
| Normalized FFO | $142,147 | $145,340 | $143,736 | $137,722 | $143,414 | ||||||||||||
HEALTHCARE REALTY | 4Q 2025 SUPPLEMENTAL INFORMATION 27 | |||||||
EBITDA Reconciliations 1 | ||
| DOLLARS IN THOUSANDS | ||
| RECONCILIATION OF EBITDA | |||||||||||||||||
| 4Q 2025 | 3Q 2025 | 2Q 2025 | 1Q 2025 | 4Q 2024 | |||||||||||||
| Net income (loss) | $14,591 | ($58,544) | ($160,144) | ($45,389) | ($108,212) | ||||||||||||
| Interest expense | 48,189 | 52,642 | 53,346 | 54,812 | 58,265 | ||||||||||||
| Income taxes | 300 | 372 | 297 | 310 | 657 | ||||||||||||
| Depreciation and amortization | 127,408 | 137,841 | 147,749 | 150,968 | 160,330 | ||||||||||||
| Unconsolidated JV depreciation, amortization, and interest | 8,121 | 7,063 | 7,384 | 7,128 | 6,336 | ||||||||||||
| EBITDA | $198,609 | $139,374 | $48,632 | $167,829 | $117,376 | ||||||||||||
| Transaction costs | 300 | 125 | 593 | 1,011 | 1,577 | ||||||||||||
| Gain on sales of assets | (135,711) | (76,771) | (20,004) | (2,904) | (32,082) | ||||||||||||
| Impairments on real estate assets | 105,706 | 104,362 | 140,877 | 12,080 | 79,497 | ||||||||||||
| Restructuring and severance-related charges | 588 | 9,010 | 7,060 | 114 | 19,288 | ||||||||||||
| Loss on extinguishment of debt | 165 | 286 | — | — | 237 | ||||||||||||
| Debt Covenant EBITDA | $169,657 | $176,386 | $177,158 | $178,130 | $185,893 | ||||||||||||
Leasing commission amortization 2 | 8,418 | 6,520 | 6,404 | 5,621 | 5,744 | ||||||||||||
| Lease intangibles, franchise taxes and prepaid ground amortization | (31) | (111) | 578 | 520 | (3,596) | ||||||||||||
Timing impact 3 | (2,089) | 558 | 4,129 | 4,176 | (2,125) | ||||||||||||
| Stock based compensation | 3,308 | 3,386 | 3,887 | 3,028 | 3,028 | ||||||||||||
| Allowance for credit losses | 100 | — | 1,471 | — | 1,600 | ||||||||||||
| Rent reserves, net | 582 | 146 | 130 | 94 | (369) | ||||||||||||
Debt financing costs 4 | 1,449 | 3,207 | — | — | — | ||||||||||||
| Unconsolidated JV adjustments | 319 | 425 | 163 | 204 | 113 | ||||||||||||
| Adjusted EBITDA | $181,713 | $190,517 | $193,920 | $191,773 | $190,288 | ||||||||||||
| Annualized Adjusted EBITDA | $726,852 | $762,068 | $775,680 | $767,092 | $761,152 | ||||||||||||
| RECONCILIATION OF NET DEBT | |||||||||||||||||
| Debt | $3,911,423 | $4,485,706 | $4,694,391 | $4,732,618 | $4,662,771 | ||||||||||||
| Share of unconsolidated net debt | 31,751 | 30,887 | 32,437 | 29,908 | 31,455 | ||||||||||||
| Cash | (26,172) | (43,345) | (25,507) | (25,722) | (68,916) | ||||||||||||
| Net debt | $3,917,002 | $4,473,248 | $4,701,321 | $4,736,804 | $4,625,310 | ||||||||||||
Net debt to adjusted EBITDA 5 | 5.4x | 5.9x | 6.1x | 6.2x | 6.1x | ||||||||||||
HEALTHCARE REALTY | 4Q 2025 SUPPLEMENTAL INFORMATION 28 | |||||||
Components of Net Asset Value 1 | ||
| DOLLARS IN THOUSANDS | ||
| CASH NOI | |||||
| 4Q 2025 | |||||
Same store 2 | $157,917 | ||||
| Acquisition & Re/development Completions | 4,110 | ||||
| Total | $162,537 | ||||
Other adjustments 3 | 5,179 | ||||
| Total Cash NOI | $167,716 | ||||
| DEVELOPMENT & REDEVELOPMENT PROPERTIES | ||||||||||||||
PROJECTED STABILIZED ANNUAL CASH NOI 4 | ||||||||||||||
| COST TO COMPLETE | BUDGET | LOW | HIGH | |||||||||||
| Developments | $13,366 | $106,200 | $7,000 | $8,000 | ||||||||||
Redevelopments 5 | 169,394 | 291,450 | 42,000 | 44,000 | ||||||||||
| $182,760 | $397,650 | $49,000 | $52,000 | |||||||||||
| LAND HELD FOR DEVELOPMENT, CASH, & OTHER ASSETS | ||||||||
| Land held for development | $57,535 | |||||||
Disposition pipeline 6 | 187,361 | |||||||
Unstabilized properties 7 | 128,621 | |||||||
Cash and other assets 8 | 394,414 | |||||||
| $767,931 | ||||||||
| DEBT | ||||||||
| Unsecured credit facility | $120,000 | |||||||
| Unsecured term loans | 500,000 | |||||||
| Senior notes | 3,449,285 | |||||||
| Mortgage notes payable | 28,904 | |||||||
| Company share of joint venture net debt | 31,751 | |||||||
Other liabilities 9 | 323,413 | |||||||
| $4,453,353 | ||||||||
| TOTAL SHARES OUTSTANDING | ||||||||
As of December 31, 2025 10 | 355,878,607 | |||||||
HEALTHCARE REALTY | 4Q 2025 SUPPLEMENTAL INFORMATION 29 | |||||||
| 2026 Guidance | ||
| DOLLARS AND SHARES IN MILLIONS, EXCEPT PER SHARE DATA | ||
| 2026 EARNINGS GUIDANCE | ||||||||
| LOW | HIGH | |||||||
| Earnings per share | $(0.05) | $0.05 | ||||||
| NAREIT FFO per share | $1.44 | $1.50 | ||||||
Normalized FFO per share | $1.58 | $1.64 | ||||||
| Same store cash NOI growth | 3.5 | % | 4.5 | % | ||||
| KEY ASSUMPTIONS | ||||||||
| LOW | HIGH | |||||||
| Normalized general and administrative | $43 | $47 | ||||||
Interest expense, net of capitalized interest 1 | $135 | $145 | ||||||
| Total maintenance capex | $105 | $125 | ||||||
SOURCES AND USES 2 | ||||||||
| MIDPOINT | ||||||||
Asset sales and loan receivable repayments 3 | $175 | |||||||
Bond issuance 4 | 600 | |||||||
| FAD less dividends | 100 | |||||||
| Total Sources | $875 | |||||||
| Bond repayments | $600 | |||||||
Investments and share repurchases 5 | 50 | |||||||
| Development, redevelopment, and 1st gen capital | 225 | |||||||
| Total Uses | $875 | |||||||
| Target adjusted net debt to EBITDA | mid-5x | |||||||
Diluted shares outstanding 6 | 353 | |||||||
HEALTHCARE REALTY | 4Q 2025 SUPPLEMENTAL INFORMATION 30 | |||||||