000136425012/312026Q1falseShares Issued, Not Disclosedxbrli:sharesiso4217:USDiso4217:USDxbrli:sharesutr:sqftnysedei:unitnysedei:parcelnysedei:propertynysedei:venturexbrli:purenysedei:storynysedei:loannysedei:instrumentnysedei:segmentnysedei:building00013642502026-01-012026-03-3100013642502026-05-0100013642502026-03-3100013642502025-12-310001364250nysedei:RentalRevenueAndTenantRecoveryRevenueMembernysedei:OfficeSegmentMember2026-01-012026-03-310001364250nysedei:RentalRevenueAndTenantRecoveryRevenueMembernysedei:OfficeSegmentMember2025-01-012025-03-310001364250nysedei:ParkingRevenueAndOtherIncomeMembernysedei:OfficeSegmentMember2026-01-012026-03-310001364250nysedei:ParkingRevenueAndOtherIncomeMembernysedei:OfficeSegmentMember2025-01-012025-03-310001364250nysedei:OfficeSegmentMember2026-01-012026-03-310001364250nysedei:OfficeSegmentMember2025-01-012025-03-310001364250nysedei:RentalRevenueMembernysedei:MultifamilySegmentMember2026-01-012026-03-310001364250nysedei:RentalRevenueMembernysedei:MultifamilySegmentMember2025-01-012025-03-310001364250nysedei:ParkingRevenueAndOtherIncomeMembernysedei:MultifamilySegmentMember2026-01-012026-03-310001364250nysedei:ParkingRevenueAndOtherIncomeMembernysedei:MultifamilySegmentMember2025-01-012025-03-310001364250nysedei:MultifamilySegmentMember2026-01-012026-03-310001364250nysedei:MultifamilySegmentMember2025-01-012025-03-3100013642502025-01-012025-03-310001364250us-gaap:CommonStockMember2025-12-310001364250us-gaap:CommonStockMember2024-12-310001364250us-gaap:CommonStockMember2026-01-012026-03-310001364250us-gaap:CommonStockMember2025-01-012025-03-310001364250us-gaap:CommonStockMember2026-03-310001364250us-gaap:CommonStockMember2025-03-310001364250us-gaap:AdditionalPaidInCapitalMember2025-12-310001364250us-gaap:AdditionalPaidInCapitalMember2024-12-310001364250us-gaap:AdditionalPaidInCapitalMember2026-01-012026-03-310001364250us-gaap:AdditionalPaidInCapitalMember2025-01-012025-03-310001364250us-gaap:AdditionalPaidInCapitalMember2026-03-310001364250us-gaap:AdditionalPaidInCapitalMember2025-03-310001364250us-gaap:AccumulatedOtherComprehensiveIncomeMember2025-12-310001364250us-gaap:AccumulatedOtherComprehensiveIncomeMember2024-12-310001364250us-gaap:AccumulatedOtherComprehensiveIncomeMember2026-01-012026-03-310001364250us-gaap:AccumulatedOtherComprehensiveIncomeMember2025-01-012025-03-310001364250us-gaap:AccumulatedOtherComprehensiveIncomeMember2026-03-310001364250us-gaap:AccumulatedOtherComprehensiveIncomeMember2025-03-310001364250us-gaap:AccumulatedDistributionsInExcessOfNetIncomeMember2025-12-310001364250us-gaap:AccumulatedDistributionsInExcessOfNetIncomeMember2024-12-310001364250us-gaap:AccumulatedDistributionsInExcessOfNetIncomeMember2026-01-012026-03-310001364250us-gaap:AccumulatedDistributionsInExcessOfNetIncomeMember2025-01-012025-03-310001364250us-gaap:AccumulatedDistributionsInExcessOfNetIncomeMember2026-03-310001364250us-gaap:AccumulatedDistributionsInExcessOfNetIncomeMember2025-03-310001364250us-gaap:NoncontrollingInterestMember2025-12-310001364250us-gaap:NoncontrollingInterestMember2024-12-310001364250us-gaap:NoncontrollingInterestMember2026-01-012026-03-310001364250us-gaap:NoncontrollingInterestMember2025-01-012025-03-310001364250us-gaap:NoncontrollingInterestMember2026-03-310001364250us-gaap:NoncontrollingInterestMember2025-03-3100013642502024-12-3100013642502025-03-310001364250srt:OfficeBuildingMembernysedei:WhollyOwnedAndConsolidatedPropertiesMember2026-03-310001364250nysedei:OfficePropertyUnderDevelopmentMembernysedei:WhollyOwnedAndConsolidatedPropertiesMember2026-03-310001364250srt:MultifamilyMembernysedei:WhollyOwnedAndConsolidatedPropertiesMember2026-03-310001364250nysedei:ApartmentUnitsUnderDevelopmentMembernysedei:WhollyOwnedAndConsolidatedPropertiesMember2026-03-310001364250nysedei:WhollyOwnedAndConsolidatedPropertiesMember2026-03-310001364250srt:OfficeBuildingMemberus-gaap:WhollyOwnedPropertiesMember2026-03-310001364250srt:OfficeBuildingMemberus-gaap:ConsolidatedPropertiesMember2026-03-310001364250srt:OfficeBuildingMember2026-03-310001364250srt:MultifamilyMemberus-gaap:WhollyOwnedPropertiesMember2026-03-310001364250srt:MultifamilyMemberus-gaap:ConsolidatedPropertiesMember2026-03-310001364250srt:MultifamilyMember2026-03-310001364250srt:SubsidiariesMember2026-03-310001364250srt:SubsidiariesMember2025-12-310001364250nysedei:SubsidiariesAndJointVenturesMember2026-03-310001364250nysedei:SubsidiariesAndJointVenturesMember2025-12-310001364250nysedei:TenantRecoveriesMember2026-01-012026-03-310001364250nysedei:TenantRecoveriesMember2025-01-012025-03-3100013642502025-01-012025-12-310001364250us-gaap:BuildingImprovementsMember2026-03-310001364250us-gaap:BuildingImprovementsMember2025-03-310001364250srt:OfficeBuildingMembernysedei:PartnershipXMember2025-12-310001364250nysedei:PartnershipXMember2026-01-012026-03-310001364250nysedei:PartnershipXMemberus-gaap:LandMember2025-01-012025-01-010001364250nysedei:PartnershipXMemberus-gaap:BuildingAndBuildingImprovementsMember2025-01-012025-01-010001364250nysedei:PartnershipXMember2025-01-012025-01-010001364250srt:AffiliatedEntityMember2025-01-022025-01-020001364250srt:OfficeBuildingMembernysedei:A10900WilshireMembersrt:AffiliatedEntityMember2025-01-020001364250srt:AffiliatedEntityMembernysedei:FannieMaeLoanJanuary92030MaturityMemberus-gaap:SecuredDebtMember2024-12-310001364250nysedei:A10900WilshireMemberus-gaap:LandMember2026-01-012026-03-310001364250nysedei:A10900WilshireMemberus-gaap:BuildingImprovementsMember2026-01-012026-03-310001364250nysedei:A10900WilshireMember2026-01-012026-03-310001364250nysedei:AboveMarketTenantLeasesMember2026-03-310001364250nysedei:AboveMarketTenantLeasesMember2025-12-310001364250nysedei:AboveMarketGroundLeasesMember2026-03-310001364250nysedei:AboveMarketGroundLeasesMember2025-12-310001364250nysedei:BelowMarketTenantLeasesMember2026-03-310001364250nysedei:BelowMarketTenantLeasesMember2025-12-310001364250nysedei:TenantLeaseMember2026-01-012026-03-310001364250nysedei:TenantLeaseMember2025-01-012025-03-310001364250nysedei:AboveMarketGroundLeasesMember2026-01-012026-03-310001364250nysedei:AboveMarketGroundLeasesMember2025-01-012025-03-310001364250srt:SubsidiariesMembernysedei:TermLoanAug152026MaturityMemberus-gaap:SecuredDebtMember2026-01-012026-03-310001364250srt:SubsidiariesMembernysedei:TermLoanAug152026MaturityMemberus-gaap:SecuredDebtMember2026-03-310001364250srt:SubsidiariesMembernysedei:TermLoanAug152026MaturityMemberus-gaap:SecuredDebtMember2025-12-310001364250srt:SubsidiariesMembernysedei:TermLoanSep192026MaturityMemberus-gaap:SecuredDebtMember2026-01-012026-03-310001364250srt:SubsidiariesMembernysedei:TermLoanSep192026MaturityMemberus-gaap:SecuredDebtMember2026-03-310001364250srt:SubsidiariesMembernysedei:TermLoanSep192026MaturityMemberus-gaap:SecuredDebtMember2025-12-310001364250srt:SubsidiariesMembernysedei:TermLoanNov12026MaturityMemberus-gaap:SecuredDebtMember2026-01-012026-03-310001364250srt:SubsidiariesMembernysedei:TermLoanNov12026MaturityMemberus-gaap:SecuredDebtMember2026-03-310001364250srt:SubsidiariesMembernysedei:TermLoanNov12026MaturityMemberus-gaap:SecuredDebtMember2025-12-310001364250srt:SubsidiariesMembernysedei:TermLoanMay182028MaturityMemberus-gaap:SecuredDebtMember2026-01-012026-03-310001364250srt:SubsidiariesMembernysedei:TermLoanMay182028MaturityMemberus-gaap:SecuredDebtMember2026-03-310001364250srt:SubsidiariesMembernysedei:TermLoanMay182028MaturityMemberus-gaap:SecuredDebtMember2025-12-310001364250srt:SubsidiariesMembernysedei:TermLoanJanuary12029MaturityMemberus-gaap:SecuredDebtMember2026-01-012026-03-310001364250srt:SubsidiariesMembernysedei:TermLoanJanuary12029MaturityMemberus-gaap:SecuredDebtMember2026-03-310001364250srt:SubsidiariesMembernysedei:TermLoanJanuary12029MaturityMemberus-gaap:SecuredDebtMember2025-12-310001364250srt:SubsidiariesMembernysedei:FannieMaeLoanApril12030MaturityMemberus-gaap:SecuredDebtMember2026-01-012026-03-310001364250srt:SubsidiariesMembernysedei:FannieMaeLoanApril12030MaturityMemberus-gaap:SecuredDebtMember2026-03-310001364250srt:SubsidiariesMembernysedei:FannieMaeLoanApril12030MaturityMemberus-gaap:SecuredDebtMember2025-12-310001364250srt:SubsidiariesMembernysedei:FannieMaeLoanSeptember12030MaturityMemberus-gaap:SecuredDebtMember2026-01-012026-03-310001364250srt:SubsidiariesMembernysedei:FannieMaeLoanSeptember12030MaturityMemberus-gaap:SecuredDebtMember2026-03-310001364250srt:SubsidiariesMembernysedei:FannieMaeLoanSeptember12030MaturityMemberus-gaap:SecuredDebtMember2025-12-310001364250srt:SubsidiariesMembernysedei:ConstructionLoanDecember102030MaturityMemberus-gaap:SecuredDebtMember2026-01-012026-03-310001364250srt:SubsidiariesMembernysedei:ConstructionLoanDecember102030MaturityMemberus-gaap:SecuredDebtMember2026-03-310001364250srt:SubsidiariesMembernysedei:ConstructionLoanDecember102030MaturityMemberus-gaap:SecuredDebtMember2025-12-310001364250srt:SubsidiariesMembernysedei:TermLoanMarch32032MaturityMemberus-gaap:SecuredDebtMember2026-01-012026-03-310001364250srt:SubsidiariesMembernysedei:TermLoanMarch32032MaturityMemberus-gaap:SecuredDebtMember2026-03-310001364250srt:SubsidiariesMembernysedei:TermLoanMarch32032MaturityMemberus-gaap:SecuredDebtMember2025-12-310001364250srt:SubsidiariesMembernysedei:TermLoanJuly292032MaturityMemberus-gaap:SecuredDebtMember2026-01-012026-03-310001364250srt:SubsidiariesMembernysedei:TermLoanJuly292032MaturityMemberus-gaap:SecuredDebtMember2026-03-310001364250srt:SubsidiariesMembernysedei:TermLoanJuly292032MaturityMemberus-gaap:SecuredDebtMember2025-12-310001364250srt:SubsidiariesMembernysedei:FannieMaeLoanAugust12033MaturityMemberus-gaap:SecuredDebtMember2026-01-012026-03-310001364250srt:SubsidiariesMembernysedei:FannieMaeLoanAugust12033MaturityMemberus-gaap:SecuredDebtMember2026-03-310001364250srt:SubsidiariesMembernysedei:FannieMaeLoanAugust12033MaturityMemberus-gaap:SecuredDebtMember2025-12-310001364250srt:SubsidiariesMembernysedei:TermLoanFixedJune12038MaturityMemberus-gaap:SecuredDebtMember2026-01-012026-03-310001364250srt:SubsidiariesMembernysedei:TermLoanFixedJune12038MaturityMemberus-gaap:SecuredDebtMember2026-03-310001364250srt:SubsidiariesMembernysedei:TermLoanFixedJune12038MaturityMemberus-gaap:SecuredDebtMember2025-12-310001364250srt:AffiliatedEntityMembernysedei:TermLoanMay152027MaturityMemberus-gaap:SecuredDebtMember2026-01-012026-03-310001364250srt:AffiliatedEntityMembernysedei:TermLoanMay152027MaturityMemberus-gaap:SecuredDebtMember2026-03-310001364250srt:AffiliatedEntityMembernysedei:TermLoanMay152027MaturityMemberus-gaap:SecuredDebtMember2025-12-310001364250srt:AffiliatedEntityMembernysedei:TermLoanAugust192028MaturityMemberus-gaap:SecuredDebtMember2026-01-012026-03-310001364250srt:AffiliatedEntityMembernysedei:TermLoanAugust192028MaturityMemberus-gaap:SecuredDebtMember2026-03-310001364250srt:AffiliatedEntityMembernysedei:TermLoanAugust192028MaturityMemberus-gaap:SecuredDebtMember2025-12-310001364250srt:AffiliatedEntityMembernysedei:TermLoanSeptember142028MaturityMemberus-gaap:SecuredDebtMember2026-01-012026-03-310001364250srt:AffiliatedEntityMembernysedei:TermLoanSeptember142028MaturityMemberus-gaap:SecuredDebtMember2026-03-310001364250srt:AffiliatedEntityMembernysedei:TermLoanSeptember142028MaturityMemberus-gaap:SecuredDebtMember2025-12-310001364250srt:AffiliatedEntityMembernysedei:TermLoanDecember112028MaturityMemberus-gaap:SecuredDebtMember2026-01-012026-03-310001364250srt:AffiliatedEntityMembernysedei:TermLoanDecember112028MaturityMemberus-gaap:SecuredDebtMember2026-03-310001364250srt:AffiliatedEntityMembernysedei:TermLoanDecember112028MaturityMemberus-gaap:SecuredDebtMember2025-12-310001364250srt:AffiliatedEntityMembernysedei:TermLoanApril262029MaturityMemberus-gaap:SecuredDebtMember2026-01-012026-03-310001364250srt:AffiliatedEntityMembernysedei:TermLoanApril262029MaturityMemberus-gaap:SecuredDebtMember2026-03-310001364250srt:AffiliatedEntityMembernysedei:TermLoanApril262029MaturityMemberus-gaap:SecuredDebtMember2025-12-310001364250srt:AffiliatedEntityMembernysedei:TermLoanJune12029MaturityMemberus-gaap:SecuredDebtMember2026-01-012026-03-310001364250srt:AffiliatedEntityMembernysedei:TermLoanJune12029MaturityMemberus-gaap:SecuredDebtMember2026-03-310001364250srt:AffiliatedEntityMembernysedei:TermLoanJune12029MaturityMemberus-gaap:SecuredDebtMember2025-12-310001364250srt:AffiliatedEntityMembernysedei:FannieMaeLoanJanuary92030MaturityMemberus-gaap:SecuredDebtMember2026-01-012026-03-310001364250srt:AffiliatedEntityMembernysedei:FannieMaeLoanJanuary92030MaturityMemberus-gaap:SecuredDebtMember2026-03-310001364250srt:AffiliatedEntityMembernysedei:FannieMaeLoanJanuary92030MaturityMemberus-gaap:SecuredDebtMember2025-12-310001364250us-gaap:SecuredDebtMember2026-01-012026-03-310001364250srt:SubsidiariesMembernysedei:FannieMaeLoanSeptember12030MaturityMemberus-gaap:SecuredDebtMember2025-08-310001364250srt:SubsidiariesMembernysedei:TermLoan1March32032MaturityMemberus-gaap:SecuredDebtMember2026-03-310001364250srt:SubsidiariesMembernysedei:TermLoan2March32032MaturityMemberus-gaap:SecuredDebtMember2026-03-310001364250us-gaap:RevolvingCreditFacilityMembersrt:SubsidiariesMemberus-gaap:SecuredDebtMember2026-03-310001364250nysedei:FannieMaeLoanAugust12033MaturityMembersrt:SubsidiariesMember2026-03-310001364250nysedei:FannieMaeLoanAugust12033MaturityMembersrt:SubsidiariesMember2025-08-310001364250srt:SubsidiariesMembernysedei:FloatingRateDebtMemberus-gaap:SecuredDebtMember2026-03-310001364250nysedei:TermLoanFixedJune12038MaturityMemberus-gaap:SecuredDebtMember2026-01-012026-03-310001364250nysedei:TermLoanDecember112028MaturityMemberus-gaap:SecuredDebtMember2026-01-012026-03-310001364250srt:SubsidiariesMembernysedei:FannieMaeLoanJanuary92030MaturityMembersrt:MinimumMember2026-03-310001364250srt:SubsidiariesMembernysedei:FannieMaeLoanJanuary92030MaturityMembersrt:MaximumMember2026-03-310001364250us-gaap:InterestRateSwapMember2026-03-310001364250us-gaap:InterestRateCapMember2026-03-310001364250nysedei:EffectiveFixedRateLoansMember2026-03-310001364250nysedei:EffectiveFixedRateLoansMember2025-12-310001364250nysedei:FixedRateLoansMember2026-03-310001364250nysedei:FixedRateLoansMember2025-12-310001364250nysedei:CappedRateLoansMember2026-03-310001364250nysedei:CappedRateLoansMember2025-12-310001364250nysedei:VariableRateLoansMember2026-03-310001364250nysedei:VariableRateLoansMember2025-12-310001364250us-gaap:InterestRateSwapMemberus-gaap:DesignatedAsHedgingInstrumentMemberus-gaap:CashFlowHedgingMember2026-03-310001364250us-gaap:InterestRateCapMemberus-gaap:NondesignatedMember2026-03-310001364250us-gaap:InterestRateSwapMemberus-gaap:DesignatedAsHedgingInstrumentMemberus-gaap:CashFlowHedgingMember2025-12-310001364250us-gaap:CashFlowHedgingMemberus-gaap:DesignatedAsHedgingInstrumentMember2026-01-012026-03-310001364250us-gaap:CashFlowHedgingMemberus-gaap:DesignatedAsHedgingInstrumentMember2025-01-012025-03-310001364250nysedei:DouglasEmmettOperatingPartnershipMember2026-03-310001364250nysedei:DouglasEmmettOperatingPartnershipMemberus-gaap:CommonStockMember2026-03-310001364250us-gaap:EquityMethodInvestmentNonconsolidatedInvesteeOrGroupOfInvesteesMember2026-01-012026-03-310001364250us-gaap:EquityMethodInvestmentNonconsolidatedInvesteeOrGroupOfInvesteesMember2025-01-012025-03-310001364250nysedei:OperatingPartnershipUnitsMember2026-01-012026-03-310001364250nysedei:OperatingPartnershipUnitsMember2025-01-012025-03-310001364250nysedei:VestedLongTermIncentivePlanLTIPUnitsMember2026-01-012026-03-310001364250nysedei:VestedLongTermIncentivePlanLTIPUnitsMember2025-01-012025-03-310001364250us-gaap:EstimateOfFairValueFairValueDisclosureMemberus-gaap:FairValueInputsLevel2Member2026-03-310001364250us-gaap:EstimateOfFairValueFairValueDisclosureMemberus-gaap:FairValueInputsLevel2Member2025-12-310001364250us-gaap:CarryingReportedAmountFairValueDisclosureMemberus-gaap:FairValueInputsLevel2Member2026-03-310001364250us-gaap:CarryingReportedAmountFairValueDisclosureMemberus-gaap:FairValueInputsLevel2Member2025-12-310001364250us-gaap:FairValueInputsLevel2Member2026-03-310001364250us-gaap:FairValueInputsLevel2Member2025-12-310001364250us-gaap:OperatingSegmentsMembernysedei:OfficeSegmentMember2026-01-012026-03-310001364250us-gaap:OperatingSegmentsMembernysedei:OfficeSegmentMember2025-01-012025-03-310001364250us-gaap:OperatingSegmentsMembernysedei:MultifamilySegmentMember2026-01-012026-03-310001364250us-gaap:OperatingSegmentsMembernysedei:MultifamilySegmentMember2025-01-012025-03-310001364250us-gaap:OperatingSegmentsMember2026-01-012026-03-310001364250us-gaap:OperatingSegmentsMember2025-01-012025-03-310001364250us-gaap:WhollyOwnedPropertiesMember2026-03-310001364250nysedei:DevelopmentProjectsRepositioningProjectsCapitalExpenditureProjectsAndTenantImprovementsMember2026-03-310001364250srt:SubsidiariesMembernysedei:TermLoanApril262029MaturityMemberus-gaap:SecuredDebtMember2023-11-300001364250srt:OfficeBuildingMembernysedei:BedfordCollectionMembersrt:SubsidiariesMemberus-gaap:SubsequentEventMember2026-04-300001364250srt:OfficeBuildingMembernysedei:BedfordCollectionMembersrt:SubsidiariesMemberus-gaap:SubsequentEventMember2026-04-012026-04-300001364250srt:SubsidiariesMembernysedei:TermLoanApril2031MaturityMemberus-gaap:SecuredDebtMemberus-gaap:SubsequentEventMember2026-04-300001364250srt:SubsidiariesMembernysedei:TermLoanApril2031MaturityMemberus-gaap:SecuredDebtMemberus-gaap:SubsequentEventMember2026-04-012026-04-30
United States
Securities and Exchange Commission
Washington, D.C. 20549
FORM 10-Q
☒
QUARTERLY REPORT PURSUANT TO SECTION 13 OR 15(d) OF THE SECURITIES EXCHANGE ACT OF 1934
For the quarterly period ended March 31, 2026
or
☐
TRANSITION REPORT PURSUANT TO SECTION 13 OR 15(d) OF THE SECURITIES EXCHANGE ACT OF 1934
For the transition period from _____ to _____
Commission file number: 001-33106
Douglas Emmett, Inc.
(Exact name of registrant as specified in its charter)
Maryland
20-3073047
(State or other jurisdiction of incorporation or organization)
(I.R.S. Employer Identification No.)
1299 Ocean Avenue, Suite 1000, Santa Monica, California
90401
(Address of principal executive offices)
(Zip Code)
(310) 255-7700
(Registrant’s telephone number, including area code)
N/A
(Former name, former address and former fiscal year, if changed since last report)
Securities registered pursuant to Section 12(b) of the Act:
Title of Each Class
Trading Symbol
Name of Each Exchange on Which Registered
Common Stock, $0.01 par value per share
DEI
New York Stock Exchange
Indicate by check mark whether the registrant (1) has filed all reports required to be filed by Section 13 or 15(d) of the Securities Exchange Act of 1934 during the preceding 12 months (or for such shorter period that the registrant was required to file such reports), and (2) has been subject to such filing requirements for the past 90 days. Yes☒No ☐
Indicate by check mark whether the registrant has submitted electronically every Interactive Data File required to be submitted pursuant to Rule 405 of Regulation S-T (§232.405 of this chapter) during the preceding 12 months (or for such shorter period that the registrant was required to submit such files). Yes☒No ☐
Indicate by check mark whether the registrant is a large accelerated filer, an accelerated filer, a non-accelerated filer, a smaller reporting company, or an emerging growth company. See definitions of "large accelerated filer," "accelerated filer," "smaller reporting company," and "emerging growth company" in Rule 12b-2 of the Exchange Act.
Large accelerated filer
☒
Accelerated filer
☐
Non-accelerated filer
☐
Smaller reporting company
☐
Emerging growth company
☐
If an emerging growth company, indicate by check mark if the registrant has elected not to use the extended transition period for complying with any new or revised financial accounting standards provided pursuant to Section 13(a) of the Exchange Act. ☐
Indicate by check mark whether the registrant is a shell company (as defined in Rule 12b-2 of the Exchange Act). Yes ☐No ☒
Indicate the number of shares outstanding of each of the issuer’s classes of common stock, as of the latest practicable date.
Annualized cash base rent (excludes tenant reimbursements, parking and other revenue) before abatements under leases commenced as of the reporting date and expiring after the reporting date. Annualized Rent for our triple net office properties (in Honolulu) is calculated by adding expense reimbursements and estimates of normal building expenses paid by tenants to base rent. Annualized Rent does not include lost rent recovered from insurance and rent for building management use. Annualized Rent includes rent for our corporate headquarters in Santa Monica. We report Annualized Rent because it is a widely reported measure of the performance of equity REITs, and is used by some investors as a means to determine tenant demand and to compare our performance and value with other REITs. We use Annualized Rent to manage and monitor the performance of our office and multifamily portfolios.
Development Portfolio
Represents the following properties undergoing development activities: (i) a residential property with 712 apartments in Los Angeles which we removed from the residential rental market following a fire in January 2020, (ii) a 456,000 square foot single tenant office property in Los Angeles that we commenced converting to multi-tenant after the tenant's lease expired in 2024 and (iii) a 247,000 square foot office property in Westwood with an adjoining residential development site that we acquired in January 2025 and which we are planning to develop into 323 apartments.
Funds From Operations (FFO)
We calculate FFO in accordance with the standards established by NAREIT by excluding gains (or losses) on sales of investments in real estate, gains (or losses) from changes in control of investments in real estate, real estate depreciation and amortization (other than amortization of right-of-use assets for which we are the lessee and amortization of deferred loan costs), and impairment write-downs of real estate. FFO is a non-GAAP supplemental financial measure that we report because we believe it is useful to our investors. See Management’s Discussion and Analysis of Financial Condition and Results of Operations in Item 2 of this Report for a discussion of FFO.
In-Service Portfolio
Represents our Total Portfolio excluding properties in our Development Portfolio.
Leased Rate
Commencing in the fourth quarter of 2024, the Leased Rate reflects the percentage leased for our In-Service Portfolio as of the reporting date. Prior to the fourth quarter of 2024 the Leased Rate reflected the percentage leased for our Total Portfolio as of the reporting date. Management space is considered leased. Space taken out of service during a repositioning or which is vacant as a result of a fire or other damage is excluded from both the numerator and denominator for calculating the Leased Rate. For newly developed buildings going through lease up, units are included in both the numerator and denominator as they are leased. We report Leased Rate because it is a widely reported measure of the performance of equity REITs, and is also used by some investors as a means to determine tenant demand and to compare our performance with other REITs. We use Leased Rate to manage and monitor the performance of our office and multifamily portfolios.
Net Operating Income (NOI)
We calculate NOI as revenue less operating expenses attributable to the properties that we own and operate. NOI is calculated by excluding the following from our net (loss) income: general and administrative expenses, depreciation and amortization expense, other income, other expenses, interest expense, gains (or losses) on sales of investments in real estate, gain from consolidation of a JV, and net (loss) income attributable to noncontrolling interests. NOI is a non-GAAP supplemental financial measure that we report because we believe it is useful to our investors. See "Management’s Discussion and Analysis of Financial Condition and Results of Operations" in Item 2 of this Report for a discussion of our Same Property NOI.
Occupancy Rate
We calculate Occupancy Rate by excluding signed leases not yet commenced from the Leased Rate. We report Occupancy Rate because it is a widely reported measure of the performance of equity REITs, and is also used by some investors as a means to determine tenant demand and to compare our performance with other REITs. We use Occupancy Rate to manage and monitor the performance of our office and multifamily portfolios.
Building improvements required to maintain revenues once a property has been stabilized, and excludes capital expenditures for (i) acquired buildings being stabilized, (ii) newly developed space, (iii) upgrades to improve revenues or operating expenses or significantly change the use of the space, (iv) casualty damage and (v) bringing the property into compliance with governmental or lender requirements. We report Recurring Capital Expenditures because it is a widely reported measure of the performance of equity REITs, and is used by some investors as a means to determine our cash flow requirements and to compare our performance with other REITs. We use Recurring Capital Expenditures to manage and monitor the performance of our office and multifamily portfolios.
Rentable Square Feet
Based on the BOMA remeasurement and consists of leased square feet (including square feet with respect to signed leases not commenced as of the reporting date), available square feet, building management use square feet and square feet of the BOMA adjustment on leased space. We report Rentable Square Feet because it is a widely reported measure of the performance and value of equity REITs, and is also used by some investors to compare our performance and value with other REITs. We use Rentable Square Feet to manage and monitor the performance of our office portfolio.
Rental Rate
We present two forms of Rental Rates - Cash Rental Rates and Straight-Line Rental Rates. Cash Rental Rate is calculated by dividing the rent paid on the measurement date by the Rentable Square Feet. Straight-Line Rental Rate is calculated by dividing the average rent over the lease term by the Rentable Square Feet.
Same Properties
Our consolidated properties that have been owned and operated by us in a consistent manner, and reported in our consolidated results during the entire span of both periods being compared. We exclude from our same property subset any properties that during the comparable periods were: (i) acquired, (ii) sold, held for sale, contributed or otherwise removed from our consolidated financial statements, (iii) that underwent a major repositioning project or were impacted by development activity, or suffered significant casualty loss that we believed significantly affected the properties' operating results. We also exclude rent received from ground leases. Our same properties for 2026 include all of our In-Service Portfolio properties.
Short-Term Leases
Represents leases that expired on or before the reporting date or had a term of less than one year, including hold over tenancies, month to month leases and other short-term occupancies.
Total Portfolio
Includes our consolidated properties, which includes the properties of our consolidated joint ventures.
This Report contains forward-looking statements within the meaning of the Section 27A of the Securities Act and Section 21E of the Exchange Act. You can find many (but not all) of these statements by looking for words such as “believe”, “expect”, “anticipate”, “estimate”, “approximate”, “intend”, “plan”, “would”, “could”, “may”, “future” or other similar expressions in this Report. We claim the protection of the safe harbor contained in the Private Securities Litigation Reform Act of 1995. We caution investors that any forward-looking statements used in this Report, or those that we make orally or in writing from time to time, are based on our beliefs and assumptions, as well as information currently available to us. Actual outcomes will be affected by known and unknown risks, trends, uncertainties and factors beyond our control or ability to predict. Although we believe that our assumptions are reasonable, they are not guarantees of future performance and some will inevitably prove to be incorrect. As a result, our future results can be expected to differ from our expectations, and those differences may be material. Accordingly, investors should use caution when relying on previously reported forward-looking statements, which were based on results and trends at the time they were made, to anticipate future results or trends. Some of the risks and uncertainties that could cause our actual results, performance or achievements to differ materially from those expressed or implied by forward-looking statements include the following:
•adverse economic, political or real estate developments affecting Southern California or Honolulu, Hawaii;
•competition from other real estate investors in our markets;
•decreasing rental rates or increasing tenant incentive and vacancy rates;
•reduced demand for office space, including as a result of remote work and flexible working arrangements that allow work from remote locations other than the employer’s office premises;
•defaults on, early terminations of, or non-renewal of leases by tenants;
•elevated or increasing interest rates;
•increases in operating and construction costs, including due to inflation and actual or potential tariffs or trade disruptions;
•insufficient cash flows to service our outstanding debt or pay rent on ground leases;
•difficulties in raising capital;
•inability to liquidate real estate or other investments quickly;
•adverse changes to rent control laws and regulations;
•environmental uncertainties;
•natural disasters;
•fire and other property damage;
•insufficient insurance, or increases in insurance costs;
•inability to successfully expand into new markets and submarkets;
•difficulties in identifying properties to acquire and failure to complete acquisitions successfully;
•failure to successfully operate acquired properties;
•risks associated with property development;
•risks associated with JVs;
•conflicts of interest with our officers and reliance on key personnel;
•changes in zoning and other land use laws;
•adverse results of litigation or governmental proceedings;
•failure to comply with laws, regulations and covenants that are applicable to our business;
•possible terrorist attacks or wars;
•possible cyber attacks or intrusions;
•adverse changes to accounting rules;
•weaknesses in our internal controls over financial reporting;
•failure to maintain our REIT status under federal tax laws; and
•adverse changes to tax laws, including those related to property taxes.
For further discussion of these and other risk factors see Item 1A. "Risk Factors” in our 2025 Annual Report on Form 10-K for the fiscal year ended December 31, 2025, and Item 1A. "Risk Factors" in this Report. This Report and all subsequent written and oral forward-looking statements attributable to us or any person acting on our behalf are expressly qualified in their entirety by the cautionary statements contained or referred to in this section. We do not undertake any obligation to release publicly any revisions to our forward-looking statements to reflect events or circumstances after the date of this Report except as required by law.
Notes to Consolidated Financial Statements (unaudited)
1. Overview
Organization and Business Description
Douglas Emmett, Inc. is a fully integrated, self-administered and self-managed REIT. We are one of the largest owners and operators of high-quality office and multifamily properties in Los Angeles County, California and Honolulu, Hawaii. Through our interest in our Operating Partnership, its subsidiaries, and our consolidated JVs, we focus on owning, acquiring, developing and managing a substantial market share of top-tier office properties and premier multifamily communities in neighborhoods that possess significant supply constraints, high-end executive housing and key lifestyle amenities. The terms "us," "we" and "our" as used in the consolidated financial statements refer to Douglas Emmett, Inc. and its subsidiaries on a consolidated basis.
At March 31, 2026, our Total Portfolio consisted of (i) a 18.0 million square foot office portfolio, which included a 456 thousand square foot office property under development, (ii) 5,445 multifamily apartment units, which included 1,035 apartment units under development, and (iii) fee interests in two parcels of land from which we receive rent under ground leases. As of March 31, 2026, our portfolio consisted of the following (including ancillary retail space and excluding two parcels of land from which we receive rent under ground leases):
Total Portfolio
Office
Wholly-owned properties
52
Consolidated JV properties
18
70
Multifamily
Wholly-owned properties
12
Consolidated JV properties
3
15
Total
85
Basis of Presentation
The accompanying consolidated financial statements are the consolidated financial statements of Douglas Emmett, Inc. and its subsidiaries, including our Operating Partnership and our consolidated JVs. All significant intercompany balances and transactions have been eliminated in our consolidated financial statements.
We consolidate entities in which we are considered to be the primary beneficiary of a VIE or have a majority of the voting interest of the entity. We are deemed to be the primary beneficiary of a VIE when we have (i) the power to direct the activities of that VIE that most significantly impact its economic performance, and (ii) the obligation to absorb losses or the right to receive benefits that could potentially be significant to the VIE. We do not consolidate entities in which the other parties have substantive kick-out rights to remove our power to direct the activities, most significantly impacting the economic performance, of that VIE. In determining whether we are the primary beneficiary, we consider factors such as ownership interest, management representation, authority to control decisions, and contractual and substantive participating rights of each party.
We consolidate our Operating Partnership through which we conduct substantially all of our business, and own, directly and through subsidiaries, substantially all of our assets, and are obligated to repay substantially all of our liabilities. The consolidated debt, excluding our consolidated JVs, was $3.83 billion and $3.81 billion as of March 31, 2026 and December 31, 2025. See Note 7. We also consolidate six JVs through our Operating Partnership. We consolidate our Operating Partnership and our six JVs because they are VIEs and we or our Operating Partnership are the primary beneficiary for each.
In addition to the above six consolidated JVs, we entered into a new consolidated JV in March 2026 which acquired an office property in April 2026. See Note 16 to our consolidated financial statements in Item 1 of this Report for more information regarding subsequent events.
Notes to Consolidated Financial Statements (unaudited) (continued)
As of March 31, 2026, our consolidated VIE entities, excluding our Operating Partnership, had:
•aggregate consolidated assets of $3.75 billion (of which $3.53 billion related to investment in real estate), and
•aggregate consolidated liabilities of $1.85 billion (of which $1.78 billion related to debt).
As of December 31, 2025, our consolidated VIE entities, excluding our Operating Partnership, had:
•aggregate consolidated assets of $3.76 billion (of which $3.55 billion related to investment in real estate), and
•aggregate consolidated liabilities of $1.84 billion (of which $1.78 billion related to debt).
The accompanying unaudited interim consolidated financial statements have been prepared pursuant to the rules and regulations of the SEC in conformity with US GAAP as established by the FASB in the ASC. Certain information and footnote disclosures normally included in the consolidated financial statements prepared in conformity with US GAAP may have been condensed or omitted pursuant to SEC rules and regulations, although we believe that the disclosures are adequate to make their presentation not misleading. The accompanying unaudited interim consolidated financial statements include, in our opinion, all adjustments, consisting of normal recurring adjustments, necessary to present fairly the financial information set forth therein. The results of operations for the interim periods are not necessarily indicative of the results that may be expected for the year ending December 31, 2026. The interim consolidated financial statements should be read in conjunction with the consolidated financial statements in our 2025 Annual Report on Form 10-K and the notes thereto. Any references to the number or class of properties, square footage, per square footage amounts, apartment units and geography, are outside the scope of our independent registered public accounting firm’s review of our consolidated financial statements in accordance with the standards of the PCAOB.
2. Summary of Significant Accounting Policies
We have not made any changes to our significant accounting policies disclosed in our 2025 Annual Report on Form 10-K.
Use of Estimates
The preparation of consolidated financial statements in conformity with US GAAP requires management to make certain estimates that affect the reported amounts in the consolidated financial statements and accompanying notes. Actual results could differ materially from those estimates.
Revenue Recognition
Rental revenues and tenant recoveries
We account for our rental revenues, and variable lease payments such as tenant recoveries and parking revenues, in accordance with Topic 842. We adopted a practical expedient which allows us to account for our rental revenues, tenant recoveries and certain parking revenues on a combined basis. Rental revenues and tenant recoveries from tenant leases are included in Rental revenues and tenant recoveries on our consolidated statements of operations. Tenant recoveries were
$13.6 million and $12.2 million for the three months ended March 31, 2026 and 2025, respectively. Parking revenues are included in Parking and other income on our consolidated statements of operations.
Collectibility
In accordance with Topic 842, we perform an assessment as to whether or not substantially all of the amounts due under a tenant’s lease agreement is deemed probable of collection. This assessment involves using a methodology that requires judgment and estimates about matters that are uncertain at the time the estimates are made, including tenant specific factors, specific industry conditions, and general economic trends and conditions.
Notes to Consolidated Financial Statements (unaudited) (continued)
For leases where we have concluded it is probable that we will collect substantially all the lease payments due under those leases, we continue to record lease income on a straight-line basis over the lease term. For leases where we have concluded that it is not probable that we will collect substantially all the lease payments due under those leases, we limit the lease income to the lesser of the income recognized on a straight-line basis or cash basis. We write-off tenant receivables and deferred rent receivables as a charge against rental revenues and tenant recoveries in the period we conclude that substantially all of the lease payments are not probable of collection. If we subsequently collect amounts that were previously written off, then the amounts collected are recorded as an increase to our rental revenues and tenant recoveries in the period they are collected. If our conclusion of collectibility changes, we will record the difference between the lease income that would have been recognized on a straight-line basis and cash basis as a current-period adjustment to rental revenues and tenant recoveries.
Income Taxes
We have elected to be taxed as a REIT under the Code. Provided that we qualify for taxation as a REIT, we are generally not subject to corporate-level income tax on the earnings distributed currently to our stockholders that we derive from our REIT qualifying activities. We are subject to corporate-level income tax on the earnings that we derive through our TRS.
New Accounting Pronouncements
Changes to US GAAP are implemented by the FASB in the form of ASUs. We consider the applicability and impact of all ASUs. As of the date of this Report, the FASB has not issued any ASUs that we expect to be applicable and have a material impact on our consolidated financial statements.
3. Investment in Real Estate
The table below summarizes our investment in real estate:
(1) Net balances transferred from Building and improvements to Property under development for development projects was $13.9 million during 2025. No balances were transferred during the first quarter of 2026.
(2) Property under development balances transferred to Building and improvements for real estate placed into service was $0.3 million and $9.6 million during 2026 and 2025, respectively.
Consolidation of Partnership X
Partnership X is a JV through which we and another investor own two Class A office properties totaling 0.4 million square feet in the Los Angeles submarkets of Brentwood and Beverly Hills. On January 1, 2025, we amended the operating agreement of Partnership X resulting in Partnership X becoming a VIE, and we became the primary beneficiary and commenced consolidating Partnership X on January 1, 2025. The results of Partnership X are included in our operating results from January 1, 2025. Before January 1, 2025, Partnership X was accounted for using the equity method, and our share of Partnership X's net income was included in our statements of operations in Income from unconsolidated Fund.
Notes to Consolidated Financial Statements (unaudited) (continued)
The consolidation of Partnership X required us to recognize the JV's identifiable assets and liabilities at fair value in our consolidated financial statements, along with the fair value of the non-controlling interest of $20.2 million. We recognized a gain of $47.2 million to adjust the carrying value of our existing investment in the JV to its estimated fair value upon consolidation. The gain was determined by taking the difference between: (a) the fair value of Partnership X’s assets less its liabilities and (b) the sum of the fair value of the noncontrolling interest, the carrying value of our investment in Partnership X, and our share of Partnership X's other comprehensive income.
We determined the fair value of Partnership X’s assets and liabilities upon initial consolidation using our estimates of expected future cash flows and other valuation techniques. We estimated the fair values of Partnership X’s properties by using the income and sales comparison valuation approaches which included, but are not limited to, our estimates of rental rates, comparable sales, revenue growth rates, capitalization rates and discount rates. Assumed debt was recorded at fair value based upon the present value of the expected future payments and current interest rates. Other acquired assets, including cash and assumed liabilities were recorded at cost due to the short-term nature of the balances. The table below summarizes the adjusted relative purchase price allocation for the initial consolidation of the JV.
(In thousands)
JV Consolidation
Land
$
4,286
Buildings and improvements
157,956
Tenant improvements and lease intangibles
7,861
Acquired lease intangible assets and liabilities, net
(602)
Interest rate contract assets
6,459
Secured note payable, net
(112,995)
Other assets and liabilities, net
23,501
Net assets and liabilities consolidated
$
86,466
Acquisition of 10900 Wilshire
On January 2, 2025, a consolidated JV that we manage, and in which we own a 30% interest, acquired a 17-story, 247,000 square foot office building at 10900 Wilshire Boulevard in Westwood. Title to the property was transferred following the purchase of a secured note by the JV in 2024, which was partially financed by a $61.8 million loan. See Note 7 for our debt disclosures. We accounted for the acquisition as an asset acquisition and the acquired property's operating results are included in our consolidated operating results from the date of acquisition. The table below summarizes the relative fair values of the assets acquired and liabilities assumed.
(In thousands)
10900 Wilshire
Land
$
9,029
Buildings and improvements
$
80,865
Tenant improvements and lease intangibles
$
4,035
Acquired lease intangible assets and liabilities, net
Notes to Consolidated Financial Statements (unaudited) (continued)
4. Ground Lease
We pay rent under a ground lease located in Honolulu, Hawaii, which expires on December 31, 2086. The rent is fixed at $733 thousand per year until February 28, 2029, after which it will reset to the greater of the existing ground rent or the market rent at the time.
As of March 31, 2026, the ground lease right-of-use asset carrying value was $7.4 million and the ground lease liability was $10.8 million. Ground rent expense, which is included in Office expenses on our consolidated statements of operations, was $183 thousand for each of the three month periods ended March 31, 2026 and 2025.
The table below, which assumes that the ground rent payments will continue to be $733 thousand per year after February 28, 2029, presents the future minimum ground lease payments as of March 31, 2026:
Except as noted below, our loans: (i) are non-recourse, (ii) are secured by separate collateral pools consisting ofoneor more properties, (iii) require interest-only monthly payments with the outstanding principal due upon maturity, and (iv) contain certain financial covenants which could require us to deposit excess cash flow with the lender under certain circumstances unless we (at our option) either provide a guarantee or additional collateral or pay down the loan within certain parameters set forth in the loan documents. Certain loans with maturity date extension options require us to meet minimum financial thresholds in order to extend the loan maturity date.
(1)Maturity dates include extension options.
(2)All of our floating rate debt agreements include a zero-percent SOFR floor. If the loan is swap-fixed then the related swaps do not include such a floor.
(3)Effective rate as of March 31, 2026. Includes the effect of interest rate swaps (if applicable) and excludes the effect of points and prepaid loan fees, and loan premiums/discounts. See Note 9 for details of our interest rate swaps. See further below for details of our loan costs and loan premiums/discounts.
(4)Comprised of eight loans with the same terms.
(5)The construction loan will provide up to $375 million, including interest, for redevelopment of our Landmark Residences project in Brentwood. The loan has a floating interest rate. We entered into accreting swaps starting January 2, 2026 that mature January 1, 2030. As of March 31, 2026, the swaps effectively fix 81% of the loan at an interest rate of 5.80% with the remainder of the loan floating at SOFR + 2.45%. We made certain guarantees related to the loan, including the completion of the development project.
Notes to Consolidated Financial Statements (unaudited) (continued)
(6)The loan consists of a $200 million note that bears interest at 4.5%, of which 2.825% is accrued, and a $135 million note that accrues interest at 6.0%. The accrued interest for both notes is due at maturity and is not subject to compounding. See Note 8 regarding the accrued interest on the loan. The weighted average face rate on the principal balance is 5.10%, and the effective rate as a result of the non-compounding is 4.57%. The loan includes a revolving credit facility of $12.5 million, which accrues interest at 5.5%. As of March 31, 2026, there was no balance outstanding on the revolving credit facility.
(7)The loan has a lender-required out-of-the-money interest rate cap at an interest rate of 7.84% until August 2026. $380 million of swaps were previously associated with other debt that we paid off in August 2025. They continue to hedge our remaining floating rate debt. For purposes of this table we have applied $350.0 million to this loan and the remaining $30.0 million has been applied to our pool of floating rate debt.
(8)The loan requires monthly payments of principal and interest. The principal amortization is based upon a 30-year amortization schedule.
(9)The interest rate cap which capped the interest rate at 7.45% expires in May 2026.
(10)The loan requires monthly payments of principal and interest for twelve months commencing on January 5, 2028 based upon a 25-year principal amortization schedule.
(11)We guaranteed the portion of the loan principal that would need to be paid down in order to meet the minimum debt yield in the loan agreement. See "Guarantees" in Note 15.
(12)The interest rate is fixed at 6% until July 8, 2027 and then increases to 6.25% for the remaining term of the loan.
(13)See Note 12 for our debt fair value disclosures.
(14)Balances are net of accumulated amortization/accretion of $1.0 million and $1.1 million at March 31, 2026 and December 31, 2025, respectively.
(15)Balances are net of accumulated amortization of $59.2 million and $55.8 million at March 31, 2026 and December 31, 2025, respectively.
The table below summarizes our consolidated fixed and floating rate debt. The statistics include the impact of $30.0 million of swaps and $472.0 million of caps that are not assigned to loans in the debt table at the beginning of this footnote.
(In thousands)
Principal Balance as of March 31, 2026
Principal Balance as of December 31, 2025
Aggregate swap-fixed rate loans
$
2,574,100
$
2,520,000
Aggregate fixed rate loans
1,490,980
1,492,861
Aggregate capped rate loans
1,202,000
1,202,000
Aggregate floating rate loans
341,465
378,506
Total Debt
$
5,608,545
$
5,593,367
The table below summarizes certain consolidated debt statistics as of March 31, 2026. The statistics include the impact of $30.0 million of swaps (maturing June 1, 2027) that are not assigned to loans in the debt table at the beginning of this footnote.
Statistics for consolidated loans with interest fixed under the terms of the loan or a swap
Principal balance (in thousands)
$4,065,080
Weighted average remaining life (including extension options)
Notes to Consolidated Financial Statements (unaudited) (continued)
Future Principal Payments
At March 31, 2026, the minimum future principal payments due on our consolidated secured notes payable were as follows:
Twelve months ending March 31,
Including Maturity Extension Options(1)
(In thousands)
2027
$
1,181,999
2028
381,045
2029
1,606,094
2030
397,894
2031
1,136,440
Thereafter
905,073
Total future principal payments
$
5,608,545
________________________________________________
(1) Some of our loan agreements require that we meet certain minimum financial thresholds to be able to extend the loan maturity.
Loan Premium and Loan Costs
The table below presents loan premium and loan costs, which are included in Interest expense on our consolidated statements of operations:
Three Months Ended March 31,
(In thousands)
2026
2025
Loan premium/discount (amortized)/accreted and written off, net
$
83
$
83
Deferred loan costs amortized and written off
3,437
2,457
Loan costs expensed
—
14
Total
$
3,520
$
2,554
8. Interest Payable, Accounts Payable and Deferred Revenue
(In thousands)
March 31, 2026
December 31, 2025
Interest payable(1)
$
35,059
$
32,416
Accounts payable and accrued liabilities
101,145
56,708
Deferred revenue
49,551
50,835
Total interest payable, accounts payable and deferred revenue
$
185,755
$
139,959
________________________________________________
(1) Includes accrued interest of $14.9 million and $11.5 million for a term loan that matures in March 2032, at March 31, 2026 and December 31, 2025, respectively. See Note 7 for more information regarding our debt.
Notes to Consolidated Financial Statements (unaudited) (continued)
9. Derivative Contracts
We make use of interest rate swap and cap contracts to manage the risk associated with changes in interest rates on our floating-rate debt and to satisfy certain lender requirements. When we enter into a floating-rate term loan, we generally enter into an interest rate swap agreement for the equivalent principal amount, for a period covering the majority of the loan term, which effectively converts our floating-rate debt to a fixed-rate basis during that time. We also enter into interest rate cap agreements from time to time to cap the interest rates on our floating rate loans. We may enter into derivative contracts that are intended to hedge certain economic risks, even though hedge accounting does not apply or we elect to not apply hedge accounting. We do not speculate in derivatives and we do not make use of any other derivative instruments. See Note 7 regarding our debt and our consolidated JVs' debt that is hedged.
Derivative Summary
The table below summarizes our derivative contracts as of March 31, 2026:
(1)The notional amount reflects 100%, not our pro-rata share, of our consolidated JVs' derivatives. See Note 7 for more information about our hedged consolidated debt.
(2)Our derivative contracts do not provide for right of offset between derivative contracts.
(3)See Note 12 for our derivative fair value disclosures.
Counterparty Credit Risk
We are subject to credit risk from the counterparties on our interest rate swap and cap contract assets because we do not receive collateral. We seek to minimize that risk by entering into agreements with a variety of counterparties with investment grade ratings. The fair value of our interest rate swap and cap contract assets, including accrued interest and excluding credit risk adjustments, was as follows:
Notes to Consolidated Financial Statements (unaudited) (continued)
Credit-risk-related Contingent Features
Certain of our swaps include credit-risk related contingent features. For example, we have agreements with certain of our interest rate swap counterparties that contain a provision under which we could be declared in default on our derivative obligations if repayment of the underlying indebtedness that we are hedging is accelerated by the lender due to our default on the indebtedness. As of March 31, 2026, there have been no events of default with respect to our interest rate swaps or our consolidated JVs' interest rate swaps. We do not post collateral for our interest rate swap contract liabilities. The fair value of our interest rate swap contract liabilities, including accrued interest and excluding credit risk adjustments, was as follows:
(2)We did not have any unconsolidated entities during the three months ended March 31, 2026 and March 31, 2025. We consolidated Partnership X commencing on January 1, 2025. Our share of the Partnership X's OCI on January 1, 2025 was reclassified to the gain from consolidation we recorded. See Note 3 regarding the consolidation of Partnership X.
Future Reclassifications from AOCI
As of March 31, 2026, we estimate that $16.4 million of gains in AOCI related to derivatives designated as cash flow hedges will be reclassified to interest expense during the next twelve months.
Notes to Consolidated Financial Statements (unaudited) (continued)
10. Equity
During the Three Months Ended March 31, 2026
•We acquired 23 thousand OP Units in exchange for issuing an equal number of shares of our common stock to the holders of the OP Units.
•We acquired 3 thousand OP Units for $31 thousand in cash.
During the Three Months Ended March 31, 2025
•We acquired 11 thousand OP Units in exchange for issuing an equal number of shares of our common stock to the holders of the OP Units.
•We acquired 3 thousand OP Units for $48 thousand in cash.
Noncontrolling Interests
Our noncontrolling interests consist of interests in our Operating Partnership and consolidated JVs which are not owned by us. See Note 3 regarding the noncontrolling interest in the Partnership X JV we consolidated on January 1, 2025. As of March 31, 2026, noncontrolling interests in our Operating Partnership owned 38.2 million OP Units and fully-vested LTIP Units, which represented approximately 18.6% of our Operating Partnership's total outstanding interests, and we owned 167.5 million OP Units (to match our 167.5 million shares of outstanding common stock), which represented approximately 81.4% of our Operating Partnership's total outstanding interests.
A share of our common stock, an OP Unit and an LTIP Unit (once vested and booked up) have essentially the same economic characteristics, sharing equally in the distributions from our Operating Partnership. Investors who own OP Units have the right to cause our Operating Partnership to acquire their OP Units for an amount of cash per unit equal to the market value of one share of our common stock at the date of acquisition, or, at our election, exchange their OP Units for shares of our common stock on aone-for-one basis. LTIP Units have been granted to our employees and non-employee directors as part of their compensation. These awards generally vest over a service period and once vested can generally be converted to OP Units provided our stock price increases by more than a specified hurdle.
Changes in our Ownership Interest in our Operating Partnership
The table below presents the effect on our equity from net (loss) income attributable to common stockholders and changes in our ownership interest in our Operating Partnership:
Three Months Ended March 31,
(In thousands)
2026
2025
Net (loss) income attributable to common stockholders
$
(2,498)
$
39,800
Transfers from noncontrolling interests:
Exchange of OP Units with noncontrolling interests
302
159
Repurchases of OP Units from noncontrolling interests
9
(9)
Net transfers from noncontrolling interests
311
150
Change from net (loss) income attributable to common stockholders and transfers from noncontrolling interests
(1)See Note 9 for the details of our derivatives and Note 12 for our derivative fair value disclosures.
(2)We did not have any unconsolidated entities during the three months ended March 31, 2026 and March 31, 2025. We consolidated Partnership X commencing on January 1, 2025. Our share of the Partnership X's OCI on January 1, 2025 was reclassified to the gain from consolidation we recorded. See Note 3 regarding the consolidation of Partnership X.
Stock-Based Compensation
The Douglas Emmett, Inc. 2016 Omnibus Stock Incentive Plan, as amended (the "2016 Plan"), permits us to make grants of stock-based compensation awards to our directors, officers, employees and consultants. The plan is administered by the compensation committee of our board of directors. As of March 31, 2026, we had an aggregate of 6.2 million shares of common stock available for future awards. The table below presents our stock-based compensation expense:
Notes to Consolidated Financial Statements (unaudited) (continued)
11. EPS
We calculate basic EPS by dividing the net (loss) income attributable to common stockholders for the period by the weighted average number of common shares outstanding during the period. We calculate diluted EPS by dividing the net (loss) income attributable to common stockholders for the period by the weighted average number of common shares and dilutive instruments outstanding during the period using the treasury stock method. We account for unvested LTIP awards that contain non-forfeitable rights to dividends as participating securities and include these securities in the computation of basic and diluted EPS using the two-class method.The table below presents the calculation of basic and diluted EPS:
Three Months Ended March 31,
2026
2025
Numerator (In thousands):
Net (loss) income attributable to common stockholders
$
(2,498)
$
39,800
Allocation to participating securities: Unvested LTIP Units
(440)
(433)
Net (loss) income attributable to common stockholders - basic and diluted
$
(2,938)
$
39,367
Denominator (In thousands):
Weighted average shares of common stock outstanding - basic and diluted(1)
167,466
167,442
Net (loss) income per common share - basic and diluted
(1) Outstanding OP Units and vested LTIP Units are not included in the denominator in calculating diluted EPS, even though they may be exchanged under certain conditions for common stock on a one-for-one basis, because their associated net income or loss (equal on a per unit basis to the Net income or loss per common share - diluted) was already deducted in calculating Net (loss) income attributable to common stockholders. Accordingly, any exchange would not have any effect on diluted EPS. The table below presents the weighted average OP Units and vested LTIP Units outstanding for the respective periods:
Notes to Consolidated Financial Statements (unaudited) (continued)
12. Fair Value of Financial Instruments
Our estimates of the fair value of financial instruments were determined using available market information and widely used valuation methods. Considerable judgment is necessary to interpret market data and determine an estimated fair value. The use of different market assumptions or valuation methods may have a material effect on the estimated fair values. The FASB fair value framework hierarchy distinguishes between assumptions based on market data obtained from sources independent of the reporting entity, and the reporting entity’s own assumptions about market-based inputs. The hierarchy is as follows:
Level 1 - inputs utilize unadjusted quoted prices in active markets for identical assets or liabilities.
Level 2 - inputs are observable either directly or indirectly for similar assets and liabilities in active markets.
Level 3 - inputs are unobservable assumptions generated by the reporting entity.
As of March 31, 2026, we did not have any fair value estimates of financial instruments using Level 3 inputs.
Financial instruments disclosed at fair value
Short term financial instruments
The carrying amounts for cash and cash equivalents, tenant receivables, interest payable, accounts payable, security deposits and dividends payable approximate fair value because of the short-term nature of these instruments.
Secured notes payable
See Note 7 for the details of our secured notes payable. We estimate the fair value of our consolidated secured notes payable by calculating the credit-adjusted present value of the principal and interest payments for each secured note payable. The calculation incorporates observable market interest rates which we consider to be Level 2 inputs, assumes that the loans will be outstanding through maturity, and includes any maturity extension options. The table below presents the estimated fair value and carrying value of our secured notes payable, the carrying value includes unamortized loan premium/discount and excludes unamortized deferred loan fees:
(In thousands)
March 31, 2026
December 31, 2025
Fair value
$
5,579,500
$
5,566,229
Carrying value
$
5,609,712
$
5,594,452
Ground lease liability
See Note 4 for the details of our ground lease. We estimate the fair value of our ground lease liability by calculating the present value of the future lease payments disclosed in Note 4 using our incremental borrowing rate. The calculation incorporates observable market interest rates which we consider to be Level 2 inputs. The table below presents the estimated fair value and carrying value of our ground lease liability:
Notes to Consolidated Financial Statements (unaudited) (continued)
Financial instruments measured at fair value on a recurring basis
Derivative instruments
See Note 9 for the details of our derivatives. We present our derivatives on our consolidated balance sheets at fair value, on a gross basis, excluding accrued interest. We estimate the fair value of our derivative instruments by calculating the credit-adjusted present value of the expected future cash flows of each derivative. The calculation incorporates the contractual terms of the derivatives, observable market interest rates which we consider to be Level 2 inputs, and credit risk adjustments to reflect the counterparty's as well as our own non-performance risk. Our derivatives are not subject to master netting arrangements.
The table below presents the estimated fair value of our derivatives.
(1) Consolidated derivatives, which reflect 100%, not our pro-rata share, of our consolidated JVs' derivatives, are included in interest rate contracts on our consolidated balance sheets. The fair values exclude accrued interest which is included in interest payable on our consolidated balance sheets. See "Loan Guarantees" in Note 15 regarding Partnership X swap guarantees.
Notes to Consolidated Financial Statements (unaudited) (continued)
13. Segment Reporting
Segment information is prepared on the same basis that our chief operating decision maker (CODM) reviews information to assess performance and make resource allocation decisions. Our CODM is our CEO. We operate in two business segments: (i) the acquisition, development, ownership and management of office real estate and (ii) the acquisition, development, ownership and management of multifamily real estate. The services for our office segment primarily include rental of office space and other tenant services, including parking and storage space rental. The services for our multifamily segment include rental of apartments and other tenant services, including parking and storage space rental. Asset information by segment is not reported because we do not use this measure to assess performance or make decisions to allocate resources. Therefore, depreciation and amortization expense is not allocated among segments. General and administrative expenses and interest expense are not included in segment profit as our internal reporting addresses these items on a corporate level.
The table below presents the operating activity of our reportable segments:
(In thousands)
Three Months Ended March 31,
2026
2025
Office Segment
Total office revenues
$
200,520
$
202,097
Office expenses
(74,476)
(73,053)
Office segment profit
126,044
129,044
Multifamily Segment
Total multifamily revenues
50,439
49,438
Multifamily expenses
(16,559)
(16,555)
Multifamily segment profit
33,880
32,883
Total profit from all segments
$
159,924
$
161,927
The table below presents a reconciliation of the net (loss) income attributable to common stockholders to the total profit from all segments:
(In thousands)
Three Months Ended March 31,
2026
2025
Net (loss) income attributable to common stockholders
$
(2,498)
$
39,800
Net loss (income) attributable to noncontrolling interests
Notes to Consolidated Financial Statements (unaudited) (continued)
14. Future Minimum Lease Rental Receipts
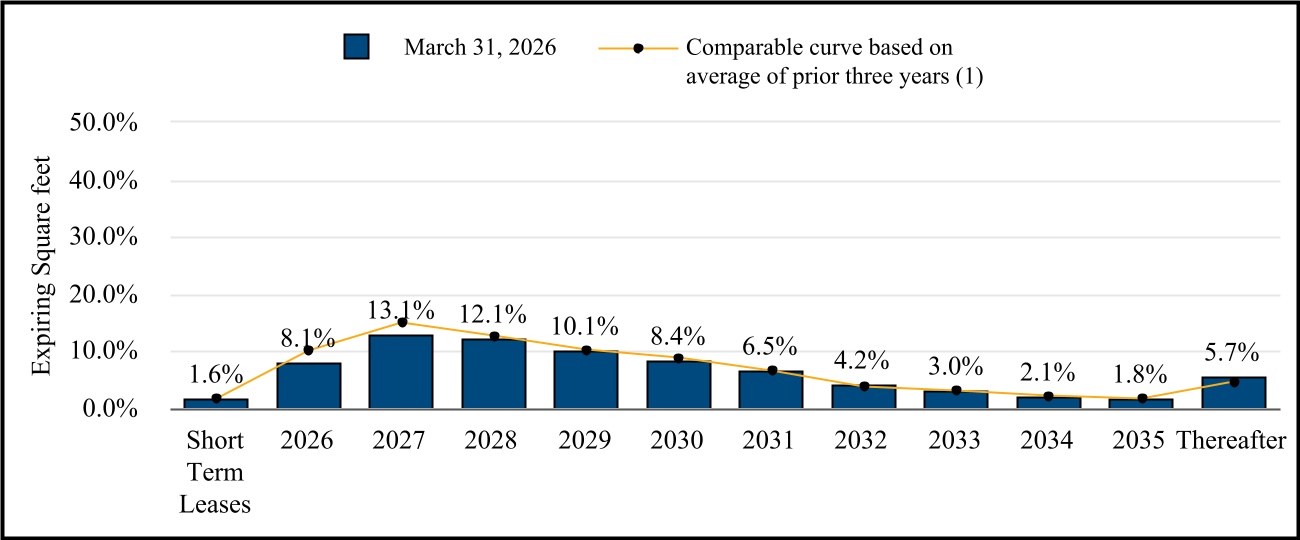
We lease space to tenants primarily under non-cancelable operating leases that generally contain provisions for a base rent plus reimbursement of certain operating expenses, and we own fee interests in two parcels of land from which we receive rent under ground leases. The table below presents the future minimum base rentals on our non-cancelable office tenant and ground leases for our consolidated properties at March 31, 2026:
Twelve months ending March 31,
(In thousands)
2027
$
591,046
2028
523,969
2029
434,801
2030
350,917
2031
290,870
Thereafter
1,072,362
Total future minimum base rentals(1)
$
3,263,965
___________________________________
(1) Does not include (i) residential leases, which typically have a term of one year or less, (ii) holdover rent, (iii) other types of rent such as storage and antenna rent, (iv) tenant reimbursements, (v) straight-line rent, (vi) amortization/accretion of acquired above/below-market lease intangibles and (vii) percentage rents. The amounts assume that early termination options held by tenants will not be exercised.
15. Commitments, Contingencies and Guarantees
Legal Proceedings
From time to time, we are party to various lawsuits, claims and other legal proceedings that arise in the ordinary course of our business. Excluding ordinary, routine litigation incidental to our business, we are not currently a party to any legal proceedings that we believe would reasonably be expected to have a materially adverse effect on our business, financial condition or results of operations.
The Landmark Residences (Formerly Barrington Plaza)
In May 2023, we used a state law, the Ellis Act, to begin moving tenants out of the buildings in order to complete fire and life safety retrofits. We are appealing a ruling by a trial court in Santa Monica that the Ellis Act wasn’t the proper avenue for removing those tenants. We do not expect the ruling to have a meaningful impact on the anticipated timing, cost, or ultimate plans for The Landmark Residences property, and continue to coordinate with the City of Los Angeles to comply with its order to sprinkler The Landmark Residences property and to complete other fire life safety work. We are currently in litigation with the insurance providers in 2020 for The Landmark Residences to recover certain costs associated with reconstruction.
Concentration of Risk
Tenant Receivables
We are subject to credit risk with respect to our tenant receivables and deferred rent receivables related to our tenant leases. Our tenants' ability to honor the terms of their respective leases remains dependent upon economic, regulatory and social factors. We seek to minimize our credit risk from our tenant leases by (i) targeting smaller, more affluent office tenants, from a diverse mix of industries, (ii) performing credit evaluations of prospective tenants and (iii) obtaining security deposits or letters of credit from our tenants. For each of the three month periods ended March 31, 2026 and 2025, no tenant accounted for more than 10% of our total revenues.
Notes to Consolidated Financial Statements (unaudited) (continued)
Geographic Risk
All of our properties, including our consolidated JVs' properties, are located in Los Angeles County, California and Honolulu, Hawaii, and we are therefore susceptible to adverse economic and regulatory developments, as well as natural disasters, in those markets.
Derivative Counterparty Credit Risk
We are subject to credit risk with respect to our derivative counterparties. We do not post or receive collateral with respect to our derivative transactions. Our derivative contracts do not provide for right of offset between derivative contracts. See Note 9 for the details of our derivative contracts. We seek to minimize our credit risk by entering into agreements with a variety of counterparties with investment grade ratings.
Cash Balances
We have significant cash balances invested in a variety of short-term money market funds that are intended to preserve principal value and maintain a high degree of liquidity while providing current income. These investments are not insured against loss of principal and there is no guarantee that our investments in these funds will be redeemable at par value. We also have significant cash balances in bank accounts with high quality financial institutions with investment grade ratings. Interest bearing bank accounts at each U.S. banking institution are insured by the FDIC up to $250 thousand.
Asset Retirement Obligations
Conditional asset retirement obligations represent a legal obligation to perform an asset retirement activity in which the timing and/or method of settlement is conditional on a future event that may or may not be within our control. A liability for a conditional asset retirement obligation must be recorded if the fair value of the obligation can be reasonably estimated. Environmental site assessments have identified thirty-three buildings in our Total Portfolio which contain asbestos, and would have to be removed in compliance with applicable environmental regulations if these properties are demolished or undergo major renovations. As of March 31, 2026, the obligations to remove the asbestos from properties which are currently undergoing major renovations, or that we plan to renovate in the future, are not material to our consolidated financial statements. As of March 31, 2026, the obligations to remove the asbestos from our other properties have indeterminable settlement dates, and we are unable to reasonably estimate the fair value of the associated conditional asset retirement obligations.
Contractual Commitments
As of March 31, 2026, we had an aggregate remaining contractual commitment for development projects, repositioning projects, capital expenditure projects and tenant improvements of approximately $259.7 million.
Loan Guarantees
In November 2023, we signed a guarantee for the $175.0 million consolidated JV loan which guarantees the portion of the loan principal that would need to be paid down to meet the minimum debt yield in the loan agreement. The loan matures in April 2029. The guarantee will remain in effect until either the guarantee obligation or the loan is paid in full. As of March 31, 2026, we estimate the risk of loss for this guarantee to be low. See Note 7for more information regarding our debt.
16. Subsequent Events
In April 2026, a new joint venture managed by us acquired The Bedford Collection, a five-building medical office portfolio, totaling 246,000 square feet in the Beverly Hills Golden Triangle for $260 million. We hold a 13% stake in the joint venture's $150 million of equity. The joint venture also borrowed $130 million secured by a non-recourse, interest-only first trust deed loan that matures in April 2031. The loan bears interest at SOFR plus 1.7%, which we fixed at 5.26% with interest rate swaps through April 2030.
Item 2. Management’s Discussion and Analysis of Financial Condition and Results of Operations
The following discussion should be read in conjunction with our Forward Looking Statements disclaimer, and our consolidated financial statements and related notes in Part I, Item 1 of this Report. During the three months ended March 31, 2026, our results of operations were impacted by: (i) various transactions - see "Acquisitions, Debt and Equity Transactions, and Development and Repositioning Projects" further below.
Business Description
Douglas Emmett, Inc. is a fully integrated, self-administered and self-managed REIT. Through our interest in our Operating Partnership and its subsidiaries, and our consolidated JVs, we are one of the largest owners and operators of high-quality office and multifamily properties in Los Angeles County, California and in Honolulu, Hawaii. We focus on owning, acquiring, developing and managing a substantial market share of top-tier office properties and premier multifamily communities in neighborhoods that possess significant supply constraints, high-end executive housing and key lifestyle amenities.
For the purpose of reporting key operating metrics we are focused on the properties in our In-Service Portfolio. Our In-Service Portfolio consists of our Total Portfolio excluding our Development Portfolio. The Development Portfolio consists of two multifamily properties and one office property whose operations are significantly limited by the development activity and are excluded from our In-Service Portfolio statistics and operating metrics. Our portfolio statistics and operating metrics as of March 31, 2026 were as follows:
In-Service Portfolio
Development Portfolio
Total Portfolio
Office Portfolio
Number of Properties
69
1
70
Rentable square feet
17,526,068
456,205
17,982,273
Multifamily Portfolio
Number of Properties
13
2
15
Number of Units
4,410
1,035
5,445
In-Service Portfolio Leasing Statistics
Office Portfolio
Leased Rate
80.9
%
Occupancy Rate
77.5
%
Multifamily Portfolio Leased Rate
99.6
%
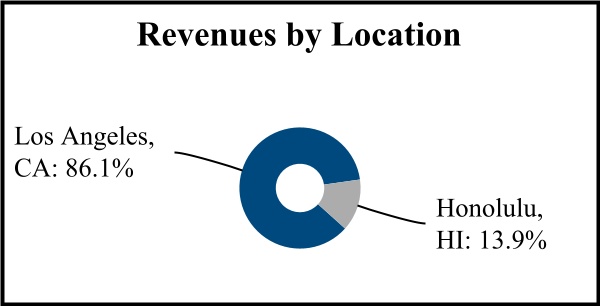
Revenues by Segment and Location
During the three months ended March 31, 2026, revenues from our Total Portfolio were derived as follows:
Acquisitions, Debt and Equity Transactions, and Development and Repositioning Projects
Acquisitions, Debt and Equity Transactions
During the first quarter of 2026:
•We entered into accreting swaps starting January 2, 2026 that mature January 1, 2030 to effectively fix the interest rate on a portion of the increasing estimated balance outstanding under the construction loan at 5.80%.
•In March 2026, we entered into a new consolidated JV for the purpose of acquiring medical office properties in Beverly Hills, CA. We will manage and own a 13% interest in the JV. See Note 16 to our consolidated financial statements in Item 1 of this Report for more information regarding this acquisition.
See Notes 7 and 9 to our consolidated financial statements in Item 1 of this Report for more information regarding our debt and derivative contracts, respectively.
Development Portfolio
Studio Plaza
Studio Plaza is a 456,000 square foot office property located in Burbank. Following the move-out of a long-term single tenant, we are converting the property into a multi-tenant office building. The extensive common area upgrades have been completed and the construction of new tenant suites is ongoing.
The Landmark Residences (Formerly Barrington Plaza)
During the second quarter of 2023, we removed The Landmark Residences residential property in Los Angeles from the rental market. A reconstruction of this property is expected to take a number of years at a cost of several hundred million dollars. As of March 31, 2026, a significant majority of the tenants have vacated. See "Legal Proceedings" in Note 15 to our consolidated financial statements in Item 1 of this Report.
10900 Wilshire Boulevard
During the first quarter of 2025, a consolidated JV that we manage acquired an office property located at 10900 Wilshire. We are developing a mixed-used community featuring up to 323 apartment units. We will convert the existing 247,000 square foot office tower into a residential and office building with up to 200 units, integrating it with a new residential building that we are constructing on the property. The conversion of the office tower will occur in phases over a number of years as the office space in the building is vacated.
Repositionings
We often strategically purchase properties with large vacancies or expected near-term lease roll-over and use our knowledge of the property and submarket to reposition the property for the optimal use and tenant mix. In addition, we may reposition properties already in our portfolio. The work we undertake to reposition a building typically takes months or even years, and could involve a range of improvements from a complete structural renovation to a targeted remodeling of selected spaces. During the repositioning, the affected property may display depressed rental revenues and occupancy levels that impact our operating results and, therefore, comparisons of our performance from period to period.
The table below presents the average annual rental rate per leased square foot and the annualized lease transaction costs per leased square foot for leases executed in our total office portfolio during the respective periods. Commencing with the fourth quarter of 2024, the table below presents only our In-Service Portfolio.
(1)These average rental rates are not directly comparable from year to year because the averages are significantly affected from period to period by factors such as the buildings, submarkets, and types of space and terms involved in the leases executed during the respective reporting period. Because straight-line rent takes into account the full economic value during the full term of each lease, including rent concessions and escalations, we believe that it may provide a better comparison than ending cash rents, which include the impact of the annual escalations over the entire term of the lease.
(2)Reflects the weighted average straight-line Annualized Rent. Excludes leases with a term of twelve months or less, leases where the prior lease was terminated more than a year before signing of the new lease, leases for tenants relocated at the landlord's request, leases in acquired buildings where we believe the information about the prior agreement is incomplete or where we believe the base rent reflects other off-market inducements to the tenant, and other non-comparable leases, such as retail leases.
(3)Reflects the weighted average leasing commissions and tenant improvement allowances divided by the weighted average number of years for the leases. Excludes leases substantially negotiated by the seller in the case of acquired properties, leases for tenants relocated from space at the landlord's request, and non-comparable leases, such as retail leases.
(4)Our office rental rates and lease transaction costs were impacted by a large tenant lease renewal during 2024. Our lease transaction costs in the first quarter of 2026 were impacted by a number of new leases to large tenants.
The table below presents the rent roll for new and renewed leases per leased square foot executed in our total office portfolio. The table below presents only our In-Service Portfolio.
(1)Represents the average annual initial stabilized cash and straight-line rents per square foot on new and renewed leases signed during the period compared to the prior leases for the same space. Excludes leases with a term of twelve months or less, leases where the prior lease was terminated more than a year before signing of the new lease, leases for tenants relocated at the landlord's request, leases in acquired buildings where we believe the information about the prior agreement is incomplete or where we believe the base rent reflects other off-market inducements to the tenant, and other non-comparable leases, such as retail leases.
(2)Our office rent roll can fluctuate from period to period as a result of changes in our submarkets, buildings and term of the expiring leases, making these metrics difficult to predict.
Multifamily Rental Rates
The table below presents the average annual rental rate per leased unit for new tenants. Commencing with the fourth quarter of 2024, the table below presents only our In-Service Portfolio.
(1) These average rental rates are not directly comparable from year to year because of changes in the properties and units included. For example:
(i) During 2023, the average was impacted by leasing of units at our newly developed West Los Angeles property, The Landmark Los Angeles, where the rental rates were higher than the average in our portfolio. The Landmark Residences (formerly Barrington Plaza) was removed from this metric beginning with the third quarter of 2023.
(ii) During 2024, the average was impacted by leasing of units at our newly developed West Los Angeles property, The Landmark Los Angeles, where the rental rates were higher than the average in our portfolio.
Multifamily Rent Roll
The rent on leases subject to rent change during the three months ended March 31, 2026 (new tenants and existing tenants undergoing annual rent review) was 2.7% higher on average than the prior rent for the same unit after adjusting for rent concessions. The rent change includes only our In-Service Portfolio.
Office and Multifamily Occupancy Rates
The tables below present the occupancy rates for our office portfolio and multifamily portfolio. Our Occupancy Rates may not be directly comparable from year to year, as they can be impacted by acquisitions, dispositions, and development and redevelopment projects. Commencing with the fourth quarter of 2024, the table below presents only our In-Service Portfolio.
(1)Excludes units vacated as part of removing The Landmark Residences (formerly Barrington Plaza) from the rental market until June of 2023 and excludes the impact of The Landmark Residences entirely starting in July 2023.
(2)Average occupancy rates are calculated by averaging the occupancy rates at the end of each of the quarters in the period and at the end of the quarter immediately prior to the start of the period.
Office Portfolio Lease Expirations
As of March 31, 2026, assuming non-exercise of renewal options and early termination rights, we expect to see expiring square footage for our In-Service office portfolio as follows:
(1) Average of the percentage of leases at March 31, 2023, 2024, and 2025 with the same remaining duration as the leases for the labeled year had at March 31, 2026.
Comparison of three months ended March 31, 2026 to three months ended March 31, 2025
Three Months Ended March 31,
Favorable (Unfavorable)
2026
2025
Change
%
Commentary
(In thousands)
Revenues
Office rental revenue and tenant recoveries
$
169,052
$
172,514
$
(3,462)
(2.0)
%
The decrease was primarily due to lower rental revenues due to lower occupancy, partly offset by higher tenant recoveries.
Office parking and other income
$
31,468
$
29,583
$
1,885
6.4
%
The increase was primarily due to higher parking income driven by higher parking rates.
Multifamily revenue
$
50,439
$
49,438
$
1,001
2.0
%
The increase was primarily due to higher rental revenues driven by higher occupancy and higher rental rates, partly offset by lower below-market lease accretion.
Operating expenses
Office rental expenses
$
74,476
$
73,053
$
(1,423)
(1.9)
%
The increase was primarily due to: (i) higher property taxes, (ii) higher utilities expenses, and (iii) higher scheduled services expenses, (iv) partly offset by lower insurance.
Multifamily rental expenses
$
16,559
$
16,555
$
(4)
—
%
Multifamily rental expenses did not change significantly with higher personnel expenses offset by lower insurance expenses.
General and administrative expenses
$
13,576
$
11,460
$
(2,116)
(18.5)
%
The increase was primarily due to: (i) higher legal fees and (ii) higher advocacy expenses.
Depreciation and amortization
$
97,407
$
97,840
$
433
0.4
%
Depreciation and amortization did not change significantly compared to the prior period.
We report FFO because it is a widely reported measure of the performance of equity REITs, and is also used by some investors to identify the impact of trends in occupancy rates, rental rates and operating costs from year to year, excluding impacts from changes in the value of our real estate, and to compare our performance with other REITs. FFO is a non-GAAP financial measure for which we believe that net (loss) income is the most directly comparable GAAP financial measure. FFO has limitations as a measure of our performance because it excludes depreciation and amortization of real estate, and captures neither the changes in the value of our properties that result from use or market conditions, nor the level of capital expenditures, tenant improvements and leasing commissions necessary to maintain the operating performance of our properties, all of which have real economic effect and could materially impact our results from operations. FFO should be considered only as a supplement to net (loss) income as a measure of our performance and should not be used as a measure of our liquidity or cash flow, nor is it indicative of funds available to fund our cash needs, including our ability to pay dividends. Other REITs may not calculate FFO in accordance with the NAREIT definition and, accordingly, our FFO may not be comparable to the FFO of other REITs. See "Results of Operations" above for a discussion of the items that impacted our net (loss) income.
FFO Reconciliation to GAAP
The table below reconciles our FFO (the FFO attributable to our common stockholders and noncontrolling interests in our Operating Partnership - which includes our share of our consolidated JVs FFO) to net (loss) income attributable to common stockholders (the most directly comparable GAAP measure).
Three Months Ended March 31,
(In thousands)
2026
2025
Net (loss) income attributable to common stockholders
$
(2,498)
$
39,800
Depreciation and amortization of real estate assets
97,407
97,840
Net loss (income) attributable to noncontrolling interests
(1)Adjusts for the net (loss) income and depreciation and amortization of real estate assets that is attributable to the noncontrolling interests in our consolidated JVs.
Comparison of three months ended March 31, 2026 to three months ended March 31, 2025
For the three months ended March 31, 2026, FFO decreased by $5.1 million, or 6.2%, to $75.9 million, compared to $81.0 million for the three months ended March 31, 2025. The decrease was primarily due to: (i) higher interest expense, (ii) lower office occupancy, (iii) higher general and administrative expense, (iv) lower interest income and (v) higher office expenses, which was partly offset by higher multifamily rental revenues due to higher occupancy and higher rental rates.
Non-GAAP Supplemental Financial Measure: Same Property NOI
Usefulness to Investors
We report Same Property NOI to facilitate a comparison of our operations between reported periods. Many investors use Same Property NOI to evaluate our operating performance and to compare our operating performance with other REITs, because it can reduce the impact of investing transactions on operating trends. Same Property NOI is a non-GAAP financial measure for which we believe that net (loss) income is the most directly comparable GAAP financial measure. We report Same Property NOI because it is a widely recognized measure of the performance of equity REITs, and is used by some investors to identify trends in occupancy rates, rental rates and operating costs and to compare our operating performance with that of other REITs. Same Property NOI has limitations as a measure of our performance because it excludes depreciation and amortization expense, and captures neither the changes in the value of our properties that result from use or market conditions, nor the level of capital expenditures, tenant improvements and leasing commissions necessary to maintain the operating performance of our properties, all of which have real economic effect and could materially impact our results from operations. Other REITs may not calculate Same Property NOI in the same manner. As a result, our Same Property NOI may not be comparable to the Same Property NOI of other REITs. Same Property NOI should be considered only as a supplement to net (loss) income as a measure of our performance and should not be used as a measure of our liquidity or cash flow, nor is it indicative of funds available to fund our cash needs, including our ability to pay dividends.
Comparison of three months ended March 31, 2026 to three months ended March 31, 2025
Our Same Properties for 2026 included 69 office properties, aggregating 17.5 million Rentable Square Feet, and 13 multifamily properties with an aggregate 4,410 units. The amounts presented below reflect 100% (not our pro-rata share).
Three Months Ended March 31,
Favorable (Unfavorable)
2026
2025
Change
%
Commentary
(In thousands)
Office revenues
$
196,227
$
197,191
$
(964)
(0.5)
%
The decrease was primarily due to lower rental revenues due to lower occupancy, partly offset by higher parking income due to higher parking rates, and higher tenant recoveries.
Office expenses
(73,591)
(71,922)
(1,669)
(2.3)
%
The increase was primarily due to higher property taxes, higher utilities expenses, and higher scheduled service expenses, partly offset by insurance expenses.
Office NOI
122,636
125,269
(2,633)
(2.1)
%
Multifamily revenues
49,984
48,949
1,035
2.1
%
The increase was primarily due to higher rental revenues driven by higher occupancy and higher rental rates, partly offset by lower below-market lease accretion.
Multifamily expenses
(16,427)
(16,274)
(153)
(0.9)
%
The increase was primarily due to an increase in personnel expenses, offset by lower insurance expenses.
The table below presents a reconciliation of Net (loss) income attributable to common stockholders (the most directly comparable GAAP measure) to NOI and Same Property NOI:
Three Months Ended March 31,
(In thousands)
2026
2025
Net (loss) income attributable to common stockholders
$
(2,498)
$
39,800
Net (loss) income attributable to noncontrolling interests
Our short-term liquidity needs consist primarily of funds necessary for our operating activities, development, repositioning projects, debt refinancings, dividends, distributions and discretionary share repurchases. During the three months ended March 31, 2026, we generated cash from operations of $116.9 million. As of March 31, 2026, we had $357.2 million of cash and cash equivalents. See Note 7 to our consolidated financial statements in Item 1 of this Report for more information regarding our debt maturities and interest rate swap expirations. Excluding acquisitions and debt refinancings, we expect to meet our short-term liquidity requirements through cash on hand and cash generated by operations. With respect to our short-term debt maturities, we expect to refinance them prior to maturity.
Long-term liquidity
Our long-term liquidity needs consist primarily of funds necessary to pay for acquisitions, development and debt refinancings. We do not expect to have sufficient funds on hand to cover these long-term cash requirements due to REIT federal tax rules which require that we distribute at least 90% of our income on an annual basis. We plan to meet our long-term liquidity needs through long-term secured non-recourse debt, the issuance of equity securities, including common stock and OP Units, as well as property dispositions and JV transactions.
We generally only use non-recourse debt secured by our properties. As of the date of this report, approximately 43% of our total office portfolio was unencumbered. To mitigate the impact of changing interest rates on our cash flows from operations, we generally enter into interest rate swap agreements with respect to our loans with floating interest rates. These swap agreements generally expire two years before the maturity date of the related loan, during which time we can refinance the loan without any interest penalty. We also enter into interest rate cap agreements from time to time to cap the interest rates on our floating rate loans. See Notes 7 and 9 to our consolidated financial statements in Item 1 of this Report for more information regarding our debt and derivative contracts, respectively. See Item 3 "Quantitative and Qualitative Disclosures about Market Risk" of this Report regarding the impact of interest rate increases on our future operating results and cash flows.
Certain Contractual Obligations
See the following notes to our consolidated financial statements in Item 1 of this Report for information regarding our contractual commitments:
•Note 4 - minimum future ground lease payments;
•Note 7 - minimum future principal payments for our secured notes payable, and the interest rates that determine our future periodic interest payments; and
•Note 15 - contractual commitments and guarantees.
(1) Our cash flows from operating activities are primarily dependent upon the occupancy and rental rates of our portfolio, the collectibility of tenant receivables, the level of our operating and general and administrative expenses, and interest expense. The decrease in cash provided from operating activities of $15.7 million was primarily due to: (i) higher interest expense, (ii) lower office occupancy, (iii) higher general and administrative expense, (iv) lower interest income and (v) higher office expenses, which was partly offset by higher multifamily rental revenues due to higher occupancy and higher rental rates.
(2) Our cash flows from investing activities is generally used to fund property acquisitions, developments and redevelopment projects, and Recurring and non-Recurring Capital Expenditures. The increase in cash used in investing activities of $40.9 million was primarily due to $25.6 million of cash and cash equivalents assumed from the consolidation of Partnership X on January 1, 2025, an increase in capital expenditures for improvements to real estate of $9.4 million, and an increase in capital expenditures for developments of $5.9 million.
(3) Our cash flows from financing activities are generally impacted by our borrowings and capital activities, as well as dividends and distributions paid to common stockholders and noncontrolling interests, respectively. The increase in cash used in financing activities of $8.0 million was primarily due to lower net borrowings and a decrease in loan cost payments of $2.9 million.
Critical Accounting Policies and Estimates
We have not made any changes to our critical accounting policies disclosed in our 2025 Annual Report on Form 10-K. Our discussion and analysis of our financial condition and results of operations is based upon our consolidated financial statements, which have been prepared in accordance with US GAAP, and which requires us to make estimates of certain items, which affect the reported amounts of our assets, liabilities, revenues and expenses. While we believe that our estimates are based upon reasonable assumptions and judgments at the time that they are made, some of our estimates could prove to be incorrect, and those differences could be material. Some of our estimates are subject to adjustment as we believe appropriate, based on revised estimates, and reconciliation to actual results when available.
Item 3. Quantitative and Qualitative Disclosures about Market Risk
Fixed-Rate Borrowings and Hedged Borrowings
As of March 31, 2026, the interest rates for 72% of our consolidated borrowings were fixed or swap-fixed with interest rate swaps, and 21% were capped with interest rate caps. As of March 31, 2026, the maximum amount the interest expense on our capped-rate borrowings could increase by is $38.9 million per year. Higher interest rates would cause an increase in our future interest expense on our capped-rate debt, which would reduce our future net income, cash flows from operations and FFO. Our interest rate swap agreements generally expire two years before the maturity date of the related loan, during which time we can refinance the loan without any interest penalty. After the interest rate swap agreements expire the related debt will be floating rate. Higher interest rates, to the extent they are higher than our swap-fixed rates when our interest rate swaps expire, would cause our future interest expense on our debt to increase, which would reduce our future net income, cash flows from operations and FFO. See Note 7 to our consolidated financial statements in Item 1 of this Report for more information regarding our debt maturities and our interest rate swap expirations.
Our use of interest rate swaps and caps also exposes us to credit risk from the potential inability of our counterparties to perform under the terms of those agreements. We attempt to minimize this credit risk by contracting with a variety of financial counterparties with investment grade ratings. See Note 9 to our consolidated financial statements in Item 1 of this Report for more information regarding our interest rate swaps and caps.
Unhedged Floating-Rate Borrowings
As of March 31, 2026, the interest rates for 6% of our consolidated borrowings were floating with no caps. As of March 31, 2026, the interest expense for our unhedged floating-rate borrowings would increase by $3.5 million per year for every one hundred basis points increase in the related benchmark interest rate. Higher interest rates would cause an increase in our future interest expense on our floating-rate debt, which would reduce our future net income, cash flows from operations and FFO. See Note 7 to our consolidated financial statements in Item 1 of this Report for more information regarding our floating rate debt.
Item 4. Controls and Procedures
As of March 31, 2026, the end of the period covered by this Report, we carried out an evaluation, under the supervision and with the participation of management, including our CEO and CFO, regarding the effectiveness of our disclosure controls and procedures (as defined in Rules 13a-15(e) and 15d-15(e) under the Exchange Act). Based on the foregoing, our CEO and CFO concluded, as of that time, that our disclosure controls and procedures were effective in ensuring that information required to be disclosed by us in reports filed or submitted under the Exchange Act (i) is processed, recorded, summarized and reported within the time periods specified in the SEC’s rules and forms and (ii) is accumulated and communicated to our management, including our CEO and our CFO, as appropriate, to allow for timely decisions regarding required disclosure. There have not been any changes in our internal control over financial reporting that occurred during the quarter ended March 31, 2026, that have materially affected, or are reasonably likely to materially affect, our internal control over financial reporting.
From time to time, we are party to various lawsuits, claims and other legal proceedings that arise in the ordinary course of our business. Excluding ordinary routine litigation incidental to our business, we are not currently a party to any legal proceedings that we believe would reasonably be expected to have a materially adverse effect on our business, financial condition or results of operations. See "Legal Proceedings" in Note 15 to our consolidated financial statements in Part I, Item 1 of this Report.
Item 1A. Risk Factors
We are not aware of any material changes to the risk factors disclosed in Part I, “Item 1A. Risk Factors” in our 2025 Annual Report on Form 10-K.
Item 2. Unregistered Sales of Equity Securities and Use of Proceeds
None.
Item 3. Defaults Upon Senior Securities
None.
Item 4. Mine Safety Disclosures
Not applicable.
Item 5. Other Information
(a) None.
(b) None.
(c) During the three months ended March 31, 2026, no director or officer of the Company adopted or terminateda “Rule 10b5-1 trading arrangement” or “non-Rule 10b5-1 trading arrangement,” as each such term is defined in Item 408(a) of Regulation S-K.
Inline XBRL Instance Document - the instance document does not appear in the interactive data file because its XBRL tags are embedded within the inline XBRL document.
Cover Page Interactive Data File (embedded within the Inline XBRL document)
________________________________________________
(1) Filed with Amendment No. 6 to Form S-11 on October 19, 2006 and incorporated herein by this reference. (File number 333-135082).
(2) Filed with Form 8-K on September 6, 2013 and incorporated herein by this reference. (File number 001-33106).
(3) Filed with Form 8-K on October 30, 2006 and incorporated herein by this reference. (File number 001-33106).
(4) Filed with Form 8-K on April 9, 2018 and incorporated herein by this reference. (File number 001-33106).
(5) In accordance with SEC Release No. 33-8212, these exhibits are being furnished, and are not being filed as part of this Report on Form 10-Q or as a separate disclosure document, and are not being incorporated by reference into any Securities Act registration statement.
Pursuant to the requirements of the Exchange Act, the registrant has duly caused this report to be signed on its behalf by the undersigned, thereunto duly authorized.
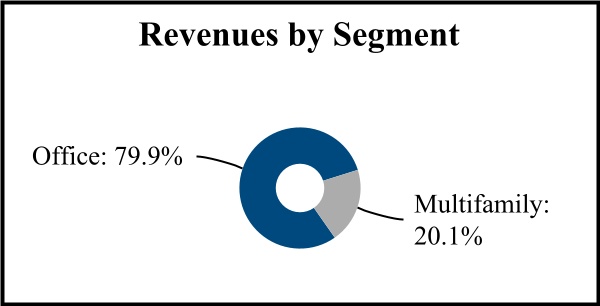 ____
____