| Q4 2020 SHAREHOLDER LETTER FEBRUARY 25, 2021 |

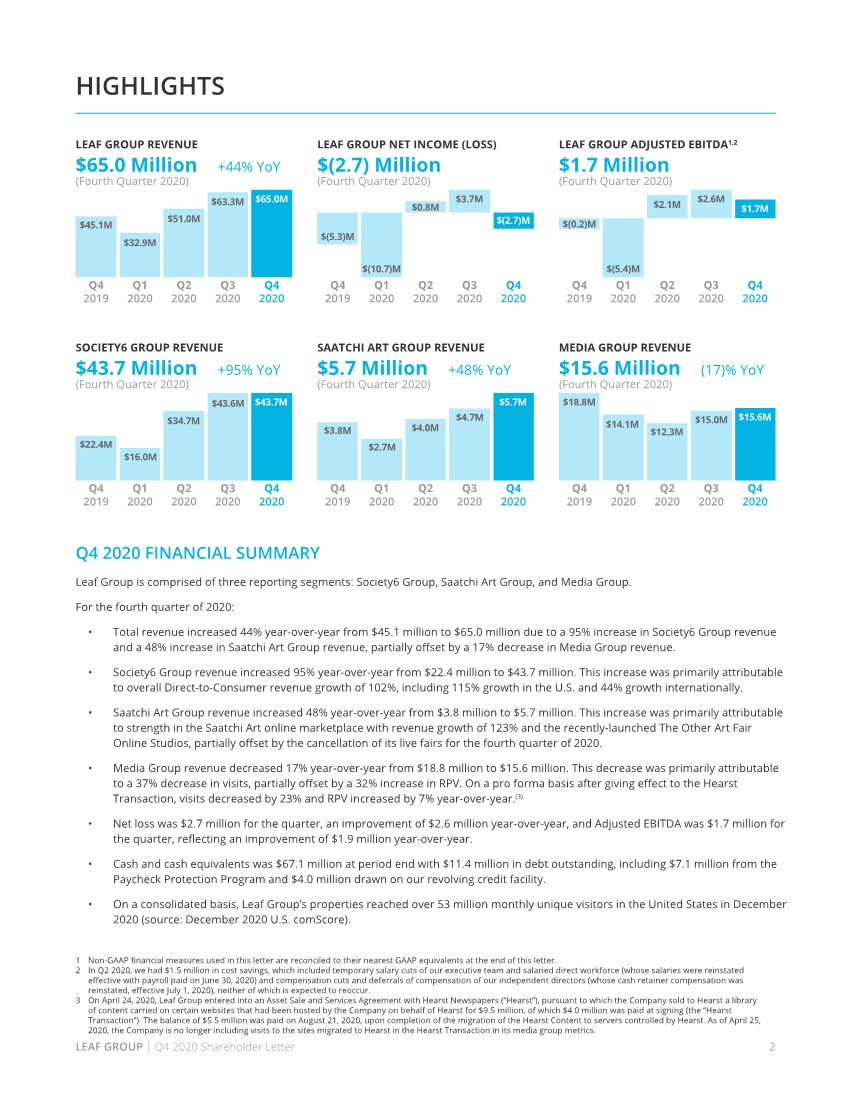
| 2 LEAF GROUP | Q4 2020 Shareholder Letter Q4 2019 Q1 2020 Q2 2020 Q3 2020 Q4 2020 Q4 2019 Q1 2020 Q2 2020 Q3 2020 Q4 2020 Q4 2019 Q1 2020 Q2 2020 Q3 2020 Q4 2020 Q4 2019 Q1 2020 Q2 2020 Q3 2020 Q4 2020 HIGHLIGHTS Q4 2020 FINANCIAL SUMMARY $22.4M $16.0M $34.7M $43.6M $43.7M SOCIETY6 GROUP REVENUE $43.7 Million +95% YoY (Fourth Quarter 2020) 1 Non-GAAP financial measures used in this letter are reconciled to their nearest GAAP equivalents at the end of this letter. 2 In Q2 2020, we had $1.5 million in cost savings, which included temporary salary cuts of our executive team and salaried direct workforce (whose salaries were reinstated effective with payroll paid on June 30, 2020) and compensation cuts and deferrals of compensation of our independent directors (whose cash retainer compensation was reinstated, effective July 1, 2020), neither of which is expected to reoccur. 3 On April 24, 2020, Leaf Group entered into an Asset Sale and Services Agreement with Hearst Newspapers (“Hearst”), pursuant to which the Company sold to Hearst a library of content carried on certain websites that had been hosted by the Company on behalf of Hearst for $9.5 million, of which $4.0 million was paid at signing (the “Hearst Transaction”). The balance of $5.5 million was paid on August 21, 2020, upon completion of the migration of the Hearst Content to servers controlled by Hearst. As of April 25, 2020, the Company is no longer including visits to the sites migrated to Hearst in the Hearst Transaction in its media group metrics. LEAF GROUP ADJUSTED EBITDA1,2 $1.7 Million (Fourth Quarter 2020) $18.8M $14.1M $12.3M $15.0M $15.6M MEDIA GROUP REVENUE $15.6 Million (17)% YoY (Fourth Quarter 2020) $3.8M $2.7M $4.0M $4.7M $5.7M SAATCHI ART GROUP REVENUE $5.7 Million +48% YoY (Fourth Quarter 2020) $(5.4)M $(0.2)M $2.6M $2.1M $1.7M LEAF GROUP REVENUE $65.0 Million +44% YoY (Fourth Quarter 2020) Q4 2019 Q1 2020 Q2 2020 Q3 2020 Q4 2020 Q4 2019 Q1 2020 Q2 2020 Q3 2020 Q4 2020 $45.1M $32.9M $51.0M $63.3M $65.0M LEAF GROUP NET INCOME (LOSS) $(2.7) Million (Fourth Quarter 2020) $(5.3)M $(10.7)M $3.7M $0.8M $(2.7)M Leaf Group is comprised of three reporting segments: Society6 Group, Saatchi Art Group, and Media Group. For the fourth quarter of 2020: • Total revenue increased 44% year-over-year from $45.1 million to $65.0 million due to a 95% increase in Society6 Group revenue and a 48% increase in Saatchi Art Group revenue, partially offset by a 17% decrease in Media Group revenue. • Society6 Group revenue increased 95% year-over-year from $22.4 million to $43.7 million. This increase was primarily attributable to overall Direct-to-Consumer revenue growth of 102%, including 115% growth in the U.S. and 44% growth internationally. • Saatchi Art Group revenue increased 48% year-over-year from $3.8 million to $5.7 million. This increase was primarily attributable to strength in the Saatchi Art online marketplace with revenue growth of 123% and the recently-launched The Other Art Fair Online Studios, partially offset by the cancellation of its live fairs for the fourth quarter of 2020. • Media Group revenue decreased 17% year-over-year from $18.8 million to $15.6 million. This decrease was primarily attributable to a 37% decrease in visits, partially offset by a 32% increase in RPV. On a pro forma basis after giving effect to the Hearst Transaction, visits decreased by 23% and RPV increased by 7% year-over-year.(3) • Net loss was $2.7 million for the quarter, an improvement of $2.6 million year-over-year, and Adjusted EBITDA was $1.7 million for the quarter, reflecting an improvement of $1.9 million year-over-year. • Cash and cash equivalents was $67.1 million at period end with $11.4 million in debt outstanding, including $7.1 million from the Paycheck Protection Program and $4.0 million drawn on our revolving credit facility. • On a consolidated basis, Leaf Group’s properties reached over 53 million monthly unique visitors in the United States in December 2020 (source: December 2020 U.S. comScore). |
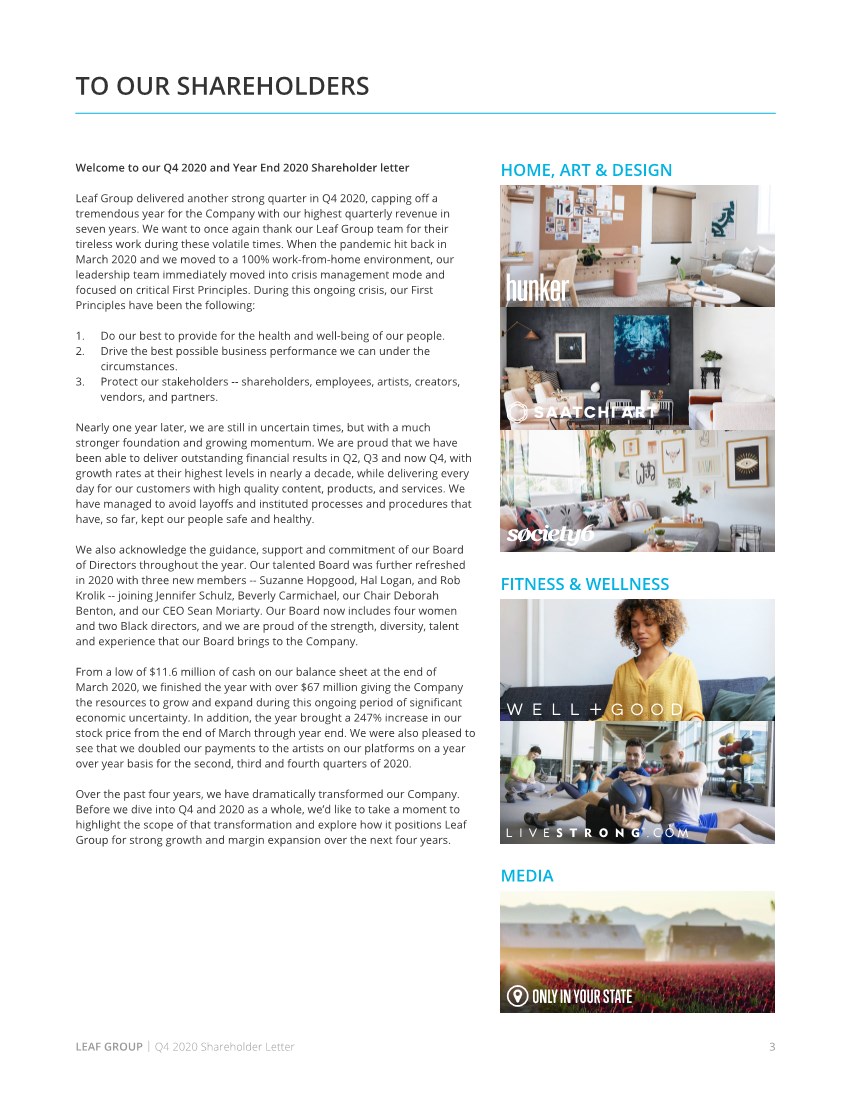
| 3 LEAF GROUP | Q4 2020 Shareholder Letter Welcome to our Q4 2020 and Year End 2020 Shareholder letter Leaf Group delivered another strong quarter in Q4 2020, capping off a tremendous year for the Company with our highest quarterly revenue in seven years. We want to once again thank our Leaf Group team for their tireless work during these volatile times. When the pandemic hit back in March 2020 and we moved to a 100% work-from-home environment, our leadership team immediately moved into crisis management mode and focused on critical First Principles. During this ongoing crisis, our First Principles have been the following: 1. Do our best to provide for the health and well-being of our people. 2. Drive the best possible business performance we can under the circumstances. 3. Protect our stakeholders -- shareholders, employees, artists, creators, vendors, and partners. Nearly one year later, we are still in uncertain times, but with a much stronger foundation and growing momentum. We are proud that we have been able to deliver outstanding financial results in Q2, Q3 and now Q4, with growth rates at their highest levels in nearly a decade, while delivering every day for our customers with high quality content, products, and services. We have managed to avoid layoffs and instituted processes and procedures that have, so far, kept our people safe and healthy. We also acknowledge the guidance, support and commitment of our Board of Directors throughout the year. Our talented Board was further refreshed in 2020 with three new members -- Suzanne Hopgood, Hal Logan, and Rob Krolik -- joining Jennifer Schulz, Beverly Carmichael, our Chair Deborah Benton, and our CEO Sean Moriarty. Our Board now includes four women and two Black directors, and we are proud of the strength, diversity, talent and experience that our Board brings to the Company. From a low of $11.6 million of cash on our balance sheet at the end of March 2020, we finished the year with over $67 million giving the Company the resources to grow and expand during this ongoing period of significant economic uncertainty. In addition, the year brought a 247% increase in our stock price from the end of March through year end. We were also pleased to see that we doubled our payments to the artists on our platforms on a year over year basis for the second, third and fourth quarters of 2020. Over the past four years, we have dramatically transformed our Company. Before we dive into Q4 and 2020 as a whole, we’d like to take a moment to highlight the scope of that transformation and explore how it positions Leaf Group for strong growth and margin expansion over the next four years. TO OUR SHAREHOLDERS HOME, ART & DESIGN FITNESS & WELLNESS MEDIA |
| 4 LEAF GROUP | Q4 2020 Shareholder Letter FOUR YEAR TRANSFORMATION Since rebranding the Company to Leaf Group in late 2016, we have worked hard to transform the company beyond its roots as a content-light, high volume digital publisher by creating and growing high-quality brands in key lifestyle categories. This massive effort is now paying off in a big way, as we have nearly doubled revenue from $113 million in 2016 to $212 million in 2020, all while significantly improving the bottom line -- from an Adjusted EBITDA loss of $15 million in 2016 to a profit of $1 million in 2020. Our focus on improving brand quality, customer satisfaction and engagement across the portfolio positioned us well to meet the demands of the past year’s massive consumer behavior shift to online, underpinning our strong 2020 performance. We firmly believe these shifts in consumer behavior are here to stay, and we expect that this past year was just the beginning of a bright new chapter of strong sustained growth for Leaf Group. Over the past four years, Society6 Group has gone through its own dramatic transformation, growing Gross Transaction Value (GTV) from $66 million in 2016 to $159 million in 2020. Our strategy of deepening the brand’s catalog of home decor products has differentiated it from many of its competitors while cementing Society6 as an emerging marketplace leader in the rapidly growing online home decor sector. Through product expansion, Society6 has grown its product assortment from 12 products at the time of acquisition by Leaf Group to more than 75 premium products in 2020. Recent improvements in the user experience, paired with the brand’s high quality, made-to-order products featuring unique original designs have resonated with consumers. Society6 has also significantly expanded its global community of independent artists, nearly doubling from 218,000 artists in 2016 to more than 400,000 artists in 2020. The number of original designs has grown at a similar pace, from 3 million to approximately 8 million in 2020 -- with about 6,000 new designs uploaded daily to the platform. With the acquisition of Deny Designs in 2017, leading to the formation of the Society6 Group, the brand quickly grew its B2B channel, developing deep relationships with retailers, such as Nordstrom, Wayfair, Urban Outfitters, Target and Walmart, and hospitality brands, such as Springhill Suites by Marriott. Saatchi Art was founded on a vision of breaking the barriers created by the traditional art market, democratizing the art world for both artists and art buyers alike by providing transparency around pricing and an online platform where all emerging artists could showcase their work. In 2016, we acquired The Other Art Fair, merging a highly experiential in-real-life art event business with Saatchi Art’s global online artist and art buyer audiences. Now, with the art world experiencing significant disruption following the closures of brick-and- mortar galleries and a shift to the digital-first purchase preferences of the millennial generation, we are well positioned to capitalize on this increased demand for online art sales. Nowhere was Saatchi Art’s preparedness for this moment more evident than our creation of the Online Studios this past year, which captured the onsite experience of The Other Art Fair’s local events within Saatchi Art’s digital platform in an effort to offset the impact of the pandemic. In 2018, Saatchi Art launched its hospitality trade business, creating a new and fast-growing revenue channel that quickly established relationships with some of the world’s most recognized hospitality brands, including The Four Seasons and The Dream Hotels. With the implementation of all of these different initiatives, Saatchi Art has delivered impressive growth -- expanding from 74,000 artists in 2016 to more than 115,000 artists in 2020, and growing GTV from $18 million in 2016 to $39 million in 2020. Digital media has been part of the Company since its founding -- but it looks a lot different now than it did at the start. We have done significant work to transform this part of our business from content-light text-based sites to beautiful, highly-respected digital lifestyle brands that add meaningful value to our readers’ lives. Our efforts have focused on acquiring and growing brands in key high-passion categories, including Fitness & Wellness and Home, Art & Design, and we’ve worked tirelessly to expand and raise the profile of each of our premium media properties. In 2017, we launched Hunker to fill a void in the fragmented home design publishing sector that, at the time, mainly focused on ultra-affluent or low-budget DIY. Hunker’s fresh and approachable perspective on interior design quickly connected with audiences and in September 2019, Hunker was the #1 single domain in the Home category (Comscore). In 2018, we acquired Well+Good, significantly deepening our position in the Fitness & Wellness category while also expanding our direct sales capabilities. This past month, we continued Well+Good’s evolution by launching a dedicated e-commerce shop from which consumers can easily purchase the beauty and wellness products that Well+Good editors are most excited about -- creating a new revenue stream for the platform. In February 2019, we acquired the digital travel media site OnlyInYourState and have quickly grown the business, demonstrating the scale of our proprietary media technology platform shared by our digital media properties. In addition to organically growing and acquiring new brands to expand the portfolio, we have also strategically divested non-core assets, including the $39 million sale of Cracked in 2016 and the sale of content to publishing partner Hearst for $9.5 million this past Spring. By strategically focusing our portfolio on these key lifestyle categories, we were able to grow Media revenue from $47.3 million in 2016 to $57.0 million in 2020. We also nearly doubled the segment’s profitability, from $10.8 million in 2016 to $21.5 million in 2020. Our focused portfolio of high-quality brands continues to resonate with consumers, with our audience growing from 49 million unique monthly visitors in 2016 to 53 million unique monthly visitors at the end of 2020. Alongside the strong growth profile and healthy unit economics of our business segments, the corporate platform displays strong operating leverage. Over the past four years, corporate overhead, as a percentage of revenue, has improved from 16.2% in 2016 to 9.1% in 2020, further highlighting our operating leverage. Additionally, employee productivity improved sharply with revenue per employee increasing from $426,000 in 2016 to $589,000 in 2020. We expect these trends to continue as Leaf Group grows. |
| 5 LEAF GROUP | Q4 2020 Shareholder Letter STRONG GROWTH MOMENTUM CONTINUED IN Q4 2020 We ended 2020 strong, with Q4 2020 revenue increasing 44% year-over-year to $65.0 million -- driven by 95% growth at Society6 Group and a 48% increase in Saatchi Art Group revenue, partially offset by a 17% decrease in Media Group revenue. Society6 Group GTV increased 103% in Q4 2020, as our teams successfully executed against an earlier holiday shopping season and drove record growth in new customers and strong repeat purchasing throughout the period. Saatchi Art Group delivered another strong quarter of growth, with Saatchi Art Online GTV growing 50% year-over-year and the Group’s overall revenue growing 48% year-over-year, despite the cancellation and postponement of The Other Art Fair live events. Q4 Adjusted EBITDA improved $1.9 million year-over-year to $1.7 million, with strong revenue growth in Society6 Group and Saatchi Art Group, partially offset by lower Media Group revenue and segment contribution. In Q4 2020, we reinvested in customer acquisition for Society6 and these efforts are paying dividends in early 2021, with a 125% year-over-year increase in January GTV and strong growth in repeat customers. GAME CHANGING 2020 - DONE THE RIGHT WAY The volatility of this past year affected every aspect of our lives. As the world quickly locked down in March, entire industries were forced to shut down and millions of Americans found themselves unemployed. From day one of this global pandemic, we knew that our priority was protecting our people and maintaining as much stability as possible for them in their professional lives and we quickly introduced new technology and processes to keep our global teams engaged and connected. We are incredibly proud of the fact that, nearly one year later, we have avoided layoffs here at Leaf Group, while delivering outstanding financial and operational results. In addition to our corporate commitment to protect our people, our brands also committed to helping their communities. Society6 has donated more than $200,000 to date for World Central Kitchen’s COVID-19 community support efforts through sales of face masks, Well+Good raised over $40,000 for various organizations through its Virtual TALKS program, and Livestrong.com launched its first ever Cardio-for-a-Cause Challenge in support of Back on My Feet. Through Society6 and Saatchi Art, we paid artists $37 million in 2020, supporting the careers of hundreds of thousands of artists across the world during a time when art fairs and brick-and-mortar galleries were forced to shut down. All of these efforts have been a direct reflection of Leaf Group’s strong core values, and we fully expect to build upon them this year. Turning back to our full-year financial results, Leaf Group’s revenue increased 37% year-over-year in 2020 -- driven by 87% year-over- year growth in Society6 Group and 8% year-over-year growth in Saatchi Art Group, with a 53% increase in Saatchi Art revenue partially offset by the lack of in-real-life art fairs for The Other Art Fair. Media revenue declined 13% year-over-year in a volatile year for lifestyle digital publishers, but we are encouraged by the strong pipeline our sales team generated leading up to the end of 2020. On top of strong revenue growth in 2020, our marketplace brands saw significant growth in brand awareness through increased audience and record-setting new customer acquisition. The significant work done under-the-hood for Society6 in 2019 positioned the brand to quickly convert this massive new audience into loyal repeat customers in 2020, and further strengthened its “growth flywheel” through record new customers, as well as improved customer retention, a growing artist community, design and product expansion and a strengthening B2B business. The record setting increase in customer acquisition and strong repeat purchase behavior across our marketplace brands underscores our expectation of sustained growth over the next several years. Profound changes in consumer behavior accelerated by the pandemic are pulling forward substantial e-commerce penetration gains. As states and markets have reopened, online growth rates remain strong and customer satisfaction remains high, suggesting consumer changes are here to stay. However, we remain in uncertain times regarding the easing of pandemic and consumer spending patterns, which limit visibility over the next several quarters, and we will manage our business with the right balance of operating discipline and growth investment as the picture becomes more clear. We are indeed fortunate to own and operate vibrant young brands in categories poised for disruptive growth online. Our team, originally brought together to turn around a business with significant challenges in its first three years as a public company, has not only turned the business around, but set it up for sustainable long term growth and profitability. Such a team, well tested by a myriad of challenges over time, is fully committed to ensuring that our shareholders and stakeholders are well rewarded by continued strong business performance. We stand ready to take full advantage of the opportunities before us as we build our Leaf Group businesses. |
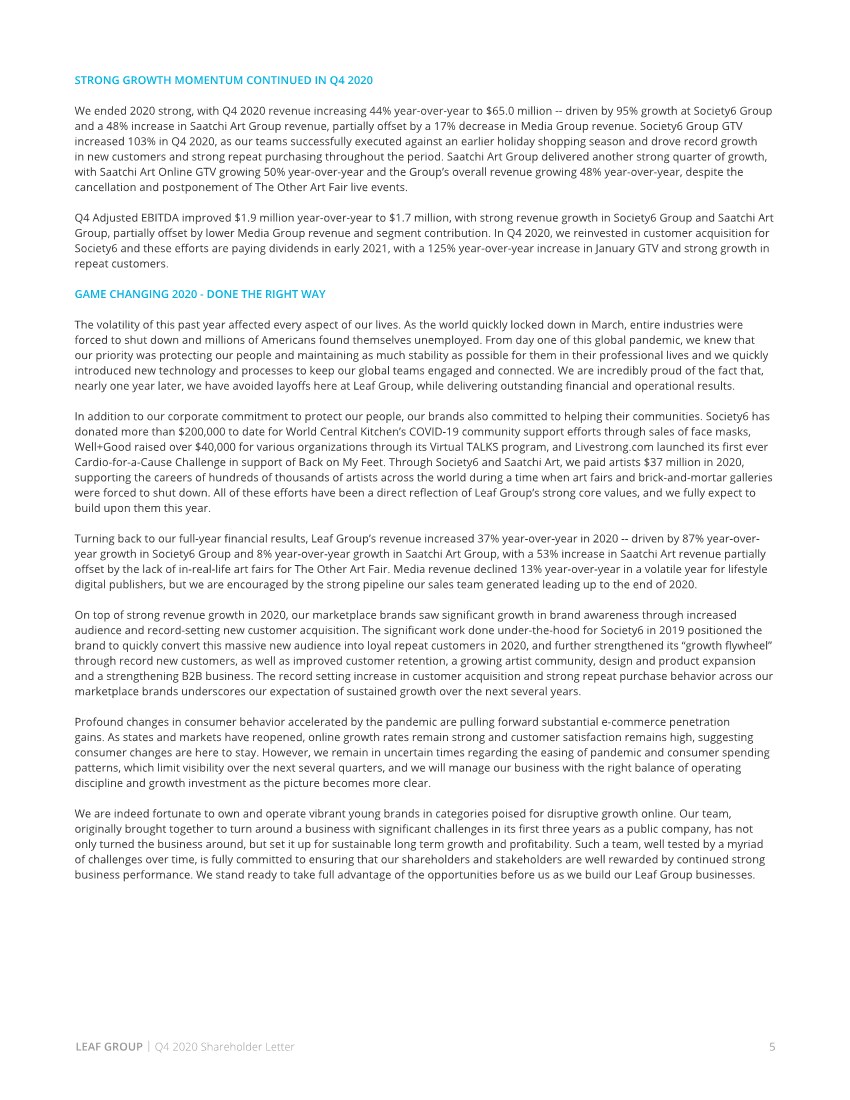
| 6 LEAF GROUP | Q4 2020 Shareholder Letter Q4 2020 BUSINESS HIGHLIGHTS Our Fitness & Wellness brands continued to deepen relationships with blue chip advertisers throughout Q4 2020 -- one example is Well+Good’s relationship with Bose. In October 2020, Bose partnered with Well+Good for its annual United States of Running campaign, which featured five-week training plans for a 5K or 10K run. The program culminated with a virtual run on November 7. The program was so successful that, prior to the campaign concluding, Bose had committed to sponsoring Well+Good’s ReNew Year program in January 2021. FITNESS & WELLNESS Well+Good’s “Our United States of Running” and Livestrong’s “Best 5K Ever Challenge.” |
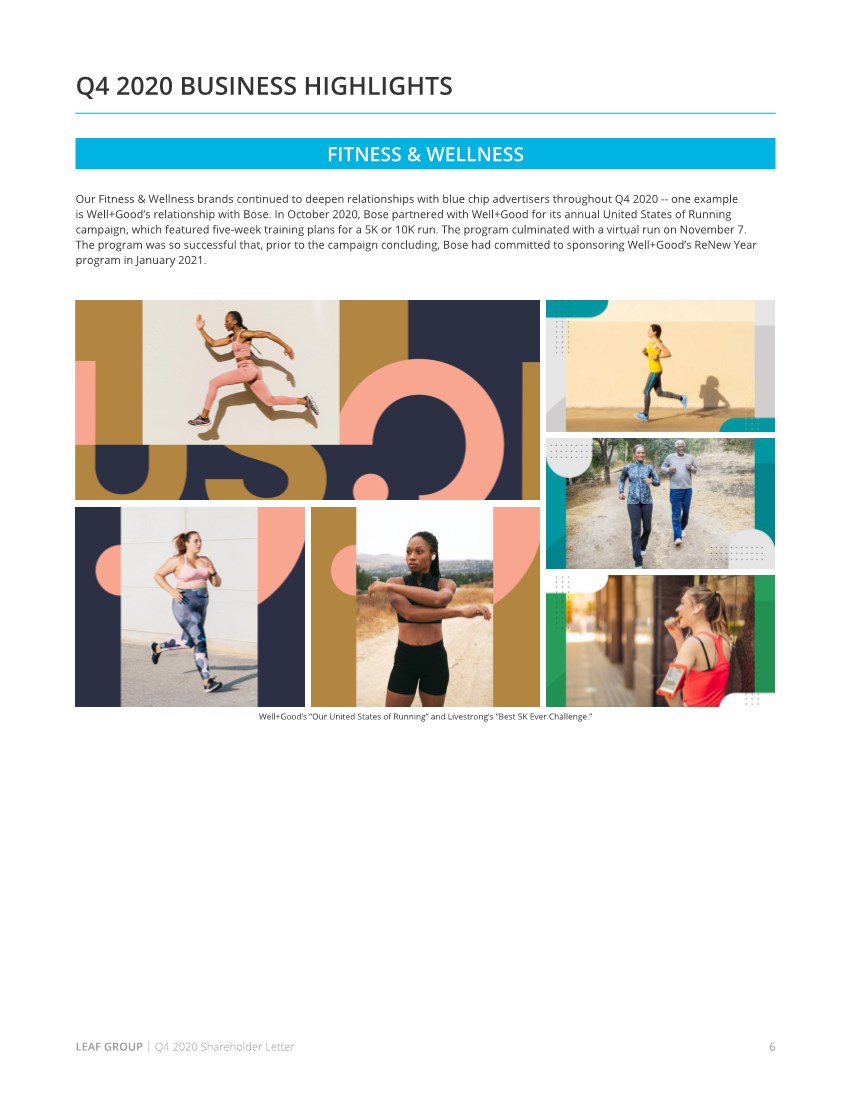
| 7 LEAF GROUP | Q4 2020 Shareholder Letter In Q4 2020, Well+Good reached more than 11.5 million unique monthly visitors (source: December 2020 comScore). The brand launched its annual Trends report in December 2020 -- marking its 11th year of this comprehensive report on the wellness industry. A culmination of months of research, this year’s report features 29 trends, which included interviews with hundreds of experts, industry leaders, and brand representatives, including household names like Peloton, Apple, Whole Foods, Kroger, Zoom, Ulta and Nike. Though in years past, Well+Good has hosted an in-real-life event to celebrate its annual Trends report, this year the brand created an all-day virtual event featuring programming and workshops that tied back to the editorial report. Over 1,100 people tuned in throughout the day and were able to experience programming with industry leaders and influencers, including Julianne Hough, Jessica Malaty Rivera, Maryam Ajayi, Rachel Ricketts and more. In early January 2021, Well+Good announced the launch of its new e-commerce offering, the Well+Good SHOP, continuing its focus on diversifying revenue. This commerce initiative is a new way for Well+Good readers to buy products curated by Well+Good editors, without ever leaving the Well+Good site. The Well+Good SHOP features products within all of the brand’s core vertical categories, including beauty, self care, activewear, and home. Wellness Trends 2021 and Gift Guide 2020. The Essential Kitchen and Top Recipes of 2020. In Q4 2020, Livestrong.com reached more than 7.1 million unique monthly visitors (source: December 2020 comScore). In 2020, the brand further developed its popular monthly Challenge fitness program, creating a dedicated newsletter to complement the highly engaged Facebook Challenge Group -- the newsletter generated more than 25,000 subscribers in Q4 2020. In December, Livestrong.com launched its first ever Cardio-for-a- Cause Challenge in support of nonprofit Back on my Feet. The Challenge participants logged more than 60,000 active miles, donating $12,000 to the organization. In Q4 2020, Livestrong.com launched two new food-related editorial franchises -- The Essential Kitchen and Top Recipes of 2020. As part of the brand’s ongoing DEI initiatives, Livestrong.com published an updated style guide that includes inclusive language and a comprehensive list of best practices for all contributors to follow. The brand also hosted three live Q&A sessions in Q4 2020, in an effort to provide an inclusive platform to discuss inequities in the health and wellness space. Additionally, Livestrong.com focused on building its social media footprint in Q4 2020, with Facebook engagement up more than 3x year-over-year and Instagram followers up 28% year-over-year. |
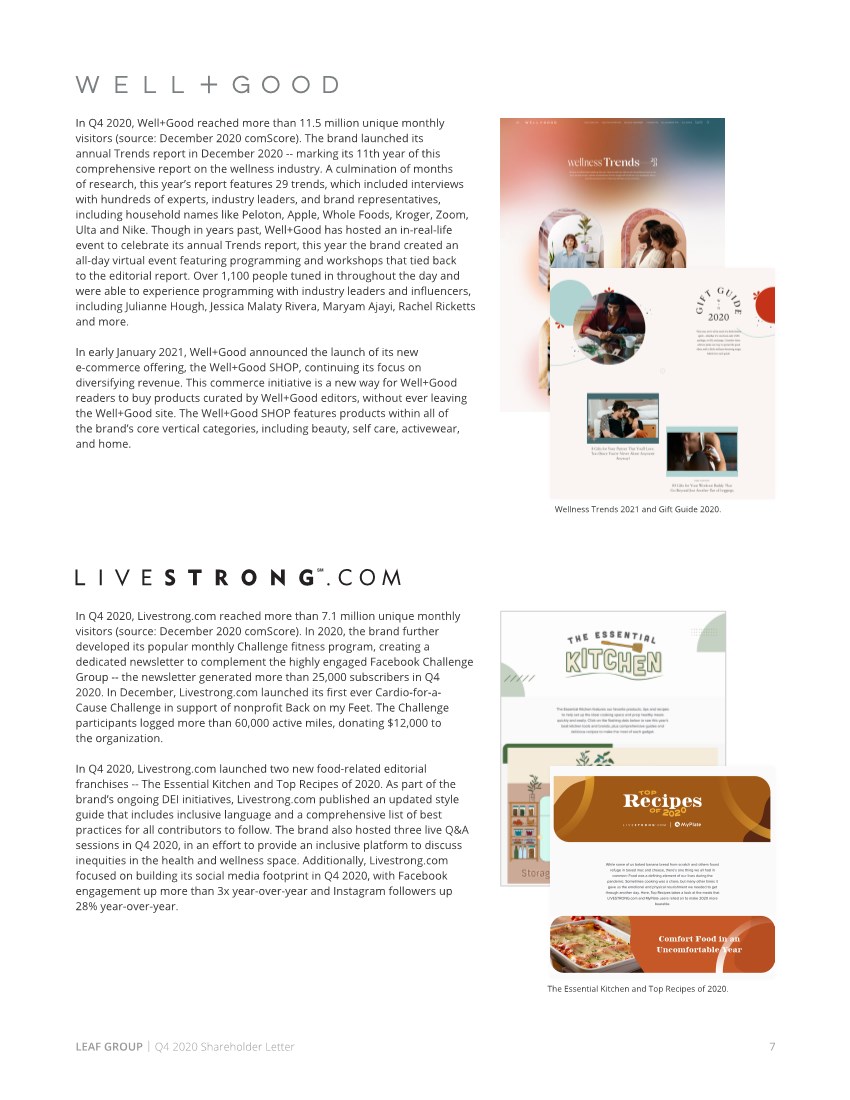
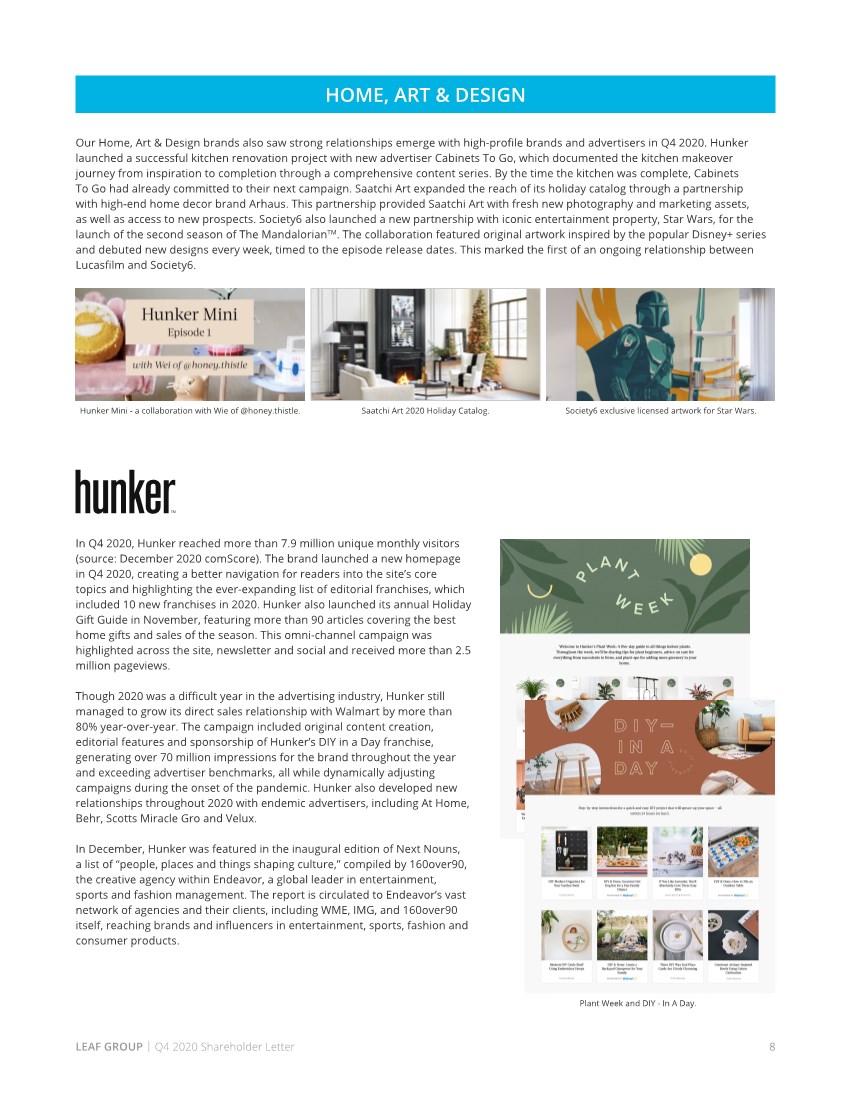
| 8 LEAF GROUP | Q4 2020 Shareholder Letter Our Home, Art & Design brands also saw strong relationships emerge with high-profile brands and advertisers in Q4 2020. Hunker launched a successful kitchen renovation project with new advertiser Cabinets To Go, which documented the kitchen makeover journey from inspiration to completion through a comprehensive content series. By the time the kitchen was complete, Cabinets To Go had already committed to their next campaign. Saatchi Art expanded the reach of its holiday catalog through a partnership with high-end home decor brand Arhaus. This partnership provided Saatchi Art with fresh new photography and marketing assets, as well as access to new prospects. Society6 also launched a new partnership with iconic entertainment property, Star Wars, for the launch of the second season of The MandalorianTM. The collaboration featured original artwork inspired by the popular Disney+ series and debuted new designs every week, timed to the episode release dates. This marked the first of an ongoing relationship between Lucasfilm and Society6. HOME, ART & DESIGN Hunker Mini - a collaboration with Wie of @honey.thistle. Saatchi Art 2020 Holiday Catalog. Society6 exclusive licensed artwork for Star Wars. In Q4 2020, Hunker reached more than 7.9 million unique monthly visitors (source: December 2020 comScore). The brand launched a new homepage in Q4 2020, creating a better navigation for readers into the site’s core topics and highlighting the ever-expanding list of editorial franchises, which included 10 new franchises in 2020. Hunker also launched its annual Holiday Gift Guide in November, featuring more than 90 articles covering the best home gifts and sales of the season. This omni-channel campaign was highlighted across the site, newsletter and social and received more than 2.5 million pageviews. Though 2020 was a difficult year in the advertising industry, Hunker still managed to grow its direct sales relationship with Walmart by more than 80% year-over-year. The campaign included original content creation, editorial features and sponsorship of Hunker’s DIY in a Day franchise, generating over 70 million impressions for the brand throughout the year and exceeding advertiser benchmarks, all while dynamically adjusting campaigns during the onset of the pandemic. Hunker also developed new relationships throughout 2020 with endemic advertisers, including At Home, Behr, Scotts Miracle Gro and Velux. In December, Hunker was featured in the inaugural edition of Next Nouns, a list of “people, places and things shaping culture,” compiled by 160over90, the creative agency within Endeavor, a global leader in entertainment, sports and fashion management. The report is circulated to Endeavor’s vast network of agencies and their clients, including WME, IMG, and 160over90 itself, reaching brands and influencers in entertainment, sports, fashion and consumer products. Plant Week and DIY - In A Day. |
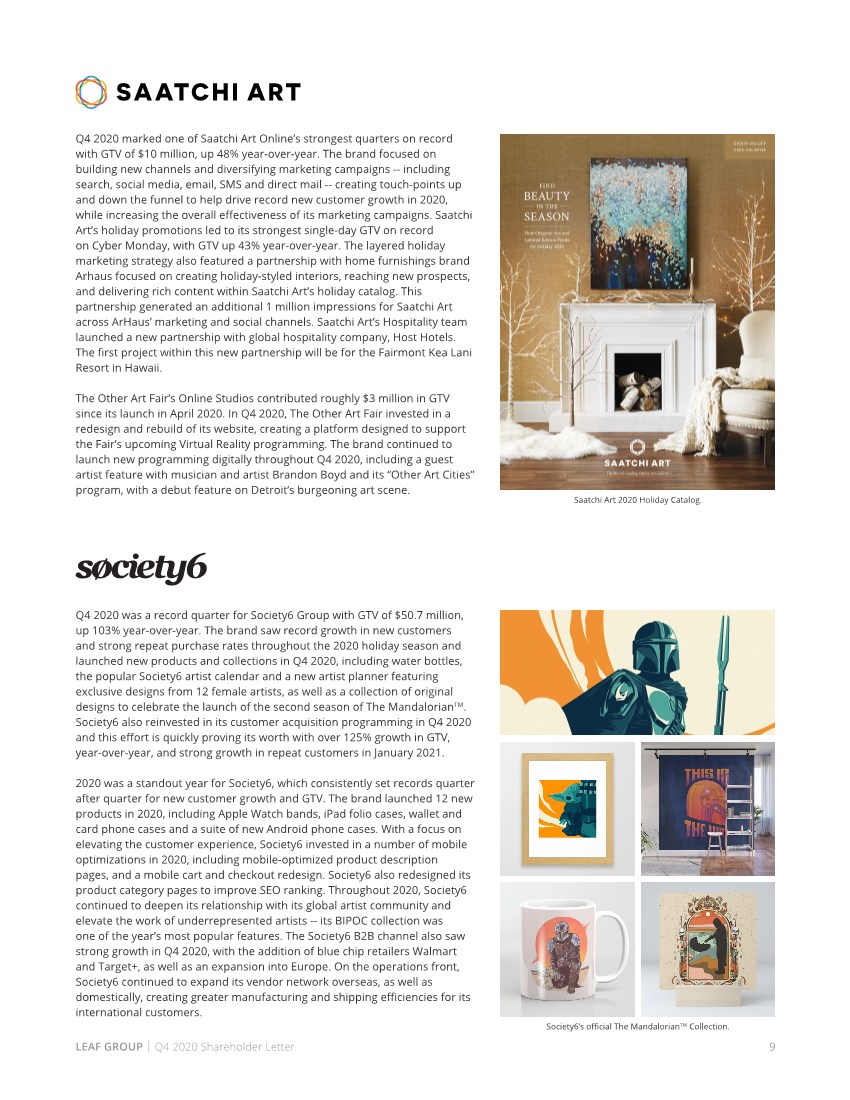
| 9 LEAF GROUP | Q4 2020 Shareholder Letter Q4 2020 marked one of Saatchi Art Online’s strongest quarters on record with GTV of $10 million, up 48% year-over-year. The brand focused on building new channels and diversifying marketing campaigns -- including search, social media, email, SMS and direct mail -- creating touch-points up and down the funnel to help drive record new customer growth in 2020, while increasing the overall effectiveness of its marketing campaigns. Saatchi Art’s holiday promotions led to its strongest single-day GTV on record on Cyber Monday, with GTV up 43% year-over-year. The layered holiday marketing strategy also featured a partnership with home furnishings brand Arhaus focused on creating holiday-styled interiors, reaching new prospects, and delivering rich content within Saatchi Art’s holiday catalog. This partnership generated an additional 1 million impressions for Saatchi Art across ArHaus’ marketing and social channels. Saatchi Art’s Hospitality team launched a new partnership with global hospitality company, Host Hotels. The first project within this new partnership will be for the Fairmont Kea Lani Resort in Hawaii. The Other Art Fair’s Online Studios contributed roughly $3 million in GTV since its launch in April 2020. In Q4 2020, The Other Art Fair invested in a redesign and rebuild of its website, creating a platform designed to support the Fair’s upcoming Virtual Reality programming. The brand continued to launch new programming digitally throughout Q4 2020, including a guest artist feature with musician and artist Brandon Boyd and its “Other Art Cities” program, with a debut feature on Detroit’s burgeoning art scene. Saatchi Art 2020 Holiday Catalog. Society6’s official The MandalorianTM Collection. Q4 2020 was a record quarter for Society6 Group with GTV of $50.7 million, up 103% year-over-year. The brand saw record growth in new customers and strong repeat purchase rates throughout the 2020 holiday season and launched new products and collections in Q4 2020, including water bottles, the popular Society6 artist calendar and a new artist planner featuring exclusive designs from 12 female artists, as well as a collection of original designs to celebrate the launch of the second season of The MandalorianTM. Society6 also reinvested in its customer acquisition programming in Q4 2020 and this effort is quickly proving its worth with over 125% growth in GTV, year-over-year, and strong growth in repeat customers in January 2021. 2020 was a standout year for Society6, which consistently set records quarter after quarter for new customer growth and GTV. The brand launched 12 new products in 2020, including Apple Watch bands, iPad folio cases, wallet and card phone cases and a suite of new Android phone cases. With a focus on elevating the customer experience, Society6 invested in a number of mobile optimizations in 2020, including mobile-optimized product description pages, and a mobile cart and checkout redesign. Society6 also redesigned its product category pages to improve SEO ranking. Throughout 2020, Society6 continued to deepen its relationship with its global artist community and elevate the work of underrepresented artists -- its BIPOC collection was one of the year’s most popular features. The Society6 B2B channel also saw strong growth in Q4 2020, with the addition of blue chip retailers Walmart and Target+, as well as an expansion into Europe. On the operations front, Society6 continued to expand its vendor network overseas, as well as domestically, creating greater manufacturing and shipping efficiencies for its international customers. |
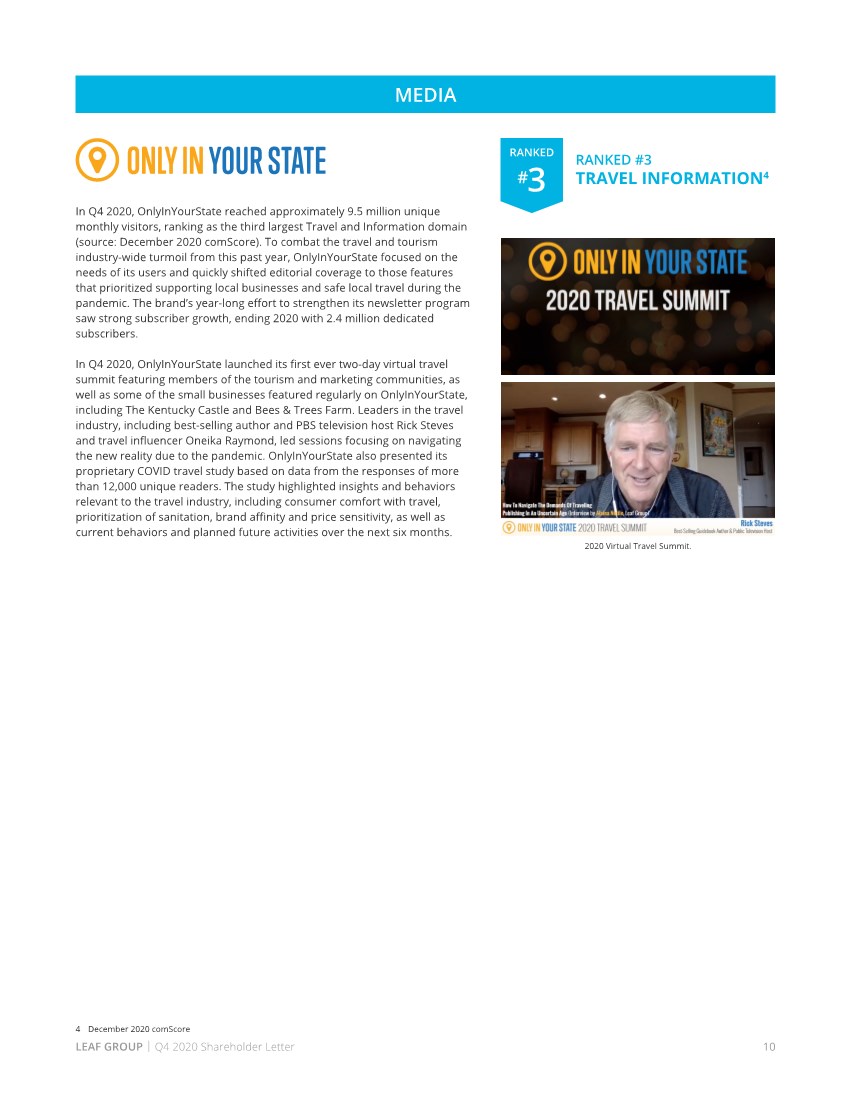
| 10 LEAF GROUP | Q4 2020 Shareholder Letter MEDIA In Q4 2020, OnlyInYourState reached approximately 9.5 million unique monthly visitors, ranking as the third largest Travel and Information domain (source: December 2020 comScore). To combat the travel and tourism industry-wide turmoil from this past year, OnlyInYourState focused on the needs of its users and quickly shifted editorial coverage to those features that prioritized supporting local businesses and safe local travel during the pandemic. The brand’s year-long effort to strengthen its newsletter program saw strong subscriber growth, ending 2020 with 2.4 million dedicated subscribers. In Q4 2020, OnlyInYourState launched its first ever two-day virtual travel summit featuring members of the tourism and marketing communities, as well as some of the small businesses featured regularly on OnlyInYourState, including The Kentucky Castle and Bees & Trees Farm. Leaders in the travel industry, including best-selling author and PBS television host Rick Steves and travel influencer Oneika Raymond, led sessions focusing on navigating the new reality due to the pandemic. OnlyInYourState also presented its proprietary COVID travel study based on data from the responses of more than 12,000 unique readers. The study highlighted insights and behaviors relevant to the travel industry, including consumer comfort with travel, prioritization of sanitation, brand affinity and price sensitivity, as well as current behaviors and planned future activities over the next six months. 2020 Virtual Travel Summit. #3 RANKED RANKED #3 TRAVEL INFORMATION4 4 December 2020 comScore |
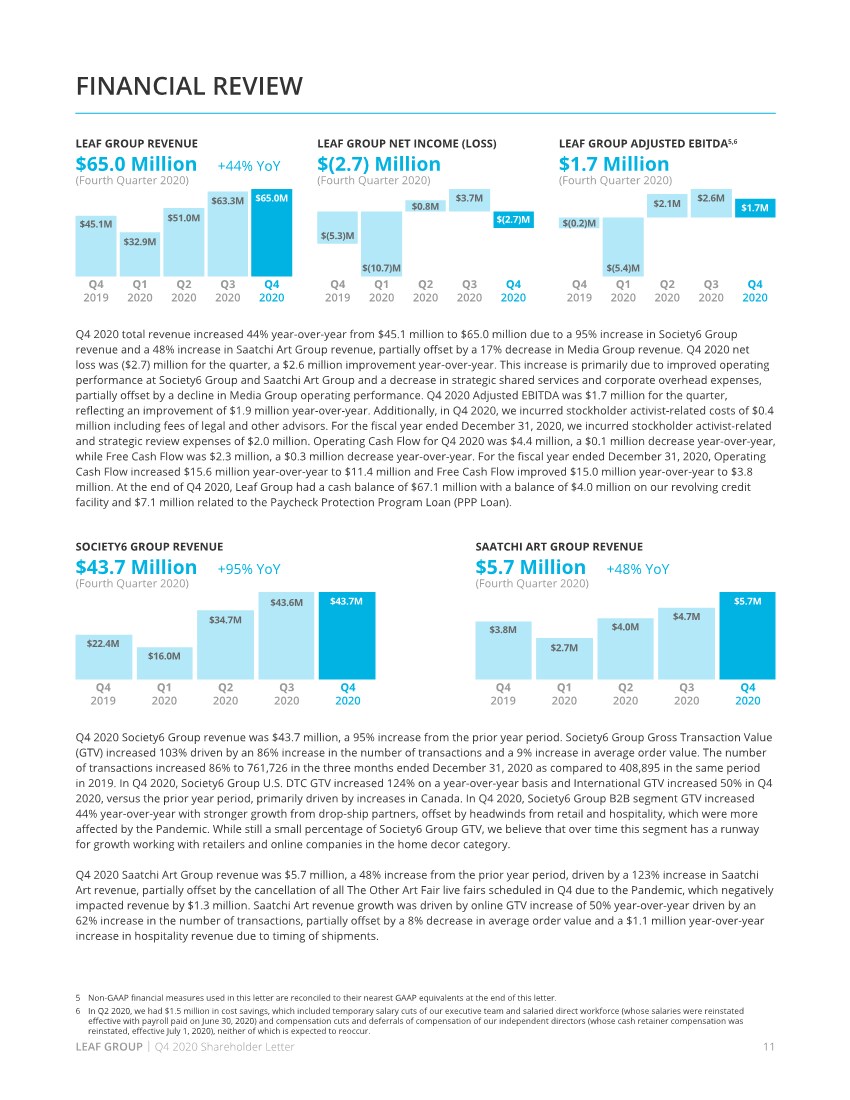
| 11 LEAF GROUP | Q4 2020 Shareholder Letter FINANCIAL REVIEW Q4 2020 total revenue increased 44% year-over-year from $45.1 million to $65.0 million due to a 95% increase in Society6 Group revenue and a 48% increase in Saatchi Art Group revenue, partially offset by a 17% decrease in Media Group revenue. Q4 2020 net loss was ($2.7) million for the quarter, a $2.6 million improvement year-over-year. This increase is primarily due to improved operating performance at Society6 Group and Saatchi Art Group and a decrease in strategic shared services and corporate overhead expenses, partially offset by a decline in Media Group operating performance. Q4 2020 Adjusted EBITDA was $1.7 million for the quarter, reflecting an improvement of $1.9 million year-over-year. Additionally, in Q4 2020, we incurred stockholder activist-related costs of $0.4 million including fees of legal and other advisors. For the fiscal year ended December 31, 2020, we incurred stockholder activist-related and strategic review expenses of $2.0 million. Operating Cash Flow for Q4 2020 was $4.4 million, a $0.1 million decrease year-over-year, while Free Cash Flow was $2.3 million, a $0.3 million decrease year-over-year. For the fiscal year ended December 31, 2020, Operating Cash Flow increased $15.6 million year-over-year to $11.4 million and Free Cash Flow improved $15.0 million year-over-year to $3.8 million. At the end of Q4 2020, Leaf Group had a cash balance of $67.1 million with a balance of $4.0 million on our revolving credit facility and $7.1 million related to the Paycheck Protection Program Loan (PPP Loan). Q4 2020 Society6 Group revenue was $43.7 million, a 95% increase from the prior year period. Society6 Group Gross Transaction Value (GTV) increased 103% driven by an 86% increase in the number of transactions and a 9% increase in average order value. The number of transactions increased 86% to 761,726 in the three months ended December 31, 2020 as compared to 408,895 in the same period in 2019. In Q4 2020, Society6 Group U.S. DTC GTV increased 124% on a year-over-year basis and International GTV increased 50% in Q4 2020, versus the prior year period, primarily driven by increases in Canada. In Q4 2020, Society6 Group B2B segment GTV increased 44% year-over-year with stronger growth from drop-ship partners, offset by headwinds from retail and hospitality, which were more affected by the Pandemic. While still a small percentage of Society6 Group GTV, we believe that over time this segment has a runway for growth working with retailers and online companies in the home decor category. Q4 2020 Saatchi Art Group revenue was $5.7 million, a 48% increase from the prior year period, driven by a 123% increase in Saatchi Art revenue, partially offset by the cancellation of all The Other Art Fair live fairs scheduled in Q4 due to the Pandemic, which negatively impacted revenue by $1.3 million. Saatchi Art revenue growth was driven by online GTV increase of 50% year-over-year driven by an 62% increase in the number of transactions, partially offset by a 8% decrease in average order value and a $1.1 million year-over-year increase in hospitality revenue due to timing of shipments. 5 Non-GAAP financial measures used in this letter are reconciled to their nearest GAAP equivalents at the end of this letter. 6 In Q2 2020, we had $1.5 million in cost savings, which included temporary salary cuts of our executive team and salaried direct workforce (whose salaries were reinstated effective with payroll paid on June 30, 2020) and compensation cuts and deferrals of compensation of our independent directors (whose cash retainer compensation was reinstated, effective July 1, 2020), neither of which is expected to reoccur. $22.4M $16.0M $43.6M $34.7M $43.7M SOCIETY6 GROUP REVENUE $43.7 Million +95% YoY (Fourth Quarter 2020) $3.8M $2.7M $4.7M $4.0M $5.7M SAATCHI ART GROUP REVENUE $5.7 Million +48% YoY (Fourth Quarter 2020) Q4 2019 Q1 2020 Q2 2020 Q3 2020 Q4 2020 Q4 2019 Q1 2020 Q2 2020 Q3 2020 Q4 2020 Q4 2019 Q1 2020 Q2 2020 Q3 2020 Q4 2020 LEAF GROUP ADJUSTED EBITDA5,6 $1.7 Million (Fourth Quarter 2020) $(5.4)M $(0.2)M $2.6M $2.1M $1.7M LEAF GROUP REVENUE $65.0 Million +44% YoY (Fourth Quarter 2020) Q4 2019 Q1 2020 Q2 2020 Q3 2020 Q4 2020 Q4 2019 Q1 2020 Q2 2020 Q3 2020 Q4 2020 $45.1M $32.9M $51.0M $63.3M $65.0M LEAF GROUP NET INCOME (LOSS) $(2.7) Million (Fourth Quarter 2020) $(5.3)M $(10.7)M $3.7M $0.8M $(2.7)M |
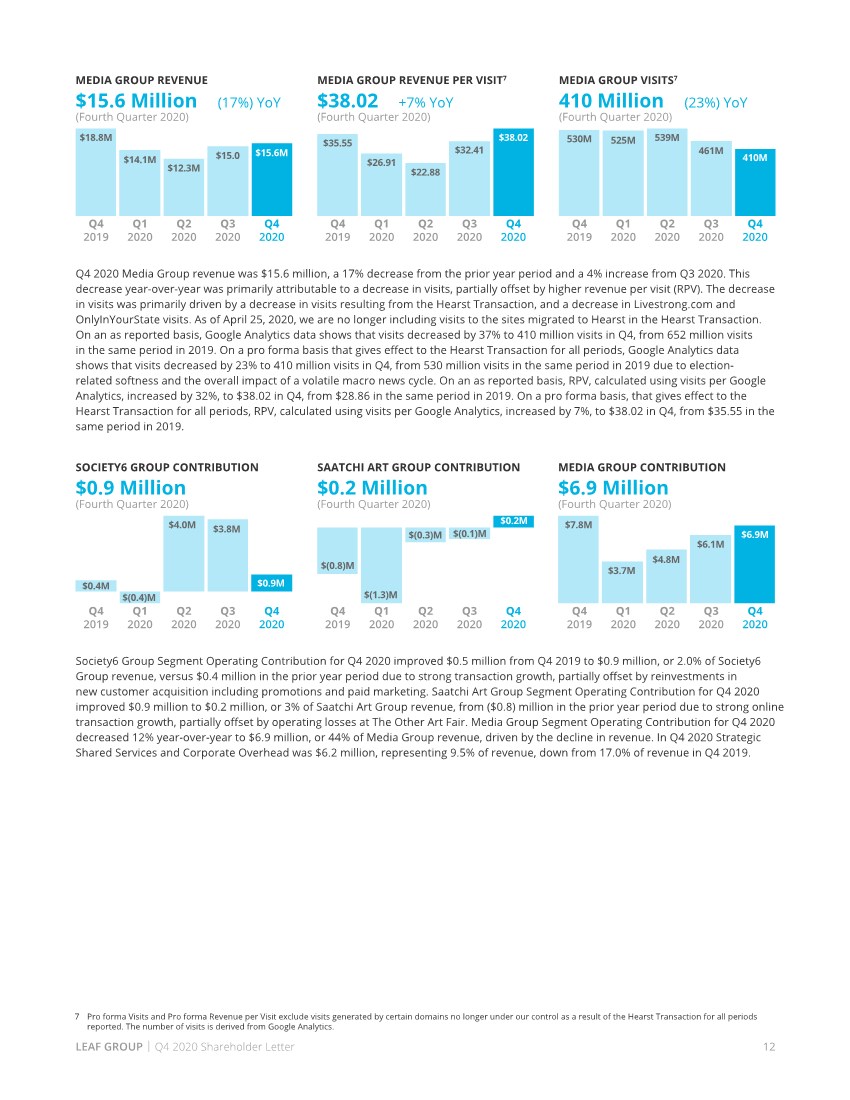
| 12 LEAF GROUP | Q4 2020 Shareholder Letter Q4 2019 Q1 2020 Q2 2020 Q3 2020 Q4 2020 Q4 2020 Media Group revenue was $15.6 million, a 17% decrease from the prior year period and a 4% increase from Q3 2020. This decrease year-over-year was primarily attributable to a decrease in visits, partially offset by higher revenue per visit (RPV). The decrease in visits was primarily driven by a decrease in visits resulting from the Hearst Transaction, and a decrease in Livestrong.com and OnlyInYourState visits. As of April 25, 2020, we are no longer including visits to the sites migrated to Hearst in the Hearst Transaction. On an as reported basis, Google Analytics data shows that visits decreased by 37% to 410 million visits in Q4, from 652 million visits in the same period in 2019. On a pro forma basis that gives effect to the Hearst Transaction for all periods, Google Analytics data shows that visits decreased by 23% to 410 million visits in Q4, from 530 million visits in the same period in 2019 due to election- related softness and the overall impact of a volatile macro news cycle. On an as reported basis, RPV, calculated using visits per Google Analytics, increased by 32%, to $38.02 in Q4, from $28.86 in the same period in 2019. On a pro forma basis, that gives effect to the Hearst Transaction for all periods, RPV, calculated using visits per Google Analytics, increased by 7%, to $38.02 in Q4, from $35.55 in the same period in 2019. Society6 Group Segment Operating Contribution for Q4 2020 improved $0.5 million from Q4 2019 to $0.9 million, or 2.0% of Society6 Group revenue, versus $0.4 million in the prior year period due to strong transaction growth, partially offset by reinvestments in new customer acquisition including promotions and paid marketing. Saatchi Art Group Segment Operating Contribution for Q4 2020 improved $0.9 million to $0.2 million, or 3% of Saatchi Art Group revenue, from ($0.8) million in the prior year period due to strong online transaction growth, partially offset by operating losses at The Other Art Fair. Media Group Segment Operating Contribution for Q4 2020 decreased 12% year-over-year to $6.9 million, or 44% of Media Group revenue, driven by the decline in revenue. In Q4 2020 Strategic Shared Services and Corporate Overhead was $6.2 million, representing 9.5% of revenue, down from 17.0% of revenue in Q4 2019. $7.8M $3.7M $6.1M $4.8M $6.9M MEDIA GROUP CONTRIBUTION $6.9 Million (Fourth Quarter 2020) $0.4M $(0.8)M $(0.4)M $(1.3)M $3.8M $4.0M $(0.1)M $(0.3)M $0.9M $0.2M SOCIETY6 GROUP CONTRIBUTION $0.9 Million (Fourth Quarter 2020) SAATCHI ART GROUP CONTRIBUTION $0.2 Million (Fourth Quarter 2020) 7 Pro forma Visits and Pro forma Revenue per Visit exclude visits generated by certain domains no longer under our control as a result of the Hearst Transaction for all periods reported. The number of visits is derived from Google Analytics. $18.8M $14.1M $15.0 $12.3M $15.6M MEDIA GROUP REVENUE $15.6 Million (17%) YoY (Fourth Quarter 2020) Q4 2019 Q1 2020 Q2 2020 Q3 2020 Q4 2020 Q4 2019 Q1 2020 Q2 2020 Q3 2020 Q4 2020 Q4 2019 Q1 2020 Q2 2020 Q3 2020 Q4 2020 Q4 2019 Q1 2020 Q2 2020 Q3 2020 Q4 2020 Q4 2019 Q1 2020 Q2 2020 Q3 2020 Q4 2020 $35.55 $26.91 $32.41 $22.88 $38.02 MEDIA GROUP REVENUE PER VISIT7 $38.02 +7% YoY (Fourth Quarter 2020) 530M 525M 461M 539M 410M MEDIA GROUP VISITS7 410 Million (23%) YoY (Fourth Quarter 2020) |
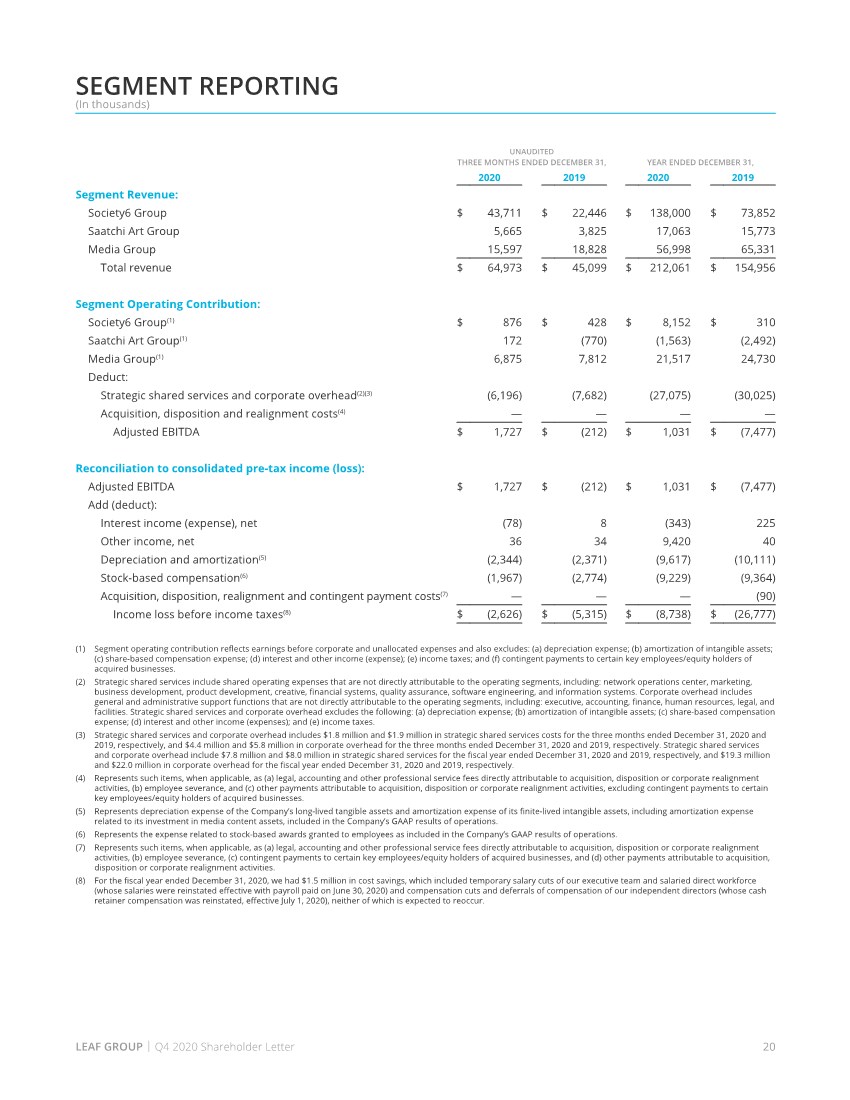
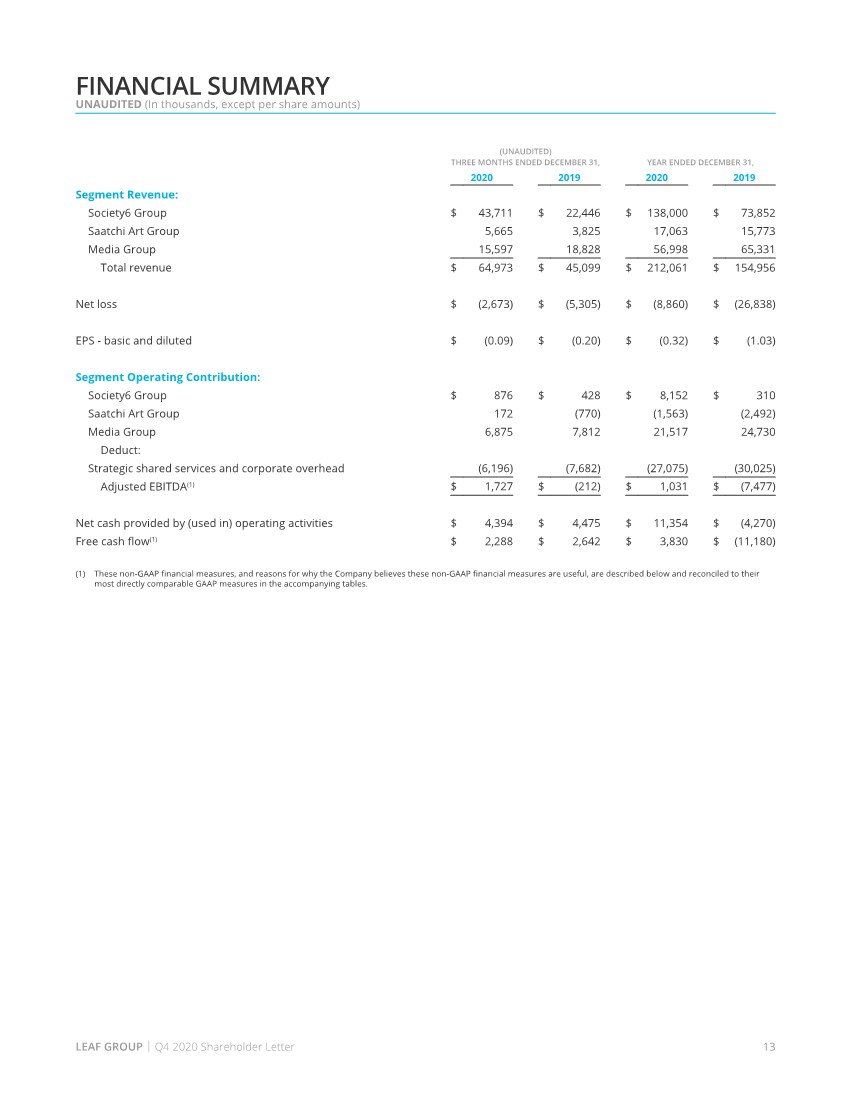
| 13 LEAF GROUP | Q4 2020 Shareholder Letter (UNAUDITED) THREE MONTHS ENDED DECEMBER 31, YEAR ENDED DECEMBER 31, 2020 2019 2020 2019 Segment Revenue: Society6 Group $ 43,711 $ 22,446 $ 138,000 $ 73,852 Saatchi Art Group 5,665 3,825 17,063 15,773 Media Group 15,597 18,828 56,998 65,331 Total revenue $ 64,973 $ 45,099 $ 212,061 $ 154,956 Net loss $ (2,673) $ (5,305) $ (8,860) $ (26,838) EPS - basic and diluted $ (0.09) $ (0.20) $ (0.32) $ (1.03) Segment Operating Contribution: Society6 Group $ 876 $ 428 $ 8,152 $ 310 Saatchi Art Group 172 (770) (1,563) (2,492) Media Group 6,875 7,812 21,517 24,730 Deduct: Strategic shared services and corporate overhead (6,196) (7,682) (27,075) (30,025) Adjusted EBITDA(1) $ 1,727 $ (212) $ 1,031 $ (7,477) Net cash provided by (used in) operating activities $ 4,394 $ 4,475 $ 11,354 $ (4,270) Free cash flow(1) $ 2,288 $ 2,642 $ 3,830 $ (11,180) (1) These non-GAAP financial measures, and reasons for why the Company believes these non-GAAP financial measures are useful, are described below and reconciled to their most directly comparable GAAP measures in the accompanying tables. FINANCIAL SUMMARY UNAUDITED (In thousands, except per share amounts) |
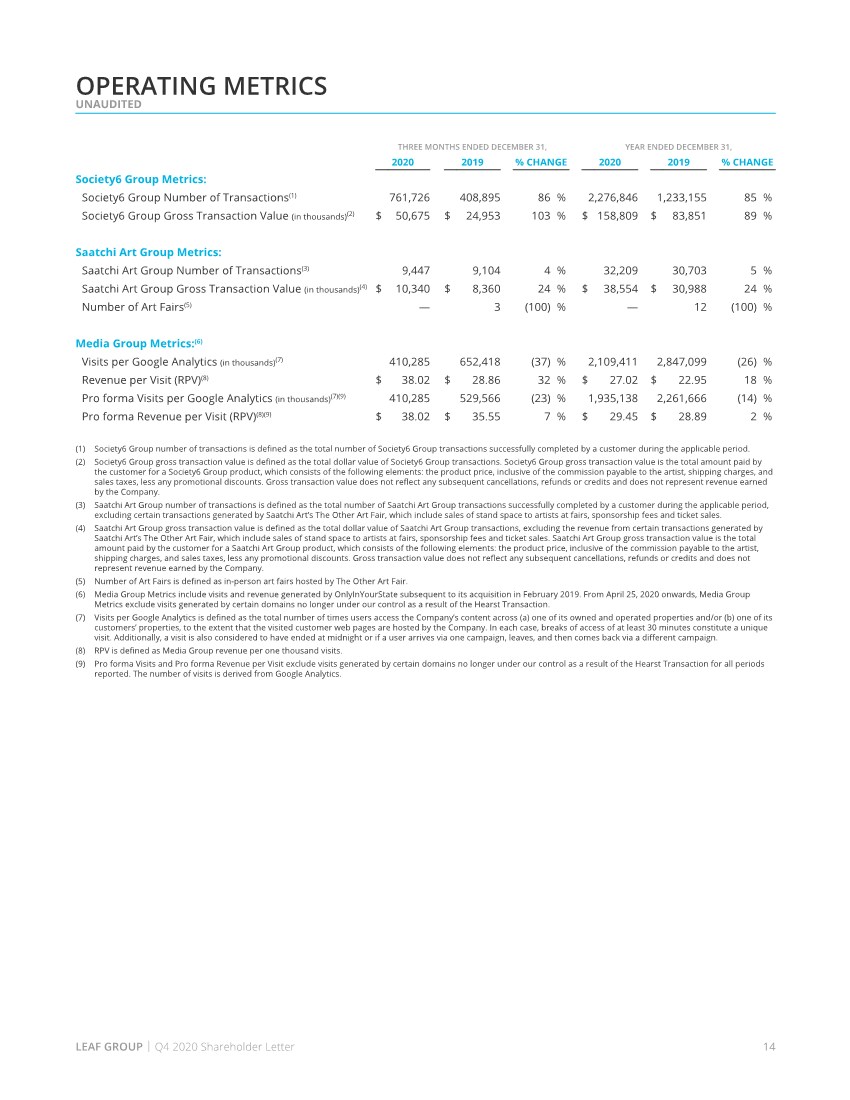
| 14 LEAF GROUP | Q4 2020 Shareholder Letter (1) Society6 Group number of transactions is defined as the total number of Society6 Group transactions successfully completed by a customer during the applicable period. (2) Society6 Group gross transaction value is defined as the total dollar value of Society6 Group transactions. Society6 Group gross transaction value is the total amount paid by the customer for a Society6 Group product, which consists of the following elements: the product price, inclusive of the commission payable to the artist, shipping charges, and sales taxes, less any promotional discounts. Gross transaction value does not reflect any subsequent cancellations, refunds or credits and does not represent revenue earned by the Company. (3) Saatchi Art Group number of transactions is defined as the total number of Saatchi Art Group transactions successfully completed by a customer during the applicable period, excluding certain transactions generated by Saatchi Art’s The Other Art Fair, which include sales of stand space to artists at fairs, sponsorship fees and ticket sales. (4) Saatchi Art Group gross transaction value is defined as the total dollar value of Saatchi Art Group transactions, excluding the revenue from certain transactions generated by Saatchi Art’s The Other Art Fair, which include sales of stand space to artists at fairs, sponsorship fees and ticket sales. Saatchi Art Group gross transaction value is the total amount paid by the customer for a Saatchi Art Group product, which consists of the following elements: the product price, inclusive of the commission payable to the artist, shipping charges, and sales taxes, less any promotional discounts. Gross transaction value does not reflect any subsequent cancellations, refunds or credits and does not represent revenue earned by the Company. (5) Number of Art Fairs is defined as in-person art fairs hosted by The Other Art Fair. (6) Media Group Metrics include visits and revenue generated by OnlyInYourState subsequent to its acquisition in February 2019. From April 25, 2020 onwards, Media Group Metrics exclude visits generated by certain domains no longer under our control as a result of the Hearst Transaction. (7) Visits per Google Analytics is defined as the total number of times users access the Company’s content across (a) one of its owned and operated properties and/or (b) one of its customers’ properties, to the extent that the visited customer web pages are hosted by the Company. In each case, breaks of access of at least 30 minutes constitute a unique visit. Additionally, a visit is also considered to have ended at midnight or if a user arrives via one campaign, leaves, and then comes back via a different campaign. (8) RPV is defined as Media Group revenue per one thousand visits. (9) Pro forma Visits and Pro forma Revenue per Visit exclude visits generated by certain domains no longer under our control as a result of the Hearst Transaction for all periods reported. The number of visits is derived from Google Analytics. OPERATING METRICS UNAUDITED THREE MONTHS ENDED DECEMBER 31, YEAR ENDED DECEMBER 31, 2020 2019 % CHANGE 2020 2019 % CHANGE Society6 Group Metrics: Society6 Group Number of Transactions(1) 761,726 408,895 86 % 2,276,846 1,233,155 85 % Society6 Group Gross Transaction Value (in thousands)(2) $ 50,675 $ 24,953 103 % $ 158,809 $ 83,851 89 % Saatchi Art Group Metrics: Saatchi Art Group Number of Transactions(3) 9,447 9,104 4 % 32,209 30,703 5 % Saatchi Art Group Gross Transaction Value (in thousands)(4) $ 10,340 $ 8,360 24 % $ 38,554 $ 30,988 24 % Number of Art Fairs(5) — 3 (100) % — 12 (100) % Media Group Metrics:(6) Visits per Google Analytics (in thousands)(7) 410,285 652,418 (37) % 2,109,411 2,847,099 (26) % Revenue per Visit (RPV)(8) $ 38.02 $ 28.86 32 % $ 27.02 $ 22.95 18 % Pro forma Visits per Google Analytics (in thousands)(7)(9) 410,285 529,566 (23) % 1,935,138 2,261,666 (14) % Pro forma Revenue per Visit (RPV)(8)(9) $ 38.02 $ 35.55 7 % $ 29.45 $ 28.89 2 % |
| 15 LEAF GROUP | Q4 2020 Shareholder Letter USE OF NON-GAAP FINANCIAL MEASURES To supplement its consolidated financial statements, which are prepared and presented in accordance with generally accepted accounting principles in the United States of America (“GAAP”), Leaf Group uses certain non-GAAP financial measures, as described below. These non-GAAP financial measures are presented to enhance the user’s overall understanding of Leaf Group’s financial performance and should not be considered a substitute for, or superior to, the financial information prepared and presented in accordance with GAAP. The non-GAAP financial measures presented in this release, together with the GAAP financial results, are the primary measures used by the Company’s management and board of directors to understand and evaluate the Company’s financial performance and operating trends, including period-to-period comparisons, because they exclude certain expenses and gains that management believes are not indicative of the Company’s core operating results. Management also uses these measures to prepare and update the Company’s short and long term financial and operational plans, to evaluate investment decisions, and in its discussions with investors, commercial bankers, equity research analysts and other users of the Company’s financial statements. Accordingly, the Company believes that these non-GAAP financial measures provide useful information to investors and others in understanding and evaluating the Company’s operating results in the same manner as the Company’s management and in comparing operating results across periods and to those of Leaf Group’s peer companies. The use of non-GAAP financial measures has certain limitations because they do not reflect all items of income and expense, or cash flows, that affect the Company’s financial performance and operations. An additional limitation of non-GAAP financial measures is that they do not have standardized meanings, and therefore other companies, including peer companies, may use the same or similarly named measures but exclude or include different items or use different computations. Management compensates for these limitations by reconciling these non-GAAP financial measures to their most comparable GAAP financial measures in the tables captioned “Reconciliations of Non-GAAP Financial Measures” included at the end of this release. Investors and others are encouraged to review the Company’s financial information in its entirety and not rely on a single financial measure. The Company defines Adjusted earnings before interest, taxes, depreciation and amortization (Adjusted EBITDA) as net income (loss) excluding interest (income) expense, income tax expense (benefit), and certain other non-cash or non-recurring items impacting net income (loss) from time to time, principally comprised of depreciation and amortization, stock-based compensation, contingent payments to certain key employees/equity holders of acquired businesses and other payments attributable to acquisition, disposition or corporate realignment activities. Management believes that the exclusion of certain expenses and gains in calculating Adjusted EBITDA provides a useful measure for period-to-period comparisons of the Company’s underlying core revenue and operating costs that is focused more closely on the current costs necessary to operate the Company’s businesses, and reflects its ongoing business in a manner that allows for meaningful analysis of trends. Management also believes that excluding certain non-cash charges can be useful because the amounts of such expenses is the result of long-term investment decisions made in previous periods rather than day-to-day operating decisions. The Company defines Segment Operating Contribution as earnings before corporate or unallocated expenses and also excludes: (a) depreciation expense; (b) amortization of intangible assets; (c) share-based compensation expense; (d) interest and other income (expense); (e) income taxes; and (f) contingent payments to certain key employees/equity holders of acquired businesses. Management believes that the exclusion of certain expenses and gains in calculating Segment Operating Contribution provides a useful measure for period-to-period comparisons of the segment’s underlying revenue and operating costs that is focused more closely on the current costs necessary to operate the segment, and reflects the segment’s ongoing business in a manner that allows for meaningful analysis of trends. Management also believes that excluding certain non-cash charges can be useful because the amounts of such expenses is the result of long-term investment decisions made in previous periods rather than day-to-day operating decisions. The Company defines Free Cash Flow as net cash provided by (used in) operating activities net of cash flows from contingent payments to certain key employees/equity holders of acquired businesses; other payments attributable to acquisition, disposition or corporate realignment activities; purchases of property and equipment; and purchases of intangible assets. Management believes that Free Cash Flow provides investors with useful information to measure operating liquidity because it reflects the Company’s underlying cash flows from recurring operating activities after investing in capital assets and intangible assets. Free Cash Flow is used by management, and may also be useful for investors, to assess the Company’s ability to generate cash flow for a variety of strategic opportunities, including reinvesting in its businesses, pursuing new business opportunities and potential acquisitions, paying dividends and repurchasing shares. ABOUT LEAF GROUP Leaf Group Ltd. (NYSE: LEAF) is a diversified consumer internet company that builds enduring, creator-driven brands that reach passionate audiences in large and growing lifestyle categories, including fitness and wellness (Well+Good, Livestrong.com and MyPlate App), and home, art and design (Saatchi Art, Society6 and Hunker). For more information about Leaf Group, visit www.leafgroup.com. CAUTIONARY INFORMATION REGARDING FORWARD-LOOKING STATEMENTS This shareholder letter contains “forward-looking statements” within the meaning of the safe harbor provisions of the U.S. Private Securities Litigation Reform Act of 1995. The forward-looking statements set forth in this shareholder letter include, among other things, statements regarding potential synergies achieved from acquisitions, the impact of strategic operational changes and the Company’s future financial performance. In addition, statements containing words such as “guidance,” “may,” “believe,” “anticipate,” “expect,” “intend,” “plan,” “project,” “projections,” “business outlook,” and “estimate” or similar expressions constitute forward-looking statements. Actual results may differ materially from the results predicted, and reported results should not be considered an indication of future performance. These forward-looking statements involve risks and uncertainties regarding the Company’s future financial performance; could cause actual results or developments to differ materially from those indicated due to a number of factors affecting Leaf Group’s operations, markets, products and services; and are based on current expectations, estimates and projections about the Company’s industry, financial condition, operating performance and results of operations, including certain assumptions related thereto. Potential risks and uncertainties that could affect the Company’s operating and financial results are described in Leaf Group’s annual report on Form 10-K for the fiscal year ending December 31, 2020 filed with the Securities and Exchange Commission (http:// www.sec.gov) on February 25, 2021, as such risks and uncertainties may be updated from time to time in Leaf Group’s quarterly reports on Form 10-Q filed with the Securities and Exchange Commission, including, without limitation, information under the captions “Risk Factors” and “Management’s Discussion and Analysis of Financial Condition and Results of Operations.” These risks and uncertainties include, among others: risks associated with political and economic instability domestically and internationally including those resulting from the COVID-19 pandemic, which have and could lead to fluctuations in the availability of credit, decreased business and consumer confidence and increased unemployment; the Company’s ability to execute its business plan to maintain compliance with the continued listing criteria of the New York Stock Exchange (“NYSE”); changes by the Small Business Administration (“SBA”) or other governmental authorities regarding the Coronavirus Aid, Relief and Economic Security Act of 2020, the SBA’s related Paycheck Protection Program (the “PPP Program”); the Company’s ability to obtain forgiveness of the loan we obtained pursuant to the PPP Program; the Company’s ability to successfully drive and increase traffic to its marketplaces and media properties; changes in the methodologies of internet search engines, including ongoing algorithmic changes made by Google, Bing and Yahoo!; the Company’s ability to attract new and repeat customers and artists to its marketplaces and successfully grow its marketplace businesses; the potential impact on advertising- based revenue from lower ad unit rates, a reduction in online advertising spending, a loss of advertisers, lower advertising yields, increased availability of ad blocking software, particularly on mobile devices and/or ongoing changes in ad unit formats; the Company’s dependence on various agreements with a specific business partner for a significant portion of its advertising revenue; the effects of shifting consumption of media content and online shopping from desktop to mobile devices and/or social media platforms; the Company’s history of incurring net operating losses; the Company’s ability to obtain capital when desired on favorable terms; potential write downs, reserves against or impairment of assets including receivables, goodwill, intangibles (including media content) or other assets; the Company’s ability to effectively integrate, manage, operate and grow acquired businesses; the Company’s ability to retain key personnel; the Company’s ability to prevent any actual or perceived security breaches; the Company’s ability to expand its business internationally; the Company’s ability to generate long-term value for its stockholders; and ongoing actions taken and any future actions that may be taken by activist stockholders. From time to time, the Company may consider acquisitions or divestitures that, if consummated, could be material. Any forward-looking statements regarding financial metrics are based upon the assumption that no such acquisition or divestiture is consummated during the relevant periods. If an acquisition or divestiture were consummated, actual results could differ materially from any forward-looking statements. Any forward-looking statement made by the Company in this shareholder letter is based only on information currently available to the Company and speaks only as of the date on which it is made. The Company undertakes no obligation to revise or update any forward-looking information, whether written or oral, that may be made from time to time, whether as a result of new information, future developments or otherwise, except as required by law, and may not provide this type of information in the future. |
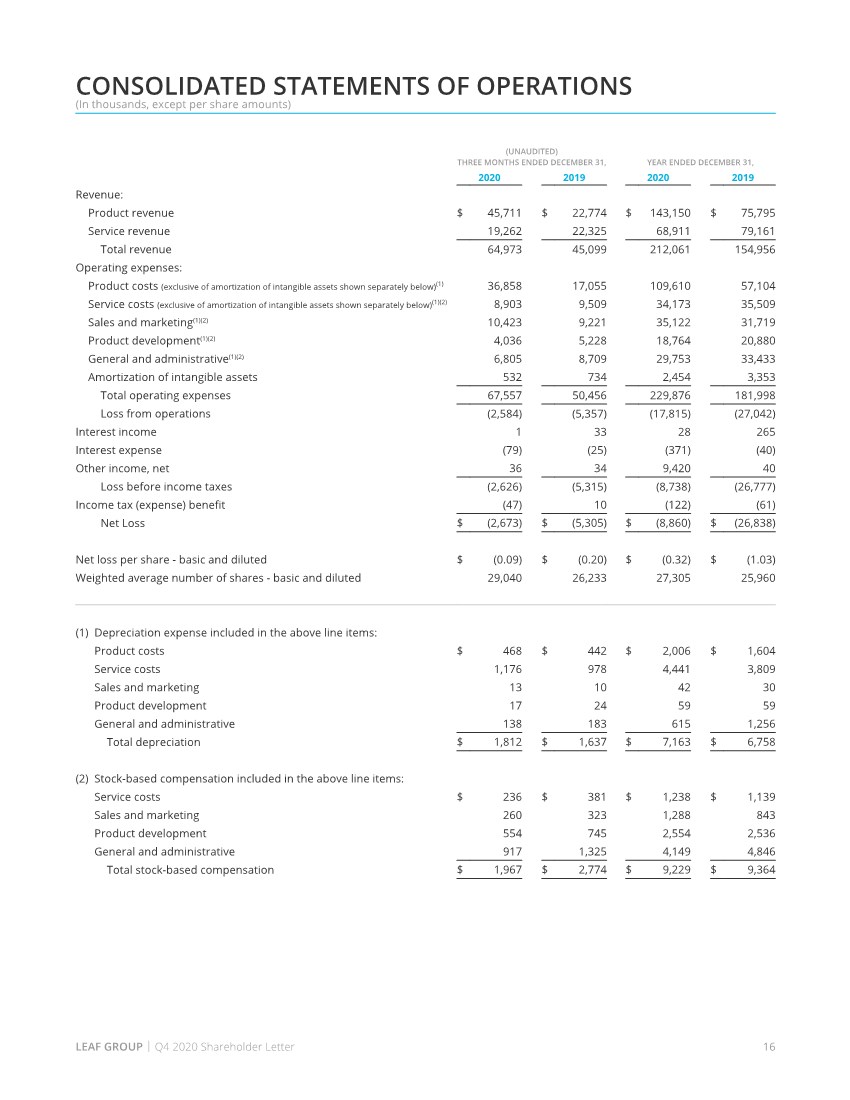
| 16 LEAF GROUP | Q4 2020 Shareholder Letter CONSOLIDATED STATEMENTS OF OPERATIONS (In thousands, except per share amounts) (UNAUDITED) THREE MONTHS ENDED DECEMBER 31, YEAR ENDED DECEMBER 31, 2020 2019 2020 2019 Revenue: Product revenue $ 45,711 $ 22,774 $ 143,150 $ 75,795 Service revenue 19,262 22,325 68,911 79,161 Total revenue 64,973 45,099 212,061 154,956 Operating expenses: Product costs (exclusive of amortization of intangible assets shown separately below)(1) 36,858 17,055 109,610 57,104 Service costs (exclusive of amortization of intangible assets shown separately below)(1)(2) 8,903 9,509 34,173 35,509 Sales and marketing(1)(2) 10,423 9,221 35,122 31,719 Product development(1)(2) 4,036 5,228 18,764 20,880 General and administrative(1)(2) 6,805 8,709 29,753 33,433 Amortization of intangible assets 532 734 2,454 3,353 Total operating expenses 67,557 50,456 229,876 181,998 Loss from operations (2,584) (5,357) (17,815) (27,042) Interest income 1 33 28 265 Interest expense (79) (25) (371) (40) Other income, net 36 34 9,420 40 Loss before income taxes (2,626) (5,315) (8,738) (26,777) Income tax (expense) benefit (47) 10 (122) (61) Net Loss $ (2,673) $ (5,305) $ (8,860) $ (26,838) Net loss per share - basic and diluted $ (0.09) $ (0.20) $ (0.32) $ (1.03) Weighted average number of shares - basic and diluted 29,040 26,233 27,305 25,960 (1) Depreciation expense included in the above line items: Product costs $ 468 $ 442 $ 2,006 $ 1,604 Service costs 1,176 978 4,441 3,809 Sales and marketing 13 10 42 30 Product development 17 24 59 59 General and administrative 138 183 615 1,256 Total depreciation $ 1,812 $ 1,637 $ 7,163 $ 6,758 (2) Stock-based compensation included in the above line items: Service costs $ 236 $ 381 $ 1,238 $ 1,139 Sales and marketing 260 323 1,288 843 Product development 554 745 2,554 2,536 General and administrative 917 1,325 4,149 4,846 Total stock-based compensation $ 1,967 $ 2,774 $ 9,229 $ 9,364 |
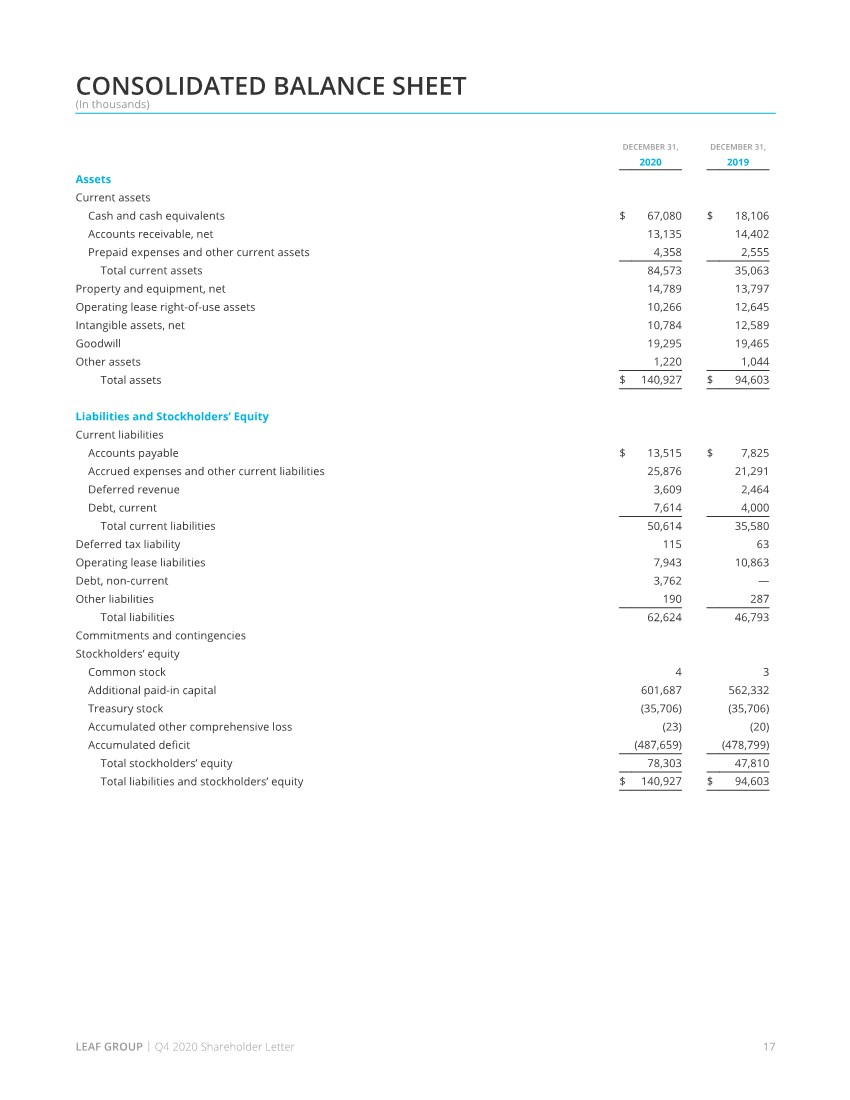
| 17 LEAF GROUP | Q4 2020 Shareholder Letter DECEMBER 31, DECEMBER 31, 2020 2019 Assets Current assets Cash and cash equivalents $ 67,080 $ 18,106 Accounts receivable, net 13,135 14,402 Prepaid expenses and other current assets 4,358 2,555 Total current assets 84,573 35,063 Property and equipment, net 14,789 13,797 Operating lease right-of-use assets 10,266 12,645 Intangible assets, net 10,784 12,589 Goodwill 19,295 19,465 Other assets 1,220 1,044 Total assets $ 140,927 $ 94,603 Liabilities and Stockholders’ Equity Current liabilities Accounts payable $ 13,515 $ 7,825 Accrued expenses and other current liabilities 25,876 21,291 Deferred revenue 3,609 2,464 Debt, current 7,614 4,000 Total current liabilities 50,614 35,580 Deferred tax liability 115 63 Operating lease liabilities 7,943 10,863 Debt, non-current 3,762 — Other liabilities 190 287 Total liabilities 62,624 46,793 Commitments and contingencies Stockholders’ equity Common stock 4 3 Additional paid-in capital 601,687 562,332 Treasury stock (35,706) (35,706) Accumulated other comprehensive loss (23) (20) Accumulated deficit (487,659) (478,799) Total stockholders’ equity 78,303 47,810 Total liabilities and stockholders’ equity $ 140,927 $ 94,603 CONSOLIDATED BALANCE SHEET (In thousands) |
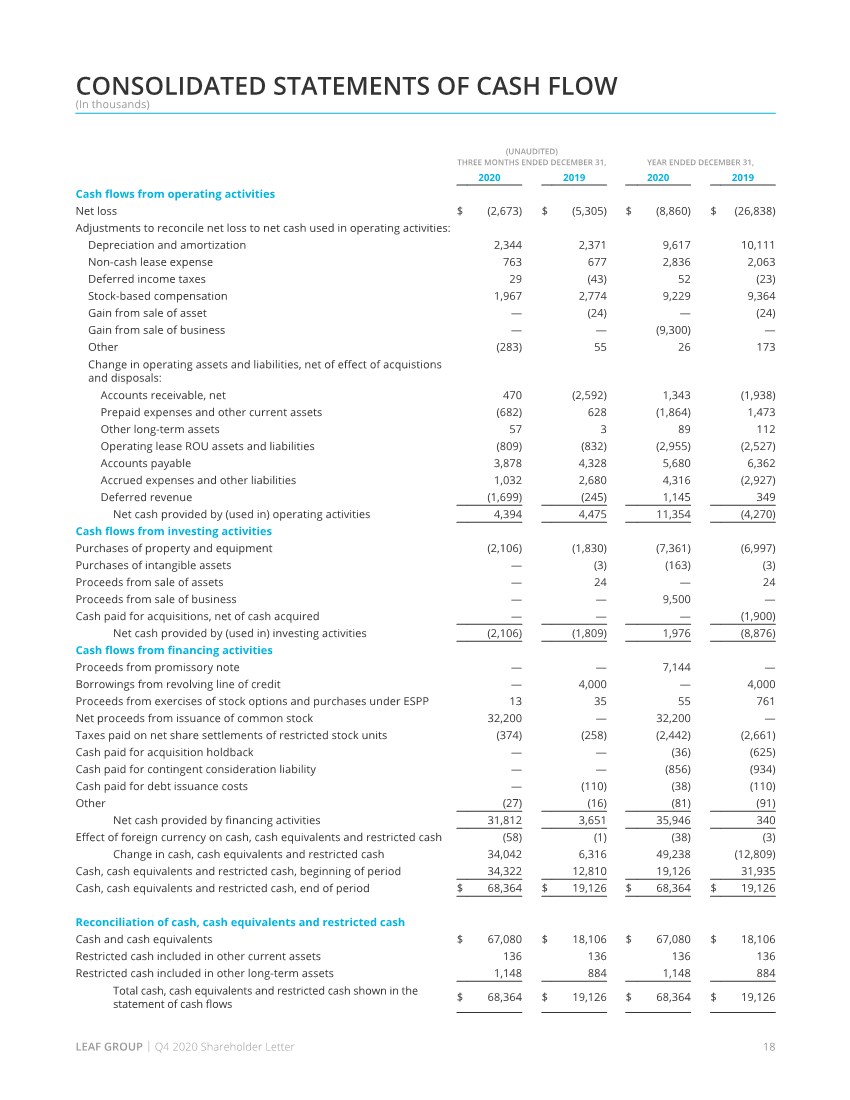
| 18 LEAF GROUP | Q4 2020 Shareholder Letter CONSOLIDATED STATEMENTS OF CASH FLOW (In thousands) (UNAUDITED) THREE MONTHS ENDED DECEMBER 31, YEAR ENDED DECEMBER 31, 2020 2019 2020 2019 Cash flows from operating activities Net loss $ (2,673) $ (5,305) $ (8,860) $ (26,838) Adjustments to reconcile net loss to net cash used in operating activities: Depreciation and amortization 2,344 2,371 9,617 10,111 Non-cash lease expense 763 677 2,836 2,063 Deferred income taxes 29 (43) 52 (23) Stock-based compensation 1,967 2,774 9,229 9,364 Gain from sale of asset — (24) — (24) Gain from sale of business — — (9,300) — Other (283) 55 26 173 Change in operating assets and liabilities, net of effect of acquistions and disposals: Accounts receivable, net 470 (2,592) 1,343 (1,938) Prepaid expenses and other current assets (682) 628 (1,864) 1,473 Other long-term assets 57 3 89 112 Operating lease ROU assets and liabilities (809) (832) (2,955) (2,527) Accounts payable 3,878 4,328 5,680 6,362 Accrued expenses and other liabilities 1,032 2,680 4,316 (2,927) Deferred revenue (1,699) (245) 1,145 349 Net cash provided by (used in) operating activities 4,394 4,475 11,354 (4,270) Cash flows from investing activities Purchases of property and equipment (2,106) (1,830) (7,361) (6,997) Purchases of intangible assets — (3) (163) (3) Proceeds from sale of assets — 24 — 24 Proceeds from sale of business — — 9,500 — Cash paid for acquisitions, net of cash acquired — — — (1,900) Net cash provided by (used in) investing activities (2,106) (1,809) 1,976 (8,876) Cash flows from financing activities Proceeds from promissory note — — 7,144 — Borrowings from revolving line of credit — 4,000 — 4,000 Proceeds from exercises of stock options and purchases under ESPP 13 35 55 761 Net proceeds from issuance of common stock 32,200 — 32,200 — Taxes paid on net share settlements of restricted stock units (374) (258) (2,442) (2,661) Cash paid for acquisition holdback — — (36) (625) Cash paid for contingent consideration liability — — (856) (934) Cash paid for debt issuance costs — (110) (38) (110) Other (27) (16) (81) (91) Net cash provided by financing activities 31,812 3,651 35,946 340 Effect of foreign currency on cash, cash equivalents and restricted cash (58) (1) (38) (3) Change in cash, cash equivalents and restricted cash 34,042 6,316 49,238 (12,809) Cash, cash equivalents and restricted cash, beginning of period 34,322 12,810 19,126 31,935 Cash, cash equivalents and restricted cash, end of period $ 68,364 $ 19,126 $ 68,364 $ 19,126 Reconciliation of cash, cash equivalents and restricted cash Cash and cash equivalents $ 67,080 $ 18,106 $ 67,080 $ 18,106 Restricted cash included in other current assets 136 136 136 136 Restricted cash included in other long-term assets 1,148 884 1,148 884 Total cash, cash equivalents and restricted cash shown in the statement of cash flows $ 68,364 $ 19,126 $ 68,364 $ 19,126 |
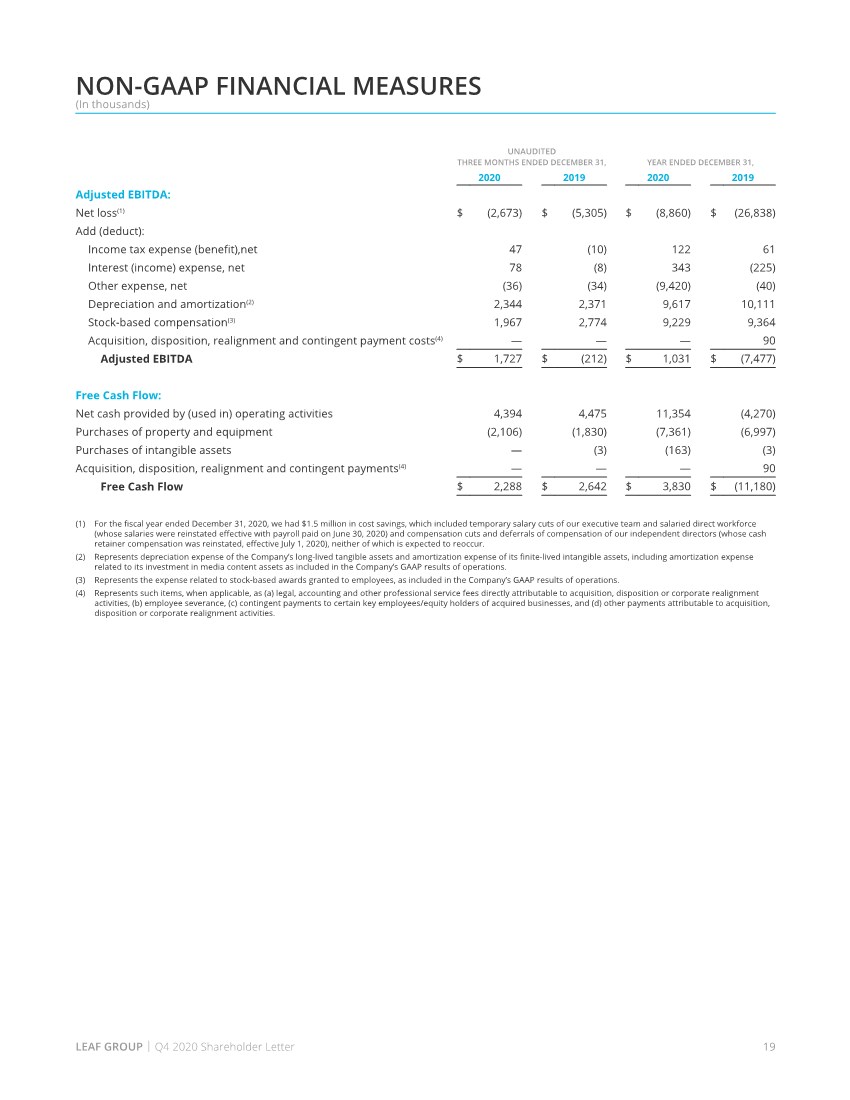
| 19 LEAF GROUP | Q4 2020 Shareholder Letter (1) For the fiscal year ended December 31, 2020, we had $1.5 million in cost savings, which included temporary salary cuts of our executive team and salaried direct workforce (whose salaries were reinstated effective with payroll paid on June 30, 2020) and compensation cuts and deferrals of compensation of our independent directors (whose cash retainer compensation was reinstated, effective July 1, 2020), neither of which is expected to reoccur. (2) Represents depreciation expense of the Company’s long-lived tangible assets and amortization expense of its finite-lived intangible assets, including amortization expense related to its investment in media content assets as included in the Company’s GAAP results of operations. (3) Represents the expense related to stock-based awards granted to employees, as included in the Company’s GAAP results of operations. (4) Represents such items, when applicable, as (a) legal, accounting and other professional service fees directly attributable to acquisition, disposition or corporate realignment activities, (b) employee severance, (c) contingent payments to certain key employees/equity holders of acquired businesses, and (d) other payments attributable to acquisition, disposition or corporate realignment activities. NON-GAAP FINANCIAL MEASURES (In thousands) UNAUDITED THREE MONTHS ENDED DECEMBER 31, YEAR ENDED DECEMBER 31, 2020 2019 2020 2019 Adjusted EBITDA: Net loss(1) $ (2,673) $ (5,305) $ (8,860) $ (26,838) Add (deduct): Income tax expense (benefit),net 47 (10) 122 61 Interest (income) expense, net 78 (8) 343 (225) Other expense, net (36) (34) (9,420) (40) Depreciation and amortization(2) 2,344 2,371 9,617 10,111 Stock-based compensation(3) 1,967 2,774 9,229 9,364 Acquisition, disposition, realignment and contingent payment costs(4) — — — 90 Adjusted EBITDA $ 1,727 $ (212) $ 1,031 $ (7,477) Free Cash Flow: Net cash provided by (used in) operating activities 4,394 4,475 11,354 (4,270) Purchases of property and equipment (2,106) (1,830) (7,361) (6,997) Purchases of intangible assets — (3) (163) (3) Acquisition, disposition, realignment and contingent payments(4) — — — 90 Free Cash Flow $ 2,288 $ 2,642 $ 3,830 $ (11,180) |
| 20 LEAF GROUP | Q4 2020 Shareholder Letter (1) Segment operating contribution reflects earnings before corporate and unallocated expenses and also excludes: (a) depreciation expense; (b) amortization of intangible assets; (c) share-based compensation expense; (d) interest and other income (expense); (e) income taxes; and (f) contingent payments to certain key employees/equity holders of acquired businesses. (2) Strategic shared services include shared operating expenses that are not directly attributable to the operating segments, including: network operations center, marketing, business development, product development, creative, financial systems, quality assurance, software engineering, and information systems. Corporate overhead includes general and administrative support functions that are not directly attributable to the operating segments, including: executive, accounting, finance, human resources, legal, and facilities. Strategic shared services and corporate overhead excludes the following: (a) depreciation expense; (b) amortization of intangible assets; (c) share-based compensation expense; (d) interest and other income (expenses); and (e) income taxes. (3) Strategic shared services and corporate overhead includes $1.8 million and $1.9 million in strategic shared services costs for the three months ended December 31, 2020 and 2019, respectively, and $4.4 million and $5.8 million in corporate overhead for the three months ended December 31, 2020 and 2019, respectively. Strategic shared services and corporate overhead include $7.8 million and $8.0 million in strategic shared services for the fiscal year ended December 31, 2020 and 2019, respectively, and $19.3 million and $22.0 million in corporate overhead for the fiscal year ended December 31, 2020 and 2019, respectively. (4) Represents such items, when applicable, as (a) legal, accounting and other professional service fees directly attributable to acquisition, disposition or corporate realignment activities, (b) employee severance, and (c) other payments attributable to acquisition, disposition or corporate realignment activities, excluding contingent payments to certain key employees/equity holders of acquired businesses. (5) Represents depreciation expense of the Company’s long-lived tangible assets and amortization expense of its finite-lived intangible assets, including amortization expense related to its investment in media content assets, included in the Company’s GAAP results of operations. (6) Represents the expense related to stock-based awards granted to employees as included in the Company’s GAAP results of operations. (7) Represents such items, when applicable, as (a) legal, accounting and other professional service fees directly attributable to acquisition, disposition or corporate realignment activities, (b) employee severance, (c) contingent payments to certain key employees/equity holders of acquired businesses, and (d) other payments attributable to acquisition, disposition or corporate realignment activities. (8) For the fiscal year ended December 31, 2020, we had $1.5 million in cost savings, which included temporary salary cuts of our executive team and salaried direct workforce (whose salaries were reinstated effective with payroll paid on June 30, 2020) and compensation cuts and deferrals of compensation of our independent directors (whose cash retainer compensation was reinstated, effective July 1, 2020), neither of which is expected to reoccur. SEGMENT REPORTING (In thousands) UNAUDITED THREE MONTHS ENDED DECEMBER 31, YEAR ENDED DECEMBER 31, 2020 2019 2020 2019 Segment Revenue: Society6 Group $ 43,711 $ 22,446 $ 138,000 $ 73,852 Saatchi Art Group 5,665 3,825 17,063 15,773 Media Group 15,597 18,828 56,998 65,331 Total revenue $ 64,973 $ 45,099 $ 212,061 $ 154,956 Segment Operating Contribution: Society6 Group(1) $ 876 $ 428 $ 8,152 $ 310 Saatchi Art Group(1) 172 (770) (1,563) (2,492) Media Group(1) 6,875 7,812 21,517 24,730 Deduct: Strategic shared services and corporate overhead(2)(3) (6,196) (7,682) (27,075) (30,025) Acquisition, disposition and realignment costs(4) — — — — Adjusted EBITDA $ 1,727 $ (212) $ 1,031 $ (7,477) Reconciliation to consolidated pre-tax income (loss): Adjusted EBITDA $ 1,727 $ (212) $ 1,031 $ (7,477) Add (deduct): Interest income (expense), net (78) 8 (343) 225 Other income, net 36 34 9,420 40 Depreciation and amortization(5) (2,344) (2,371) (9,617) (10,111) Stock-based compensation(6) (1,967) (2,774) (9,229) (9,364) Acquisition, disposition, realignment and contingent payment costs(7) — — — (90) Income loss before income taxes(8) $ (2,626) $ (5,315) $ (8,738) $ (26,777) |