.2
|
| [2] © 2026 AEROVIRONMENT, INC. Safe Harbor Statement This presentation contains "forward-looking statements" as that term is defined in the Private Securities Litigation Reform Act of 1995. Forward-looking statements include, without limitation, any statement that may predict, forecast, indicate or imply future results, performance or achievements, and may contain words such as “will,” “believe,” “anticipate,” “expect,” “estimate,” “intend,” “project,” “plan,” or words or phrases with similar meaning. Forward-looking statements are based on current expectations, forecasts and assumptions that involve risks and uncertainties, including, but not limited to, economic, competitive, governmental and technological factors outside of our control, that may cause our business, strategy or actual results to differ materially from the forward-looking statements. Factors that could cause actual results to differ materially from the forward-looking statements include, but are not limited to, the impact of our ability to successfully close and integrate acquisitions into our operations and avoid disruptions from acquisition transactions that will harm our business; the recording of goodwill and other intangible assets as part of acquisitions that are subject to potential impairments in the future and any realization of such impairments; any actual or threatened disruptions to our relationships with our distributors, suppliers, customers and employees, including shortages in components for our products, whether due to restrictions and sanctions imposed by foreign governments or otherwise; the ability to timely and sufficiently integrate international operations into our ongoing business and compliance programs; reliance on sales to the U.S. government, including uncertainties in classification, pricing or potentially burdensome imposed terms for certain types of government contracts; availability of U.S. government funding for defense procurement and R&D programs; our ability to win U.S. and international government R&D and procurement programs, including foreign military financing aid; changes in the timing and/or amount of government spending, including due to continuing resolutions and/or changing government priorities; adverse impacts of any U.S. government shutdown; our ability to realize the anticipated benefits of the BlueHalo transaction or other acquisitions; our ability to execute contracts for anticipated sales, perform under such contracts and other existing contracts and obtain new contracts; risks related to our international business, including compliance with export control laws; the extensive and increasing regulatory requirements governing our contracts with the U.S. government and international customers; the consequences to our financial position, business and reputation that could result from failing to comply with applicable law, regulatory requirements, and contractual obligations; unexpected technical and marketing difficulties inherent in major research and product development efforts; the impact of potential security and cyber threats or the risk of unauthorized access to and resulting misuse of our, our customers’ and/or our suppliers’ information and systems; failure to remain a market innovator, to create new market opportunities or to expand into new markets; our ability to increase production capacity to support anticipated growth; unexpected changes in significant operating expenses, including components and raw materials; failure to develop new products or integrate new technology into current products; any increase in litigation activity or unfavorable results in legal proceedings, including pending class actions, or litigation that may arise from or in conjunction with our recent acquisitions; our ability to respond and adapt to legal, regulatory and government budgetary changes; our ability to comply with the covenants in our loan documents, outstanding convertible notes or acquisition and merger agreements for acquisitions; our ability to attract and retain skilled employees, including retention of employees of acquired companies; the impact of inflation; and general economic and business conditions in the United States and elsewhere in the world; and the failure to establish and maintain effective internal control over financial reporting. For a further list and description of such risks and uncertainties, see the reports we file with the Securities and Exchange Commission. We do not intend, and undertake no obligation, to update any forward-looking statements, whether as a result of new information, future events or otherwise. |
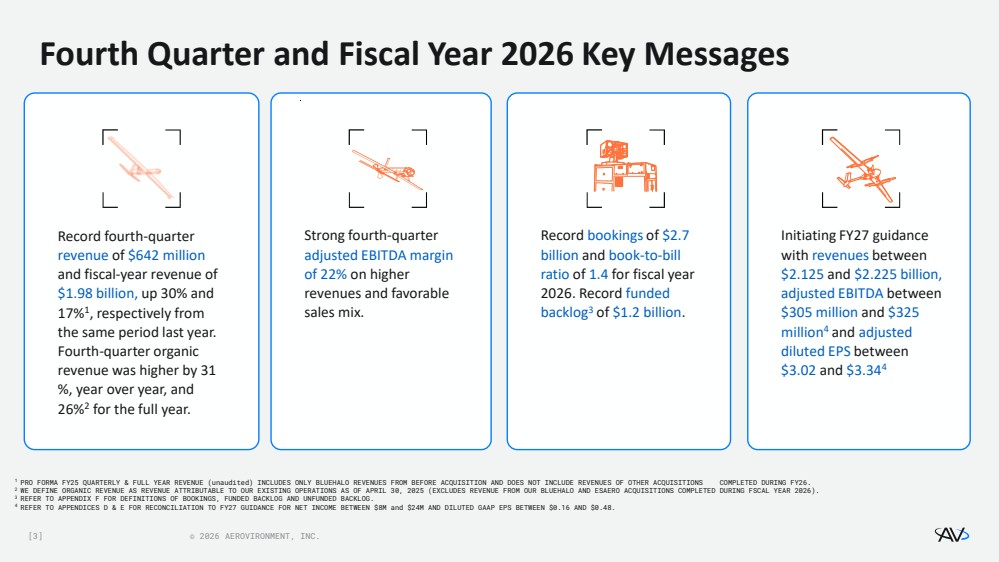
| [3] © 2026 AEROVIRONMENT, INC. Record bookings of $2.7 billion and book-to-bill ratio of 1.4 for fiscal year 2026. Record funded backlog3 of $1.2 billion. Record fourth-quarter revenue of $642 million and fiscal-year revenue of $1.98 billion, up 30% and 17%1 , respectively from the same period last year. Fourth-quarter organic revenue was higher by 31 %, year over year, and 26%2 for the full year. Strong fourth-quarter adjusted EBITDA margin of 22% on higher revenues and favorable sales mix. Initiating FY27 guidance with revenues between $2.125 and $2.225 billion, adjusted EBITDA between $305 million and $325 million4 and adjusted diluted EPS between $3.02 and $3.344 Fourth Quarter and Fiscal Year 2026 Key Messages 1 PRO FORMA FY25 QUARTERLY & FULL YEAR REVENUE (unaudited) INCLUDES ONLY BLUEHALO REVENUES FROM BEFORE ACQUISITION AND DOES NOT INCLUDE REVENUES OF OTHER ACQUISITIONS COMPLETED DURING FY26. 2 WE DEFINE ORGANIC REVENUE AS REVENUE ATTRIBUTABLE TO OUR EXISTING OPERATIONS AS OF APRIL 30, 2025 (EXCLUDES REVENUE FROM OUR BLUEHALO AND ESAERO ACQUISITIONS COMPLETED DURING FSCAL YEAR 2026). 3 REFER TO APPENDIX F FOR DEFINITIONS OF BOOKINGS, FUNDED BACKLOG AND UNFUNDED BACKLOG. 4 REFER TO APPENDICES D & E FOR RECONCILIATION TO FY27 GUIDANCE FOR NET INCOME BETWEEN $8M and $24M AND DILUTED GAAP EPS BETWEEN $0.16 AND $0.48. |
| [4] © 2026 AEROVIRONMENT, INC. Fourth Quarter Fiscal Year 2026 Results Metric Q4 FY26 Notes Revenue $641.6 M o 30% YoY Pro forma revenue growth3 o 31% YoY organic revenue growth4 GAAP Gross Margin $202.6 M o Record fourth-quarter gross margin driven by strong AxS sales Non-GAAP Adjusted EBITDA1 $140.1 M o Record fourth-quarter adjusted EBITDA of 22% driven by strong AxS sales o Adjusted non-GAAP SG&A = 11% of revenue5 o IRAD = 5% of revenue Non-GAAP EPS (diluted)2 $1.84 o Higher revenues due to contributions from AxS Funded Backlog $1.2 B o Continued strength in funded backlog driven by AxS Unfunded Backlog $1.5 B o Excludes $1.5 billion in unfunded backlog reported in prior quarters due to SCAR termination 1 Q4 GAAP NET INCOME WAS $63.2 MILLION. REFER TO ADJUSTED EBITDA RECONCILIATION ON APPENDIX C. 2 Q4 GAAP EPS WAS $1.25 PER DILUTED SHARE. REFER TO RECONCILIATION OF NON-GAAP EARNINGS PER DILUTED SHARE ON APPENDIX A. 3 PRO FORMA FY25 QUARTERLY (UNAUDITED) INCLUDES ONLY BLUEHALO REVENUES FROM BEFORE ACQUISITION AND NOT REVENUES OF OTHER ACQUISITIONS COMPLETED DURING FY26. 4 WE DEFINE ORGANIC REVENUE AS REVENUE ATTRIBUTABLE TO OUR EXISTING OPERATIONS AS OF APRIL 30, 2025 (EXCLUDES REVENUE FROM OUR BLUEHALO AND ESAERO ACQUISITIONS COMPLETED DURING FISCAL YEAR 2026). 5 GAAP SG&A WAS 18% of Q4 REVENUE. REFER TO GAAP TO NON-GAAP RECONCILIATION OF ADJUSTED SG&A ON APPENDIX G. |
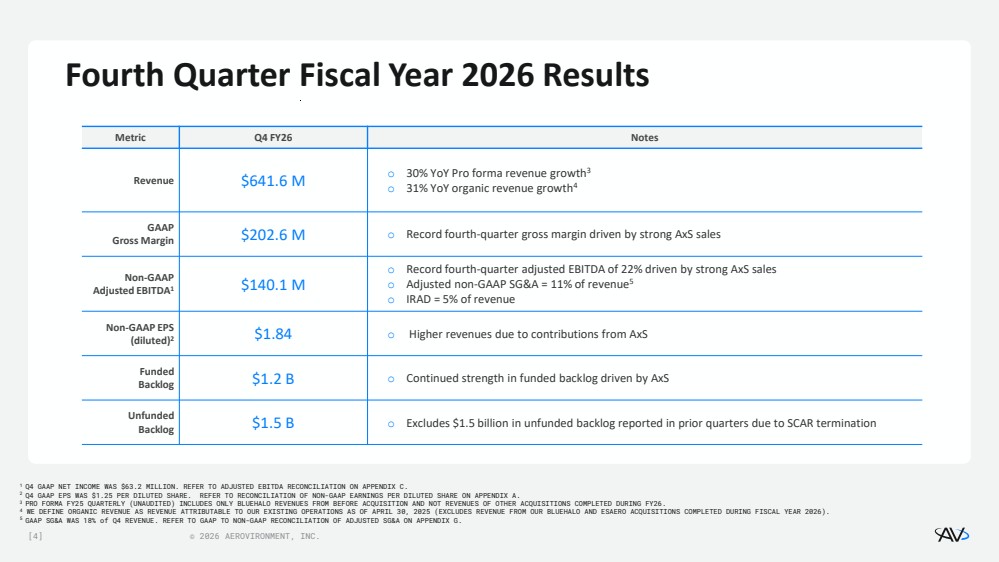
| [5] © 2026 AEROVIRONMENT, INC. Fiscal Year 2026 Results Metric FY26 Notes Revenue $1.98 B o 17% YoY Pro forma revenue growth3 o 26% YoY organic revenue growth4 GAAP Gross Margin $500.6 M o Strong FY26 gross margin driven by strong AxS sales Non-GAAP Adjusted EBITDA1 $286.1 M o Adjusted EBITDA of 14% o Adjusted non-GAAP SG&A = 13% of revenue5 o IRAD = 6% of revenue Non-GAAP EPS (diluted)2 $3.31 o Strong adjusted EPS driven by sales in AxS Funded Backlog $1.2 B o Continued strength in funded backlog driven by AxS Unfunded Backlog $1.5 B o Excludes $1.5 billion in unfunded backlog reported in prior quarters due to SCAR termination 1 FY26 GAAP NET LOSS WAS ($265.1M). REFER TO ADJUSTED EBITDA RECONCILIATION ON APPENDIX E. 2 FY26 GAAP LOSS PER SHARE WAS ($5.40) PER DILUTED SHARE. REFER TO RECONCILIATION OF NON-GAAP EARNINGS PER DILUTED SHARE ON APPENDIX D. 3 PRO FORMA FY25 REVENUE (UNAUDITED) INCLUDES ONLY BLUEHALO REVENUES FROM BEFORE ACQUISITION AND NOT REVENUES OF OTHER ACQUISITIONS COMPLETED DURING FY26. 4 WE DEFINE ORGANIC REVENUE AS REVENUE ATTRIBUTABLE TO OUR EXISTING OPERATIONS AS OF APRIL 30, 2025 (EXCLUDES REVENUE FROM OUR BLUEHALO AND ESAERO ACQUISITIONS COMPLETED DURING FISCAL YEAR 2026). 5 GAAP SG&A WAS 22% of FY26 REVENUE. REFER TO GAAP TO NON-GAAP RECONCILIATION OF ADJUSTED SG&A ON APPENDIX G. |
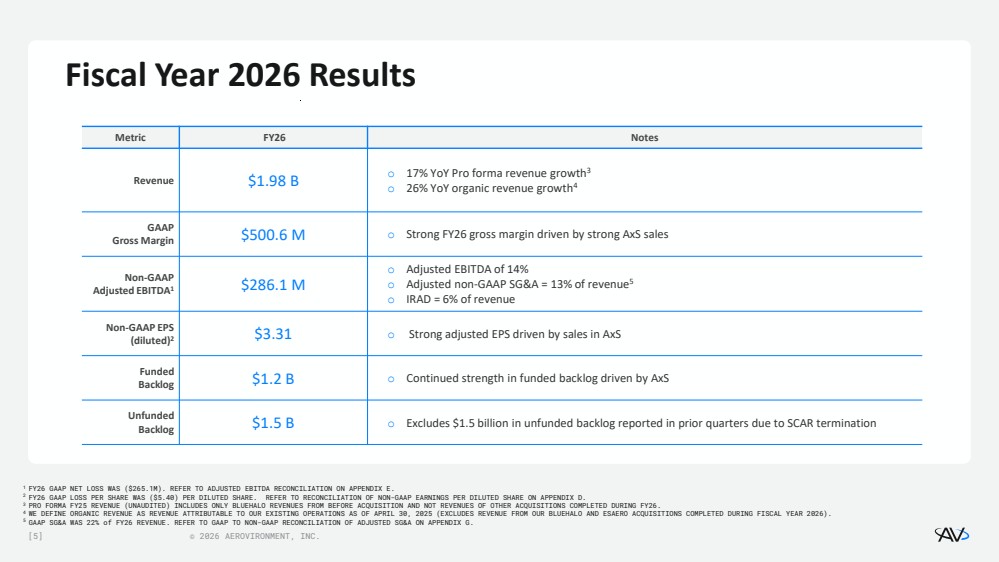
| [6] © 2026 AEROVIRONMENT, INC. Revenue Mix, Adjusted Profitability and Non-GAAP EPS 1 PRO FORMA FY25 QUARTERLY REVENUE (unaudited) INCLUDES ONLY BLUEHALO REVENUES FROM BEFORE ACQUISITION AND NOT REVENUES OF OTHER ACQUISITIONS COMPLETED DURING FY26. 2 Q4 FY26 GAAP PRODUCT MARGIN: 42% | SERVICE MARGIN (6%). REFER TO GAAP TO NON-GAAP RECONCILIATION OF GROSS MARGIN ON APPENDIX B. 3 Q4 FY25 GAAP EPS WAS $0.59 AND Q4 FY26 GAAP EPS WAS $1.25 PER DILUTED SHARE. REFER TO RECONCILIATION OF NON-GAAP DILUTED EARNINGS PER SHARE ON APPENDIX A. Quarterly Revenue by Segment1 AxS: AUTONOMOUS SYSTEMS SCDE: SPACE, CYBER AND DIRECTED ENERGY 36% 33% 32% 44% 13% 14% 17% 2% 29% 27% 27% 34% 0% 20% 40% 60% Q1 FY26 Q2 FY26 Q3 FY26 Q4 FY26 Adj Product Margin Adj Service Margin Total Adj Gross Margin $1.61 $1.84 $- $0.20 $0.40 $0.60 $0.80 $1.00 $1.20 $1.40 $1.60 $1.80 $2.00 Q4 FY25 Q4 FY26 Q4 FY26 Revenue: 77% Product | 23% Services Adjusted Non-GAAP Gross Margin2 Non-GAAP Diluted EPS3 [$M] $494.1 $454.7 $472.5 $408.0 $641.6 $0.0 $100.0 $200.0 $300.0 $400.0 $500.0 $600.0 $700.0 $800.0 Q4 FY25 Q1 FY26 Q2 FY26 Q3 FY26 Q4 FY26 AxS $330.6 $285.3 $301.6 $278.7 $492.4 SCDE $163.5 $169.4 $170.9 $129.3 $149.2 |
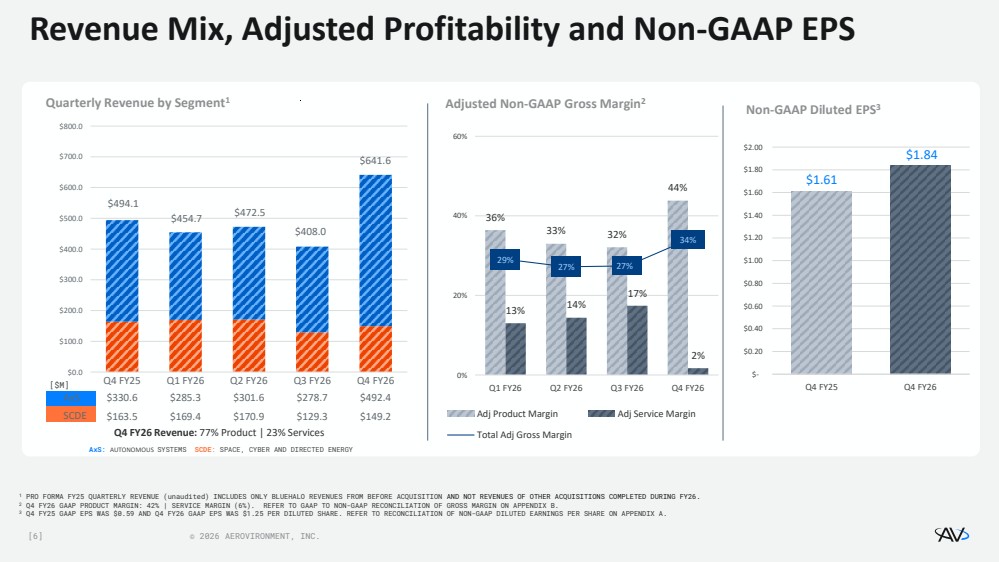
| [7] © 2026 AEROVIRONMENT, INC. Fourth Quarter Year over Year Revenue Comparison by Operating Group 1INCLUDES FY25 PRO FORMA REVENUE (unaudited) FROM BLUEHALO ONLY AND NOT REVENUES OF OTHER ACQUISITIONS COMPLETED DURING FY26. [$M] Pro Forma1 Q4 FY25 Actual Q4 FY26 Variance vs. Prior Year [$] Variance vs. Prior Year [%] Uncrewed Aircraft Systems $ 103 $ 121 $ 18 17 % Precision Strike & Defensive Systems $ 185 $ 333 $ 148 80 % Other $ 43 $ 38 $ [5] [12] % AxS TOTAL $ 331 $ 492 $ 161 49 % Space & Directed Energy $ 60 $ 74 $ 14 23 % Cyber & Mission Solutions $ 103 $ 76 $ [27] [26] % SCDE TOTAL $ 163 $ 150 $ [13] [8] % COMBINED TOTAL $ 494 $ 642 $ 148 30 % |
| [8] © 2026 AEROVIRONMENT, INC. Full Year Revenue Comparison by Operating Group 1INCLUDES FY25 PRO FORMA REVENUE (unaudited) FROM BLUEHALO ONLY AND NOT REVENUES OF OTHER ACQUISITIONS COMPLETED DURING FY26. [$M] Pro Forma1 FY25 Actual FY26 Variance vs. Prior Fiscal YTD[$] Variance vs. Prior Fiscal YTD[%] Uncrewed Aircraft Systems $ 352 $ 364 $ 12 3 % Precision Strike & Defensive Systems $ 527 $ 848 $ 321 61 % Other $ 170 $ 146 $ [24] [14] % AxS TOTAL $ 1,049 $ 1,358 $ 309 29 % Space & Directed Energy $ 231 $ 274 $ 43 19 % Cyber & Mission Solutions $ 415 $ 345 $ [70] [17] % SCDE TOTAL $ 646 $ 619 $ [27] [4] % COMBINED TOTAL $ 1,695 $ 1,977 $ 282 17 % |
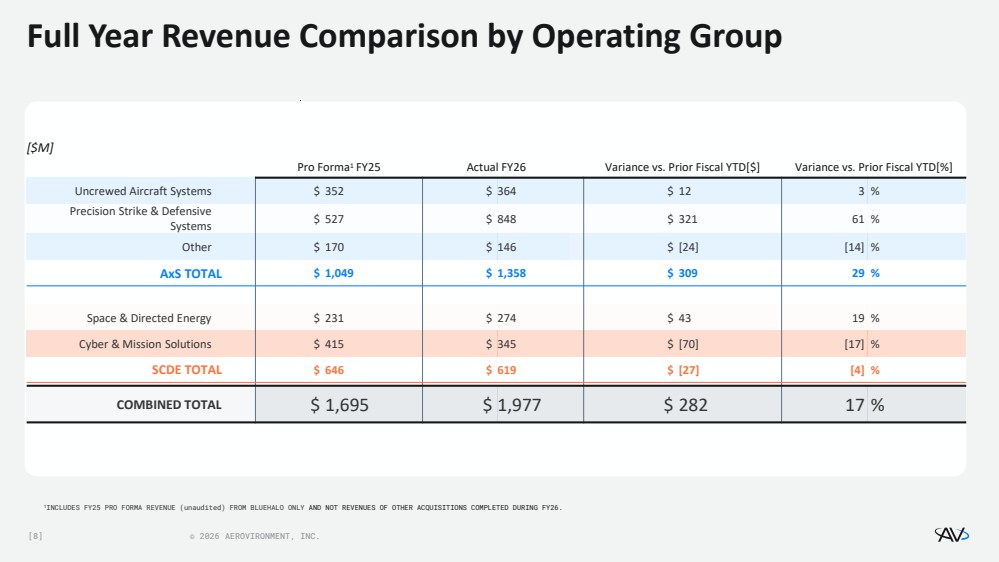
| [9] © 2026 AEROVIRONMENT, INC. Updated Guidance: Fiscal 2027 Outlook 1 FY26 GAAP LOSS PER SHARE OF $(5.40). REFER TO GAAP EPS RECONCILIATION ON APPENDIX D. 2 FY26 GAAP NET LOSS OF $(265.1M). FORECAST FULL YEAR GAAP NET INCOME BETWEEN $8M AND $24M. REFER TO ADJUSTED EBITDA RECONCILIATION ON APPENDIX E. 3 FORECAST FULL YEAR GAAP NET INCOME PER DILUTED SHARE BETWEEN $0.16 AND $0.48. REFER TO FORECASTED NON-GAAP EPS RECONCILIATION ON APPENDIX D. 4 FORECAST FULL YEAR GAAP SG&A AS A PERCENT OF REVENUE BETWEEN 2O% AND 21%. REFER TO GAAP TO NON-GAAP RECONCILIATION OF ADJUSTED SG&A ON APPENDIX G. 5 INCLUDES CLOUD IMPLEMENTATION CAPITAL EXPENDITURES AND SOFTWARE CAPITALIZATION. As of 06/29/2026 FY26 Results FY27 Guidance Notes / Assumptions Revenue $1.98 B $2.125 B to $2.225 B 10% year-over-year growth at midpoint o 1HFY27 = 45%; 2HFY27 = 55% Adjusted EBITDA $286.1 M2 $305 M to $325 M2 14% at midpoint2 o IRAD 7% to 9% o Adj SG&A 14% to 16% 4 o Stock based compensation of approx. $44 million for FY27 o Adj EBITDA 1HFY27 = 1/3 ; 2HFY27 = 2/3 Non-GAAP Earnings Per Share (diluted) $3.311 $3.02 to $3.343 o Higher depreciation expenses due to additional capital expenditures required for capacity and facility expansion o 1HFY27 = 25% ; 2HFY27 75% Capital Expenditures5 5% 12% to 14% o Increased due to scaling manufacturing capabilities & facility expansion o Includes integration-related capital expenditures Other o Deal & integration expenses approx. $10 M |
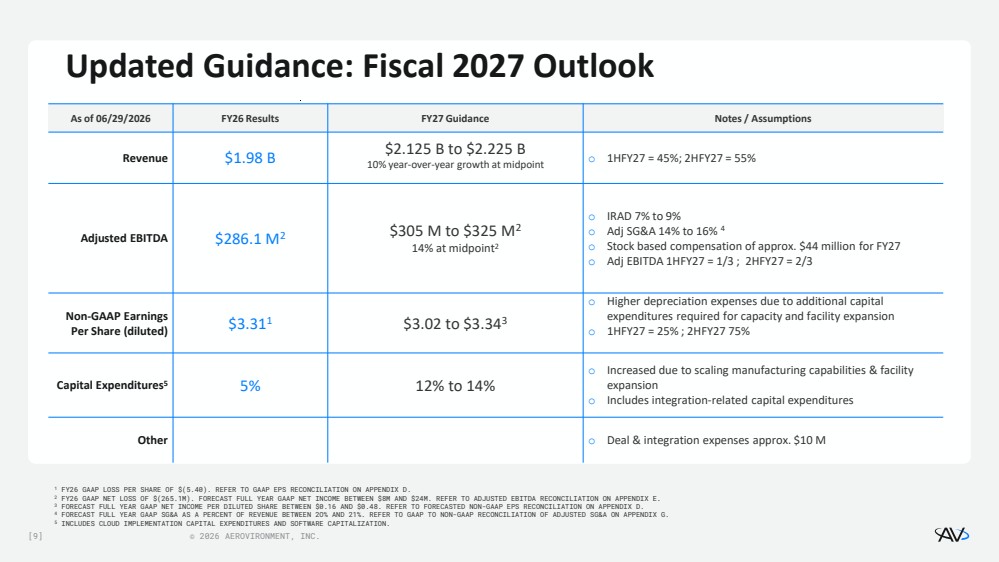
| [10] © 2026 AEROVIRONMENT, INC. 990 314 192 $- $500 $1,000 $1,500 $2,000 $2,500 Q4 FY26 (6/29/26) Q1 FY27 Q2 FY27 Q3 FY27 Q4 FY27 Year-to-Date - FY27 Funded Backlog - FY27 Anticipated Qtr-to-Date Bookings - FY27 Anticipated Unfunded Backlog - FY27 Anticipated FY27 Revenue Visibility 1BASED ON MIDPOINT OF GUIDANCE RANGE OF $2.125 BILLION TO $2.225 BILLION. Company visibility supports revenue guidance range 69% visibility 1 GUIDANCE RANGE $2.125B - $2.225B IN MILLIONS |
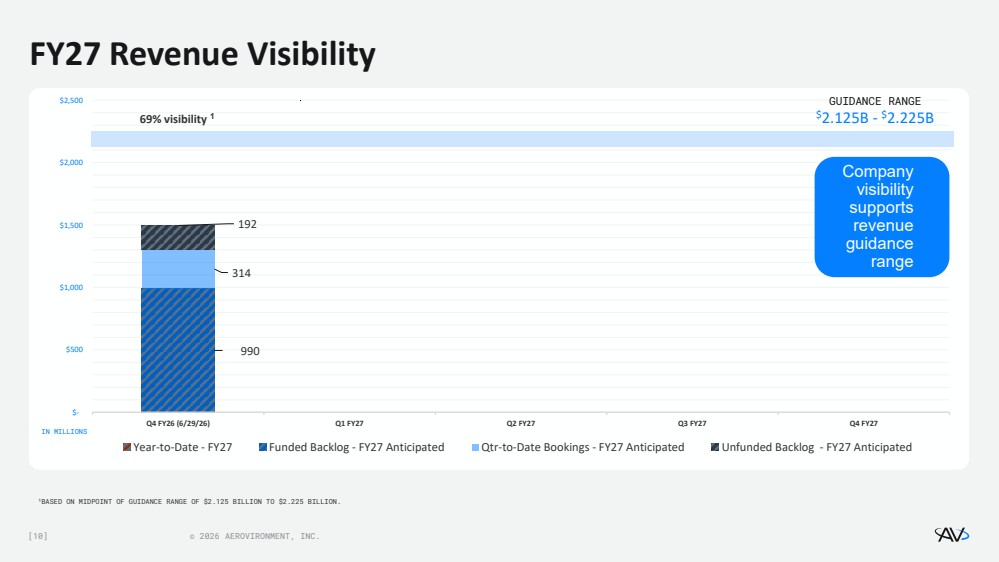
| [11] © 2026 AEROVIRONMENT, INC. Major Awards Since Fourth Quarter Fiscal Year 2026 $20M $25M Q4 Contract to Integrate PANTHER Phased Array Antenna on SkyRange Platforms for Hypersonic Telemetry Contract to Advance Ceramic Materials Research for the U.S. Air Force and Space Force Q1 Long Range Reconnaissance (LRR): Completed System Design Review #2, Delivery of 2nd Production Award Army Selects AV’s VAPOR® CLE for Medium Range Reconnaissance Program Contract to Mature Human Performance Technologies for Warfighter Readiness U.S. Army Selects AV’s Switchblade® 400 for LASSO Program CYBER AND MISSION SOLUTIONS CYBER AND MISSION SOLUTIONS |
| FINANCIAL TABLES |
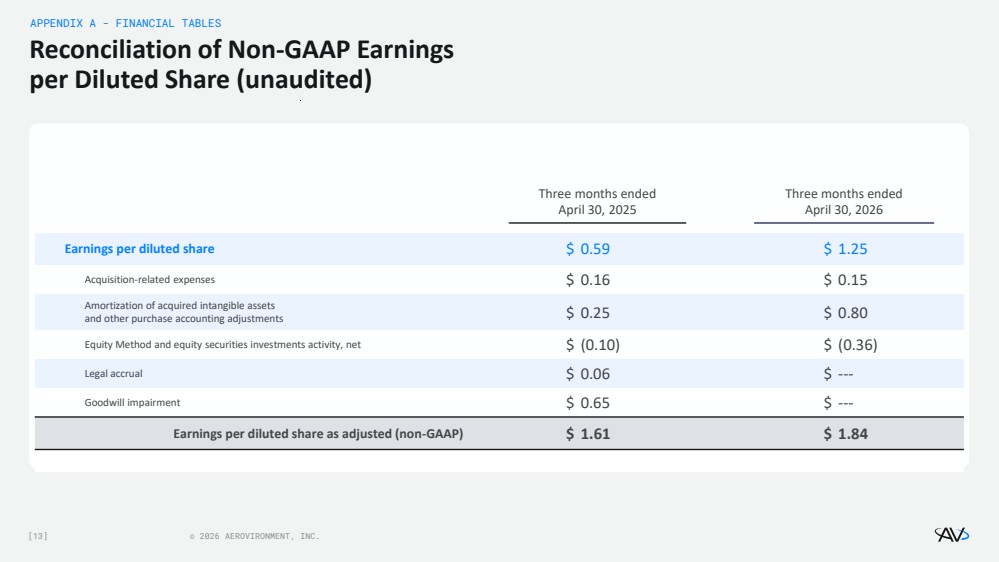
| [13] © 2026 AEROVIRONMENT, INC. Reconciliation of Non-GAAP Earnings per Diluted Share (unaudited) APPENDIX A - FINANCIAL TABLES Three months ended April 30, 2025 Three months ended April 30, 2026 Earnings per diluted share $ 0.59 $ 1.25 Acquisition-related expenses $ 0.16 $ 0.15 Amortization of acquired intangible assets and other purchase accounting adjustments $ 0.25 $ 0.80 Equity Method and equity securities investments activity, net $ (0.10) $ (0.36) Legal accrual $ 0.06 $ --- Goodwill impairment $ 0.65 $ --- Earnings per diluted share as adjusted (non-GAAP) $ 1.61 $ 1.84 |
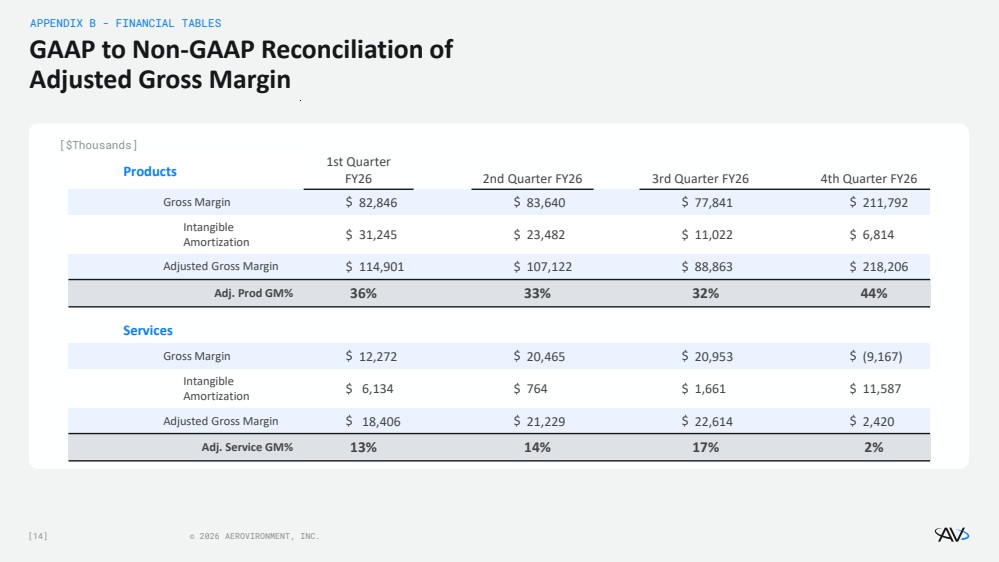
| [14] © 2026 AEROVIRONMENT, INC. GAAP to Non-GAAP Reconciliation of Adjusted Gross Margin APPENDIX B - FINANCIAL TABLES Products 1st Quarter FY26 2nd Quarter FY26 3rd Quarter FY26 4th Quarter FY26 Gross Margin $ 82,846 $ 83,640 $ 77,841 $ 211,792 Intangible Amortization $ 31,245 $ 23,482 $ 11,022 $ 6,814 Adjusted Gross Margin $ 114,901 $ 107,122 $ 88,863 $ 218,206 Adj. Prod GM% 36% 33% 32% 44% Services Gross Margin $ 12,272 $ 20,465 $ 20,953 $ (9,167) Intangible Amortization $ 6,134 $ 764 $ 1,661 $ 11,587 Adjusted Gross Margin $ 18,406 $ 21,229 $ 22,614 $ 2,420 Adj. Service GM% 13% 14% 17% 2% [$Thousands] |
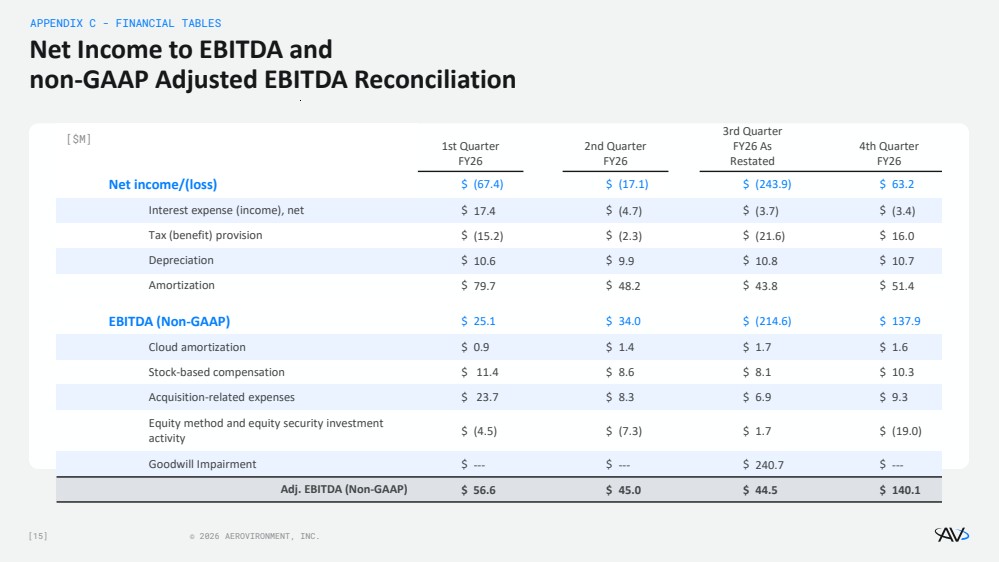
| [15] © 2026 AEROVIRONMENT, INC. Net Income to EBITDA and non-GAAP Adjusted EBITDA Reconciliation APPENDIX C - FINANCIAL TABLES 1st Quarter FY26 2nd Quarter FY26 3rd Quarter FY26 As Restated 4th Quarter FY26 Net income/(loss) $ (67.4) $ (17.1) $ (243.9) $ 63.2 Interest expense (income), net $ 17.4 $ (4.7) $ (3.7) $ (3.4) Tax (benefit) provision $ (15.2) $ (2.3) $ (21.6) $ 16.0 Depreciation $ 10.6 $ 9.9 $ 10.8 $ 10.7 Amortization $ 79.7 $ 48.2 $ 43.8 $ 51.4 EBITDA (Non-GAAP) $ 25.1 $ 34.0 $ (214.6) $ 137.9 Cloud amortization $ 0.9 $ 1.4 $ 1.7 $ 1.6 Stock-based compensation $ 11.4 $ 8.6 $ 8.1 $ 10.3 Acquisition-related expenses $ 23.7 $ 8.3 $ 6.9 $ 9.3 Equity method and equity security investment activity $ (4.5) $ (7.3) $ 1.7 $ (19.0) Goodwill Impairment $ --- $ --- $ 240.7 $ --- Adj. EBITDA (Non-GAAP) $ 56.6 $ 45.0 $ 44.5 $ 140.1 [$M] |
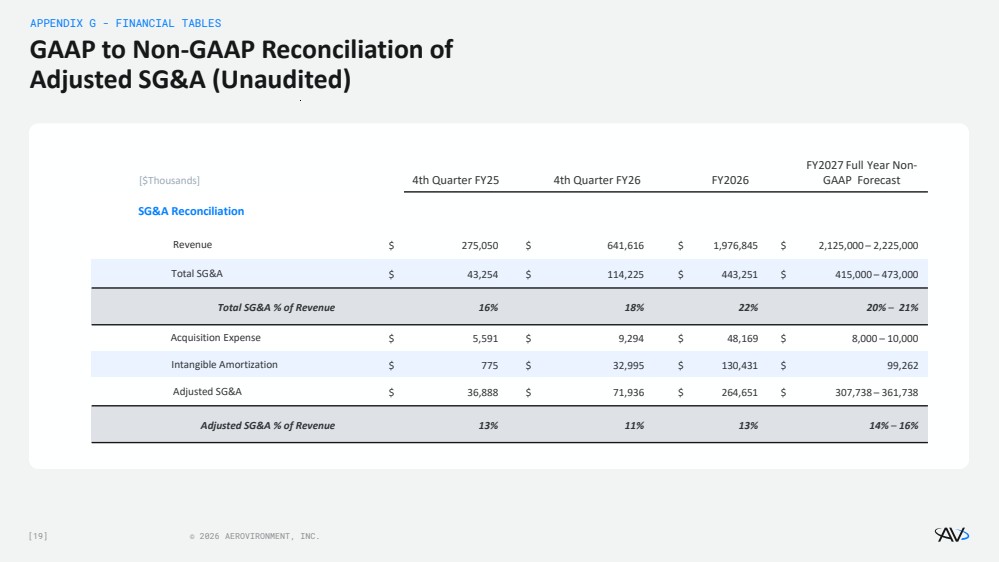
| [16] © 2026 AEROVIRONMENT, INC. GAAP to Non-GAAP Reconciliation of Earnings per Diluted Share (Unaudited) APPENDIX D - FINANCIAL TABLES Fiscal year ended April 30, 2025 Fiscal year ended April 30, 2026 Fiscal year ended April 30, 2027 Earnings (loss) per diluted share (GAAP) $ 1.55 $ (5.40) $ $0.16 - $0.48 Acquisition-related expenses $ 0.54 $ 0.89 $ $0.16 Amortization of acquired intangible assets and other purchase accounting adjustments $ 0.66 $ 3.60 $ $2.70 Legal accrual $ 0.06 $ --- $ --- Equity Method and equity securities investments activity, net $ (0.18) $ (0.54) $ --- Goodwill impairment $ 0.65 $ 4.76 $ --- Earnings per diluted share as adjusted (non-GAAP) $ 3.28 $ 3.31 $ $3.02 - $3.34 |
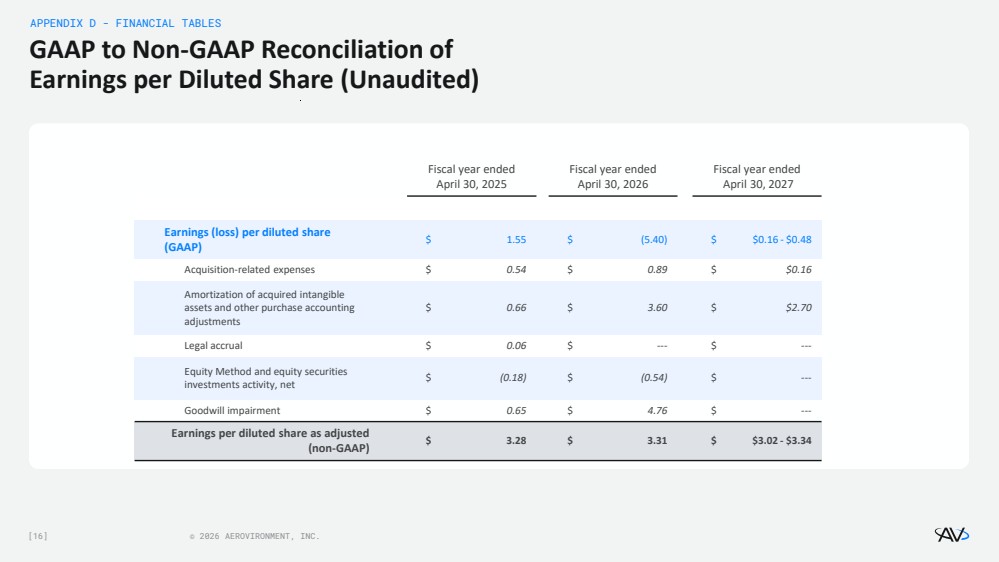
| [17] © 2026 AEROVIRONMENT, INC. Reconciliation of 2027 Forecast and Fiscal Year 2026 Non-GAAP adjusted EBITDA (Unaudited) APPENDIX E - FINANCIAL TABLES [$M] Fiscal year ended April 30, 2026 Fiscal year ended April 30, 2027 Net (loss) income from continued operations $ (265.1) $ 8 - 24 Interest expense (income), net $ 5.6 $ (8) Tax benefit $ (23.1) $ (6) – (2) Depreciation $ 41.9 $ 70 Amortization $ 223.1 $ 173 EBITDA (Non-GAAP) $ (17.6) $ 237 - 257 Cloud amortization $ 5.7 $ 14 Stock-based compensation $ 38.3 $ 44 Acquisition-related expenses $ 48.2 $ 10 Goodwill impairment $ 240.7 $ --- Equity method and equity security investment activity $ (29.2) $ --- Adj. EBITDA (Non-GAAP) $ 286.1 $ 305 - 325 |
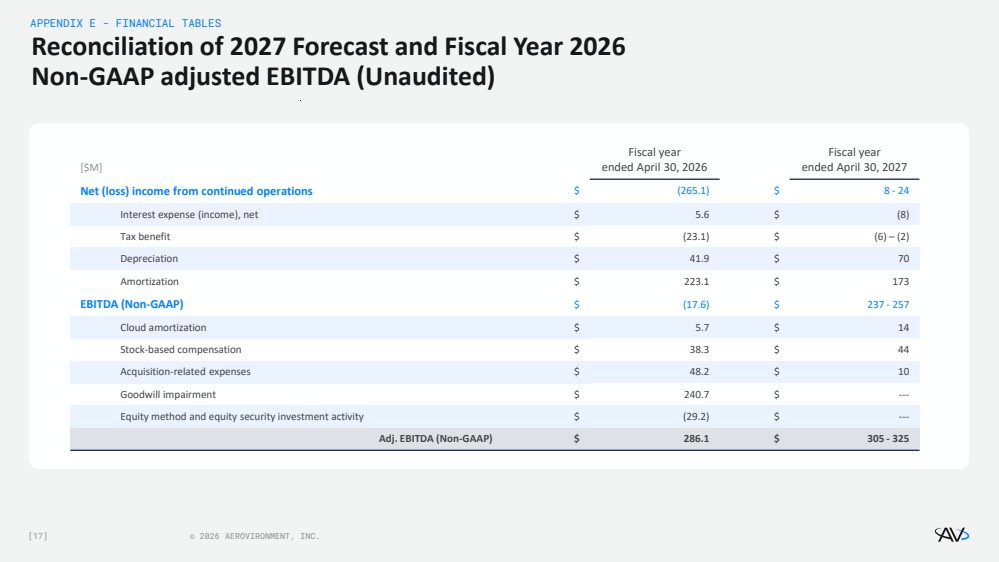
| [18] © 2026 AEROVIRONMENT, INC. AVAV Contracting Related Definitions APPENDIX F - FINANCIAL TABLES Term Definition Q4 FY26 Results Bookings The value of new authorized/exercised contract awards and contract modifications received during the reporting period. Bookings typically include the total contract value for new awards and the incremental value of modifications. Bookings include authorized contract values where the customer has provided contractual authority to perform work, even if funding has not yet been obligated, but does not include the unauthorized portion of TCV. $0.57B (QTD) $2.7B (YTD)1 Funded Backlog The portion of backlog for which the customer has provided appropriated, obligated funding that the company is currently authorized to spend. Funded backlog is the most “cash-certain” portion of backlog, representing work the company can execute immediately and bill against. This is often driven by U.S. DoD funding obligations and contract increments. $1.2B Unfunded Backlog The remaining value of awarded contracts for which the customer has not yet obligated funding. These amounts reflect future expected funding—commonly tied to multi-year programs where annual appropriations, options, or increments are still pending. Unfunded backlog is typical in large defense programs and is converted to funded backlog as appropriations and task orders are executed. Unfunded ceiling amounts for sole-source or multi-awardee Indefinite Delivery, Indefinite Quantity (“IDIQ”) contracts are not included in unfunded backlog. $1.5 B 1 Book-to-Bill Ratio The book-to-bill ratio measures the relationship between the value of new bookings in a given period (Fiscal YTD) and the revenue billed or recognized over that same period. Book-to-bill ratio is calculated by dividing period bookings by period revenues. 1.4 (YTD) 2 1 UNFUNDED BACKLOG EXCLUDES $1.5 BILLION IN UNFUNDED BACKLOG REPORTED IN PRIOR QUARTERS DUE TO SCAR TERMINATION. 2 YEAR-TO-DATE TOTAL FOR THE FISCAL YEAR ENDED APRIL 30, 2026. |
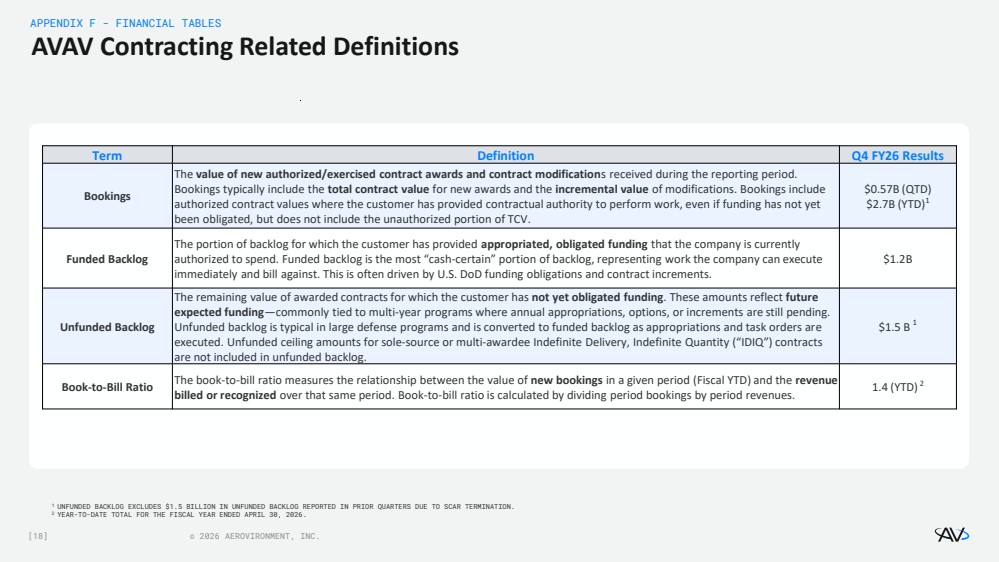
| [19] © 2026 AEROVIRONMENT, INC. GAAP to Non-GAAP Reconciliation of Adjusted SG&A (Unaudited) APPENDIX G - FINANCIAL TABLES [$Thousands] 4th Quarter FY25 4th Quarter FY26 FY2026 FY2027 Full Year Non-GAAP Forecast SG&A Reconciliation Revenue $ 275,050 $ 641,616 $ 1,976,845 $ 2,125,000 – 2,225,000 Total SG&A $ 43,254 $ 114,225 $ 443,251 $ 415,000 – 473,000 Total SG&A % of Revenue 16% 18% 22% 20% – 21% Acquisition Expense $ 5,591 $ 9,294 $ 48,169 $ 8,000 – 10,000 Intangible Amortization $ 775 $ 32,995 $ 130,431 $ 99,262 Adjusted SG&A $ 36,888 $ 71,936 $ 264,651 $ 307,738 – 361,738 Adjusted SG&A % of Revenue 13% 11% 13% 14% – 16% |
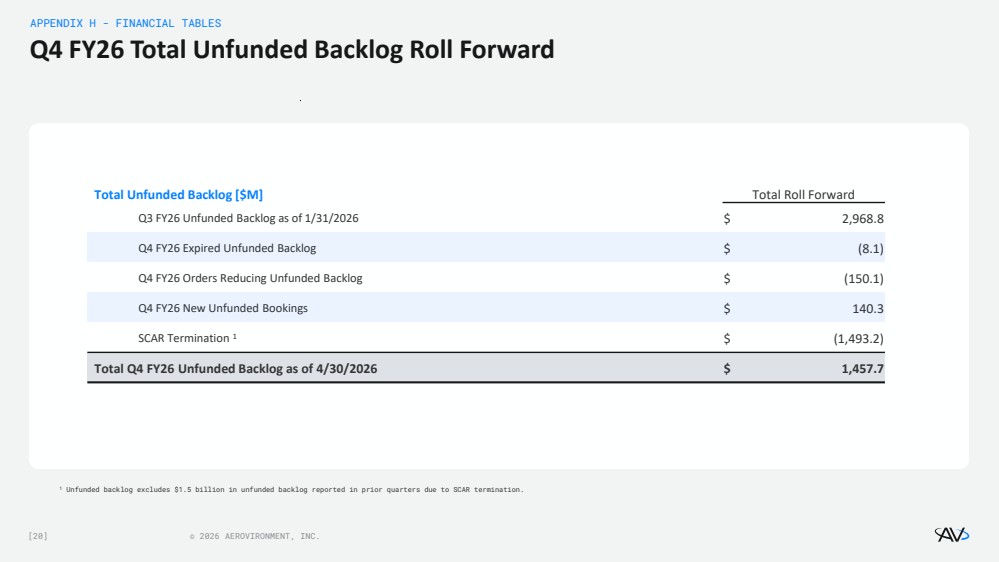
| [20] © 2026 AEROVIRONMENT, INC. Q4 FY26 Total Unfunded Backlog Roll Forward APPENDIX H - FINANCIAL TABLES Total Unfunded Backlog [$M] Total Roll Forward Q3 FY26 Unfunded Backlog as of 1/31/2026 $ 2,968.8 Q4 FY26 Expired Unfunded Backlog $ (8.1) Q4 FY26 Orders Reducing Unfunded Backlog $ (150.1) Q4 FY26 New Unfunded Bookings $ 140.3 SCAR Termination 1 $ (1,493.2) Total Q4 FY26 Unfunded Backlog as of 4/30/2026 $ 1,457.7 1 Unfunded backlog excludes $1.5 billion in unfunded backlog reported in prior quarters due to SCAR termination. |