
October 2025 Corporate Overview
This presentation and any accompanying oral presentation contains forward-looking statements within the meaning of the "safe harbor" provisions of the Private Securities Litigation Reform Act of 1995, including, but not limited to: the timing of the release of data from the Company’s clinical trials, including initial data for rosnilimab’s Phase 2 clinical trial in ulcerative colitis and ANB033's Phase 1b clinical trial in celiac disease; expectations regarding the structure, infrastructure, timing and taxation of the proposed separation of companies; timing of paydown of financial obligations to Sagard; timing of initiation of Phase 1b clinical trial in second indication with ANB033; timing of initiation of potential Phase 2 clinical trials with rosnilimab in additional indications; whether any partnership with rosnilimab will take place; the potential to receive any royalties or milestone payments from the Vanda Pharmaceuticals license agreement; whether any of the Company’s product candidates will be best in class or optimized; the potential to receive any additional milestones or royalties from the GSK collaboration and timing therefor; and the Company’s projected cash runway. Statements including words such as “plan,” “continue,” “expect,” or “ongoing” and statements in the future tense are forward-looking statements. These forward-looking statements involve risks and uncertainties, as well as assumptions, which, if they do not fully materialize or prove incorrect, could cause its results to differ materially from those expressed or implied by such forward-looking statements. Forward-looking statements are subject to risks and uncertainties that may cause the company’s actual activities or results to differ significantly from those expressed in any forward-looking statement, including risks and uncertainties related to the company’s ability to advance its product candidates, obtain regulatory approval of and ultimately commercialize its product candidates, the timing and results of preclinical and clinical trials, the company’s ability to fund development activities and achieve development goals, the company’s ability to protect intellectual property and other risks and uncertainties described under the heading “Risk Factors” in documents the company files from time to time with the Securities and Exchange Commission. These forward-looking statements speak only as of the date of this presentation, and the company undertakes no obligation to revise or update any forward-looking statements to reflect events or circumstances after the date hereof. Certain information contained in this presentation may be derived from information provided by industry sources. The Company believes such information is accurate and that the sources from which it has been obtained are reliable. However, the Company cannot guarantee the accuracy of, and has not independently verified, such information. The trademarks included herein are the property of the owners thereof and are used for reference purposes only. Such use should not be construed as an endorsement of such products. 2 Safe harbor statement
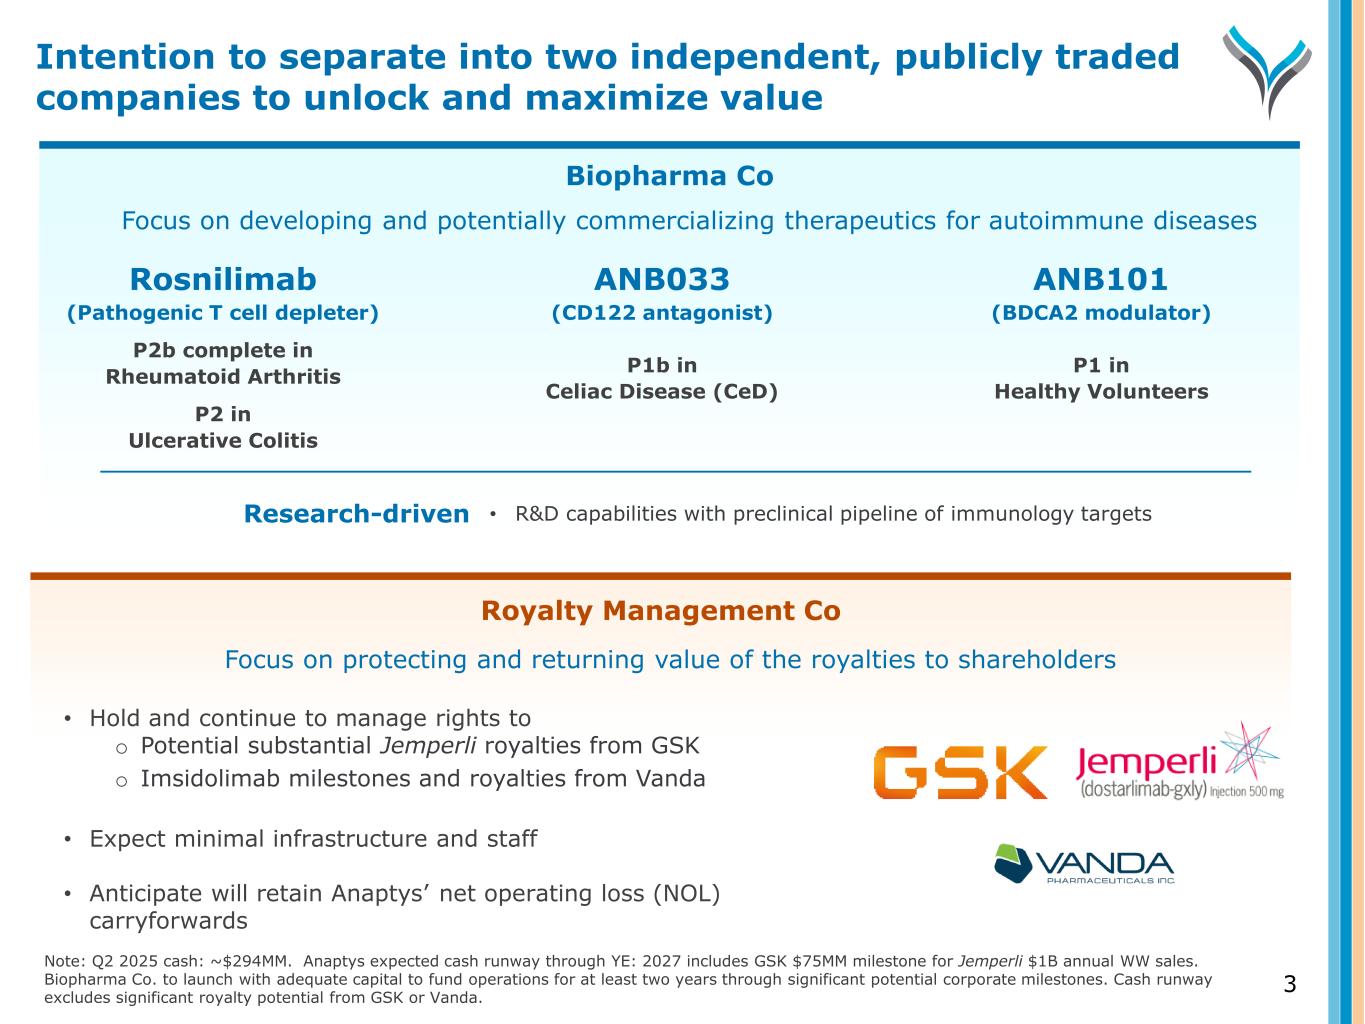
Biopharma Co ANB033 (CD122 antagonist) P1b in Celiac Disease (CeD) Rosnilimab (Pathogenic T cell depleter) P2b complete in Rheumatoid Arthritis P2 in Ulcerative Colitis Focus on developing and potentially commercializing therapeutics for autoimmune diseases ANB101 (BDCA2 modulator) P1 in Healthy Volunteers Royalty Management Co 3 Research-driven • R&D capabilities with preclinical pipeline of immunology targets Note: Q2 2025 cash: ~$294MM. Anaptys expected cash runway through YE: 2027 includes GSK $75MM milestone for Jemperli $1B annual WW sales. Biopharma Co. to launch with adequate capital to fund operations for at least two years through significant potential corporate milestones. Cash runway excludes significant royalty potential from GSK or Vanda. Focus on protecting and returning value of the royalties to shareholders • Hold and continue to manage rights to o Potential substantial Jemperli royalties from GSK o Imsidolimab milestones and royalties from Vanda • Expect minimal infrastructure and staff • Anticipate will retain Anaptys’ net operating loss (NOL) carryforwards Intention to separate into two independent, publicly traded companies to unlock and maximize value
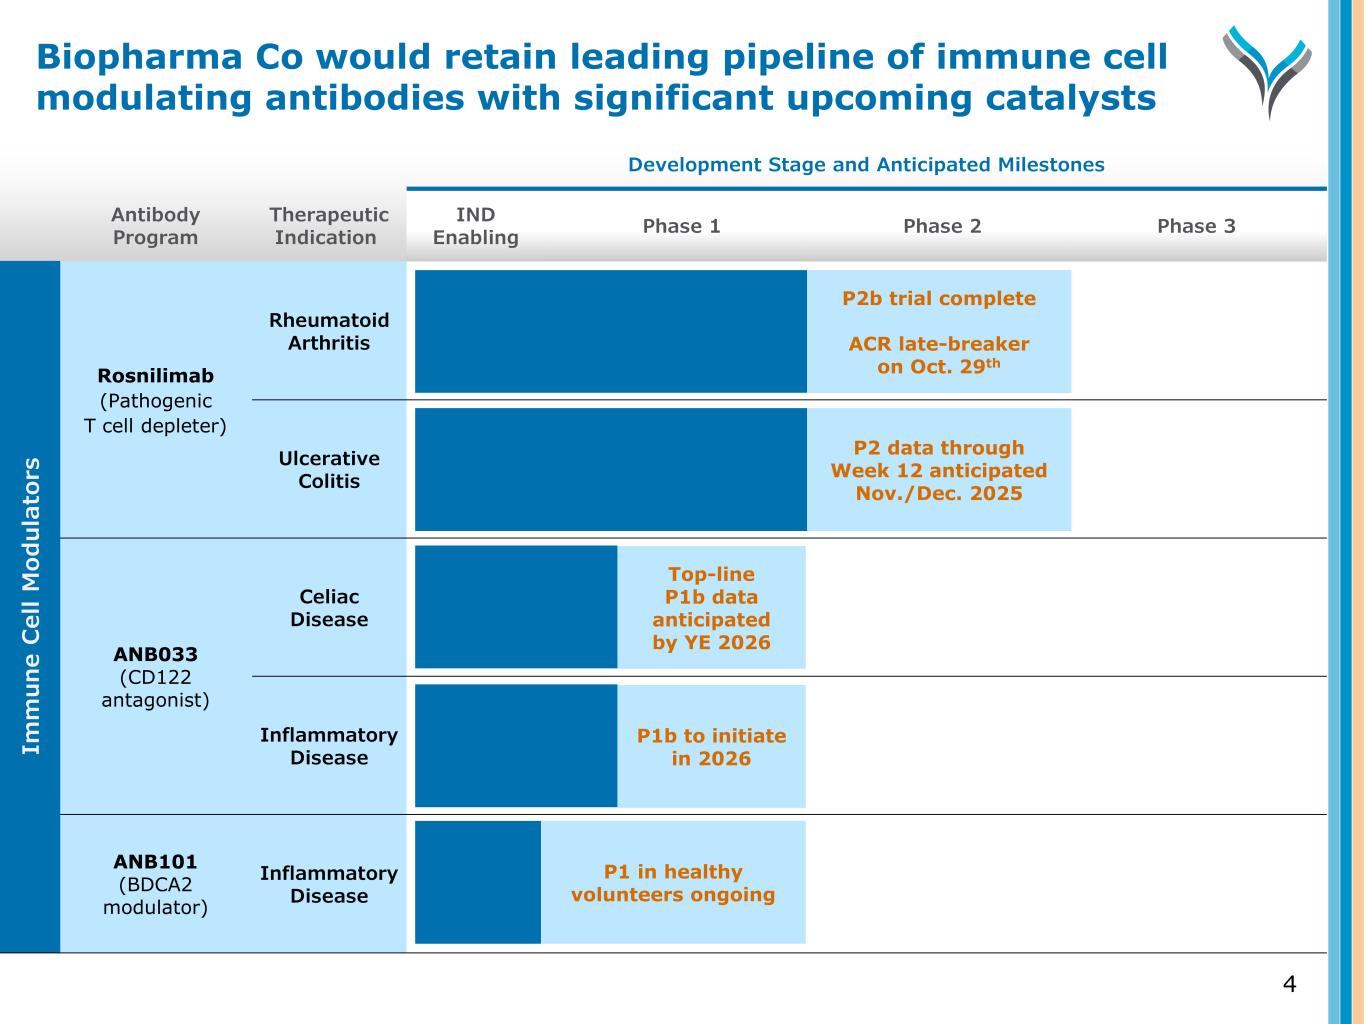
Antibody Program Therapeutic Indication Development Stage and Anticipated Milestones IND Enabling Phase 1 Phase 2 Phase 3 Rosnilimab (Pathogenic T cell depleter) Rheumatoid Arthritis Ulcerative Colitis ANB033 (CD122 antagonist) Celiac Disease Inflammatory Disease ANB101 (BDCA2 modulator) Inflammatory Disease 4 P2b trial complete ACR late-breaker on Oct. 29th P2 data through Week 12 anticipated Nov./Dec. 2025 Top-line P1b data anticipated by YE 2026 Im m u n e C el l M od u la to rs P1 in healthy volunteers ongoing P1b to initiate in 2026 Biopharma Co would retain leading pipeline of immune cell modulating antibodies with significant upcoming catalysts
JemperliTM (dostarlimab, PD-1 Antagonist) Imsidolimab (IL-36R antagonist) Royalty-Bearing Assets
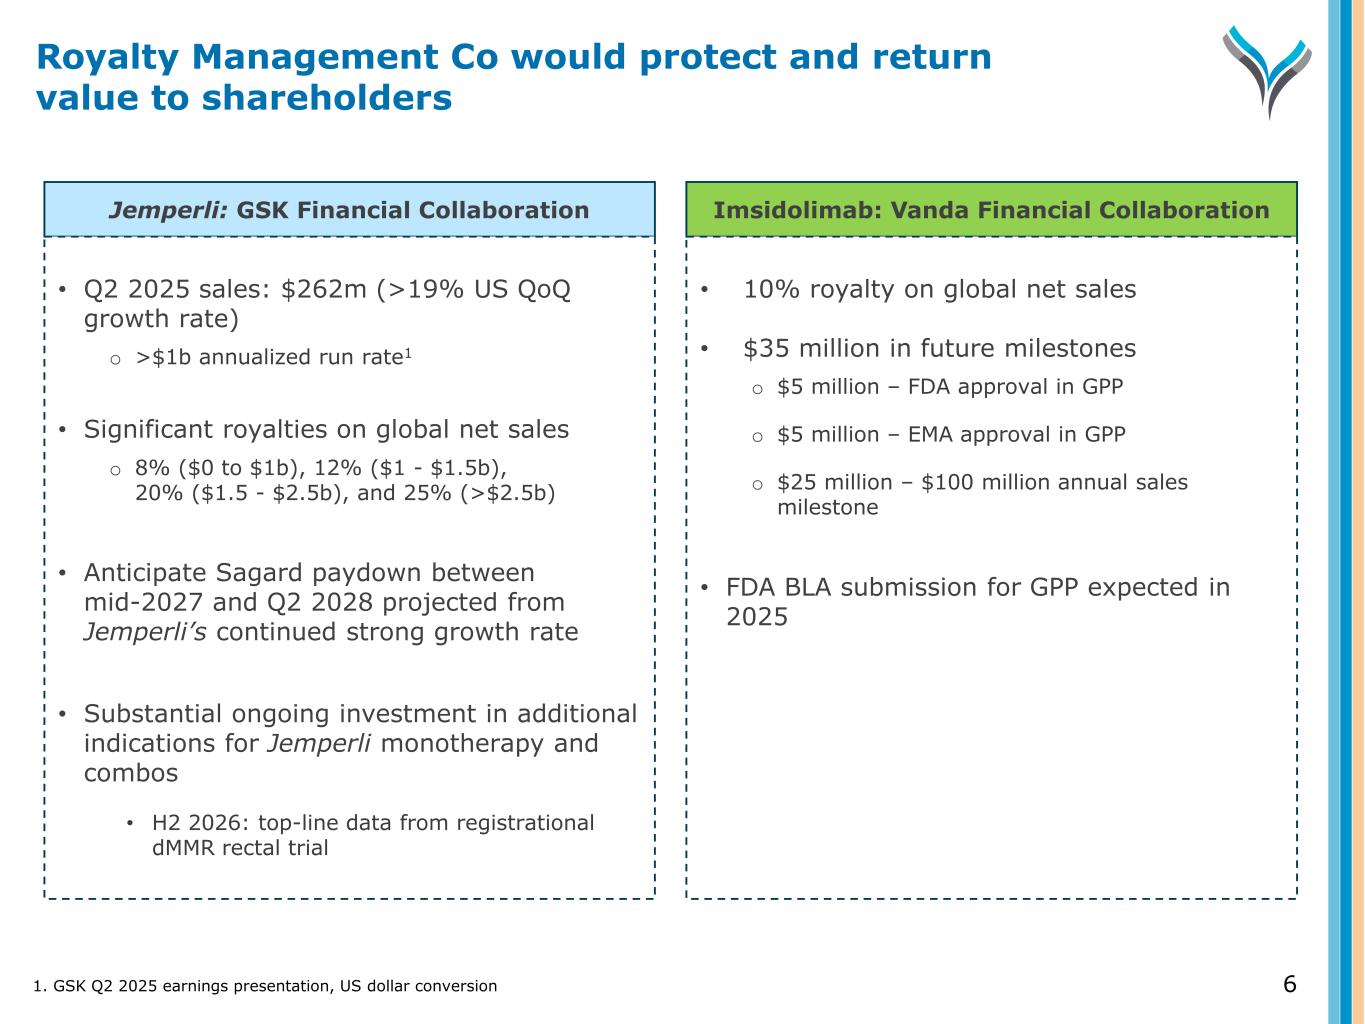
6 Jemperli: GSK Financial Collaboration Imsidolimab: Vanda Financial Collaboration • Q2 2025 sales: $262m (>19% US QoQ growth rate) o >$1b annualized run rate1 • Significant royalties on global net sales o 8% ($0 to $1b), 12% ($1 - $1.5b), 20% ($1.5 - $2.5b), and 25% (>$2.5b) • Anticipate Sagard paydown between mid-2027 and Q2 2028 projected from Jemperli’s continued strong growth rate • Substantial ongoing investment in additional indications for Jemperli monotherapy and combos • H2 2026: top-line data from registrational dMMR rectal trial • 10% royalty on global net sales • $35 million in future milestones o $5 million – FDA approval in GPP o $5 million – EMA approval in GPP o $25 million – $100 million annual sales milestone • FDA BLA submission for GPP expected in 2025 1. GSK Q2 2025 earnings presentation, US dollar conversion Royalty Management Co would protect and return value to shareholders
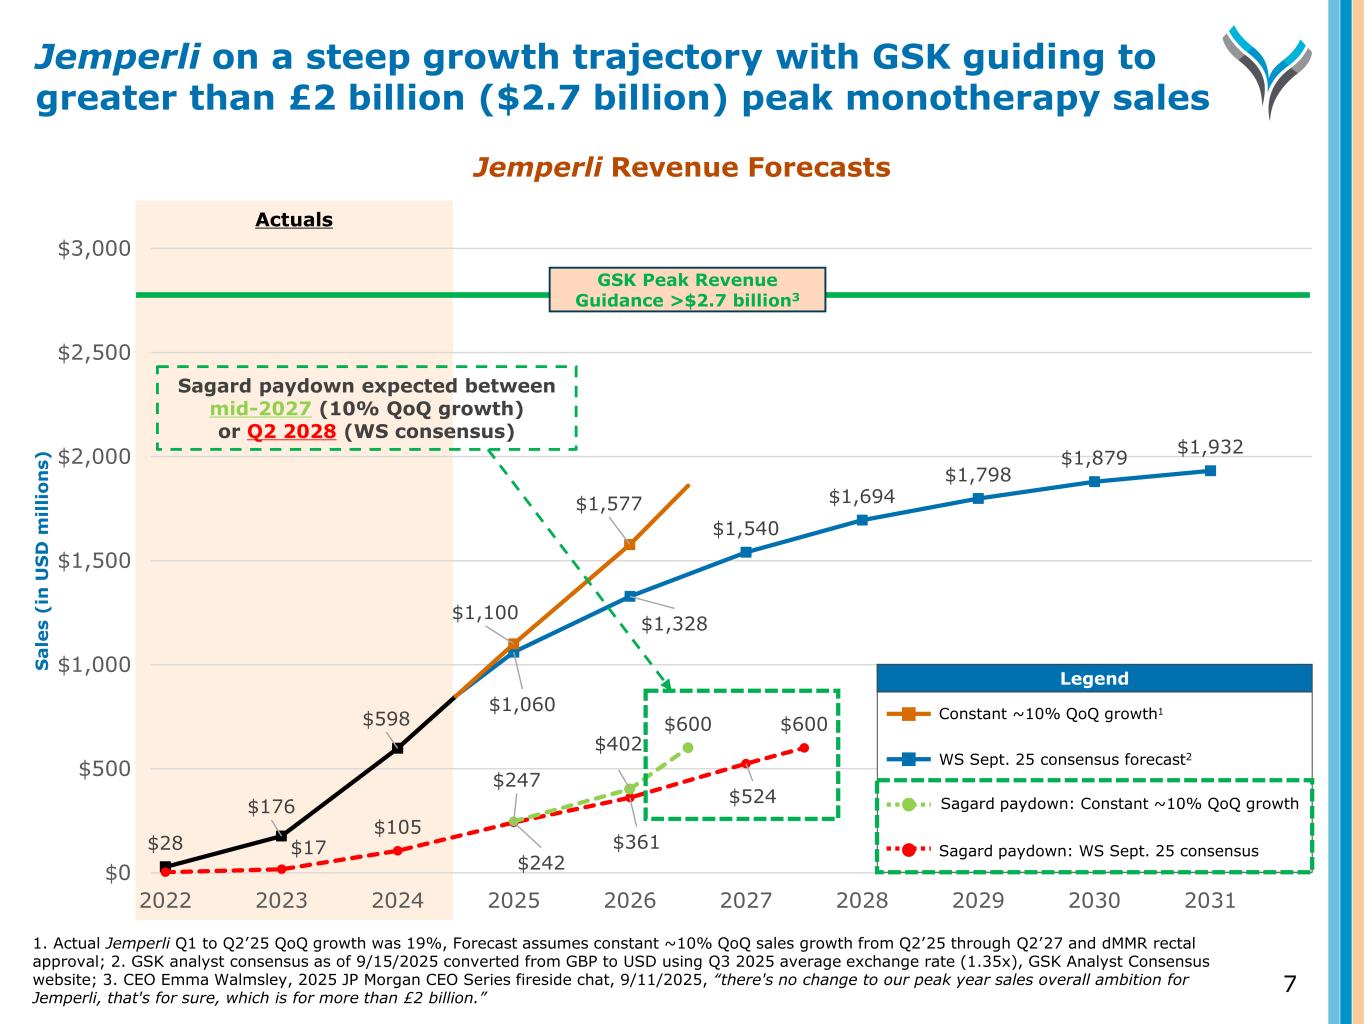
Actuals 1. Actual Jemperli Q1 to Q2’25 QoQ growth was 19%, Forecast assumes constant ~10% QoQ sales growth from Q2’25 through Q2’27 and dMMR rectal approval; 2. GSK analyst consensus as of 9/15/2025 converted from GBP to USD using Q3 2025 average exchange rate (1.35x), GSK Analyst Consensus website; 3. CEO Emma Walmsley, 2025 JP Morgan CEO Series fireside chat, 9/11/2025, “there's no change to our peak year sales overall ambition for Jemperli, that's for sure, which is for more than £2 billion.” Jemperli on a steep growth trajectory with GSK guiding to greater than £2 billion ($2.7 billion) peak monotherapy sales 7 Jemperli Revenue Forecasts $28 $176 $598 $1,060 $1,328 $1,540 $1,694 $1,798 $1,879 $1,932 $17 $105 $242 $361 $524 $600 $1,100 $1,577 $247 $402 $600 $0 $500 $1,000 $1,500 $2,000 $2,500 $3,000 2022 2023 2024 2025 2026 2027 2028 2029 2030 2031 S a le s (i n U S D m il li o n s) Legend Legend Constant ~10% QoQ growth1 WS Sept. 25 consensus forecast2 Sagard paydown: Constant ~10% QoQ growth Sagard paydown: WS Sept. 25 consensus Sagard paydown expected between mid-2027 (10% QoQ growth) or Q2 2028 (WS consensus) GSK Peak Revenue Guidance >$2.7 billion3
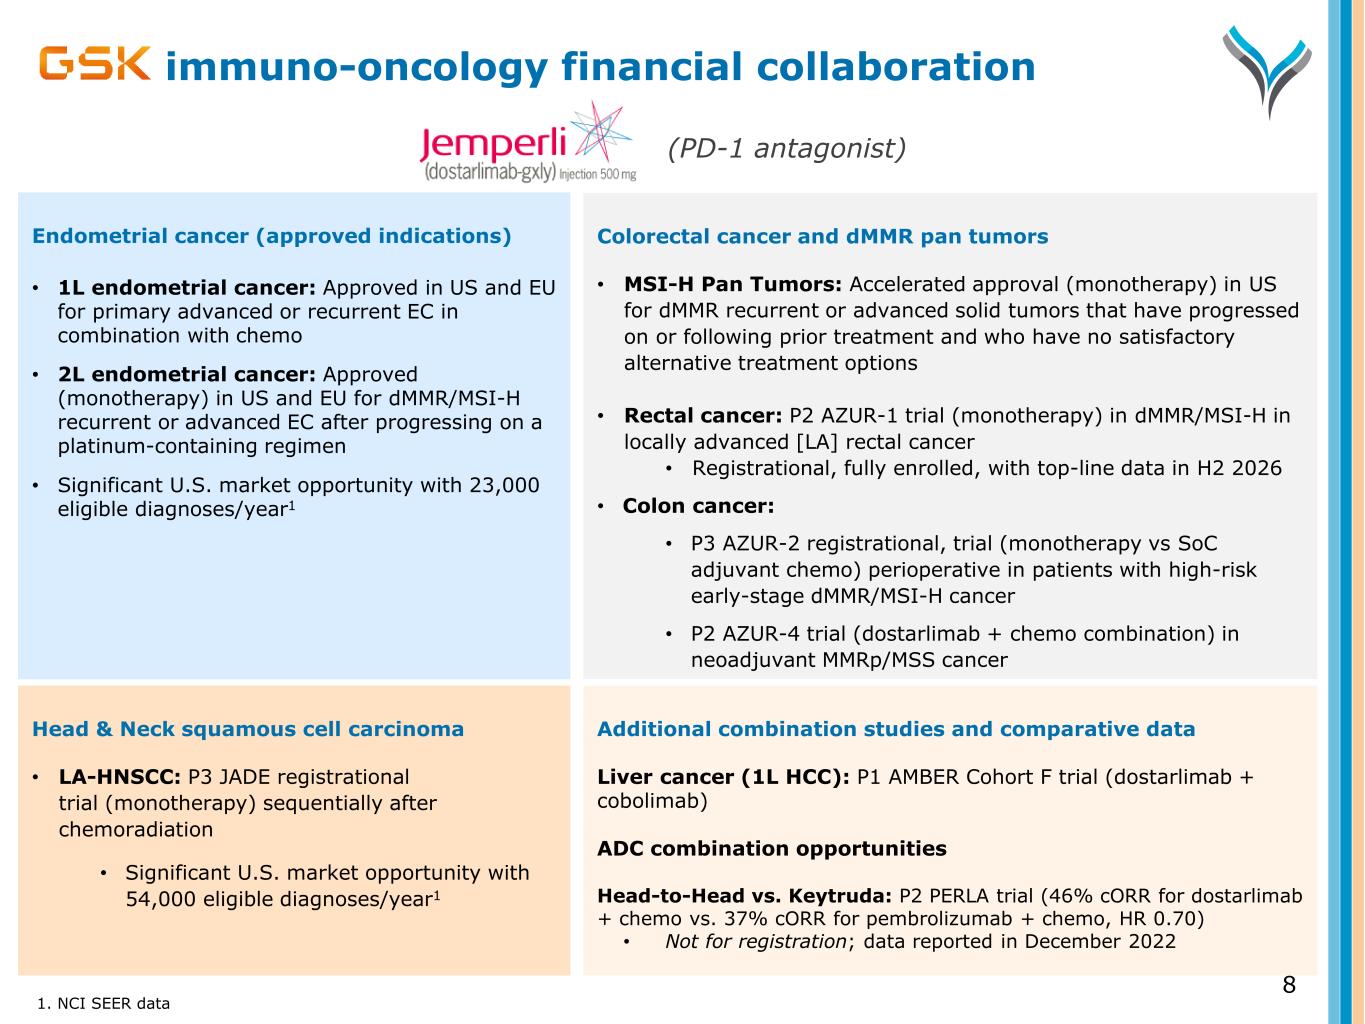
Head & Neck squamous cell carcinoma • LA-HNSCC: P3 JADE registrational trial (monotherapy) sequentially after chemoradiation • Significant U.S. market opportunity with 54,000 eligible diagnoses/year1 immuno-oncology financial collaboration Colorectal cancer and dMMR pan tumors • MSI-H Pan Tumors: Accelerated approval (monotherapy) in US for dMMR recurrent or advanced solid tumors that have progressed on or following prior treatment and who have no satisfactory alternative treatment options • Rectal cancer: P2 AZUR-1 trial (monotherapy) in dMMR/MSI-H in locally advanced [LA] rectal cancer • Registrational, fully enrolled, with top-line data in H2 2026 • Colon cancer: • P3 AZUR-2 registrational, trial (monotherapy vs SoC adjuvant chemo) perioperative in patients with high-risk early-stage dMMR/MSI-H cancer • P2 AZUR-4 trial (dostarlimab + chemo combination) in neoadjuvant MMRp/MSS cancer 1. NCI SEER data 8 Endometrial cancer (approved indications) • 1L endometrial cancer: Approved in US and EU for primary advanced or recurrent EC in combination with chemo • 2L endometrial cancer: Approved (monotherapy) in US and EU for dMMR/MSI-H recurrent or advanced EC after progressing on a platinum-containing regimen • Significant U.S. market opportunity with 23,000 eligible diagnoses/year1 (PD-1 antagonist) Additional combination studies and comparative data Liver cancer (1L HCC): P1 AMBER Cohort F trial (dostarlimab + cobolimab) ADC combination opportunities Head-to-Head vs. Keytruda: P2 PERLA trial (46% cORR for dostarlimab + chemo vs. 37% cORR for pembrolizumab + chemo, HR 0.70) • Not for registration; data reported in December 2022
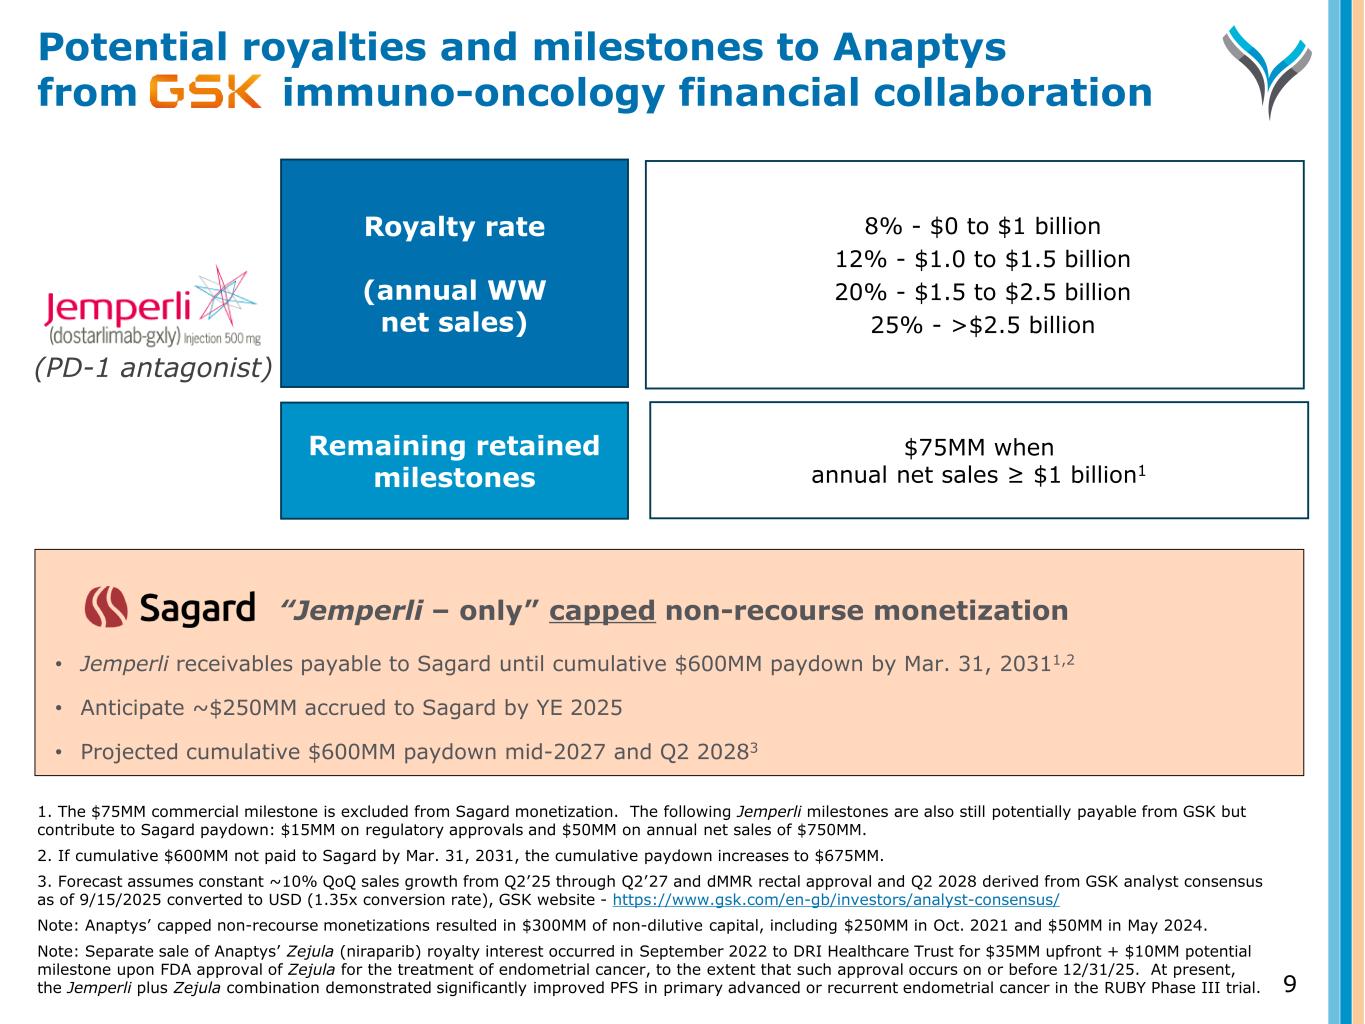
“Jemperli – only” capped non-recourse monetization • Jemperli receivables payable to Sagard until cumulative $600MM paydown by Mar. 31, 20311,2 • Anticipate ~$250MM accrued to Sagard by YE 2025 • Projected cumulative $600MM paydown mid-2027 and Q2 20283 Potential royalties and milestones to Anaptys from immuno-oncology financial collaboration 9 1. The $75MM commercial milestone is excluded from Sagard monetization. The following Jemperli milestones are also still potentially payable from GSK but contribute to Sagard paydown: $15MM on regulatory approvals and $50MM on annual net sales of $750MM. 2. If cumulative $600MM not paid to Sagard by Mar. 31, 2031, the cumulative paydown increases to $675MM. 3. Forecast assumes constant ~10% QoQ sales growth from Q2’25 through Q2’27 and dMMR rectal approval and Q2 2028 derived from GSK analyst consensus as of 9/15/2025 converted to USD (1.35x conversion rate), GSK website - https://www.gsk.com/en-gb/investors/analyst-consensus/ Note: Anaptys’ capped non-recourse monetizations resulted in $300MM of non-dilutive capital, including $250MM in Oct. 2021 and $50MM in May 2024. Note: Separate sale of Anaptys’ Zejula (niraparib) royalty interest occurred in September 2022 to DRI Healthcare Trust for $35MM upfront + $10MM potential milestone upon FDA approval of Zejula for the treatment of endometrial cancer, to the extent that such approval occurs on or before 12/31/25. At present, the Jemperli plus Zejula combination demonstrated significantly improved PFS in primary advanced or recurrent endometrial cancer in the RUBY Phase III trial. (PD-1 antagonist) Royalty rate (annual WW net sales) Remaining retained milestones 8% - $0 to $1 billion 12% - $1.0 to $1.5 billion 20% - $1.5 to $2.5 billion 25% - >$2.5 billion $75MM when annual net sales ≥ $1 billion1
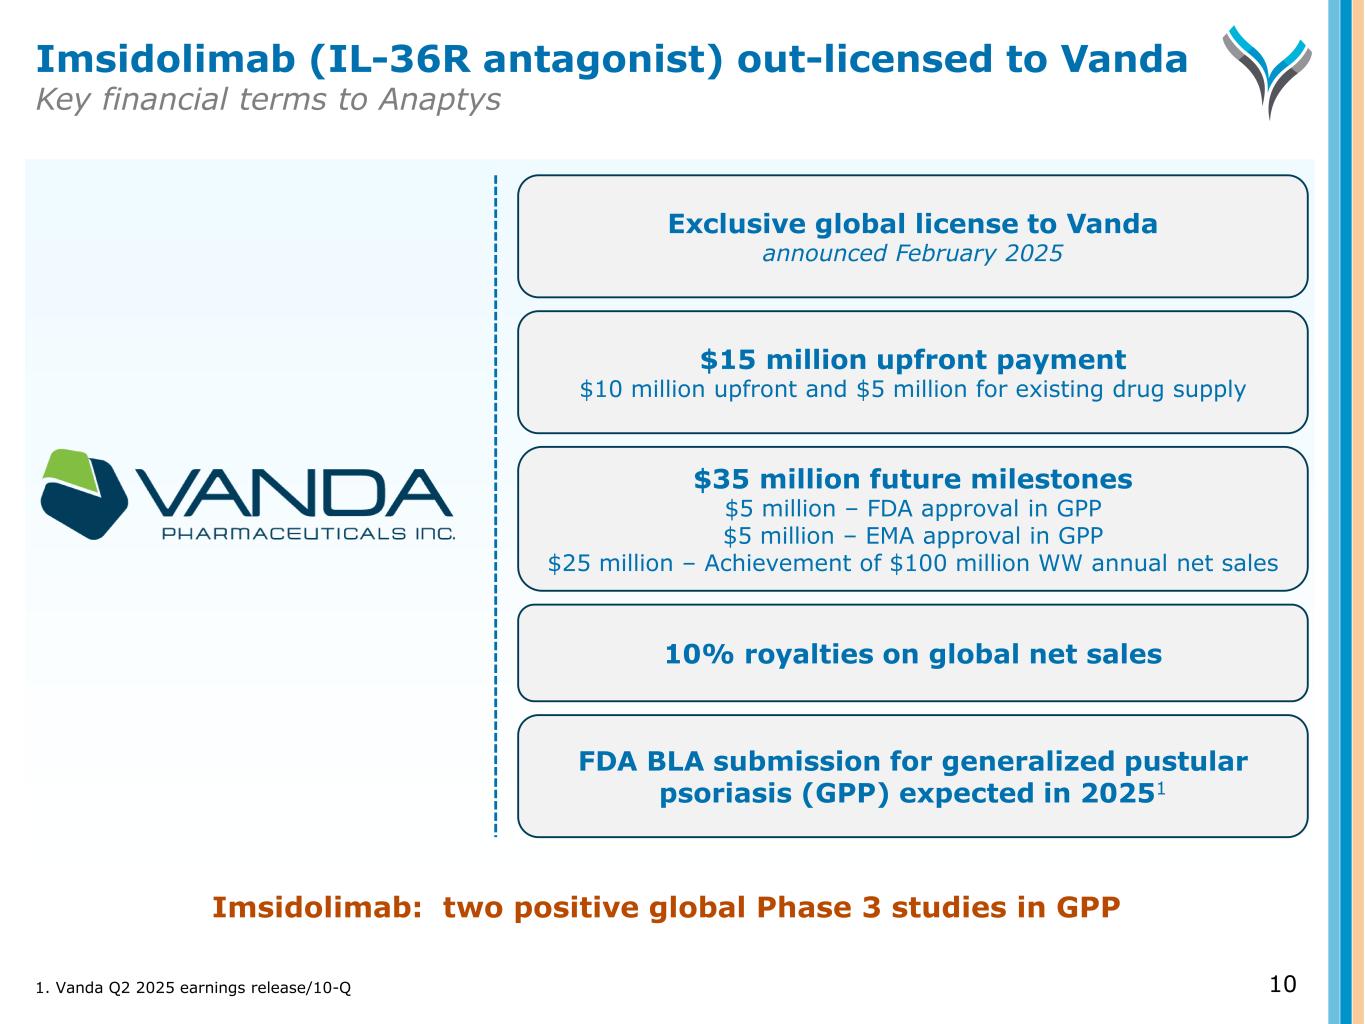
10 Exclusive global license to Vanda announced February 2025 $15 million upfront payment $10 million upfront and $5 million for existing drug supply 10% royalties on global net sales FDA BLA submission for generalized pustular psoriasis (GPP) expected in 20251 Imsidolimab: two positive global Phase 3 studies in GPP Imsidolimab (IL-36R antagonist) out-licensed to Vanda Key financial terms to Anaptys $35 million future milestones $5 million – FDA approval in GPP $5 million – EMA approval in GPP $25 million – Achievement of $100 million WW annual net sales 1. Vanda Q2 2025 earnings release/10-Q
(Pathogenic T Cell Depleter) Rosnilimab
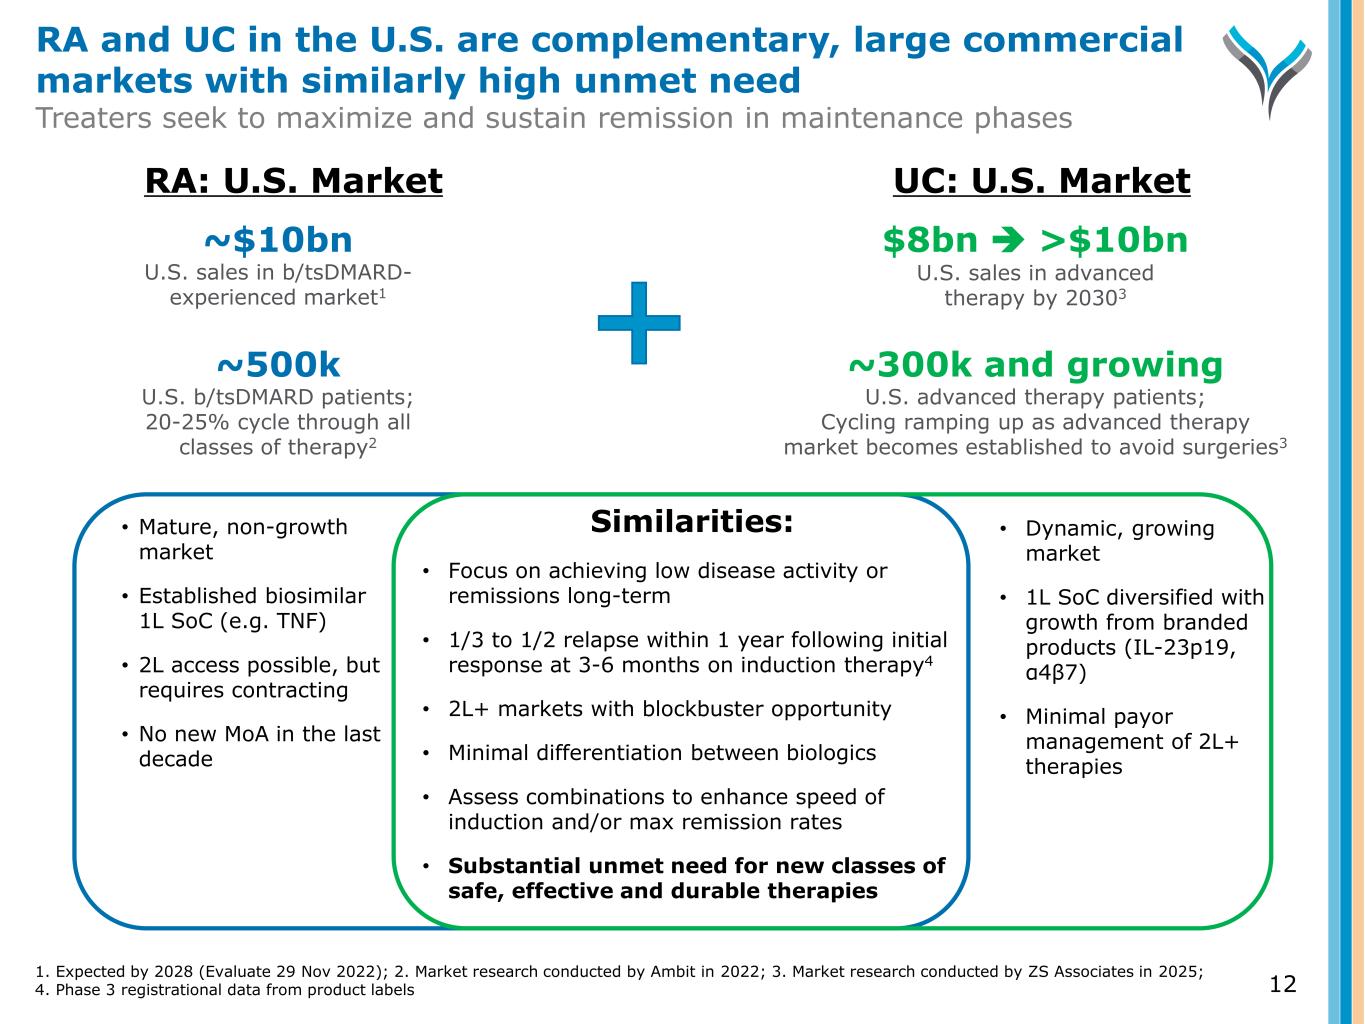
Similarities: • Focus on achieving low disease activity or remissions long-term • 1/3 to 1/2 relapse within 1 year following initial response at 3-6 months on induction therapy4 • 2L+ markets with blockbuster opportunity • Minimal differentiation between biologics • Assess combinations to enhance speed of induction and/or max remission rates • Substantial unmet need for new classes of safe, effective and durable therapies • Mature, non-growth market • Established biosimilar 1L SoC (e.g. TNF) • 2L access possible, but requires contracting • No new MoA in the last decade • Dynamic, growing market • 1L SoC diversified with growth from branded products (IL-23p19, α4β7) • Minimal payor management of 2L+ therapies ~$10bn U.S. sales in b/tsDMARD- experienced market1 $8bn >$10bn U.S. sales in advanced therapy by 20303 ~500k U.S. b/tsDMARD patients; 20-25% cycle through all classes of therapy2 ~300k and growing U.S. advanced therapy patients; Cycling ramping up as advanced therapy market becomes established to avoid surgeries3 RA: U.S. Market UC: U.S. Market 1. Expected by 2028 (Evaluate 29 Nov 2022); 2. Market research conducted by Ambit in 2022; 3. Market research conducted by ZS Associates in 2025; 4. Phase 3 registrational data from product labels RA and UC in the U.S. are complementary, large commercial markets with similarly high unmet need Treaters seek to maximize and sustain remission in maintenance phases 12
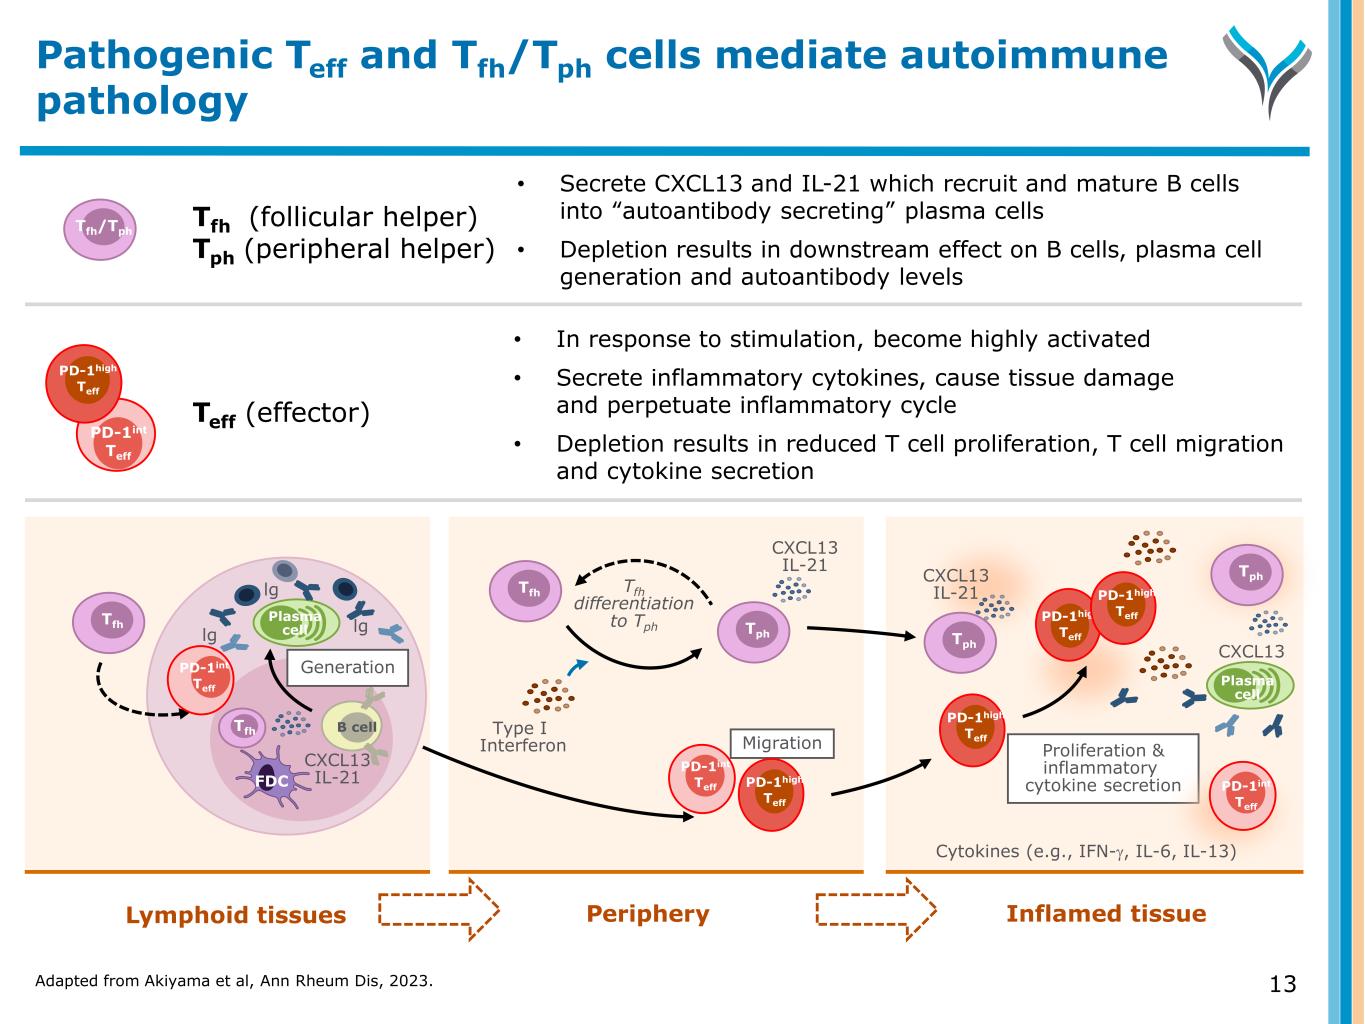
Adapted from Akiyama et al, Ann Rheum Dis, 2023. 13 Pathogenic Teff and Tfh/Tph cells mediate autoimmune pathology Lymphoid tissues Periphery Inflamed tissue 13 B cell Tfh Plasma celllg lg lg Tfh FDC Generation CXCL13 IL-21 Tfh Type I Interferon CXCL13 IL-21 Proliferation & inflammatory cytokine secretion Cytokines (e.g., IFN-γ, IL-6, IL-13) CXCL13 IL-21 CXCL13 Plasma cell Tfh (follicular helper) Tph (peripheral helper) • In response to stimulation, become highly activated • Secrete inflammatory cytokines, cause tissue damage and perpetuate inflammatory cycle • Depletion results in reduced T cell proliferation, T cell migration and cytokine secretion Tfh/Tph • Secrete CXCL13 and IL-21 which recruit and mature B cells into “autoantibody secreting” plasma cells • Depletion results in downstream effect on B cells, plasma cell generation and autoantibody levels Teff (effector) Migration Tfh differentiation to Tph Tph Tph Tph PD-1int Teff PD-1int Teff PD-1high Teff PD-1high Teff PD-1high Teff PD-1high Teff PD-1int Teff PD-1int Teff PD-1high Teff
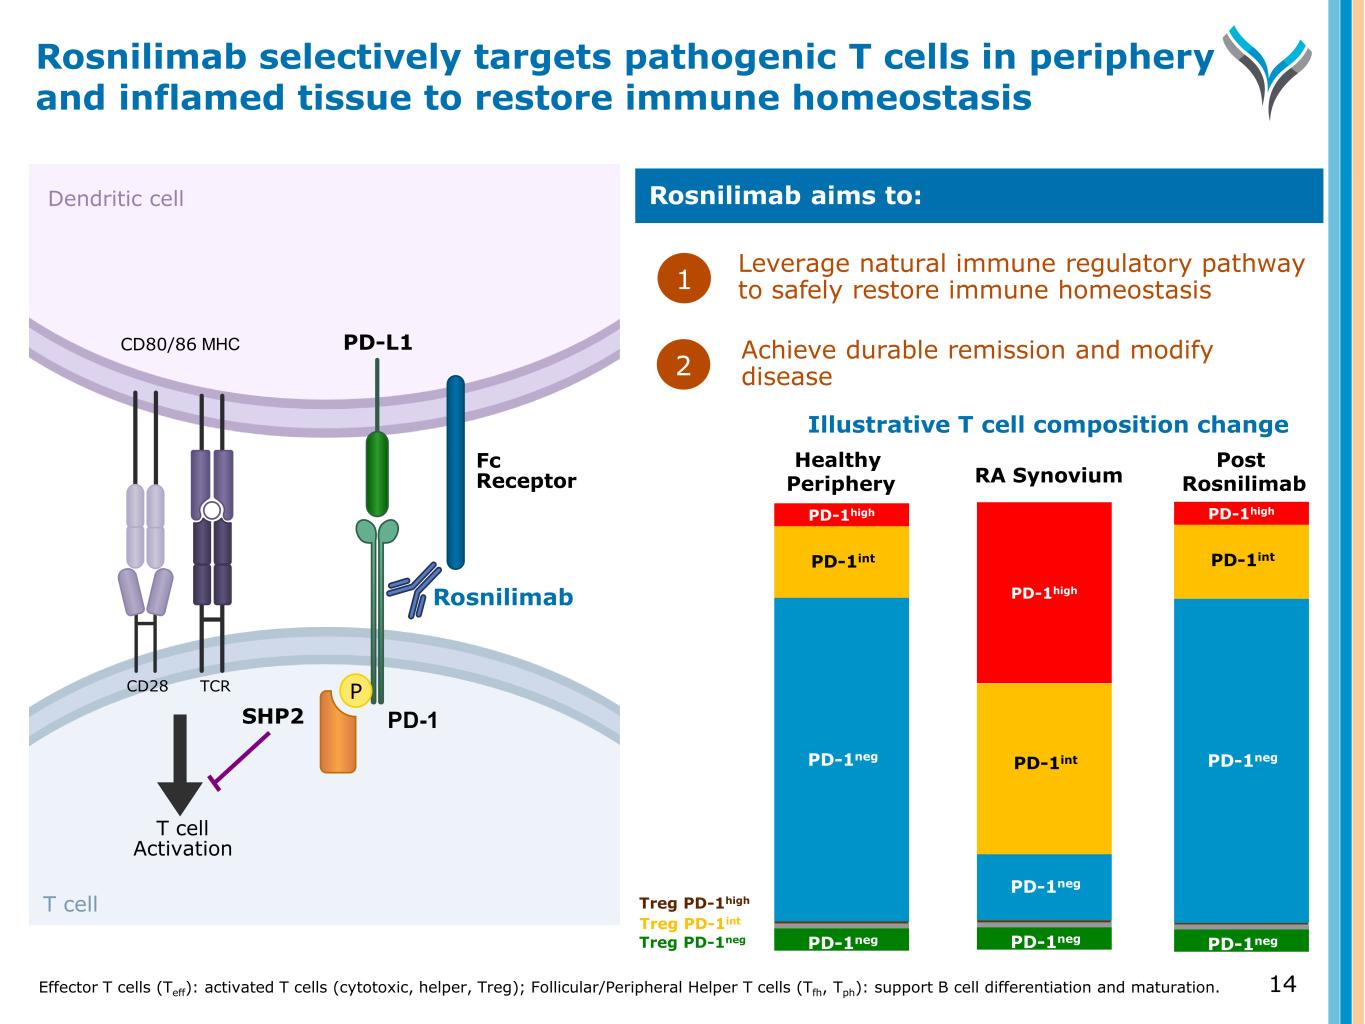
14 Dendritic cell T cell T cell Activation MHCCD80/86 SHP2 TCRCD28 P PD-1 PD-L1 Rosnilimab Fc Receptor Leverage natural immune regulatory pathway to safely restore immune homeostasis1 Rosnilimab aims to: Achieve durable remission and modify disease Rosnilimab selectively targets pathogenic T cells in periphery and inflamed tissue to restore immune homeostasis Effector T cells (Teff): activated T cells (cytotoxic, helper, Treg); Follicular/Peripheral Helper T cells (Tfh, Tph): support B cell differentiation and maturation. 2 PD-1neg PD-1neg PD-1neg PD-1int PD-1high PD-1neg PD-1negPD-1neg PD-1int PD-1high PD-1int PD-1high PD-1neg PD-1neg Treg PD-1int Treg PD-1high Treg PD-1neg Illustrative T cell composition change Healthy Periphery RA Synovium Post Rosnilimab
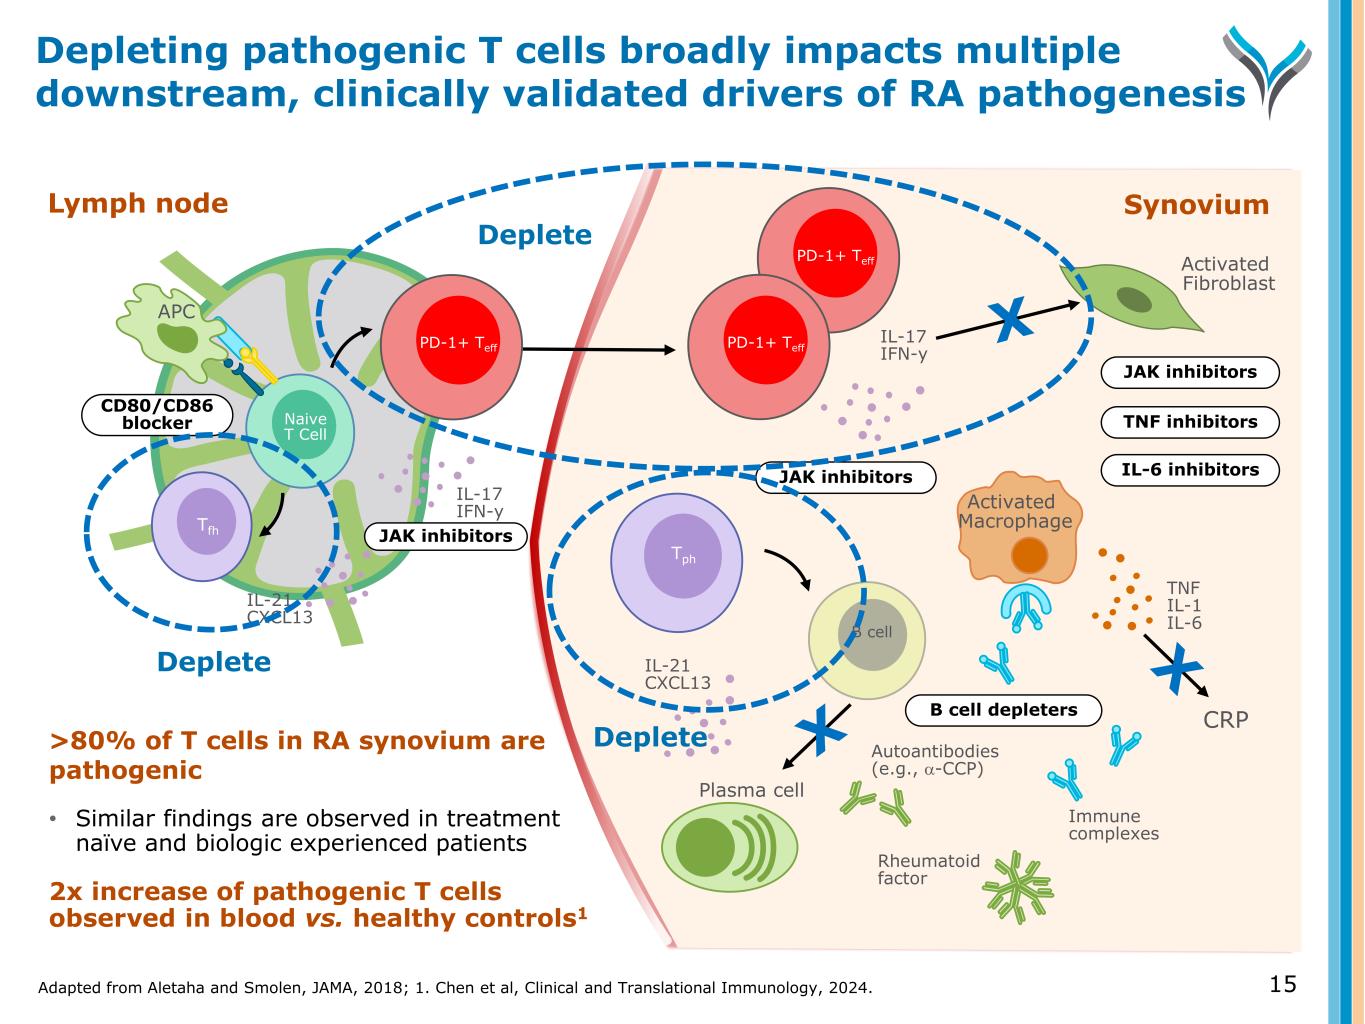
Adapted from Aletaha and Smolen, JAMA, 2018; 1. Chen et al, Clinical and Translational Immunology, 2024. 15 Depleting pathogenic T cells broadly impacts multiple downstream, clinically validated drivers of RA pathogenesis >80% of T cells in RA synovium are pathogenic • Similar findings are observed in treatment naïve and biologic experienced patients 2x increase of pathogenic T cells observed in blood vs. healthy controls1 Naive T Cell IL-17 IFN-y IL-21 CXCL13 APC Tfh Lymph node CD80/CD86 blocker JAK inhibitors Synovium Tph Activated Macrophage Activated Fibroblast TNF IL-1 IL-6B cell IL-21 CXCL13 Plasma cell Autoantibodies (e.g., α-CCP) Immune complexes Rheumatoid factor B cell depleters IL-6 inhibitors TNF inhibitors JAK inhibitors JAK inhibitors IL-17 IFN-y PD-1+ Teff PD-1+ TeffPD-1+ Teff Deplete Deplete Deplete CRP
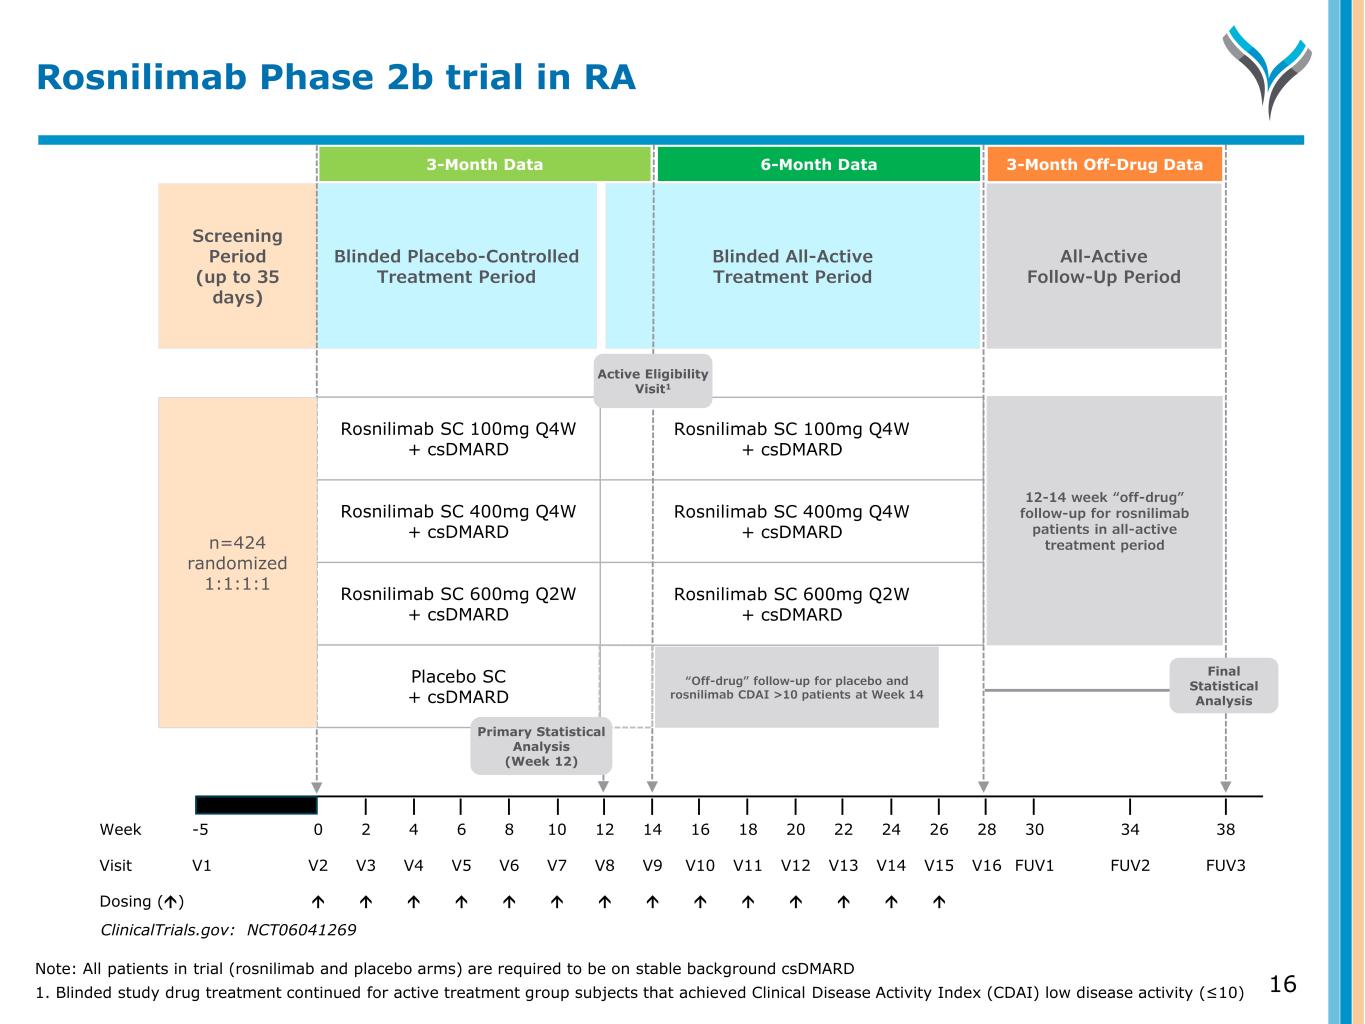
16 Screening Period (up to 35 days) Blinded Placebo-Controlled Treatment Period All-Active Follow-Up Period Blinded All-Active Treatment Period Week -5 0 2 4 6 8 10 12 14 16 18 20 22 24 26 28 30 34 38 Visit V1 V2 V3 V4 V5 V6 V7 V8 V9 V10 V11 V12 V13 V14 V15 V16 FUV1 FUV2 FUV3 Dosing () Rosnilimab SC 100mg Q4W + csDMARD Rosnilimab SC 400mg Q4W + csDMARD Rosnilimab SC 600mg Q2W + csDMARD Placebo SC + csDMARD Rosnilimab SC 100mg Q4W + csDMARD Rosnilimab SC 400mg Q4W + csDMARD Rosnilimab SC 600mg Q2W + csDMARD n=424 randomized 1:1:1:1 Final Statistical Analysis Active Eligibility Visit1 ClinicalTrials.gov: NCT06041269 Rosnilimab Phase 2b trial in RA “Off-drug” follow-up for placebo and rosnilimab CDAI >10 patients at Week 14 Primary Statistical Analysis (Week 12) 3-Month Data 6-Month Data 3-Month Off-Drug Data 12-14 week “off-drug” follow-up for rosnilimab patients in all-active treatment period Note: All patients in trial (rosnilimab and placebo arms) are required to be on stable background csDMARD 1. Blinded study drug treatment continued for active treatment group subjects that achieved Clinical Disease Activity Index (CDAI) low disease activity (≤10)
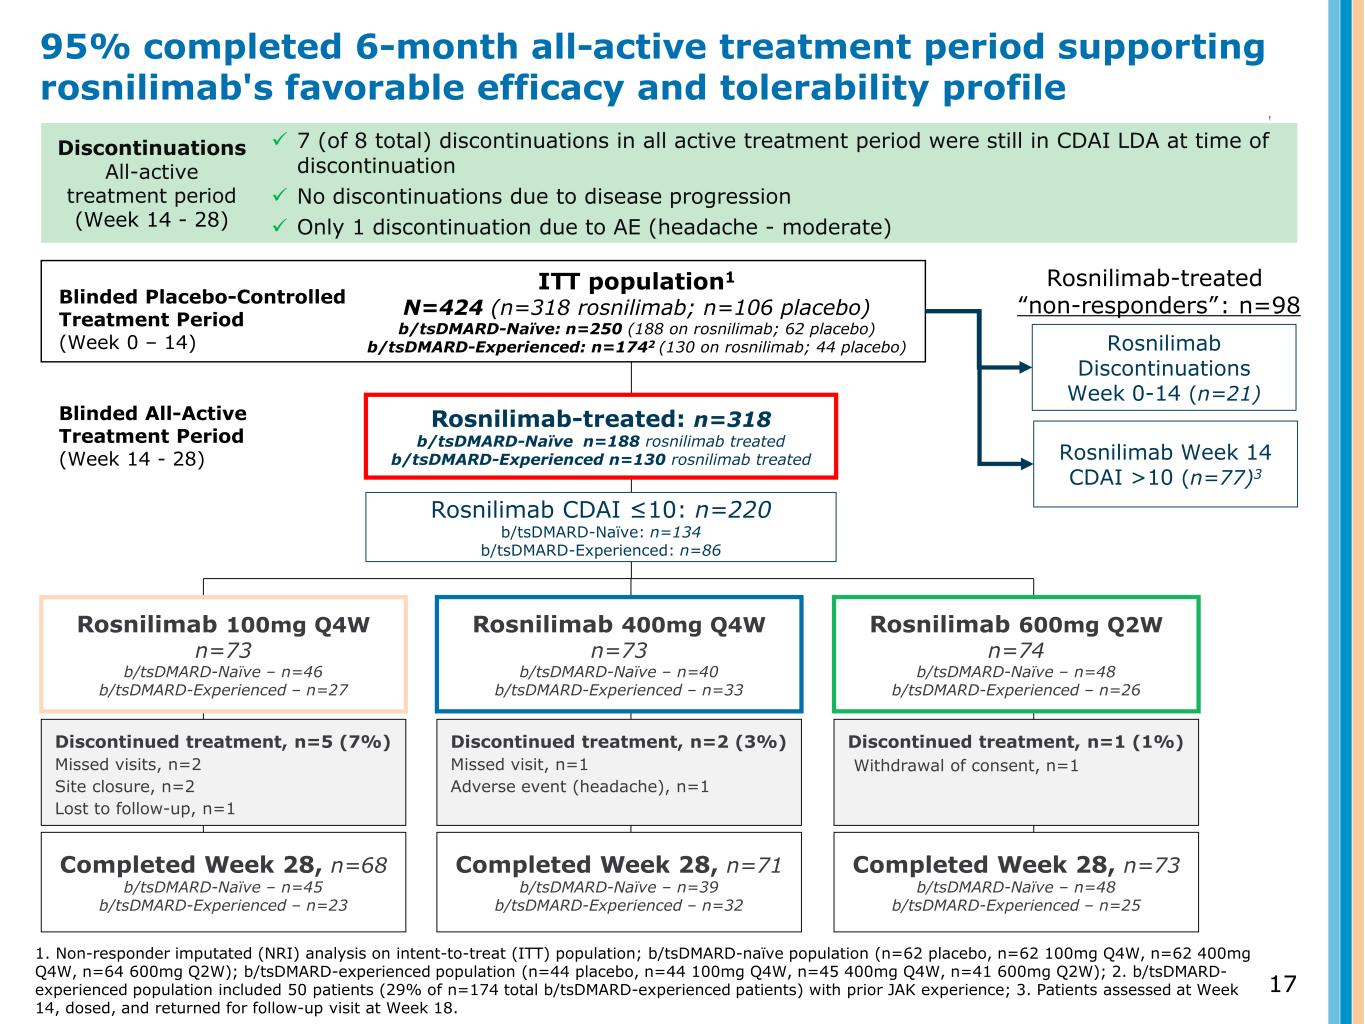
Rosnilimab-treated: n=318 b/tsDMARD-Naïve n=188 rosnilimab treated b/tsDMARD-Experienced n=130 rosnilimab treated 17 ITT population1 N=424 (n=318 rosnilimab; n=106 placebo) b/tsDMARD-Naïve: n=250 (188 on rosnilimab; 62 placebo) b/tsDMARD-Experienced: n=1742 (130 on rosnilimab; 44 placebo) Discontinued treatment, n=5 (7%) Missed visits, n=2 Site closure, n=2 Lost to follow-up, n=1 Completed Week 28, n=68 b/tsDMARD-Naïve – n=45 b/tsDMARD-Experienced – n=23 Discontinued treatment, n=2 (3%) Missed visit, n=1 Adverse event (headache), n=1 Completed Week 28, n=71 b/tsDMARD-Naïve – n=39 b/tsDMARD-Experienced – n=32 Discontinued treatment, n=1 (1%) Withdrawal of consent, n=1 Completed Week 28, n=73 b/tsDMARD-Naïve – n=48 b/tsDMARD-Experienced – n=25 Blinded Placebo-Controlled Treatment Period (Week 0 – 14) Blinded All-Active Treatment Period (Week 14 - 28) Rosnilimab Week 14 CDAI >10 (n=77)3 Discontinuations All-active treatment period (Week 14 - 28) 7 (of 8 total) discontinuations in all active treatment period were still in CDAI LDA at time of discontinuation No discontinuations due to disease progression Only 1 discontinuation due to AE (headache - moderate) 95% completed 6-month all-active treatment period supporting rosnilimab's favorable efficacy and tolerability profile 1. Non-responder imputated (NRI) analysis on intent-to-treat (ITT) population; b/tsDMARD-naïve population (n=62 placebo, n=62 100mg Q4W, n=62 400mg Q4W, n=64 600mg Q2W); b/tsDMARD-experienced population (n=44 placebo, n=44 100mg Q4W, n=45 400mg Q4W, n=41 600mg Q2W); 2. b/tsDMARD- experienced population included 50 patients (29% of n=174 total b/tsDMARD-experienced patients) with prior JAK experience; 3. Patients assessed at Week 14, dosed, and returned for follow-up visit at Week 18. Rosnilimab Discontinuations Week 0-14 (n=21) Rosnilimab CDAI ≤10: n=220 b/tsDMARD-Naïve: n=134 b/tsDMARD-Experienced: n=86 Rosnilimab-treated “non-responders”: n=98 Rosnilimab 100mg Q4W n=73 b/tsDMARD-Naïve – n=46 b/tsDMARD-Experienced – n=27 Rosnilimab 400mg Q4W n=73 b/tsDMARD-Naïve – n=40 b/tsDMARD-Experienced – n=33 Rosnilimab 600mg Q2W n=74 b/tsDMARD-Naïve – n=48 b/tsDMARD-Experienced – n=26
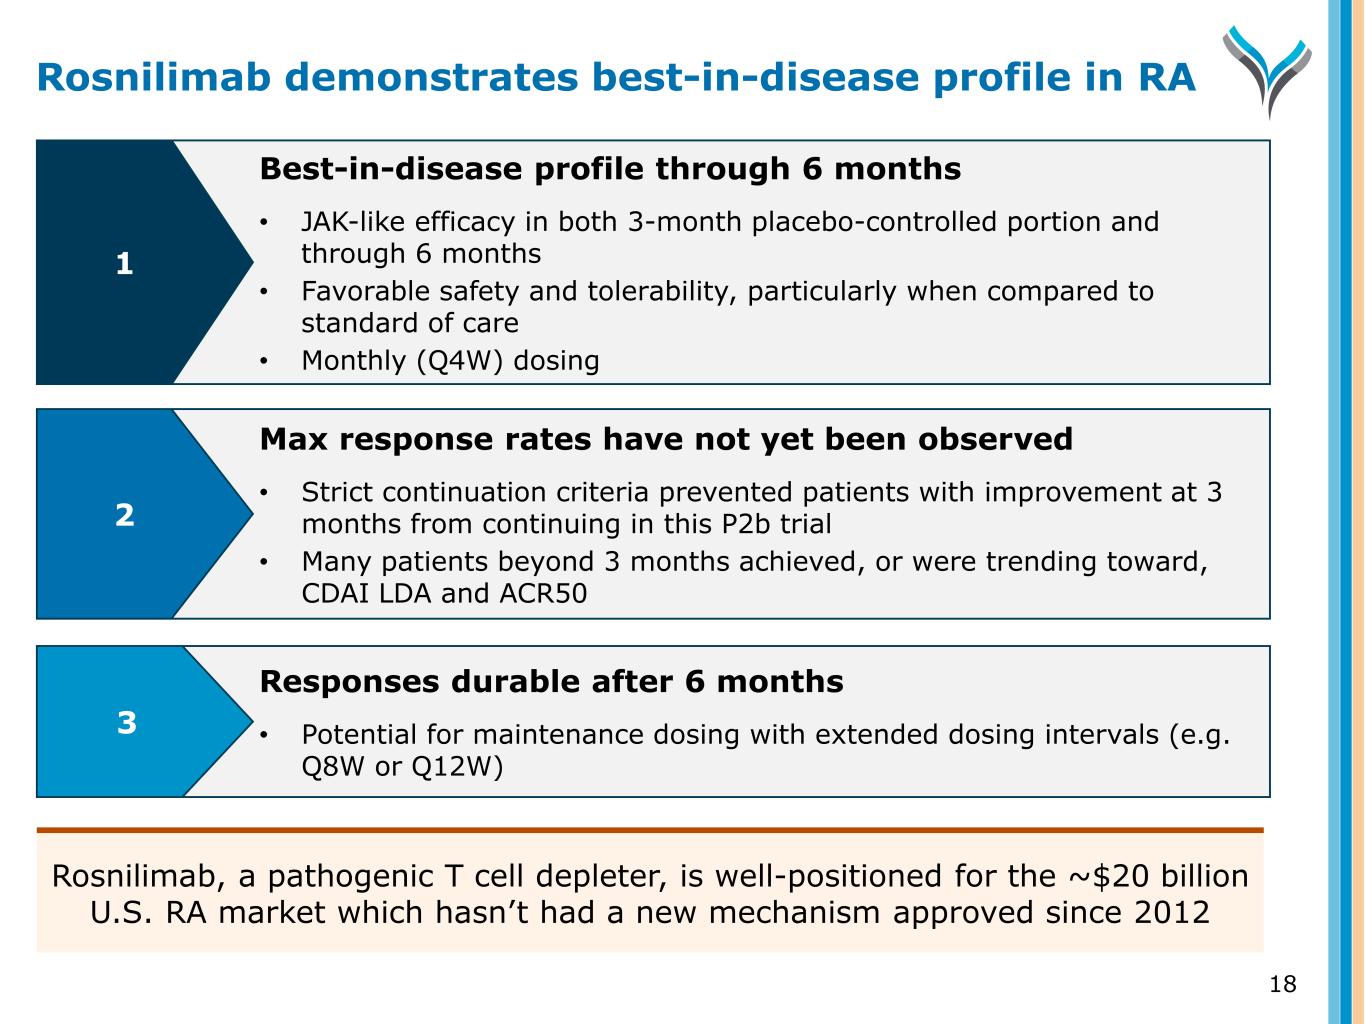
18 Responses durable after 6 months • Potential for maintenance dosing with extended dosing intervals (e.g. Q8W or Q12W) Best-in-disease profile through 6 months • JAK-like efficacy in both 3-month placebo-controlled portion and through 6 months • Favorable safety and tolerability, particularly when compared to standard of care • Monthly (Q4W) dosing Max response rates have not yet been observed • Strict continuation criteria prevented patients with improvement at 3 months from continuing in this P2b trial • Many patients beyond 3 months achieved, or were trending toward, CDAI LDA and ACR50 1 2 3 Rosnilimab demonstrates best-in-disease profile in RA Rosnilimab, a pathogenic T cell depleter, is well-positioned for the ~$20 billion U.S. RA market which hasn’t had a new mechanism approved since 2012
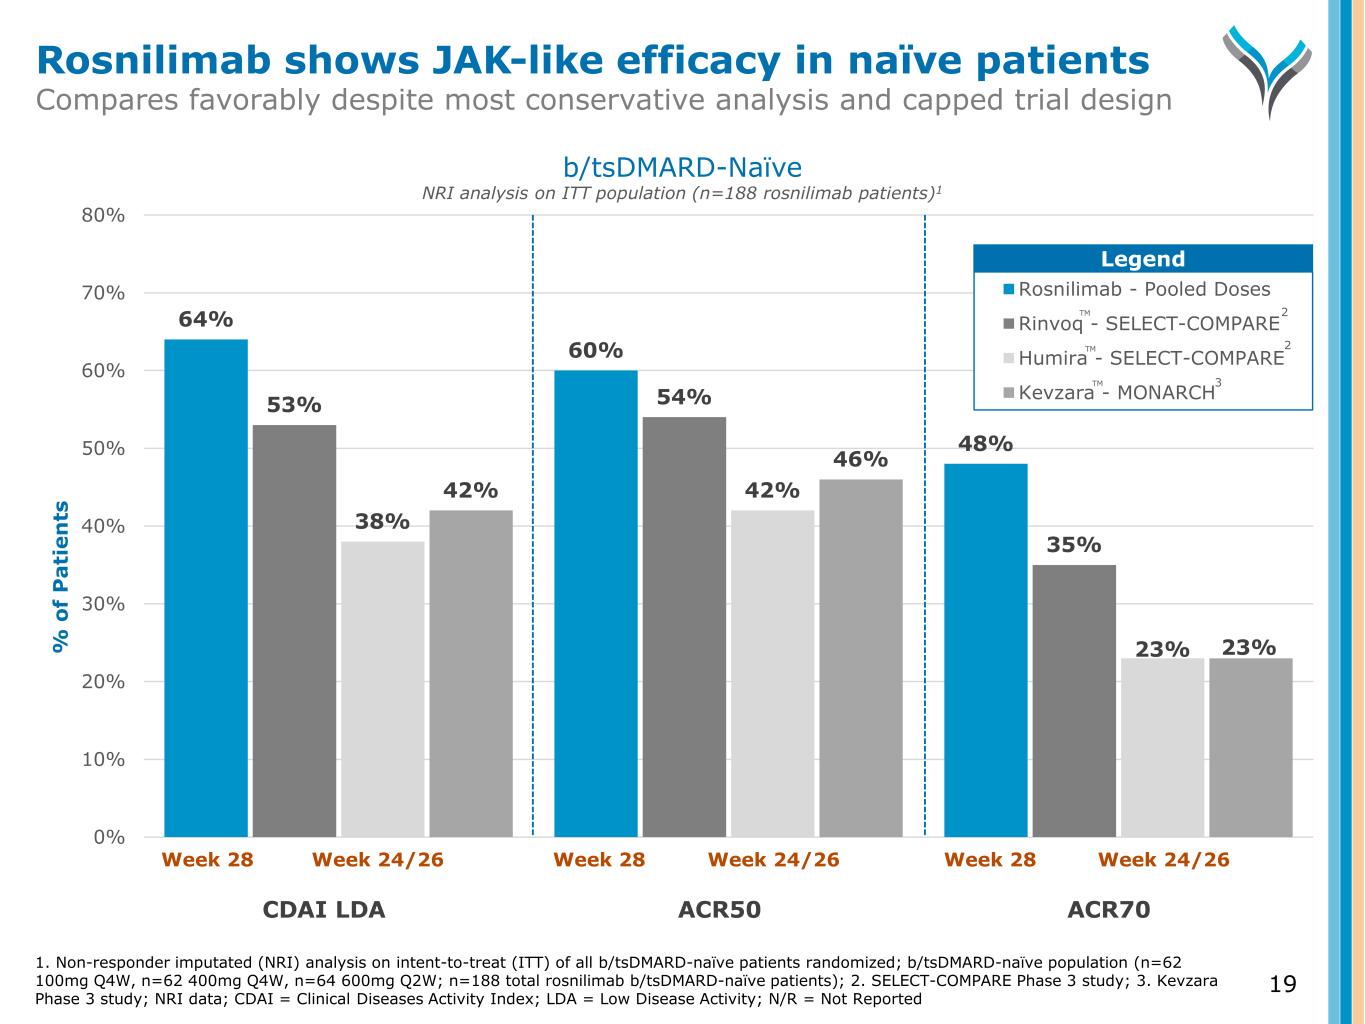
64% 60% 48% 53% 54% 35% 38% 42% 23% 42% 46% 23% 0% 10% 20% 30% 40% 50% 60% 70% 80% % o f P a ti e n ts Rosnilimab - Pooled Doses Rinvoq - SELECT-COMPARE Humira - SELECT-COMPARE Kevzara - MONARCH Week 28 Week 24/26 Week 28 Week 24/26 Week 28 Week 24/26 CDAI LDA ACR50 ACR70 1. Non-responder imputated (NRI) analysis on intent-to-treat (ITT) of all b/tsDMARD-naïve patients randomized; b/tsDMARD-naïve population (n=62 100mg Q4W, n=62 400mg Q4W, n=64 600mg Q2W; n=188 total rosnilimab b/tsDMARD-naïve patients); 2. SELECT-COMPARE Phase 3 study; 3. Kevzara Phase 3 study; NRI data; CDAI = Clinical Diseases Activity Index; LDA = Low Disease Activity; N/R = Not Reported b/tsDMARD-Naïve NRI analysis on ITT population (n=188 rosnilimab patients)1 Legend 2 3 2 Rosnilimab shows JAK-like efficacy in naïve patients Compares favorably despite most conservative analysis and capped trial design TM TM TM 19
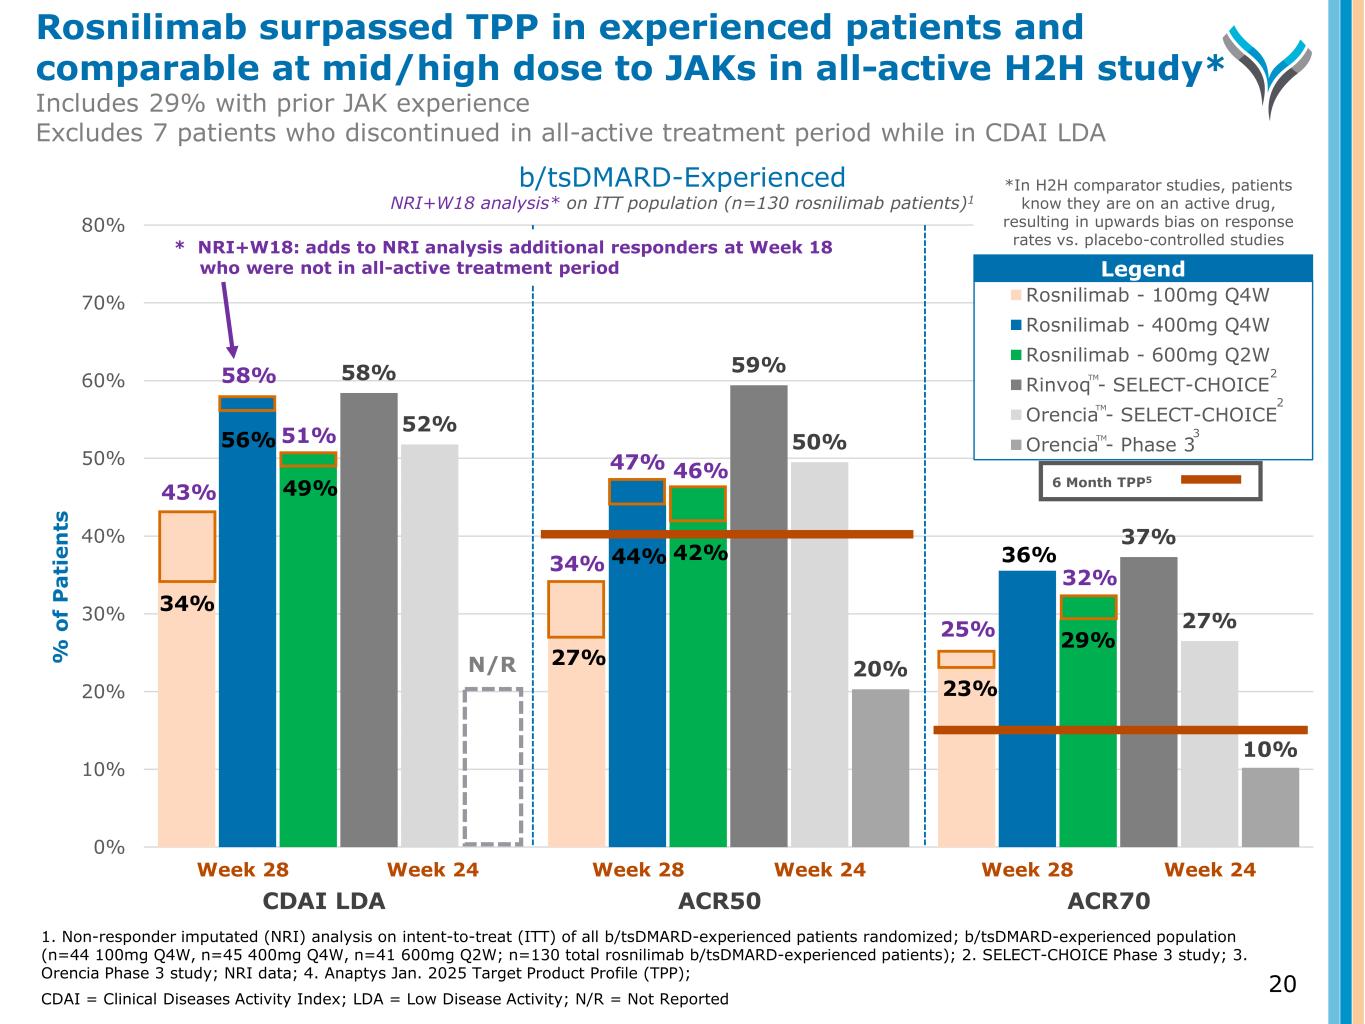
58% 59% 37% 52% 50% 27% 20% 10% 0% 10% 20% 30% 40% 50% 60% 70% 80% % o f P a ti e n ts Rosnilimab - 100mg Q4W Rosnilimab - 400mg Q4W Rosnilimab - 600mg Q2W Rinvoq - SELECT-CHOICE Orencia - SELECT-CHOICE Orencia - Phase 3 Week 28 Week 24 Week 28 Week 24 Week 28 Week 24 N/R 43% 56% 49% 27% 44% 42% 36% 29% 58% 51% 46%47% 34% 25% 32% 34% Legend b/tsDMARD-Experienced NRI+W18 analysis* on ITT population (n=130 rosnilimab patients)1 TM TM TM 6 Month TPP5 1. Non-responder imputated (NRI) analysis on intent-to-treat (ITT) of all b/tsDMARD-experienced patients randomized; b/tsDMARD-experienced population (n=44 100mg Q4W, n=45 400mg Q4W, n=41 600mg Q2W; n=130 total rosnilimab b/tsDMARD-experienced patients); 2. SELECT-CHOICE Phase 3 study; 3. Orencia Phase 3 study; NRI data; 4. Anaptys Jan. 2025 Target Product Profile (TPP); CDAI = Clinical Diseases Activity Index; LDA = Low Disease Activity; N/R = Not Reported * NRI+W18: adds to NRI analysis additional responders at Week 18 who were not in all-active treatment period 2 2 3 CDAI LDA ACR50 ACR70 23% *In H2H comparator studies, patients know they are on an active drug, resulting in upwards bias on response rates vs. placebo-controlled studies Rosnilimab surpassed TPP in experienced patients and comparable at mid/high dose to JAKs in all-active H2H study* Includes 29% with prior JAK experience Excludes 7 patients who discontinued in all-active treatment period while in CDAI LDA 20
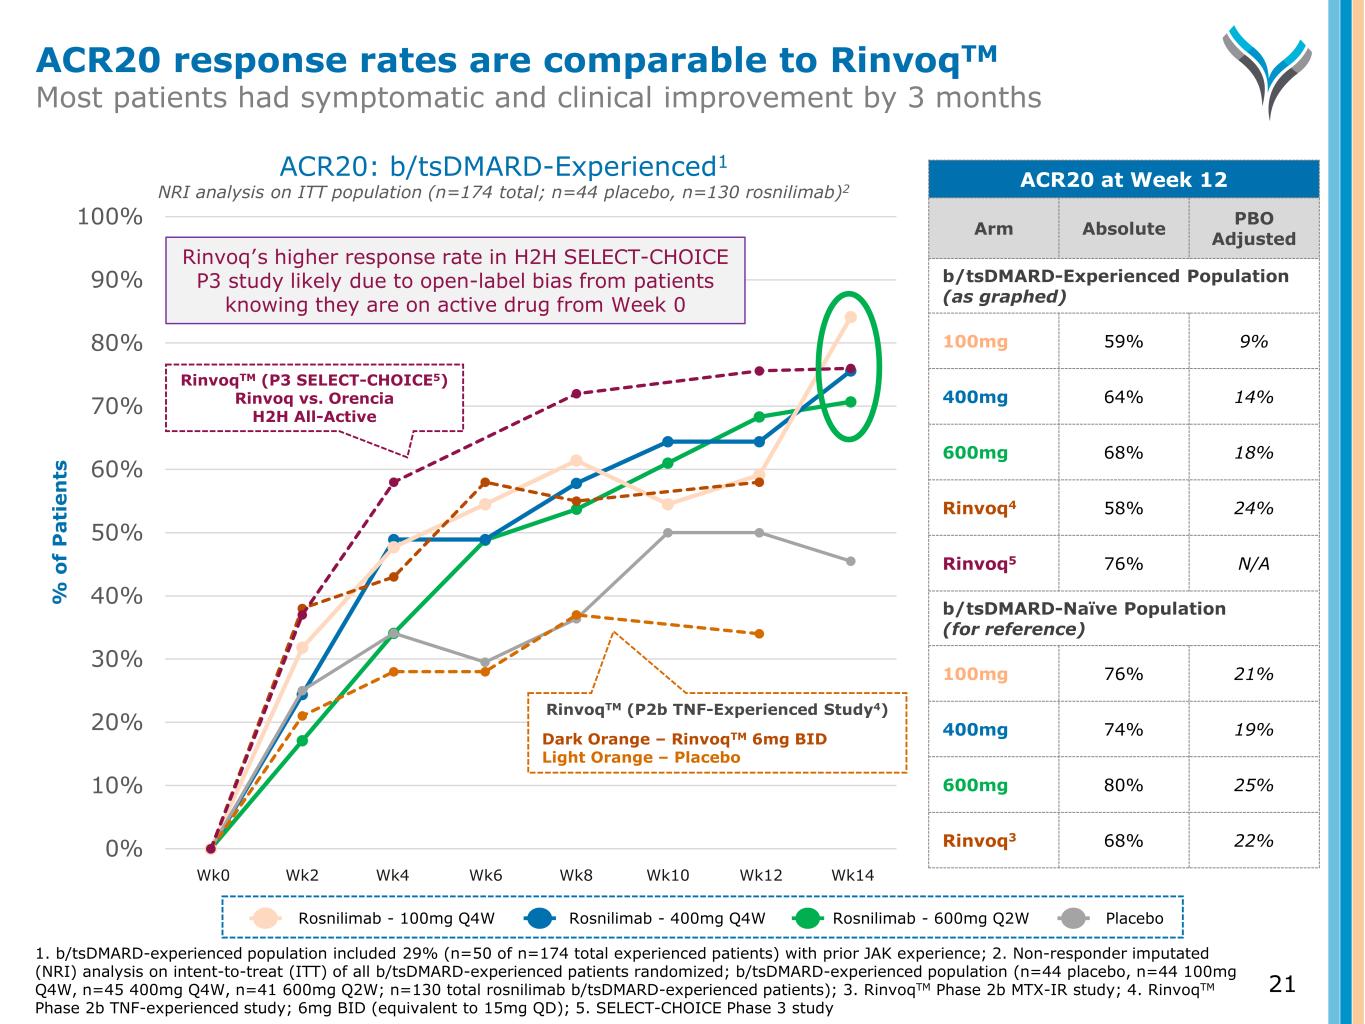
0% 10% 20% 30% 40% 50% 60% 70% 80% 90% 100% % o f P a ti e n ts RinvoqTM (P3 SELECT-CHOICE5) Rinvoq vs. Orencia H2H All-Active ACR20: b/tsDMARD-Experienced1 NRI analysis on ITT population (n=174 total; n=44 placebo, n=130 rosnilimab)2 ACR20 at Week 12 Arm Absolute PBO Adjusted b/tsDMARD-Experienced Population (as graphed) 100mg 59% 9% 400mg 64% 14% 600mg 68% 18% Rinvoq4 58% 24% Rinvoq5 76% N/A b/tsDMARD-Naïve Population (for reference) 100mg 76% 21% 400mg 74% 19% 600mg 80% 25% Rinvoq3 68% 22% Rinvoq’s higher response rate in H2H SELECT-CHOICE P3 study likely due to open-label bias from patients knowing they are on active drug from Week 0 Wk0 Wk2 Wk4 Wk6 Wk8 Wk10 Wk12 Wk14 RinvoqTM (P2b TNF-Experienced Study4) Dark Orange – RinvoqTM 6mg BID Light Orange – Placebo ACR20 response rates are comparable to RinvoqTM Most patients had symptomatic and clinical improvement by 3 months Rosnilimab - 100mg Q4W Rosnilimab - 400mg Q4W Rosnilimab - 600mg Q2W Placebo 1. b/tsDMARD-experienced population included 29% (n=50 of n=174 total experienced patients) with prior JAK experience; 2. Non-responder imputated (NRI) analysis on intent-to-treat (ITT) of all b/tsDMARD-experienced patients randomized; b/tsDMARD-experienced population (n=44 placebo, n=44 100mg Q4W, n=45 400mg Q4W, n=41 600mg Q2W; n=130 total rosnilimab b/tsDMARD-experienced patients); 3. RinvoqTM Phase 2b MTX-IR study; 4. RinvoqTM Phase 2b TNF-experienced study; 6mg BID (equivalent to 15mg QD); 5. SELECT-CHOICE Phase 3 study 21
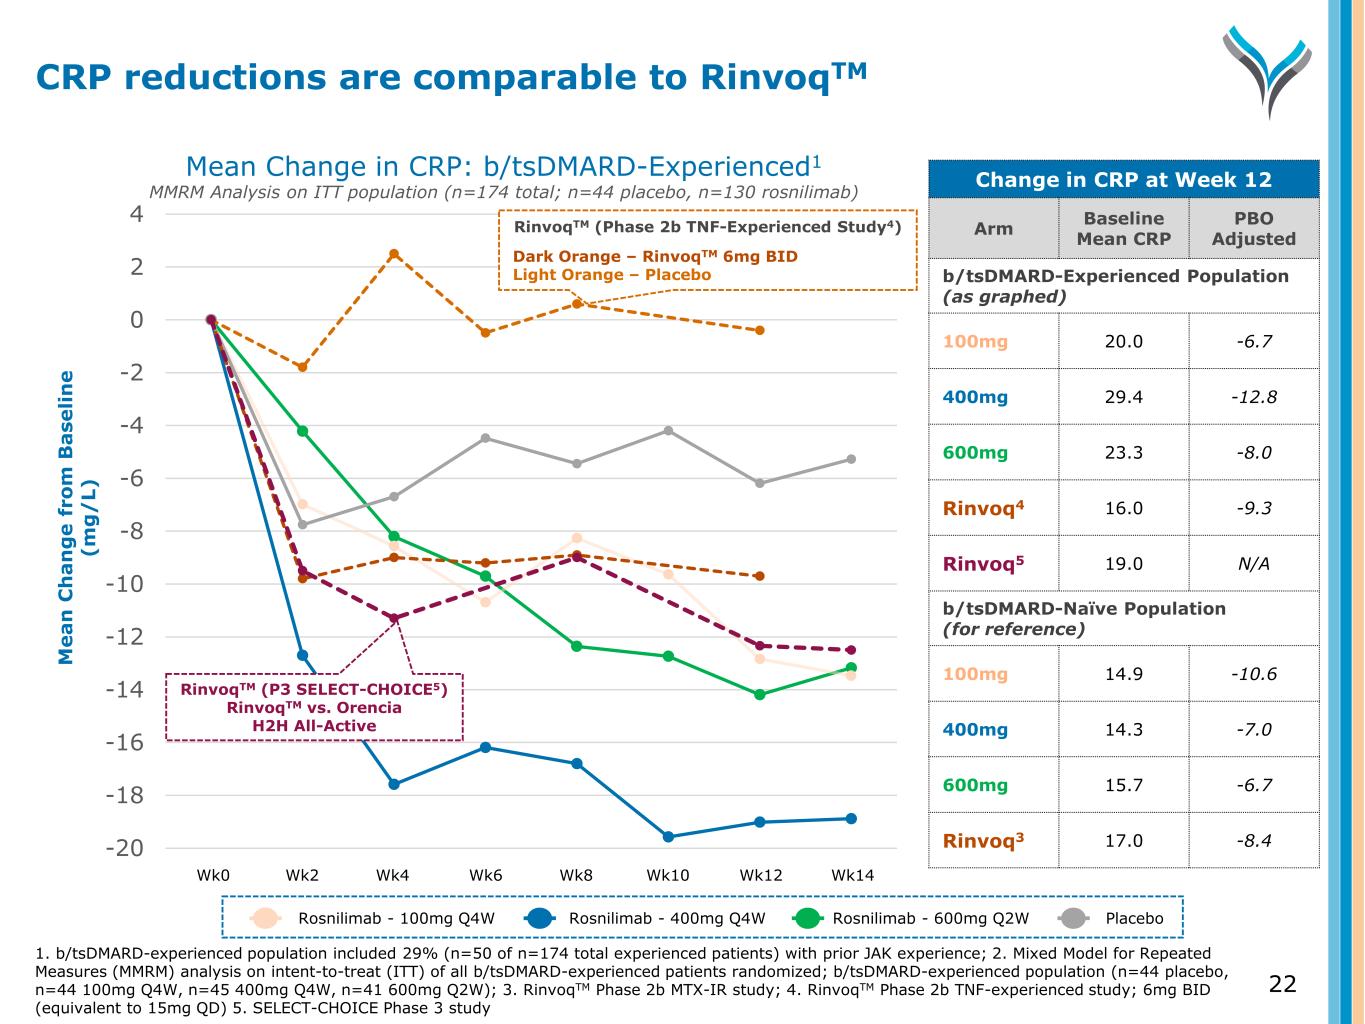
-20 -18 -16 -14 -12 -10 -8 -6 -4 -2 0 2 4 M e a n C h a n g e f ro m B a se li n e (m g / L) Wk0 Wk2 Wk4 Wk6 Wk8 Wk10 Wk12 Wk14 RinvoqTM (P3 SELECT-CHOICE5) RinvoqTM vs. Orencia H2H All-Active RinvoqTM (Phase 2b TNF-Experienced Study4) Dark Orange – RinvoqTM 6mg BID Light Orange – Placebo Mean Change in CRP: b/tsDMARD-Experienced1 MMRM Analysis on ITT population (n=174 total; n=44 placebo, n=130 rosnilimab) Change in CRP at Week 12 Arm Baseline Mean CRP PBO Adjusted b/tsDMARD-Experienced Population (as graphed) 100mg 20.0 -6.7 400mg 29.4 -12.8 600mg 23.3 -8.0 Rinvoq4 16.0 -9.3 Rinvoq5 19.0 N/A b/tsDMARD-Naïve Population (for reference) 100mg 14.9 -10.6 400mg 14.3 -7.0 600mg 15.7 -6.7 Rinvoq3 17.0 -8.4 Rosnilimab - 100mg Q4W Rosnilimab - 400mg Q4W Rosnilimab - 600mg Q2W Placebo 1. b/tsDMARD-experienced population included 29% (n=50 of n=174 total experienced patients) with prior JAK experience; 2. Mixed Model for Repeated Measures (MMRM) analysis on intent-to-treat (ITT) of all b/tsDMARD-experienced patients randomized; b/tsDMARD-experienced population (n=44 placebo, n=44 100mg Q4W, n=45 400mg Q4W, n=41 600mg Q2W); 3. RinvoqTM Phase 2b MTX-IR study; 4. RinvoqTM Phase 2b TNF-experienced study; 6mg BID (equivalent to 15mg QD) 5. SELECT-CHOICE Phase 3 study CRP reductions are comparable to RinvoqTM 22
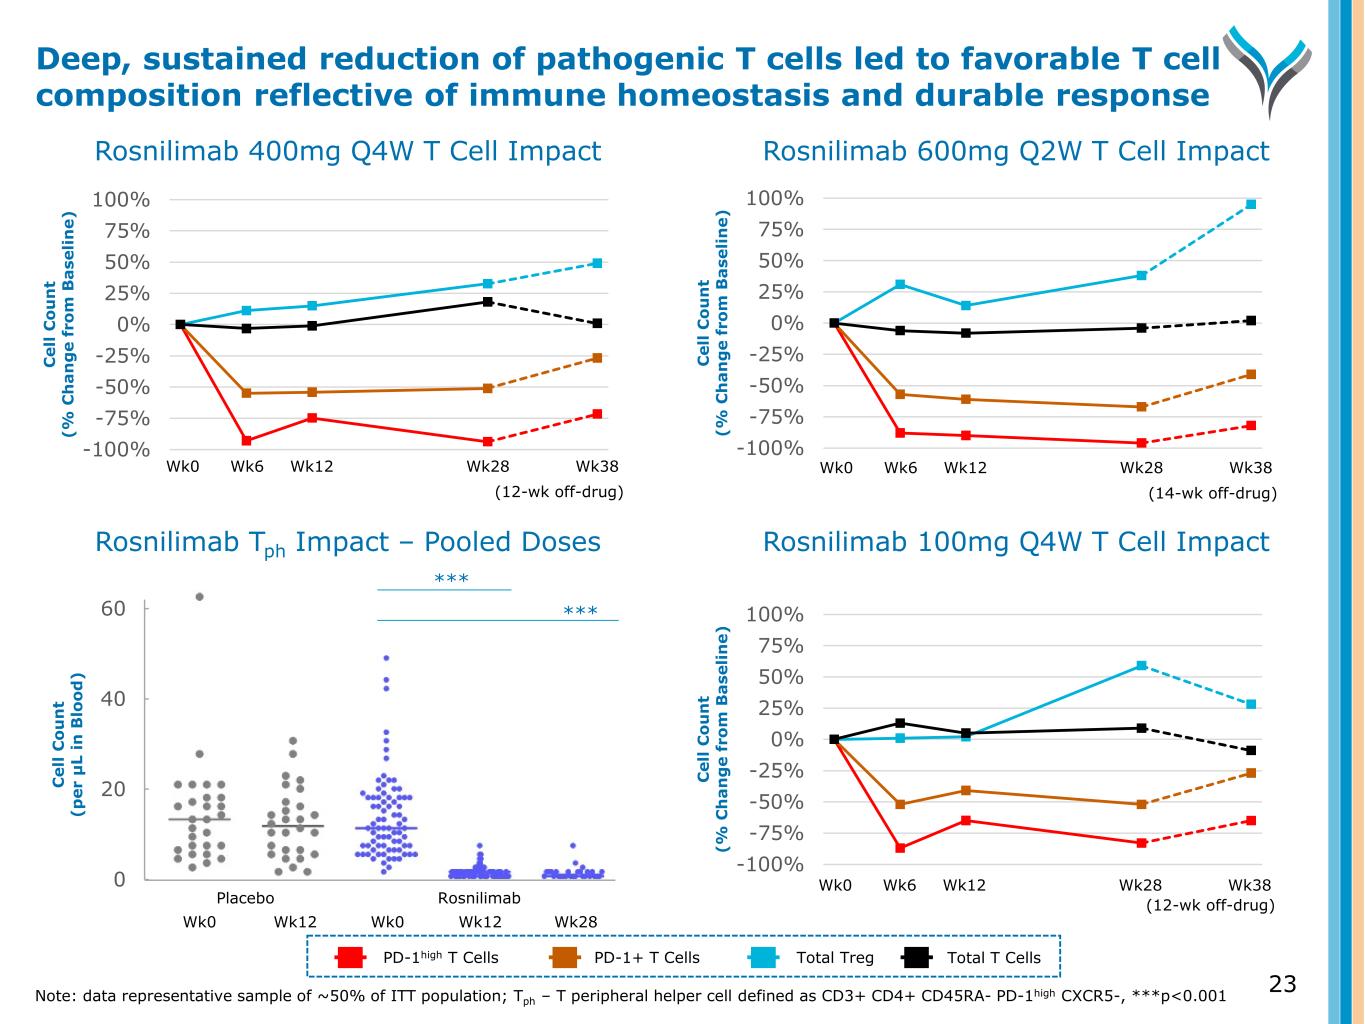
Wk0 Wk6 Wk12 Wk28 Wk38 (12-wk off-drug) -100% -75% -50% -25% 0% 25% 50% 75% 100% C el l C o u n t (% C h a n g e fr o m B a se li n e) Rosnilimab 400mg Q4W T Cell Impact Rosnilimab Tph Impact – Pooled Doses Rosnilimab 600mg Q2W T Cell Impact Rosnilimab 100mg Q4W T Cell Impact -100% -75% -50% -25% 0% 25% 50% 75% 100% C el l C o u n t (% C h a n g e fr o m B a se li n e) Wk0 Wk6 Wk12 Wk28 Wk38 (14-wk off-drug) -100% -75% -50% -25% 0% 25% 50% 75% 100% C el l C o u n t (% C h a n g e fr o m B a se li n e) 23 Deep, sustained reduction of pathogenic T cells led to favorable T cell composition reflective of immune homeostasis and durable response 0 20 40 60 C el l C o u n t (p er μ L in B lo o d ) Wk0 Wk12 Wk0 Wk12 Placebo Rosnilimab *** *** PD-1high T Cells PD-1+ T Cells Total Treg Total T Cells Note: data representative sample of ~50% of ITT population; Tph – T peripheral helper cell defined as CD3+ CD4+ CD45RA- PD-1high CXCR5-, ***p<0.001 Wk28 Wk0 Wk6 Wk12 Wk28 Wk38 (12-wk off-drug)
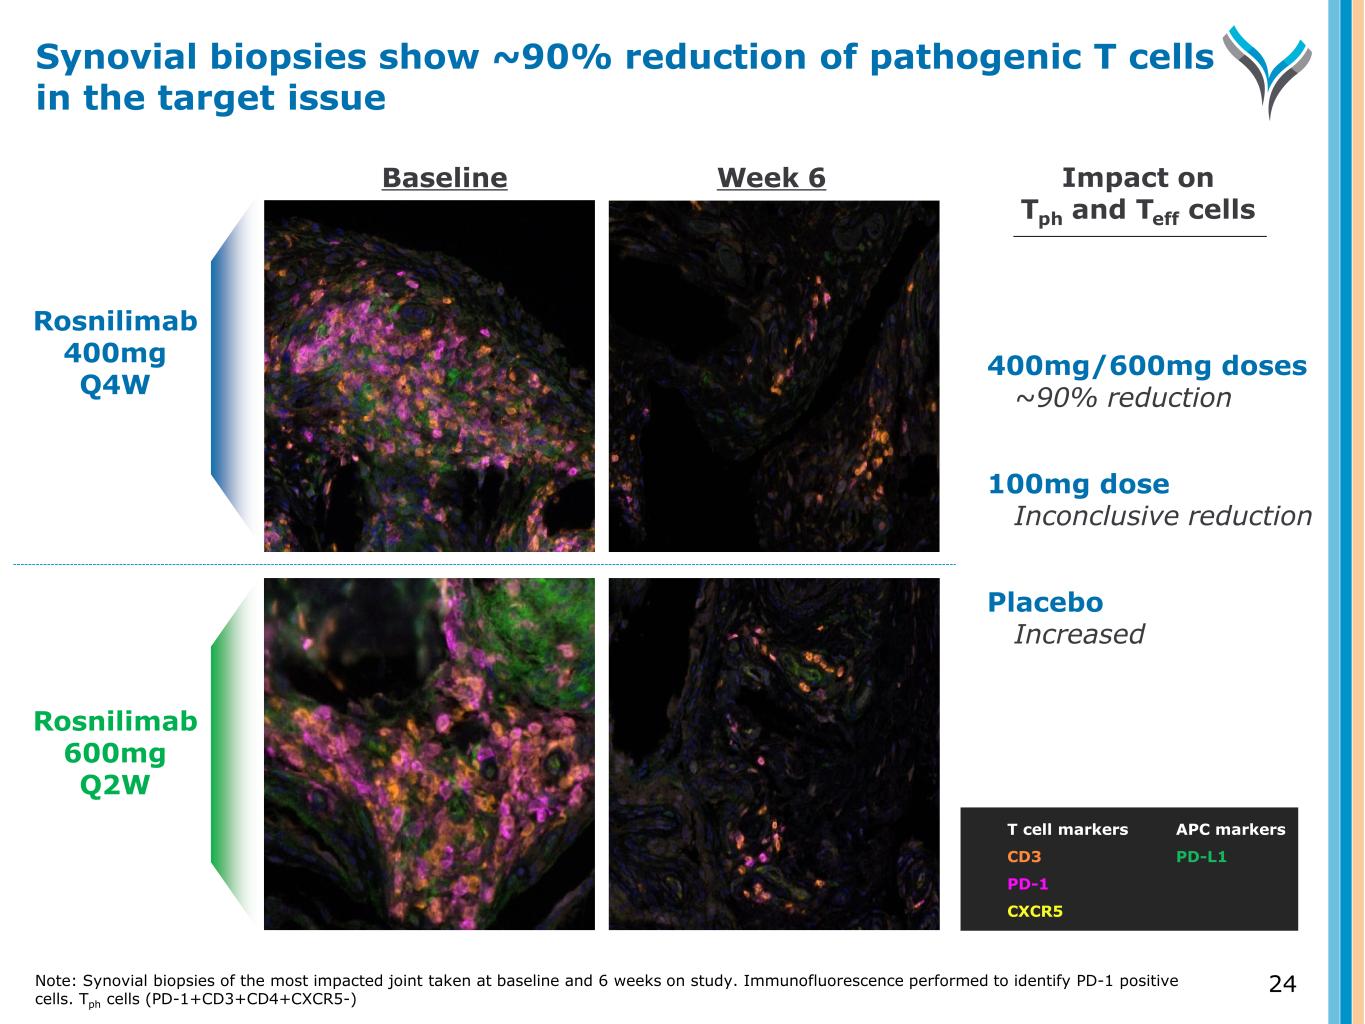
Rosnilimab 400mg Q4W Rosnilimab 600mg Q2W T cell markers CD3 PD-1 CXCR5 400mg/600mg doses ~90% reduction 100mg dose Inconclusive reduction Placebo Increased Impact on Tph and Teff cells Baseline Week 6 APC markers PD-L1 Synovial biopsies show ~90% reduction of pathogenic T cells in the target issue Note: Synovial biopsies of the most impacted joint taken at baseline and 6 weeks on study. Immunofluorescence performed to identify PD-1 positive cells. Tph cells (PD-1+CD3+CD4+CXCR5-) 24
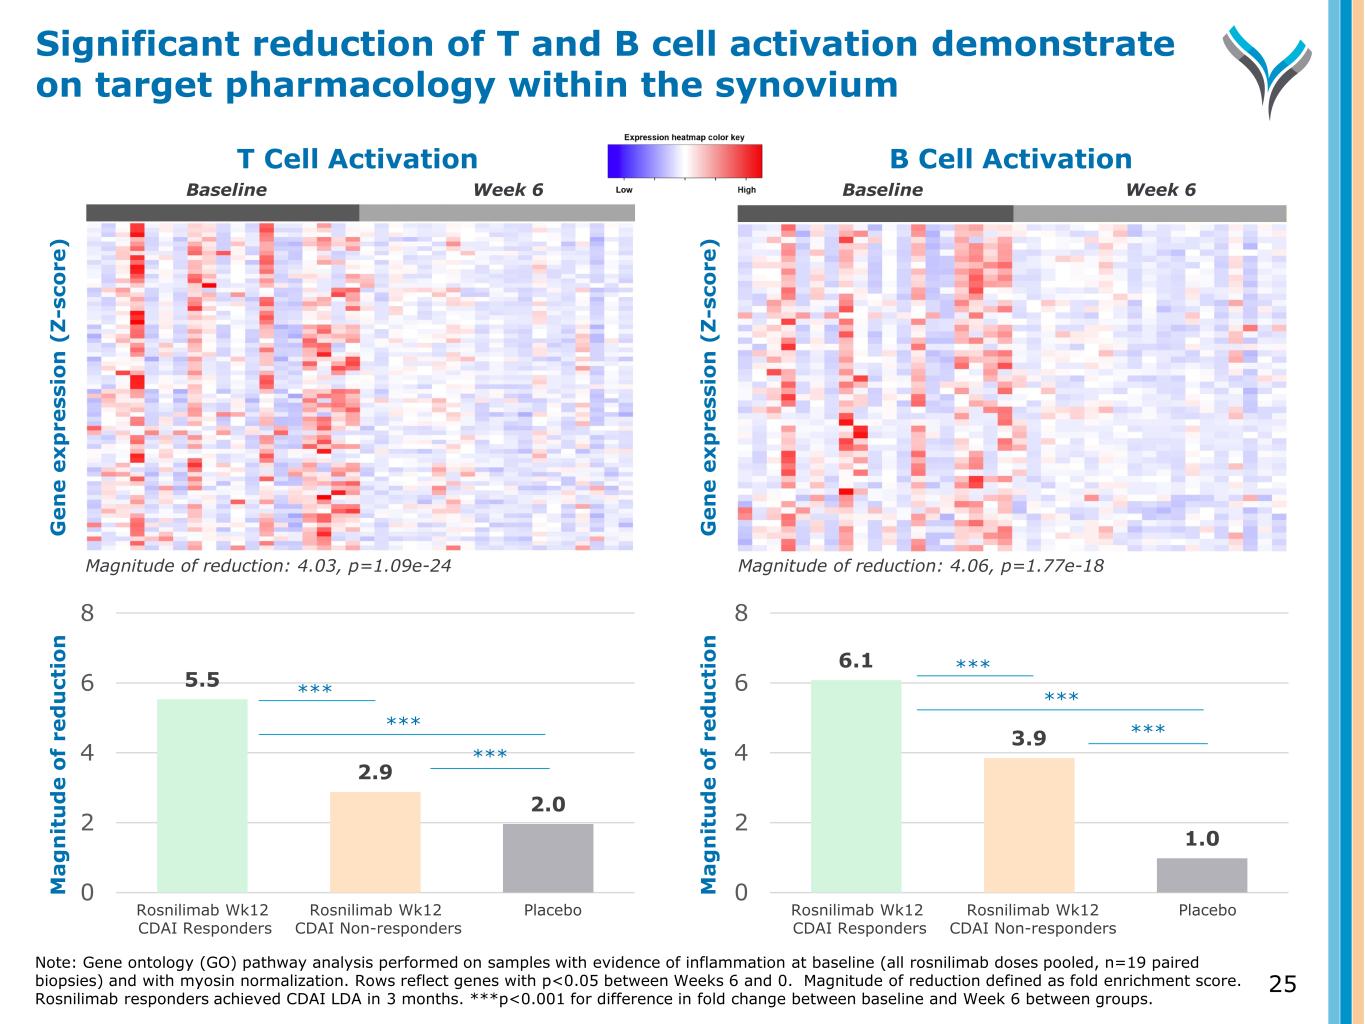
Fold decrease: 4.03, p=1.09e-24 T Cell Activation Fold decrease: 4.06, p=1.77e-18 B Cell Activation G e n e e x p re ss io n ( Z -s co re ) G e n e e x p re ss io n ( Z -s co re ) 5.5 2.9 2.0 0 2 4 6 8 6.1 3.9 1.0 0 2 4 6 8 M a g n it u d e o f re d u ct io n Magnitude of reduction: 4.03, p=1.09e-24 Magnitude of reduction: 4.06, p=1.77e-18 Rosnilimab Wk12 CDAI Responders Rosnilimab Wk12 CDAI Non-responders Placebo Rosnilimab Wk12 CDAI Responders Rosnilimab Wk12 CDAI Non-responders Placebo Week 6 *** *** *** *** *** *** M a g n it u d e o f re d u ct io n Week 6BaselineBaseline Significant reduction of T and B cell activation demonstrate on target pharmacology within the synovium Note: Gene ontology (GO) pathway analysis performed on samples with evidence of inflammation at baseline (all rosnilimab doses pooled, n=19 paired biopsies) and with myosin normalization. Rows reflect genes with p<0.05 between Weeks 6 and 0. Rosnilimab responders achieved CDAI LDA in 3 months. Magnitude of reduction defined as fold enrichment score. ***p<0.001 for difference in fold change between baseline and Week 6 between groups. 25
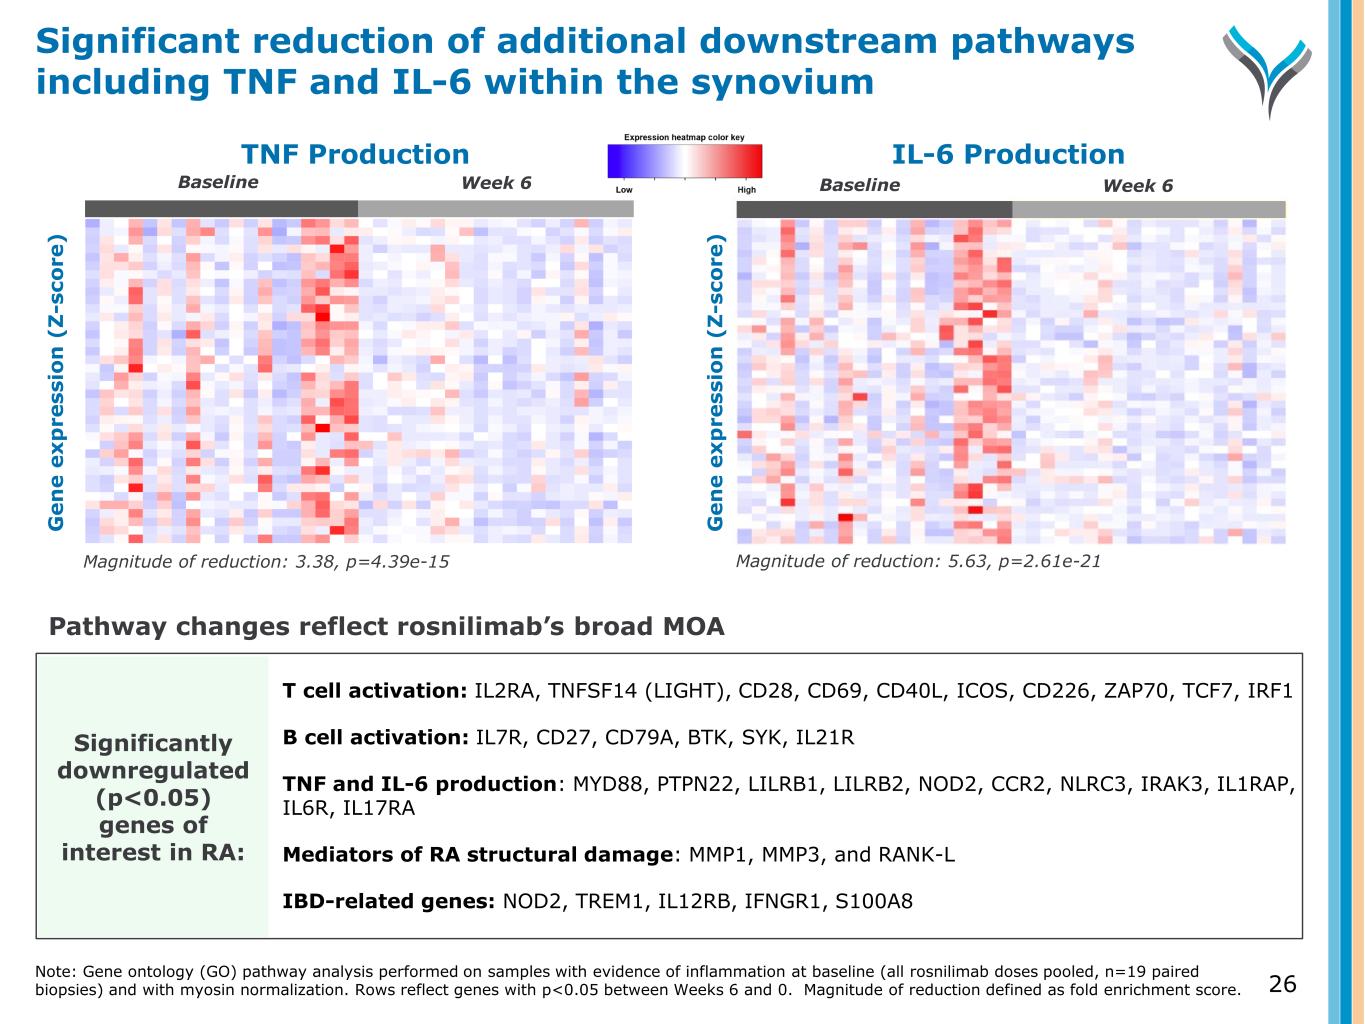
IL-6 Production G e n e e x p re ss io n ( Z -s co re ) G e n e e x p re ss io n ( Z -s co re ) Significantly downregulated (p<0.05) genes of interest in RA: Baseline TNF Production Magnitude of reduction: 3.38, p=4.39e-15 Magnitude of reduction: 5.63, p=2.61e-21 T cell activation: IL2RA, TNFSF14 (LIGHT), CD28, CD69, CD40L, ICOS, CD226, ZAP70, TCF7, IRF1 B cell activation: IL7R, CD27, CD79A, BTK, SYK, IL21R TNF and IL-6 production: MYD88, PTPN22, LILRB1, LILRB2, NOD2, CCR2, NLRC3, IRAK3, IL1RAP, IL6R, IL17RA Mediators of RA structural damage: MMP1, MMP3, and RANK-L IBD-related genes: NOD2, TREM1, IL12RB, IFNGR1, S100A8 Pathway changes reflect rosnilimab’s broad MOA Week 6Baseline Week 6Baseline Significant reduction of additional downstream pathways including TNF and IL-6 within the synovium Note: Gene ontology (GO) pathway analysis performed on samples with evidence of inflammation at baseline (all rosnilimab doses pooled, n=19 paired biopsies) and with myosin normalization. Rows reflect genes with p<0.05 between Weeks 6 and 0. Magnitude of reduction defined as fold enrichment score. G e n e e x p re ss io n ( Z -s co re ) 26
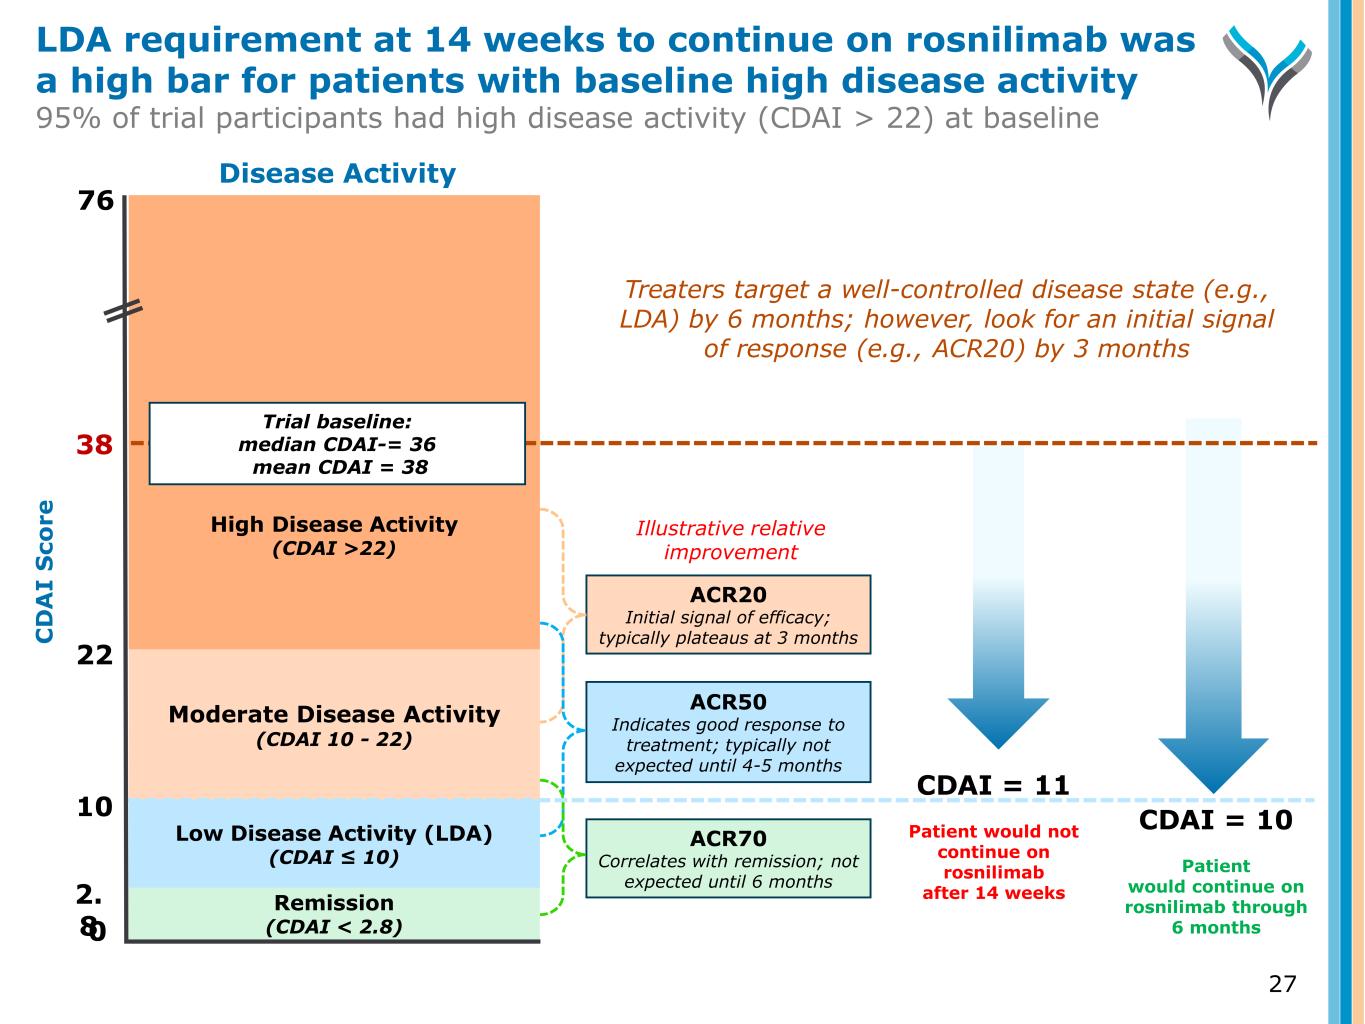
27 C D A I S co re 0 2. 8 10 22 38 Remission (CDAI < 2.8) Low Disease Activity (LDA) (CDAI ≤ 10) Moderate Disease Activity (CDAI 10 - 22) High Disease Activity (CDAI >22) Trial baseline: median CDAI-= 36 mean CDAI = 38 Disease Activity ACR20 Initial signal of efficacy; typically plateaus at 3 months ACR70 Correlates with remission; not expected until 6 months CDAI = 11 Patient would not continue on rosnilimab after 14 weeks CDAI = 10 Patient would continue on rosnilimab through 6 months Illustrative relative improvement 76 Treaters target a well-controlled disease state (e.g., LDA) by 6 months; however, look for an initial signal of response (e.g., ACR20) by 3 months ACR50 Indicates good response to treatment; typically not expected until 4-5 months LDA requirement at 14 weeks to continue on rosnilimab was a high bar for patients with baseline high disease activity 95% of trial participants had high disease activity (CDAI > 22) at baseline
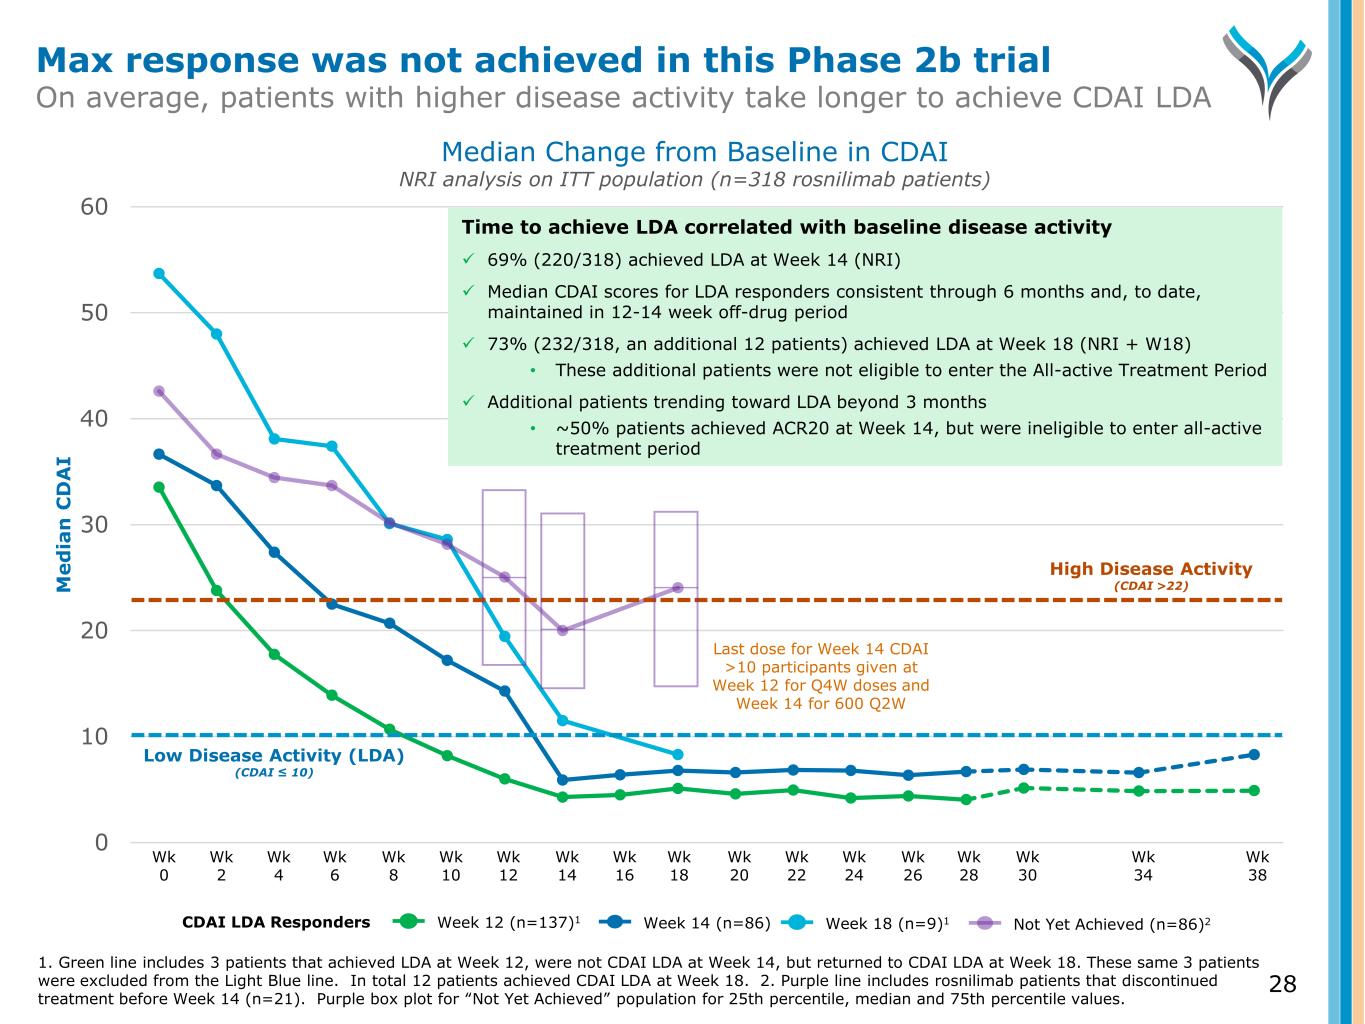
0 10 20 30 40 50 60 M e d ia n C D A I Wk 0 Wk 2 Wk 4 Wk 6 Wk 8 Wk 10 Wk 12 Wk 14 Wk 16 Wk 18 Wk 20 Wk 22 Wk 24 Wk 26 Wk 28 Wk 30 Wk 34 Wk 38 High Disease Activity (CDAI >22) Low Disease Activity (LDA) (CDAI ≤ 10) Last dose for Week 14 CDAI >10 participants given at Week 12 for Q4W doses and Week 14 for 600 Q2W Median Change from Baseline in CDAI NRI analysis on ITT population (n=318 rosnilimab patients) Not Yet Achieved (n=86)2Week 12 (n=137)1CDAI LDA Responders Week 14 (n=86) Week 18 (n=9)1 Time to achieve LDA correlated with baseline disease activity 69% (220/318) achieved LDA at Week 14 (NRI) Median CDAI scores for LDA responders consistent through 6 months and, to date, maintained in 12-14 week off-drug period 73% (232/318, an additional 12 patients) achieved LDA at Week 18 (NRI + W18) • These additional patients were not eligible to enter the All-active Treatment Period Additional patients trending toward LDA beyond 3 months • ~50% patients achieved ACR20 at Week 14, but were ineligible to enter all-active treatment period 28 Max response was not achieved in this Phase 2b trial On average, patients with higher disease activity take longer to achieve CDAI LDA 1. Green line includes 3 patients that achieved LDA at Week 12, were not CDAI LDA at Week 14, but returned to CDAI LDA at Week 18. These same 3 patients were excluded from the Light Blue line. In total 12 patients achieved CDAI LDA at Week 18. 2. Purple line includes rosnilimab patients that discontinued treatment before Week 14 (n=21). Purple box plot for “Not Yet Achieved” population for 25th percentile, median and 75th percentile values.
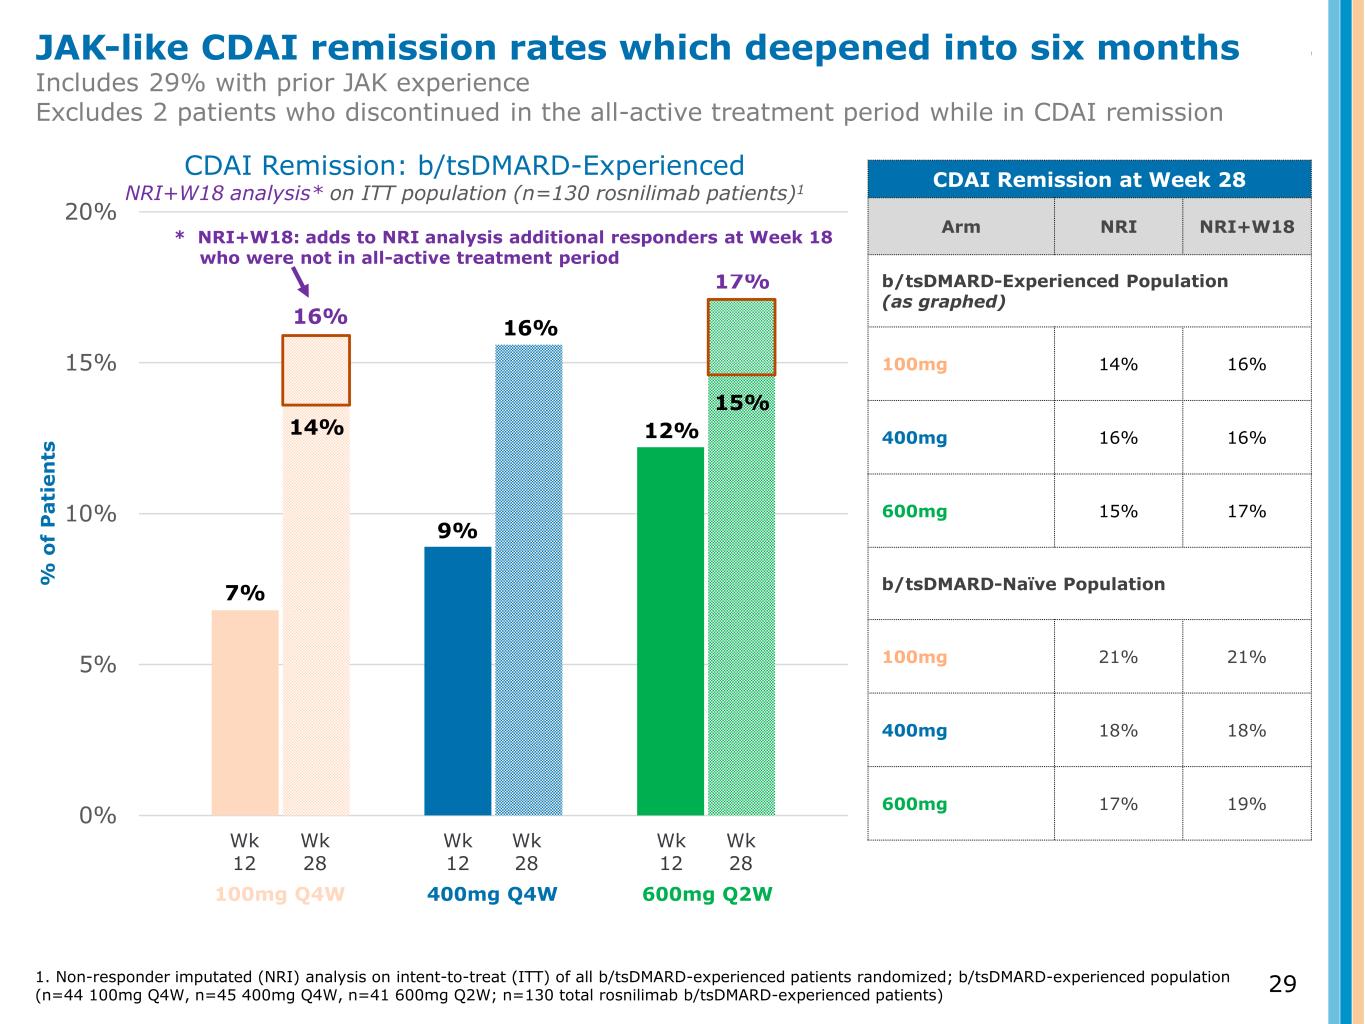
0% 5% 10% 15% 20% % o f P a ti e n ts CDAI Remission: b/tsDMARD-Experienced NRI+W18 analysis* on ITT population (n=130 rosnilimab patients)1 Wk 12 Wk 28 Wk 12 Wk 28 Wk 12 Wk 28 100mg Q4W 400mg Q4W 600mg Q2W 7% 9% 12% CDAI Remission at Week 28 Arm NRI NRI+W18 b/tsDMARD-Experienced Population (as graphed) 100mg 14% 16% 400mg 16% 16% 600mg 15% 17% b/tsDMARD-Naïve Population 100mg 21% 21% 400mg 18% 18% 600mg 17% 19% 15% 16% 14% 16% 17% JAK-like CDAI remission rates which deepened into six months Includes 29% with prior JAK experience Excludes 2 patients who discontinued in the all-active treatment period while in CDAI remission 1. Non-responder imputated (NRI) analysis on intent-to-treat (ITT) of all b/tsDMARD-experienced patients randomized; b/tsDMARD-experienced population (n=44 100mg Q4W, n=45 400mg Q4W, n=41 600mg Q2W; n=130 total rosnilimab b/tsDMARD-experienced patients) * NRI+W18: adds to NRI analysis additional responders at Week 18 who were not in all-active treatment period 29
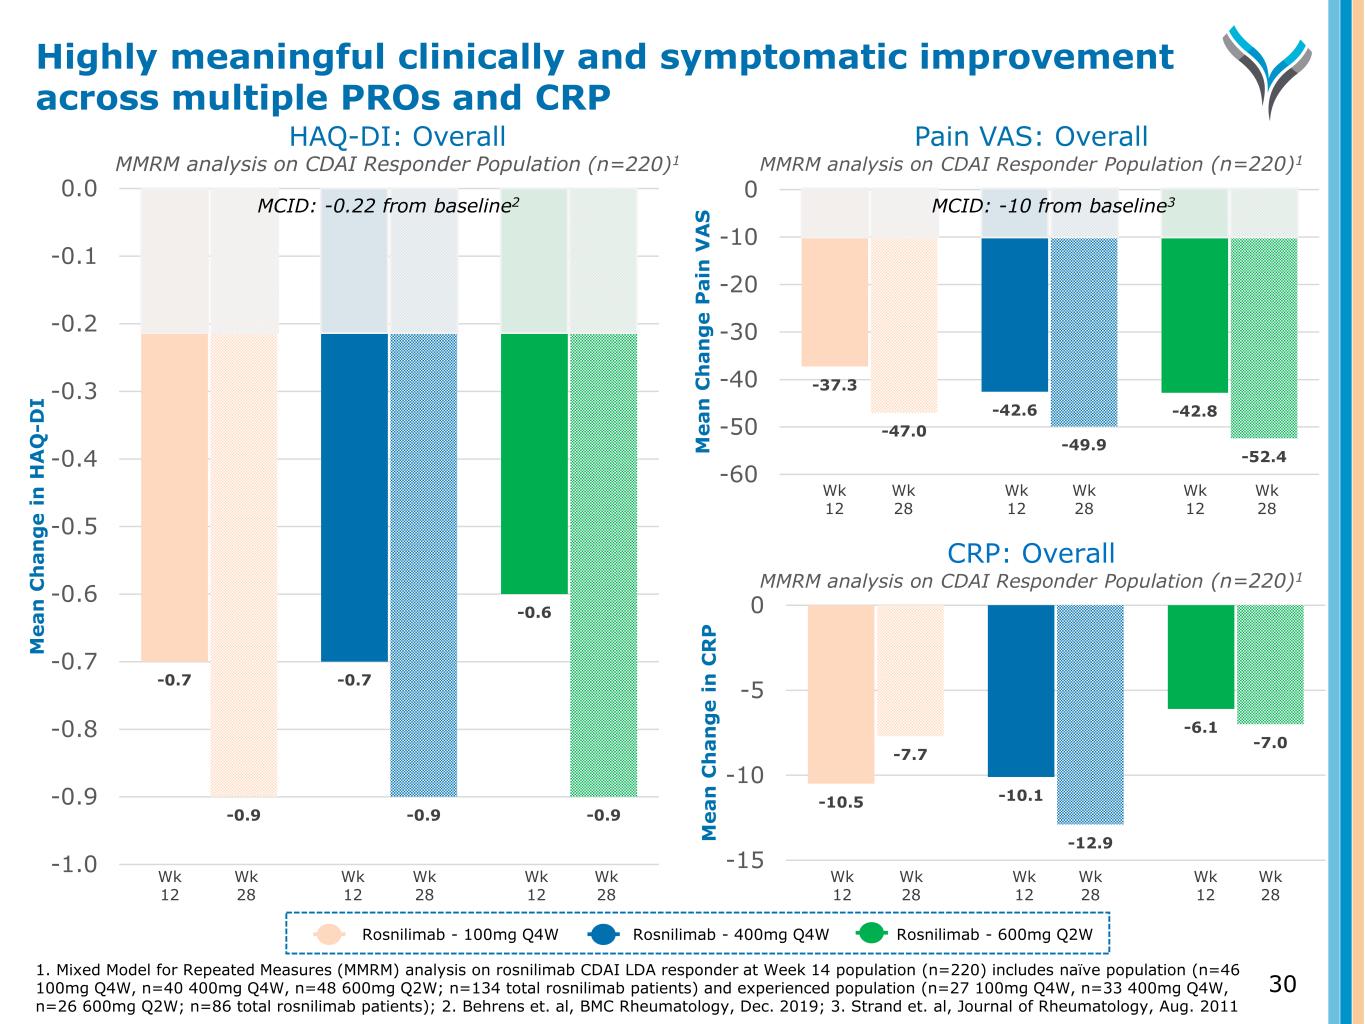
-37.3 -42.6 -42.8 -47.0 -49.9 -52.4 -60 -50 -40 -30 -20 -10 0 M e a n C h a n g e P a in V A S Pain VAS: Overall MMRM analysis on CDAI Responder Population (n=220)1 Wk 12 Wk 28 Rosnilimab - 100mg Q4W Rosnilimab - 400mg Q4W Rosnilimab - 600mg Q2W 1. Mixed Model for Repeated Measures (MMRM) analysis on rosnilimab CDAI LDA responder at Week 14 population (n=220) includes naïve population (n=46 100mg Q4W, n=40 400mg Q4W, n=48 600mg Q2W; n=134 total rosnilimab patients) and experienced population (n=27 100mg Q4W, n=33 400mg Q4W, n=26 600mg Q2W; n=86 total rosnilimab patients); 2. Behrens et. al, BMC Rheumatology, Dec. 2019; 3. Strand et. al, Journal of Rheumatology, Aug. 2011 Wk 12 Wk 28 Wk 12 Wk 28 -10.5 -10.1 -6.1 -7.7 -12.9 -7.0 -15 -10 -5 0 M e a n C h a n g e i n C R P Wk 12 Wk 28 Wk 12 Wk 28 Wk 12 Wk 28 -0.7 -0.7 -0.6 -0.9 -0.9 -0.9 -1.0 -0.9 -0.8 -0.7 -0.6 -0.5 -0.4 -0.3 -0.2 -0.1 0.0 M e a n C h a n g e i n H A Q -D I HAQ-DI: Overall MMRM analysis on CDAI Responder Population (n=220)1 Wk 12 Wk 28 Wk 12 Wk 28 Wk 12 Wk 28 30 CRP: Overall MMRM analysis on CDAI Responder Population (n=220)1 Highly meaningful clinically and symptomatic improvement across multiple PROs and CRP MCID: -0.22 from baseline2 MCID: -10 from baseline3
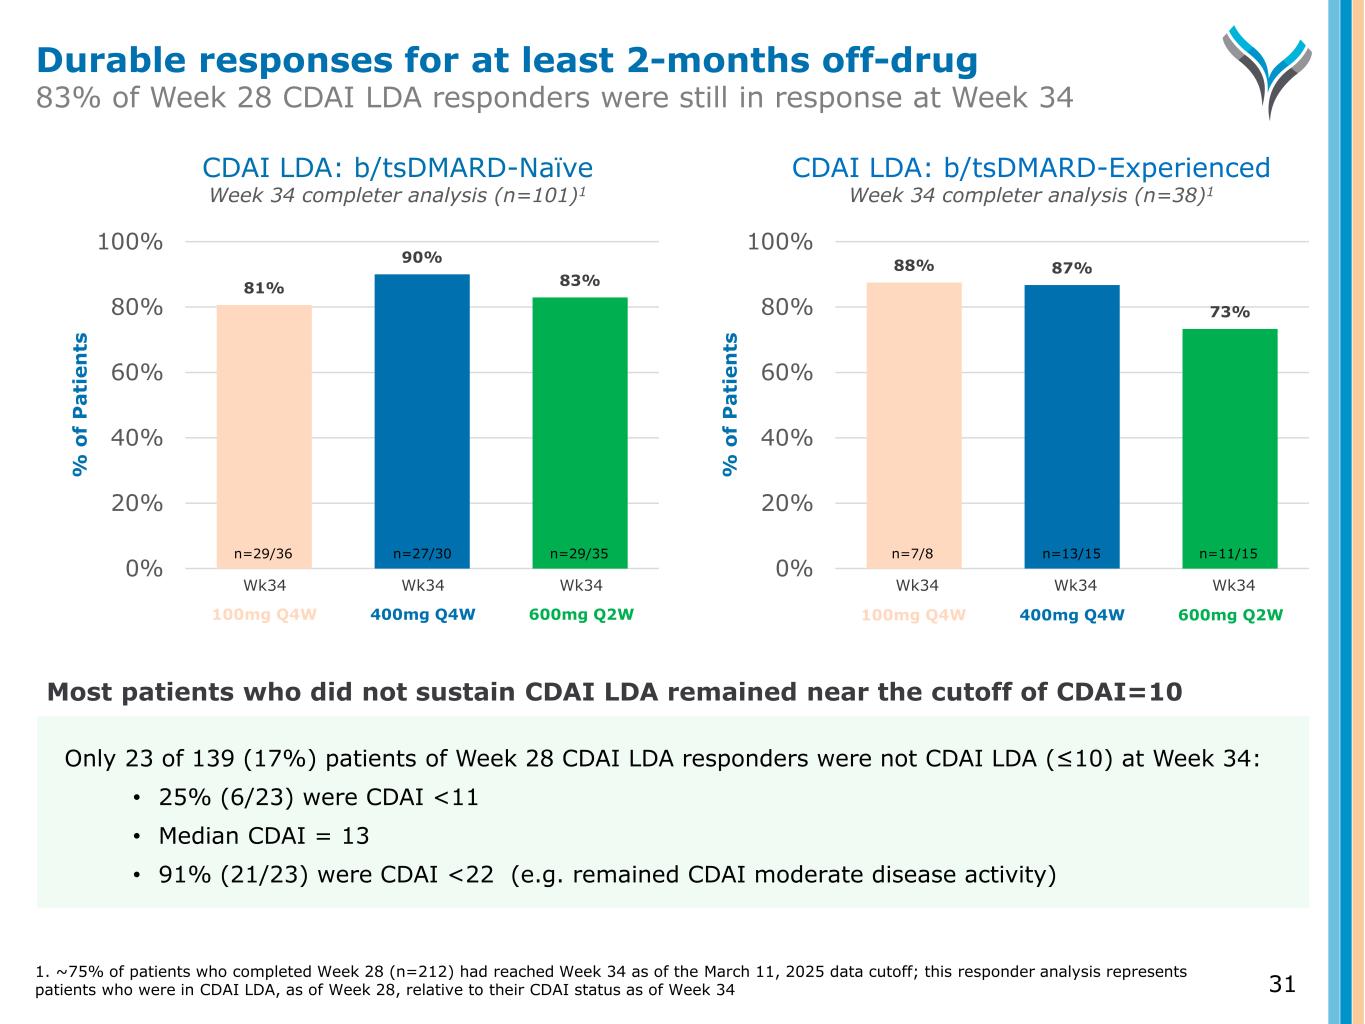
81% 90% 83% 0% 20% 40% 60% 80% 100% % o f P a ti e n ts CDAI LDA: b/tsDMARD-Naïve Week 34 completer analysis (n=101)1 CDAI LDA: b/tsDMARD-Experienced Week 34 completer analysis (n=38)1 Wk34 Wk34 Wk34 88% 87% 73% 0% 20% 40% 60% 80% 100% % o f P a ti e n ts Wk34 Wk34 Wk34 n=29/36 n=27/30 n=29/35 n=7/8 n=13/15 n=11/15 31 Only 23 of 139 (17%) patients of Week 28 CDAI LDA responders were not CDAI LDA (≤10) at Week 34: • 25% (6/23) were CDAI <11 • Median CDAI = 13 • 91% (21/23) were CDAI <22 (e.g. remained CDAI moderate disease activity) Most patients who did not sustain CDAI LDA remained near the cutoff of CDAI=10 100mg Q4W 400mg Q4W 600mg Q2W 100mg Q4W 400mg Q4W 600mg Q2W Durable responses for at least 2-months off-drug 83% of Week 28 CDAI LDA responders were still in response at Week 34 1. ~75% of patients who completed Week 28 (n=212) had reached Week 34 as of the March 11, 2025 data cutoff; this responder analysis represents patients who were in CDAI LDA, as of Week 28, relative to their CDAI status as of Week 34
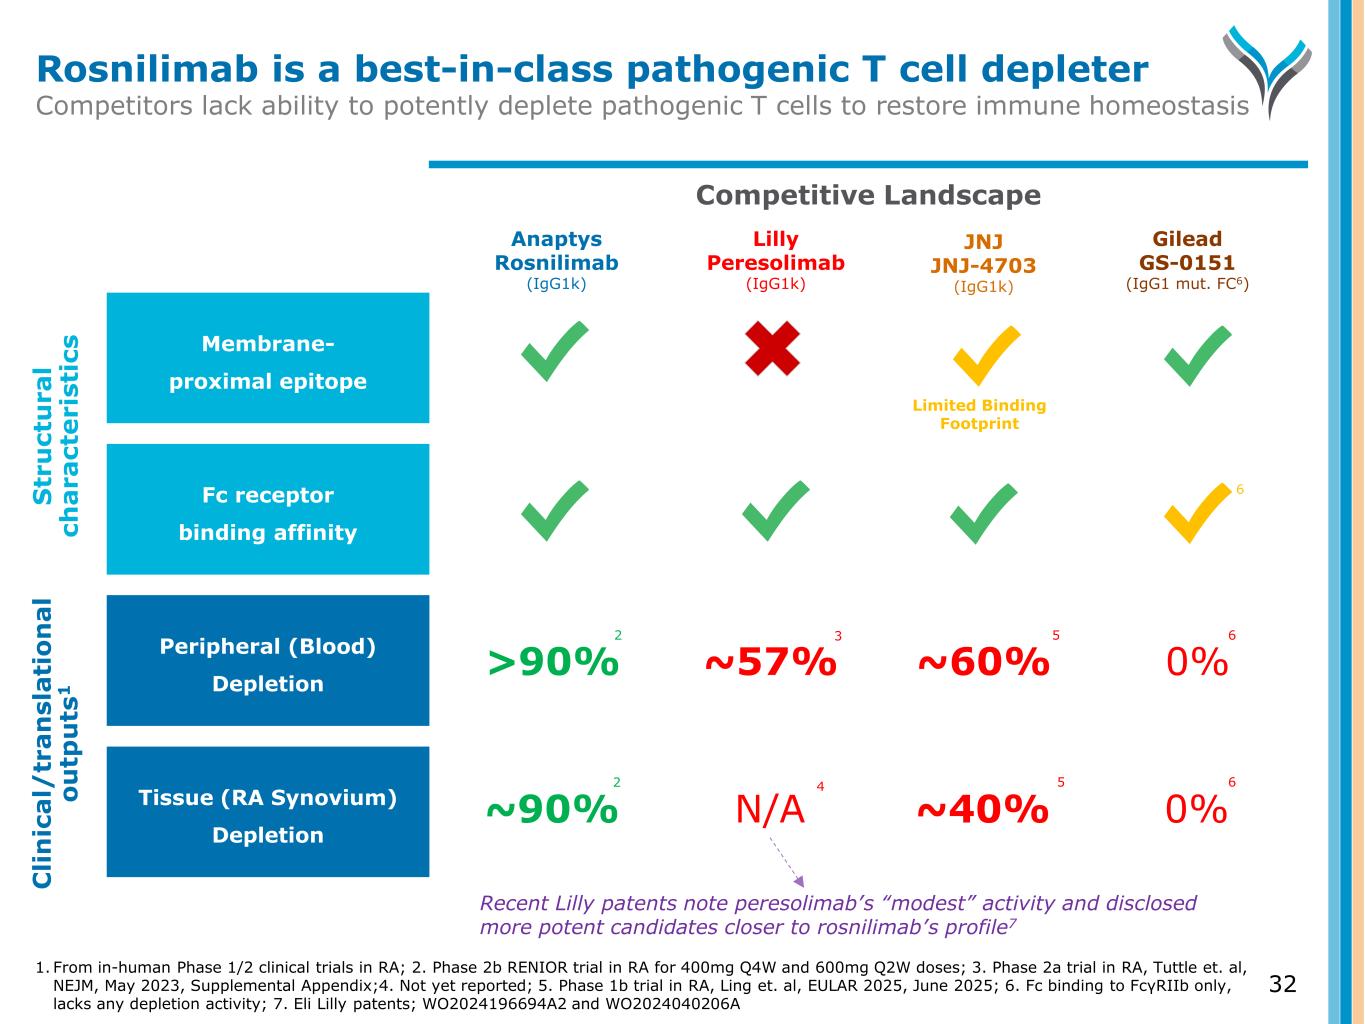
32 Competitive Landscape Fc receptor binding affinity Tissue (RA Synovium) Depletion Peripheral (Blood) Depletion Membrane- proximal epitope S tr u ct u ra l ch a ra ct e ri st ic s C li n ic a l/ tr a n sl a ti o n a l o u tp u ts 1 Rosnilimab is a best-in-class pathogenic T cell depleter Competitors lack ability to potently deplete pathogenic T cells to restore immune homeostasis Lilly Peresolimab (IgG1k) Anaptys Rosnilimab (IgG1k) Gilead GS-0151 (IgG1 mut. FC6) 6 1. From in-human Phase 1/2 clinical trials in RA; 2. Phase 2b RENIOR trial in RA for 400mg Q4W and 600mg Q2W doses; 3. Phase 2a trial in RA, Tuttle et. al, NEJM, May 2023, Supplemental Appendix;4. Not yet reported; 5. Phase 1b trial in RA, Ling et. al, EULAR 2025, June 2025; 6. Fc binding to FcγRIIb only, lacks any depletion activity; 7. Eli Lilly patents; WO2024196694A2 and WO2024040206A JNJ JNJ-4703 (IgG1k) ~57%>90% ~60% 0% N/A~90% ~40% 0% 2 2 3 4 5 5 Limited Binding Footprint Recent Lilly patents note peresolimab’s “modest” activity and disclosed more potent candidates closer to rosnilimab’s profile7 6 6
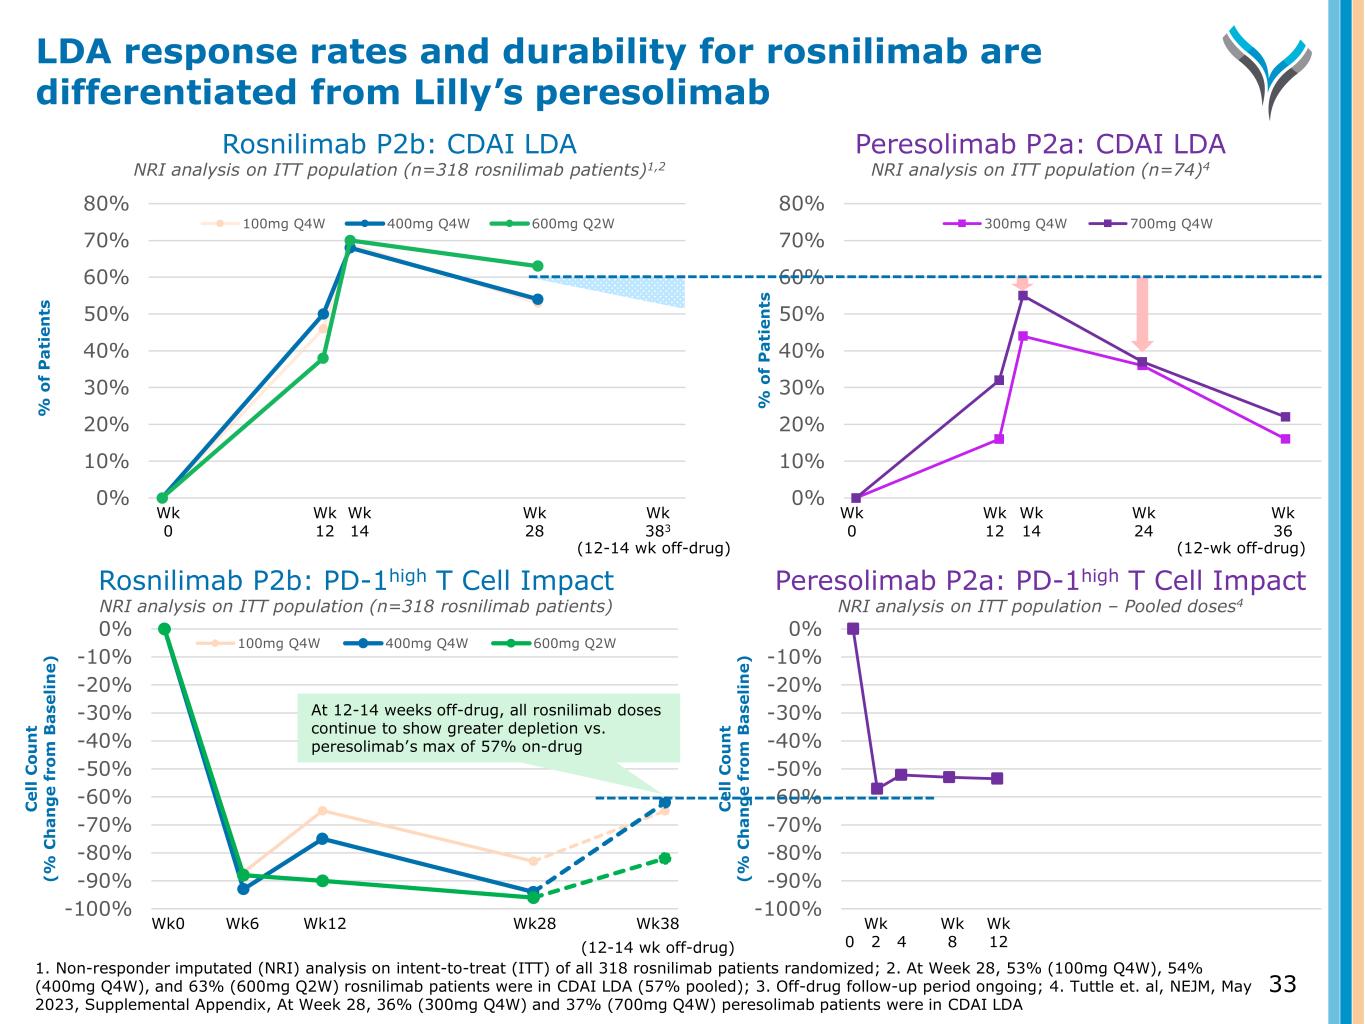
0% 10% 20% 30% 40% 50% 60% 70% 80% % o f P a ti en ts 100mg Q4W 400mg Q4W 600mg Q2W Wk 12 Wk 14 Wk 28 0% 10% 20% 30% 40% 50% 60% 70% 80% % o f P a ti en ts 300mg Q4W 700mg Q4W Wk 12 Wk 14 Wk 24 Wk 0 Wk 0 (12-wk off-drug) Wk 383 (12-14 wk off-drug) Wk 36 Rosnilimab P2b: CDAI LDA NRI analysis on ITT population (n=318 rosnilimab patients)1,2 Peresolimab P2a: CDAI LDA NRI analysis on ITT population (n=74)4 -100% -90% -80% -70% -60% -50% -40% -30% -20% -10% 0% C el l C o u n t (% C h a n g e fr o m B a se li n e) 100mg Q4W 400mg Q4W 600mg Q2W Wk0 Wk6 Wk12 Wk28 -100% -90% -80% -70% -60% -50% -40% -30% -20% -10% 0% C el l C o u n t (% C h a n g e fr o m B a se li n e) Wk 0 2 4 Wk 12 Wk 8 Wk38 (12-14 wk off-drug) Rosnilimab P2b: PD-1high T Cell Impact NRI analysis on ITT population (n=318 rosnilimab patients) Peresolimab P2a: PD-1high T Cell Impact NRI analysis on ITT population – Pooled doses4 At 12-14 weeks off-drug, all rosnilimab doses continue to show greater depletion vs. peresolimab’s max of 57% on-drug 33 LDA response rates and durability for rosnilimab are differentiated from Lilly’s peresolimab 1. Non-responder imputated (NRI) analysis on intent-to-treat (ITT) of all 318 rosnilimab patients randomized; 2. At Week 28, 53% (100mg Q4W), 54% (400mg Q4W), and 63% (600mg Q2W) rosnilimab patients were in CDAI LDA (57% pooled); 3. Off-drug follow-up period ongoing; 4. Tuttle et. al, NEJM, May 2023, Supplemental Appendix, At Week 28, 36% (300mg Q4W) and 37% (700mg Q4W) peresolimab patients were in CDAI LDA
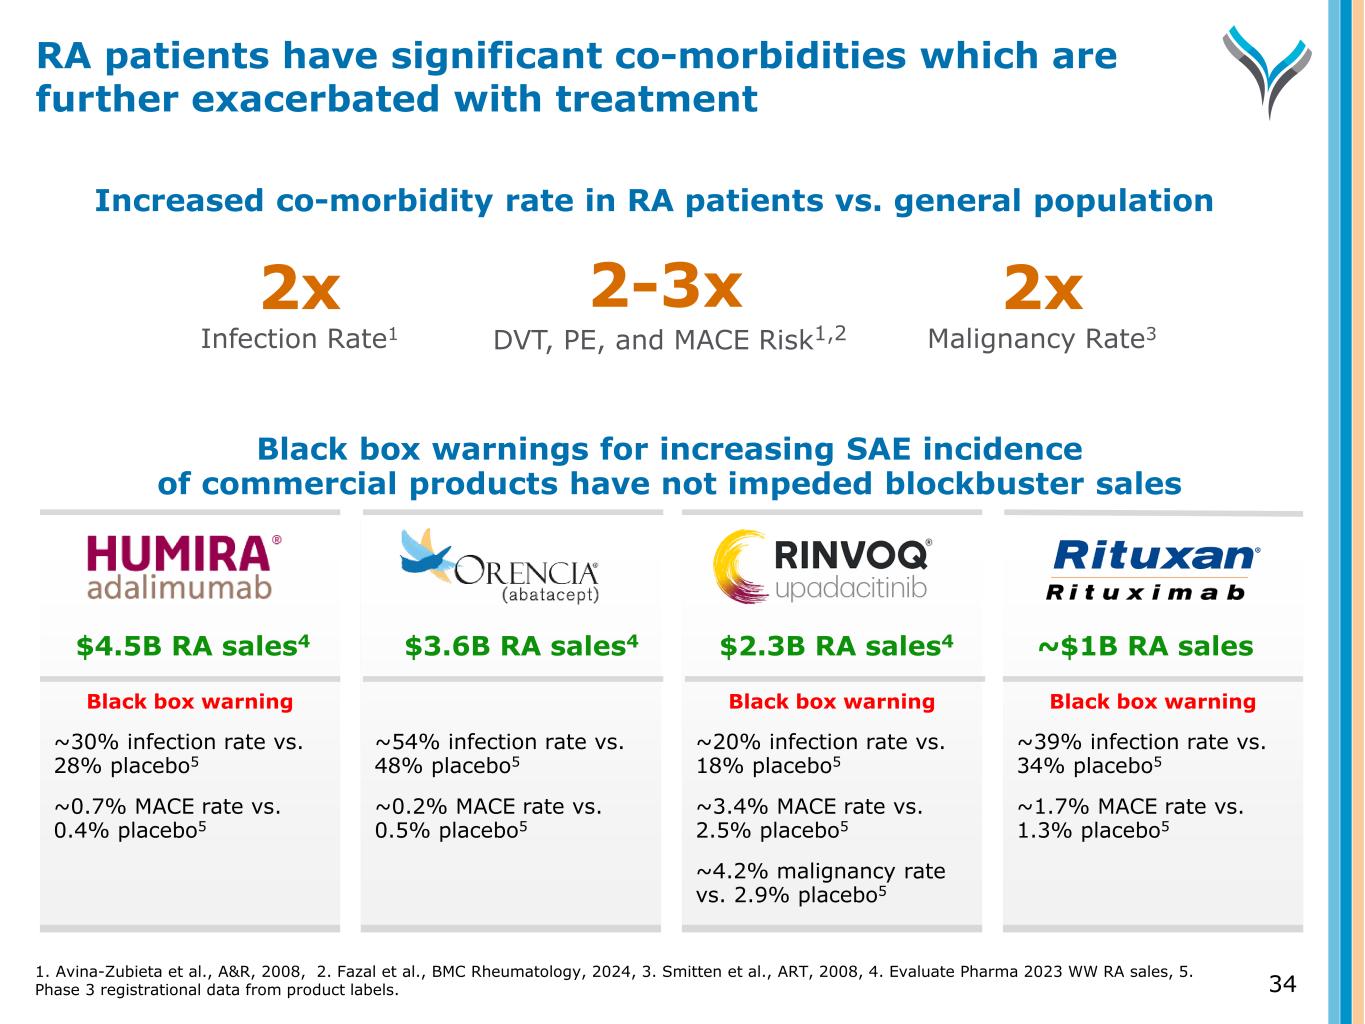
Black box warnings for increasing SAE incidence of commercial products have not impeded blockbuster sales Black box warning ~30% infection rate vs. 28% placebo5 ~0.7% MACE rate vs. 0.4% placebo5 ~54% infection rate vs. 48% placebo5 ~0.2% MACE rate vs. 0.5% placebo5 Black box warning ~20% infection rate vs. 18% placebo5 ~3.4% MACE rate vs. 2.5% placebo5 ~4.2% malignancy rate vs. 2.9% placebo5 Black box warning ~39% infection rate vs. 34% placebo5 ~1.7% MACE rate vs. 1.3% placebo5 Increased co-morbidity rate in RA patients vs. general population 2-3x DVT, PE, and MACE Risk1,2 2x Infection Rate1 2x Malignancy Rate3 $4.5B RA sales4 $3.6B RA sales4 $2.3B RA sales4 ~$1B RA sales RA patients have significant co-morbidities which are further exacerbated with treatment 1. Avina-Zubieta et al., A&R, 2008, 2. Fazal et al., BMC Rheumatology, 2024, 3. Smitten et al., ART, 2008, 4. Evaluate Pharma 2023 WW RA sales, 5. Phase 3 registrational data from product labels. 34
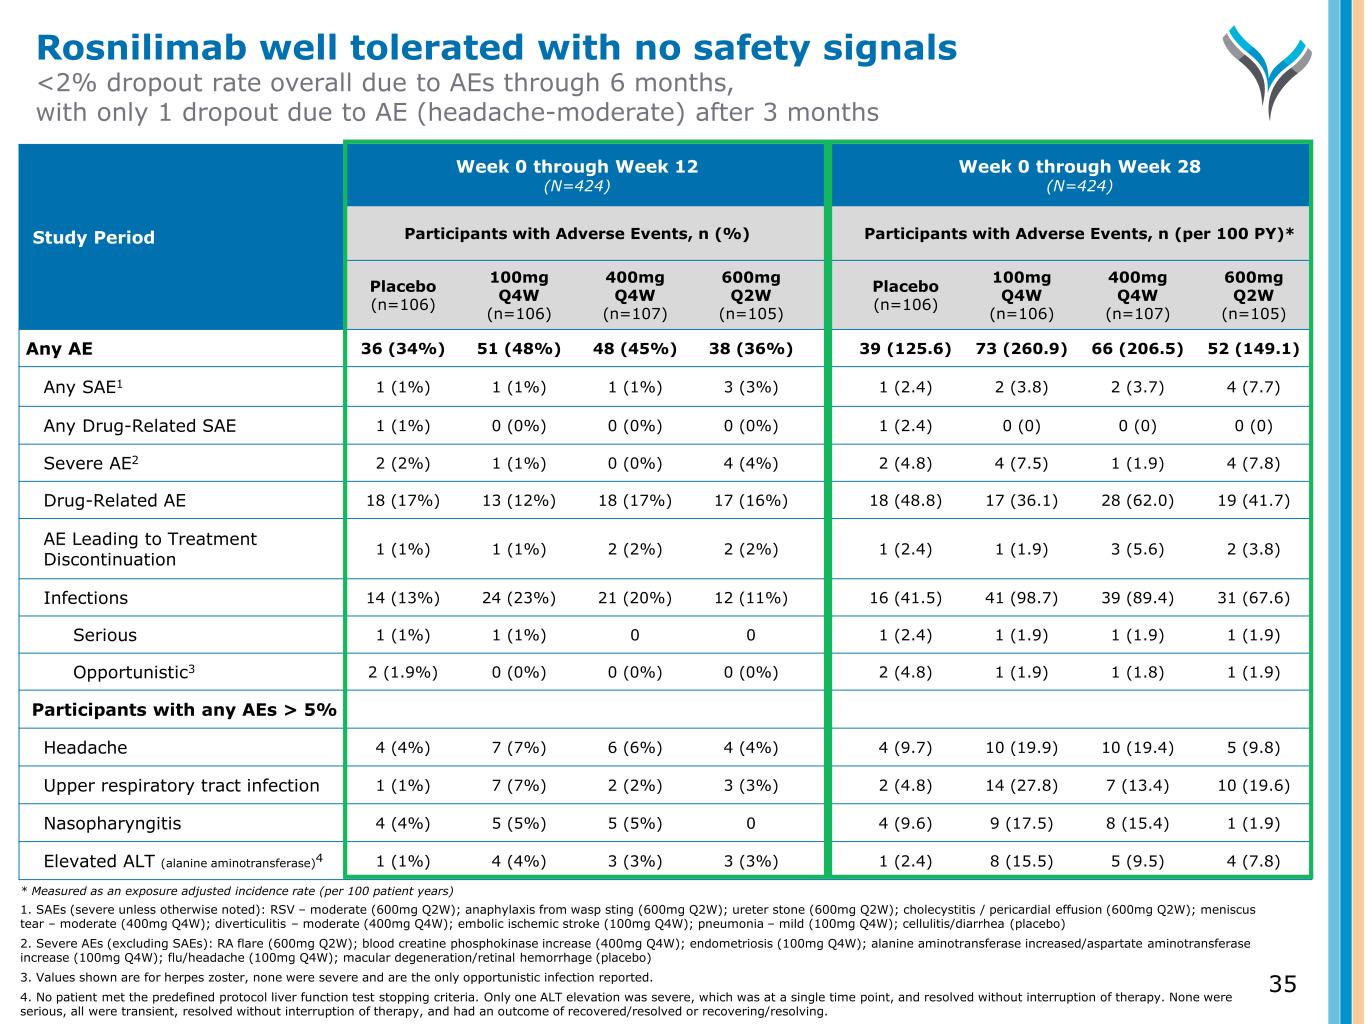
35 Study Period Week 0 through Week 12 (N=424) Week 0 through Week 28 (N=424) Participants with Adverse Events, n (%) Participants with Adverse Events, n (per 100 PY)* Placebo (n=106) 100mg Q4W (n=106) 400mg Q4W (n=107) 600mg Q2W (n=105) Placebo (n=106) 100mg Q4W (n=106) 400mg Q4W (n=107) 600mg Q2W (n=105) Any AE 36 (34%) 51 (48%) 48 (45%) 38 (36%) 39 (125.6) 73 (260.9) 66 (206.5) 52 (149.1) Any SAE1 1 (1%) 1 (1%) 1 (1%) 3 (3%) 1 (2.4) 2 (3.8) 2 (3.7) 4 (7.7) Any Drug-Related SAE 1 (1%) 0 (0%) 0 (0%) 0 (0%) 1 (2.4) 0 (0) 0 (0) 0 (0) Severe AE2 2 (2%) 1 (1%) 0 (0%) 4 (4%) 2 (4.8) 4 (7.5) 1 (1.9) 4 (7.8) Drug-Related AE 18 (17%) 13 (12%) 18 (17%) 17 (16%) 18 (48.8) 17 (36.1) 28 (62.0) 19 (41.7) AE Leading to Treatment Discontinuation 1 (1%) 1 (1%) 2 (2%) 2 (2%) 1 (2.4) 1 (1.9) 3 (5.6) 2 (3.8) Infections 14 (13%) 24 (23%) 21 (20%) 12 (11%) 16 (41.5) 41 (98.7) 39 (89.4) 31 (67.6) Serious 1 (1%) 1 (1%) 0 0 1 (2.4) 1 (1.9) 1 (1.9) 1 (1.9) Opportunistic3 2 (1.9%) 0 (0%) 0 (0%) 0 (0%) 2 (4.8) 1 (1.9) 1 (1.8) 1 (1.9) Participants with any AEs > 5% Headache 4 (4%) 7 (7%) 6 (6%) 4 (4%) 4 (9.7) 10 (19.9) 10 (19.4) 5 (9.8) Upper respiratory tract infection 1 (1%) 7 (7%) 2 (2%) 3 (3%) 2 (4.8) 14 (27.8) 7 (13.4) 10 (19.6) Nasopharyngitis 4 (4%) 5 (5%) 5 (5%) 0 4 (9.6) 9 (17.5) 8 (15.4) 1 (1.9) Elevated ALT (alanine aminotransferase)4 1 (1%) 4 (4%) 3 (3%) 3 (3%) 1 (2.4) 8 (15.5) 5 (9.5) 4 (7.8) Rosnilimab well tolerated with no safety signals <2% dropout rate overall due to AEs through 6 months, with only 1 dropout due to AE (headache-moderate) after 3 months * Measured as an exposure adjusted incidence rate (per 100 patient years) 1. SAEs (severe unless otherwise noted): RSV – moderate (600mg Q2W); anaphylaxis from wasp sting (600mg Q2W); ureter stone (600mg Q2W); cholecystitis / pericardial effusion (600mg Q2W); meniscus tear – moderate (400mg Q4W); diverticulitis – moderate (400mg Q4W); embolic ischemic stroke (100mg Q4W); pneumonia – mild (100mg Q4W); cellulitis/diarrhea (placebo) 2. Severe AEs (excluding SAEs): RA flare (600mg Q2W); blood creatine phosphokinase increase (400mg Q4W); endometriosis (100mg Q4W); alanine aminotransferase increased/aspartate aminotransferase increase (100mg Q4W); flu/headache (100mg Q4W); macular degeneration/retinal hemorrhage (placebo) 3. Values shown are for herpes zoster, none were severe and are the only opportunistic infection reported. 4. No patient met the predefined protocol liver function test stopping criteria. Only one ALT elevation was severe, which was at a single time point, and resolved without interruption of therapy. None were serious, all were transient, resolved without interruption of therapy, and had an outcome of recovered/resolved or recovering/resolving.
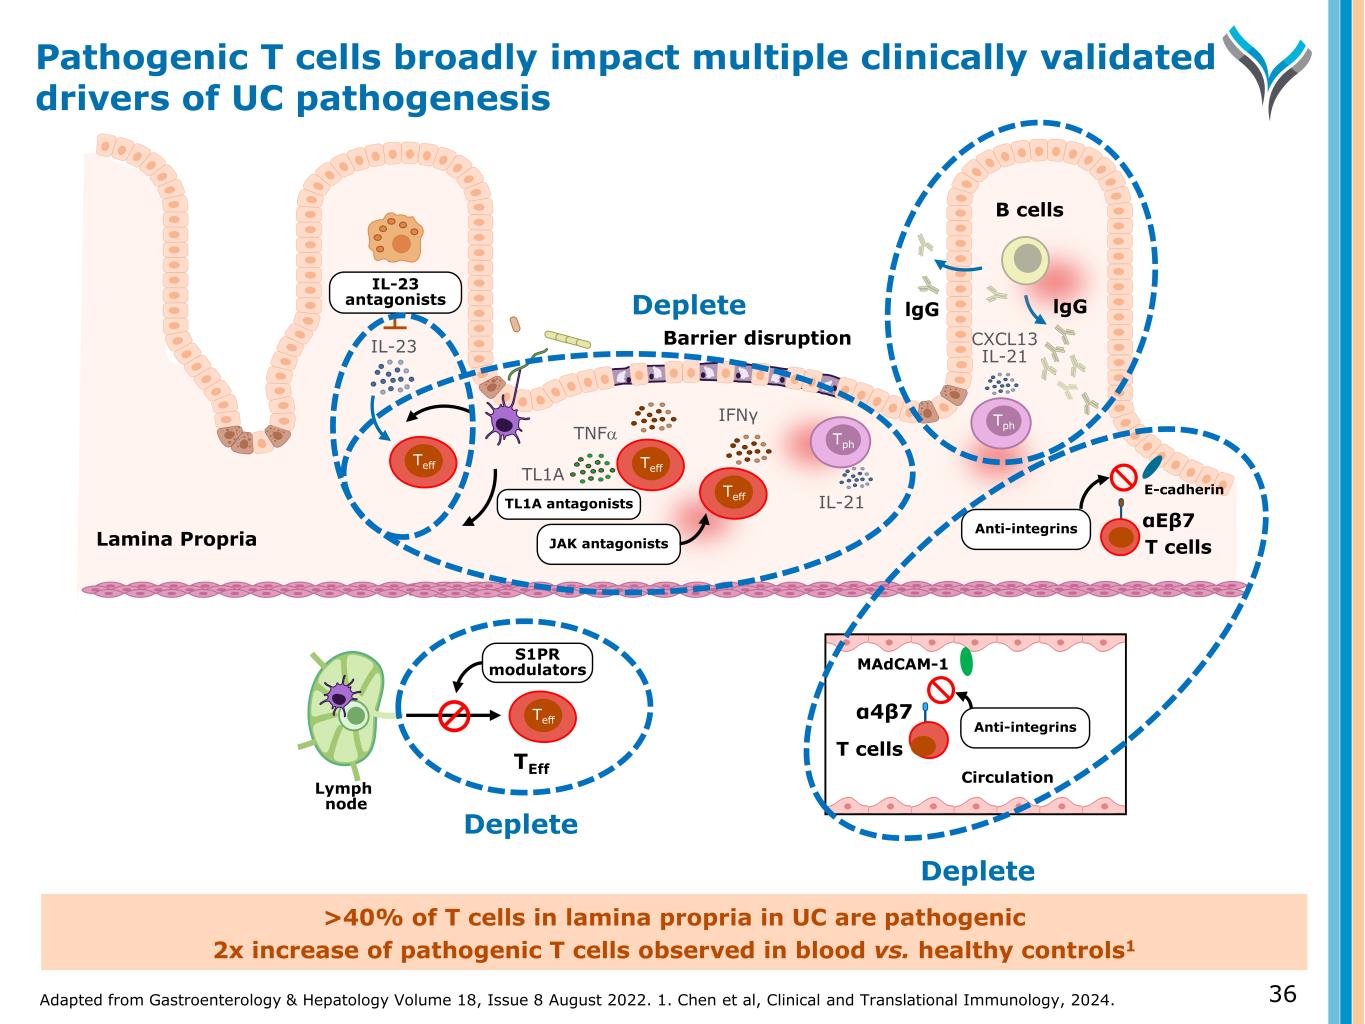
Adapted from Gastroenterology & Hepatology Volume 18, Issue 8 August 2022. 1. Chen et al, Clinical and Translational Immunology, 2024. 36 >40% of T cells in lamina propria in UC are pathogenic 2x increase of pathogenic T cells observed in blood vs. healthy controls1 B cells IL-23 antagonists αEβ7 Lymph node S1PR modulators TEff MAdCAM-1 Anti-integrins α4β7 Circulation Anti-integrins E-cadherin IFNγ IL-21 T cells T cells CXCL13 IL-21 JAK antagonists lgGlgG Barrier disruption TNFα IL-23 TL1A TL1A antagonists Teff Teff Teff Teff Deplete Deplete Deplete Tph Tph Lamina Propria Pathogenic T cells broadly impact multiple clinically validated drivers of UC pathogenesis
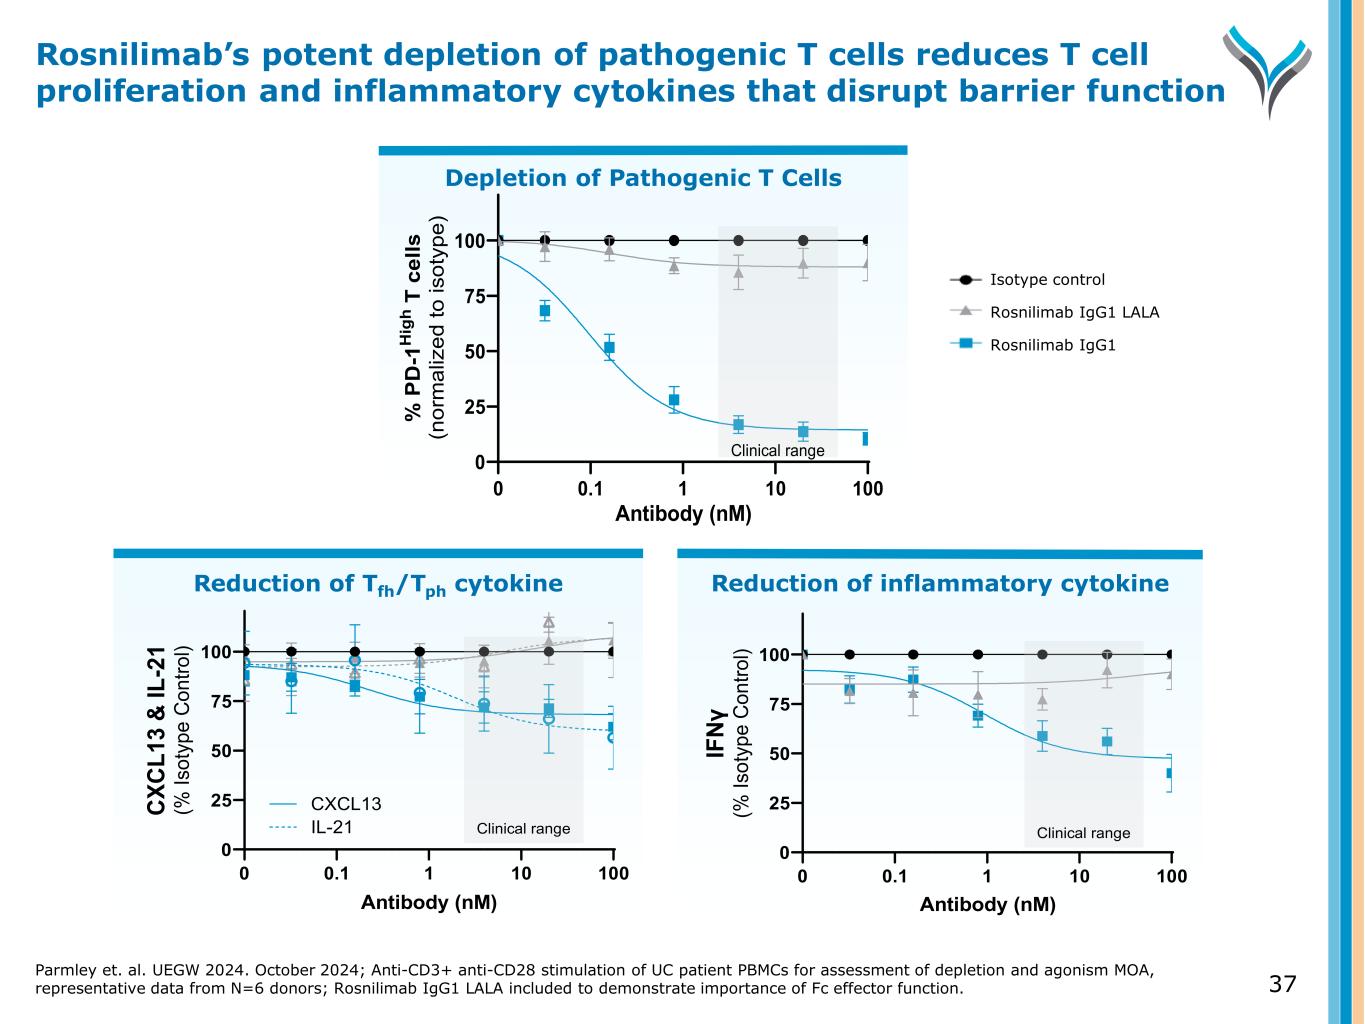
Reduction of Tfh/Tph cytokine 0 25 50 75 100 0 0.1 1 10 100 Antibody (nM) CX CL 13 & IL -2 1 (% Is ot yp e C on tro l) IL-21 CXCL13 Clinical range Reduction of inflammatory cytokine Depletion of Pathogenic T Cells Parmley et. al. UEGW 2024. October 2024; Anti-CD3+ anti-CD28 stimulation of UC patient PBMCs for assessment of depletion and agonism MOA, representative data from N=6 donors; Rosnilimab IgG1 LALA included to demonstrate importance of Fc effector function. 37 Rosnilimab’s potent depletion of pathogenic T cells reduces T cell proliferation and inflammatory cytokines that disrupt barrier function 0.1 1 10 100 0 25 50 75 100 Antibody (nM) % P D -1 H ig h T c el ls (n or m al iz ed to is ot yp e) 0 Clinical range 0 25 50 75 100 0 0.1 1 10 100 Antibody (nM) IF Nγ (% Is ot yp e C on tro l) Clinical range Isotype control Rosnilimab IgG1 LALA Rosnilimab IgG1
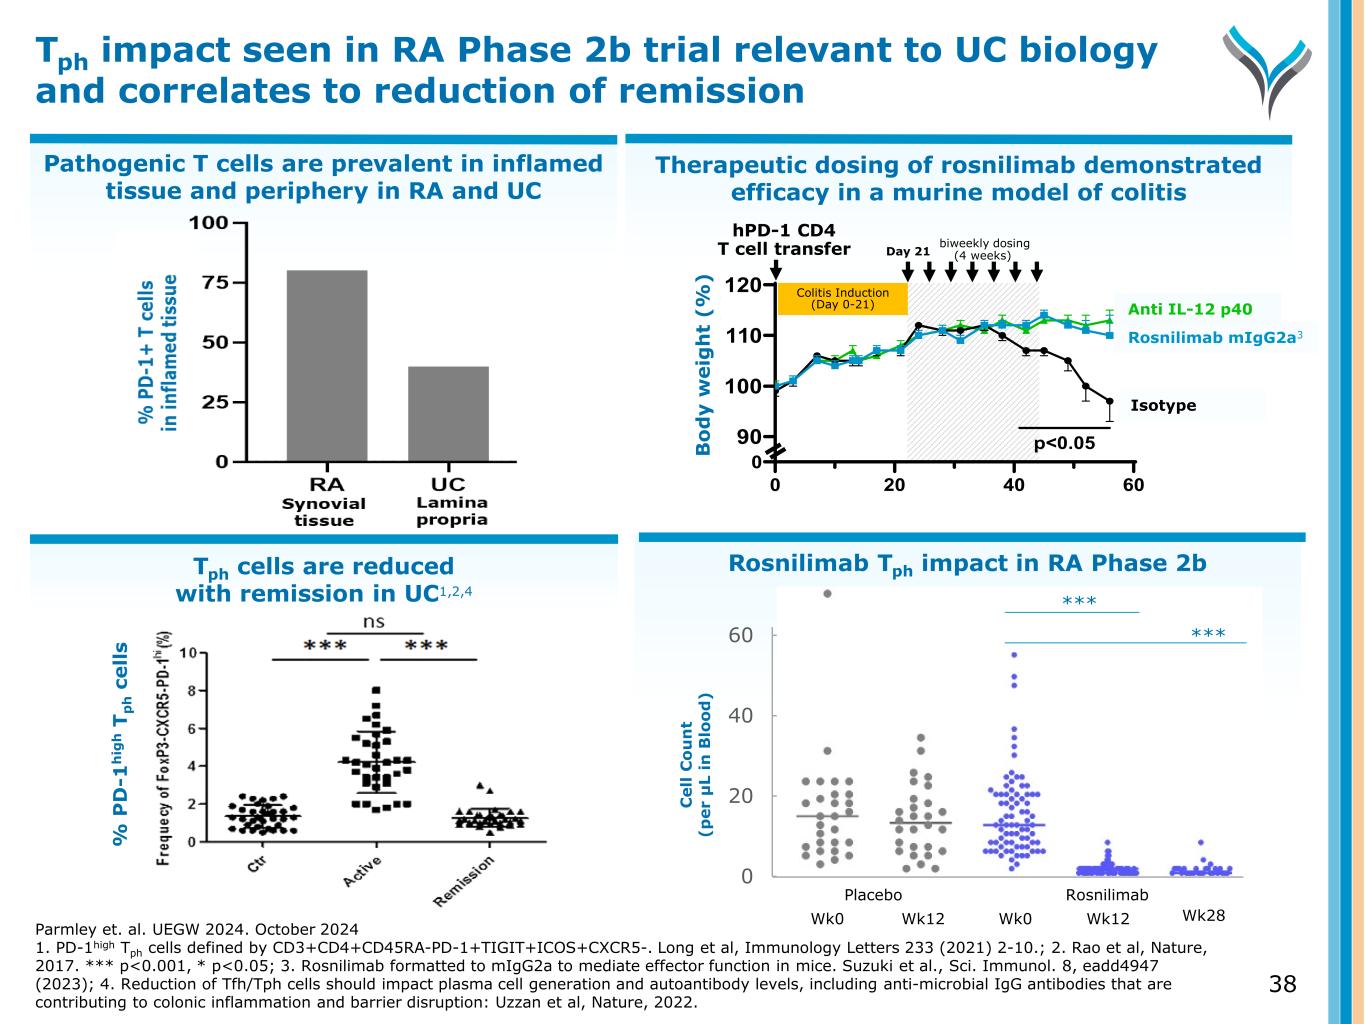
Pathogenic T cells are prevalent in inflamed tissue and periphery in RA and UC Therapeutic dosing of rosnilimab demonstrated efficacy in a murine model of colitis Tph cells are reduced with remission in UC1,2,4 Tph impact seen in RA Phase 2b trial relevant to UC biology and correlates to reduction of remission % P D -1 h ig h T p h c e ll s Parmley et. al. UEGW 2024. October 2024 1. PD-1high Tph cells defined by CD3+CD4+CD45RA-PD-1+TIGIT+ICOS+CXCR5-. Long et al, Immunology Letters 233 (2021) 2-10.; 2. Rao et al, Nature, 2017. *** p<0.001, * p<0.05; 3. Rosnilimab formatted to mIgG2a to mediate effector function in mice. Suzuki et al., Sci. Immunol. 8, eadd4947 (2023); 4. Reduction of Tfh/Tph cells should impact plasma cell generation and autoantibody levels, including anti-microbial IgG antibodies that are contributing to colonic inflammation and barrier disruption: Uzzan et al, Nature, 2022. 0 20 40 60 Bo dy w ei gh t ( % ) 100 110 120 90 Rosnilimab Isotype 0 p<0.05 Anti IL-12 p40 Colitis Induction (Day 0-21) hPD-1 CD4 T cell transfer biweekly dosing (4 weeks)Day 21 nilimab mIgG2a3 Anti IL-12 p40 Isotyp Rosnilimab Tph impact in RA Phase 2b 0 20 40 60 C el l C o u n t (p er μ L in B lo o d ) Wk0 Wk12 Wk0 Wk12 Placebo Rosnilimab Wk28 *** *** 38 B o d y w e ig h t (% )
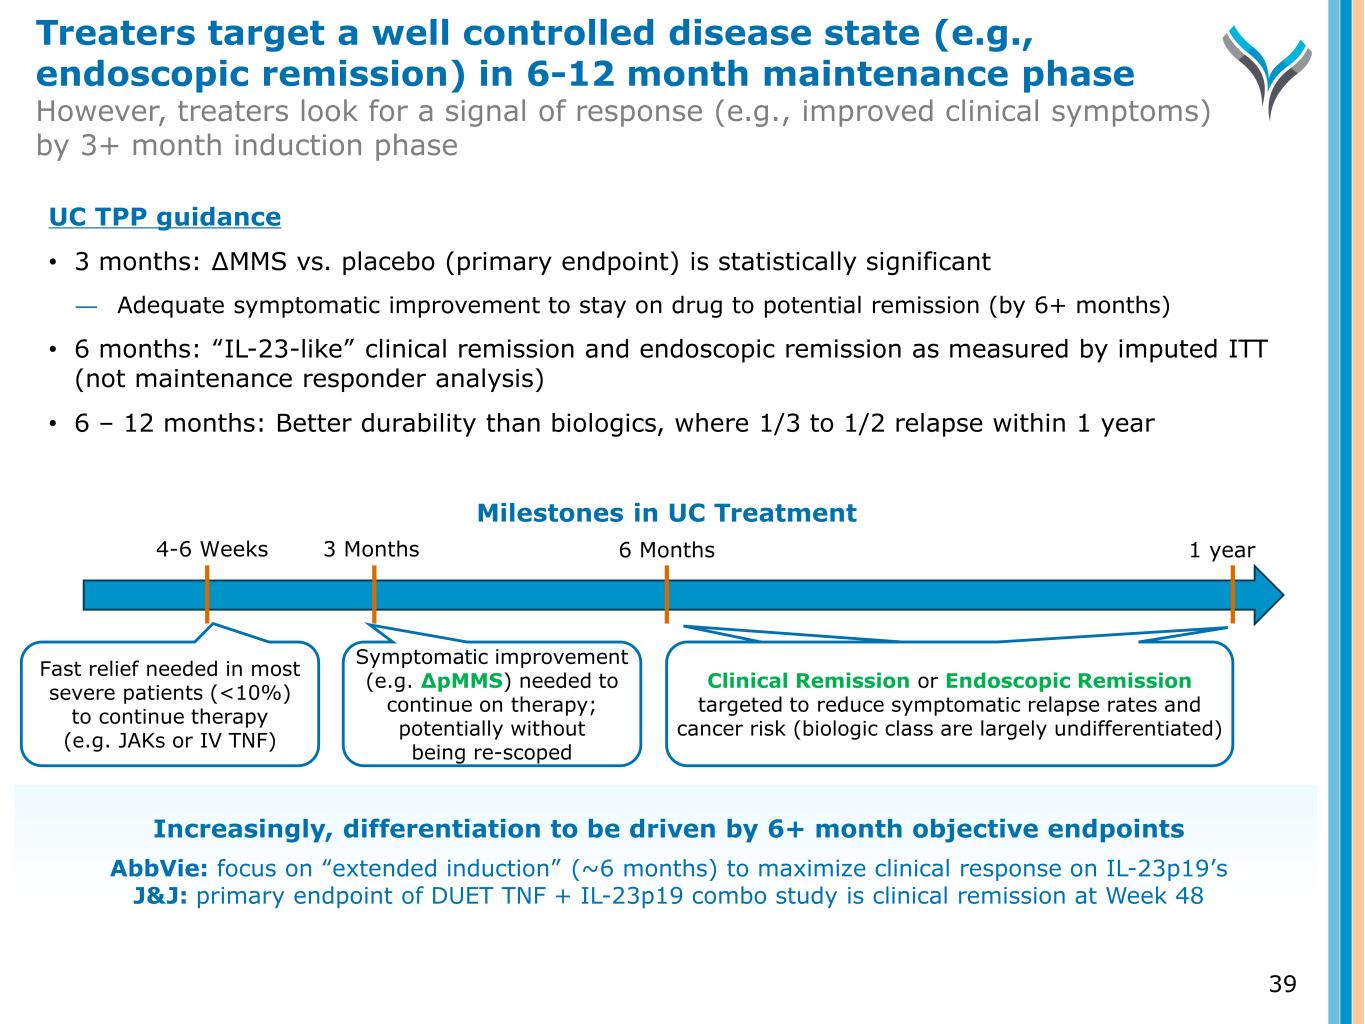
3 Months 6 Months Fast relief needed in most severe patients (<10%) to continue therapy (e.g. JAKs or IV TNF) Symptomatic improvement (e.g. ∆pMMS) needed to continue on therapy; potentially without being re-scoped Clinical Remission or Endoscopic Remission targeted to reduce symptomatic relapse rates and cancer risk (biologic class are largely undifferentiated) Milestones in UC Treatment 1 year4-6 Weeks UC TPP guidance • 3 months: ∆MMS vs. placebo (primary endpoint) is statistically significant ― Adequate symptomatic improvement to stay on drug to potential remission (by 6+ months) • 6 months: “IL-23-like” clinical remission and endoscopic remission as measured by imputed ITT (not maintenance responder analysis) • 6 – 12 months: Better durability than biologics, where 1/3 to 1/2 relapse within 1 year Increasingly, differentiation to be driven by 6+ month objective endpoints AbbVie: focus on “extended induction” (~6 months) to maximize clinical response on IL-23p19’s J&J: primary endpoint of DUET TNF + IL-23p19 combo study is clinical remission at Week 48 Treaters target a well controlled disease state (e.g., endoscopic remission) in 6-12 month maintenance phase However, treaters look for a signal of response (e.g., improved clinical symptoms) by 3+ month induction phase 39
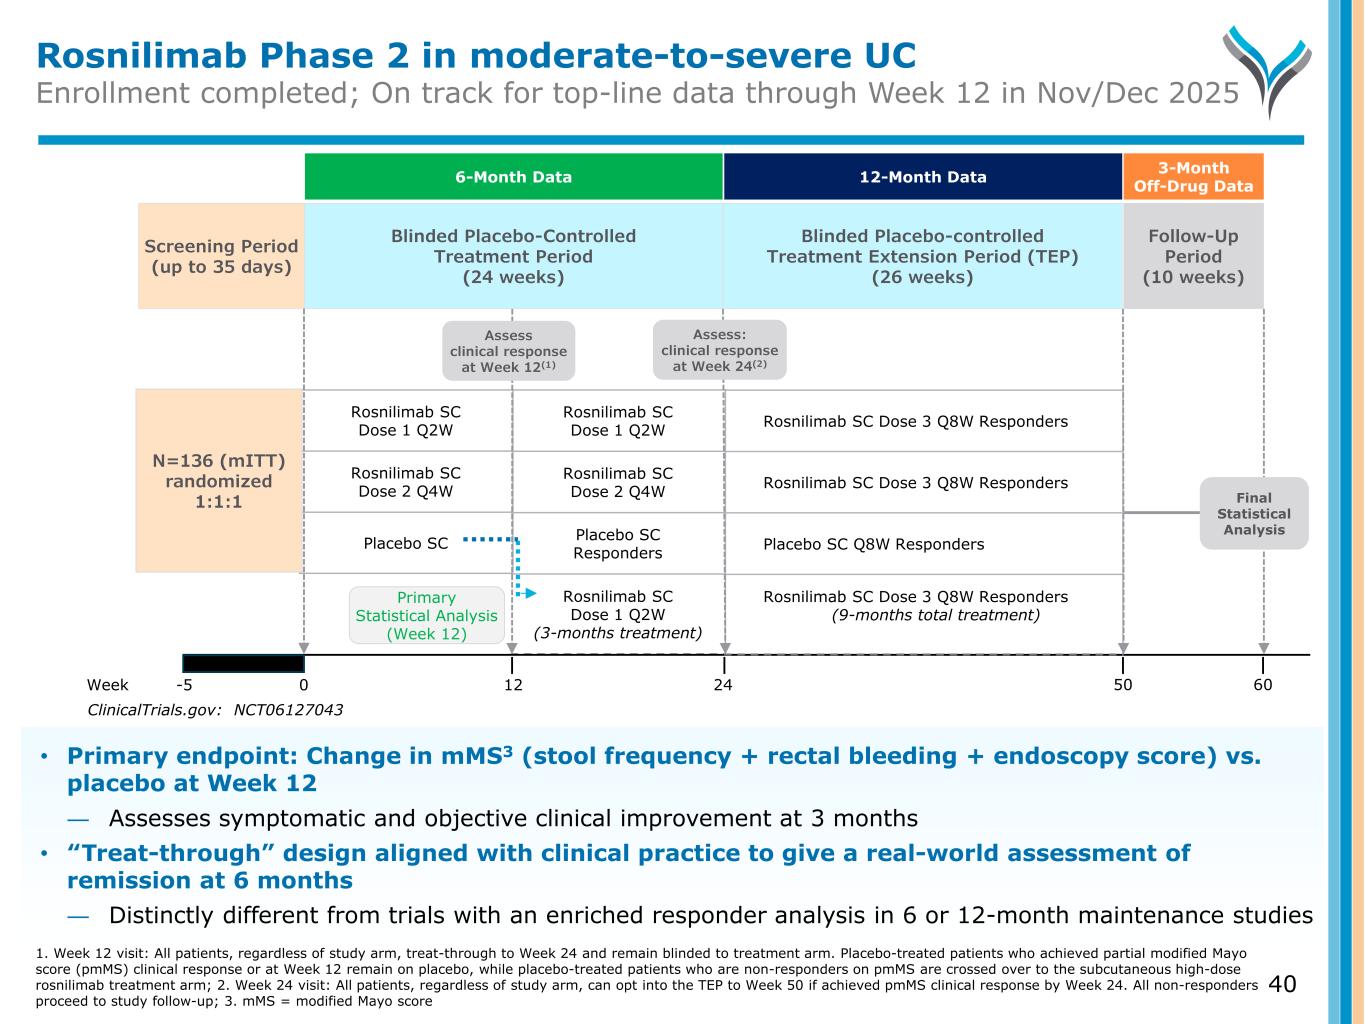
Rosnilimab Phase 2 in moderate-to-severe UC Enrollment completed; On track for top-line data through Week 12 in Nov/Dec 2025 Blinded Placebo-controlled Treatment Extension Period (TEP) (26 weeks) Screening Period (up to 35 days) Follow-Up Period (10 weeks) Week -5 0 12 24 Rosnilimab SC Dose 1 Q2W Rosnilimab SC Dose 2 Q4W Placebo SC Rosnilimab SC Dose 1 Q2W Rosnilimab SC Dose 2 Q4W Placebo SC Responders Rosnilimab SC Dose 1 Q2W (3-months treatment) N=136 (mITT) randomized 1:1:1 Final Statistical Analysis ClinicalTrials.gov: NCT06127043 Rosnilimab SC Dose 3 Q8W Responders Rosnilimab SC Dose 3 Q8W Responders Placebo SC Q8W Responders Rosnilimab SC Dose 3 Q8W Responders (9-months total treatment) 50 60 Primary Statistical Analysis (Week 12) Blinded Placebo-Controlled Treatment Period (24 weeks) Assess: clinical response at Week 24(2) Assess clinical response at Week 12(1) 6-Month Data 3-Month Off-Drug Data12-Month Data • Primary endpoint: Change in mMS3 (stool frequency + rectal bleeding + endoscopy score) vs. placebo at Week 12 ― Assesses symptomatic and objective clinical improvement at 3 months • “Treat-through” design aligned with clinical practice to give a real-world assessment of remission at 6 months ― Distinctly different from trials with an enriched responder analysis in 6 or 12-month maintenance studies 1. Week 12 visit: All patients, regardless of study arm, treat-through to Week 24 and remain blinded to treatment arm. Placebo-treated patients who achieved partial modified Mayo score (pmMS) clinical response or at Week 12 remain on placebo, while placebo-treated patients who are non-responders on pmMS are crossed over to the subcutaneous high-dose rosnilimab treatment arm; 2. Week 24 visit: All patients, regardless of study arm, can opt into the TEP to Week 50 if achieved pmMS clinical response by Week 24. All non-responders proceed to study follow-up; 3. mMS = modified Mayo score 40
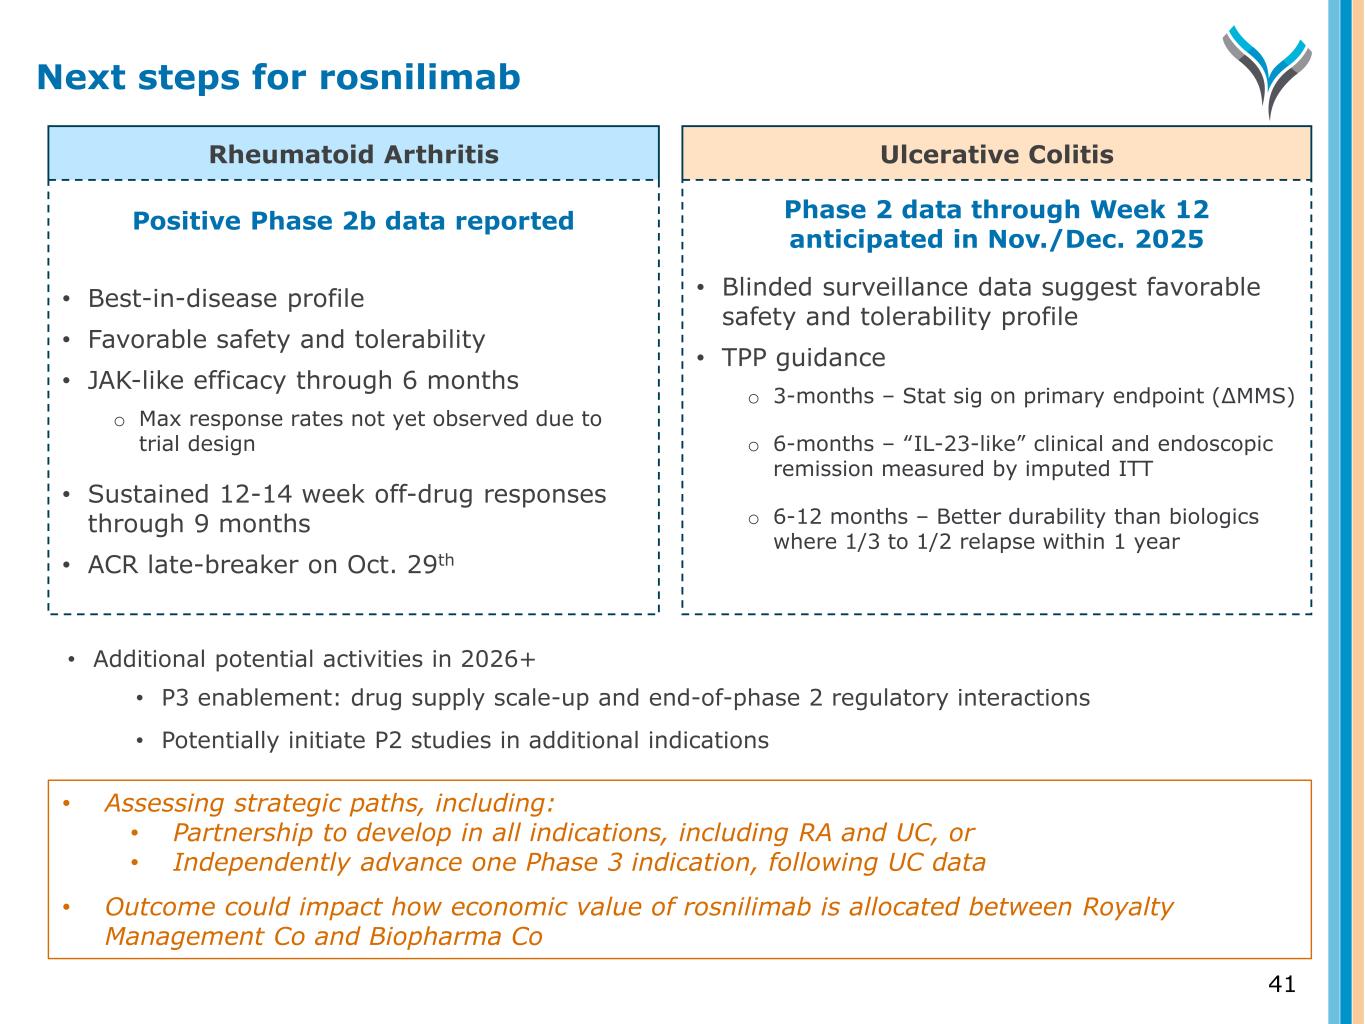
Rheumatoid Arthritis Ulcerative Colitis Positive Phase 2b data reported • Best-in-disease profile • Favorable safety and tolerability • JAK-like efficacy through 6 months o Max response rates not yet observed due to trial design • Sustained 12-14 week off-drug responses through 9 months • ACR late-breaker on Oct. 29th Phase 2 data through Week 12 anticipated in Nov./Dec. 2025 • Blinded surveillance data suggest favorable safety and tolerability profile • TPP guidance o 3-months – Stat sig on primary endpoint (∆MMS) o 6-months – “IL-23-like” clinical and endoscopic remission measured by imputed ITT o 6-12 months – Better durability than biologics where 1/3 to 1/2 relapse within 1 year • Additional potential activities in 2026+ • P3 enablement: drug supply scale-up and end-of-phase 2 regulatory interactions • Potentially initiate P2 studies in additional indications Next steps for rosnilimab 41 • Assessing strategic paths, including: • Partnership to develop in all indications, including RA and UC, or • Independently advance one Phase 3 indication, following UC data • Outcome could impact how economic value of rosnilimab is allocated between Royalty Management Co and Biopharma Co
(CD122 antagonist) ANB033
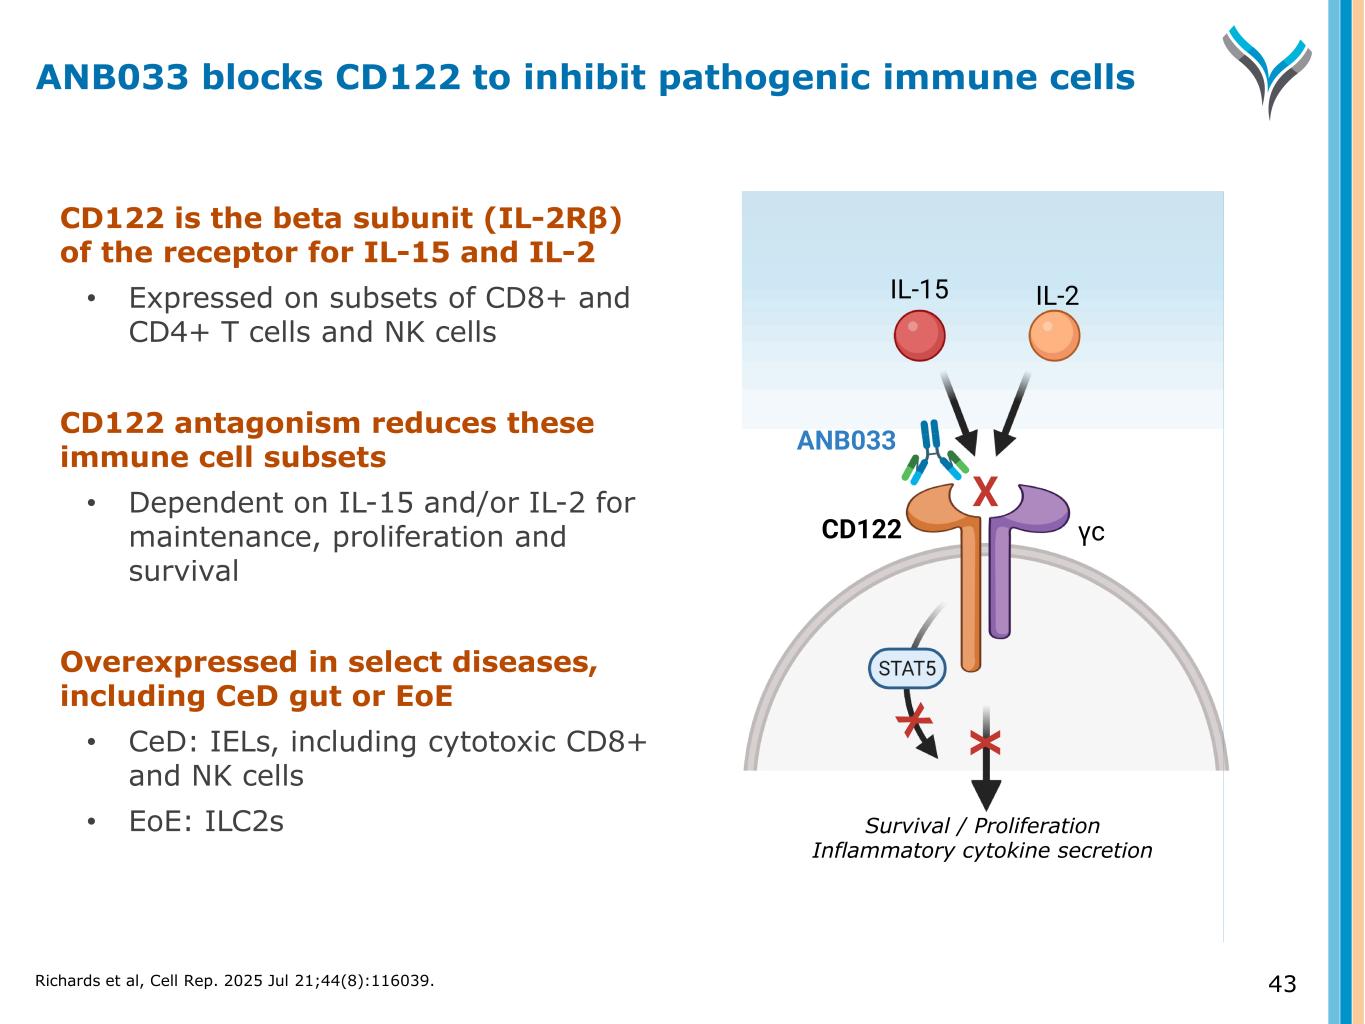
43 CD122 is the beta subunit (IL-2Rβ) of the receptor for IL-15 and IL-2 • Expressed on subsets of CD8+ and CD4+ T cells and NK cells CD122 antagonism reduces these immune cell subsets • Dependent on IL-15 and/or IL-2 for maintenance, proliferation and survival Overexpressed in select diseases, including CeD gut or EoE • CeD: IELs, including cytotoxic CD8+ and NK cells • EoE: ILC2s Survival / Proliferation Inflammatory cytokine secretion CD122 γc IL-15 IL-2 ANB033 X X ANB033 blocks CD122 to inhibit pathogenic immune cells Richards et al, Cell Rep. 2025 Jul 21;44(8):116039.
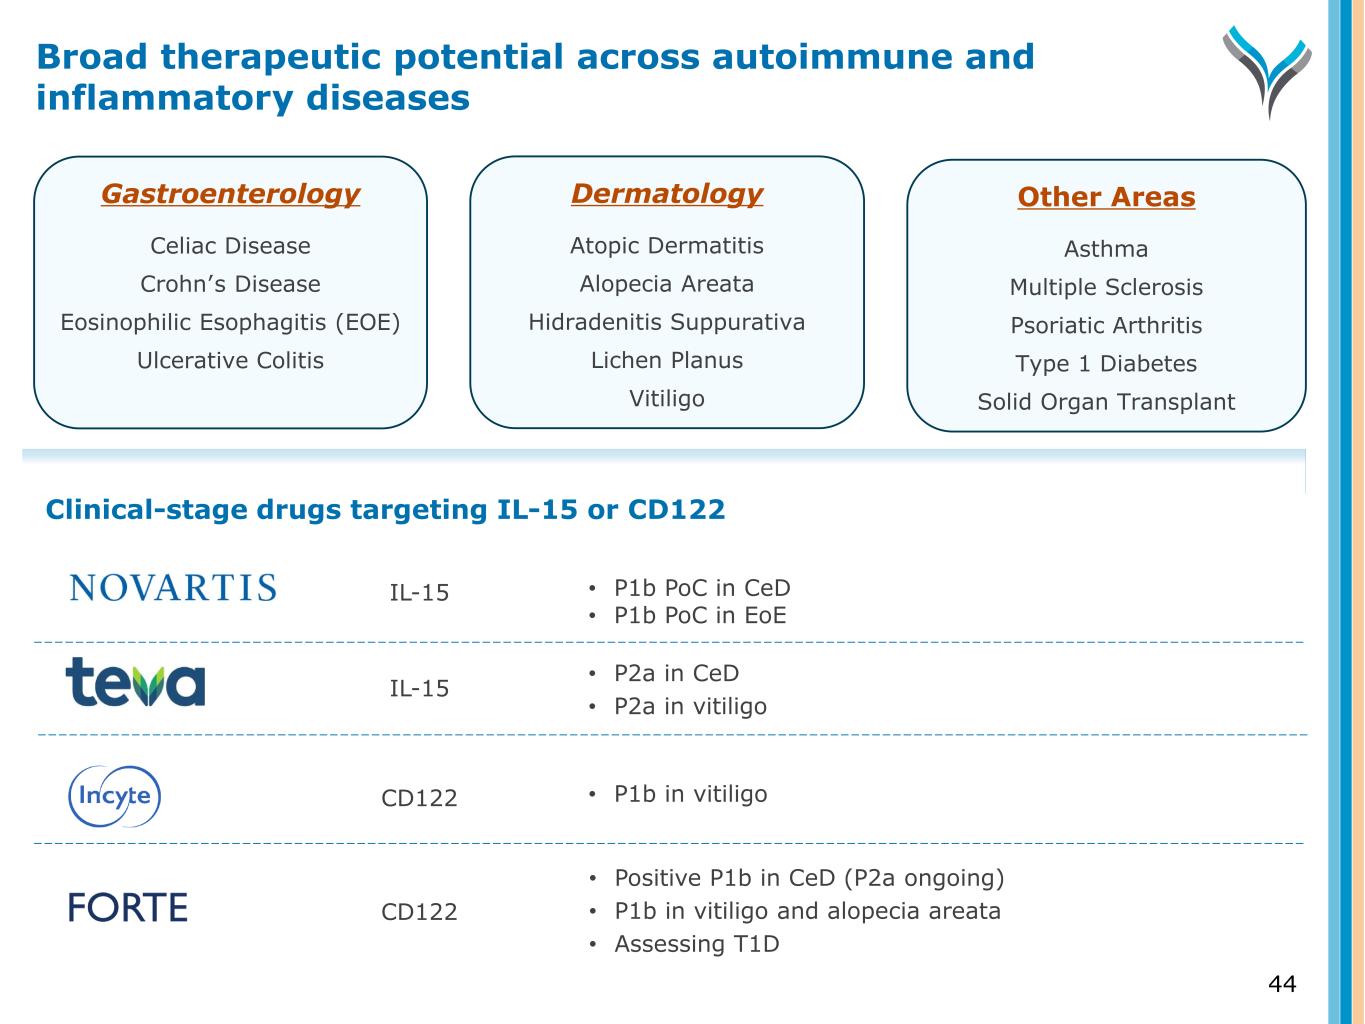
Gastroenterology Celiac Disease Crohn’s Disease Eosinophilic Esophagitis (EOE) Ulcerative Colitis Dermatology Atopic Dermatitis Alopecia Areata Hidradenitis Suppurativa Lichen Planus Vitiligo Other Areas Asthma Multiple Sclerosis Psoriatic Arthritis Type 1 Diabetes Solid Organ Transplant • P1b PoC in CeD • P1b PoC in EoE • P2a in CeD • P2a in vitiligo • P1b in vitiligo • Positive P1b in CeD (P2a ongoing) • P1b in vitiligo and alopecia areata • Assessing T1D Clinical-stage drugs targeting IL-15 or CD122 IL-15 IL-15 CD122 CD122 Broad therapeutic potential across autoimmune and inflammatory diseases 44
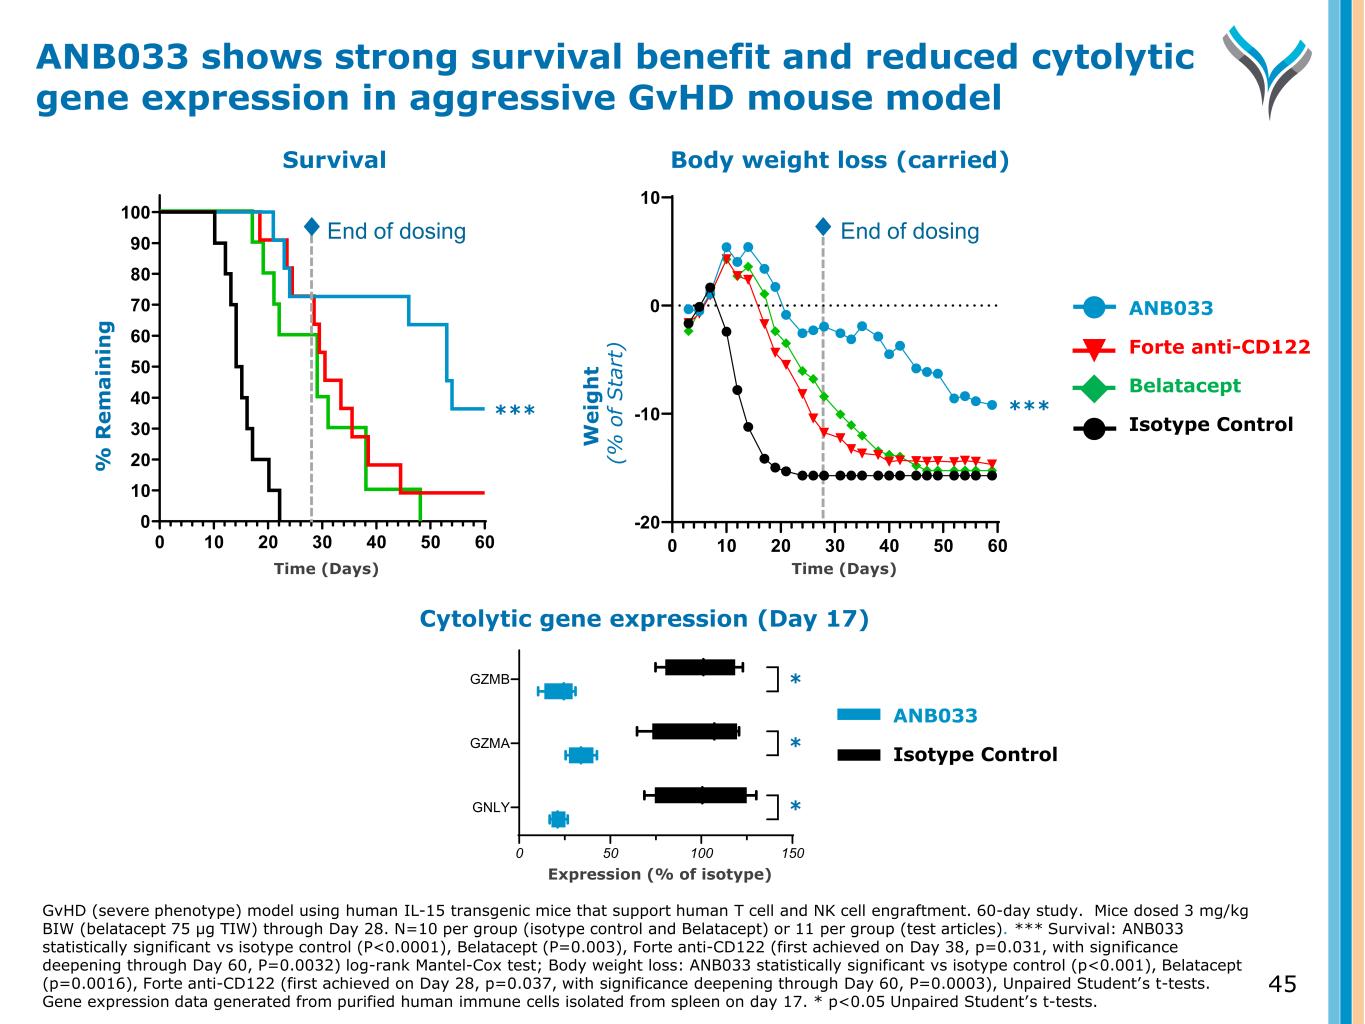
45 Body weight loss (carried) W e ig h t ( % o f S ta rt ) End of dosing 0 10 20 30 40 50 60 -20 -10 0 10 Study Day Cytolytic gene expression (Day 17) Expression (% of isotype) 0 50 100 150 GNLY GZMA GZMB ✱ ✱ ✱ ANB033 Forte anti-CD122 Belatacept Isotype Control ANB033 Isotype Control ****** Survival W e ig h t ( % o f S ta rt ) % R e m a in in g 0 10 20 30 40 50 60 0 10 20 30 40 50 60 70 80 90 100 Study Day End of dosing ANB033 shows strong survival benefit and reduced cytolytic gene expression in aggressive GvHD mouse model GvHD (severe phenotype) model using human IL-15 transgenic mice that support human T cell and NK cell engraftment. 60-day study. Mice dosed 3 mg/kg BIW (belatacept 75 µg TIW) through Day 28. N=10 per group (isotype control and Belatacept) or 11 per group (test articles). *** Survival: ANB033 statistically significant vs isotype control (P<0.0001), Belatacept (P=0.003), Forte anti-CD122 (first achieved on Day 38, p=0.031, with significance deepening through Day 60, P=0.0032) log-rank Mantel-Cox test; Body weight loss: ANB033 statistically significant vs isotype control (p<0.001), Belatacept (p=0.0016), Forte anti-CD122 (first achieved on Day 28, p=0.037, with significance deepening through Day 60, P=0.0003), Unpaired Student’s t-tests. Gene expression data generated from purified human immune cells isolated from spleen on day 17. * p<0.05 Unpaired Student’s t-tests. Time (Days) Time (Days) * * *
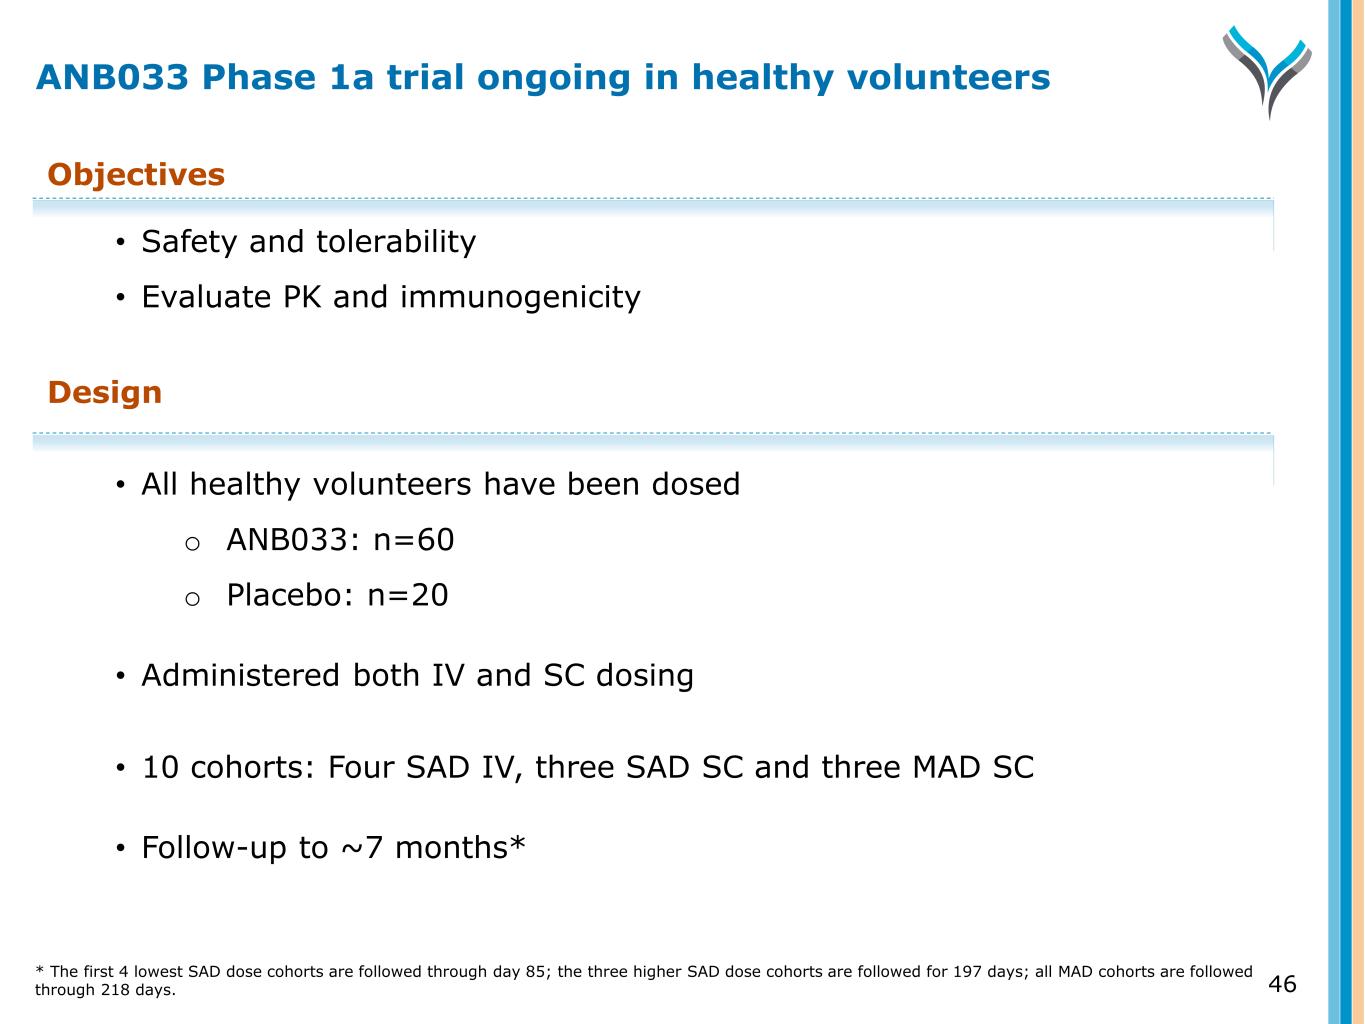
46 Objectives • Safety and tolerability • Evaluate PK and immunogenicity Design • All healthy volunteers have been dosed o ANB033: n=60 o Placebo: n=20 • Administered both IV and SC dosing • 10 cohorts: Four SAD IV, three SAD SC and three MAD SC • Follow-up to ~7 months* ANB033 Phase 1a trial ongoing in healthy volunteers * The first 4 lowest SAD dose cohorts are followed through day 85; the three higher SAD dose cohorts are followed for 197 days; all MAD cohorts are followed through 218 days.
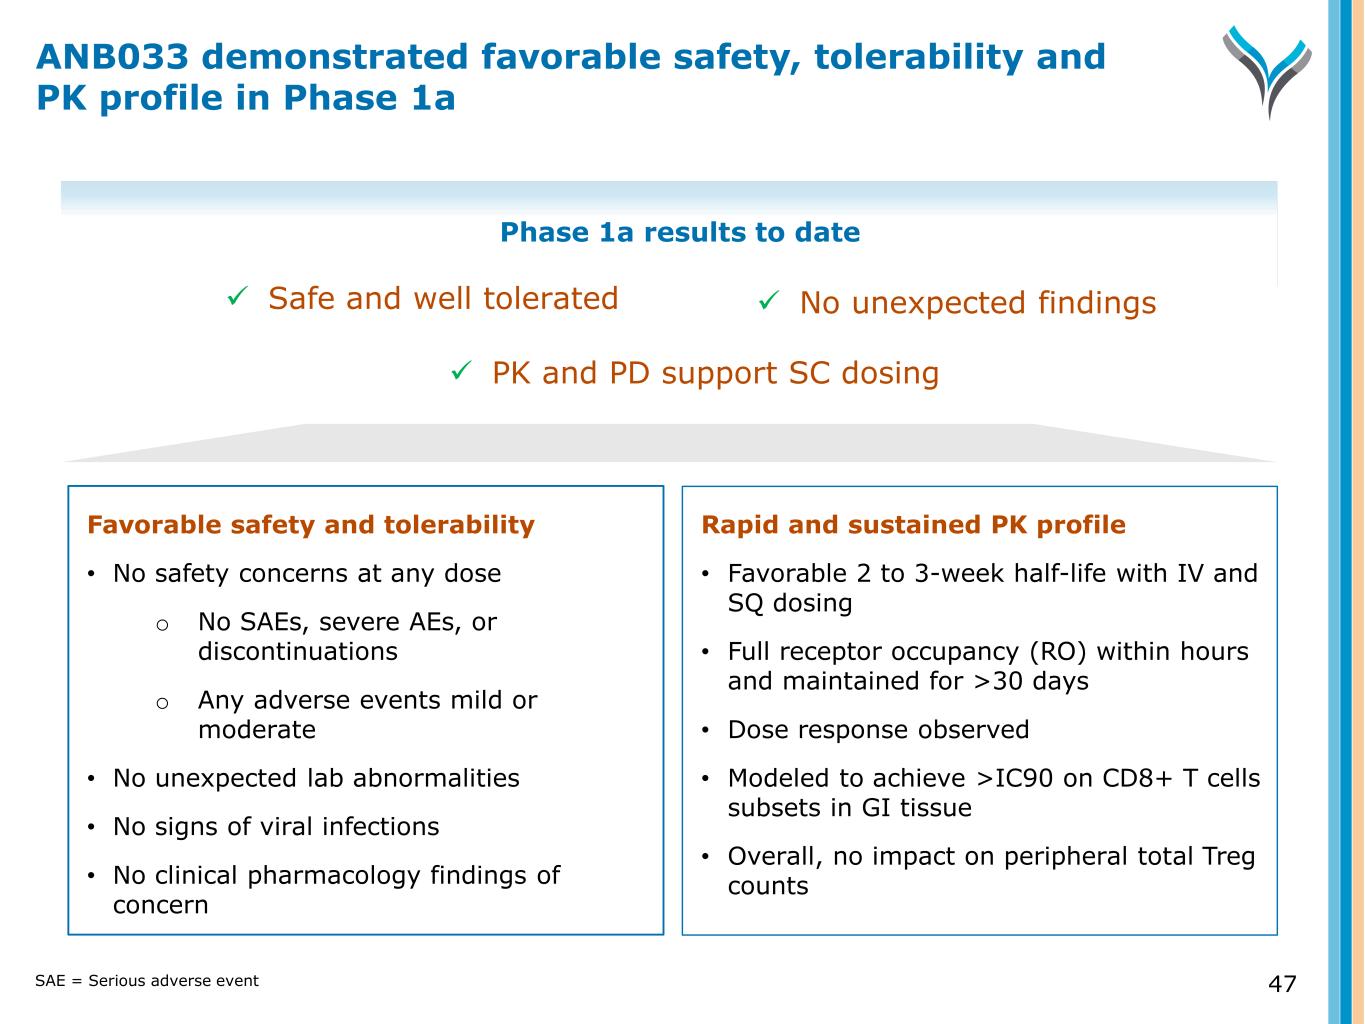
47 Favorable safety and tolerability • No safety concerns at any dose o No SAEs, severe AEs, or discontinuations o Any adverse events mild or moderate • No unexpected lab abnormalities • No signs of viral infections • No clinical pharmacology findings of concern Rapid and sustained PK profile • Favorable 2 to 3-week half-life with IV and SQ dosing • Full receptor occupancy (RO) within hours and maintained for >30 days • Dose response observed • Modeled to achieve >IC90 on CD8+ T cells subsets in GI tissue • Overall, no impact on peripheral total Treg counts Phase 1a results to date Safe and well tolerated No unexpected findings PK and PD support SC dosing ANB033 demonstrated favorable safety, tolerability and PK profile in Phase 1a SAE = Serious adverse event
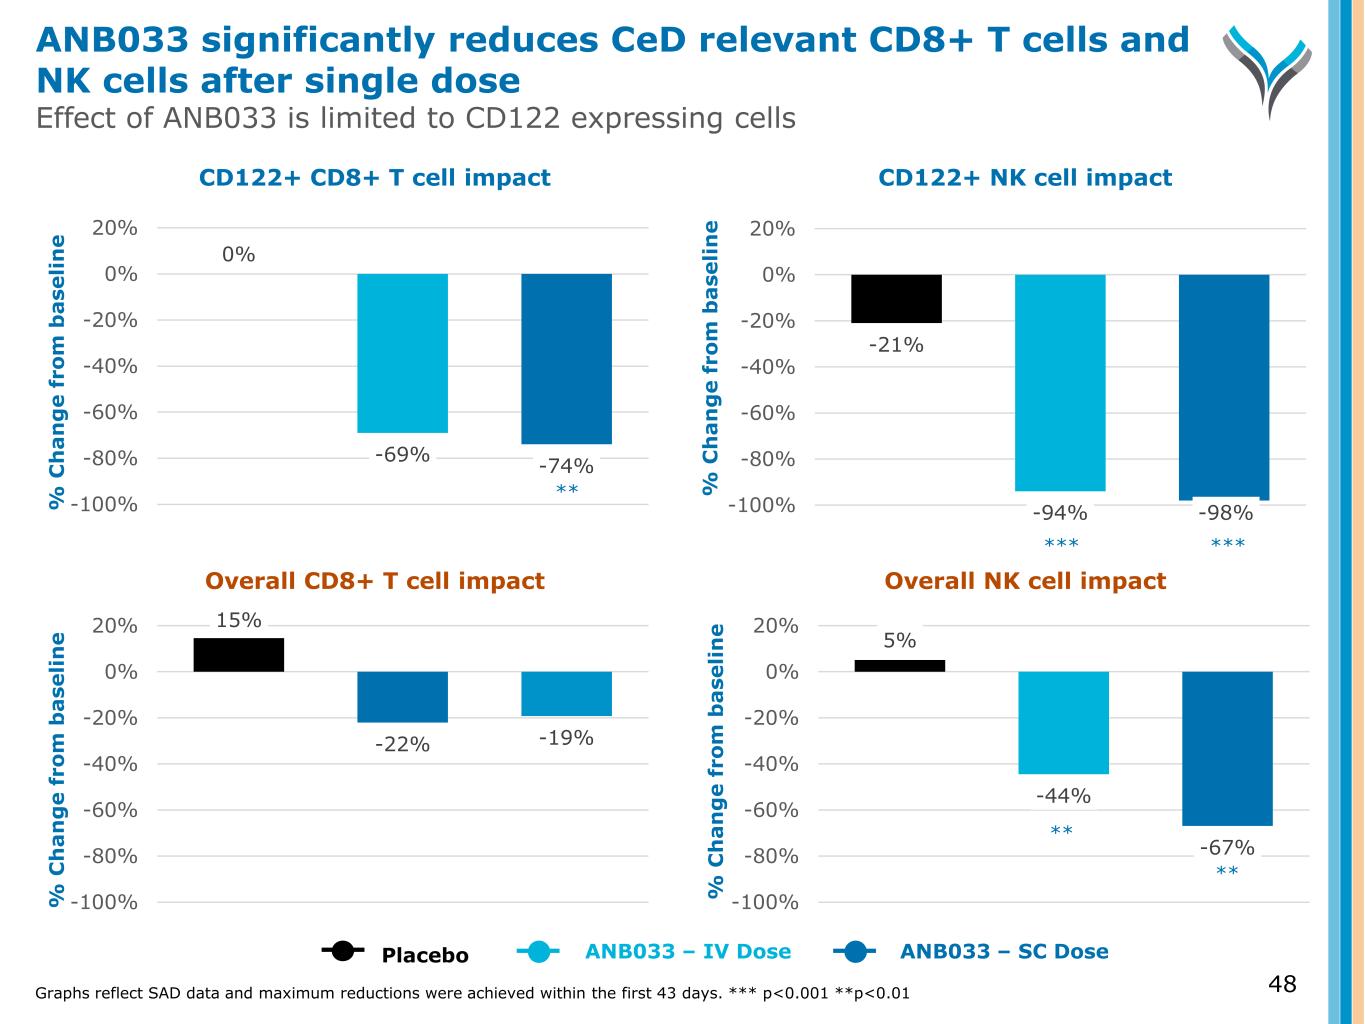
48 % C h a n g e f ro m b a se li n e % C h a n g e f ro m b a se li n e % C h a n g e f ro m b a se li n e % C h a n g e f ro m b a se li n e CD122+ CD8+ T cell impact CD122+ NK cell impact Overall CD8+ T cell impact Overall NK cell impact Graphs reflect SAD data and maximum reductions were achieved within the first 43 days. *** p<0.001 **p<0.01 15% -22% -19% -100% -80% -60% -40% -20% 0% 20% 5% -44% -67% -100% -80% -60% -40% -20% 0% 20% Placebo ANB033 – IV Dose ANB033 – SC Dose 0% -69% -74% -100% -80% -60% -40% -20% 0% 20% -21% -94% -98%-100% -80% -60% -40% -20% 0% 20% ANB033 significantly reduces CeD relevant CD8+ T cells and NK cells after single dose Effect of ANB033 is limited to CD122 expressing cells *** *** ** ** **
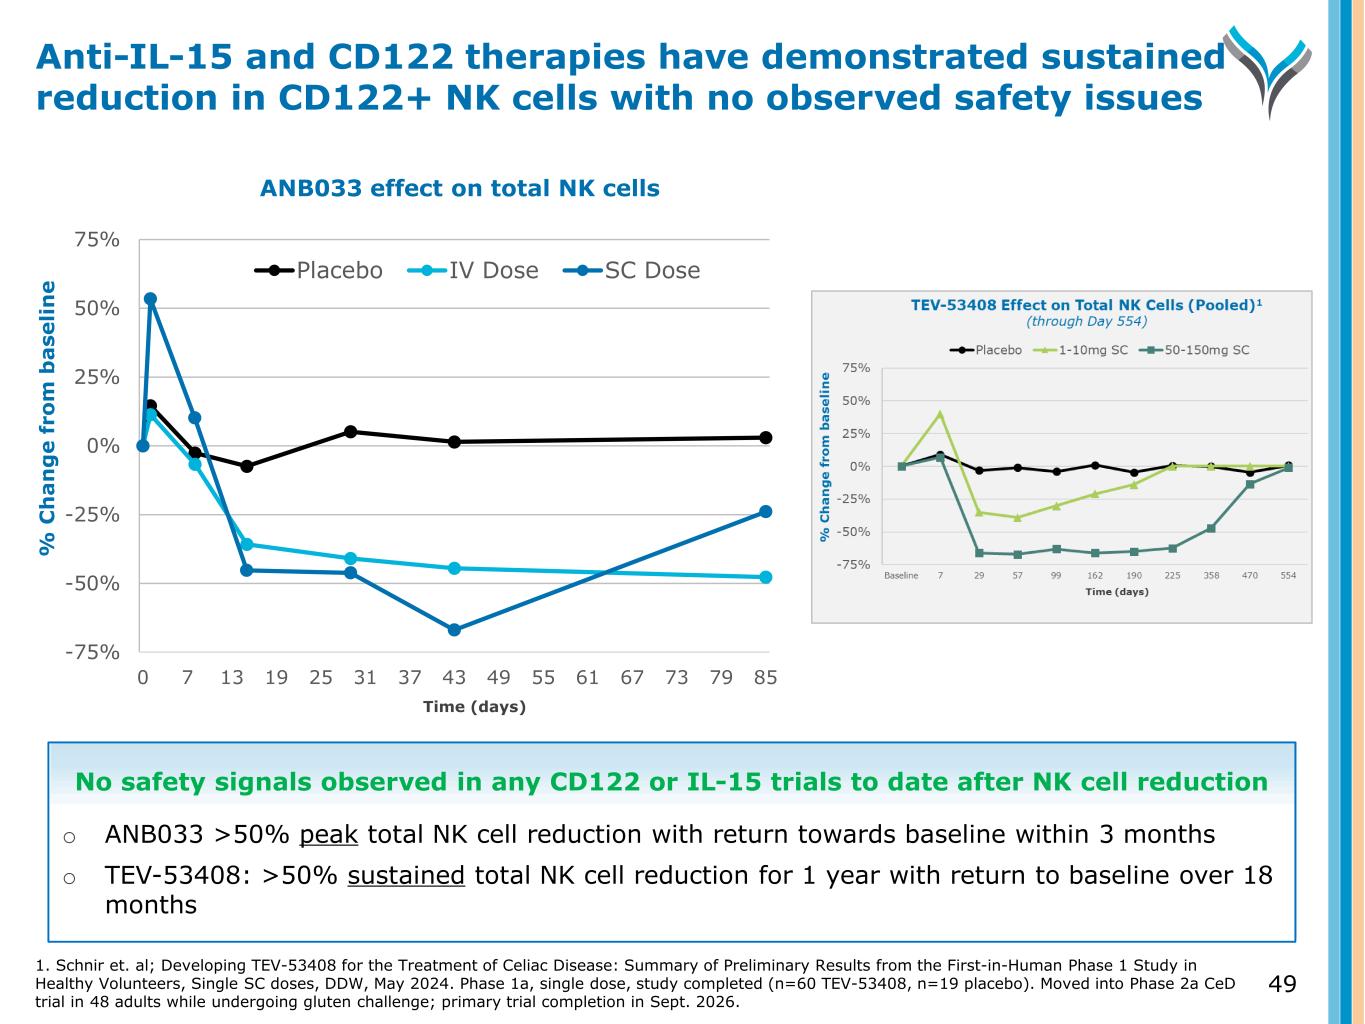
% C h a n g e f ro m b a se li n e -75% -50% -25% 0% 25% 50% 75% 0 7 13 19 25 31 37 43 49 55 61 67 73 79 85 Placebo IV Dose SC Dose 49 Anti-IL-15 and CD122 therapies have demonstrated sustained reduction in CD122+ NK cells with no observed safety issues ANB033 effect on total NK cells Time (days) No safety signals observed in any CD122 or IL-15 trials to date after NK cell reduction o ANB033 >50% peak total NK cell reduction with return towards baseline within 3 months o TEV-53408: >50% sustained total NK cell reduction for 1 year with return to baseline over 18 months 1. Schnir et. al; Developing TEV-53408 for the Treatment of Celiac Disease: Summary of Preliminary Results from the First-in-Human Phase 1 Study in Healthy Volunteers, Single SC doses, DDW, May 2024. Phase 1a, single dose, study completed (n=60 TEV-53408, n=19 placebo). Moved into Phase 2a CeD trial in 48 adults while undergoing gluten challenge; primary trial completion in Sept. 2026.
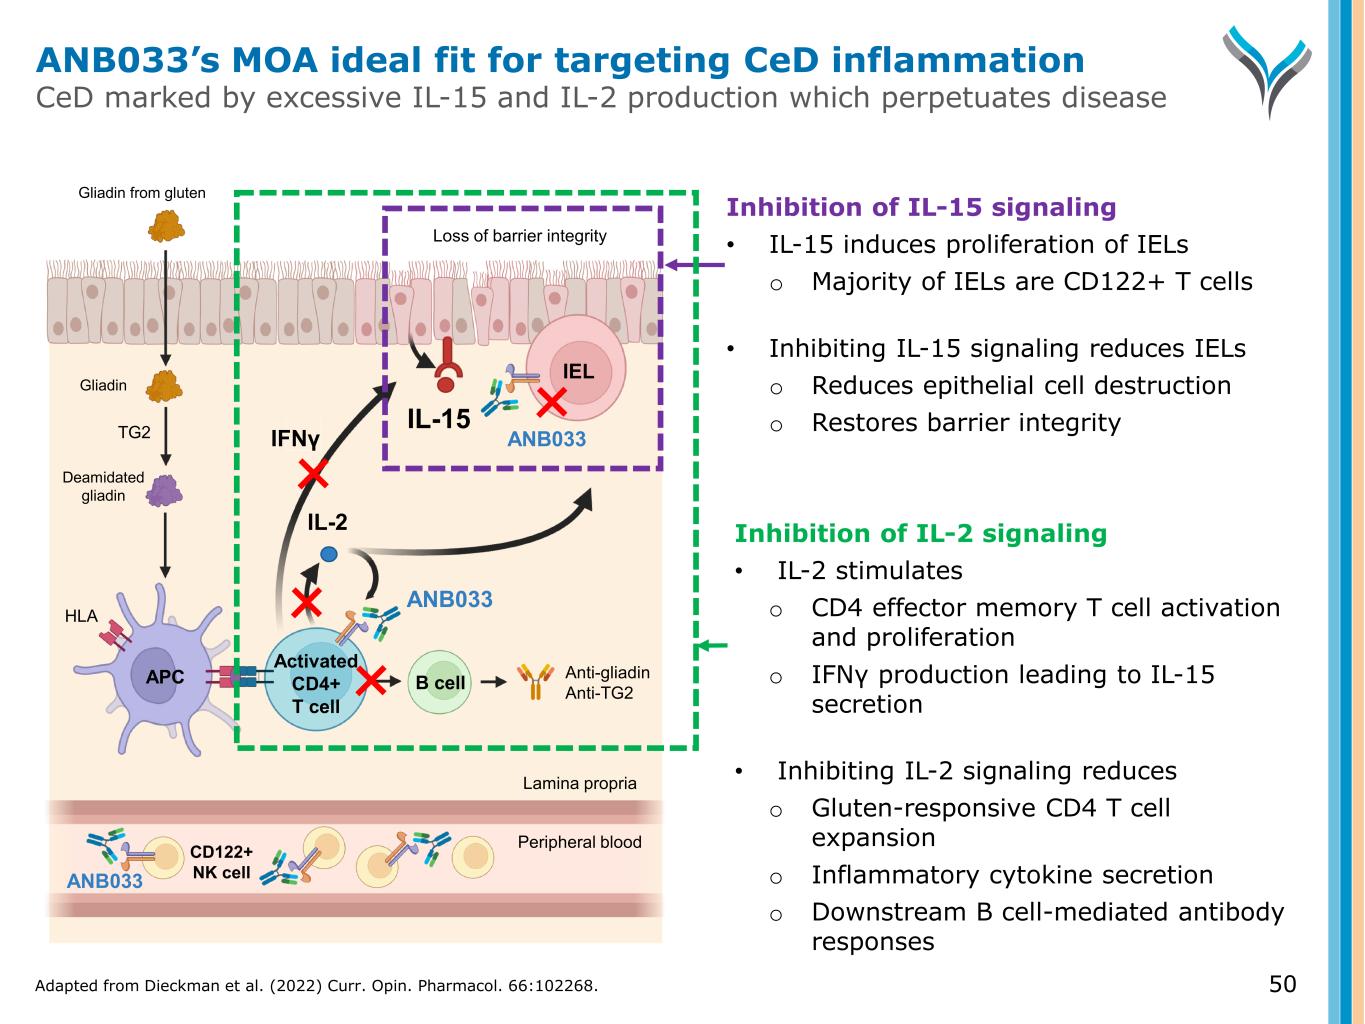
50 Activated CD4+ T cell IL-2 TG2 Anti-gliadin Anti-TG2 IEL APC B cell Gliadin Gliadin from gluten ANB033 Deamidated gliadin IFNγ ANB033 HLA Loss of barrier integrity IL-15 CD122+ NK cell Peripheral blood Lamina propria Inhibition of IL-2 signaling • IL-2 stimulates o CD4 effector memory T cell activation and proliferation o IFNγ production leading to IL-15 secretion • Inhibiting IL-2 signaling reduces o Gluten-responsive CD4 T cell expansion o Inflammatory cytokine secretion o Downstream B cell-mediated antibody responses Inhibition of IL-15 signaling • IL-15 induces proliferation of IELs o Majority of IELs are CD122+ T cells • Inhibiting IL-15 signaling reduces IELs o Reduces epithelial cell destruction o Restores barrier integrity ANB033 ANB033’s MOA ideal fit for targeting CeD inflammation CeD marked by excessive IL-15 and IL-2 production which perpetuates disease Adapted from Dieckman et al. (2022) Curr. Opin. Pharmacol. 66:102268.
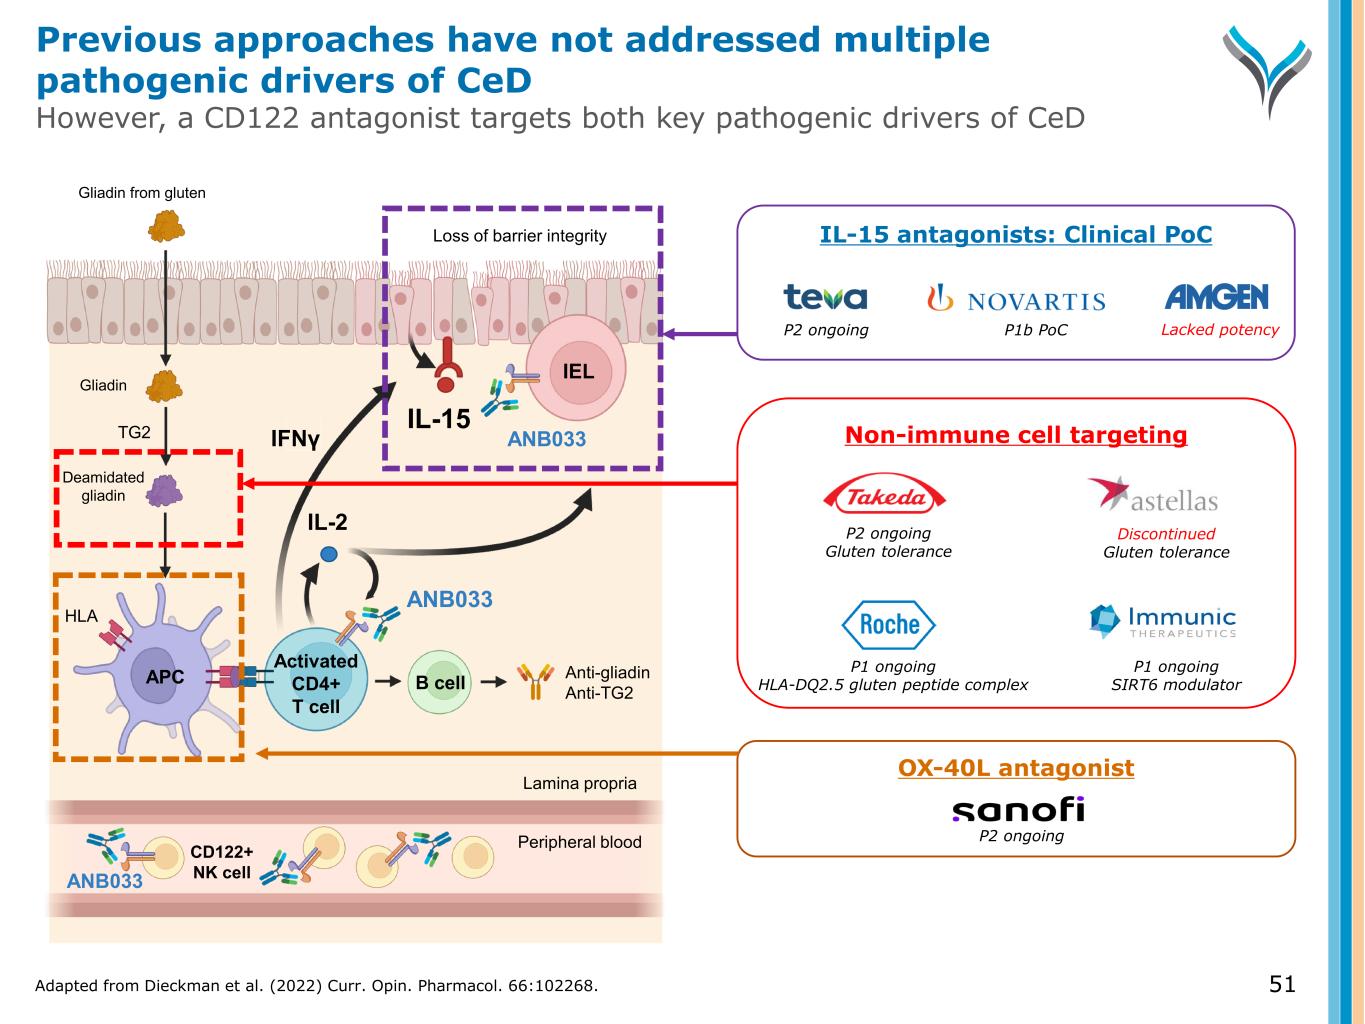
51 Activated CD4+ T cell IL-2 TG2 Anti-gliadin Anti-TG2 IEL APC B cell Gliadin Gliadin from gluten ANB033 Deamidated gliadin IFNγ ANB033 HLA Loss of barrier integrity IL-15 CD122+ NK cell Peripheral blood Lamina propria OX-40L antagonist P2 ongoing Non-immune cell targeting P1 ongoing HLA-DQ2.5 gluten peptide complex P1 ongoing SIRT6 modulator P2 ongoing Gluten tolerance Discontinued Gluten tolerance IL-15 antagonists: Clinical PoC P2 ongoing P1b PoC Lacked potency ANB033 Adapted from Dieckman et al. (2022) Curr. Opin. Pharmacol. 66:102268. Previous approaches have not addressed multiple pathogenic drivers of CeD However, a CD122 antagonist targets both key pathogenic drivers of CeD
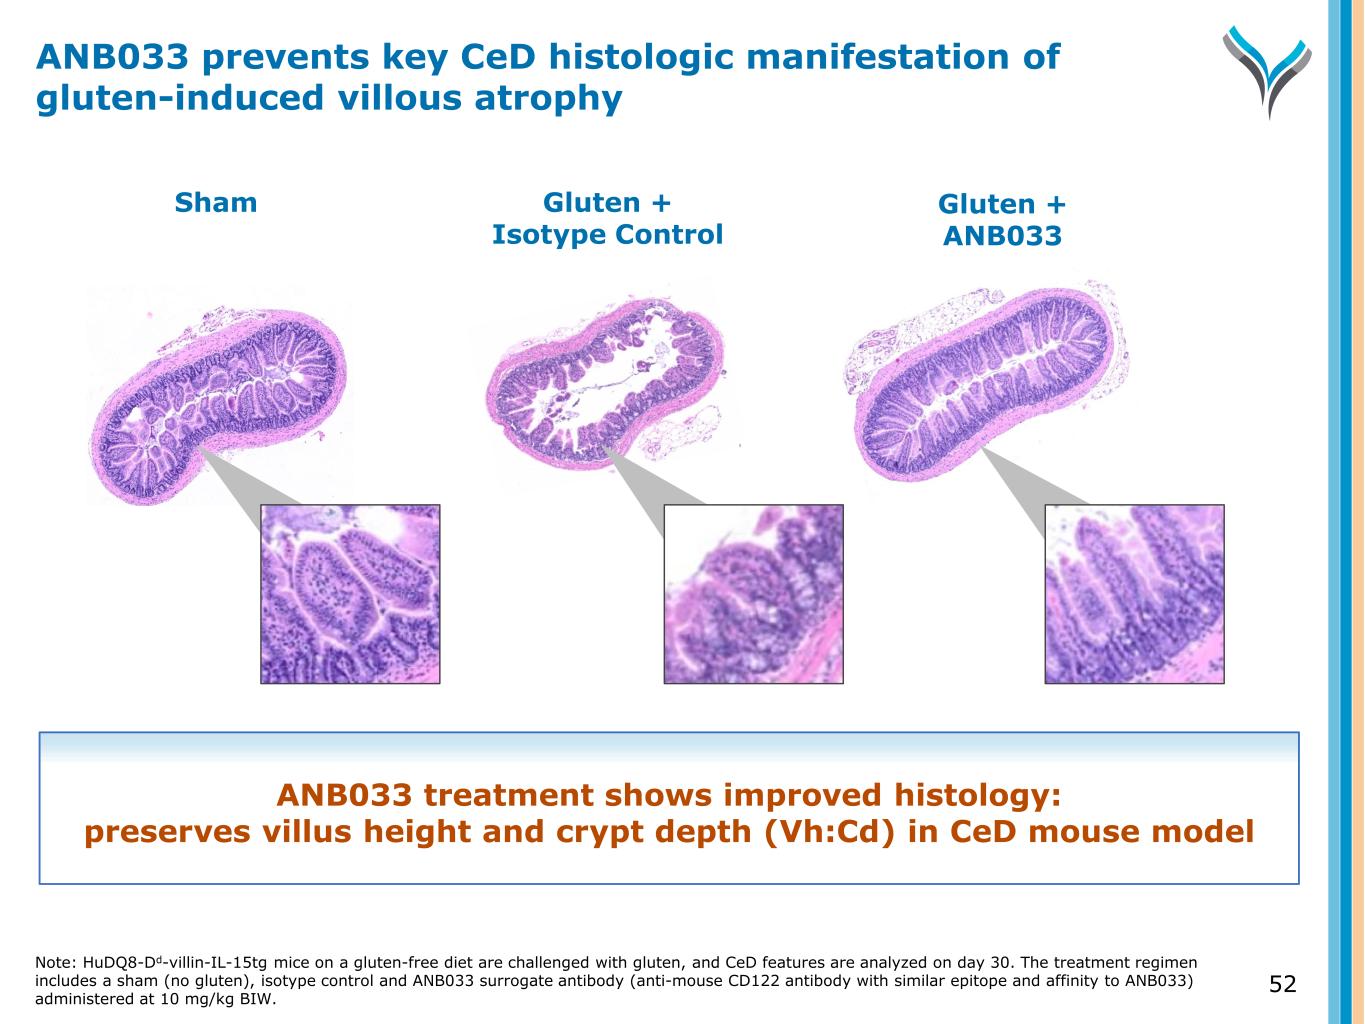
52 Sham Gluten + Isotype Control Gluten + ANB033 ANB033 treatment shows improved histology: preserves villus height and crypt depth (Vh:Cd) in CeD mouse model ANB033 prevents key CeD histologic manifestation of gluten-induced villous atrophy Note: HuDQ8-Dd-villin-IL-15tg mice on a gluten-free diet are challenged with gluten, and CeD features are analyzed on day 30. The treatment regimen includes a sham (no gluten), isotype control and ANB033 surrogate antibody (anti-mouse CD122 antibody with similar epitope and affinity to ANB033) administered at 10 mg/kg BIW.
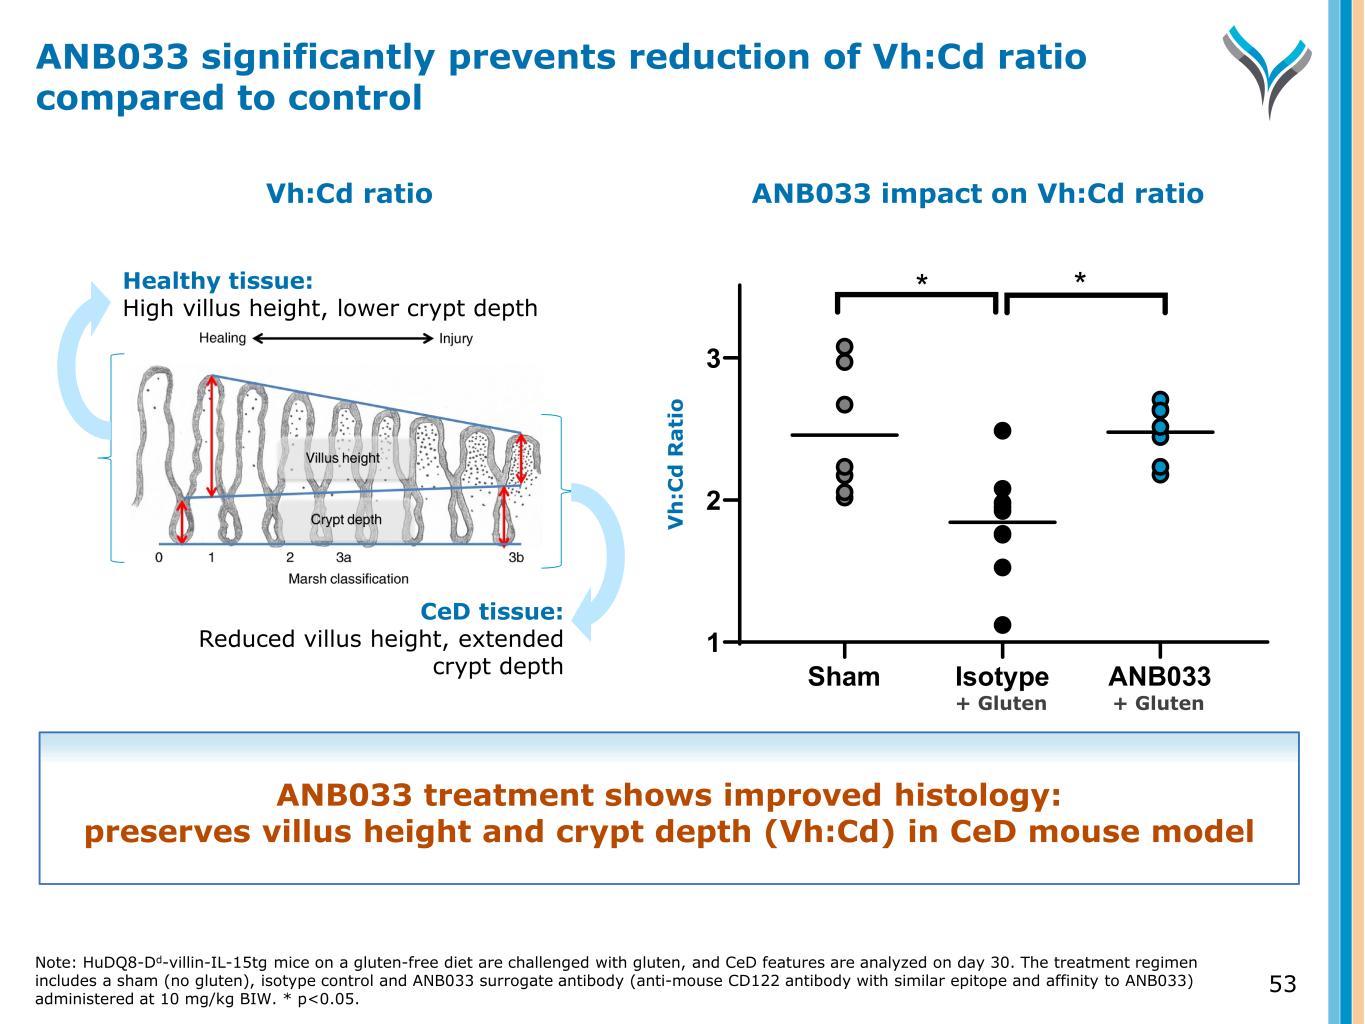
53 Healthy tissue: High villus height, lower crypt depth CeD tissue: Reduced villus height, extended crypt depth ANB033 impact on Vh:Cd ratio Sham Isotype ANB033 1 2 3 * * V h :C d R a ti o Vh:Cd ratio ANB033 significantly prevents reduction of Vh:Cd ratio compared to control ANB033 treatment shows improved histology: preserves villus height and crypt depth (Vh:Cd) in CeD mouse model Note: HuDQ8-Dd-villin-IL-15tg mice on a gluten-free diet are challenged with gluten, and CeD features are analyzed on day 30. The treatment regimen includes a sham (no gluten), isotype control and ANB033 surrogate antibody (anti-mouse CD122 antibody with similar epitope and affinity to ANB033) administered at 10 mg/kg BIW. * p<0.05. + Gluten + Gluten
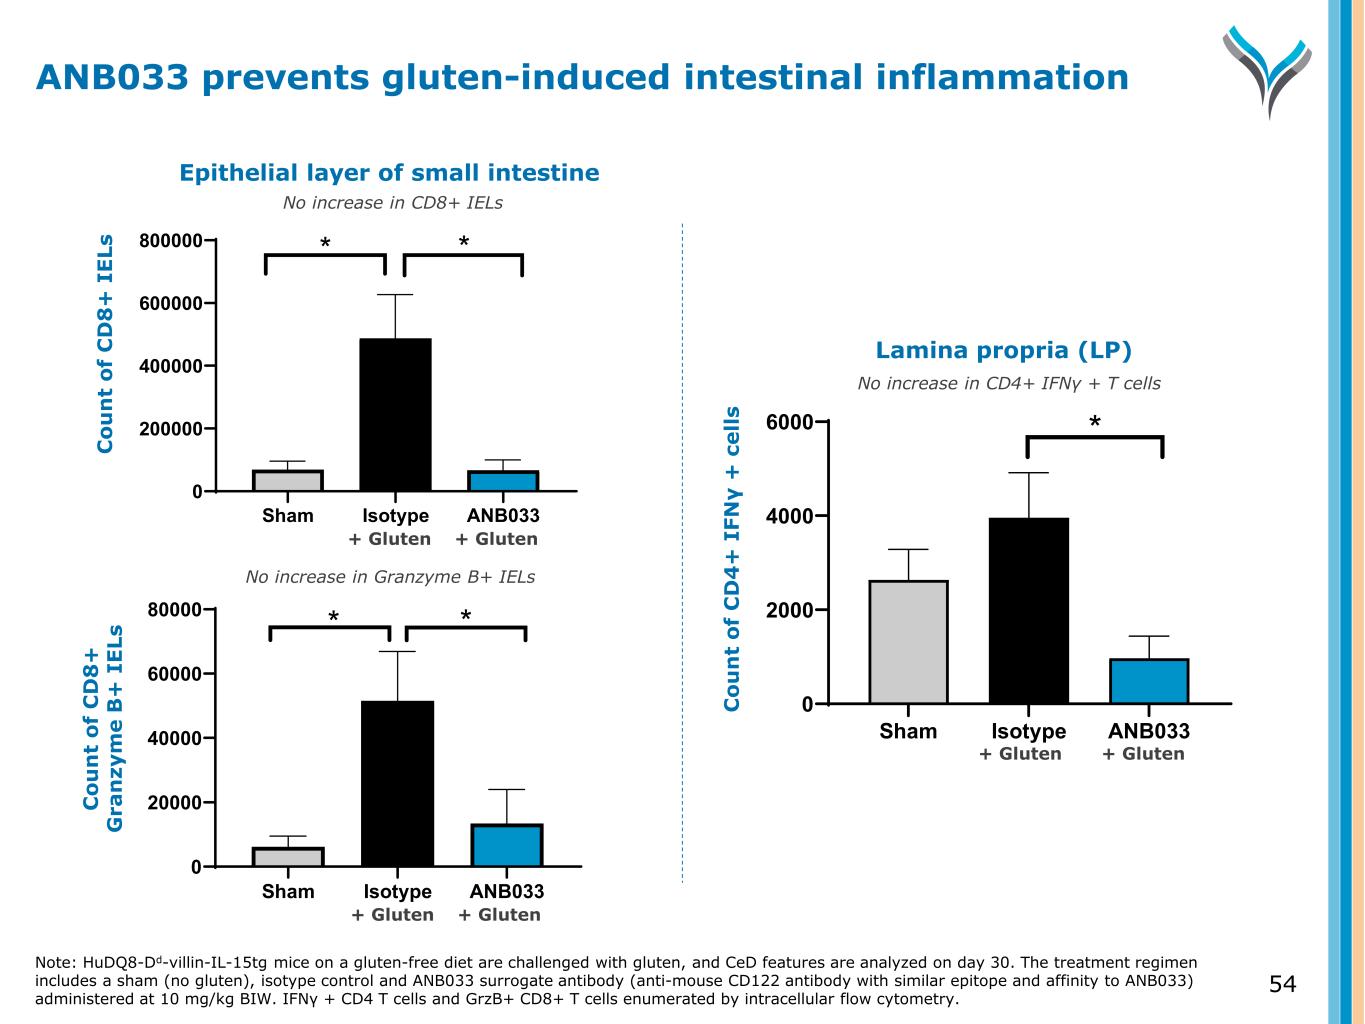
54 Sham Isotype ANB033 0 200000 400000 600000 800000 C ou nt o f C D 8+ IE Ls * * Sham Isotype ANB033 0 20000 40000 60000 80000 C ou nt o f G ra nz ym e B + IE Ls * * Sham Isotype ANB033 0 2000 4000 6000 C ou nt o f C D 4+ IF N -g + ce lls * Epithelial layer of small intestine C o u n t o f C D 8 + I E Ls C o u n t o f C D 8 + G ra n zy m e B + I E Ls Lamina propria (LP) C o u n t o f C D 4 + I FN γ + c e ll s No increase in CD8+ IELs No increase in Granzyme B+ IELs No increase in CD4+ IFNγ + T cells Note: HuDQ8-Dd-villin-IL-15tg mice on a gluten-free diet are challenged with gluten, and CeD features are analyzed on day 30. The treatment regimen includes a sham (no gluten), isotype control and ANB033 surrogate antibody (anti-mouse CD122 antibody with similar epitope and affinity to ANB033) administered at 10 mg/kg BIW. IFN + CD4 T cells and GrzB+ CD8+ T cells enumerated by intracellular flow cytometry. γ ANB033 prevents gluten-induced intestinal inflammation + Gluten + Gluten + Gluten + Gluten + Gluten + Gluten
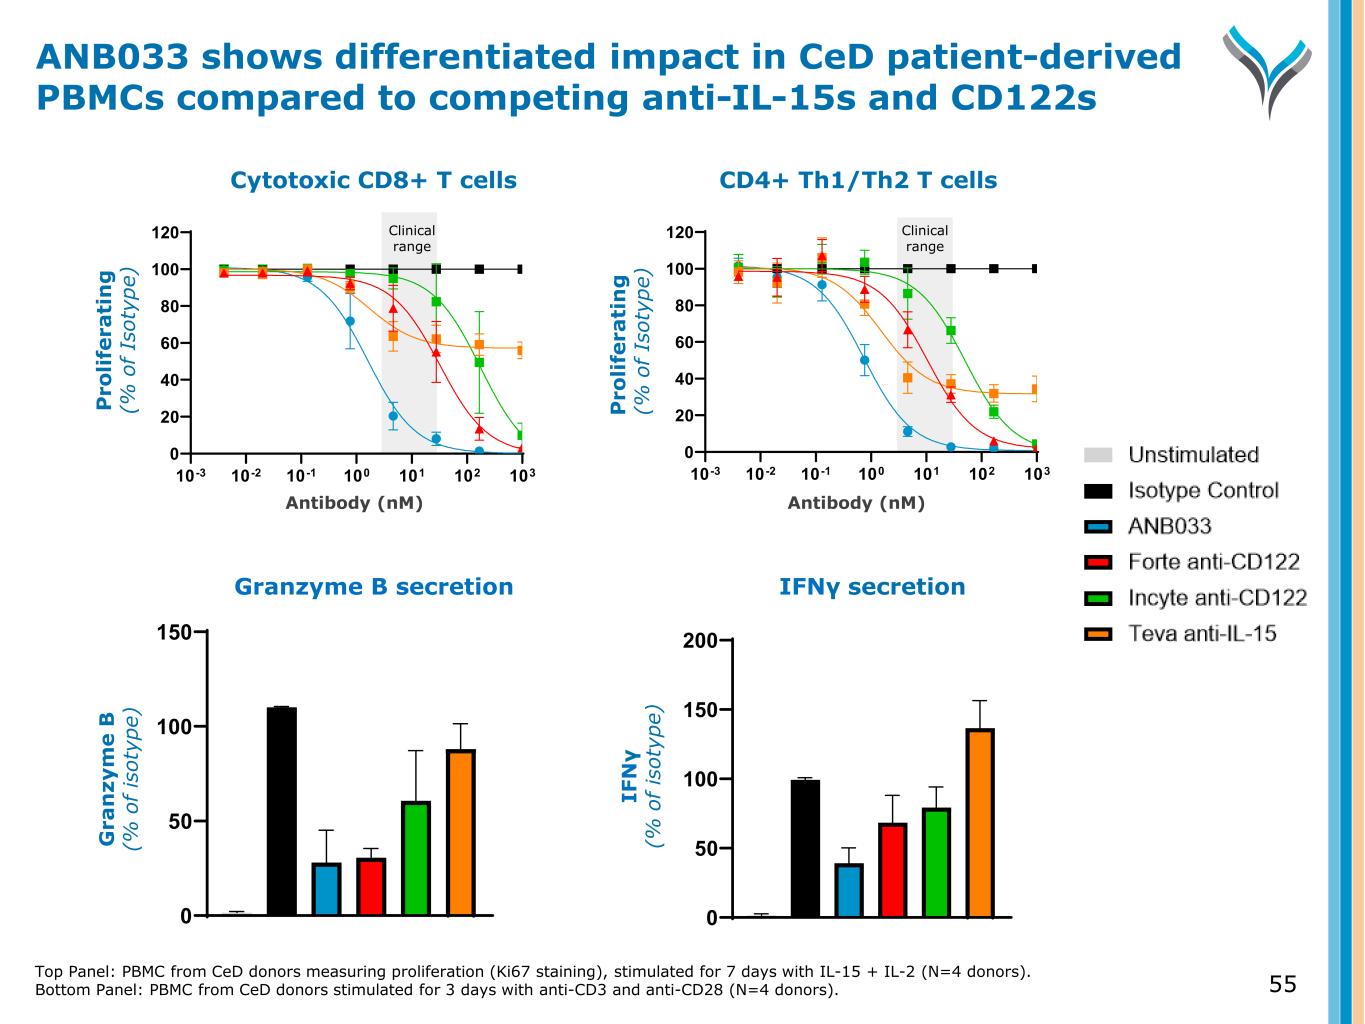
Top Panel: PBMC from CeD donors measuring proliferation (Ki67 staining), stimulated for 7 days with IL-15 + IL-2 (N=4 donors). Bottom Panel: PBMC from CeD donors stimulated for 3 days with anti-CD3 and anti-CD28 (N=4 donors). 55 IFNγ secretion 0 50 100 150 200 Antibody (nM) CD4+ Th1/Th2 T cells 10-3 10-2 10-1 100 101 102 103 0 20 40 60 80 100 120 P ro li fe ra ti n g ( % o f Is ot yp e) Clinical range IF N γ (% o f is ot yp e) Granzyme B secretion 0 50 100 150 Antibody (nM) Cytotoxic CD8+ T cells 10-3 10-2 10-1 100 101 102 103 0 20 40 60 80 100 120 P ro li fe ra ti n g ( % o f Is ot yp e) Clinical range G ra n zy m e B (% o f is ot yp e) ANB033 shows differentiated impact in CeD patient-derived PBMCs compared to competing anti-IL-15s and CD122s
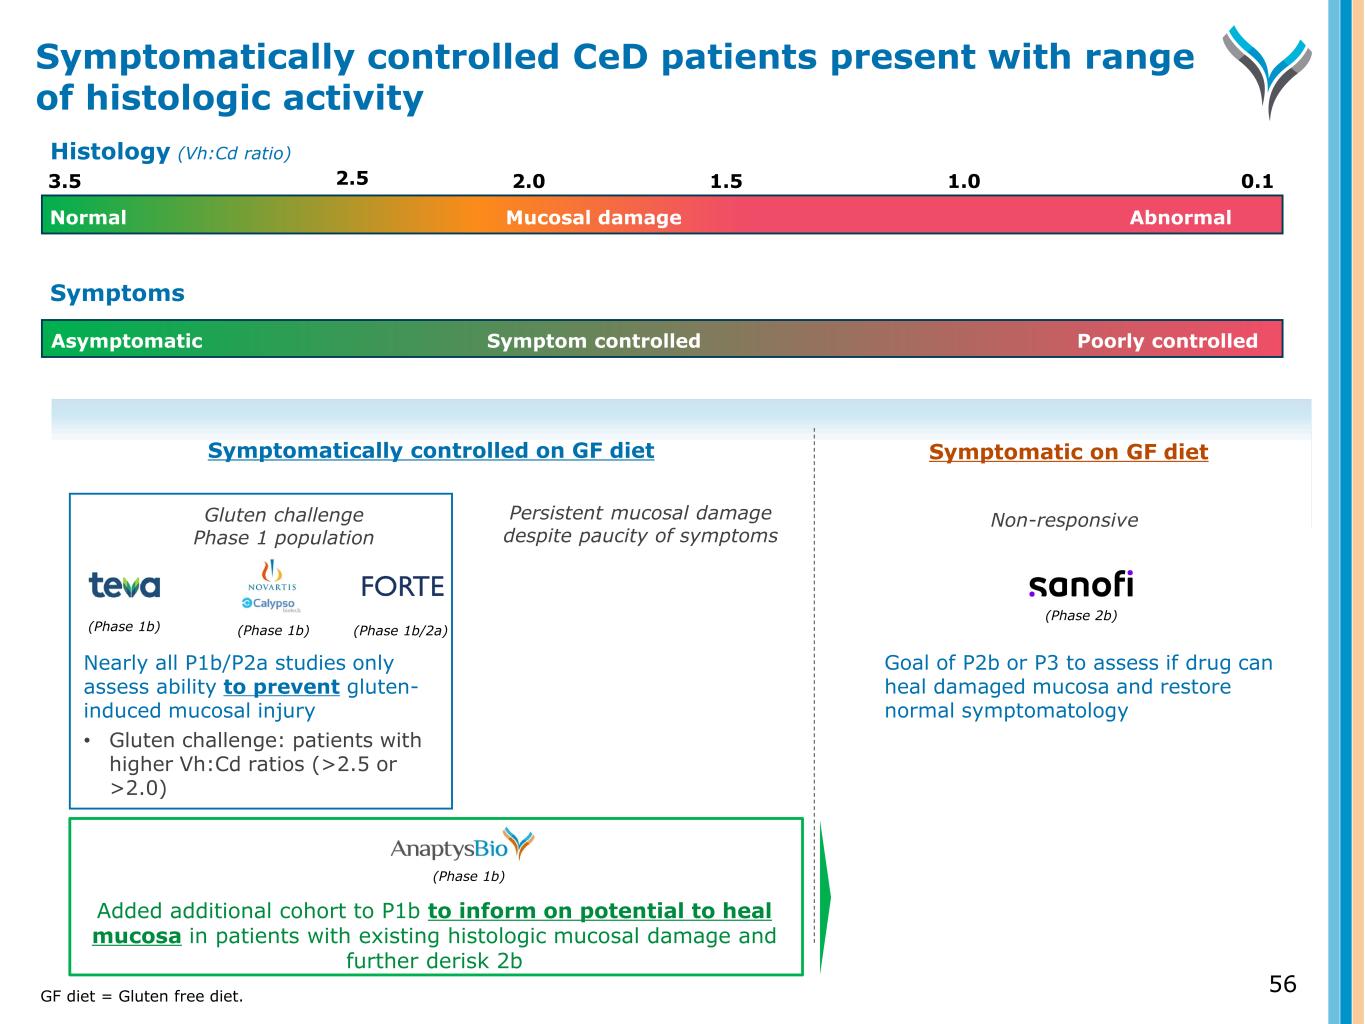
56 Symptomatically controlled on GF diet Symptomatic on GF diet Persistent mucosal damage despite paucity of symptoms Non-responsive (Phase 1b) Added additional cohort to P1b to inform on potential to heal mucosa in patients with existing histologic mucosal damage and further derisk 2b Symptom controlled Poorly controlledAsymptomatic Symptoms (Phase 2b) Goal of P2b or P3 to assess if drug can heal damaged mucosa and restore normal symptomatology Gluten challenge Phase 1 population (Phase 1b) (Phase 1b) (Phase 1b/2a) Nearly all P1b/P2a studies only assess ability to prevent gluten- induced mucosal injury • Gluten challenge: patients with higher Vh:Cd ratios (>2.5 or >2.0) Symptomatically controlled CeD patients present with range of histologic activity GF diet = Gluten free diet. 3.5 2.0 1.5 0.11.0 Normal AbnormalMucosal damage 2.5 Histology (Vh:Cd ratio)
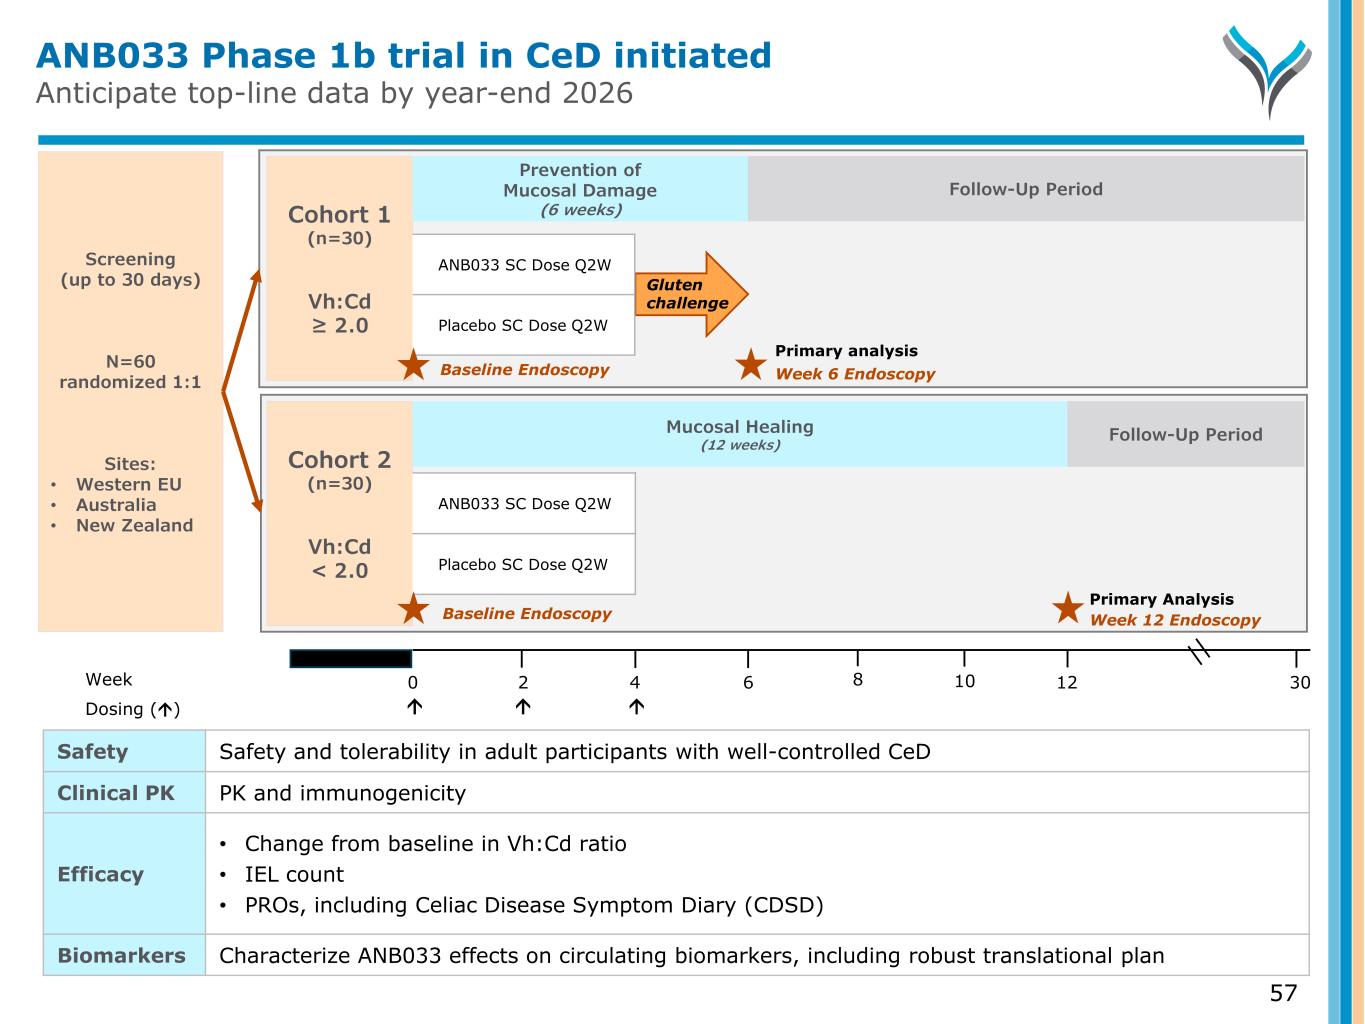
Primary Analysis ANB033 Phase 1b trial in CeD initiated Anticipate top-line data by year-end 2026 57 Screening (up to 30 days) N=60 randomized 1:1 Sites: • Western EU • Australia • New Zealand Week 0 6 124 302 Dosing () Cohort 1 (n=30) Vh:Cd ≥ 2.0 Week 6 Endoscopy Gluten challenge Prevention of Mucosal Damage (6 weeks) ANB033 SC Dose Q2W Placebo SC Dose Q2W Baseline Endoscopy Follow-Up Period Cohort 2 (n=30) Vh:Cd < 2.0 Week 12 Endoscopy Follow-Up Period Baseline Endoscopy Mucosal Healing (12 weeks) ANB033 SC Dose Q2W Placebo SC Dose Q2W Safety Safety and tolerability in adult participants with well-controlled CeD Clinical PK PK and immunogenicity Efficacy • Change from baseline in Vh:Cd ratio • IEL count • PROs, including Celiac Disease Symptom Diary (CDSD) Biomarkers Characterize ANB033 effects on circulating biomarkers, including robust translational plan 8 10 Primary analysis
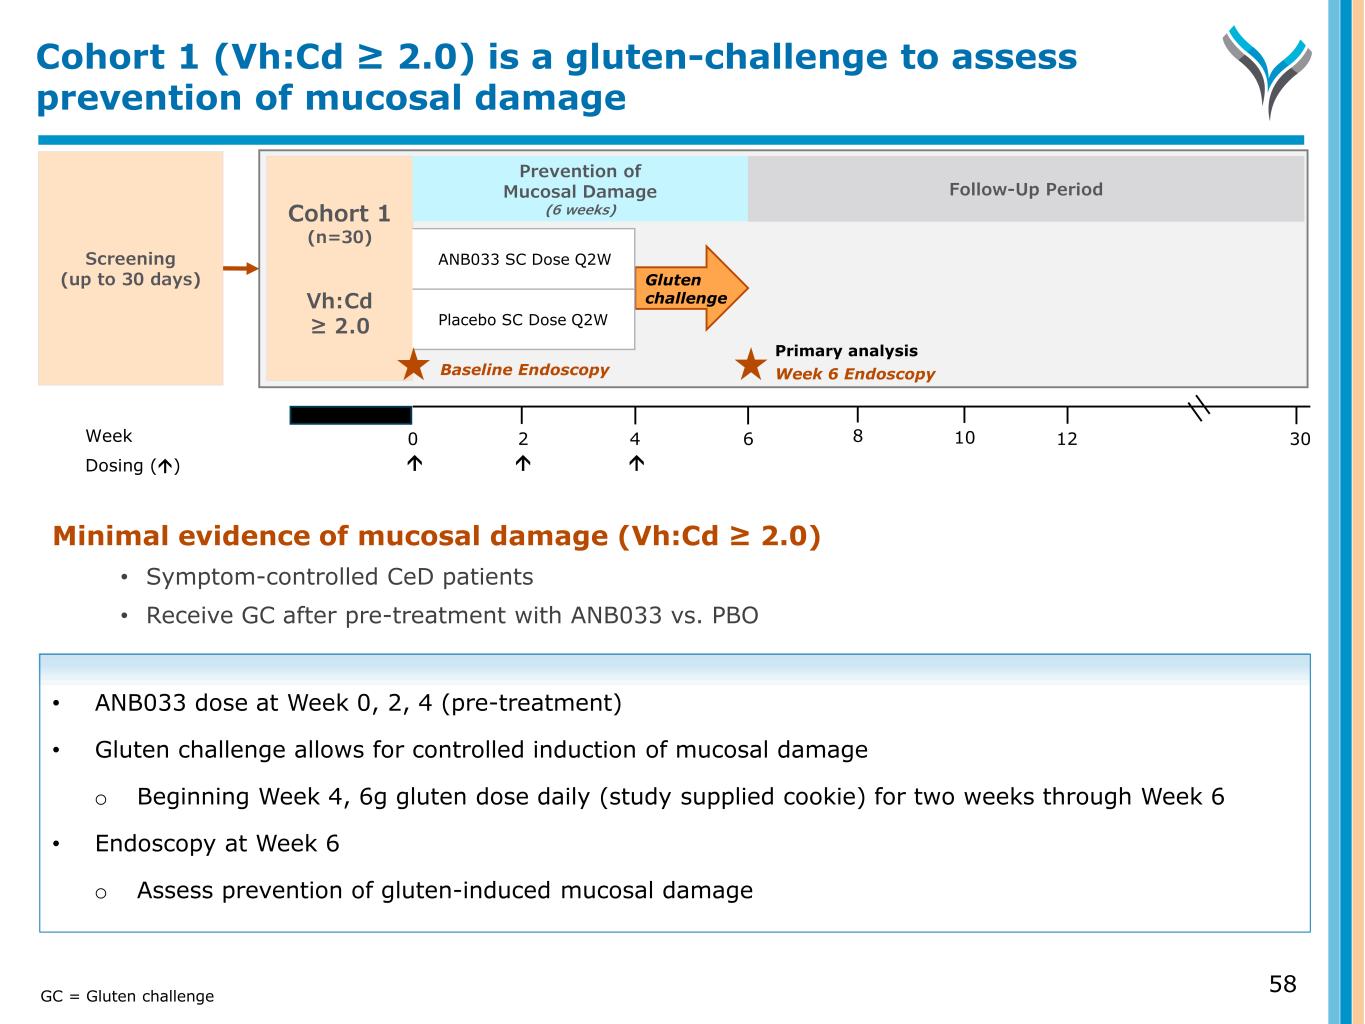
Minimal evidence of mucosal damage (Vh:Cd ≥ 2.0) • Symptom-controlled CeD patients • Receive GC after pre-treatment with ANB033 vs. PBO • ANB033 dose at Week 0, 2, 4 (pre-treatment) • Gluten challenge allows for controlled induction of mucosal damage o Beginning Week 4, 6g gluten dose daily (study supplied cookie) for two weeks through Week 6 • Endoscopy at Week 6 o Assess prevention of gluten-induced mucosal damage Screening (up to 30 days) Week 0 6 124 302 Dosing () Cohort 1 (n=30) Vh:Cd ≥ 2.0 Gluten challenge ANB033 SC Dose Q2W Placebo SC Dose Q2W 8 10 Week 6 EndoscopyBaseline Endoscopy Primary analysis Prevention of Mucosal Damage (6 weeks) Follow-Up Period Cohort 1 (Vh:Cd ≥ 2.0) is a gluten-challenge to assess prevention of mucosal damage GC = Gluten challenge 58
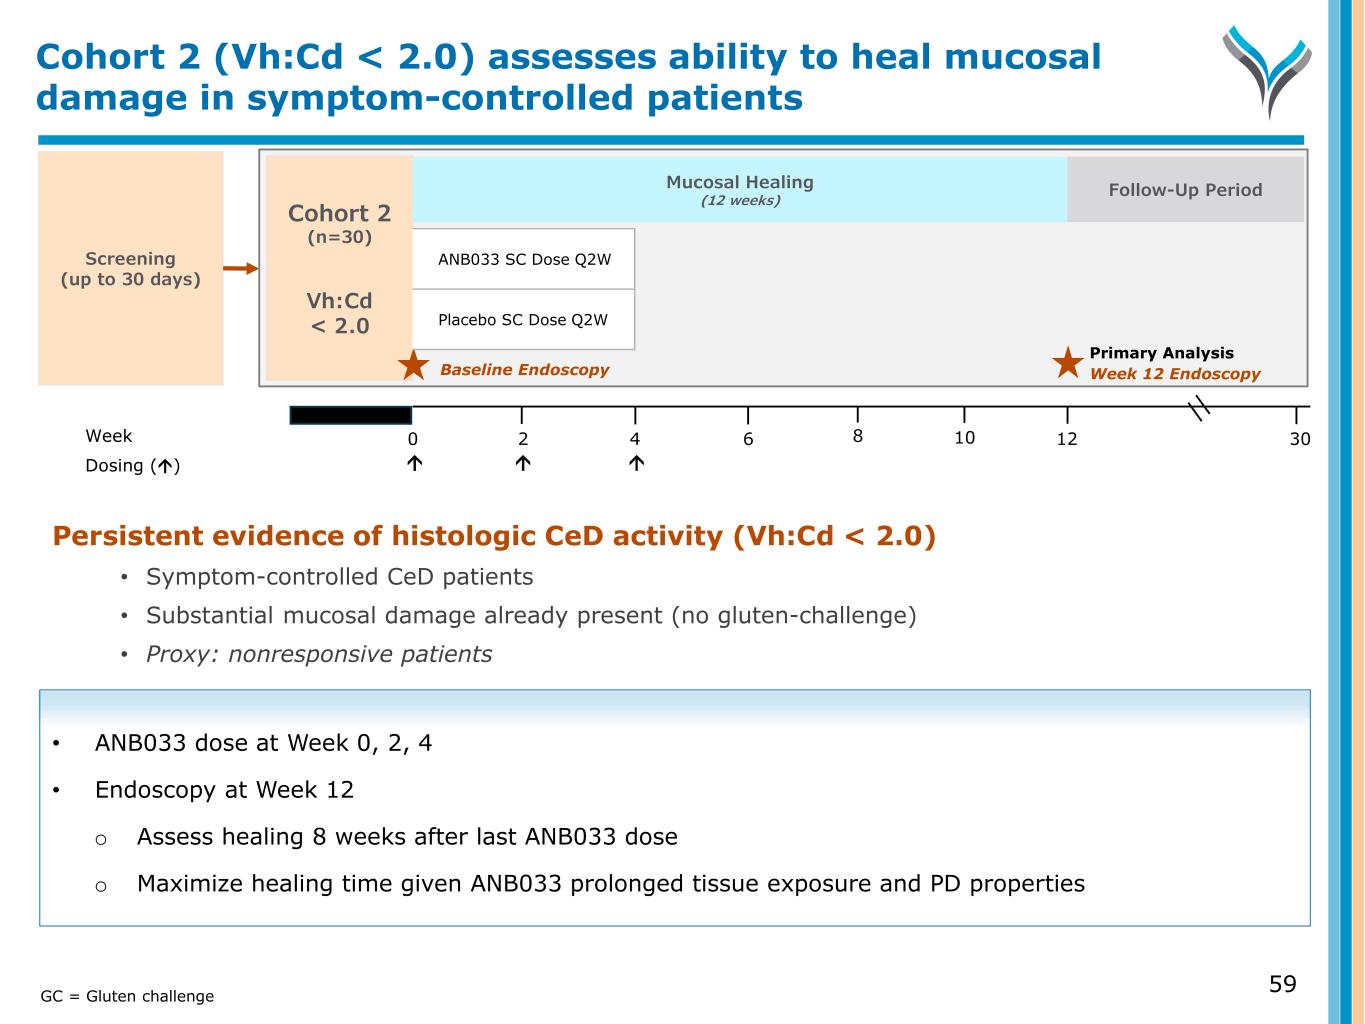
Screening (up to 30 days) Week 0 6 124 302 Dosing () 8 10 Cohort 2 (n=30) Vh:Cd < 2.0 Primary Analysis Week 12 Endoscopy Persistent evidence of histologic CeD activity (Vh:Cd < 2.0) • Symptom-controlled CeD patients • Substantial mucosal damage already present (no gluten-challenge) • Proxy: nonresponsive patients • ANB033 dose at Week 0, 2, 4 • Endoscopy at Week 12 o Assess healing 8 weeks after last ANB033 dose o Maximize healing time given ANB033 prolonged tissue exposure and PD properties Cohort 2 (Vh:Cd < 2.0) assesses ability to heal mucosal damage in symptom-controlled patients Follow-Up Period Mucosal Healing (12 weeks) 59GC = Gluten challenge Baseline Endoscopy ANB033 SC Dose Q2W Placebo SC Dose Q2W
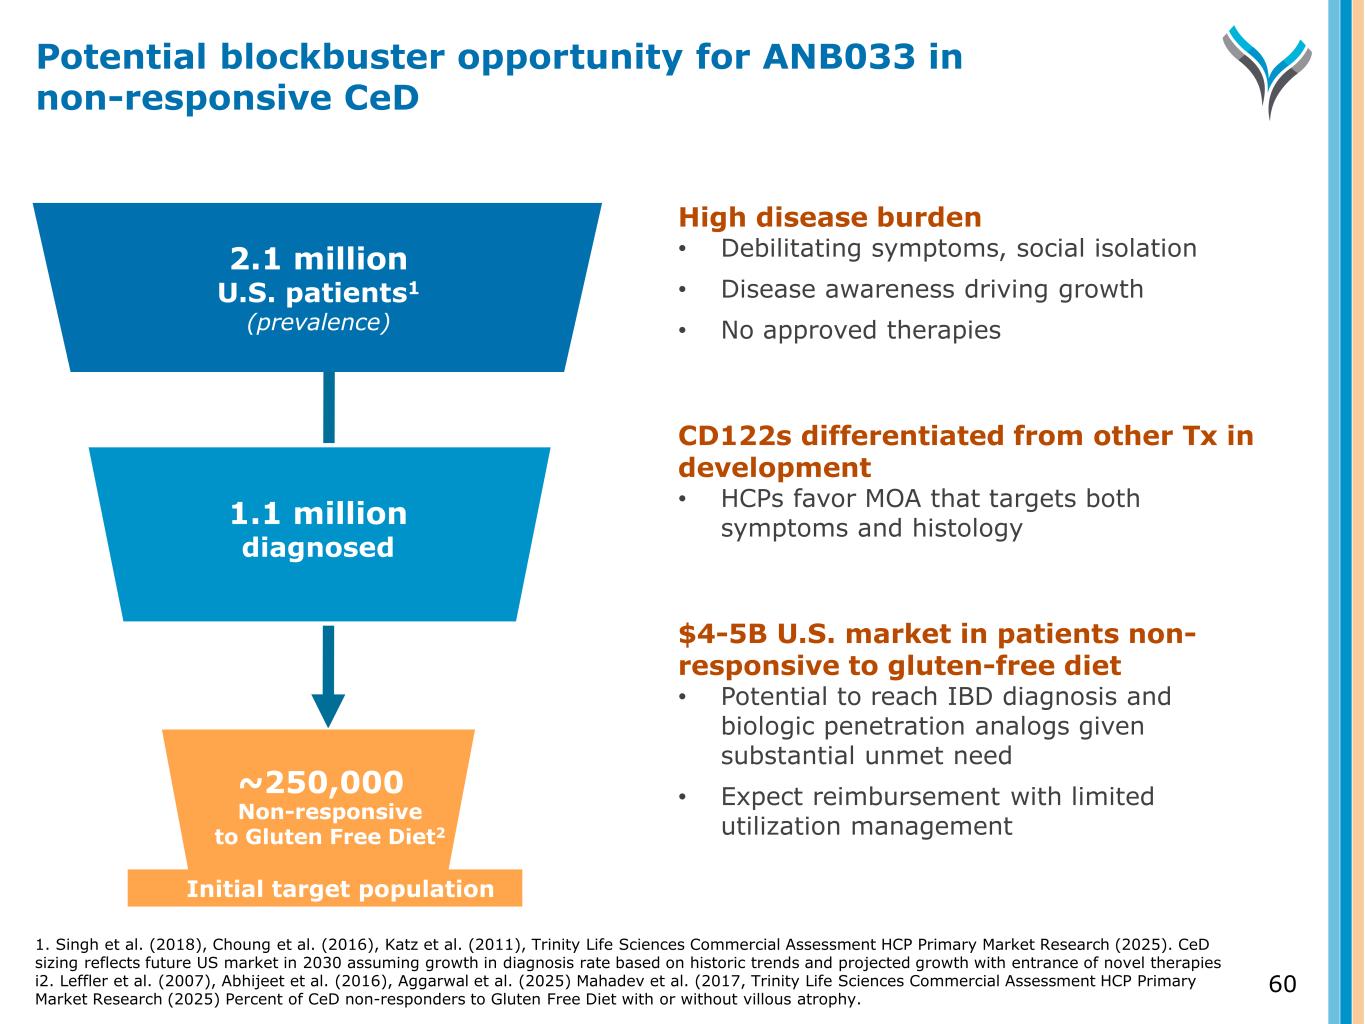
2.1 million U.S. patients1 (prevalence) ~250,000 Diagnosed Initial target population High disease burden • Debilitating symptoms, social isolation • Disease awareness driving growth • No approved therapies CD122s differentiated from other Tx in development • HCPs favor MOA that targets both symptoms and histology $4-5B U.S. market in patients non- responsive to gluten-free diet • Potential to reach IBD diagnosis and biologic penetration analogs given substantial unmet need • Expect reimbursement with limited utilization managementNon-responsive to Gluten Free Diet2 1.1 million diagnosed 60 Potential blockbuster opportunity for ANB033 in non-responsive CeD 1. Singh et al. (2018), Choung et al. (2016), Katz et al. (2011), Trinity Life Sciences Commercial Assessment HCP Primary Market Research (2025). CeD sizing reflects future US market in 2030 assuming growth in diagnosis rate based on historic trends and projected growth with entrance of novel therapies i2. Leffler et al. (2007), Abhijeet et al. (2016), Aggarwal et al. (2025) Mahadev et al. (2017, Trinity Life Sciences Commercial Assessment HCP Primary Market Research (2025) Percent of CeD non-responders to Gluten Free Diet with or without villous atrophy.
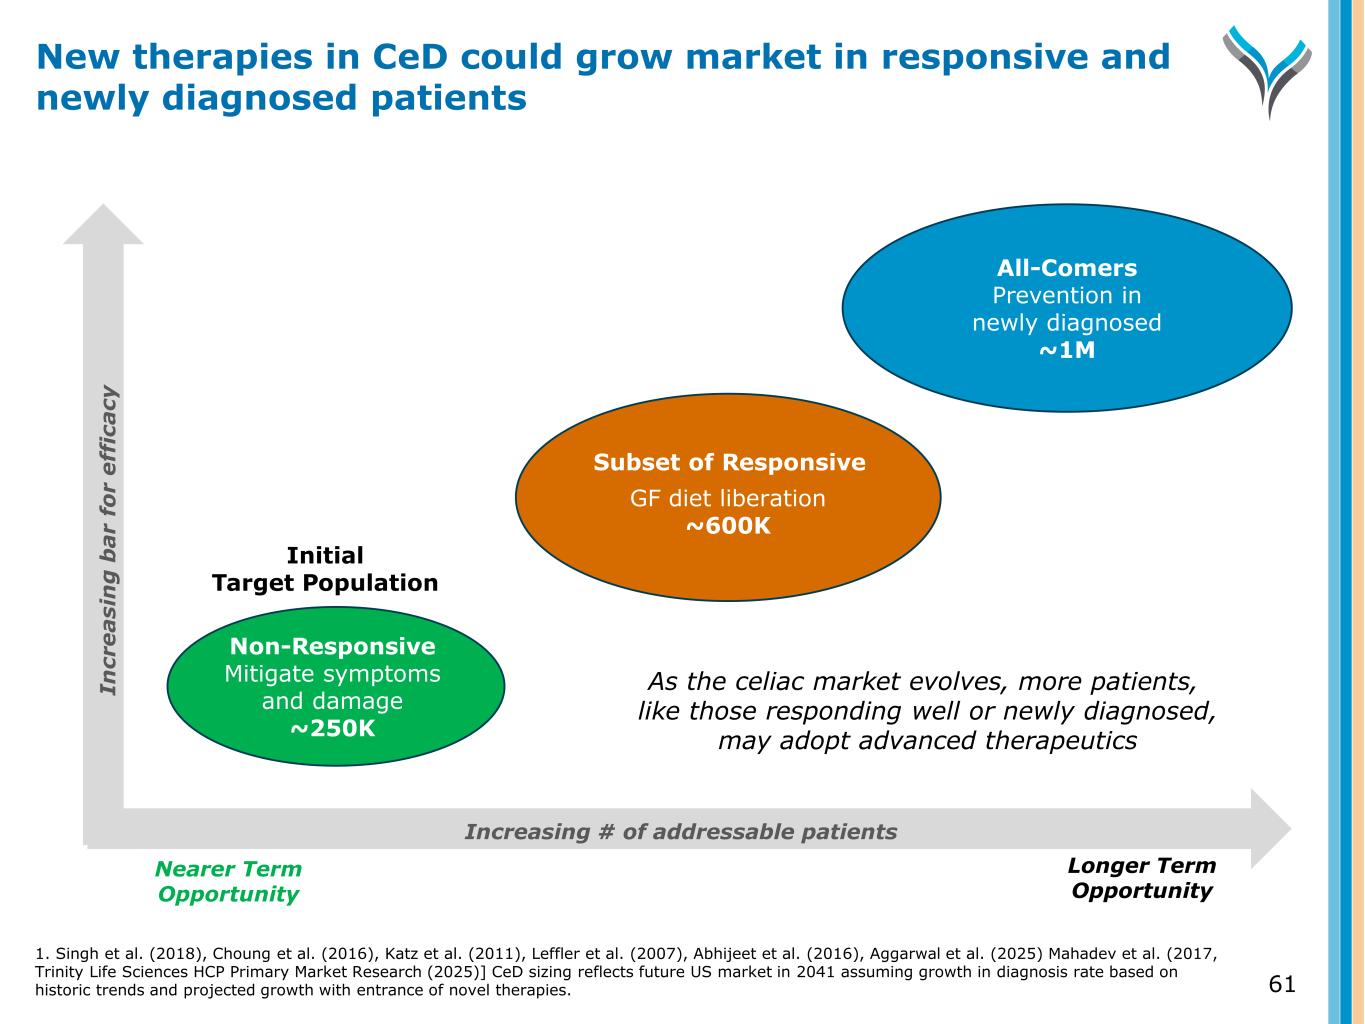
61 New therapies in CeD could grow market in responsive and newly diagnosed patients Increasing # of addressable patients Nearer Term Opportunity Longer Term Opportunity Non-Responsive Mitigate symptoms and damage ~250K GF diet liberation ~600K All-Comers Prevention in newly diagnosed ~1M Initial Target Population Subset of Responsive In cr e a si n g b a r fo r e ff ic a cy As the celiac market evolves, more patients, like those responding well or newly diagnosed, may adopt advanced therapeutics 1. Singh et al. (2018), Choung et al. (2016), Katz et al. (2011), Leffler et al. (2007), Abhijeet et al. (2016), Aggarwal et al. (2025) Mahadev et al. (2017, Trinity Life Sciences HCP Primary Market Research (2025)] CeD sizing reflects future US market in 2041 assuming growth in diagnosis rate based on historic trends and projected growth with entrance of novel therapies.
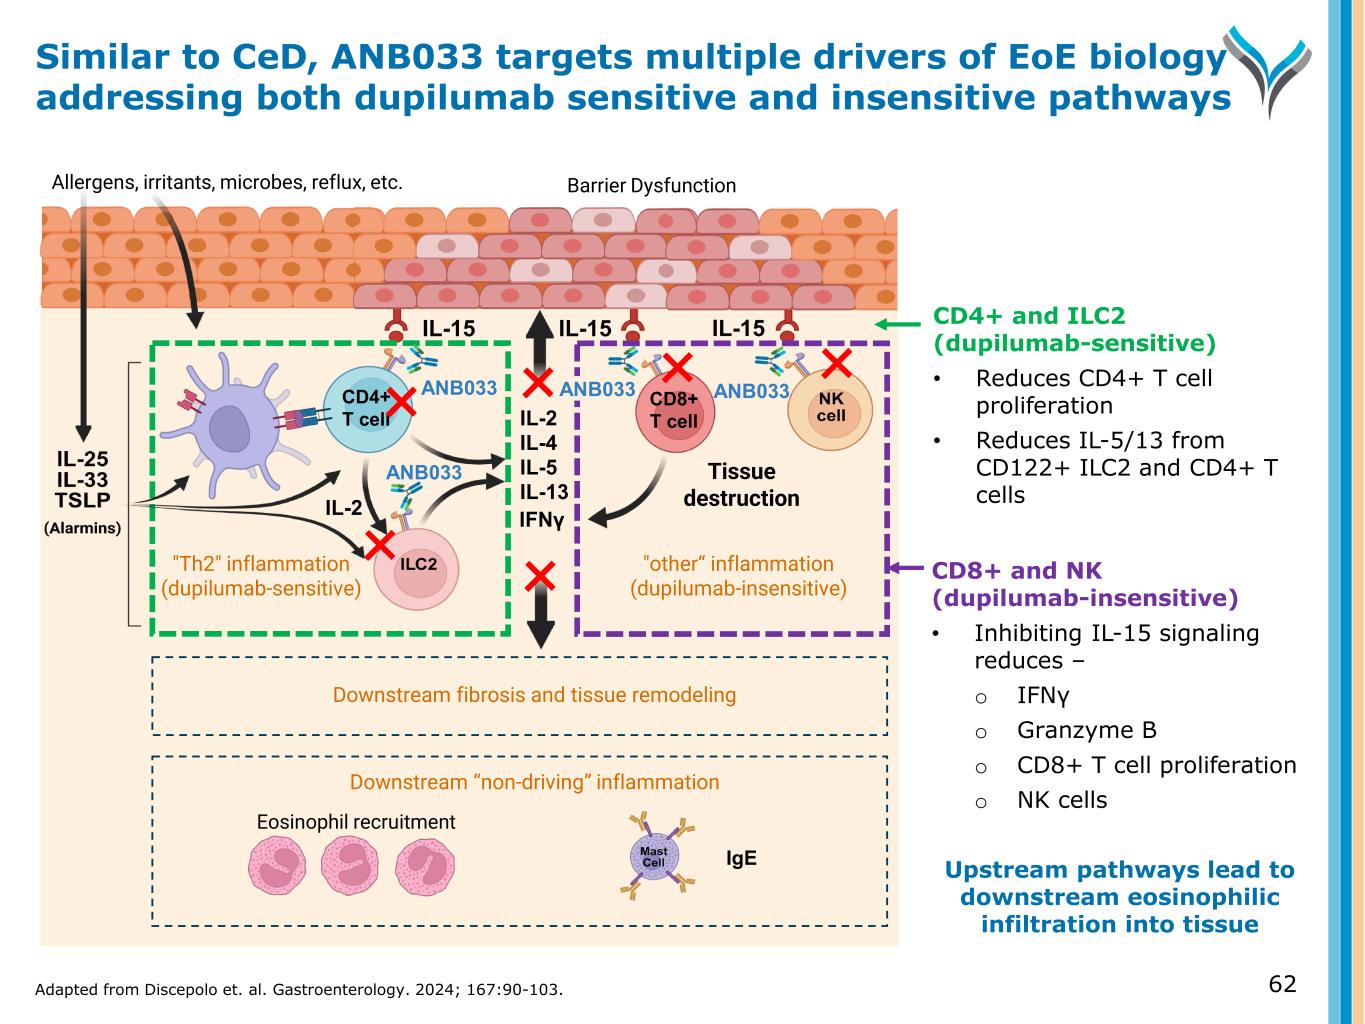
CD8+ and NK (dupilumab-insensitive) • Inhibiting IL-15 signaling reduces – o IFNγ o Granzyme B o CD8+ T cell proliferation o NK cells Upstream pathways lead to downstream eosinophilic infiltration into tissue IL-15 Allergens, irritants, microbes, reflux, etc. Eosinophil recruitment IL-15 IgE IL-2 IL-4 IL-5 IL-13 IL-15 ANB033 "Th2" inflammation (dupilumab-sensitive) "other“ inflammation (dupilumab-insensitive) Barrier Dysfunction Tissue destruction IFNγ Downstream “non-driving” inflammation ANB033CD4+ T cell CD8+ T cell Downstream fibrosis and tissue remodeling ANB033 IL-2 CD4+ and ILC2 (dupilumab-sensitive) • Reduces CD4+ T cell proliferation • Reduces IL-5/13 from CD122+ ILC2 and CD4+ T cells Similar to CeD, ANB033 targets multiple drivers of EoE biology addressing both dupilumab sensitive and insensitive pathways Adapted from Discepolo et. al. Gastroenterology. 2024; 167:90-103. 62 ANB033
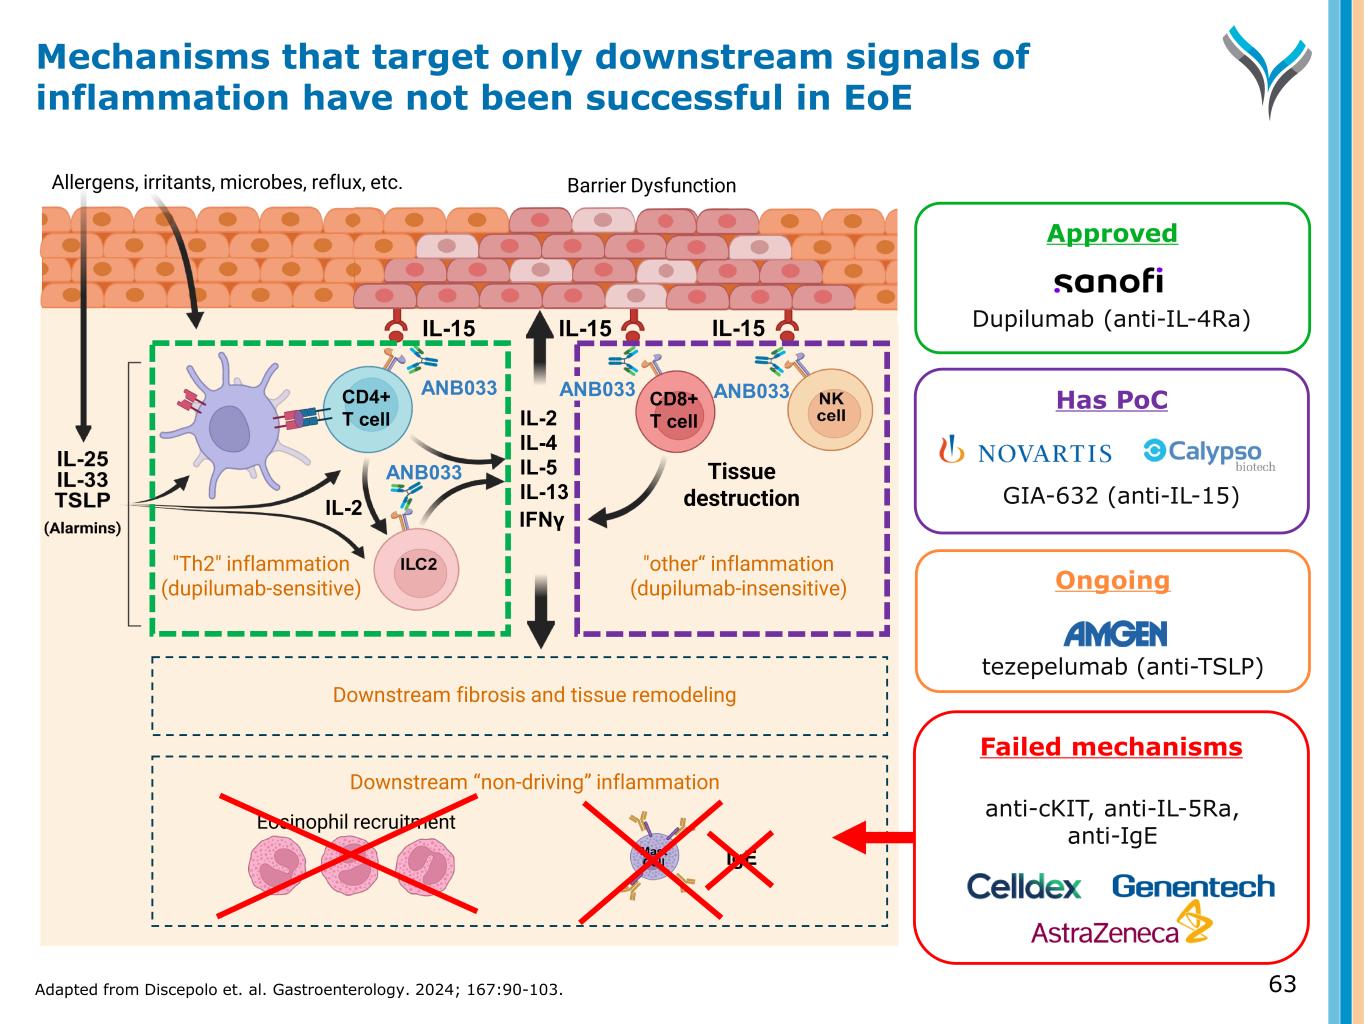
Ongoing tezepelumab (anti-TSLP) IL-15 Tissue damage Allergens, irritants, microbes, reflux, etc. Eosinophil recruitment IL-15 IgE IL-2 IL-4 IL-5 IL-13 IL-15 ANB033 "Th2" inflammation (dupilumab-sensitive) "other“ inflammation (dupilumab-insensitive) Barrier Dysfunction Tissue destruction IFNγ Downstream “non-driving” inflammation ANB033CD4+ T cell CD8+ T cell Downstream fibrosis and tissue remodeling ANB033 GIA-632 (anti-IL-15) Failed mechanisms anti-cKIT, anti-IL-5Ra, anti-IgE IL-2 Approved Dupilumab (anti-IL-4Ra) Mechanisms that target only downstream signals of inflammation have not been successful in EoE 63Adapted from Discepolo et. al. Gastroenterology. 2024; 167:90-103. ANB033 Has PoC
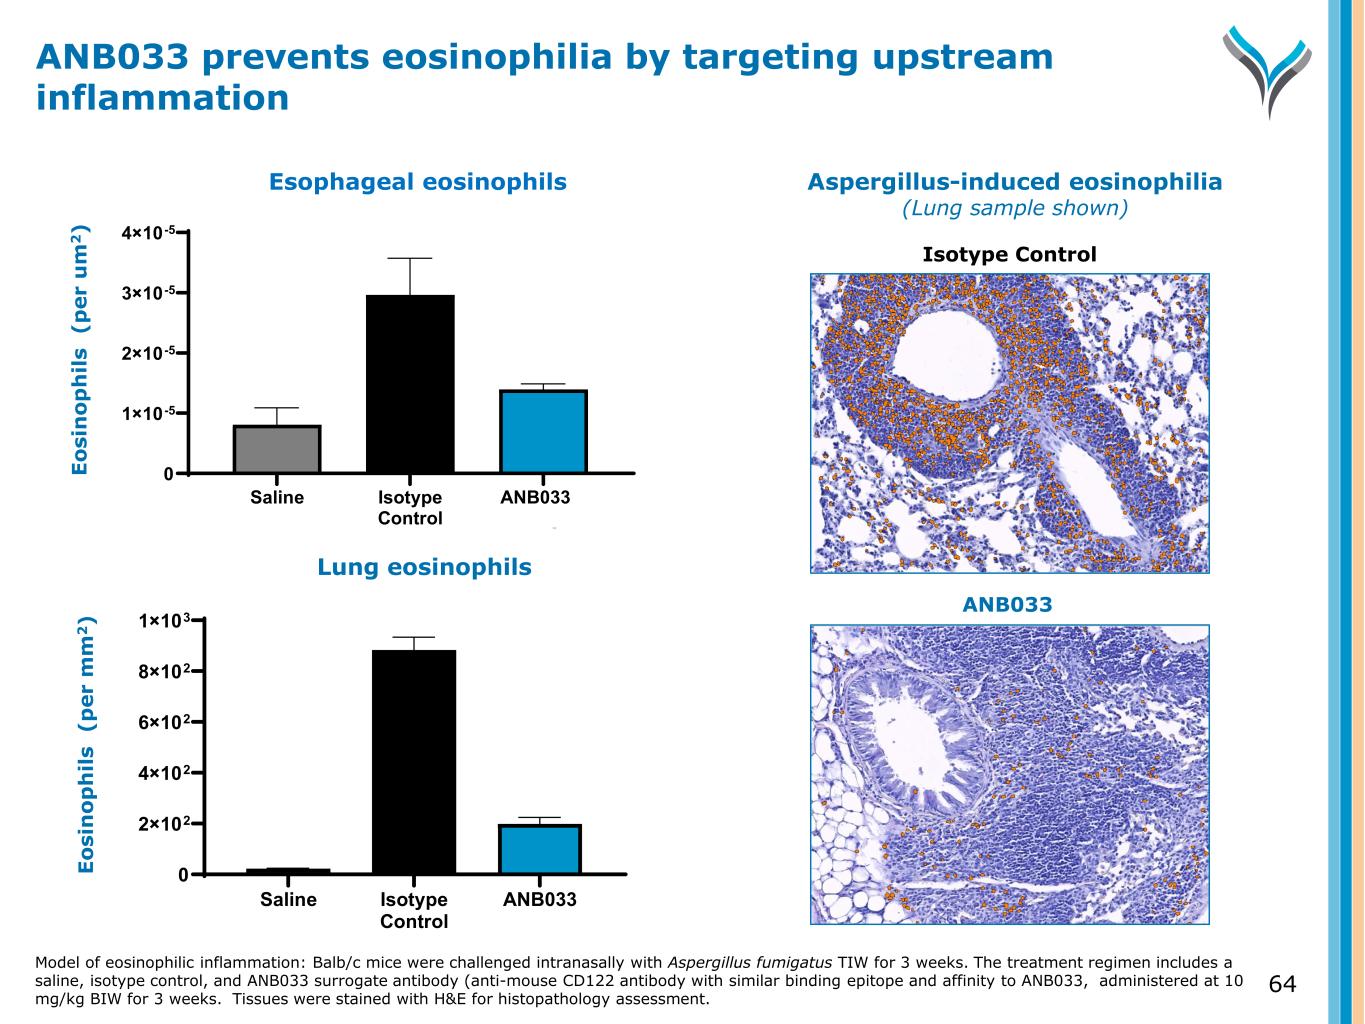
64 E o si n o p h il s ( p e r u m 2 ) Saline Isotype Control ANB033 Surrogate 0 1×10⁻⁵ 2×10⁻⁵ 3×10⁻⁵ 4×10⁻⁵ Lung eosinophils E o si n o p h il s ( p e r m m 2 ) Saline Isotype Control ANB033 Surrogate 0 2×10² 4×10² 6×10² 8×10² 1×10³ Esophageal eosinophils ANB033 prevents eosinophilia by targeting upstream inflammation Model of eosinophilic inflammation: Balb/c mice were challenged intranasally with Aspergillus fumigatus TIW for 3 weeks. The treatment regimen includes a saline, isotype control, and ANB033 surrogate antibody (anti-mouse CD122 antibody with similar binding epitope and affinity to ANB033, administered at 10 mg/kg BIW for 3 weeks. Tissues were stained with H&E for histopathology assessment. Aspergillus-induced eosinophilia (Lung sample shown) Isotype Control ANB033
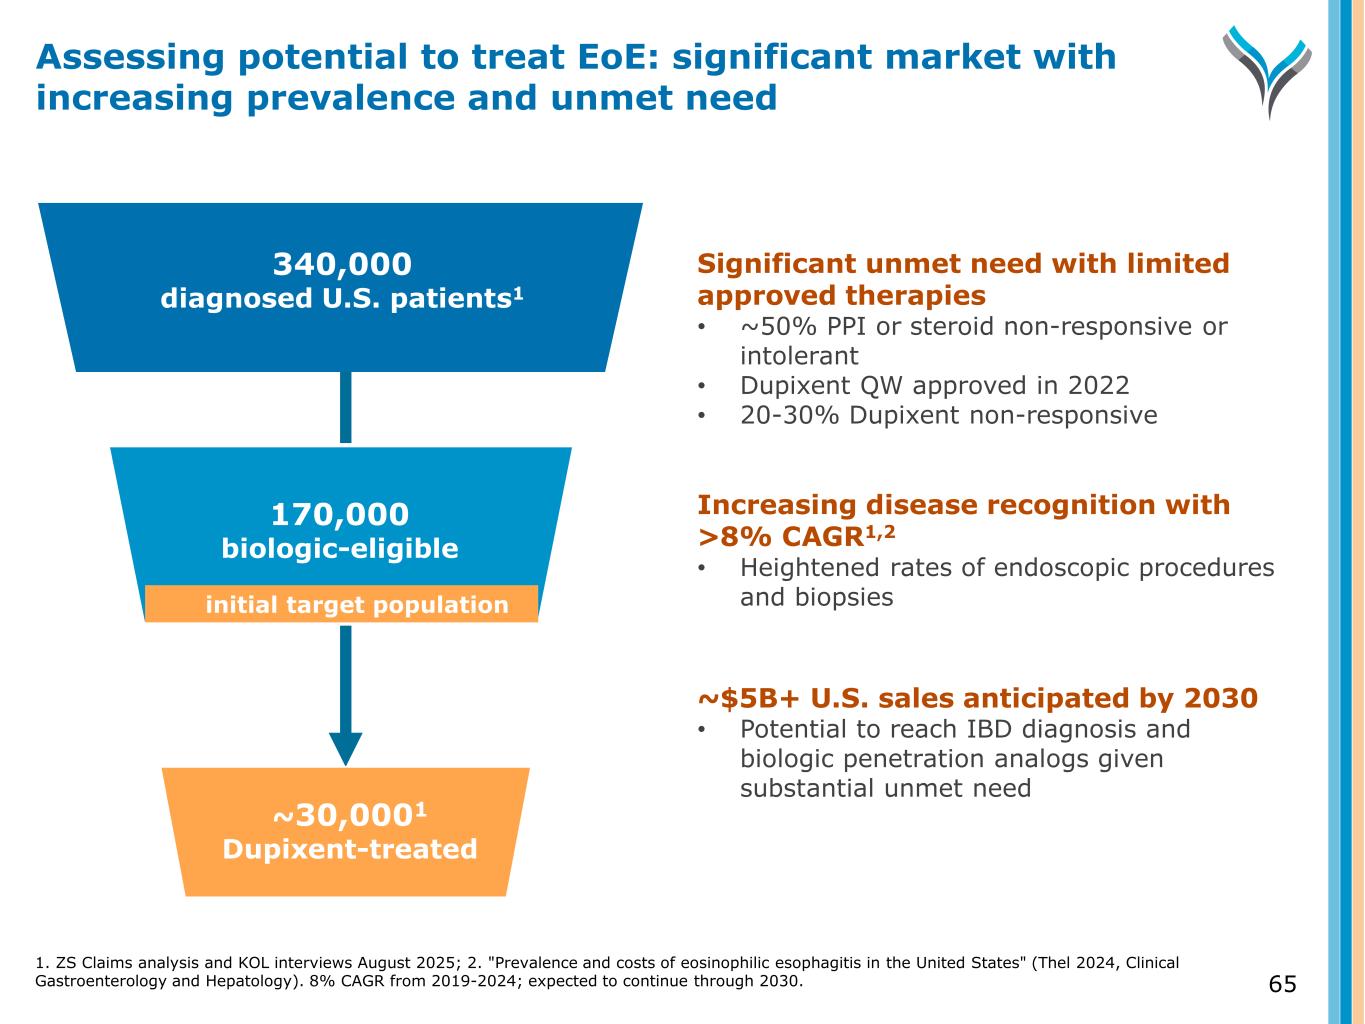
65 340,000 diagnosed U.S. patients1 Diagnosed 170,000 biologic-eligible ~30,0001 Dupixent-treated Significant unmet need with limited approved therapies • ~50% PPI or steroid non-responsive or intolerant • Dupixent QW approved in 2022 • 20-30% Dupixent non-responsive Increasing disease recognition with >8% CAGR1,2 • Heightened rates of endoscopic procedures and biopsies ~$5B+ U.S. sales anticipated by 2030 • Potential to reach IBD diagnosis and biologic penetration analogs given substantial unmet need Assessing potential to treat EoE: significant market with increasing prevalence and unmet need initial target population 1. ZS Claims analysis and KOL interviews August 2025; 2. "Prevalence and costs of eosinophilic esophagitis in the United States" (Thel 2024, Clinical Gastroenterology and Hepatology). 8% CAGR from 2019-2024; expected to continue through 2030.
(BDCA2 modulator) ANB101
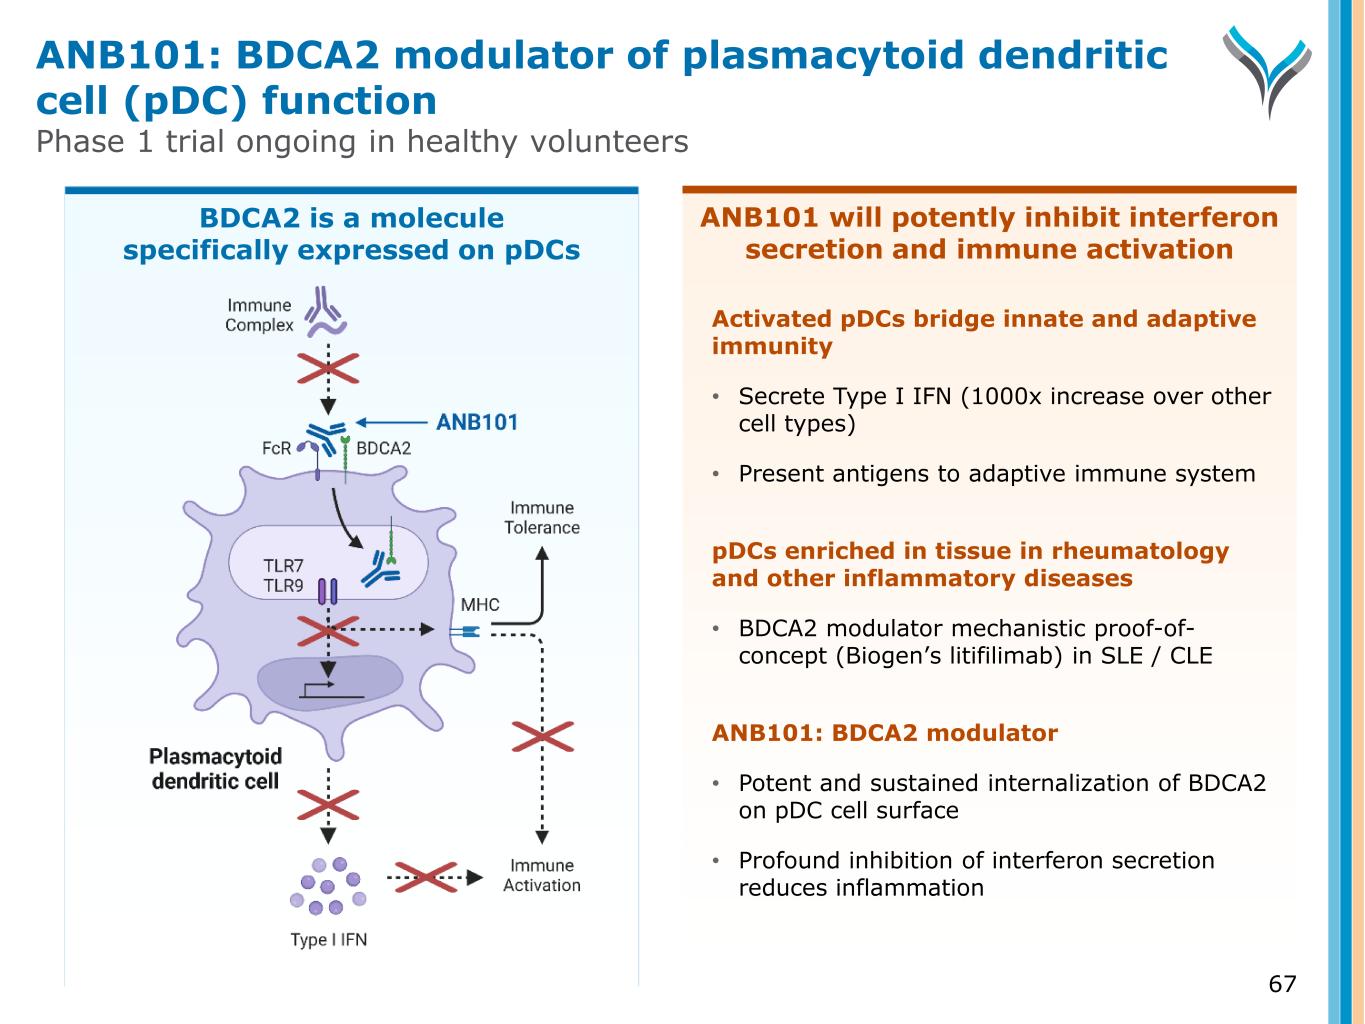
ANB101 will potently inhibit interferon secretion and immune activation 67 Activated pDCs bridge innate and adaptive immunity • Secrete Type I IFN (1000x increase over other cell types) • Present antigens to adaptive immune system pDCs enriched in tissue in rheumatology and other inflammatory diseases • BDCA2 modulator mechanistic proof-of- concept (Biogen’s litifilimab) in SLE / CLE ANB101: BDCA2 modulator • Potent and sustained internalization of BDCA2 on pDC cell surface • Profound inhibition of interferon secretion reduces inflammation ANB101: BDCA2 modulator of plasmacytoid dendritic cell (pDC) function Phase 1 trial ongoing in healthy volunteers BDCA2 is a molecule specifically expressed on pDCs
Appendix
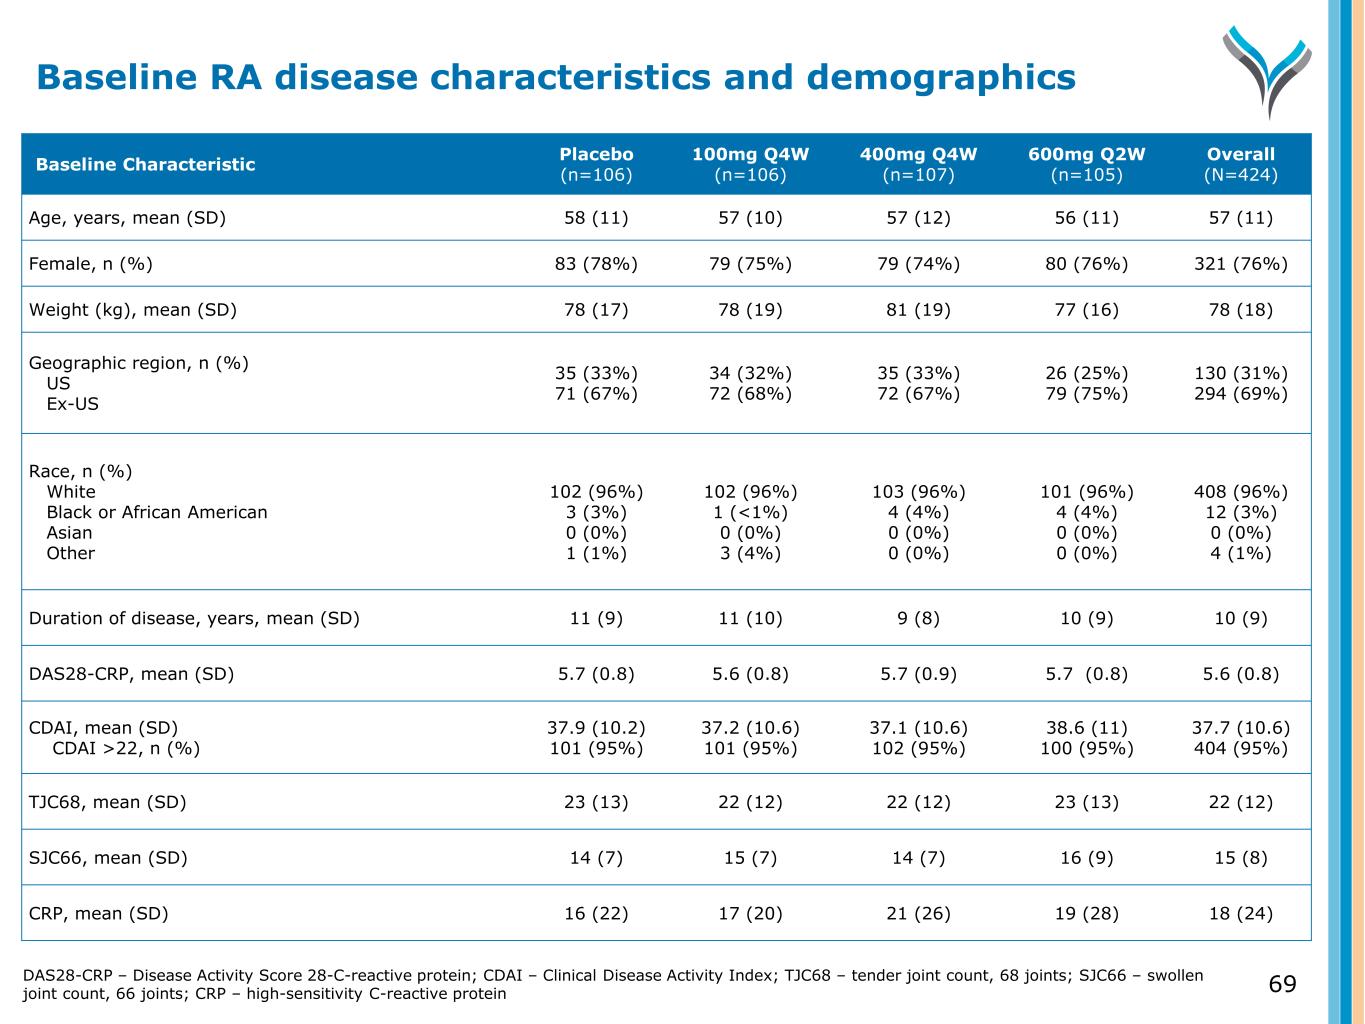
69 Baseline Characteristic Placebo (n=106) 100mg Q4W (n=106) 400mg Q4W (n=107) 600mg Q2W (n=105) Overall (N=424) Age, years, mean (SD) 58 (11) 57 (10) 57 (12) 56 (11) 57 (11) Female, n (%) 83 (78%) 79 (75%) 79 (74%) 80 (76%) 321 (76%) Weight (kg), mean (SD) 78 (17) 78 (19) 81 (19) 77 (16) 78 (18) Geographic region, n (%) US Ex-US 35 (33%) 71 (67%) 34 (32%) 72 (68%) 35 (33%) 72 (67%) 26 (25%) 79 (75%) 130 (31%) 294 (69%) Race, n (%) White Black or African American Asian Other 102 (96%) 3 (3%) 0 (0%) 1 (1%) 102 (96%) 1 (<1%) 0 (0%) 3 (4%) 103 (96%) 4 (4%) 0 (0%) 0 (0%) 101 (96%) 4 (4%) 0 (0%) 0 (0%) 408 (96%) 12 (3%) 0 (0%) 4 (1%) Duration of disease, years, mean (SD) 11 (9) 11 (10) 9 (8) 10 (9) 10 (9) DAS28-CRP, mean (SD) 5.7 (0.8) 5.6 (0.8) 5.7 (0.9) 5.7 (0.8) 5.6 (0.8) CDAI, mean (SD) CDAI >22, n (%) 37.9 (10.2) 101 (95%) 37.2 (10.6) 101 (95%) 37.1 (10.6) 102 (95%) 38.6 (11) 100 (95%) 37.7 (10.6) 404 (95%) TJC68, mean (SD) 23 (13) 22 (12) 22 (12) 23 (13) 22 (12) SJC66, mean (SD) 14 (7) 15 (7) 14 (7) 16 (9) 15 (8) CRP, mean (SD) 16 (22) 17 (20) 21 (26) 19 (28) 18 (24) Baseline RA disease characteristics and demographics DAS28-CRP – Disease Activity Score 28-C-reactive protein; CDAI – Clinical Disease Activity Index; TJC68 – tender joint count, 68 joints; SJC66 – swollen joint count, 66 joints; CRP – high-sensitivity C-reactive protein
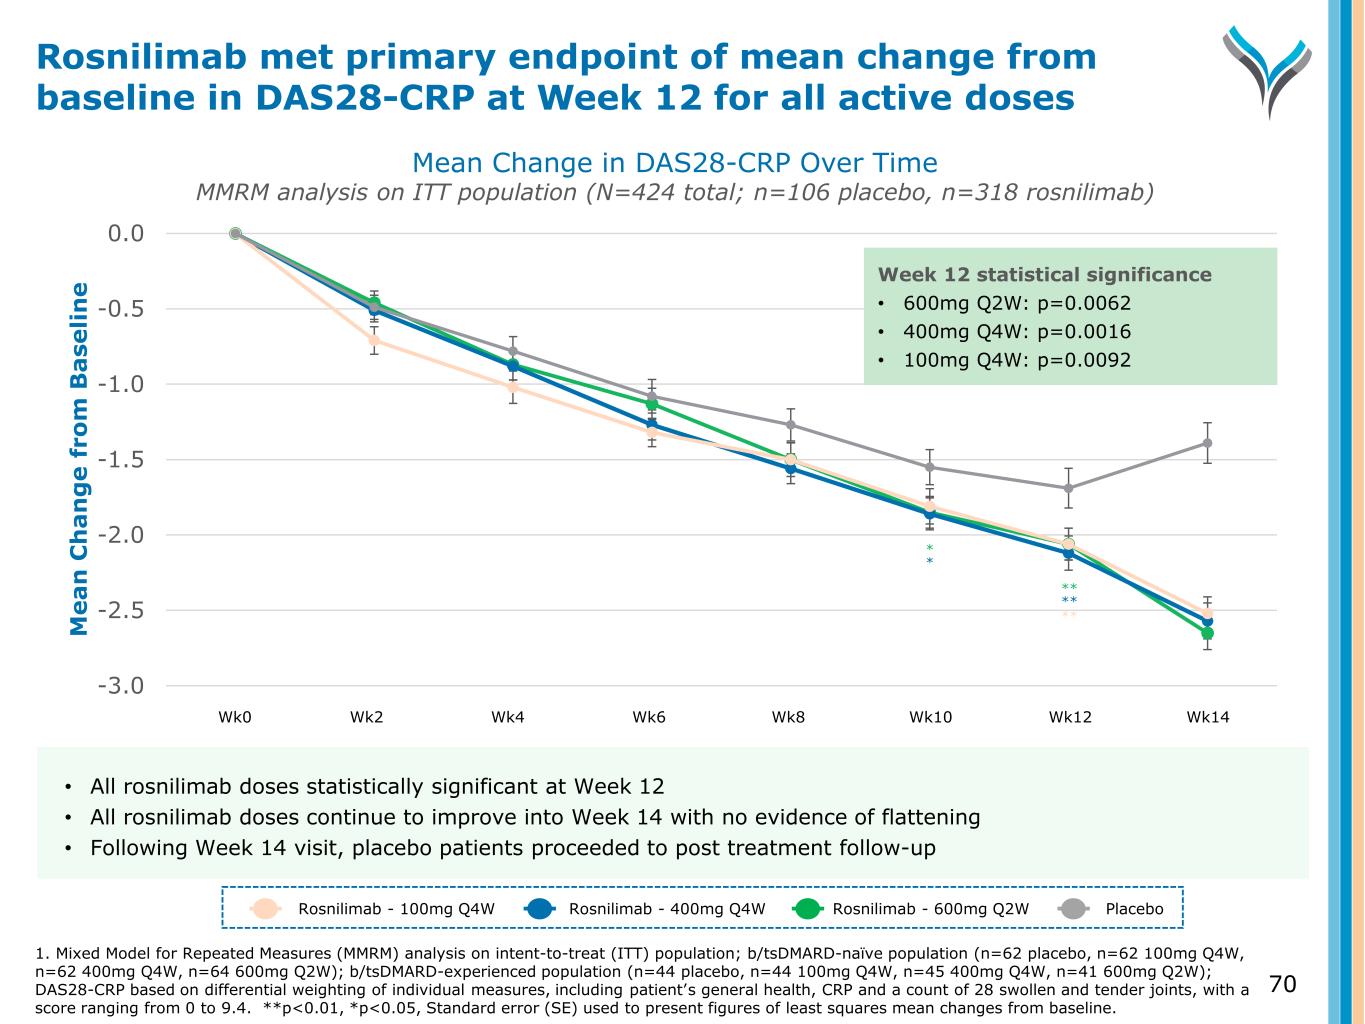
70 -3.0 -2.5 -2.0 -1.5 -1.0 -0.5 0.0 M e a n C h a n g e f ro m B a se li n e ** Week 12 statistical significance • 600mg Q2W: p=0.0062 • 400mg Q4W: p=0.0016 • 100mg Q4W: p=0.0092 ** ** * * Mean Change in DAS28-CRP Over Time MMRM analysis on ITT population (N=424 total; n=106 placebo, n=318 rosnilimab) Rosnilimab met primary endpoint of mean change from baseline in DAS28-CRP at Week 12 for all active doses Rosnilimab - 100mg Q4W Rosnilimab - 400mg Q4W Rosnilimab - 600mg Q2W Placebo • All rosnilimab doses statistically significant at Week 12 • All rosnilimab doses continue to improve into Week 14 with no evidence of flattening • Following Week 14 visit, placebo patients proceeded to post treatment follow-up Wk0 Wk2 Wk4 Wk6 Wk8 Wk10 Wk12 Wk14 1. Mixed Model for Repeated Measures (MMRM) analysis on intent-to-treat (ITT) population; b/tsDMARD-naïve population (n=62 placebo, n=62 100mg Q4W, n=62 400mg Q4W, n=64 600mg Q2W); b/tsDMARD-experienced population (n=44 placebo, n=44 100mg Q4W, n=45 400mg Q4W, n=41 600mg Q2W); DAS28-CRP based on differential weighting of individual measures, including patient’s general health, CRP and a count of 28 swollen and tender joints, with a score ranging from 0 to 9.4. **p<0.01, *p<0.05, Standard error (SE) used to present figures of least squares mean changes from baseline.
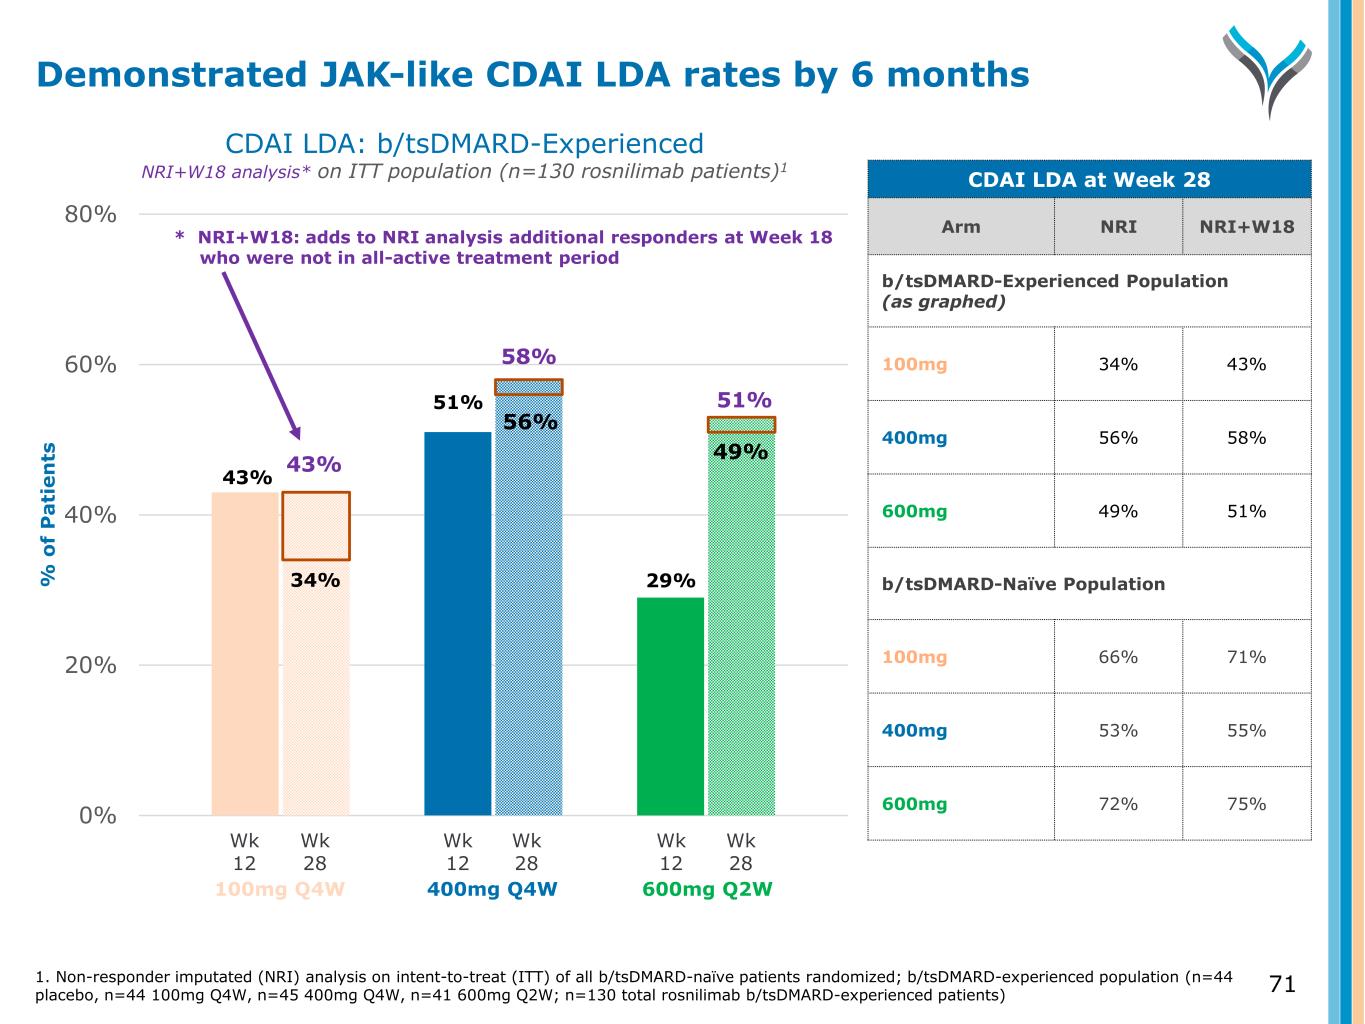
71 0% 20% 40% 60% 80% % o f P a ti e n ts 43% 51% 29%34% CDAI LDA: b/tsDMARD-Experienced NRI+W18 analysis* on ITT population (n=130 rosnilimab patients)1 Wk 12 Wk 28 Wk 12 Wk 28 Wk 12 Wk 28 100mg Q4W 400mg Q4W 600mg Q2W Demonstrated JAK-like CDAI LDA rates by 6 months CDAI LDA at Week 28 Arm NRI NRI+W18 b/tsDMARD-Experienced Population (as graphed) 100mg 34% 43% 400mg 56% 58% 600mg 49% 51% b/tsDMARD-Naïve Population 100mg 66% 71% 400mg 53% 55% 600mg 72% 75% 56% 49%43% 58% 51% 1. Non-responder imputated (NRI) analysis on intent-to-treat (ITT) of all b/tsDMARD-naïve patients randomized; b/tsDMARD-experienced population (n=44 placebo, n=44 100mg Q4W, n=45 400mg Q4W, n=41 600mg Q2W; n=130 total rosnilimab b/tsDMARD-experienced patients) * NRI+W18: adds to NRI analysis additional responders at Week 18 who were not in all-active treatment period
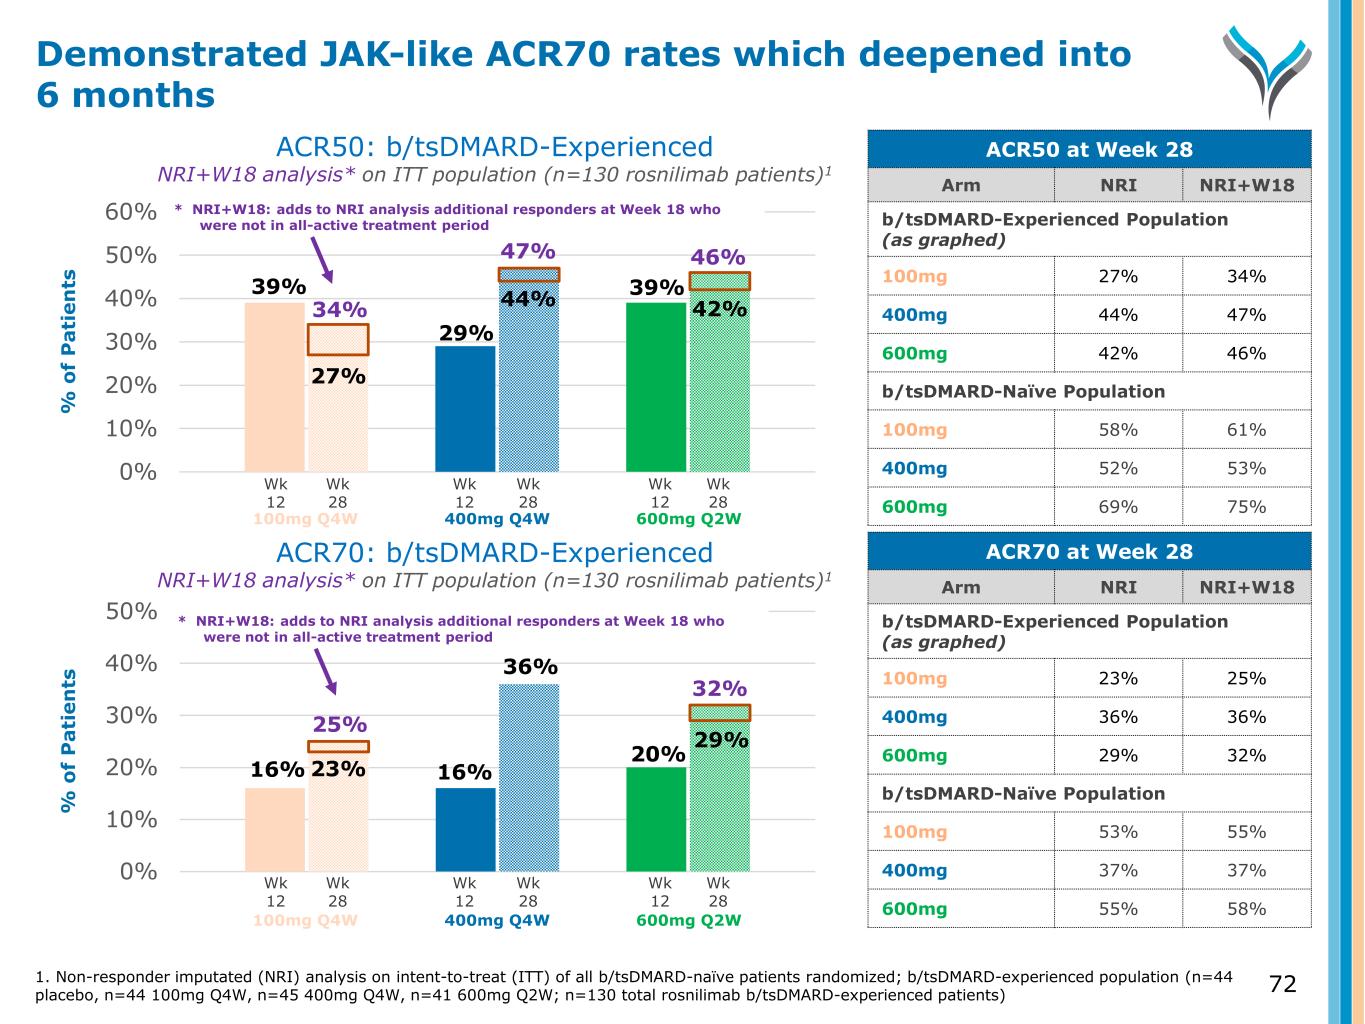
0% 10% 20% 30% 40% 50% % o f P a ti e n ts ACR50: b/tsDMARD-Experienced NRI+W18 analysis* on ITT population (n=130 rosnilimab patients)1 ACR70: b/tsDMARD-Experienced NRI+W18 analysis* on ITT population (n=130 rosnilimab patients)1 0% 10% 20% 30% 40% 50% 60% % o f P a ti e n ts Wk 12 Wk 28 Wk 12 Wk 28 Wk 12 Wk 28 Wk 12 Wk 28 Wk 12 Wk 28 Wk 12 Wk 28 100mg Q4W 400mg Q4W 600mg Q2W 100mg Q4W 400mg Q4W 600mg Q2W Demonstrated JAK-like ACR70 rates which deepened into 6 months ACR50 at Week 28 Arm NRI NRI+W18 b/tsDMARD-Experienced Population (as graphed) 100mg 27% 34% 400mg 44% 47% 600mg 42% 46% b/tsDMARD-Naïve Population 100mg 58% 61% 400mg 52% 53% 600mg 69% 75% ACR70 at Week 28 Arm NRI NRI+W18 b/tsDMARD-Experienced Population (as graphed) 100mg 23% 25% 400mg 36% 36% 600mg 29% 32% b/tsDMARD-Naïve Population 100mg 53% 55% 400mg 37% 37% 600mg 55% 58% 39% 27% 29% 44% 42% 39% 46%47% 34% 16% 16% 20% 23% 36% 29% 32% 25% 1. Non-responder imputated (NRI) analysis on intent-to-treat (ITT) of all b/tsDMARD-naïve patients randomized; b/tsDMARD-experienced population (n=44 placebo, n=44 100mg Q4W, n=45 400mg Q4W, n=41 600mg Q2W; n=130 total rosnilimab b/tsDMARD-experienced patients) * NRI+W18: adds to NRI analysis additional responders at Week 18 who were not in all-active treatment period * NRI+W18: adds to NRI analysis additional responders at Week 18 who were not in all-active treatment period 72