Oct. 14, 2025 ANB033 (CD122 antagonist) Investor Event
This presentation and any accompanying oral presentation contains forward-looking statements within the meaning of the "safe harbor" provisions of the Private Securities Litigation Reform Act of 1995, including, but not limited to: the timing of the release of data from the Company’s clinical trials, including rosnilimab’s Phase 2 clinical trial in ulcerative colitis and ANB033's Phase 1b clinical trial in celiac disease; the timing of initiation of ANB033’s Phase 1b clinical trial in a second indication; expectations regarding the structure, infrastructure, timing and taxation of the proposed separation of companies; whether any of the Company’s product candidates will be best in class or optimized; the potential to receive any additional milestones or royalties from the GSK collaboration and timing therefor; the potential to receive any royalties or milestone payments from the Vanda Pharmaceuticals license agreement; and the Company’s projected cash runway. Statements including words such as “plan,” “continue,” “expect,” or “ongoing” and statements in the future tense are forward-looking statements. These forward-looking statements involve risks and uncertainties, as well as assumptions, which, if they do not fully materialize or prove incorrect, could cause its results to differ materially from those expressed or implied by such forward-looking statements. Forward-looking statements are subject to risks and uncertainties that may cause the company’s actual activities or results to differ significantly from those expressed in any forward-looking statement, including risks and uncertainties related to the company’s ability to advance its product candidates, obtain regulatory approval of and ultimately commercialize its product candidates, the timing and results of preclinical and clinical trials, the company’s ability to fund development activities and achieve development goals, the company’s ability to protect intellectual property and other risks and uncertainties described under the heading “Risk Factors” in documents the company files from time to time with the Securities and Exchange Commission. These forward-looking statements speak only as of the date of this presentation, and the company undertakes no obligation to revise or update any forward- looking statements to reflect events or circumstances after the date hereof. Certain information contained in this presentation may be derived from information provided by industry sources. The Company believes such information is accurate and that the sources from which it has been obtained are reliable. However, the Company cannot guarantee the accuracy of, and has not independently verified, such information. The trademarks included herein are the property of the owners thereof and are used for reference purposes only. Such use should not be construed as an endorsement of such products. 2 Forward looking statement
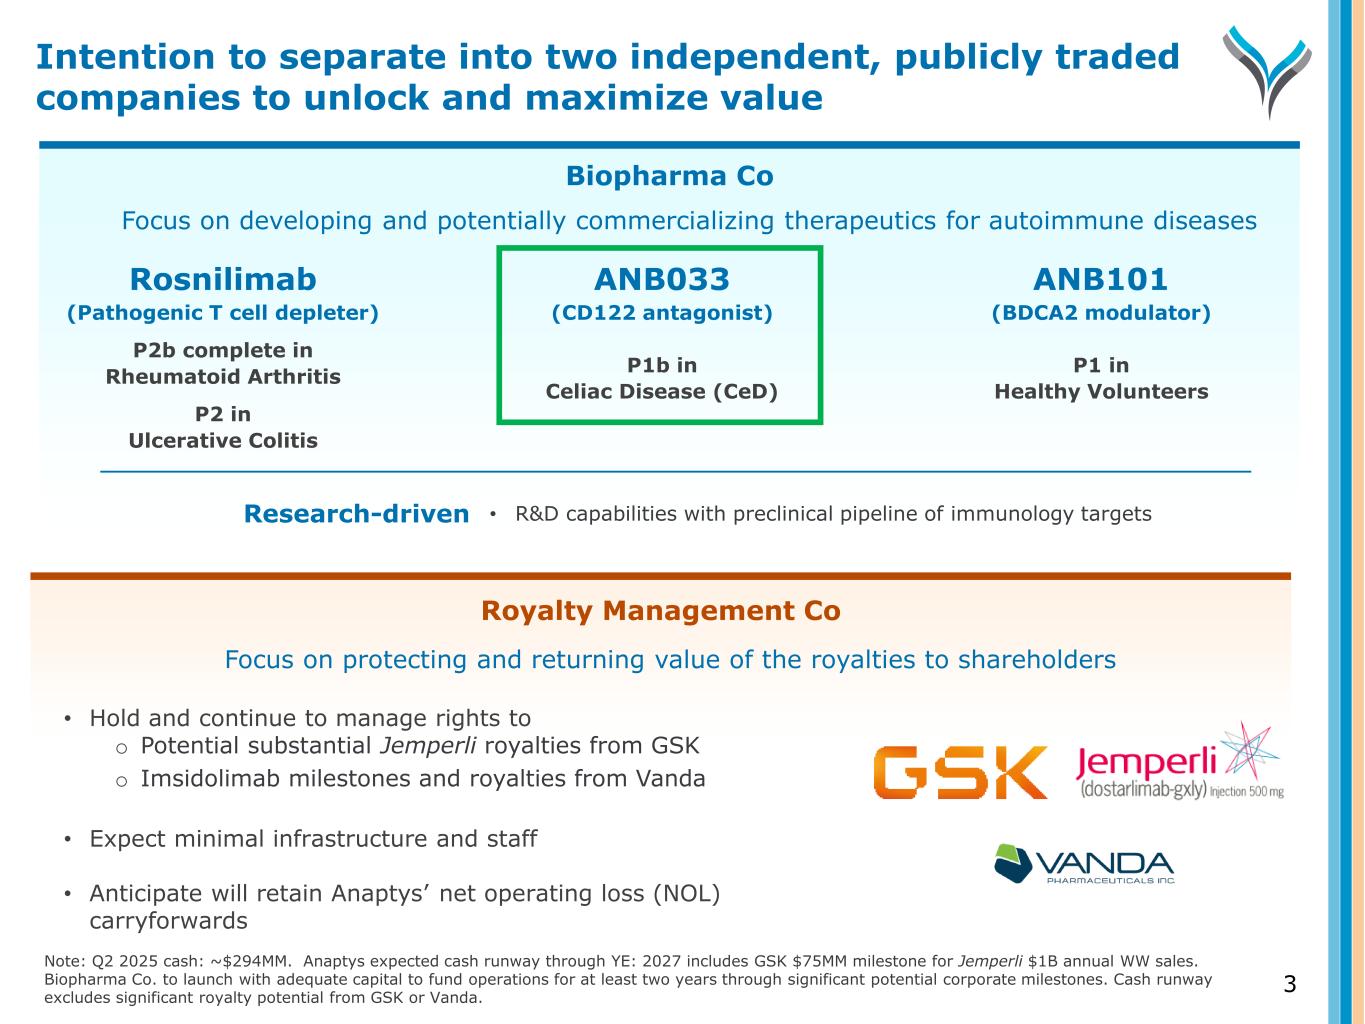
Biopharma Co ANB033 (CD122 antagonist) P1b in Celiac Disease (CeD) Rosnilimab (Pathogenic T cell depleter) P2b complete in Rheumatoid Arthritis P2 in Ulcerative Colitis Focus on developing and potentially commercializing therapeutics for autoimmune diseases ANB101 (BDCA2 modulator) P1 in Healthy Volunteers Royalty Management Co 3 Research-driven • R&D capabilities with preclinical pipeline of immunology targets Note: Q2 2025 cash: ~$294MM. Anaptys expected cash runway through YE: 2027 includes GSK $75MM milestone for Jemperli $1B annual WW sales. Biopharma Co. to launch with adequate capital to fund operations for at least two years through significant potential corporate milestones. Cash runway excludes significant royalty potential from GSK or Vanda. Focus on protecting and returning value of the royalties to shareholders • Hold and continue to manage rights to o Potential substantial Jemperli royalties from GSK o Imsidolimab milestones and royalties from Vanda • Expect minimal infrastructure and staff • Anticipate will retain Anaptys’ net operating loss (NOL) carryforwards Intention to separate into two independent, publicly traded companies to unlock and maximize value
4 • Targeting only the IL-15 cytokine addresses inflammation, but may allow pathogenic cell survival through alternative escape mechanisms • CD122 is the shared receptor subunit through which both IL-15 and IL-2 signal • IL-15 and IL-2 are central cytokines in pathogenic inflammation across broad inflammatory diseases o Overactive signaling drives proliferation and survival of cytotoxic CD8+ and CD4+ T cell subsets and NK cells o Inflammatory Th1 and Th2 cytokine secretion during T cell activation Why target CD122? Targeting CD122 has strong biologic rationale
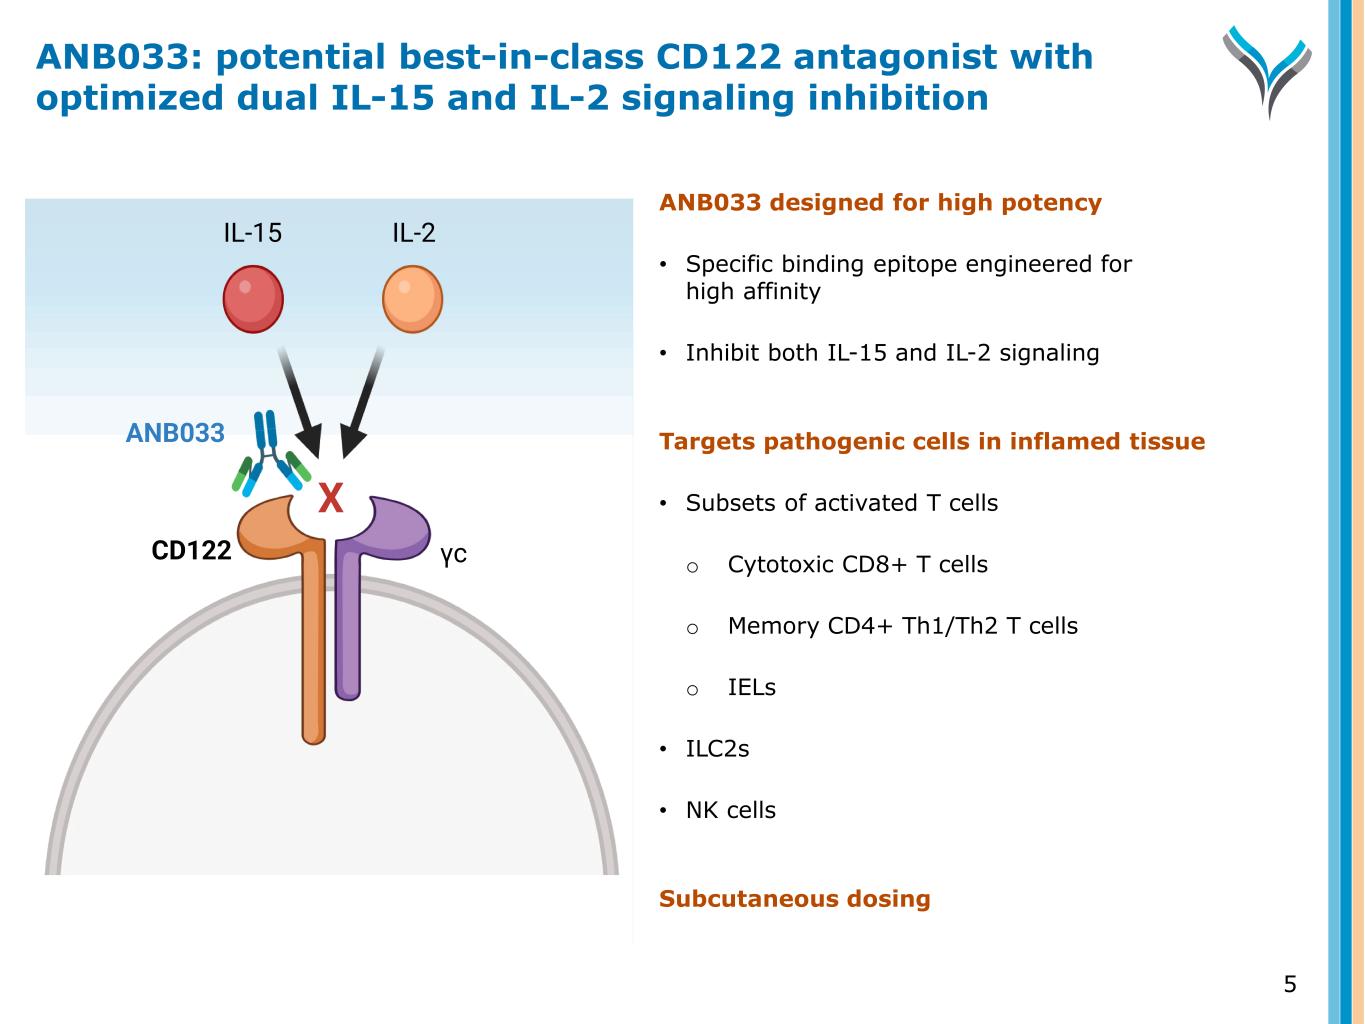
ANB033 designed for high potency • Specific binding epitope engineered for high affinity • Inhibit both IL-15 and IL-2 signaling Targets pathogenic cells in inflamed tissue • Subsets of activated T cells o Cytotoxic CD8+ T cells o Memory CD4+ Th1/Th2 T cells o IELs • ILC2s • NK cells Subcutaneous dosing 5 CD122 γc IL-15 IL-2 ANB033 X ANB033: potential best-in-class CD122 antagonist with optimized dual IL-15 and IL-2 signaling inhibition
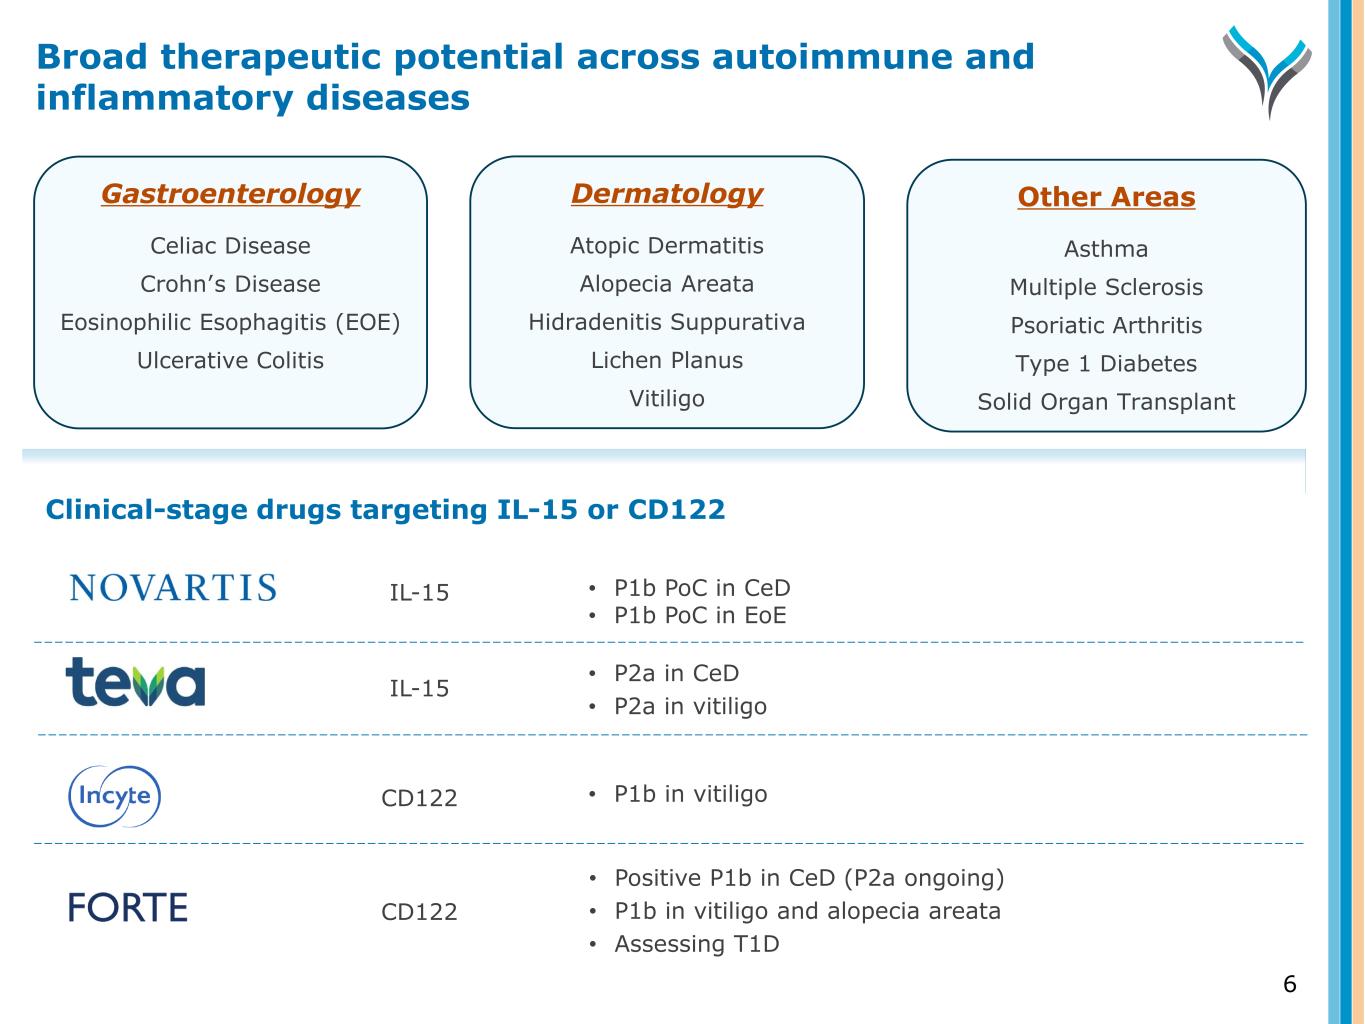
Gastroenterology Celiac Disease Crohn’s Disease Eosinophilic Esophagitis (EOE) Ulcerative Colitis Dermatology Atopic Dermatitis Alopecia Areata Hidradenitis Suppurativa Lichen Planus Vitiligo Other Areas Asthma Multiple Sclerosis Psoriatic Arthritis Type 1 Diabetes Solid Organ Transplant • P1b PoC in CeD • P1b PoC in EoE • P2a in CeD • P2a in vitiligo • P1b in vitiligo • Positive P1b in CeD (P2a ongoing) • P1b in vitiligo and alopecia areata • Assessing T1D Clinical-stage drugs targeting IL-15 or CD122 IL-15 IL-15 CD122 CD122 Broad therapeutic potential across autoimmune and inflammatory diseases 6
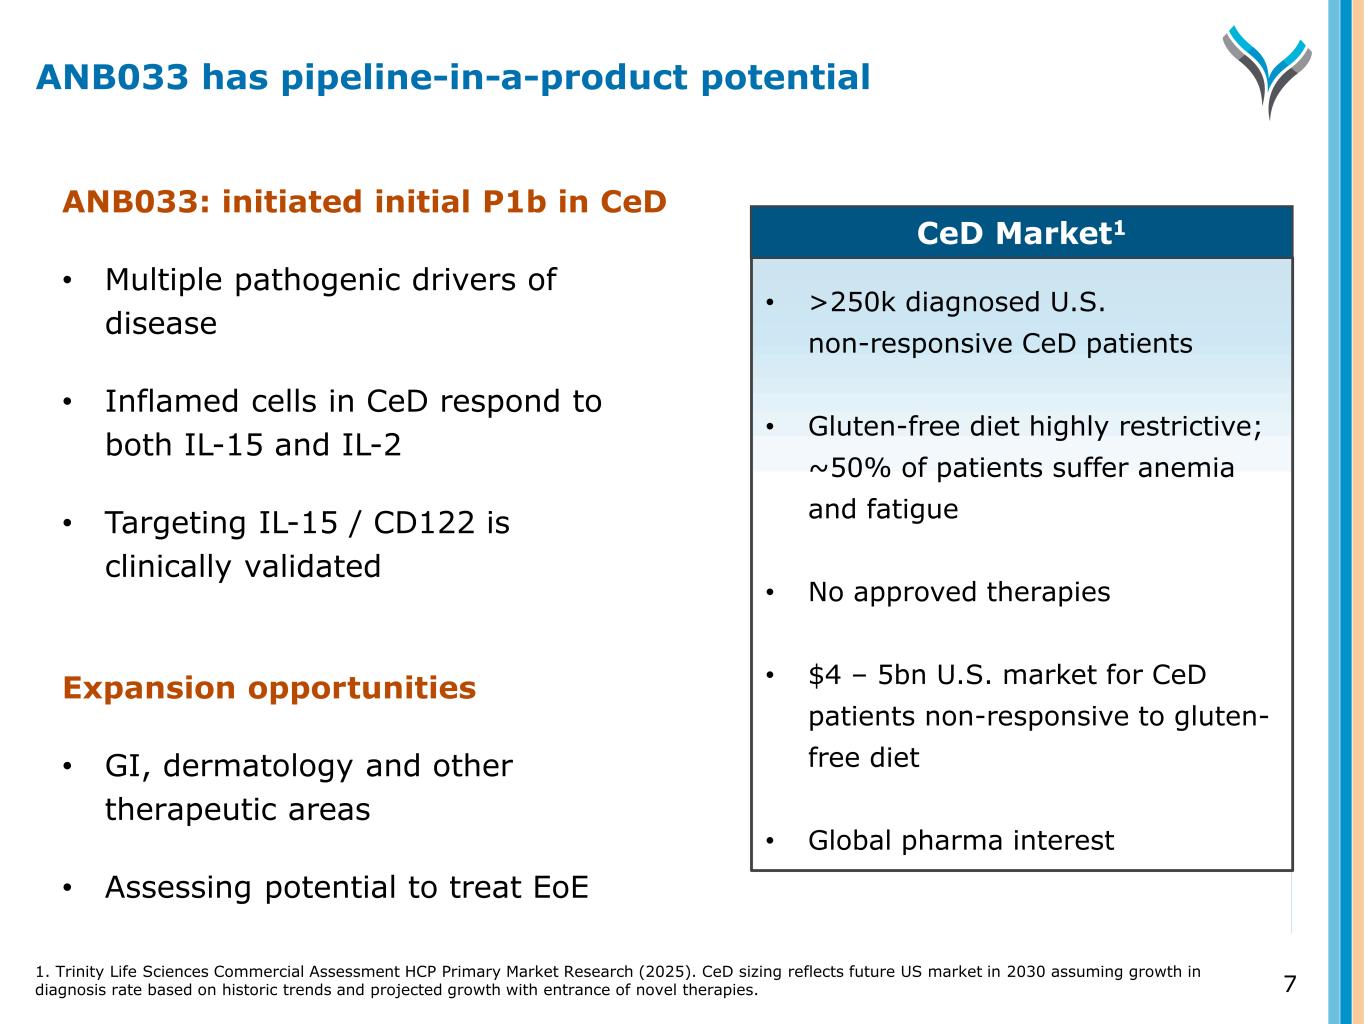
7 ANB033: initiated initial P1b in CeD • Multiple pathogenic drivers of disease • Inflamed cells in CeD respond to both IL-15 and IL-2 • Targeting IL-15 / CD122 is clinically validated Expansion opportunities • GI, dermatology and other therapeutic areas • Assessing potential to treat EoE • >250k diagnosed U.S. non-responsive CeD patients • Gluten-free diet highly restrictive; ~50% of patients suffer anemia and fatigue • No approved therapies • $4 – 5bn U.S. market for CeD patients non-responsive to gluten- free diet • Global pharma interest CeD Market1 ANB033 has pipeline-in-a-product potential 1. Trinity Life Sciences Commercial Assessment HCP Primary Market Research (2025). CeD sizing reflects future US market in 2030 assuming growth in diagnosis rate based on historic trends and projected growth with entrance of novel therapies.
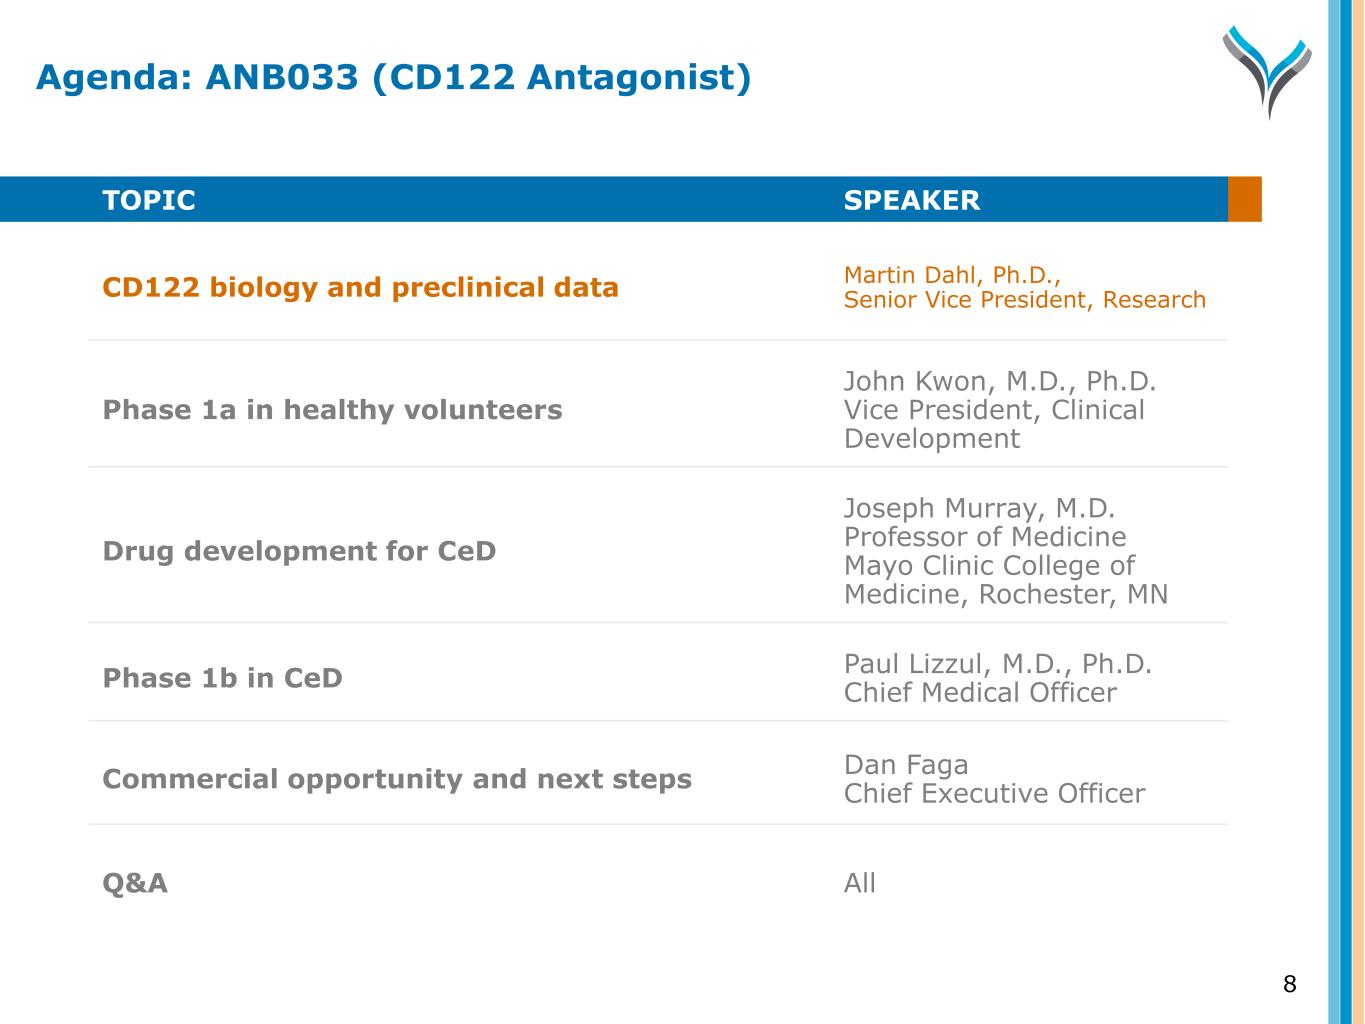
TOPIC SPEAKER CD122 biology and preclinical data Martin Dahl, Ph.D., Senior Vice President, Research Phase 1a in healthy volunteers John Kwon, M.D., Ph.D. Vice President, Clinical Development Drug development for CeD Joseph Murray, M.D. Professor of Medicine Mayo Clinic College of Medicine, Rochester, MN Phase 1b in CeD Paul Lizzul, M.D., Ph.D. Chief Medical Officer Commercial opportunity and next steps Dan Faga Chief Executive Officer Q&A All 8 Agenda: ANB033 (CD122 Antagonist)
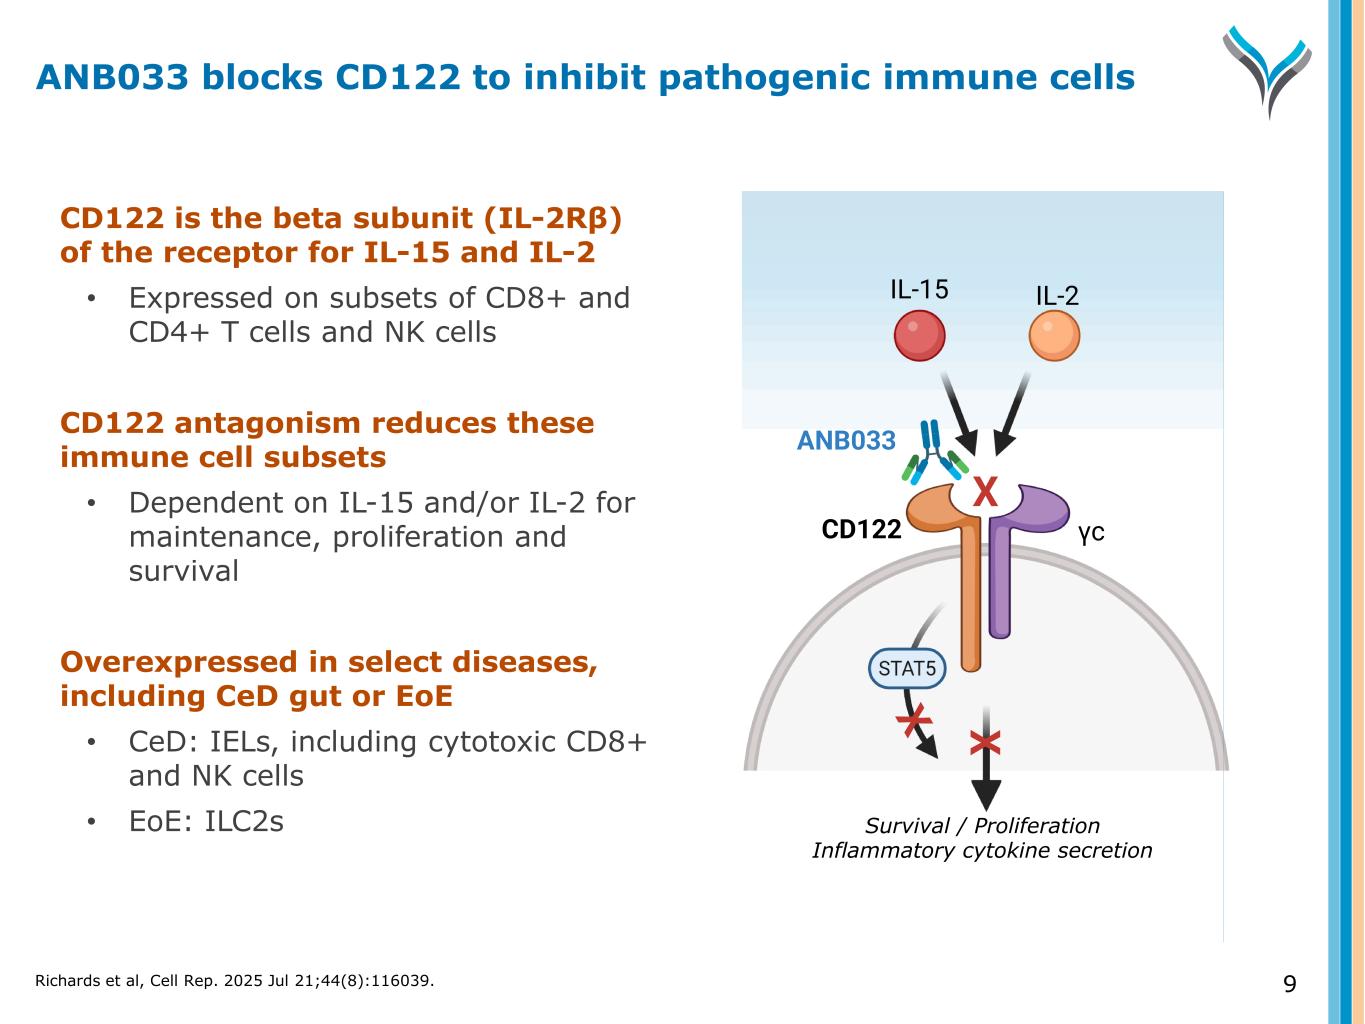
9 CD122 is the beta subunit (IL-2Rβ) of the receptor for IL-15 and IL-2 • Expressed on subsets of CD8+ and CD4+ T cells and NK cells CD122 antagonism reduces these immune cell subsets • Dependent on IL-15 and/or IL-2 for maintenance, proliferation and survival Overexpressed in select diseases, including CeD gut or EoE • CeD: IELs, including cytotoxic CD8+ and NK cells • EoE: ILC2s Survival / Proliferation Inflammatory cytokine secretion CD122 γc IL-15 IL-2 ANB033 X X ANB033 blocks CD122 to inhibit pathogenic immune cells Richards et al, Cell Rep. 2025 Jul 21;44(8):116039.
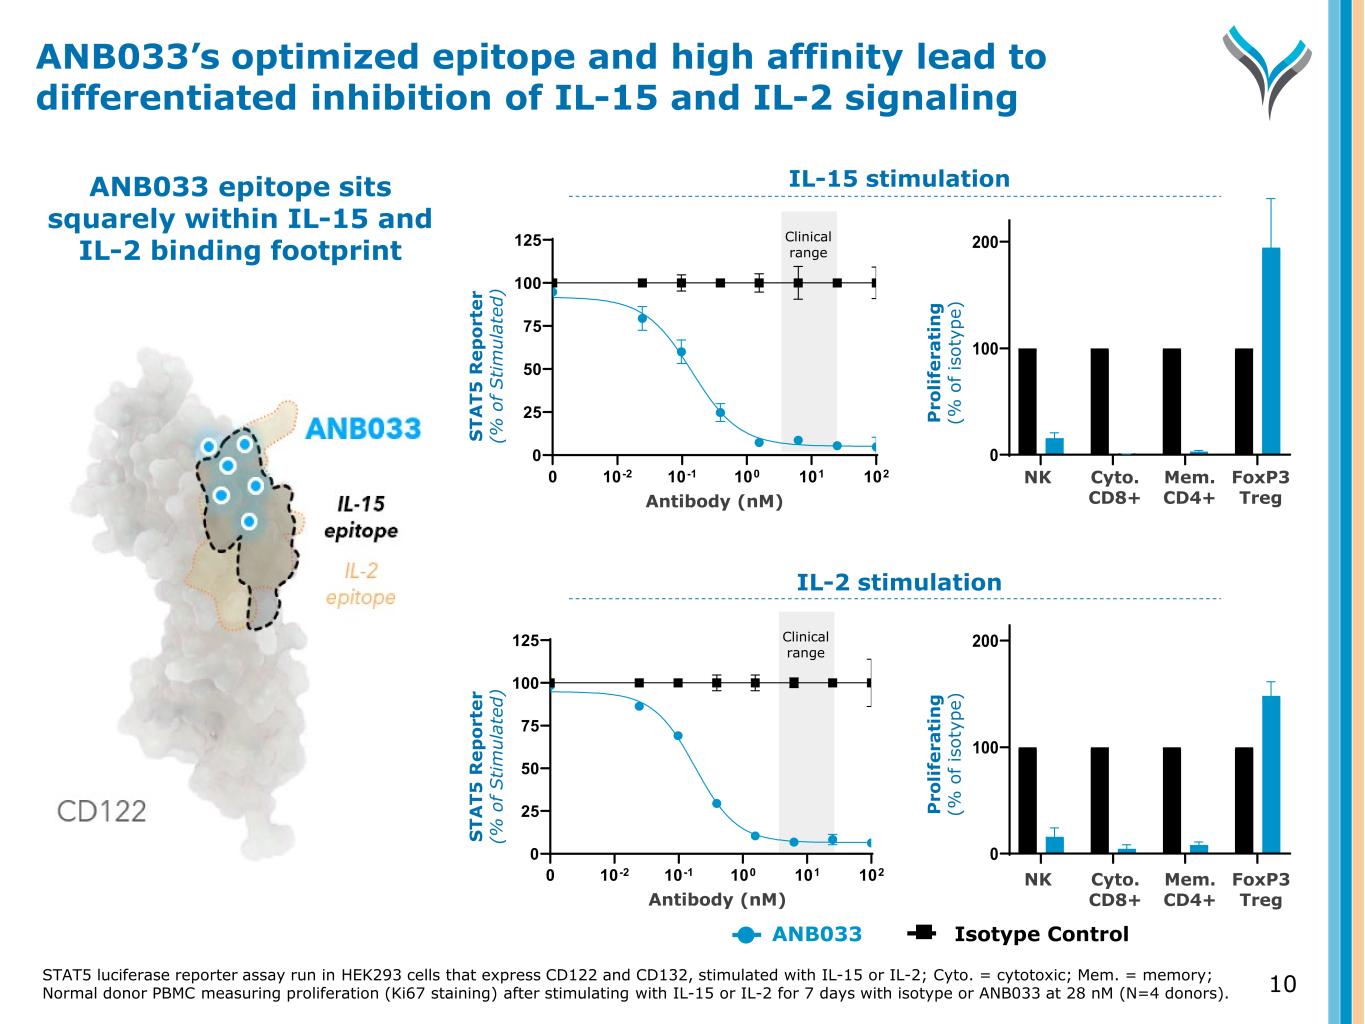
ANB033 epitope sits squarely within IL-15 and IL-2 binding footprint 10-2 10-1 100 101 102 0 25 50 75 100 125 0 10-2 10-1 100 101 102 0 25 50 75 100 125 0 S T A T 5 R e p o rt e r (% o f S ti m ul at ed ) S T A T 5 R e p o rt e r (% o f S ti m ul at ed ) Antibody (nM) Antibody (nM) ANB033’s optimized epitope and high affinity lead to differentiated inhibition of IL-15 and IL-2 signaling NK Cyto toxic C D8+ Mem ory CD4+ Fo xP 3h igh T reg 0 100 200 300 % P ro lif er at in g NK Cyto toxic C D8+ Mem ory CD4+ Fo xP 3h igh T reg 0 100 200 300 % P ro lif er at in g P ro li fe ra ti n g (% o f is ot yp e) P ro li fe ra ti n g (% o f is ot yp e) IL-2 stimulation IL-15 stimulation Clinical range Clinical range ANB033 Isotype C ntrol NK Cyto. C 8+ Mem. CD4+ FoxP3 reg N Cyto. D8+ Mem. D4+ FoxP3 reg 10STAT5 luciferase reporter assay run in HEK293 cells that express CD122 and CD132, stimulated with IL-15 or IL-2; Cyto. = cytotoxic; Mem. = memory; Normal donor PBMC measuring proliferation (Ki67 staining) after stimulating with IL-15 or IL-2 for 7 days with isotype or ANB033 at 28 nM (N=4 donors).
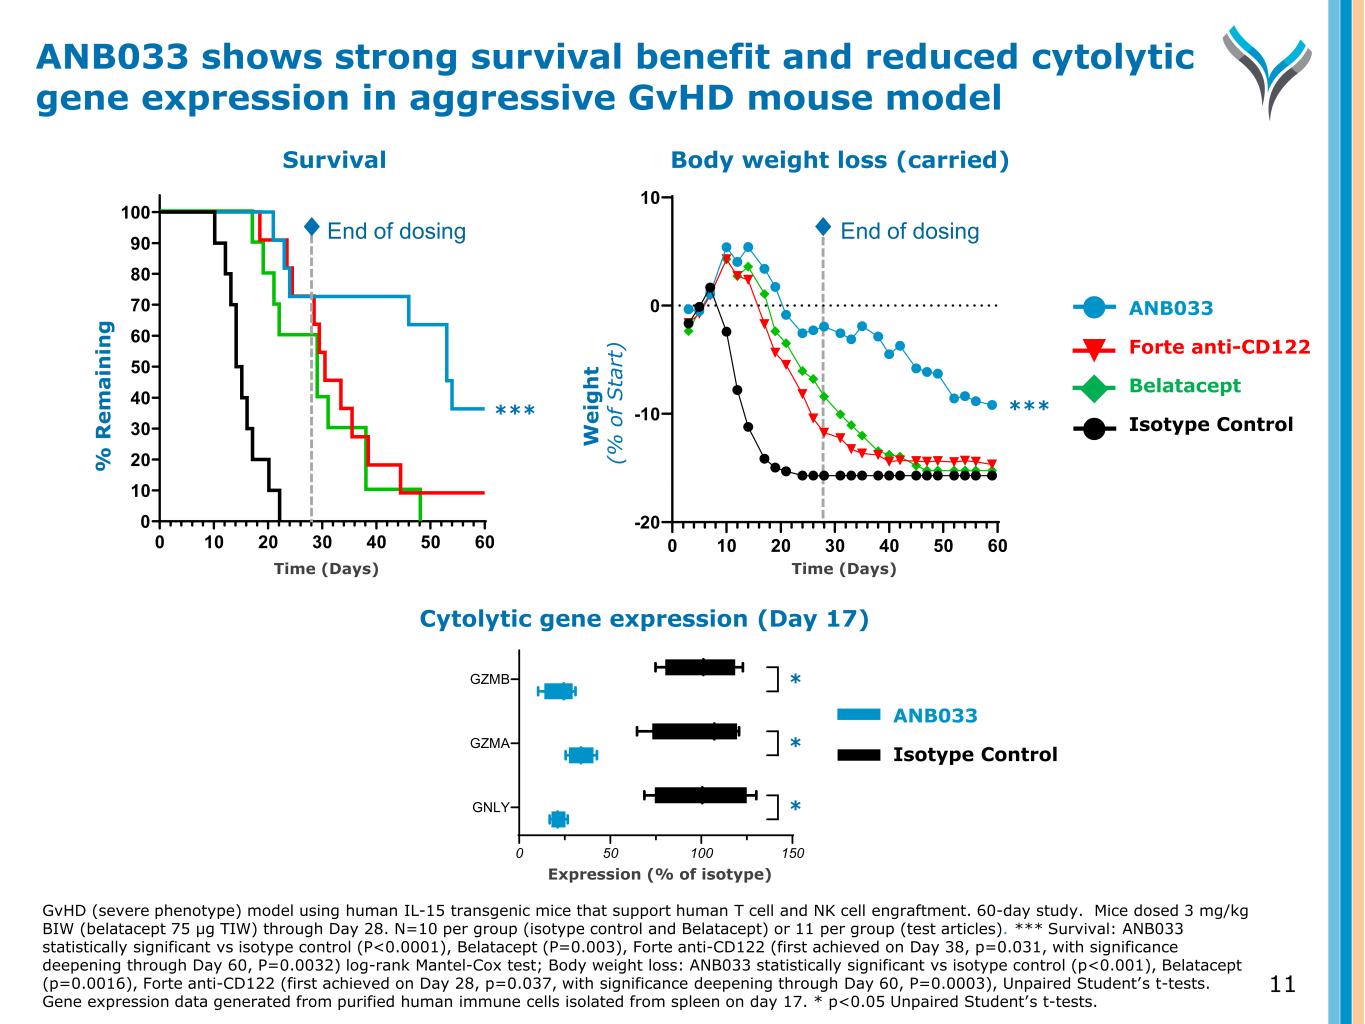
11 Body weight loss (carried) W e ig h t ( % o f S ta rt ) End of dosing 0 10 20 30 40 50 60 -20 -10 0 10 Study Day Cytolytic gene expression (Day 17) Expression (% of isotype) 0 50 100 150 GNLY GZMA GZMB ✱ ✱ ✱ ANB033 Forte anti-CD122 Belatacept Isotype Control ANB033 Isotype Control ****** Survival W e ig h t ( % o f S ta rt ) % R e m a in in g 0 10 20 30 40 50 60 0 10 20 30 40 50 60 70 80 90 100 Study Day End of dosing ANB033 shows strong survival benefit and reduced cytolytic gene expression in aggressive GvHD mouse model GvHD (severe phenotype) model using human IL-15 transgenic mice that support human T cell and NK cell engraftment. 60-day study. Mice dosed 3 mg/kg BIW (belatacept 75 µg TIW) through Day 28. N=10 per group (isotype control and Belatacept) or 11 per group (test articles). *** Survival: ANB033 statistically significant vs isotype control (P<0.0001), Belatacept (P=0.003), Forte anti-CD122 (first achieved on Day 38, p=0.031, with significance deepening through Day 60, P=0.0032) log-rank Mantel-Cox test; Body weight loss: ANB033 statistically significant vs isotype control (p<0.001), Belatacept (p=0.0016), Forte anti-CD122 (first achieved on Day 28, p=0.037, with significance deepening through Day 60, P=0.0003), Unpaired Student’s t-tests. Gene expression data generated from purified human immune cells isolated from spleen on day 17. * p<0.05 Unpaired Student’s t-tests. Time (Days) Time (Days) * * *
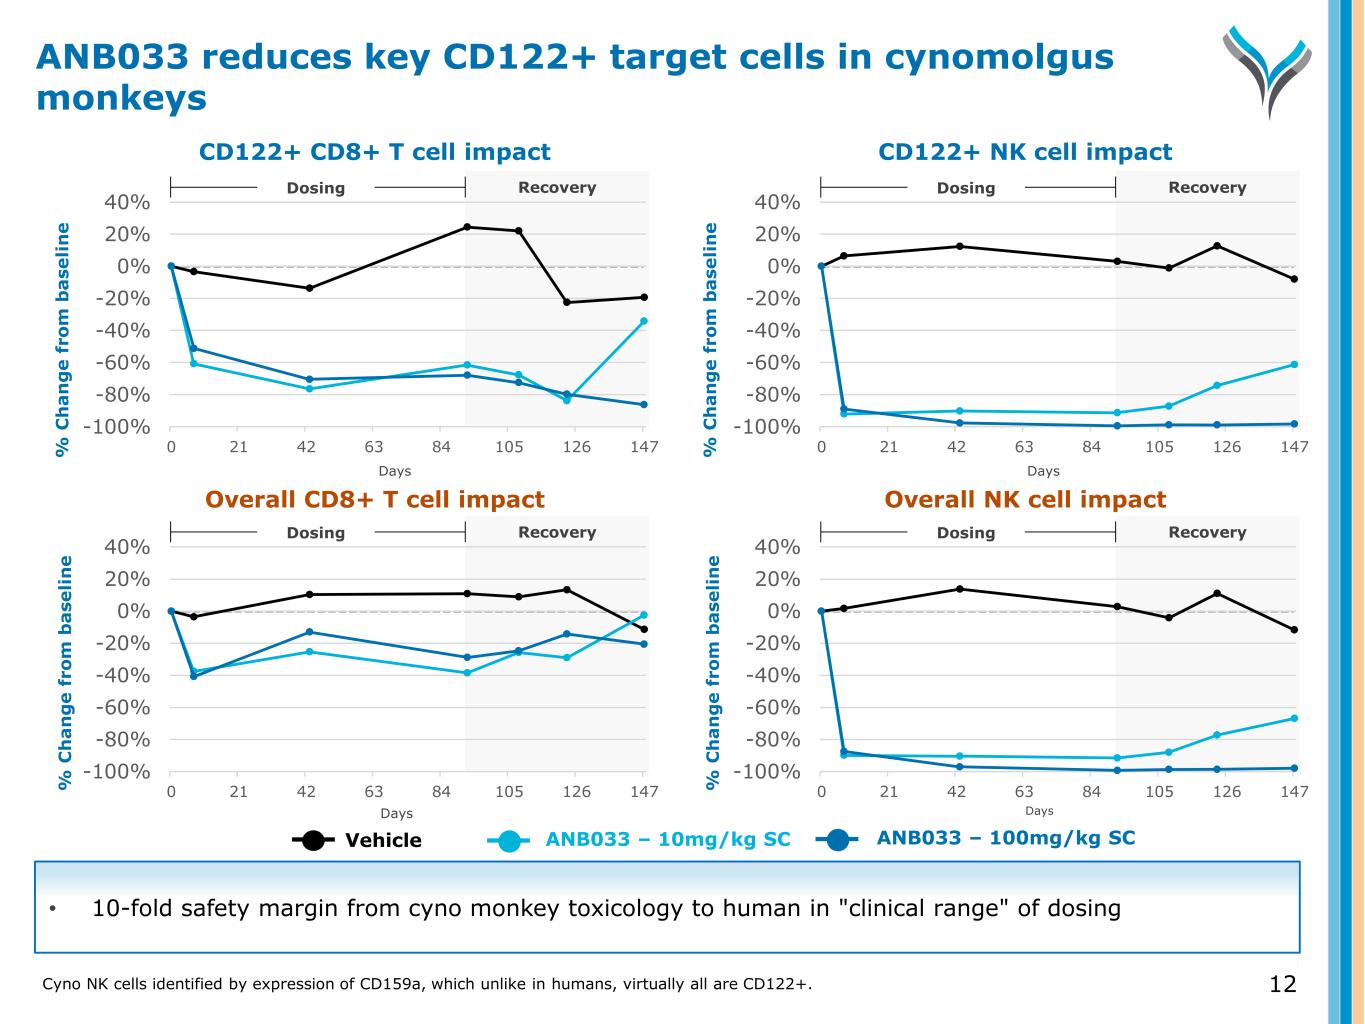
% C h a n g e f ro m b a se li n e % C h a n g e f ro m b a se li n e % C h a n g e f ro m b a se li n e % C h a n g e f ro m b a se li n e CD122+ CD8+ T cell impact CD122+ NK cell impact Overall CD8+ T cell impact Overall NK cell impact Vehicle ANB033 – 10mg/kg SC ANB033 – 100mg/kg SC Recovery -100% -80% -60% -40% -20% 0% 20% 40% 0 21 42 63 84 105 126 147 Dosing • 10-fold safety margin from cyno monkey toxicology to human in "clinical range" of dosing Days Days Days Days Recovery -100% -80% -60% -40% -20% 0% 20% 40% 0 21 42 63 84 105 126 147 Dosing Recovery -100% -80% -60% -40% -20% 0% 20% 40% 0 21 42 63 84 105 126 147 DosingRecovery -100% -80% -60% -40% -20% 0% 20% 40% 0 21 42 63 84 105 126 147 Dosing ANB033 reduces key CD122+ target cells in cynomolgus monkeys 12Cyno NK cells identified by expression of CD159a, which unlike in humans, virtually all are CD122+.
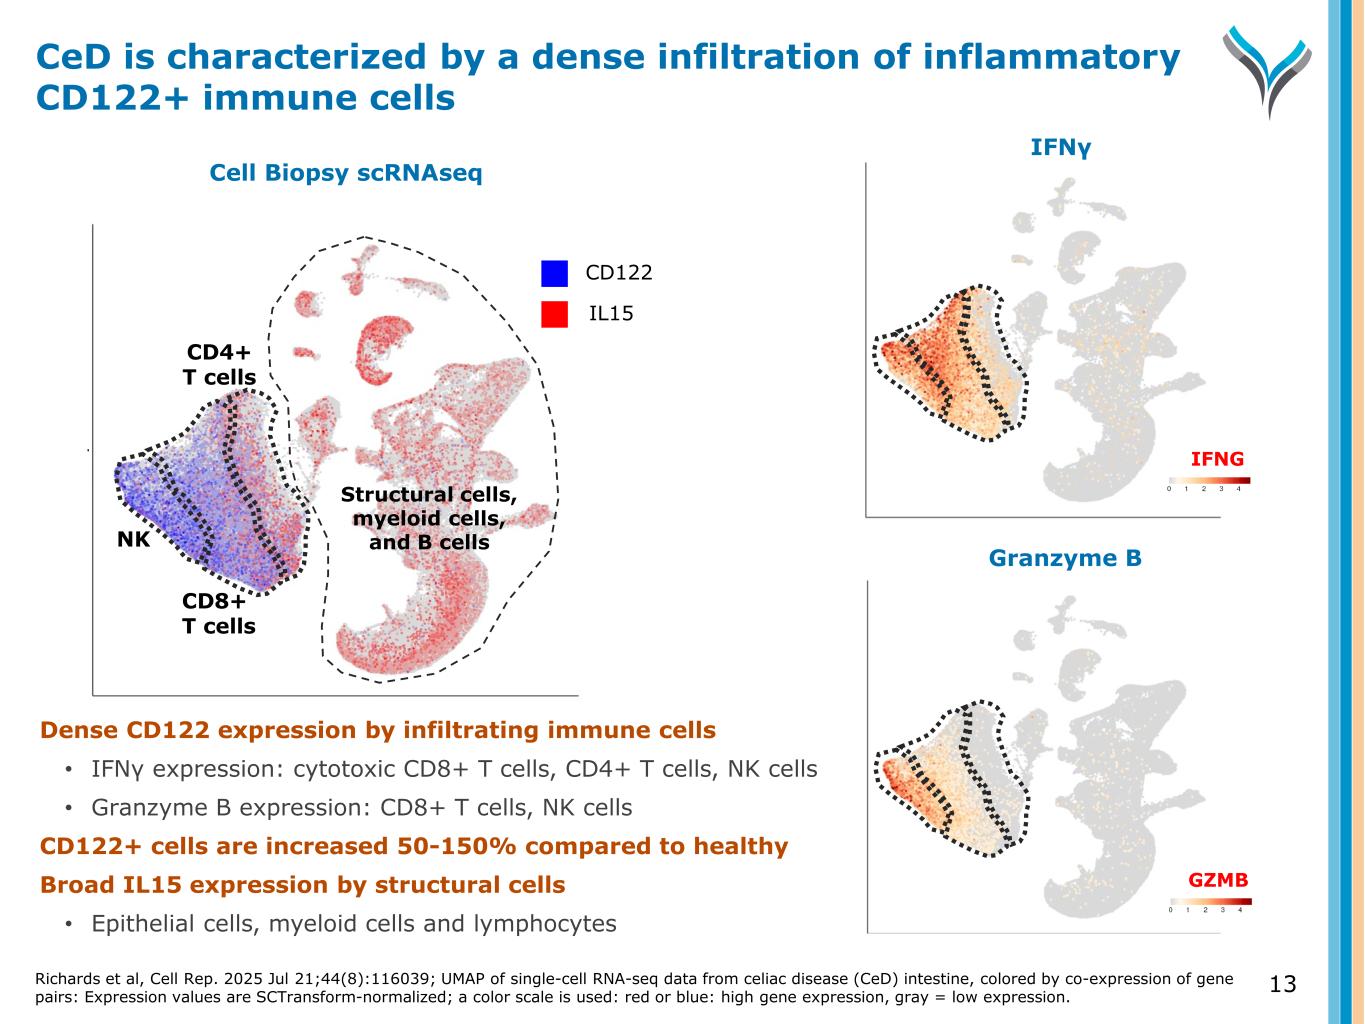
13 Granzyme B umap1 IFNγ u m a p 2 IFNG GZMB Cell Biopsy scRNAseq NK CD8+ T cells CD4+ T cells Structural cells, myeloid cells, and B cells CD122 IL15 CeD is characterized by a dense infiltration of inflammatory CD122+ immune cells Richards et al, Cell Rep. 2025 Jul 21;44(8):116039; UMAP of single-cell RNA-seq data from celiac disease (CeD) intestine, colored by co-expression of gene pairs: Expression values are SCTransform-normalized; a color scale is used: red or blue: high gene expression, gray = low expression. Dense CD122 expression by infiltrating immune cells • IFNγ expression: cytotoxic CD8+ T cells, CD4+ T cells, NK cells • Granzyme B expression: CD8+ T cells, NK cells CD122+ cells are increased 50-150% compared to healthy Broad IL15 expression by structural cells • Epithelial cells, myeloid cells and lymphocytes
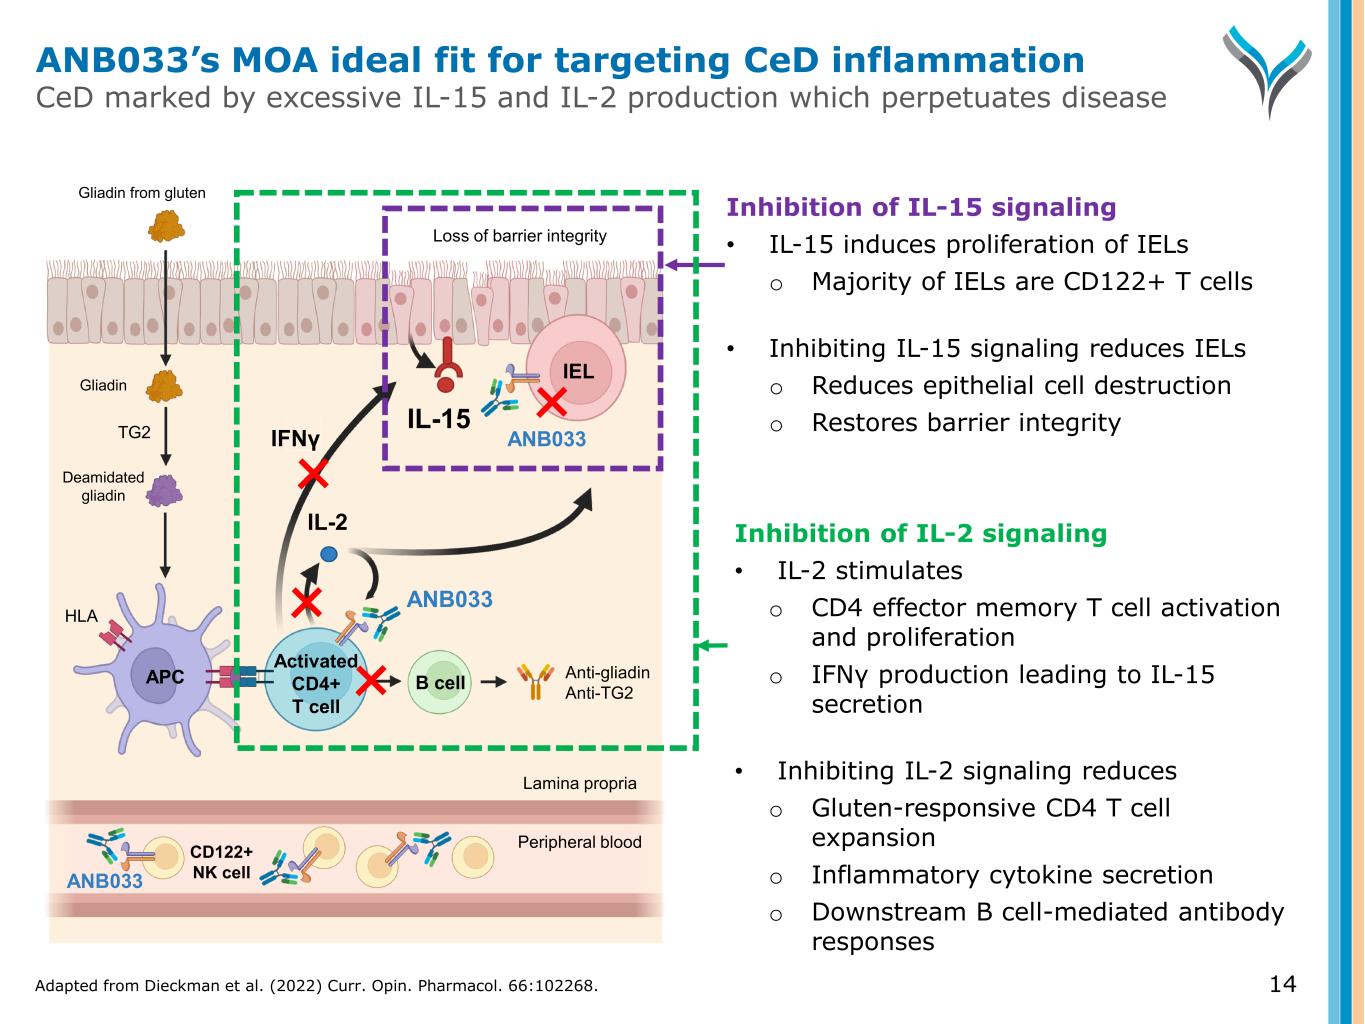
14 Activated CD4+ T cell IL-2 TG2 Anti-gliadin Anti-TG2 IEL APC B cell Gliadin Gliadin from gluten ANB033 Deamidated gliadin IFNγ ANB033 HLA Loss of barrier integrity IL-15 CD122+ NK cell Peripheral blood Lamina propria Inhibition of IL-2 signaling • IL-2 stimulates o CD4 effector memory T cell activation and proliferation o IFNγ production leading to IL-15 secretion • Inhibiting IL-2 signaling reduces o Gluten-responsive CD4 T cell expansion o Inflammatory cytokine secretion o Downstream B cell-mediated antibody responses Inhibition of IL-15 signaling • IL-15 induces proliferation of IELs o Majority of IELs are CD122+ T cells • Inhibiting IL-15 signaling reduces IELs o Reduces epithelial cell destruction o Restores barrier integrity ANB033 ANB033’s MOA ideal fit for targeting CeD inflammation CeD marked by excessive IL-15 and IL-2 production which perpetuates disease Adapted from Dieckman et al. (2022) Curr. Opin. Pharmacol. 66:102268.
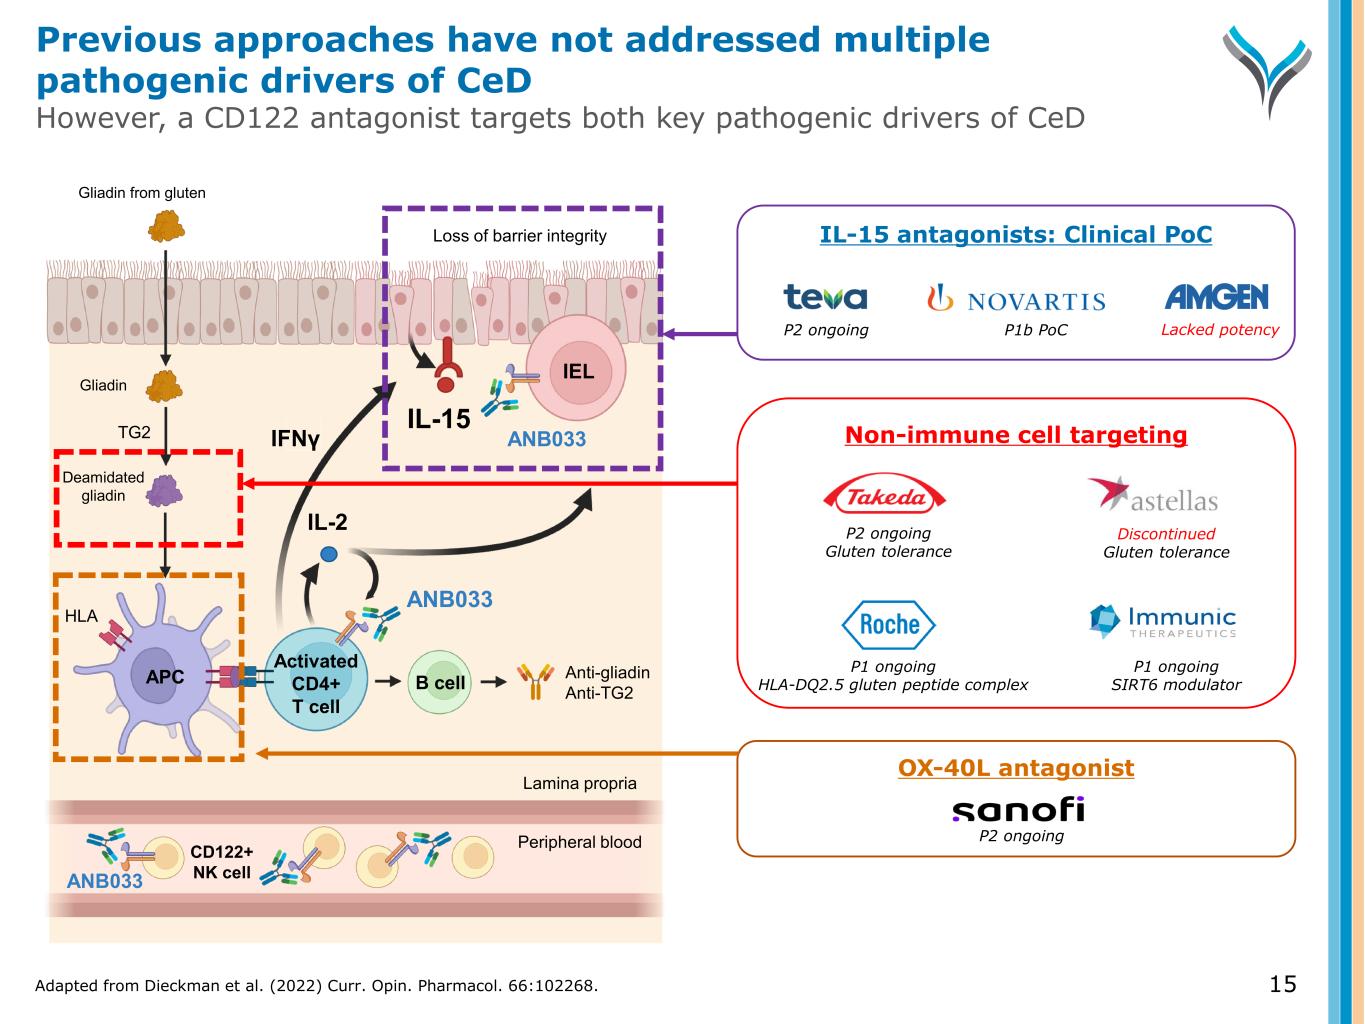
15 Activated CD4+ T cell IL-2 TG2 Anti-gliadin Anti-TG2 IEL APC B cell Gliadin Gliadin from gluten ANB033 Deamidated gliadin IFNγ ANB033 HLA Loss of barrier integrity IL-15 CD122+ NK cell Peripheral blood Lamina propria OX-40L antagonist P2 ongoing Non-immune cell targeting P1 ongoing HLA-DQ2.5 gluten peptide complex P1 ongoing SIRT6 modulator P2 ongoing Gluten tolerance Discontinued Gluten tolerance IL-15 antagonists: Clinical PoC P2 ongoing P1b PoC Lacked potency ANB033 Adapted from Dieckman et al. (2022) Curr. Opin. Pharmacol. 66:102268. Previous approaches have not addressed multiple pathogenic drivers of CeD However, a CD122 antagonist targets both key pathogenic drivers of CeD
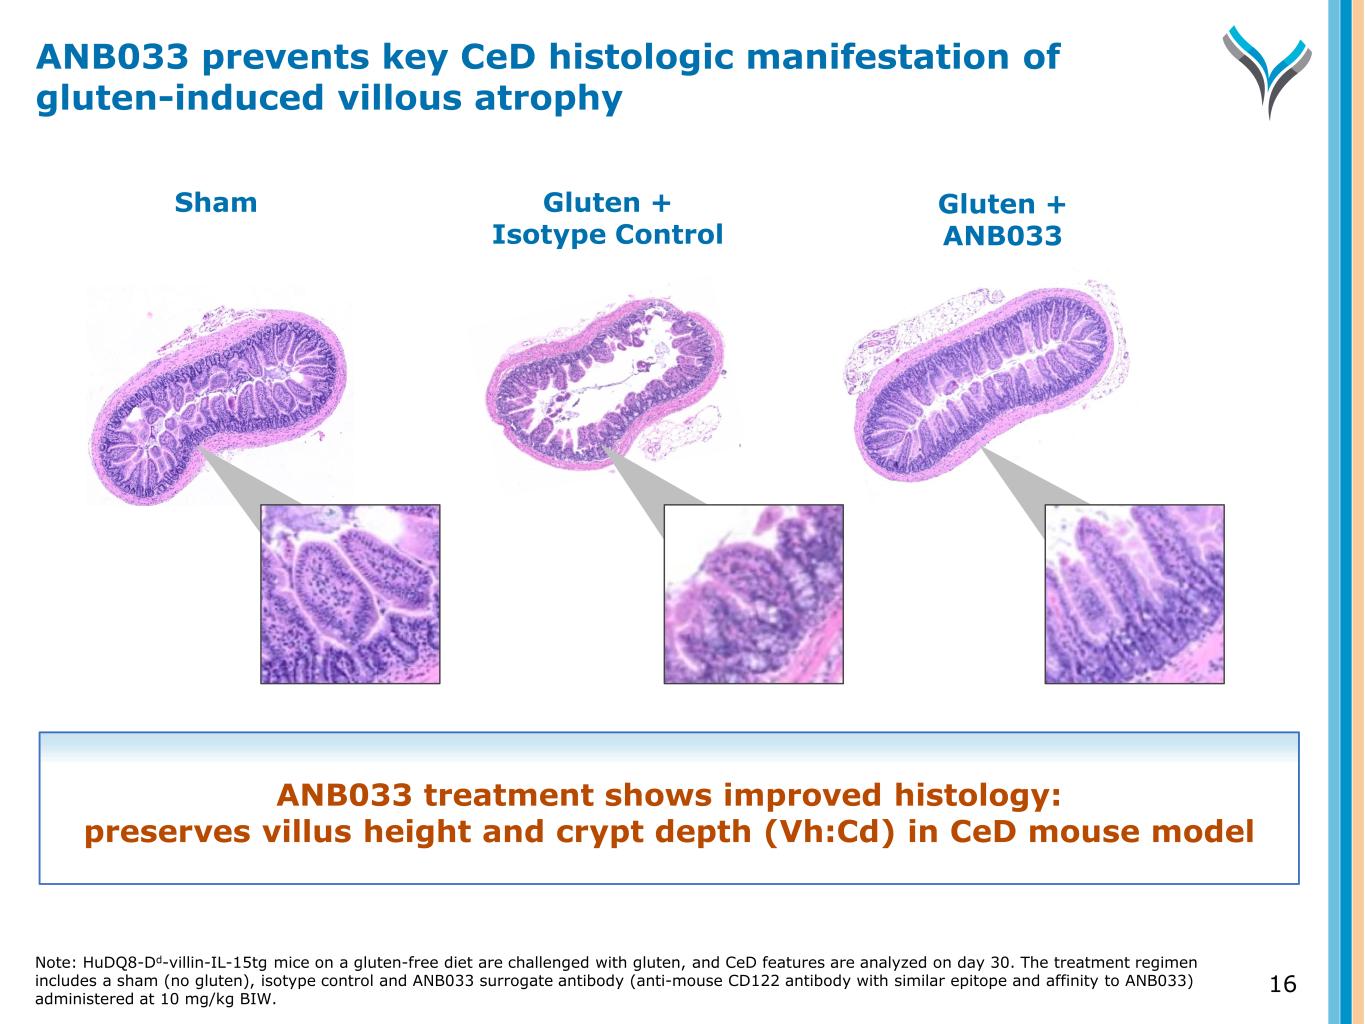
16 Sham Gluten + Isotype Control Gluten + ANB033 ANB033 treatment shows improved histology: preserves villus height and crypt depth (Vh:Cd) in CeD mouse model ANB033 prevents key CeD histologic manifestation of gluten-induced villous atrophy Note: HuDQ8-Dd-villin-IL-15tg mice on a gluten-free diet are challenged with gluten, and CeD features are analyzed on day 30. The treatment regimen includes a sham (no gluten), isotype control and ANB033 surrogate antibody (anti-mouse CD122 antibody with similar epitope and affinity to ANB033) administered at 10 mg/kg BIW.
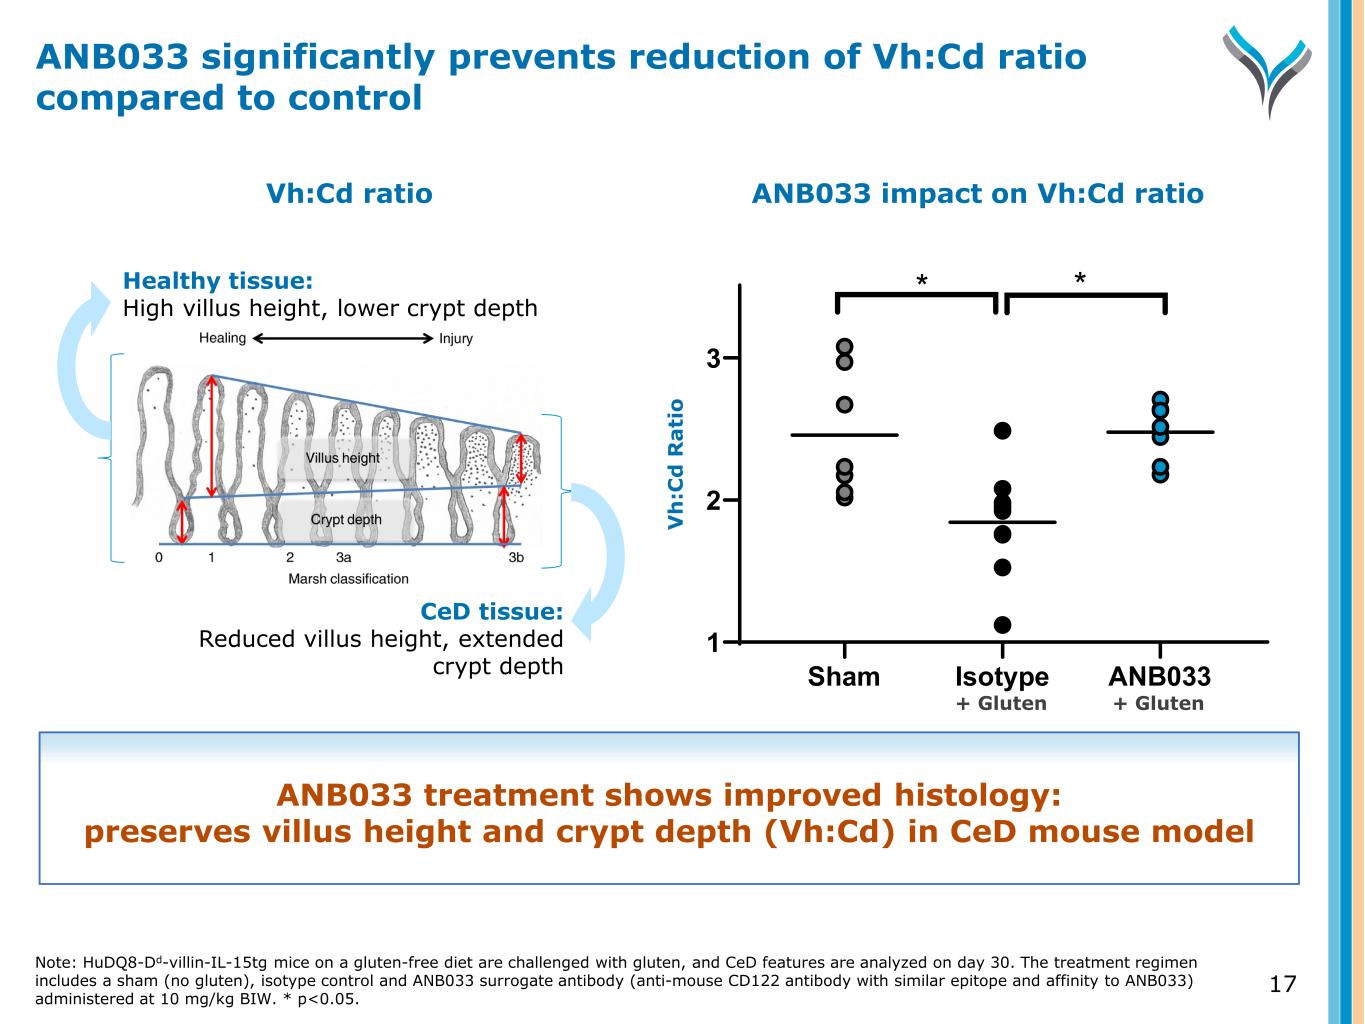
17 Healthy tissue: High villus height, lower crypt depth CeD tissue: Reduced villus height, extended crypt depth ANB033 impact on Vh:Cd ratio Sham Isotype ANB033 1 2 3 * * V h :C d R a ti o Vh:Cd ratio ANB033 significantly prevents reduction of Vh:Cd ratio compared to control ANB033 treatment shows improved histology: preserves villus height and crypt depth (Vh:Cd) in CeD mouse model Note: HuDQ8-Dd-villin-IL-15tg mice on a gluten-free diet are challenged with gluten, and CeD features are analyzed on day 30. The treatment regimen includes a sham (no gluten), isotype control and ANB033 surrogate antibody (anti-mouse CD122 antibody with similar epitope and affinity to ANB033) administered at 10 mg/kg BIW. * p<0.05. + Gluten + Gluten
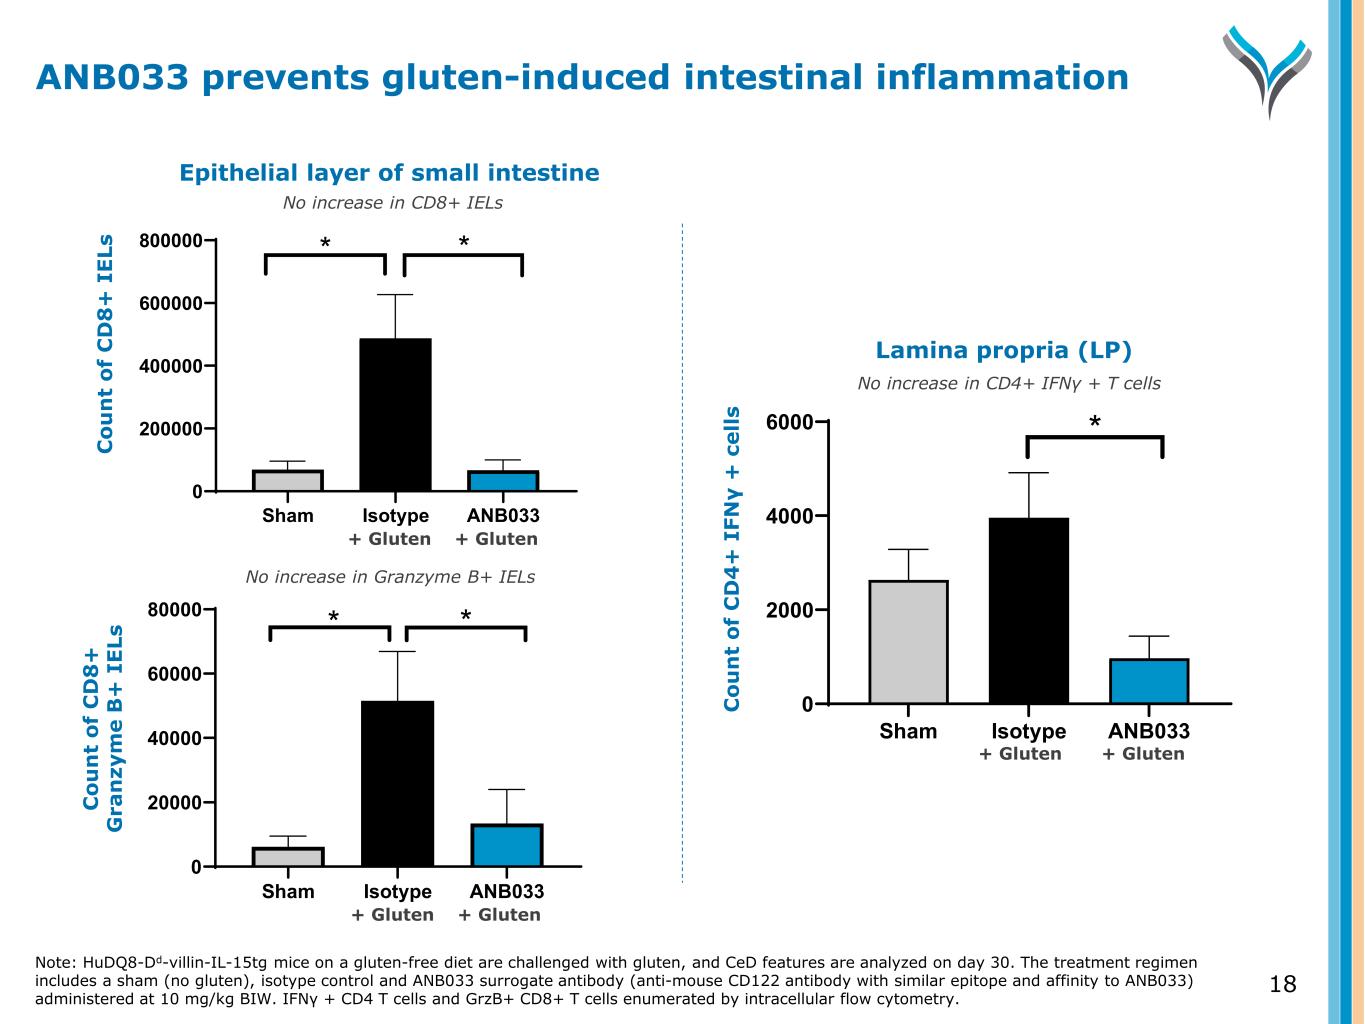
18 Sham Isotype ANB033 0 200000 400000 600000 800000 C ou nt o f C D 8+ IE Ls * * Sham Isotype ANB033 0 20000 40000 60000 80000 C ou nt o f G ra nz ym e B + IE Ls * * Sham Isotype ANB033 0 2000 4000 6000 C ou nt o f C D 4+ IF N -g + ce lls * Epithelial layer of small intestine C o u n t o f C D 8 + I E Ls C o u n t o f C D 8 + G ra n zy m e B + I E Ls Lamina propria (LP) C o u n t o f C D 4 + I FN γ + c e ll s No increase in CD8+ IELs No increase in Granzyme B+ IELs No increase in CD4+ IFNγ + T cells Note: HuDQ8-Dd-villin-IL-15tg mice on a gluten-free diet are challenged with gluten, and CeD features are analyzed on day 30. The treatment regimen includes a sham (no gluten), isotype control and ANB033 surrogate antibody (anti-mouse CD122 antibody with similar epitope and affinity to ANB033) administered at 10 mg/kg BIW. IFN + CD4 T cells and GrzB+ CD8+ T cells enumerated by intracellular flow cytometry. γ ANB033 prevents gluten-induced intestinal inflammation + Gluten + Gluten + Gluten + Gluten + Gluten + Gluten
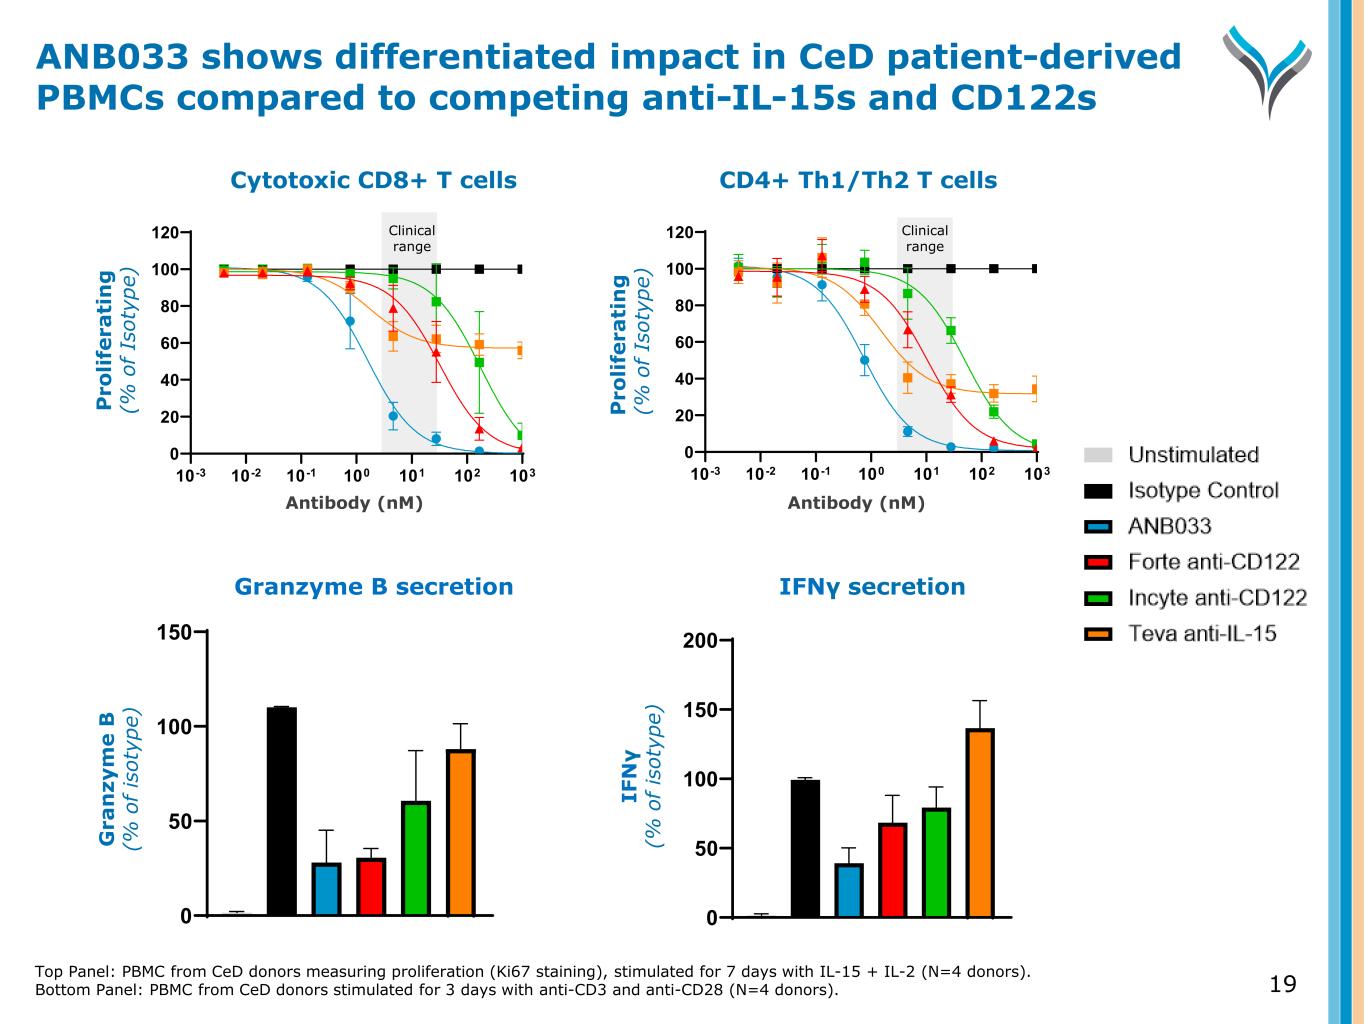
Top Panel: PBMC from CeD donors measuring proliferation (Ki67 staining), stimulated for 7 days with IL-15 + IL-2 (N=4 donors). Bottom Panel: PBMC from CeD donors stimulated for 3 days with anti-CD3 and anti-CD28 (N=4 donors). 19 IFNγ secretion 0 50 100 150 200 Antibody (nM) CD4+ Th1/Th2 T cells 10-3 10-2 10-1 100 101 102 103 0 20 40 60 80 100 120 P ro li fe ra ti n g ( % o f Is ot yp e) Clinical range IF N γ (% o f is ot yp e) Granzyme B secretion 0 50 100 150 Antibody (nM) Cytotoxic CD8+ T cells 10-3 10-2 10-1 100 101 102 103 0 20 40 60 80 100 120 P ro li fe ra ti n g ( % o f Is ot yp e) Clinical range G ra n zy m e B (% o f is ot yp e) ANB033 shows differentiated impact in CeD patient-derived PBMCs compared to competing anti-IL-15s and CD122s
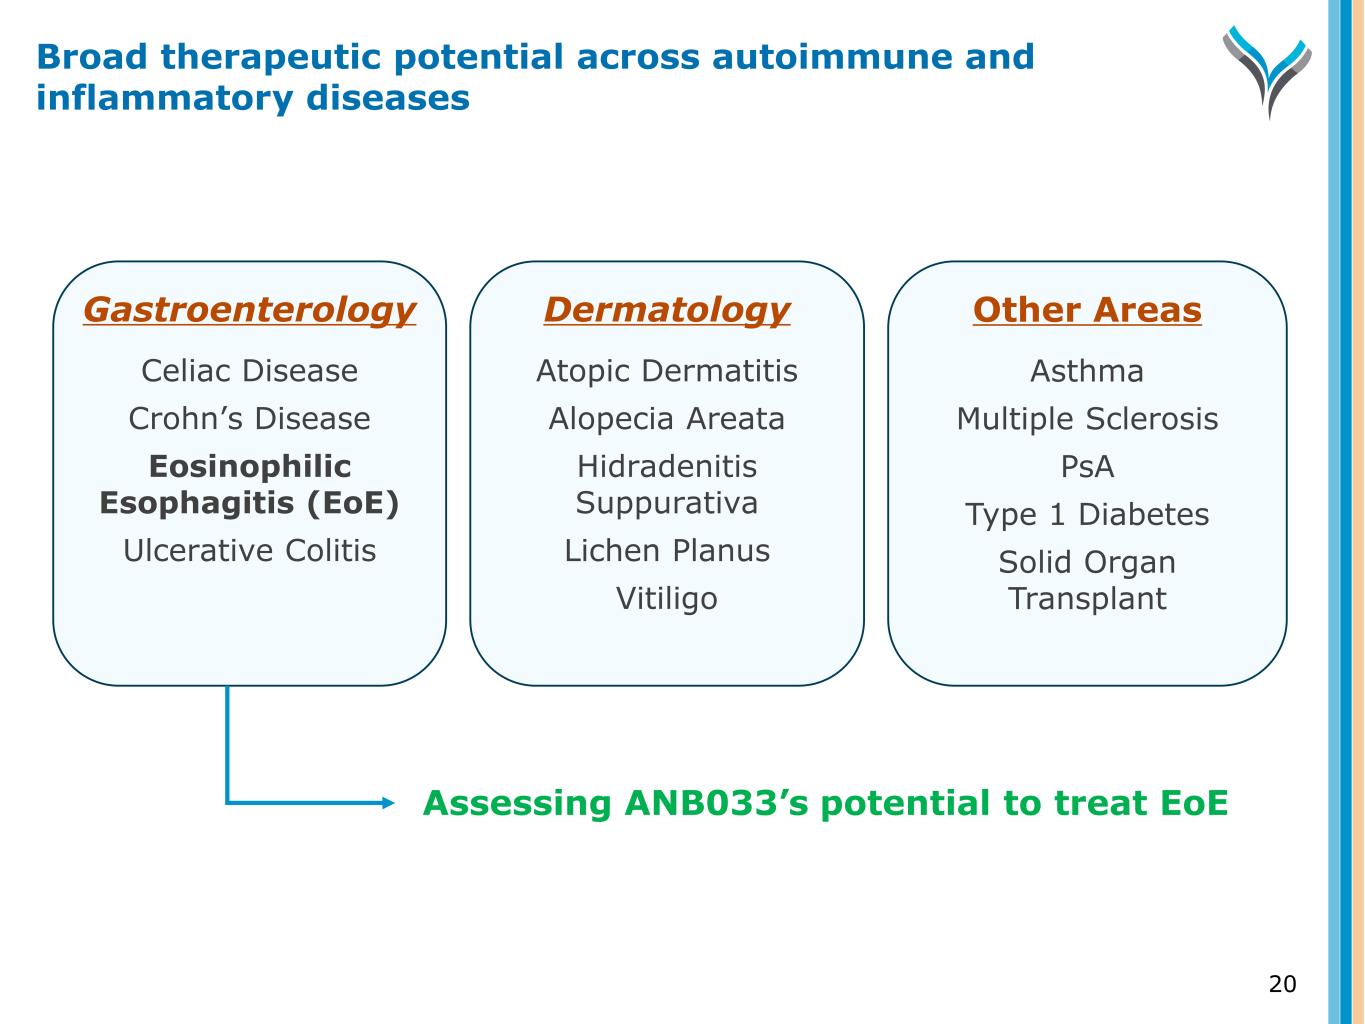
Gastroenterology Celiac Disease Crohn’s Disease Eosinophilic Esophagitis (EoE) Ulcerative Colitis Dermatology Atopic Dermatitis Alopecia Areata Hidradenitis Suppurativa Lichen Planus Vitiligo Other Areas Asthma Multiple Sclerosis PsA Type 1 Diabetes Solid Organ Transplant Assessing ANB033’s potential to treat EoE 20 Broad therapeutic potential across autoimmune and inflammatory diseases
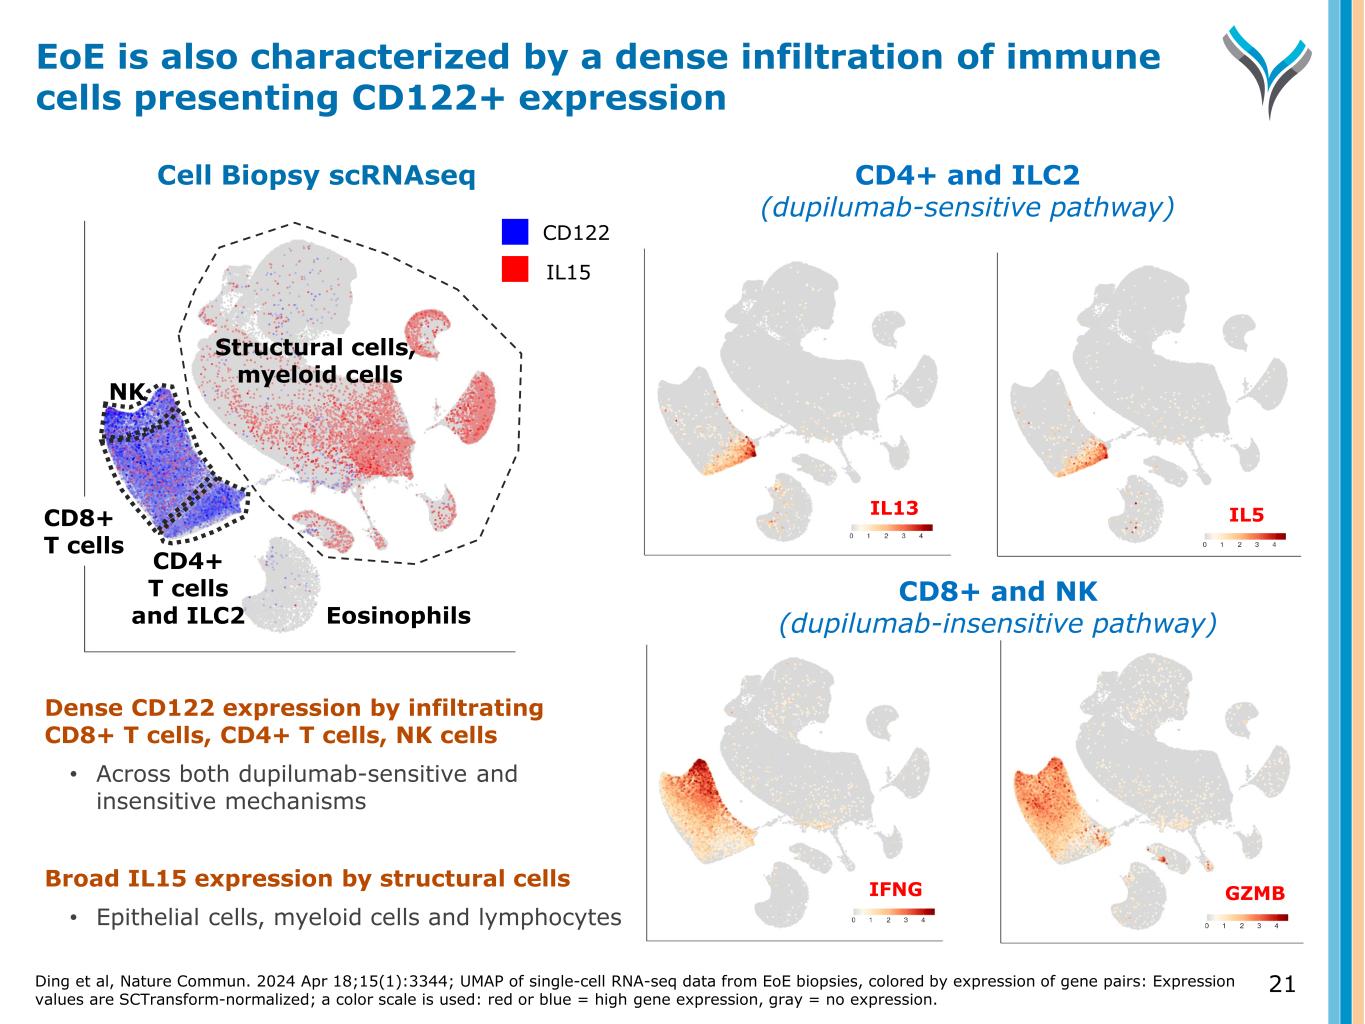
Dense CD122 expression by infiltrating CD8+ T cells, CD4+ T cells, NK cells • Across both dupilumab-sensitive and insensitive mechanisms Broad IL15 expression by structural cells • Epithelial cells, myeloid cells and lymphocytes CD8+ and NK (dupilumab-insensitive pathway) CD4+ and ILC2 (dupilumab-sensitive pathway) umap1 umap1 IL13 IL5 IFNG GZMB CD122 IL15 NK CD4+ T cells and ILC2 Structural cells, myeloid cells Eosinophils u m a p 2 CD8+ T cells Cell Biopsy scRNAseq EoE is also characterized by a dense infiltration of immune cells presenting CD122+ expression Ding et al, Nature Commun. 2024 Apr 18;15(1):3344; UMAP of single-cell RNA-seq data from EoE biopsies, colored by expression of gene pairs: Expression values are SCTransform-normalized; a color scale is used: red or blue = high gene expression, gray = no expression. 21
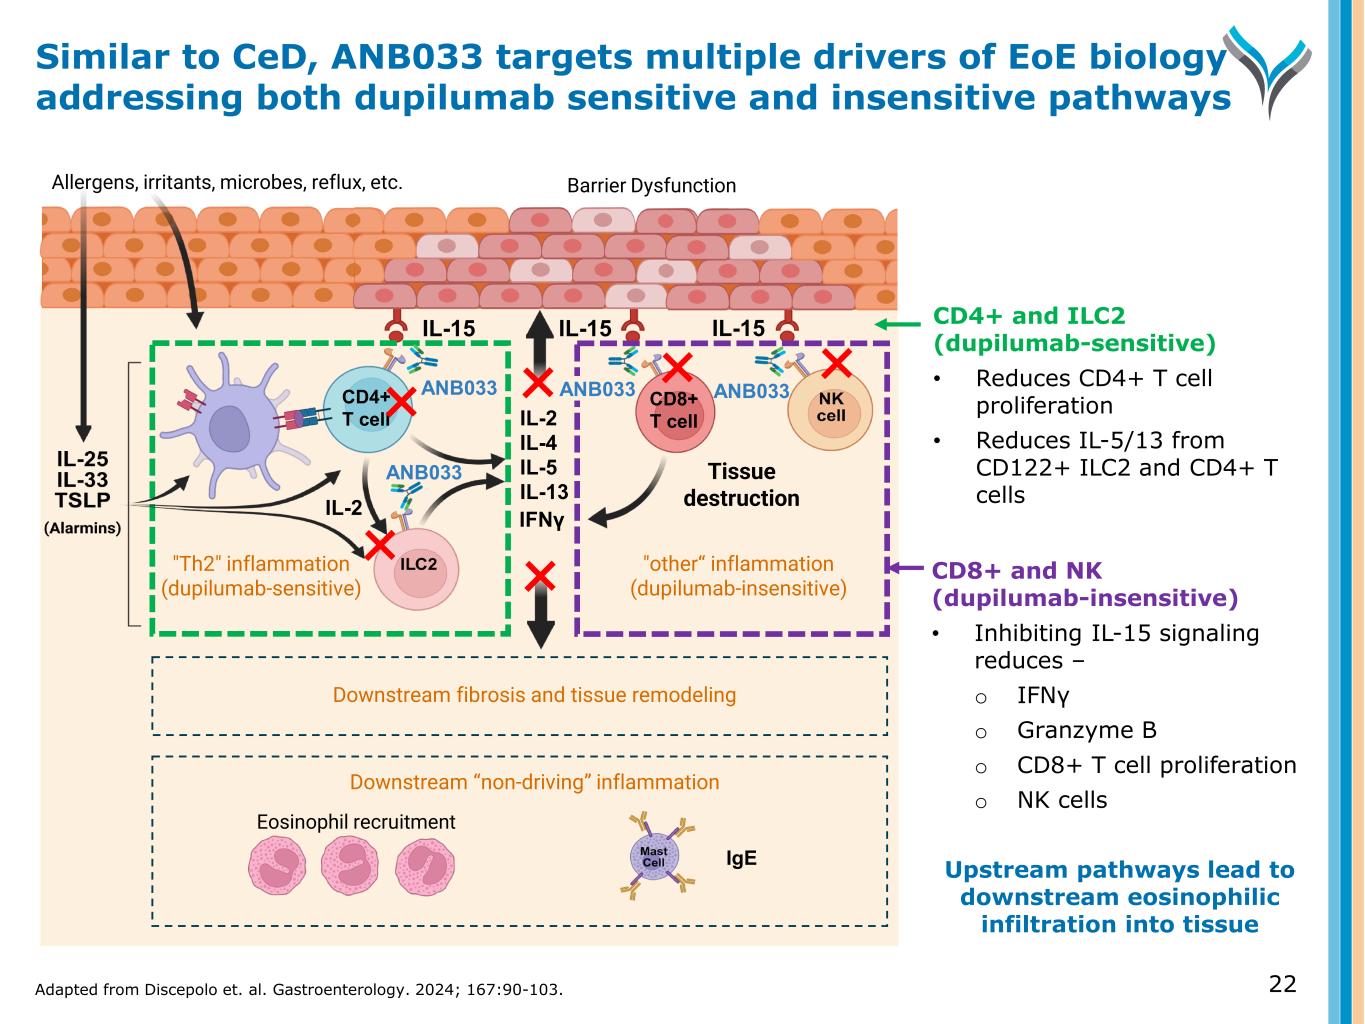
CD8+ and NK (dupilumab-insensitive) • Inhibiting IL-15 signaling reduces – o IFNγ o Granzyme B o CD8+ T cell proliferation o NK cells Upstream pathways lead to downstream eosinophilic infiltration into tissue IL-15 Allergens, irritants, microbes, reflux, etc. Eosinophil recruitment IL-15 IgE IL-2 IL-4 IL-5 IL-13 IL-15 ANB033 "Th2" inflammation (dupilumab-sensitive) "other“ inflammation (dupilumab-insensitive) Barrier Dysfunction Tissue destruction IFNγ Downstream “non-driving” inflammation ANB033CD4+ T cell CD8+ T cell Downstream fibrosis and tissue remodeling ANB033 IL-2 CD4+ and ILC2 (dupilumab-sensitive) • Reduces CD4+ T cell proliferation • Reduces IL-5/13 from CD122+ ILC2 and CD4+ T cells Similar to CeD, ANB033 targets multiple drivers of EoE biology addressing both dupilumab sensitive and insensitive pathways Adapted from Discepolo et. al. Gastroenterology. 2024; 167:90-103. 22 ANB033
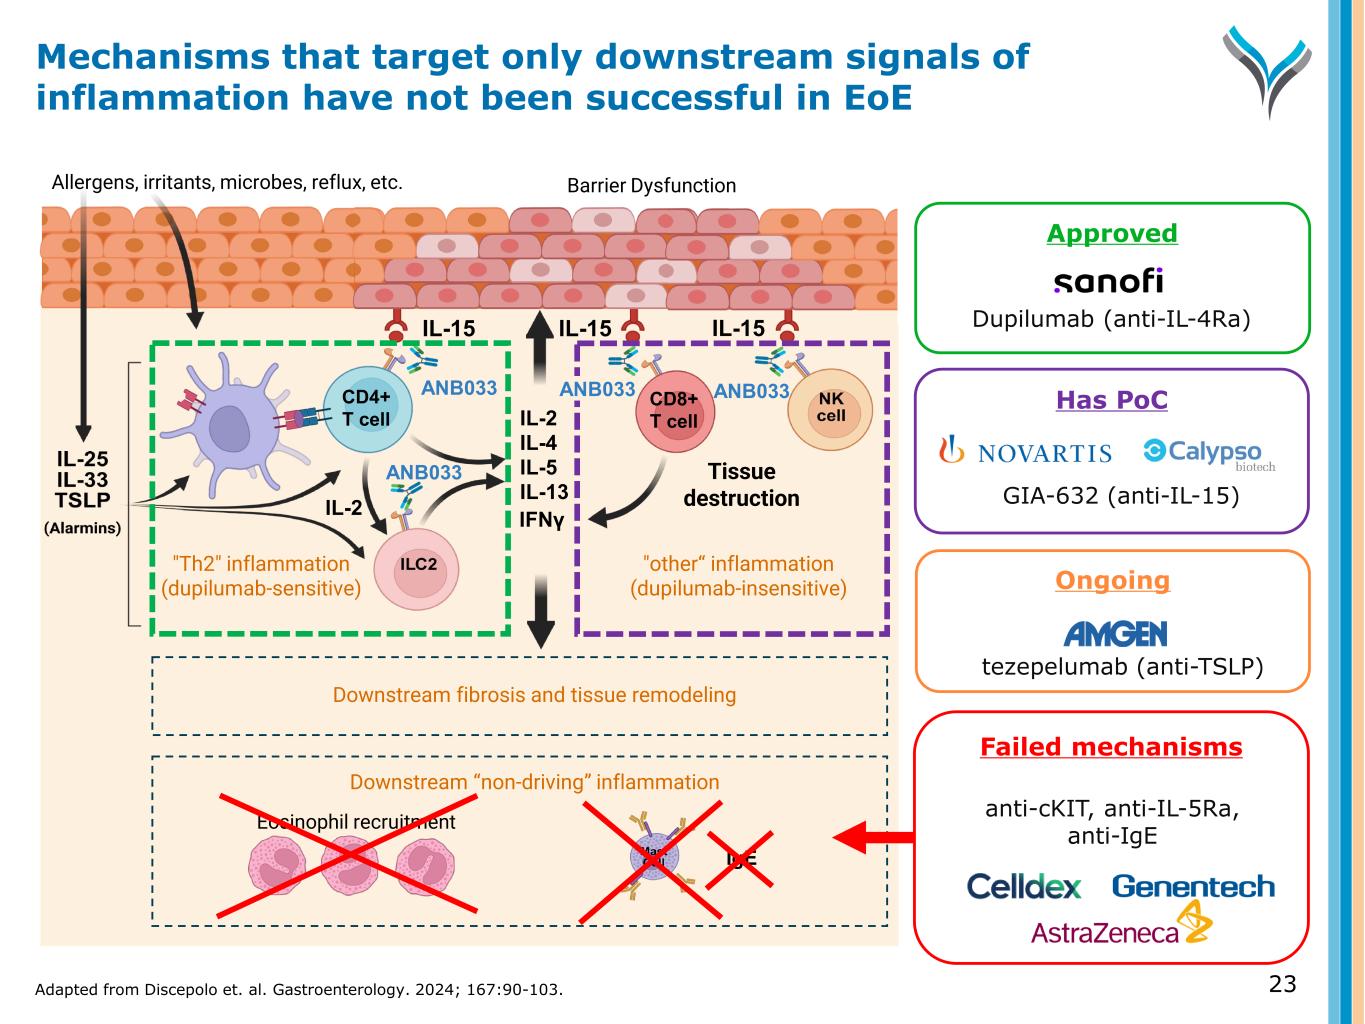
Ongoing tezepelumab (anti-TSLP) IL-15 Tissue damage Allergens, irritants, microbes, reflux, etc. Eosinophil recruitment IL-15 IgE IL-2 IL-4 IL-5 IL-13 IL-15 ANB033 "Th2" inflammation (dupilumab-sensitive) "other“ inflammation (dupilumab-insensitive) Barrier Dysfunction Tissue destruction IFNγ Downstream “non-driving” inflammation ANB033CD4+ T cell CD8+ T cell Downstream fibrosis and tissue remodeling ANB033 GIA-632 (anti-IL-15) Failed mechanisms anti-cKIT, anti-IL-5Ra, anti-IgE IL-2 Approved Dupilumab (anti-IL-4Ra) Mechanisms that target only downstream signals of inflammation have not been successful in EoE 23Adapted from Discepolo et. al. Gastroenterology. 2024; 167:90-103. ANB033 Has PoC
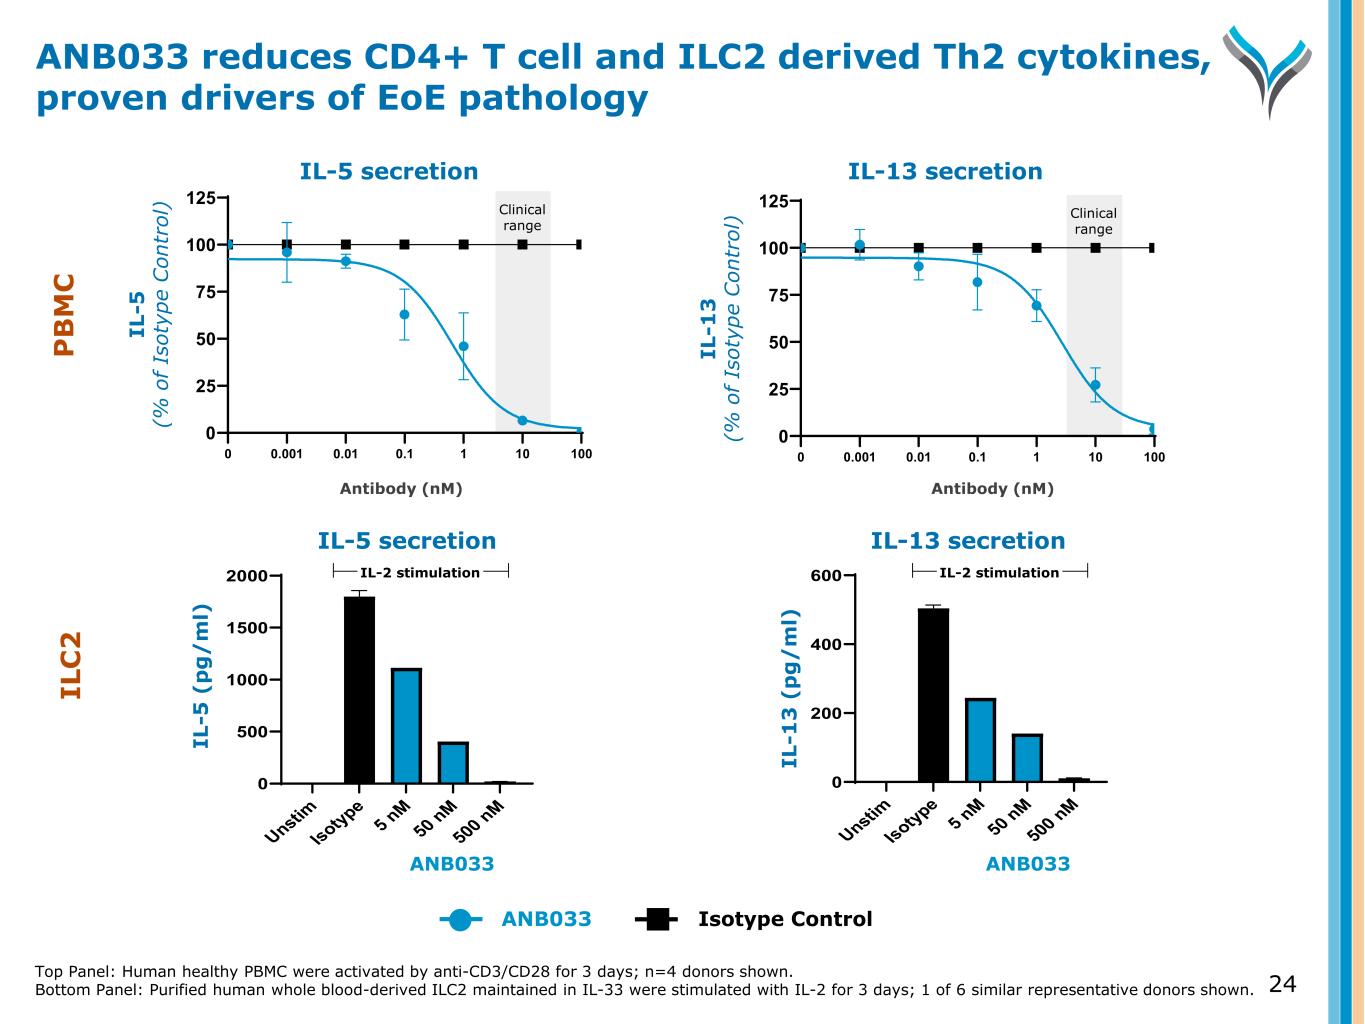
IL -5 (% o f Is ot yp e C on tr ol ) IL-13 secretionIL-5 secretion 0.001 0.01 0.1 1 10 100 0 25 50 75 100 125 0 0.001 0.01 0.1 1 10 100 0 25 50 75 100 125 0 IL -1 3 (% o f Is ot yp e C on tr ol ) Antibody (nM)Antibody (nM) Unstim Isotype 5 nM 50 nM 500 nM 0 500 1000 1500 2000 IL-5 secretion IL -5 (p g/ m l) IL-2 stimulation Unstim Isotype 5 nM 50 nM 500 nM 0 200 400 600 IL-13 secretion IL -1 3 ( pg /m l) IL-2 stimulation IL -5 ( p g / m l) IL -1 3 ( p g / m l) I - tion IL-13 secreti ANB033 Isotype Control ANB033 reduces CD4+ T cell and ILC2 derived Th2 cytokines, proven drivers of EoE pathology Top Panel: Human healthy PBMC were activated by anti-CD3/CD28 for 3 days; n=4 donors shown. Bottom Panel: Purified human whole blood-derived ILC2 maintained in IL-33 were stimulated with IL-2 for 3 days; 1 of 6 similar representative donors shown. 24 Clinical range Clinical range IL-2 stimulationIL-2 stimulation ANB033ANB033 IL C 2 P B M C
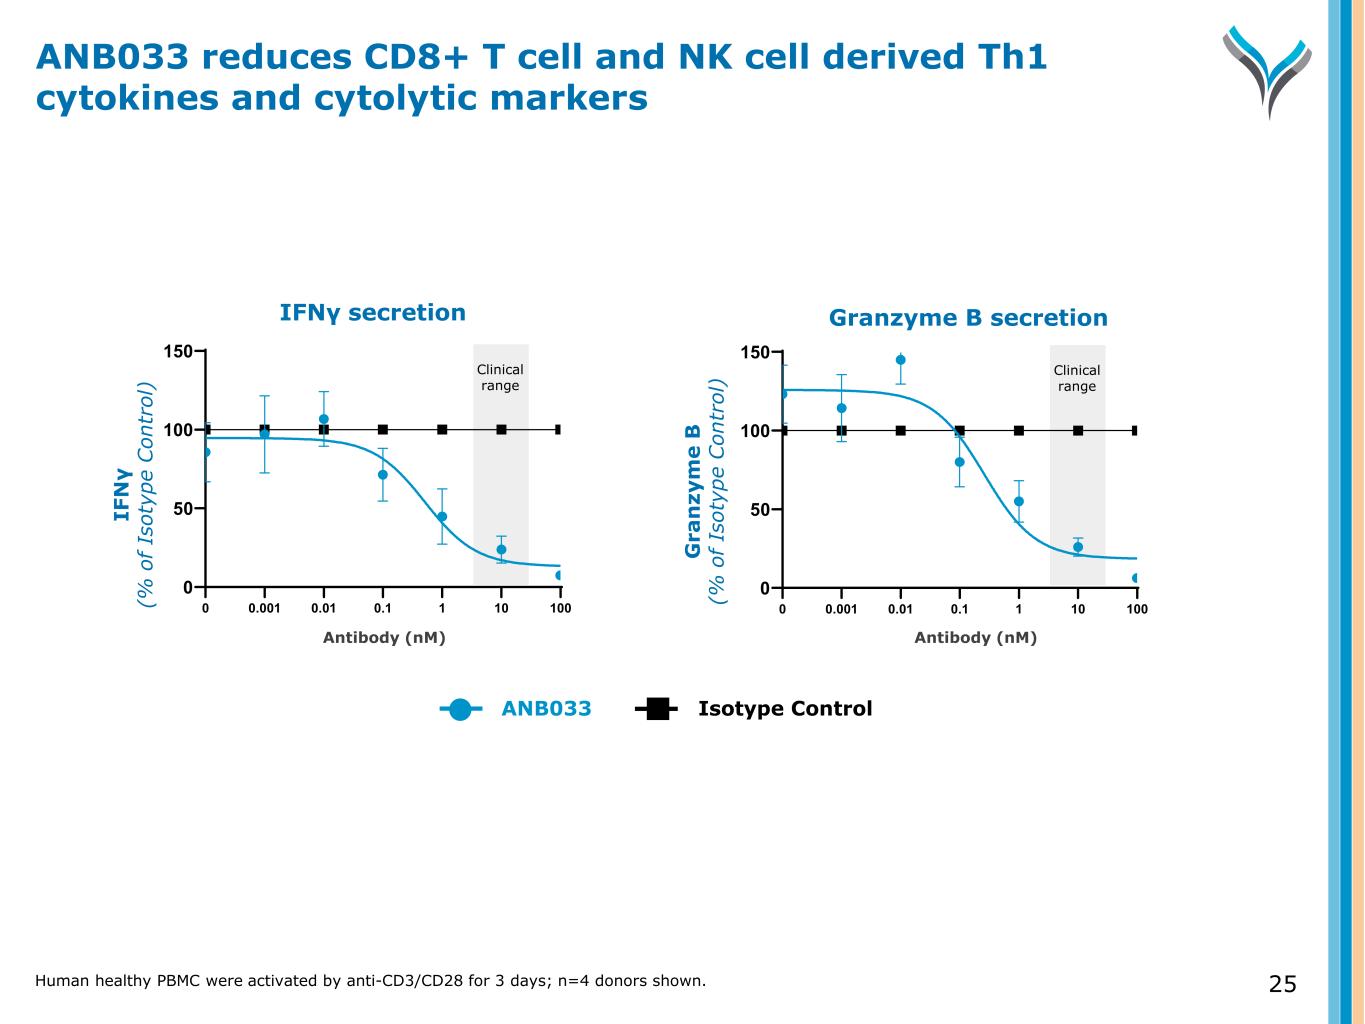
IFNγ secretion Granzyme B secretion 0.001 0.01 0.1 1 10 100 0 50 100 150 00.001 0.01 0.1 1 10 100 0 50 100 150 0 IF N γ (% o f Is ot yp e C on tr ol ) G ra n zy m e B (% o f Is ot yp e C on tr ol ) Antibody (nM)Antibody (nM) ANB033 Isotype Control ANB033 reduces CD8+ T cell and NK cell derived Th1 cytokines and cytolytic markers Human healthy PBMC were activated by anti-CD3/CD28 for 3 days; n=4 donors shown. 25 Clinical range Clinical range
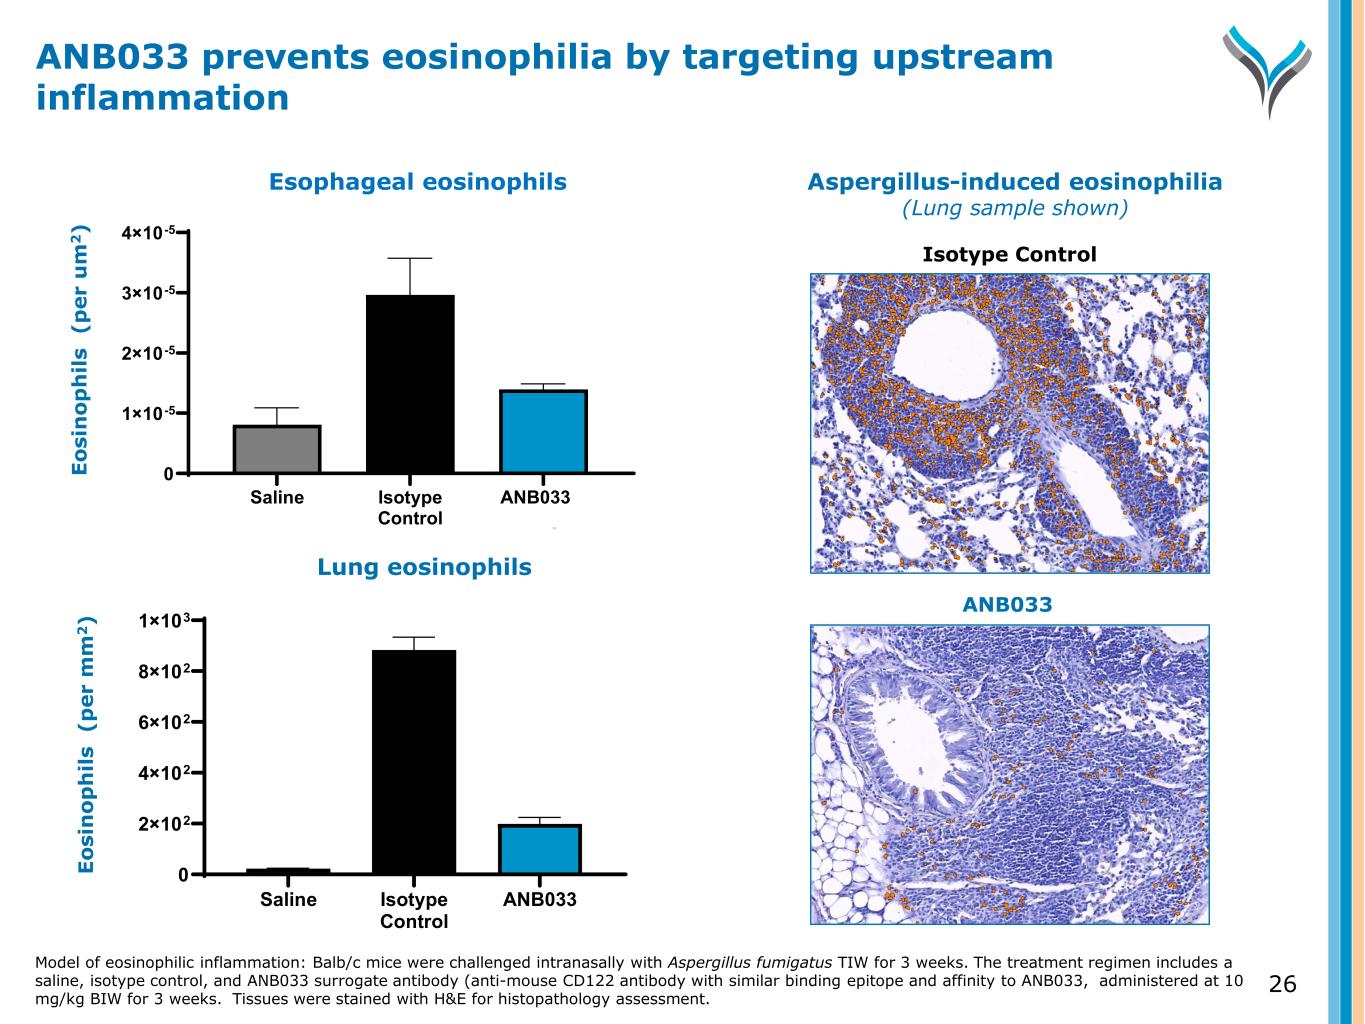
26 E o si n o p h il s ( p e r u m 2 ) Saline Isotype Control ANB033 Surrogate 0 1×10⁻⁵ 2×10⁻⁵ 3×10⁻⁵ 4×10⁻⁵ Lung eosinophils E o si n o p h il s ( p e r m m 2 ) Saline Isotype Control ANB033 Surrogate 0 2×10² 4×10² 6×10² 8×10² 1×10³ Esophageal eosinophils ANB033 prevents eosinophilia by targeting upstream inflammation Model of eosinophilic inflammation: Balb/c mice were challenged intranasally with Aspergillus fumigatus TIW for 3 weeks. The treatment regimen includes a saline, isotype control, and ANB033 surrogate antibody (anti-mouse CD122 antibody with similar binding epitope and affinity to ANB033, administered at 10 mg/kg BIW for 3 weeks. Tissues were stained with H&E for histopathology assessment. Aspergillus-induced eosinophilia (Lung sample shown) Isotype Control ANB033
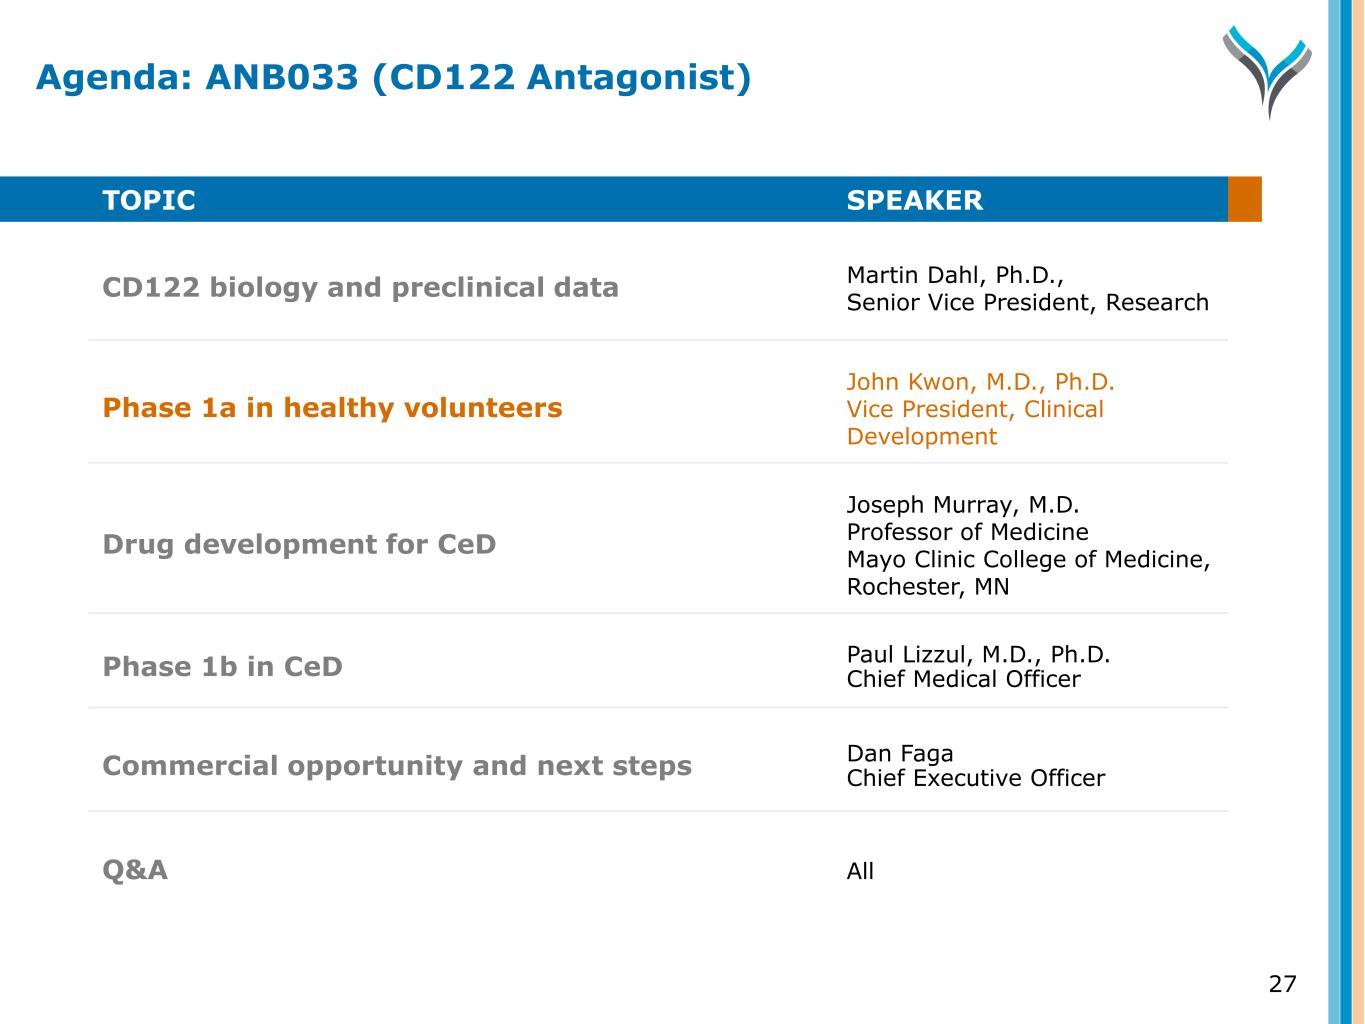
TOPIC SPEAKER CD122 biology and preclinical data Martin Dahl, Ph.D., Senior Vice President, Research Phase 1a in healthy volunteers John Kwon, M.D., Ph.D. Vice President, Clinical Development Drug development for CeD Joseph Murray, M.D. Professor of Medicine Mayo Clinic College of Medicine, Rochester, MN Phase 1b in CeD Paul Lizzul, M.D., Ph.D. Chief Medical Officer Commercial opportunity and next steps Dan Faga Chief Executive Officer Q&A All 27 Agenda: ANB033 (CD122 Antagonist)
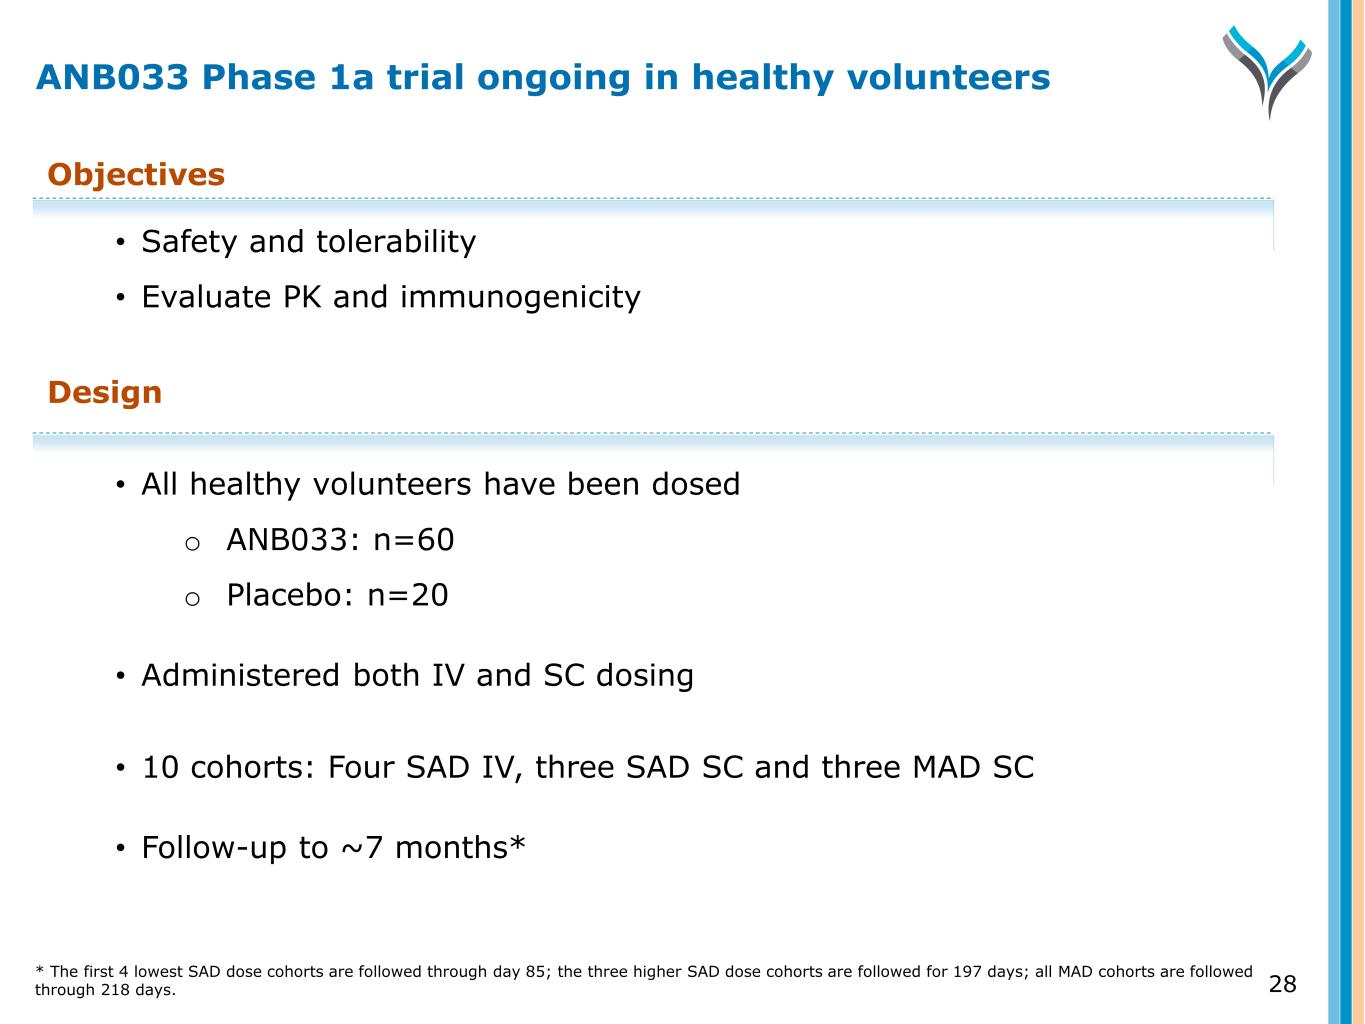
28 Objectives • Safety and tolerability • Evaluate PK and immunogenicity Design • All healthy volunteers have been dosed o ANB033: n=60 o Placebo: n=20 • Administered both IV and SC dosing • 10 cohorts: Four SAD IV, three SAD SC and three MAD SC • Follow-up to ~7 months* ANB033 Phase 1a trial ongoing in healthy volunteers * The first 4 lowest SAD dose cohorts are followed through day 85; the three higher SAD dose cohorts are followed for 197 days; all MAD cohorts are followed through 218 days.
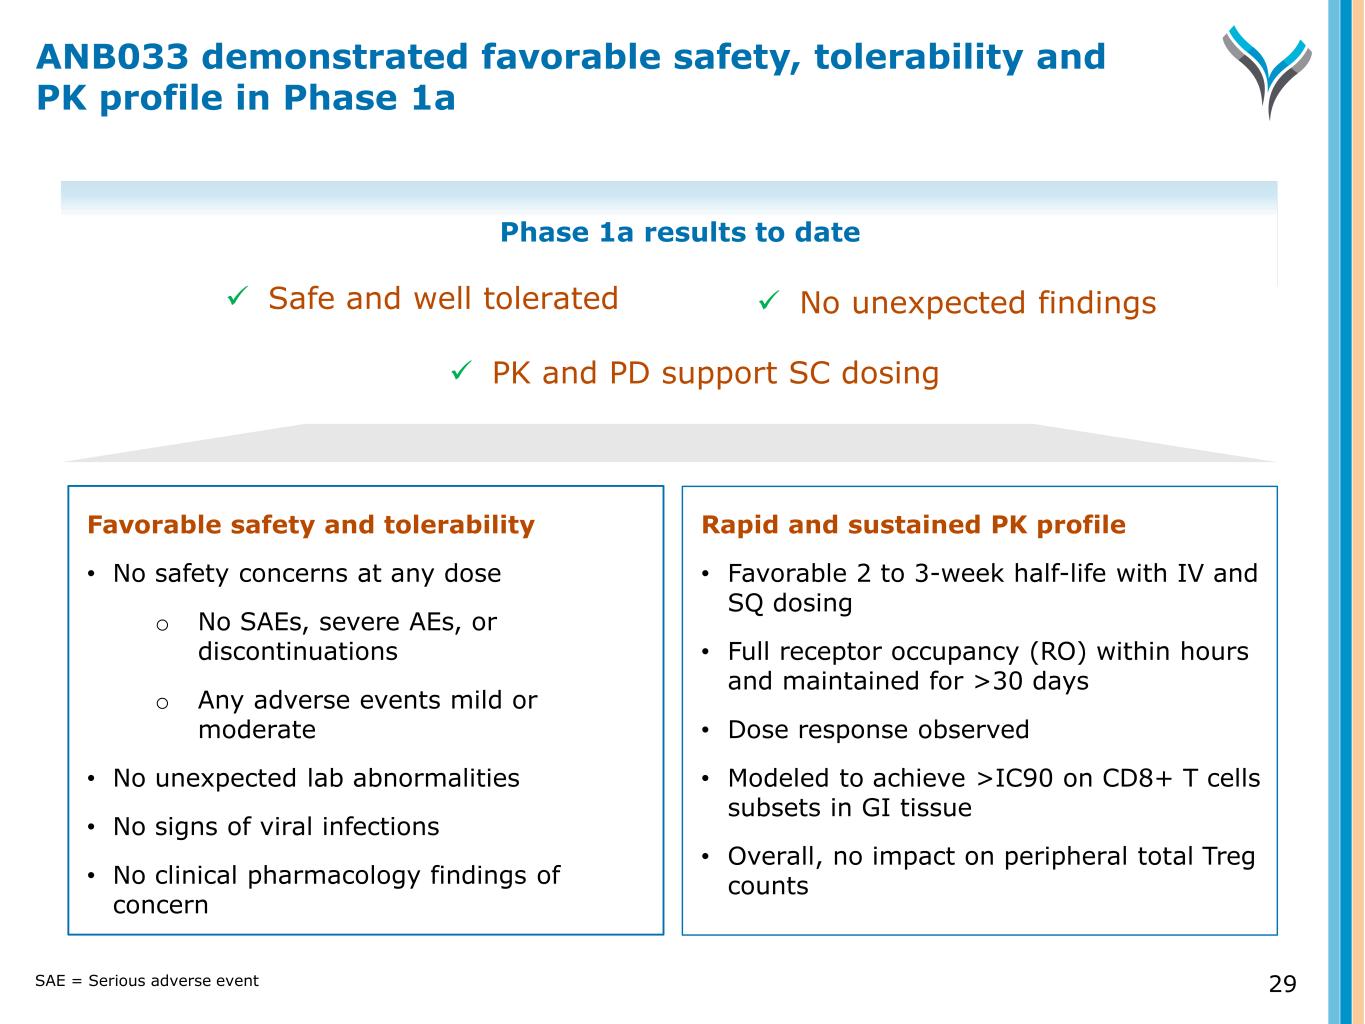
29 Favorable safety and tolerability • No safety concerns at any dose o No SAEs, severe AEs, or discontinuations o Any adverse events mild or moderate • No unexpected lab abnormalities • No signs of viral infections • No clinical pharmacology findings of concern Rapid and sustained PK profile • Favorable 2 to 3-week half-life with IV and SQ dosing • Full receptor occupancy (RO) within hours and maintained for >30 days • Dose response observed • Modeled to achieve >IC90 on CD8+ T cells subsets in GI tissue • Overall, no impact on peripheral total Treg counts Phase 1a results to date Safe and well tolerated No unexpected findings PK and PD support SC dosing ANB033 demonstrated favorable safety, tolerability and PK profile in Phase 1a SAE = Serious adverse event
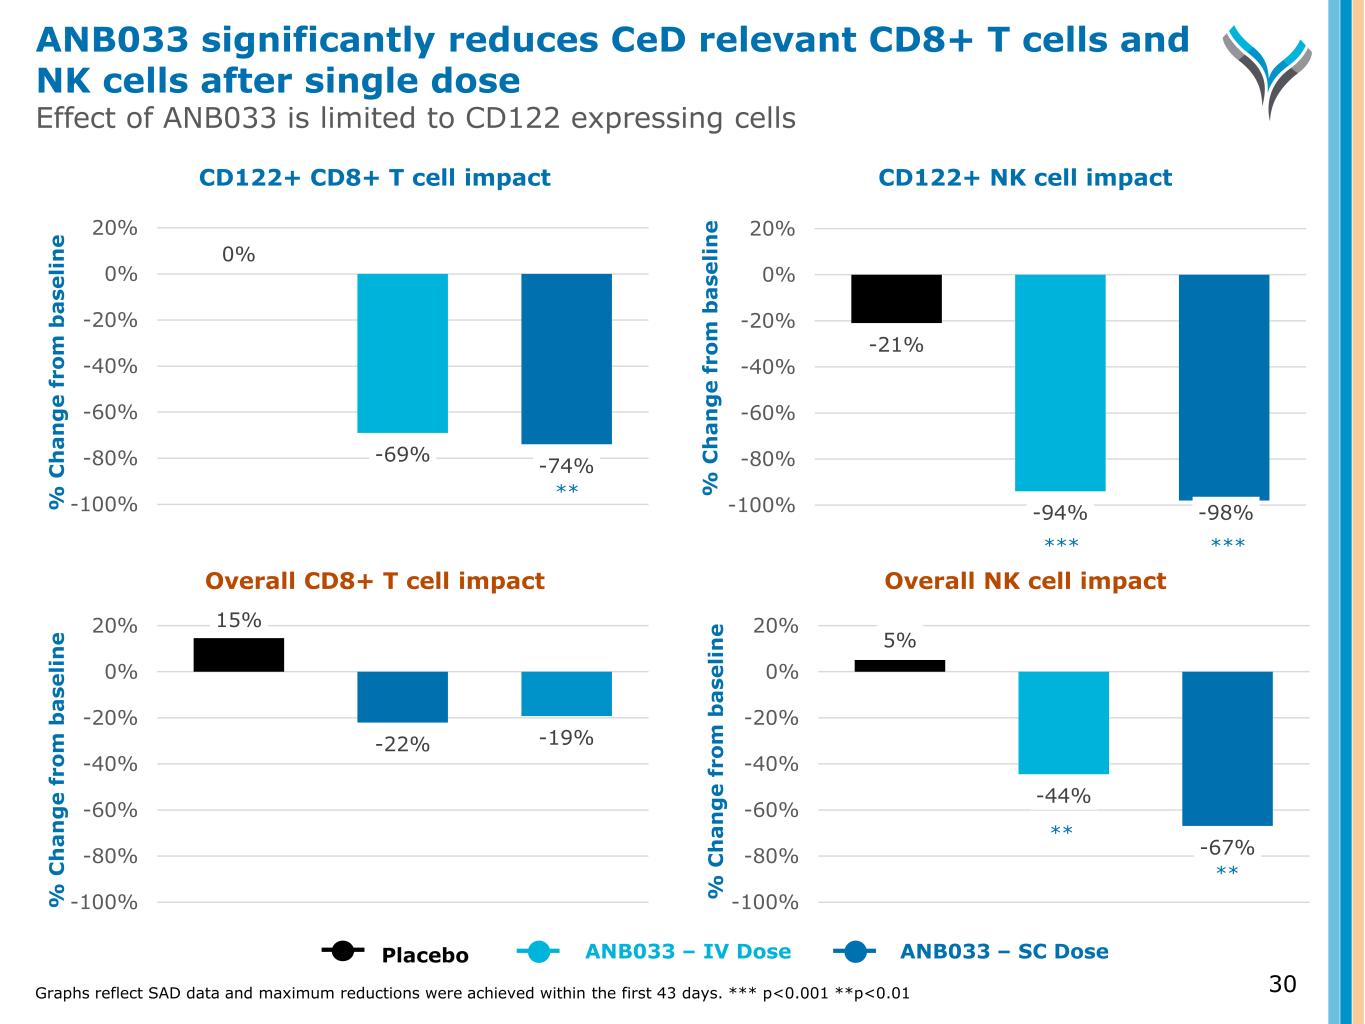
30 % C h a n g e f ro m b a se li n e % C h a n g e f ro m b a se li n e % C h a n g e f ro m b a se li n e % C h a n g e f ro m b a se li n e CD122+ CD8+ T cell impact CD122+ NK cell impact Overall CD8+ T cell impact Overall NK cell impact Graphs reflect SAD data and maximum reductions were achieved within the first 43 days. *** p<0.001 **p<0.01 15% -22% -19% -100% -80% -60% -40% -20% 0% 20% 5% -44% -67% -100% -80% -60% -40% -20% 0% 20% Placebo ANB033 – IV Dose ANB033 – SC Dose 0% -69% -74% -100% -80% -60% -40% -20% 0% 20% -21% -94% -98%-100% -80% -60% -40% -20% 0% 20% ANB033 significantly reduces CeD relevant CD8+ T cells and NK cells after single dose Effect of ANB033 is limited to CD122 expressing cells *** *** ** ** **
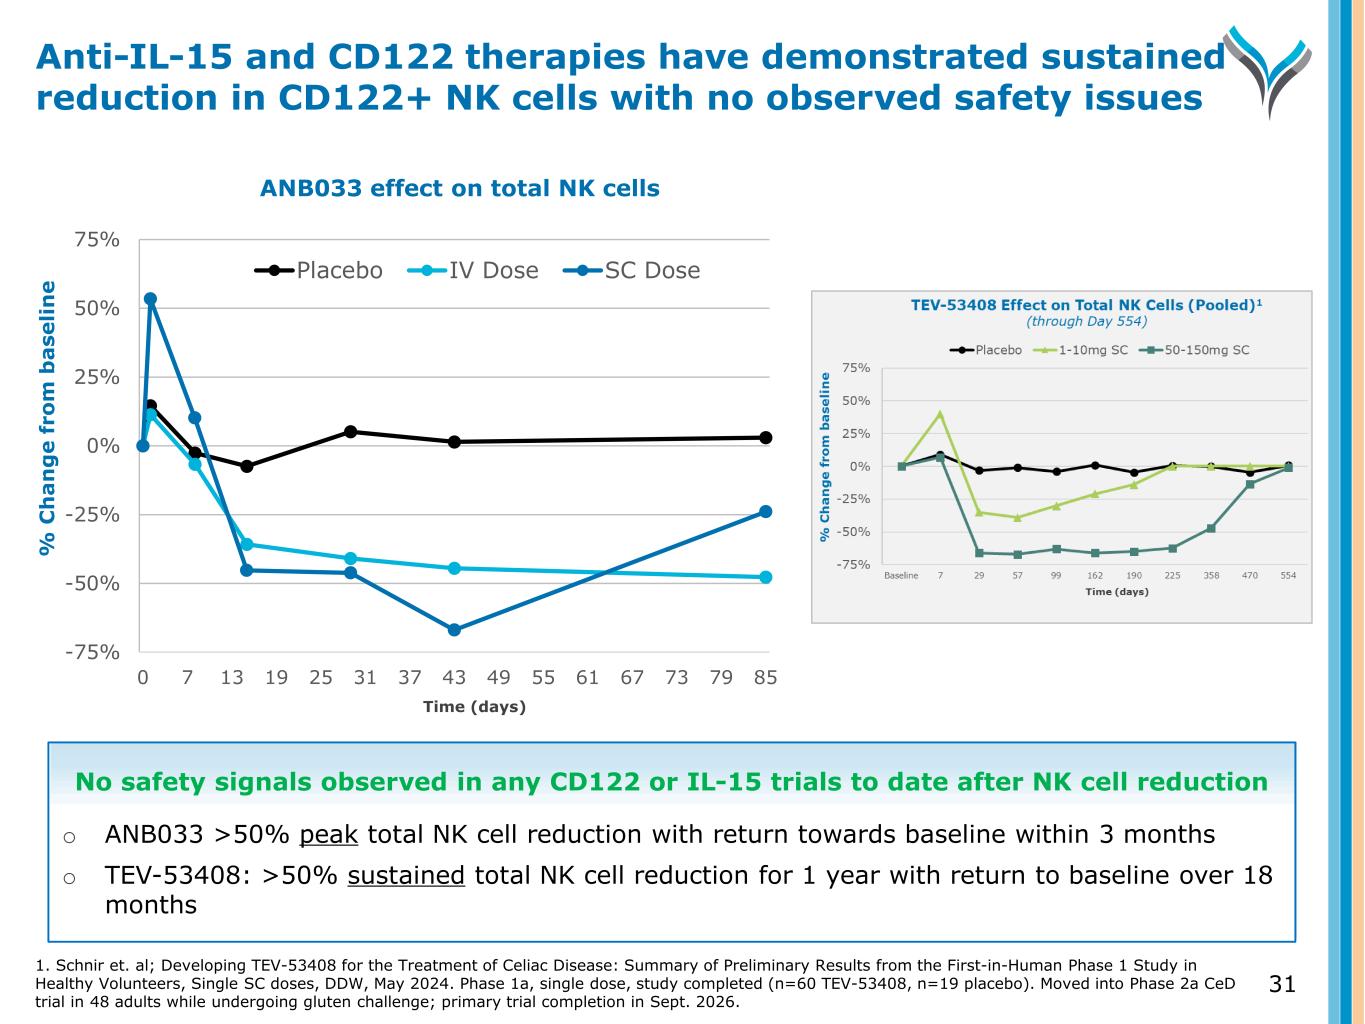
% C h a n g e f ro m b a se li n e -75% -50% -25% 0% 25% 50% 75% 0 7 13 19 25 31 37 43 49 55 61 67 73 79 85 Placebo IV Dose SC Dose 31 Anti-IL-15 and CD122 therapies have demonstrated sustained reduction in CD122+ NK cells with no observed safety issues ANB033 effect on total NK cells Time (days) No safety signals observed in any CD122 or IL-15 trials to date after NK cell reduction o ANB033 >50% peak total NK cell reduction with return towards baseline within 3 months o TEV-53408: >50% sustained total NK cell reduction for 1 year with return to baseline over 18 months 1. Schnir et. al; Developing TEV-53408 for the Treatment of Celiac Disease: Summary of Preliminary Results from the First-in-Human Phase 1 Study in Healthy Volunteers, Single SC doses, DDW, May 2024. Phase 1a, single dose, study completed (n=60 TEV-53408, n=19 placebo). Moved into Phase 2a CeD trial in 48 adults while undergoing gluten challenge; primary trial completion in Sept. 2026.
TOPIC SPEAKER CD122 biology and preclinical data Martin Dahl, Ph.D., Senior Vice President, Research Phase 1a in healthy volunteers John Kwon, M.D., Ph.D. Vice President, Clinical Development Drug development for CeD Joseph Murray, M.D. Professor of Medicine Mayo Clinic College of Medicine, Rochester, MN Phase 1b in CeD Paul Lizzul, M.D., Ph.D. Chief Medical Officer Commercial opportunity and next steps Dan Faga Chief Executive Officer Q&A All 32 Agenda: ANB033 (CD122 Antagonist)
©2025 Mayo Foundation for Medical Education and Research | WF3855367-33 • Co-founder and past president of North American Society for Study of CeD • Contributed to 2013 guidelines and 2019 AGA practice update on diagnosing and monitoring CeD • Published more than 450+ peer- reviewed papers on CeD • Past chair of AGA’s Intestinal Disease Section o Broad experience with GI disorders, including EoE KOL discussion Joseph A. Murray, M.D., Professor of Medicine, Director, Celiac Disease Research, John and Shirley Berry Professor of Gastrointestinal Sciences, Division of Gastroenterology and Hepatology, Department of Internal Medicine, Mayo Clinic, Rochester, MN 33
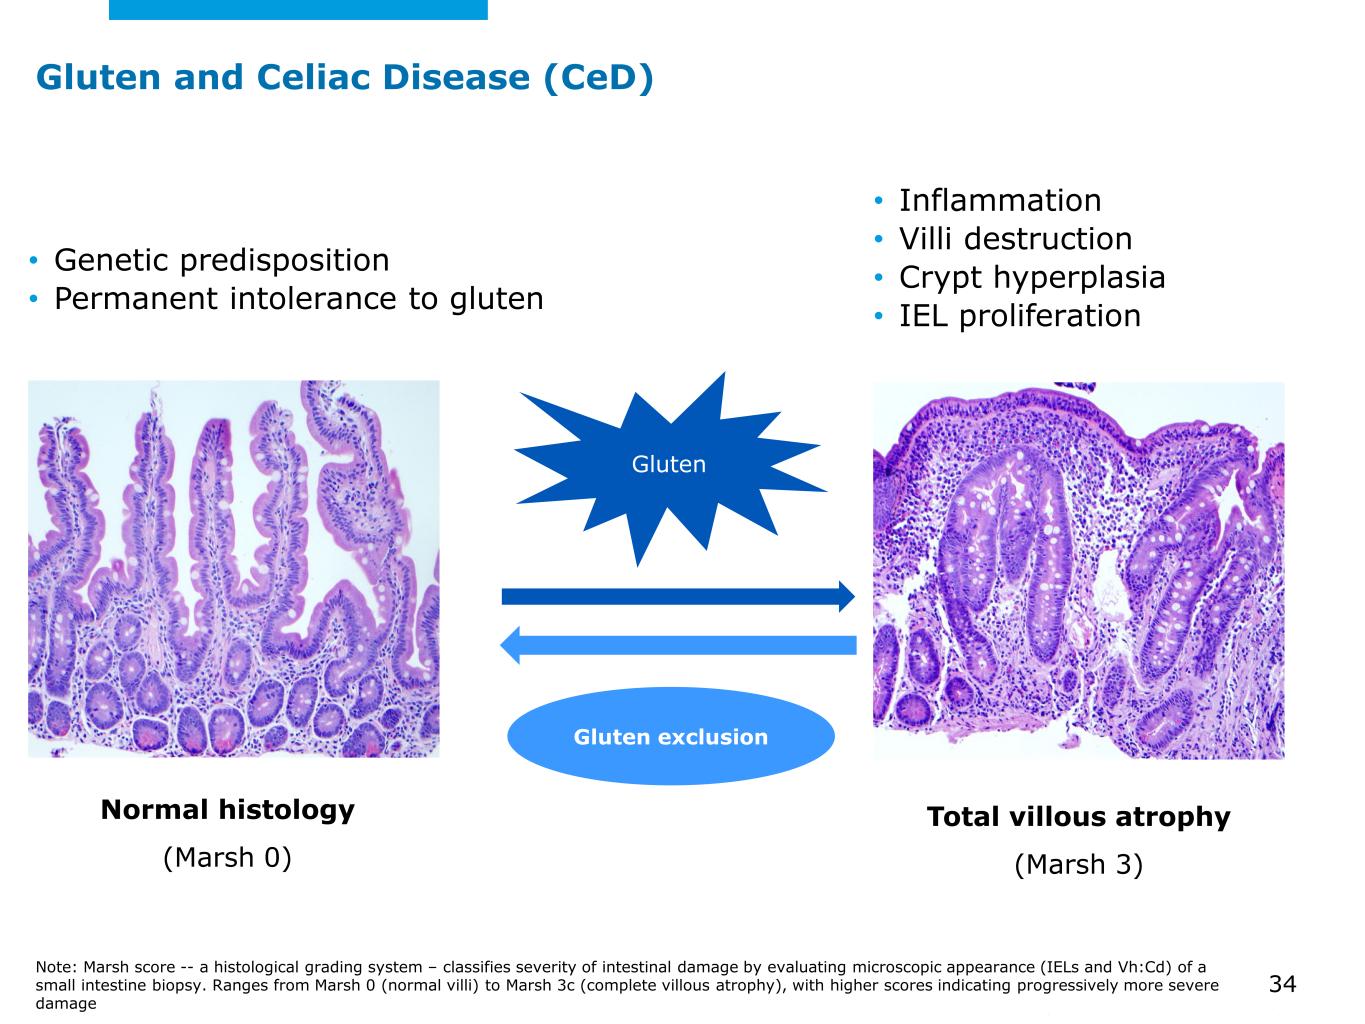
©2025 Mayo Foundation for Medical Education and Research | WF3855367-34 Gluten and Celiac Disease (CeD) Gluten Gluten exclusion Normal histology (Marsh 0) • Genetic predisposition • Permanent intolerance to gluten • Inflammation • Villi destruction • Crypt hyperplasia • IEL proliferation Note: Marsh score -- a histological grading system – classifies severity of intestinal damage by evaluating microscopic appearance (IELs and Vh:Cd) of a small intestine biopsy. Ranges from Marsh 0 (normal villi) to Marsh 3c (complete villous atrophy), with higher scores indicating progressively more severe damage Total villous atrophy (Marsh 3) 34
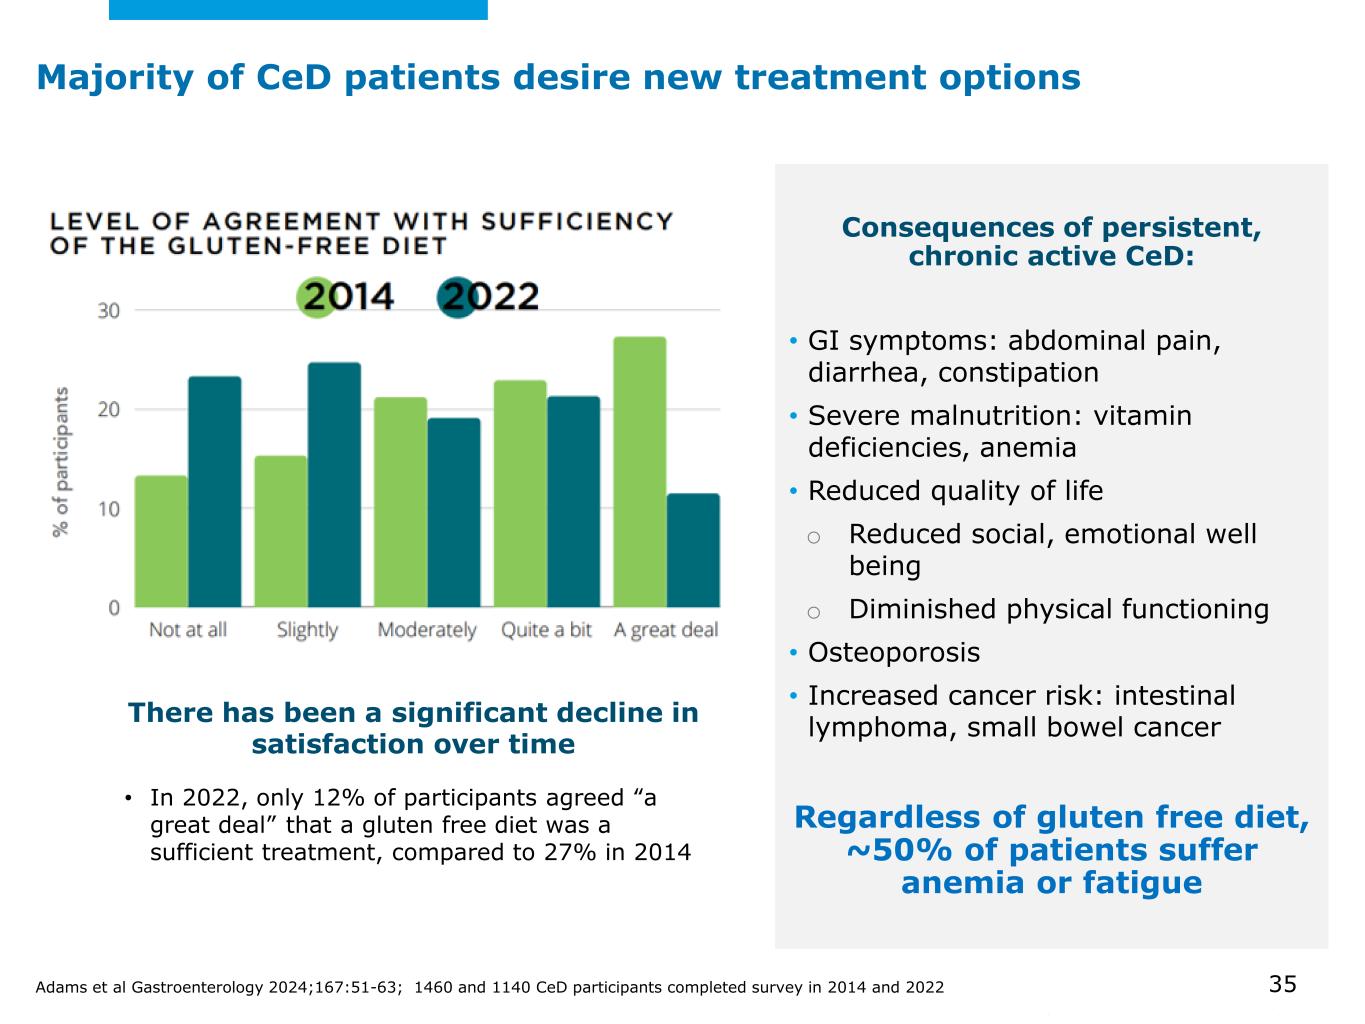
©2025 Mayo Foundation for Medical Education and Research | WF3855367-35 Majority of CeD patients desire new treatment options • In 2022, only 12% of participants agreed “a great deal” that a gluten free diet was a sufficient treatment, compared to 27% in 2014 There has been a significant decline in satisfaction over time Consequences of persistent, chronic active CeD: • GI symptoms: abdominal pain, diarrhea, constipation • Severe malnutrition: vitamin deficiencies, anemia • Reduced quality of life o Reduced social, emotional well being o Diminished physical functioning • Osteoporosis • Increased cancer risk: intestinal lymphoma, small bowel cancer Regardless of gluten free diet, ~50% of patients suffer anemia or fatigue Adams et al Gastroenterology 2024;167:51-63; 1460 and 1140 CeD participants completed survey in 2014 and 2022 35
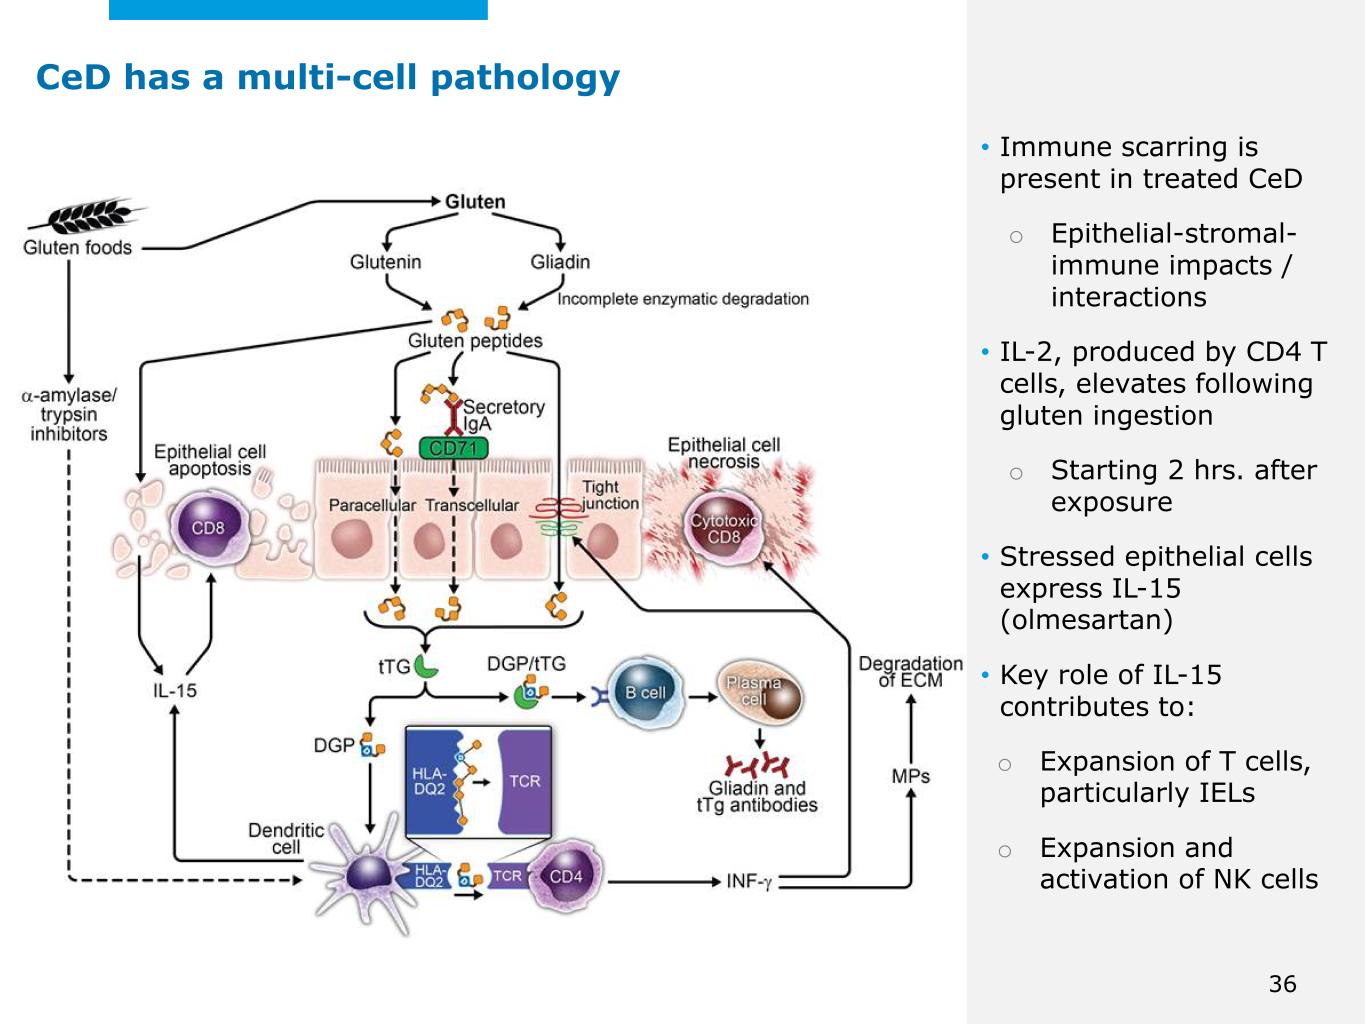
©2025 Mayo Foundation for Medical Education and Research | WF3855367-36 • Immune scarring is present in treated CeD o Epithelial-stromal- immune impacts / interactions • IL-2, produced by CD4 T cells, elevates following gluten ingestion o Starting 2 hrs. after exposure • Stressed epithelial cells express IL-15 (olmesartan) • Key role of IL-15 contributes to: o Expansion of T cells, particularly IELs o Expansion and activation of NK cells CeD has a multi-cell pathology 36
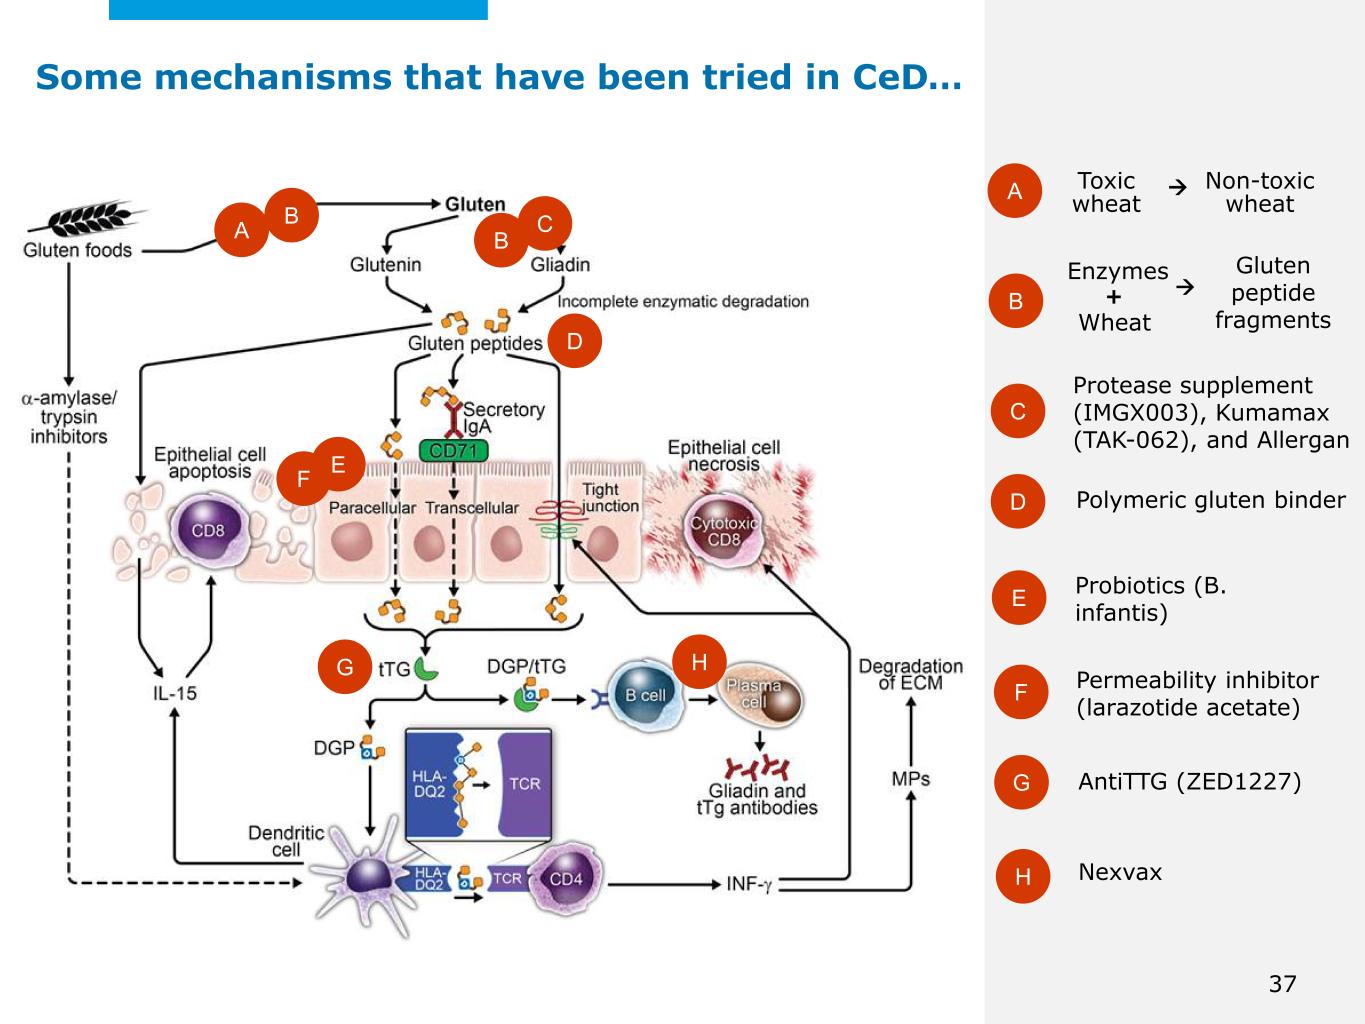
©2025 Mayo Foundation for Medical Education and Research | WF3855367-37 Some mechanisms that have been tried in CeD… Toxic wheatA B C D E F Non-toxic wheat A Enzymes + Gluten peptide fragmentsWheat Protease supplement (IMGX003), Kumamax (TAK-062), and Allergan Probiotics (B. infantis) Permeability inhibitor (larazotide acetate) Polymeric gluten binder B C B D EF G AntiTTG (ZED1227) H Nexvax G H 37
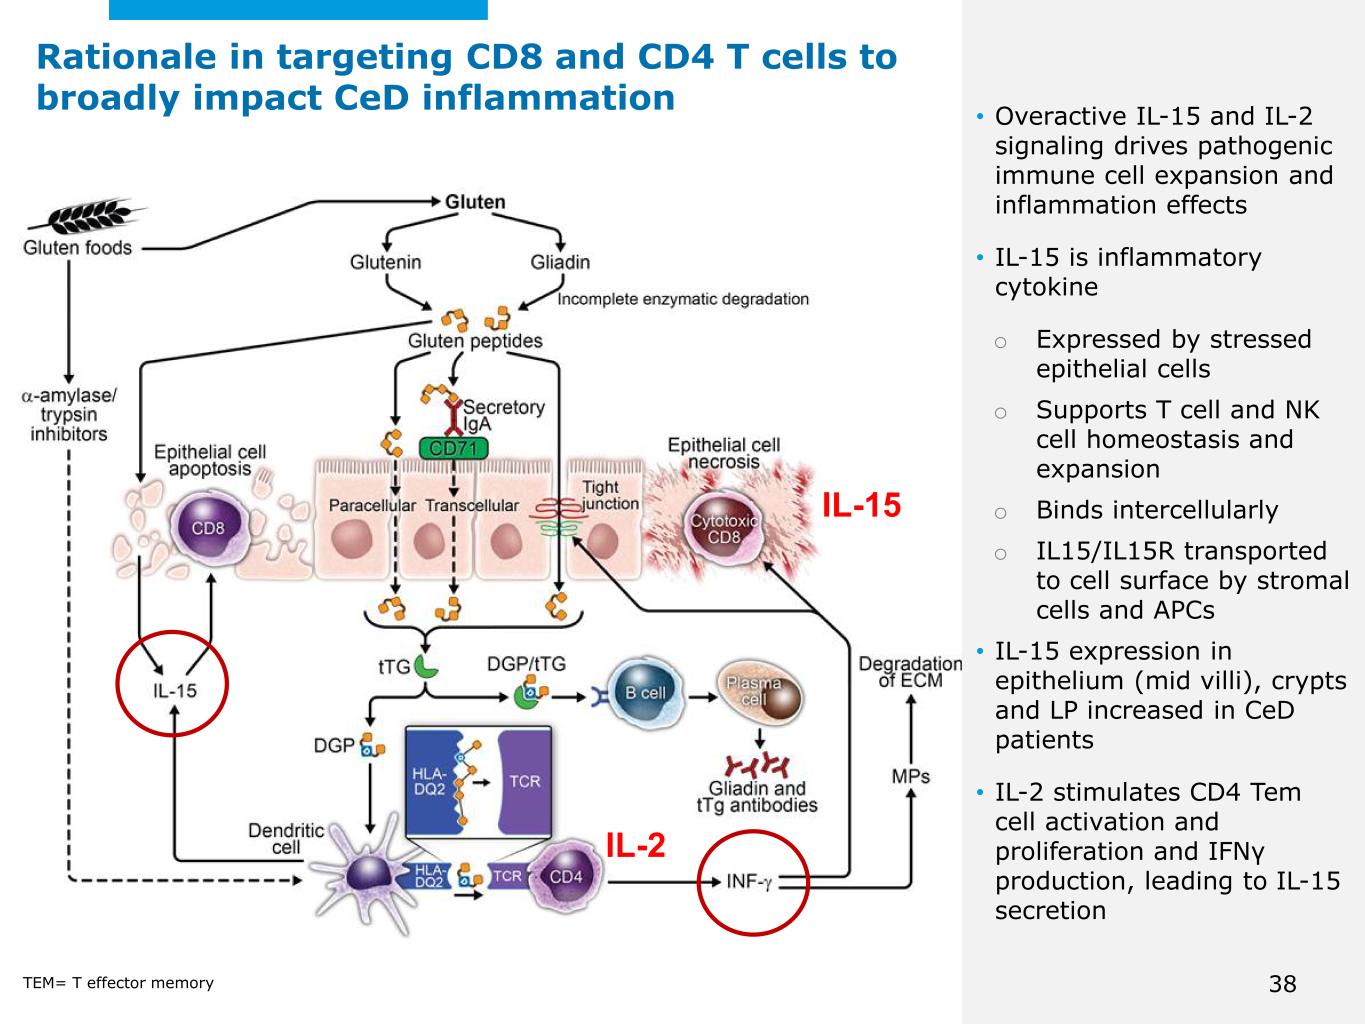
©2025 Mayo Foundation for Medical Education and Research | WF3855367-38 • Overactive IL-15 and IL-2 signaling drives pathogenic immune cell expansion and inflammation effects • IL-15 is inflammatory cytokine o Expressed by stressed epithelial cells o Supports T cell and NK cell homeostasis and expansion o Binds intercellularly o IL15/IL15R transported to cell surface by stromal cells and APCs • IL-15 expression in epithelium (mid villi), crypts and LP increased in CeD patients • IL-2 stimulates CD4 Tem cell activation and proliferation and IFNγ production, leading to IL-15 secretion Rationale in targeting CD8 and CD4 T cells to broadly impact CeD inflammation IL-15 TEM= T effector memory IL-2 38
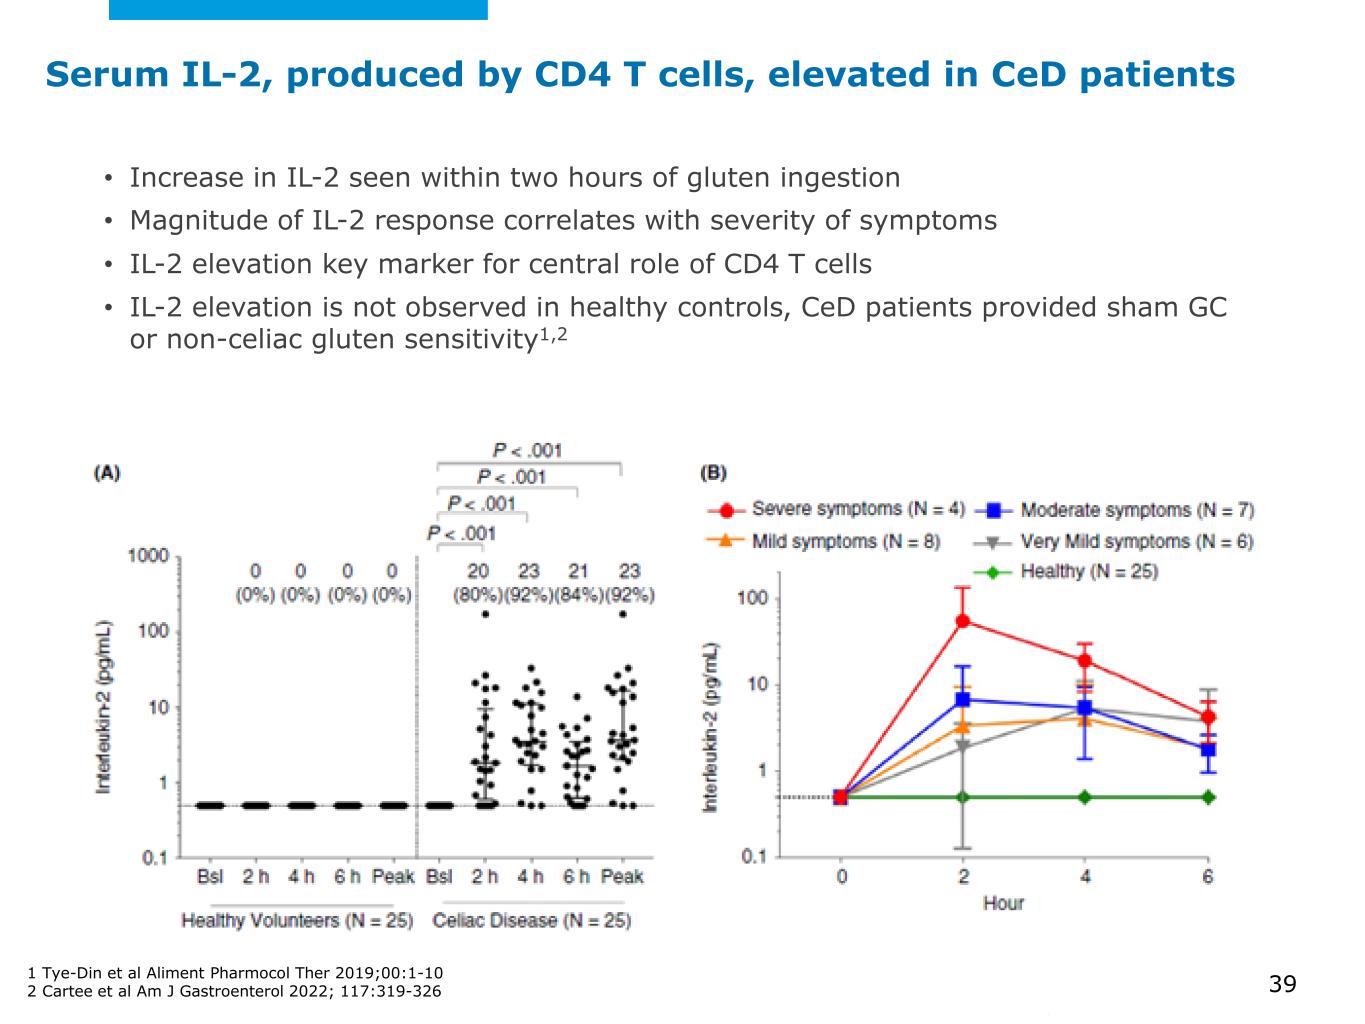
©2025 Mayo Foundation for Medical Education and Research | WF3855367-39 Serum IL-2, produced by CD4 T cells, elevated in CeD patients • Increase in IL-2 seen within two hours of gluten ingestion • Magnitude of IL-2 response correlates with severity of symptoms • IL-2 elevation key marker for central role of CD4 T cells • IL-2 elevation is not observed in healthy controls, CeD patients provided sham GC or non-celiac gluten sensitivity1,2 1 Tye-Din et al Aliment Pharmocol Ther 2019;00:1-10 2 Cartee et al Am J Gastroenterol 2022; 117:319-326 39
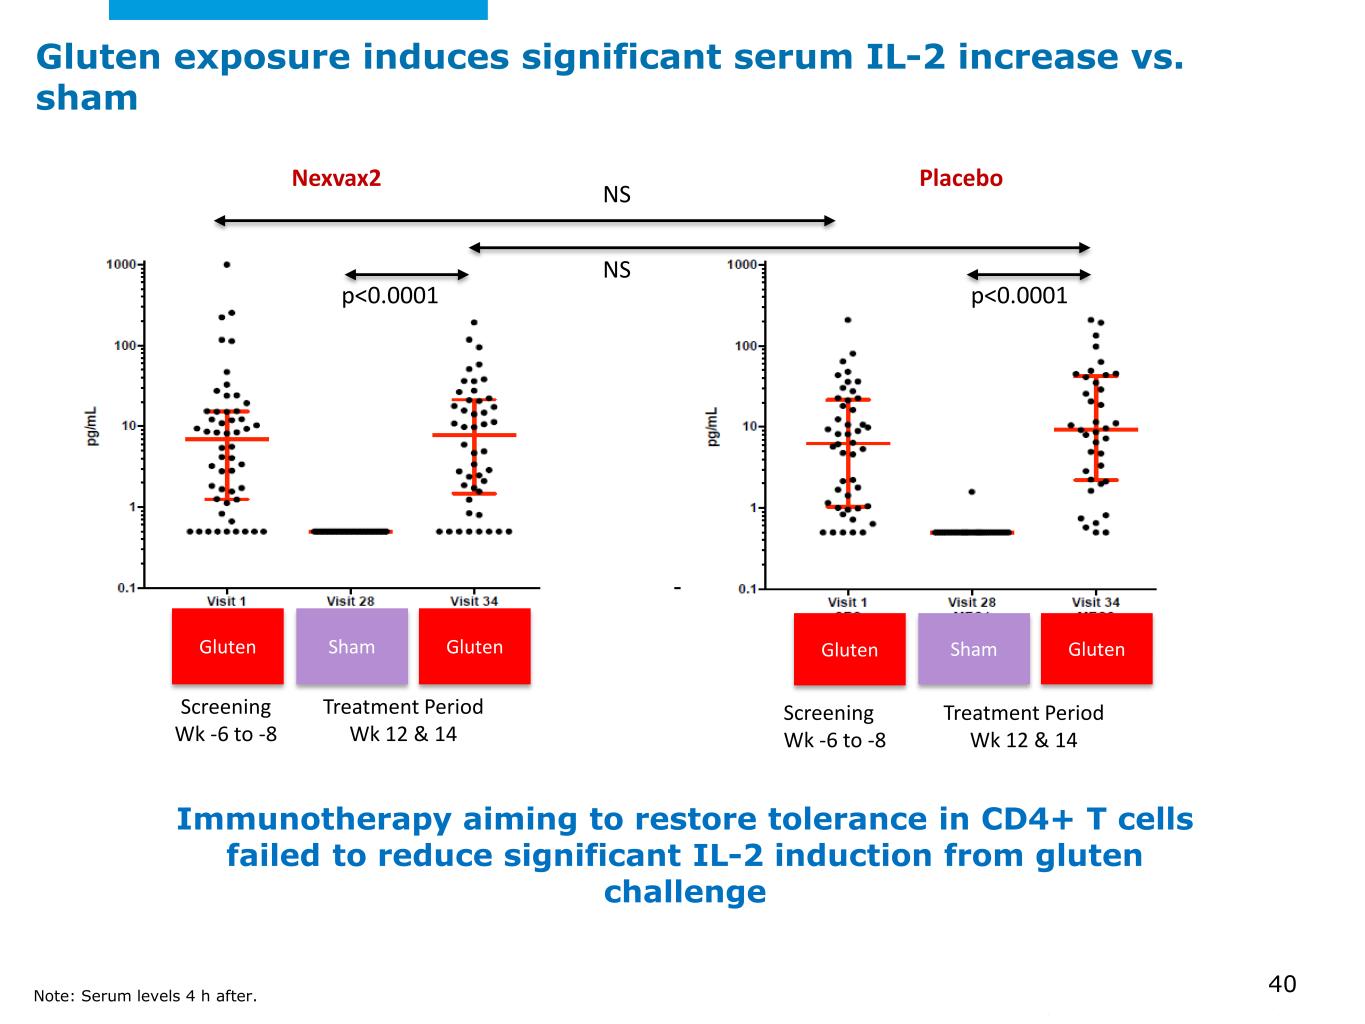
©2025 Mayo Foundation for Medical Education and Research | WF3855367-40 Gluten exposure induces significant serum IL-2 increase vs. sham Immunotherapy aiming to restore tolerance in CD4+ T cells failed to reduce significant IL-2 induction from gluten challenge Nexvax2 Placebo Gluten Sham Gluten Gluten Sham Gluten Screening Wk -6 to -8 Treatment Period Wk 12 & 14 Screening Wk -6 to -8 Treatment Period Wk 12 & 14 NS NS p<0.0001 p<0.0001 Note: Serum levels 4 h after. 40
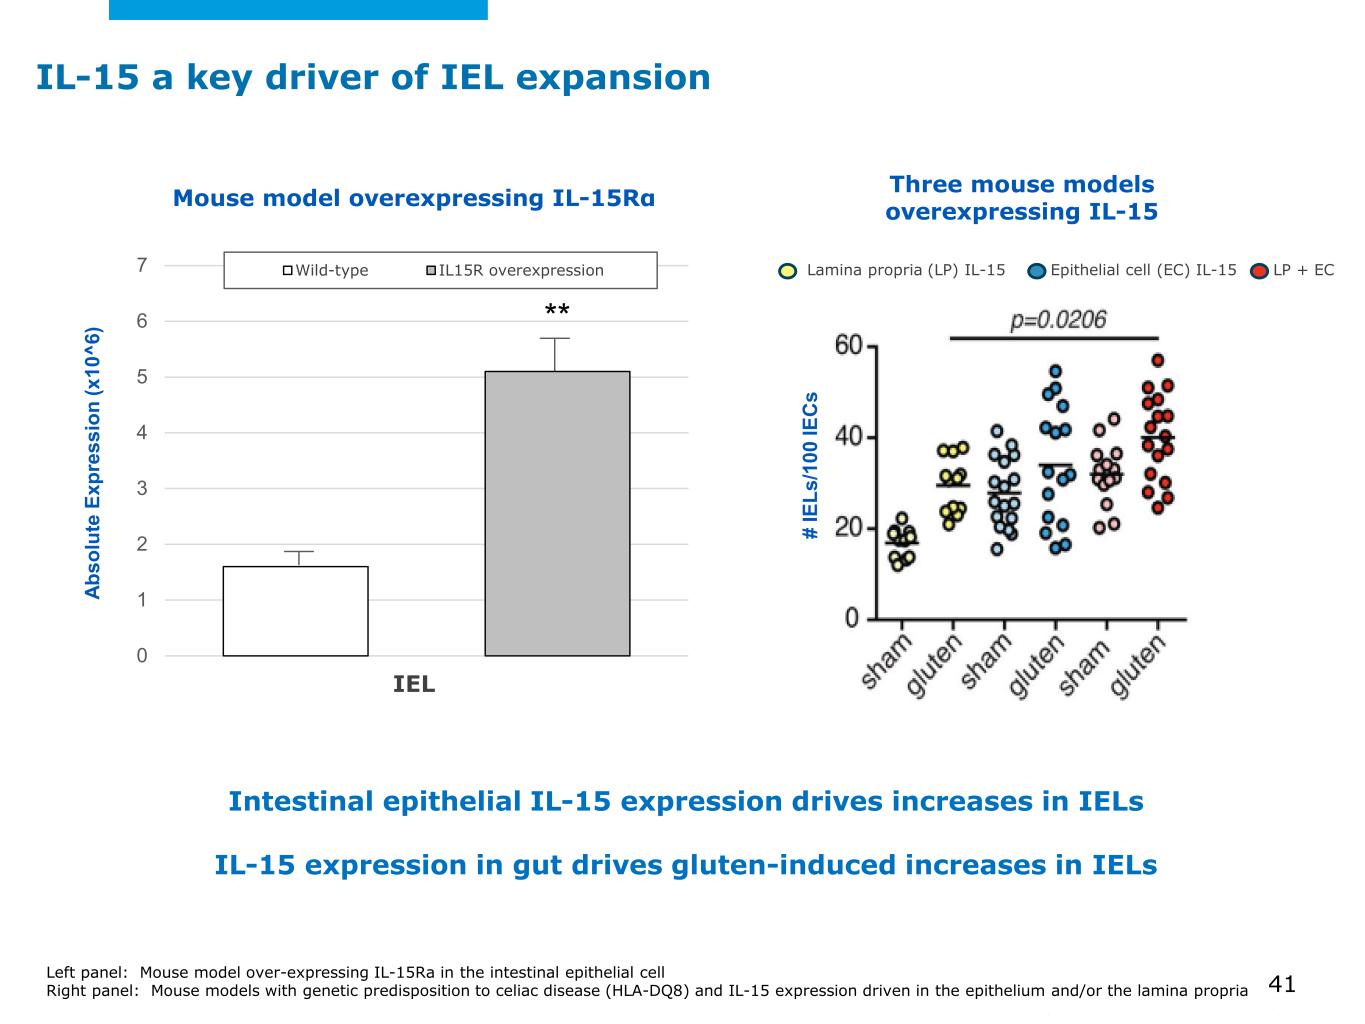
©2025 Mayo Foundation for Medical Education and Research | WF3855367-41 IL-15 a key driver of IEL expansion Left panel: Mouse model over-expressing IL-15Ra in the intestinal epithelial cell Right panel: Mouse models with genetic predisposition to celiac disease (HLA-DQ8) and IL-15 expression driven in the epithelium and/or the lamina propria 41 Intestinal epithelial IL-15 expression drives increases in IELs IL-15 expression in gut drives gluten-induced increases in IELs Three mouse models overexpressing IL-15 0 1 2 3 4 5 6 7 Wild-type IL15R overexpression Ab so lu te E xp re ss io n (x 10 ^6 ) Mouse model overexpressing IL-15Rα IEL ** Lamina propria (LP) IL-15 Epithelial cell (EC) IL-15 LP + EC # IE Ls /1 00 IE C s
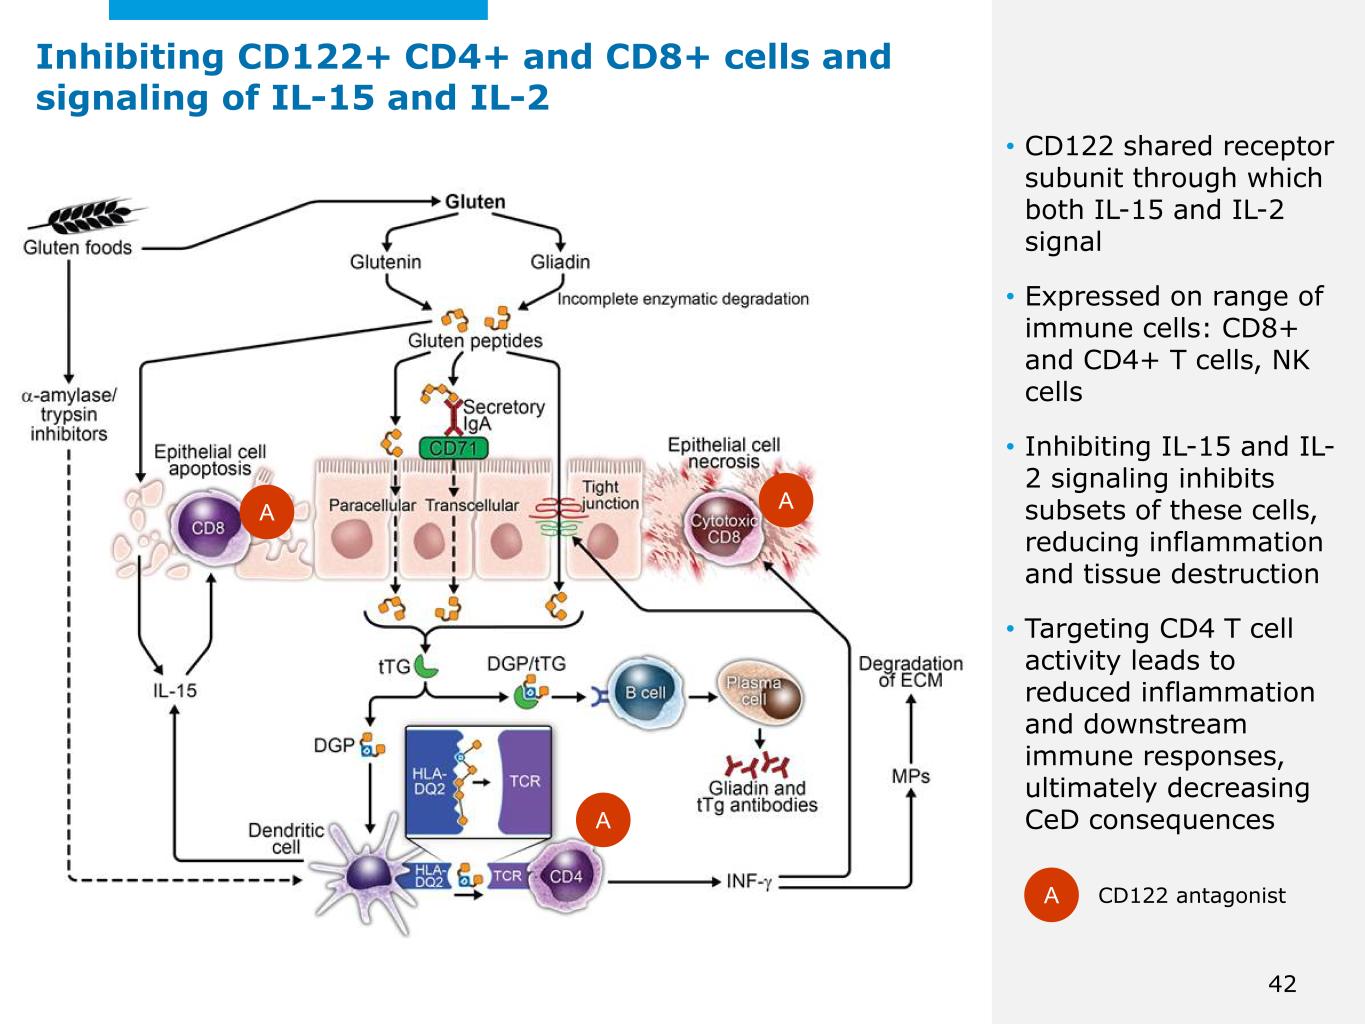
©2025 Mayo Foundation for Medical Education and Research | WF3855367-42 • CD122 shared receptor subunit through which both IL-15 and IL-2 signal • Expressed on range of immune cells: CD8+ and CD4+ T cells, NK cells • Inhibiting IL-15 and IL- 2 signaling inhibits subsets of these cells, reducing inflammation and tissue destruction • Targeting CD4 T cell activity leads to reduced inflammation and downstream immune responses, ultimately decreasing CeD consequences A CD122 antagonist A AA 42 Inhibiting CD122+ CD4+ and CD8+ cells and signaling of IL-15 and IL-2
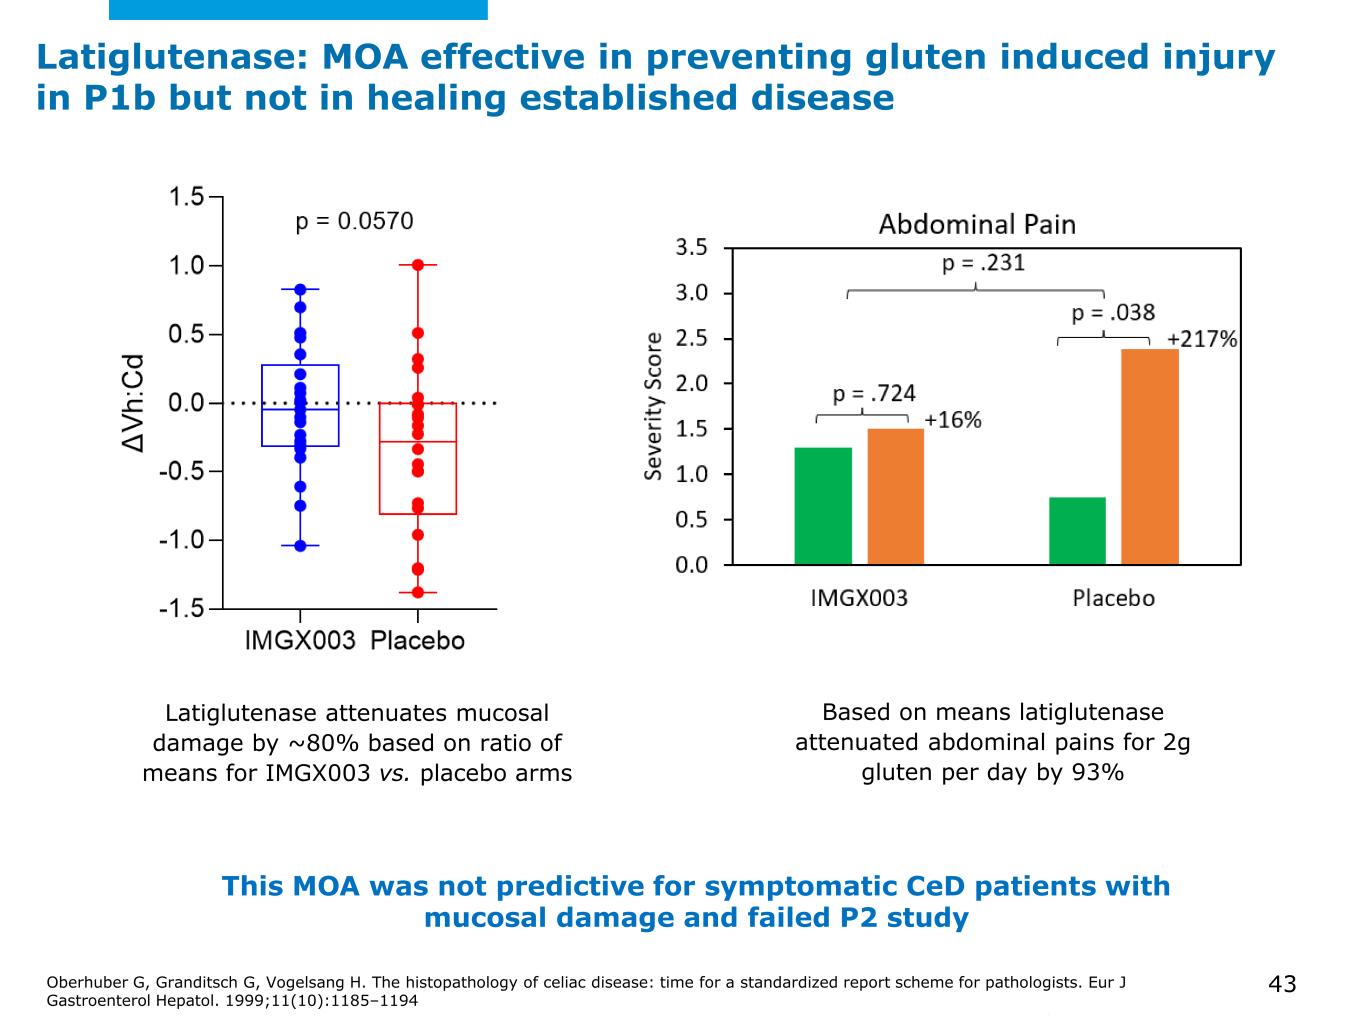
©2025 Mayo Foundation for Medical Education and Research | WF3855367-43 Latiglutenase attenuates mucosal damage by ~80% based on ratio of means for IMGX003 vs. placebo arms Based on means latiglutenase attenuated abdominal pains for 2g gluten per day by 93% This MOA was not predictive for symptomatic CeD patients with mucosal damage and failed P2 study Oberhuber G, Granditsch G, Vogelsang H. The histopathology of celiac disease: time for a standardized report scheme for pathologists. Eur J Gastroenterol Hepatol. 1999;11(10):1185–1194 43 Latiglutenase: MOA effective in preventing gluten induced injury in P1b but not in healing established disease
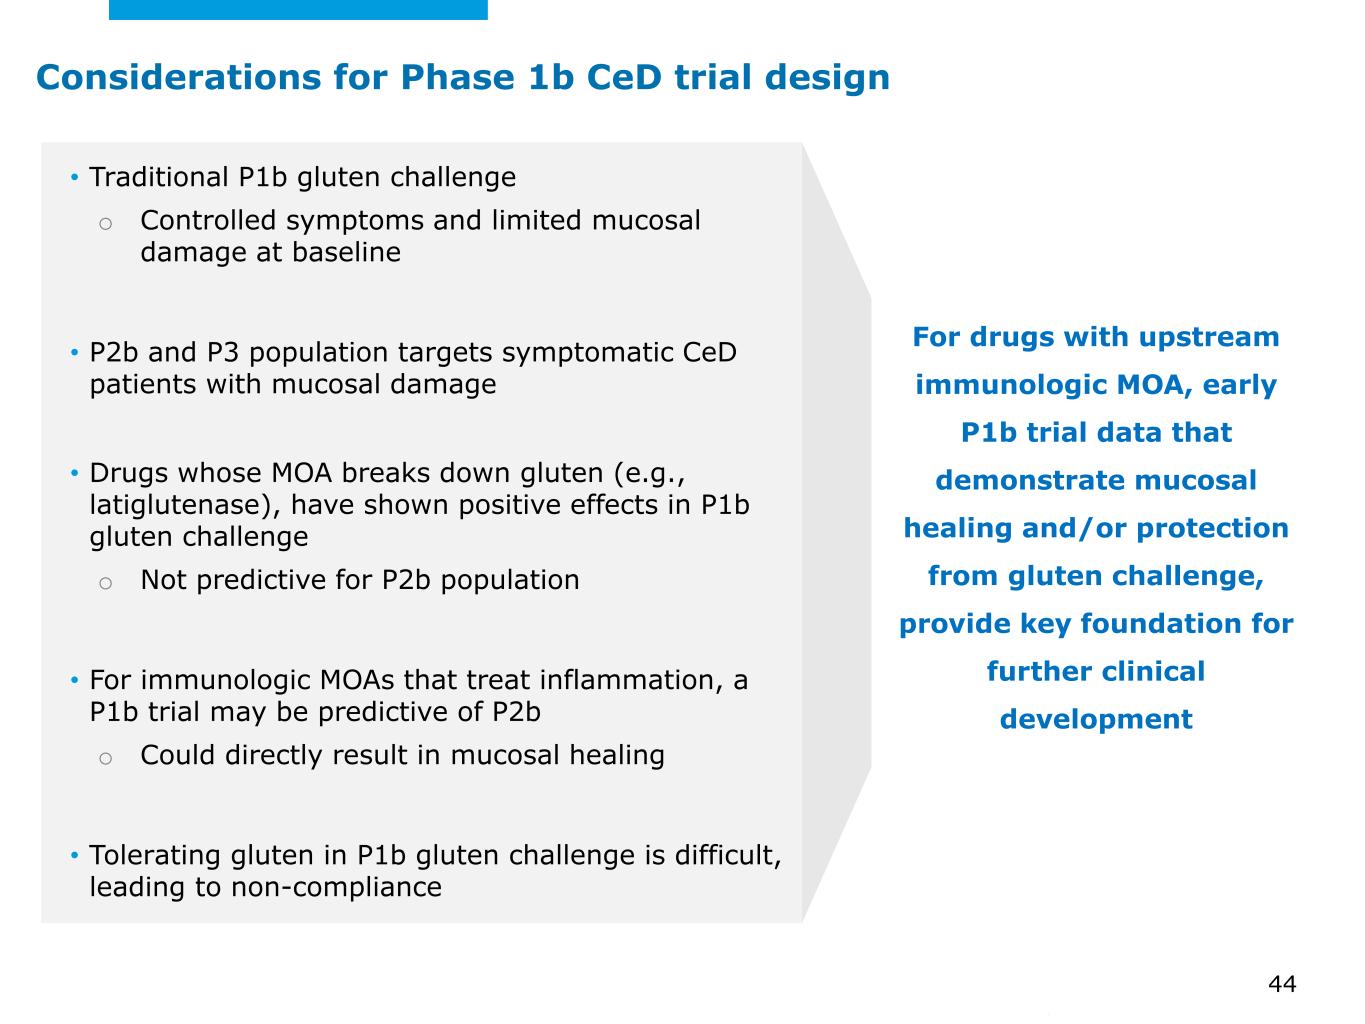
©2025 Mayo Foundation for Medical Education and Research | WF3855367-44 • Traditional P1b gluten challenge o Controlled symptoms and limited mucosal damage at baseline • P2b and P3 population targets symptomatic CeD patients with mucosal damage • Drugs whose MOA breaks down gluten (e.g., latiglutenase), have shown positive effects in P1b gluten challenge o Not predictive for P2b population • For immunologic MOAs that treat inflammation, a P1b trial may be predictive of P2b o Could directly result in mucosal healing • Tolerating gluten in P1b gluten challenge is difficult, leading to non-compliance For drugs with upstream immunologic MOA, early P1b trial data that demonstrate mucosal healing and/or protection from gluten challenge, provide key foundation for further clinical development 44 Considerations for Phase 1b CeD trial design
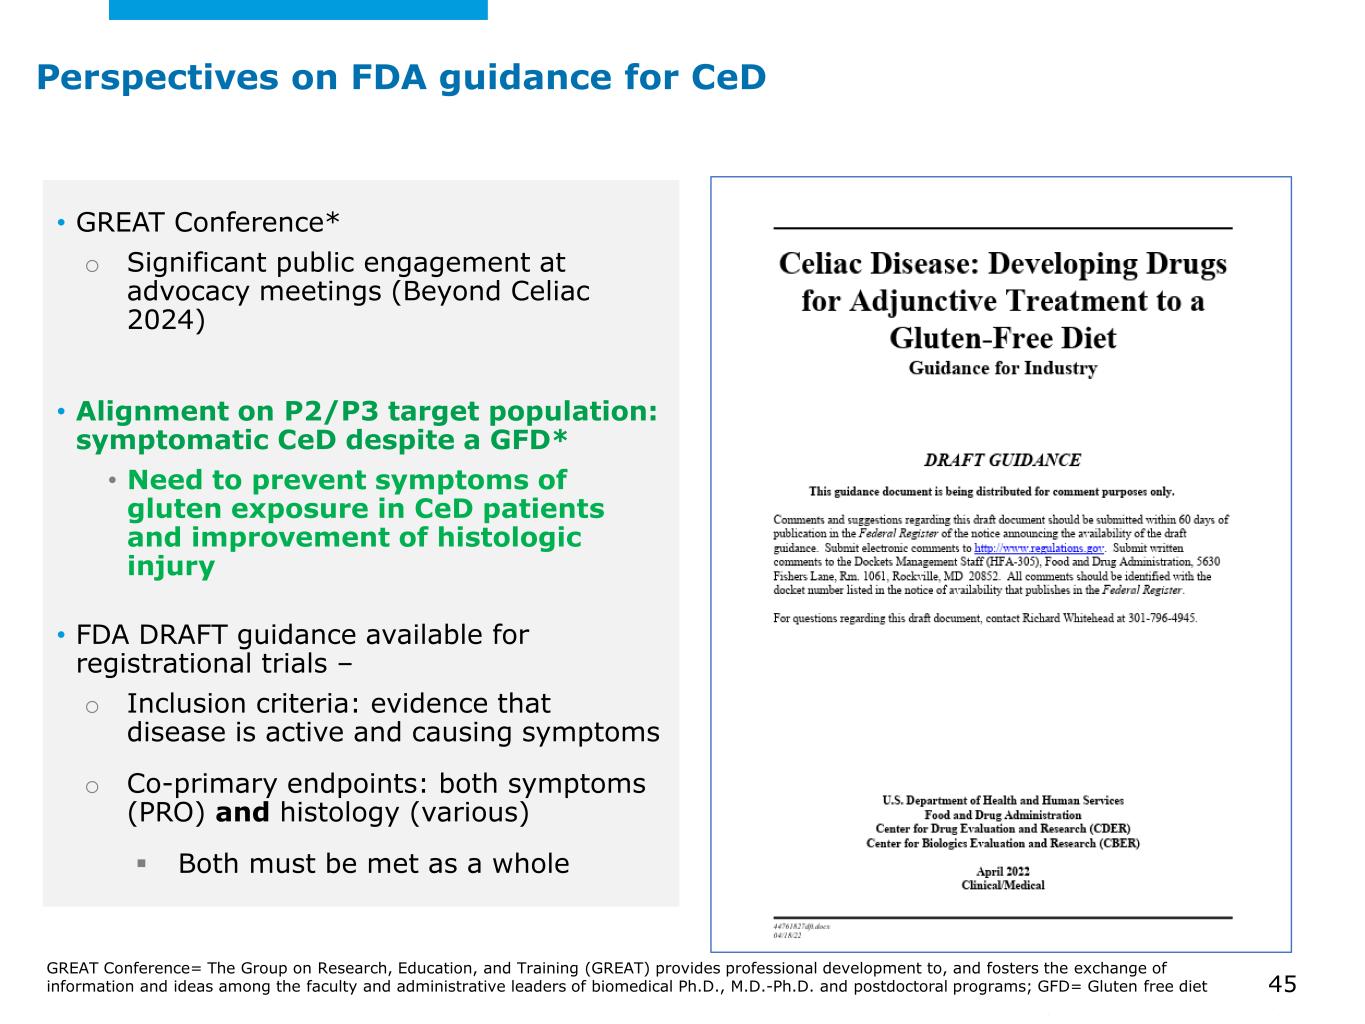
©2025 Mayo Foundation for Medical Education and Research | WF3855367-45 • GREAT Conference* o Significant public engagement at advocacy meetings (Beyond Celiac 2024) • Alignment on P2/P3 target population: symptomatic CeD despite a GFD* • Need to prevent symptoms of gluten exposure in CeD patients and improvement of histologic injury • FDA DRAFT guidance available for registrational trials – o Inclusion criteria: evidence that disease is active and causing symptoms o Co-primary endpoints: both symptoms (PRO) and histology (various) Both must be met as a whole GREAT Conference= The Group on Research, Education, and Training (GREAT) provides professional development to, and fosters the exchange of information and ideas among the faculty and administrative leaders of biomedical Ph.D., M.D.-Ph.D. and postdoctoral programs; GFD= Gluten free diet 45 Perspectives on FDA guidance for CeD
TOPIC SPEAKER CD122 biology and preclinical data Martin Dahl, Ph.D., Senior Vice President, Research Phase 1a in healthy volunteers John Kwon, M.D., Ph.D. Vice President, Clinical Development Drug development for CeD Joseph Murray, M.D. Professor of Medicine Mayo Clinic College of Medicine, Rochester, MN Phase 1b in CeD Paul Lizzul, M.D., Ph.D. Chief Medical Officer Commercial opportunity and next steps Dan Faga Chief Executive Officer Q&A All Agenda: ANB033 (CD122 Antagonist) 46
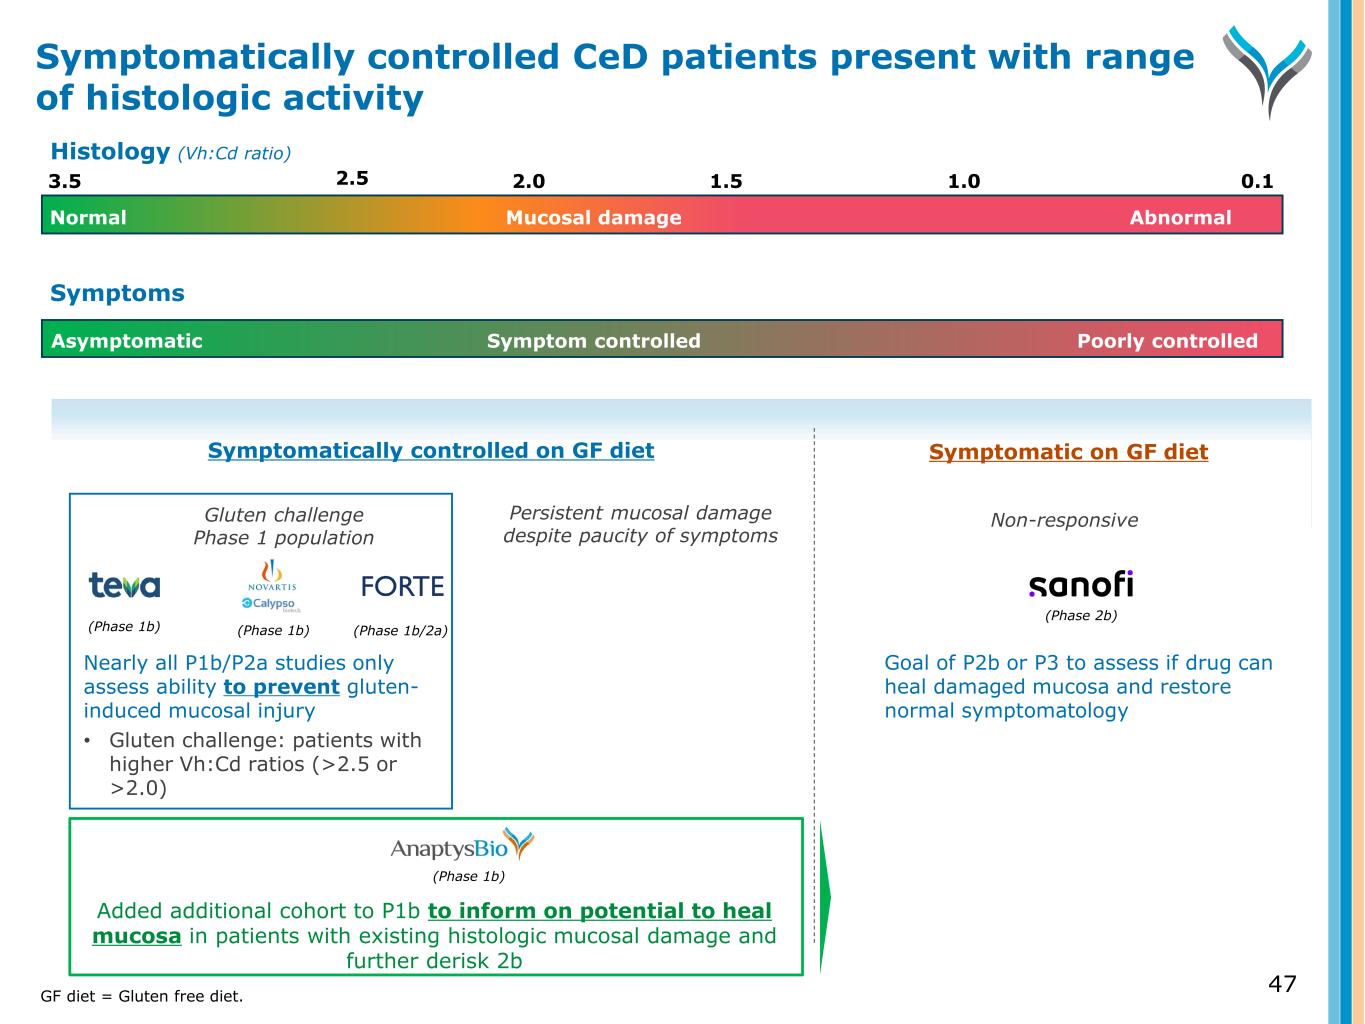
47 Symptomatically controlled on GF diet Symptomatic on GF diet Persistent mucosal damage despite paucity of symptoms Non-responsive (Phase 1b) Added additional cohort to P1b to inform on potential to heal mucosa in patients with existing histologic mucosal damage and further derisk 2b Symptom controlled Poorly controlledAsymptomatic Symptoms (Phase 2b) Goal of P2b or P3 to assess if drug can heal damaged mucosa and restore normal symptomatology Gluten challenge Phase 1 population (Phase 1b) (Phase 1b) (Phase 1b/2a) Nearly all P1b/P2a studies only assess ability to prevent gluten- induced mucosal injury • Gluten challenge: patients with higher Vh:Cd ratios (>2.5 or >2.0) Symptomatically controlled CeD patients present with range of histologic activity GF diet = Gluten free diet. 3.5 2.0 1.5 0.11.0 Normal AbnormalMucosal damage 2.5 Histology (Vh:Cd ratio)
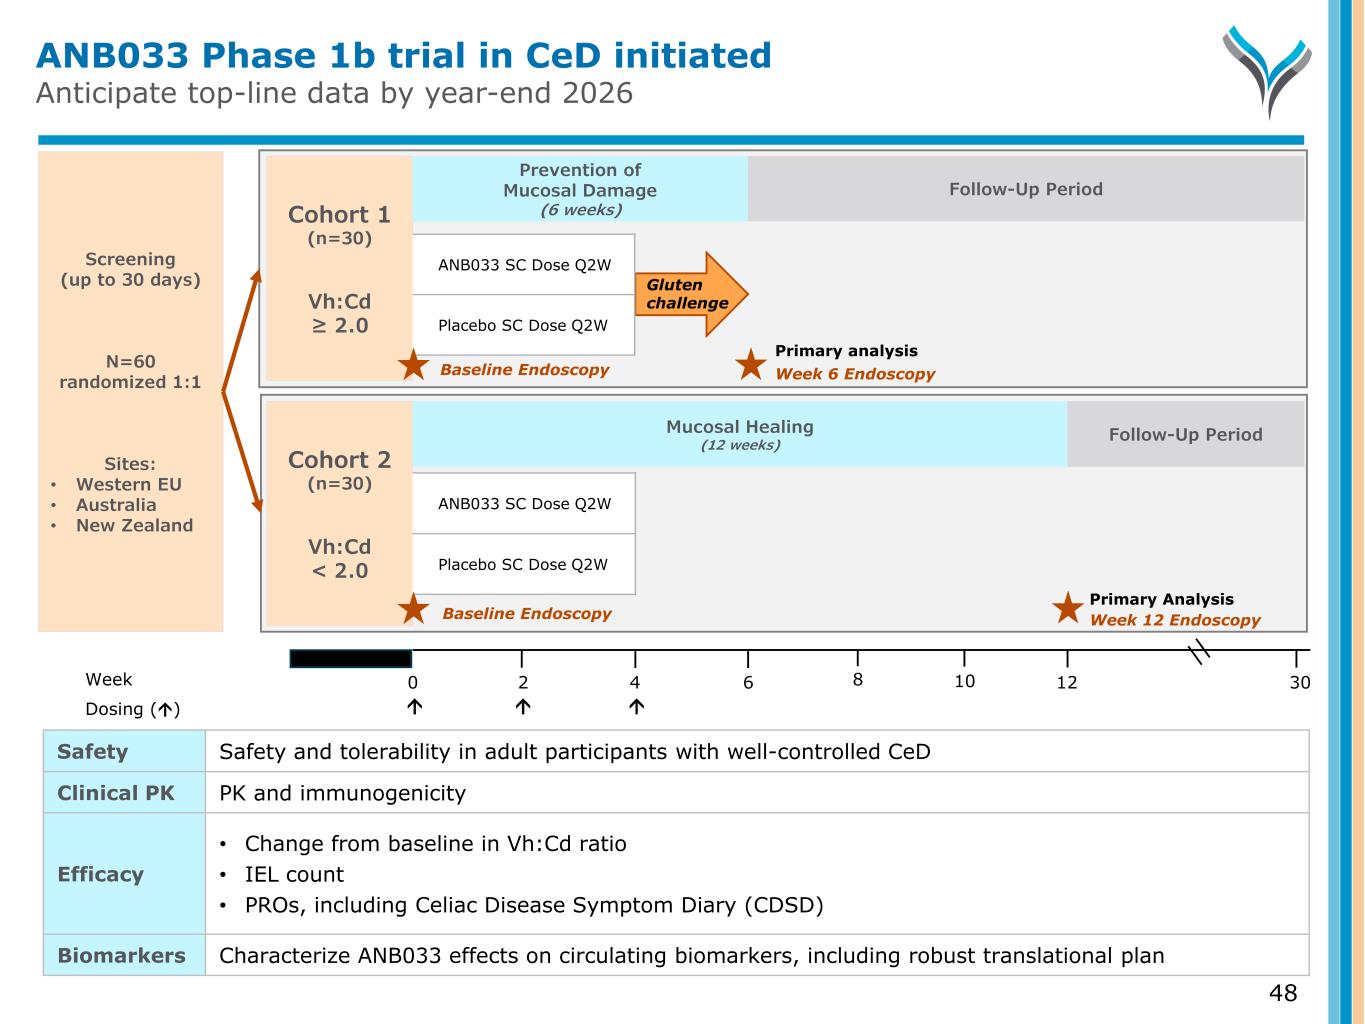
Primary Analysis ANB033 Phase 1b trial in CeD initiated Anticipate top-line data by year-end 2026 48 Screening (up to 30 days) N=60 randomized 1:1 Sites: • Western EU • Australia • New Zealand Week 0 6 124 302 Dosing () Cohort 1 (n=30) Vh:Cd ≥ 2.0 Week 6 Endoscopy Gluten challenge Prevention of Mucosal Damage (6 weeks) ANB033 SC Dose Q2W Placebo SC Dose Q2W Baseline Endoscopy Follow-Up Period Cohort 2 (n=30) Vh:Cd < 2.0 Week 12 Endoscopy Follow-Up Period Baseline Endoscopy Mucosal Healing (12 weeks) ANB033 SC Dose Q2W Placebo SC Dose Q2W Safety Safety and tolerability in adult participants with well-controlled CeD Clinical PK PK and immunogenicity Efficacy • Change from baseline in Vh:Cd ratio • IEL count • PROs, including Celiac Disease Symptom Diary (CDSD) Biomarkers Characterize ANB033 effects on circulating biomarkers, including robust translational plan 8 10 Primary analysis
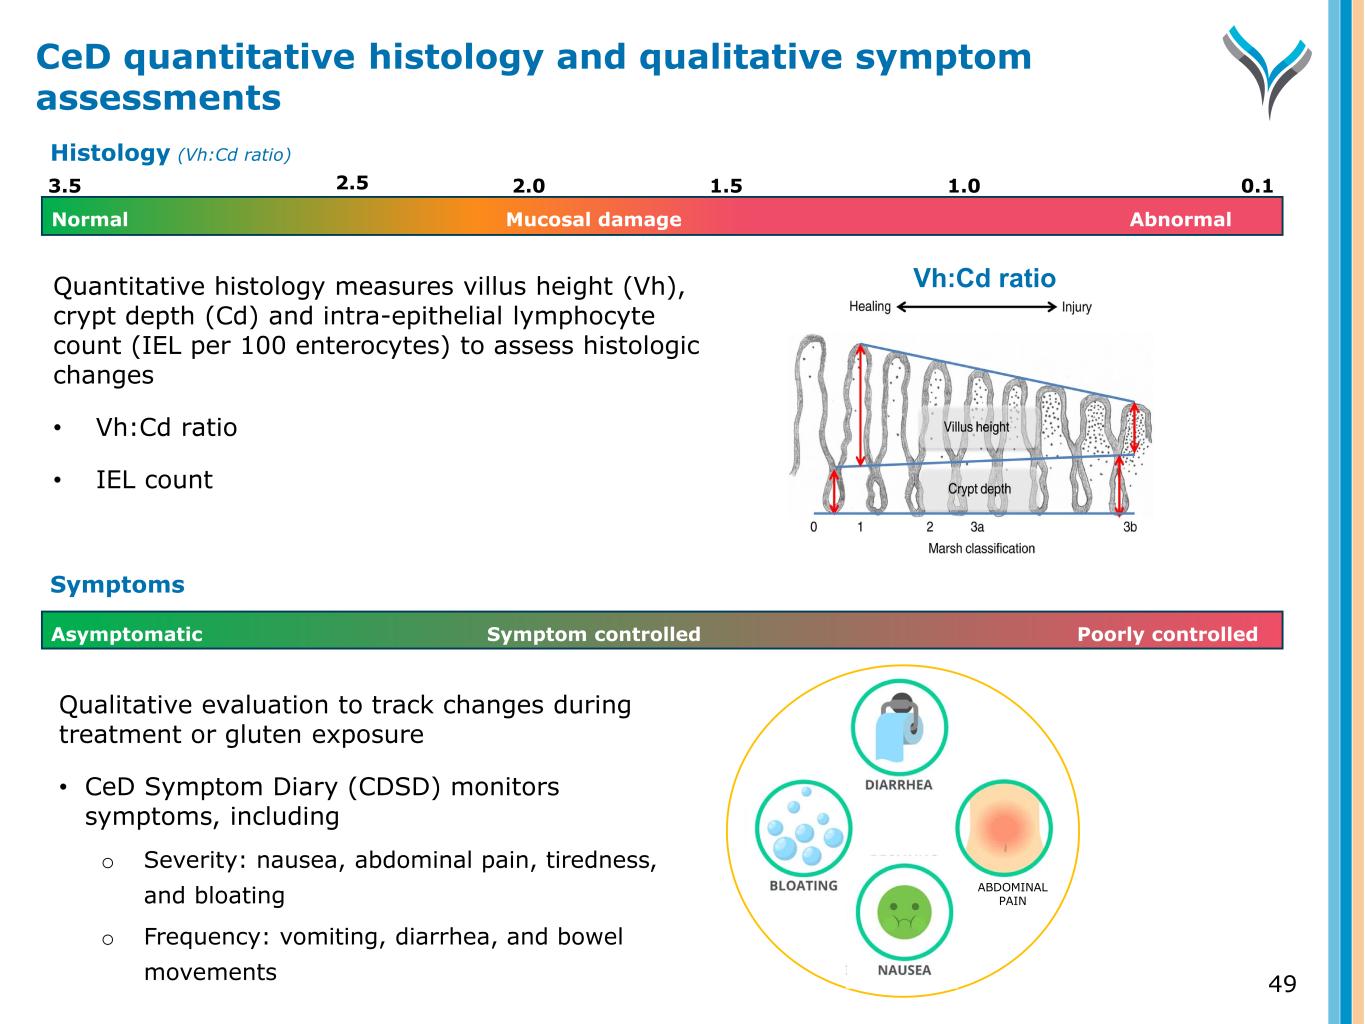
Qualitative evaluation to track changes during treatment or gluten exposure • CeD Symptom Diary (CDSD) monitors symptoms, including o Severity: nausea, abdominal pain, tiredness, and bloating o Frequency: vomiting, diarrhea, and bowel movements Symptom controlled Poorly controlledAsymptomatic Symptoms ABDOMINAL PAIN 49 CeD quantitative histology and qualitative symptom assessments Quantitative histology measures villus height (Vh), crypt depth (Cd) and intra-epithelial lymphocyte count (IEL per 100 enterocytes) to assess histologic changes • Vh:Cd ratio • IEL count 3.5 2.0 1.5 0.11.0 Normal AbnormalMucosal damage 2.5 Histology (Vh:Cd ratio) Vh:Cd ratio
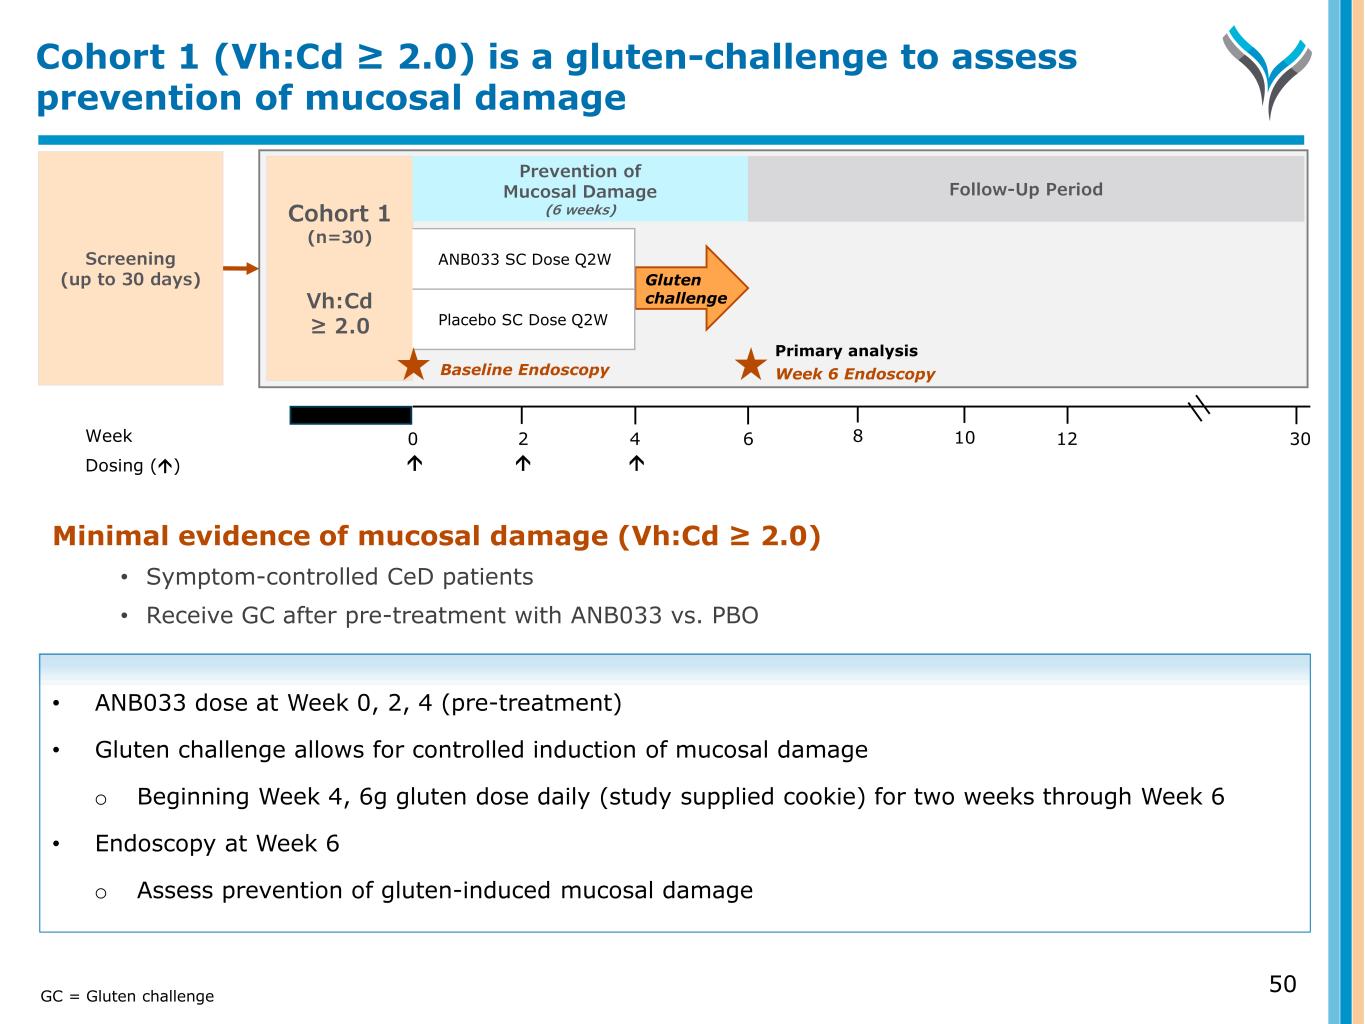
Minimal evidence of mucosal damage (Vh:Cd ≥ 2.0) • Symptom-controlled CeD patients • Receive GC after pre-treatment with ANB033 vs. PBO • ANB033 dose at Week 0, 2, 4 (pre-treatment) • Gluten challenge allows for controlled induction of mucosal damage o Beginning Week 4, 6g gluten dose daily (study supplied cookie) for two weeks through Week 6 • Endoscopy at Week 6 o Assess prevention of gluten-induced mucosal damage Screening (up to 30 days) Week 0 6 124 302 Dosing () Cohort 1 (n=30) Vh:Cd ≥ 2.0 Gluten challenge ANB033 SC Dose Q2W Placebo SC Dose Q2W 8 10 Week 6 EndoscopyBaseline Endoscopy Primary analysis Prevention of Mucosal Damage (6 weeks) Follow-Up Period Cohort 1 (Vh:Cd ≥ 2.0) is a gluten-challenge to assess prevention of mucosal damage GC = Gluten challenge 50
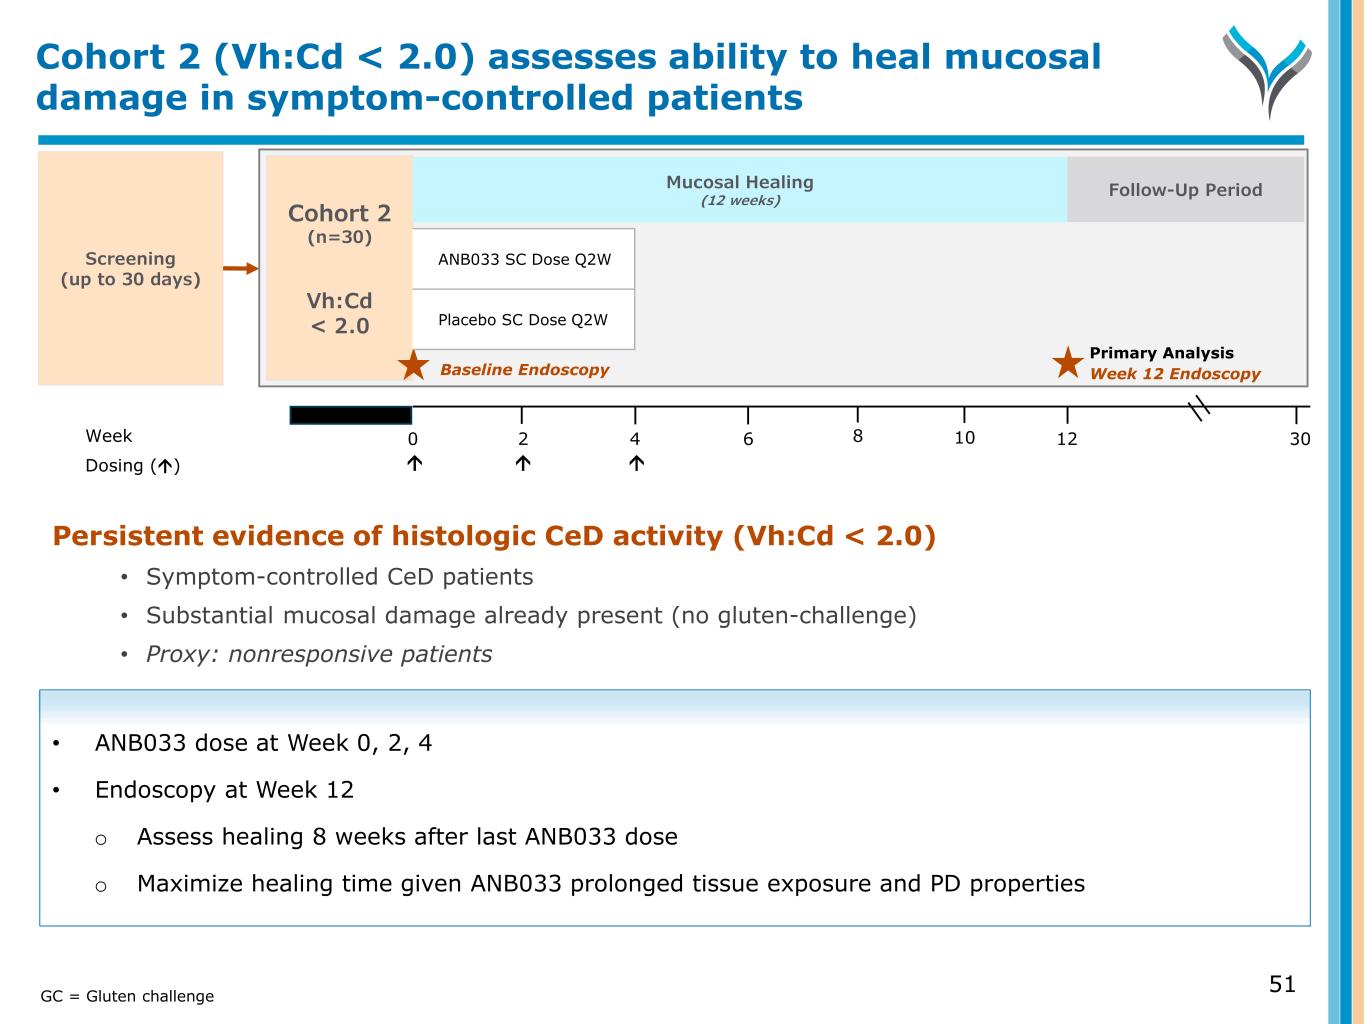
Screening (up to 30 days) Week 0 6 124 302 Dosing () 8 10 Cohort 2 (n=30) Vh:Cd < 2.0 Primary Analysis Week 12 Endoscopy Persistent evidence of histologic CeD activity (Vh:Cd < 2.0) • Symptom-controlled CeD patients • Substantial mucosal damage already present (no gluten-challenge) • Proxy: nonresponsive patients • ANB033 dose at Week 0, 2, 4 • Endoscopy at Week 12 o Assess healing 8 weeks after last ANB033 dose o Maximize healing time given ANB033 prolonged tissue exposure and PD properties Cohort 2 (Vh:Cd < 2.0) assesses ability to heal mucosal damage in symptom-controlled patients Follow-Up Period Mucosal Healing (12 weeks) 51GC = Gluten challenge Baseline Endoscopy ANB033 SC Dose Q2W Placebo SC Dose Q2W
TOPIC SPEAKER CD122 biology and preclinical data Martin Dahl, Ph.D., Senior Vice President, Research Phase 1a in healthy volunteers John Kwon, M.D., Ph.D. Vice President, Clinical Development Drug development for CeD Joseph Murray, M.D. Professor of Medicine Mayo Clinic College of Medicine, Rochester, MN Phase 1b in CeD Paul Lizzul, M.D., Ph.D. Chief Medical Officer Commercial opportunity and next steps Dan Faga Chief Executive Officer Q&A All 52 Agenda: ANB033 (CD122 Antagonist)
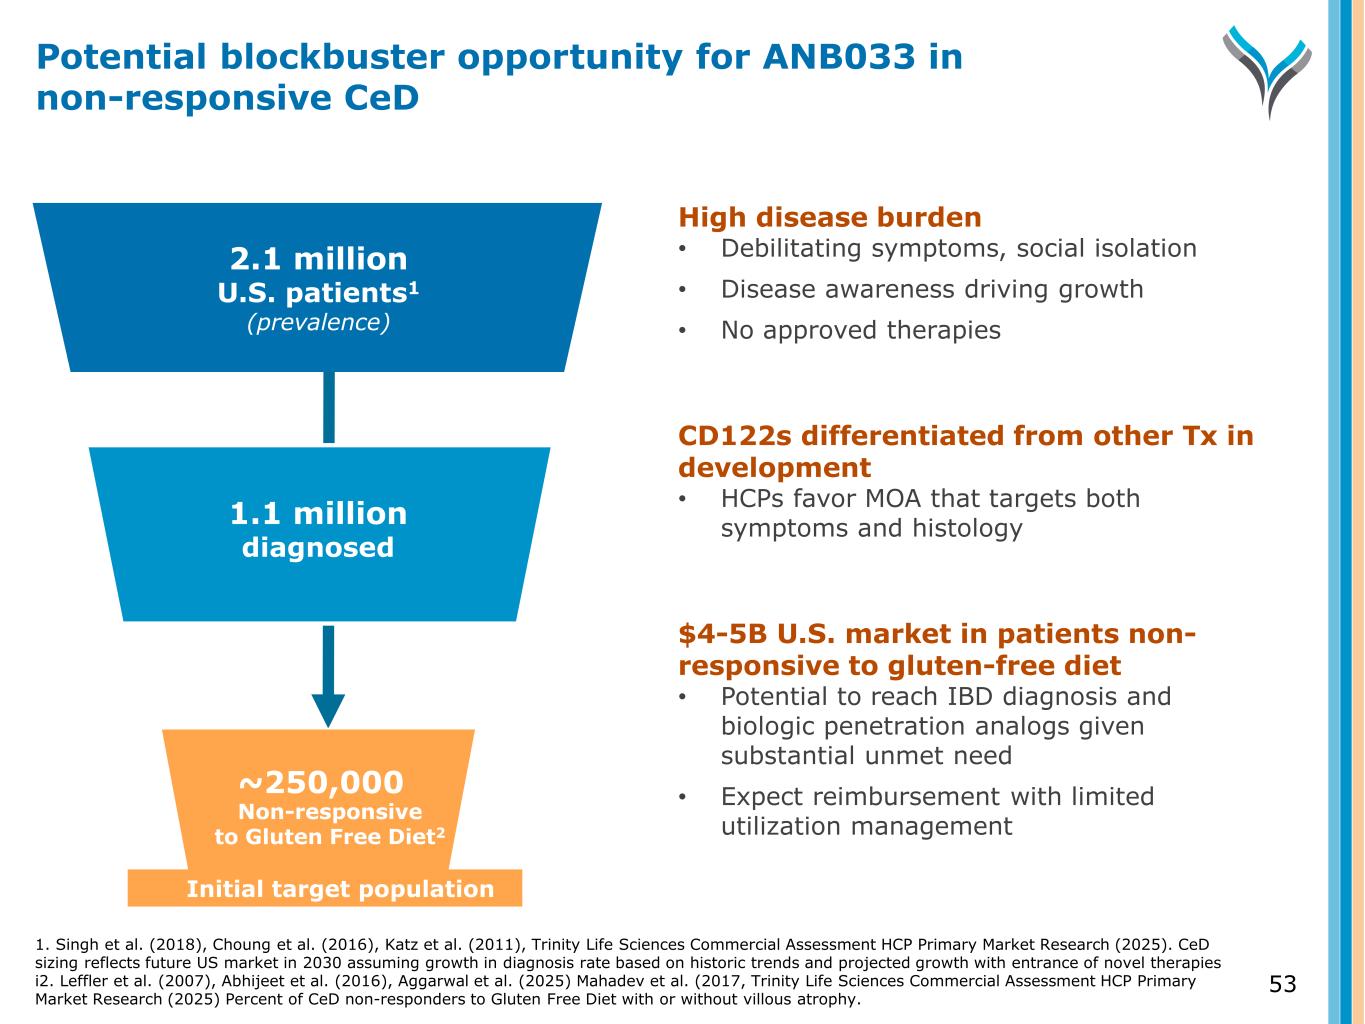
2.1 million U.S. patients1 (prevalence) ~250,000 Diagnosed Initial target population High disease burden • Debilitating symptoms, social isolation • Disease awareness driving growth • No approved therapies CD122s differentiated from other Tx in development • HCPs favor MOA that targets both symptoms and histology $4-5B U.S. market in patients non- responsive to gluten-free diet • Potential to reach IBD diagnosis and biologic penetration analogs given substantial unmet need • Expect reimbursement with limited utilization managementNon-responsive to Gluten Free Diet2 1.1 million diagnosed 53 Potential blockbuster opportunity for ANB033 in non-responsive CeD 1. Singh et al. (2018), Choung et al. (2016), Katz et al. (2011), Trinity Life Sciences Commercial Assessment HCP Primary Market Research (2025). CeD sizing reflects future US market in 2030 assuming growth in diagnosis rate based on historic trends and projected growth with entrance of novel therapies i2. Leffler et al. (2007), Abhijeet et al. (2016), Aggarwal et al. (2025) Mahadev et al. (2017, Trinity Life Sciences Commercial Assessment HCP Primary Market Research (2025) Percent of CeD non-responders to Gluten Free Diet with or without villous atrophy.
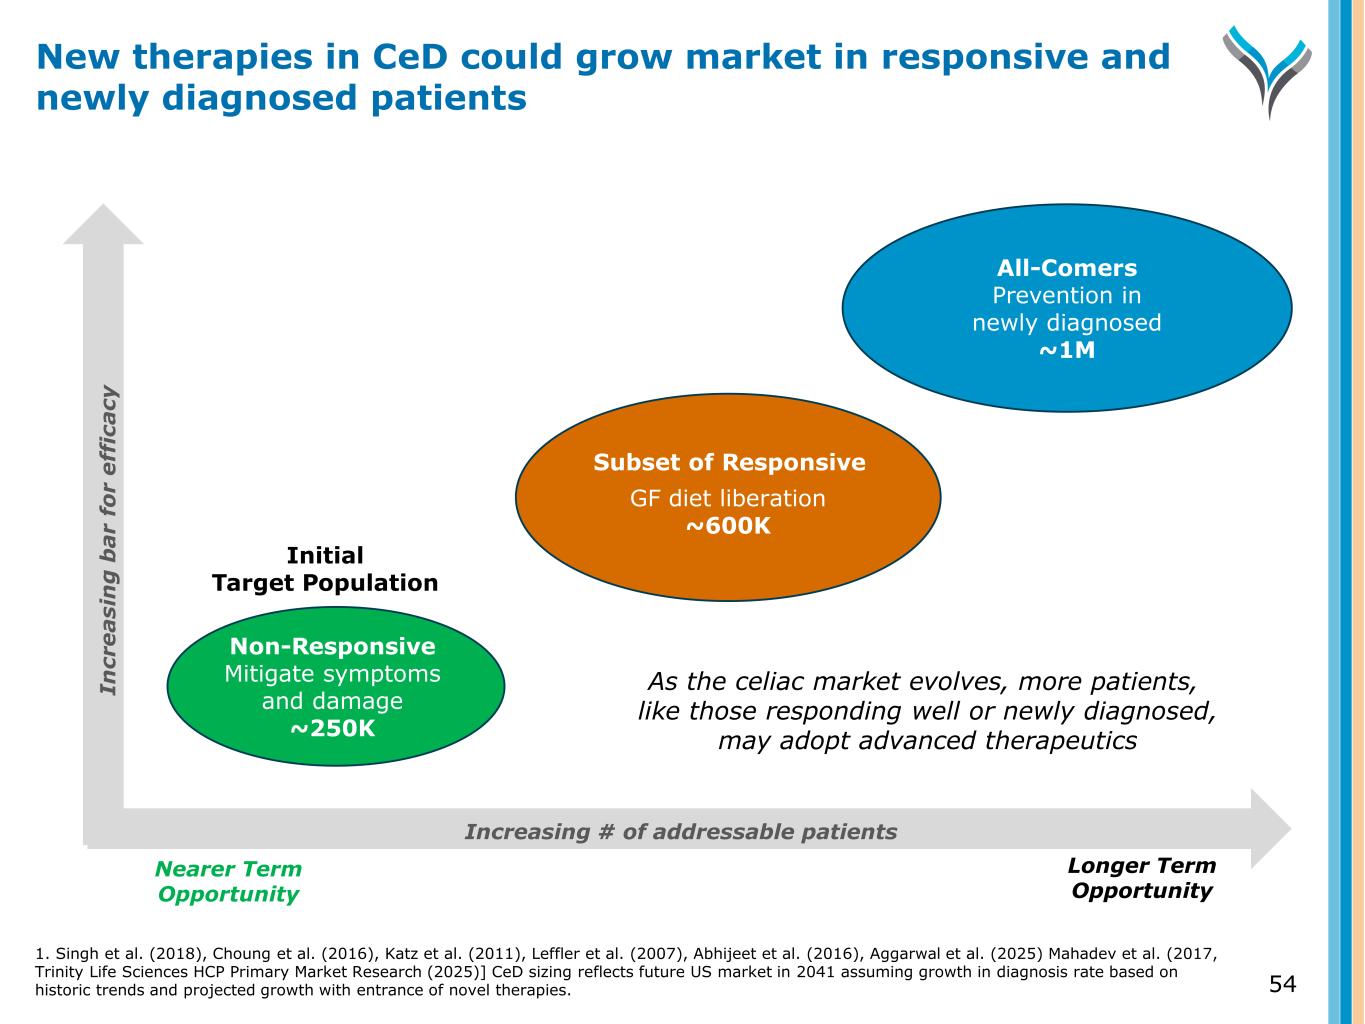
54 New therapies in CeD could grow market in responsive and newly diagnosed patients Increasing # of addressable patients Nearer Term Opportunity Longer Term Opportunity Non-Responsive Mitigate symptoms and damage ~250K GF diet liberation ~600K All-Comers Prevention in newly diagnosed ~1M Initial Target Population Subset of Responsive In cr e a si n g b a r fo r e ff ic a cy As the celiac market evolves, more patients, like those responding well or newly diagnosed, may adopt advanced therapeutics 1. Singh et al. (2018), Choung et al. (2016), Katz et al. (2011), Leffler et al. (2007), Abhijeet et al. (2016), Aggarwal et al. (2025) Mahadev et al. (2017, Trinity Life Sciences HCP Primary Market Research (2025)] CeD sizing reflects future US market in 2041 assuming growth in diagnosis rate based on historic trends and projected growth with entrance of novel therapies.
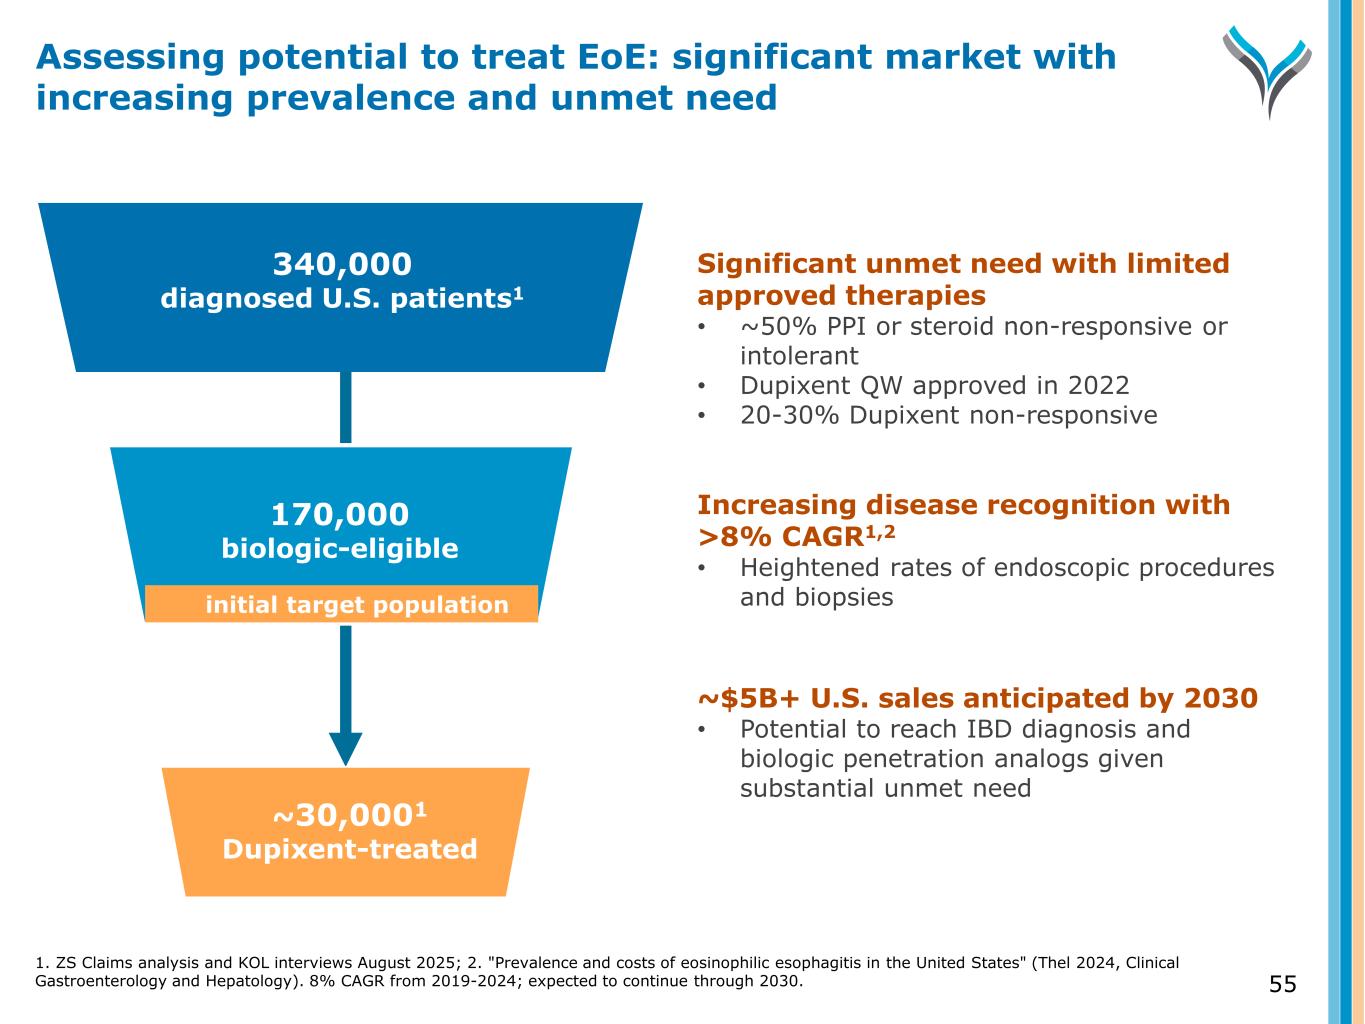
55 340,000 diagnosed U.S. patients1 Diagnosed 170,000 biologic-eligible ~30,0001 Dupixent-treated Significant unmet need with limited approved therapies • ~50% PPI or steroid non-responsive or intolerant • Dupixent QW approved in 2022 • 20-30% Dupixent non-responsive Increasing disease recognition with >8% CAGR1,2 • Heightened rates of endoscopic procedures and biopsies ~$5B+ U.S. sales anticipated by 2030 • Potential to reach IBD diagnosis and biologic penetration analogs given substantial unmet need Assessing potential to treat EoE: significant market with increasing prevalence and unmet need initial target population 1. ZS Claims analysis and KOL interviews August 2025; 2. "Prevalence and costs of eosinophilic esophagitis in the United States" (Thel 2024, Clinical Gastroenterology and Hepatology). 8% CAGR from 2019-2024; expected to continue through 2030.
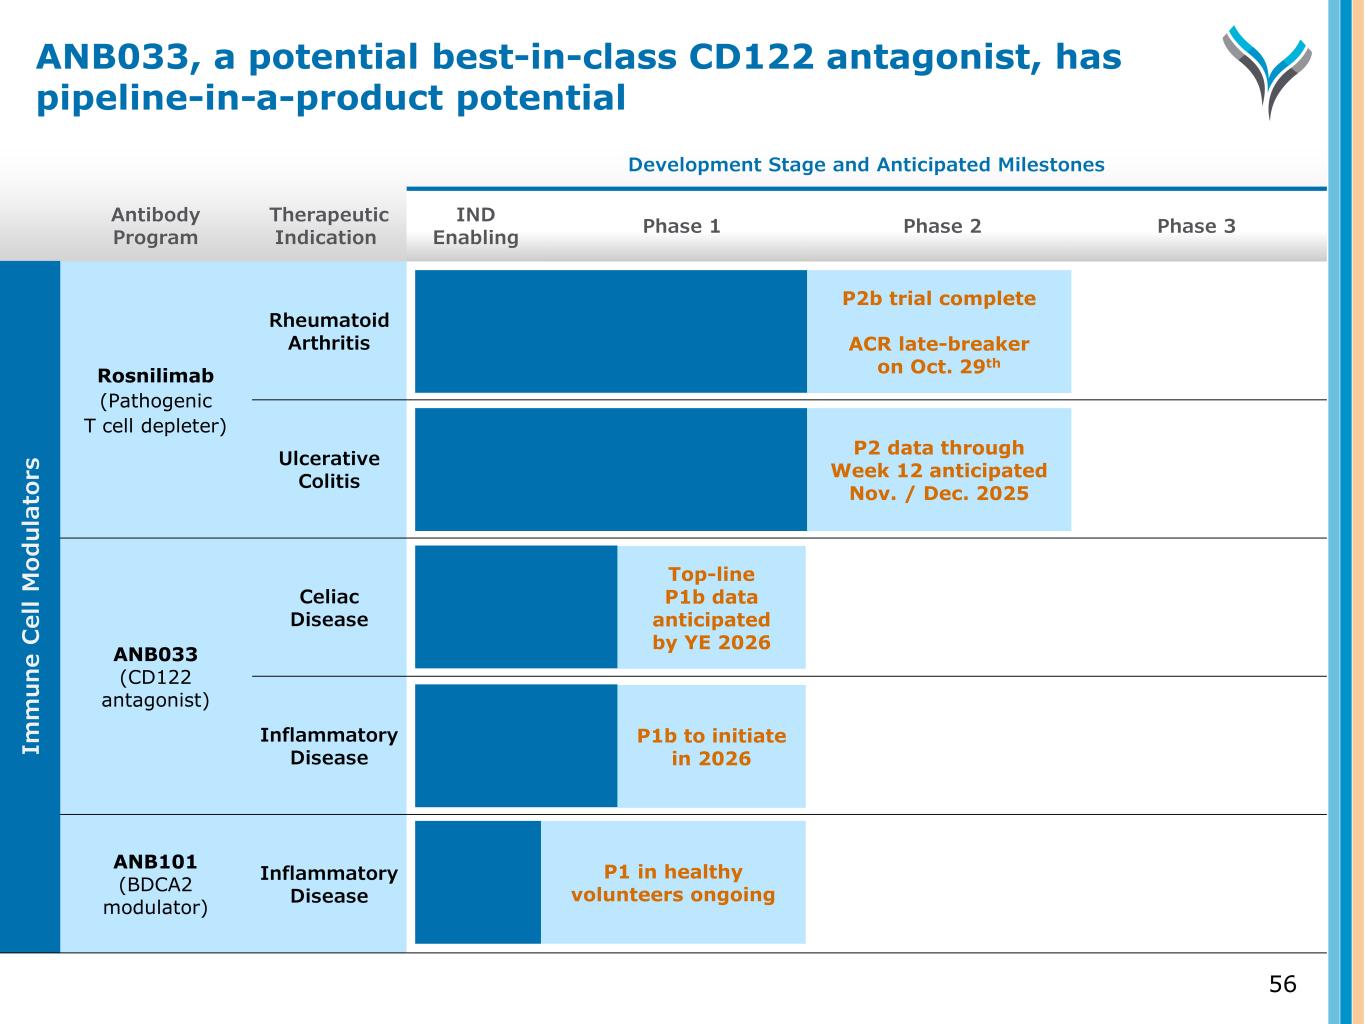
Antibody Program Therapeutic Indication Development Stage and Anticipated Milestones IND Enabling Phase 1 Phase 2 Phase 3 Rosnilimab (Pathogenic T cell depleter) Rheumatoid Arthritis Ulcerative Colitis ANB033 (CD122 antagonist) Celiac Disease Inflammatory Disease ANB101 (BDCA2 modulator) Inflammatory Disease 56 P2b trial complete ACR late-breaker on Oct. 29th P2 data through Week 12 anticipated Nov. / Dec. 2025 Top-line P1b data anticipated by YE 2026 Im m u n e C el l M od u la to rs P1 in healthy volunteers ongoing P1b to initiate in 2026 ANB033, a potential best-in-class CD122 antagonist, has pipeline-in-a-product potential