
| Trupanion, Inc. Condensed Consolidated Statements of Operations (in thousands, except share data) | |||||||||||||||||||||||
Three Months Ended September 30, | Nine Months Ended September 30, | ||||||||||||||||||||||
| 2025 | 2024 | 2025 | 2024 | ||||||||||||||||||||
| (unaudited) | |||||||||||||||||||||||
| Revenue: | |||||||||||||||||||||||
| Subscription business | $ | 252,697 | $ | 218,986 | $ | 727,917 | $ | 628,738 | |||||||||||||||
| Other business | 114,223 | 108,470 | 334,535 | 319,639 | |||||||||||||||||||
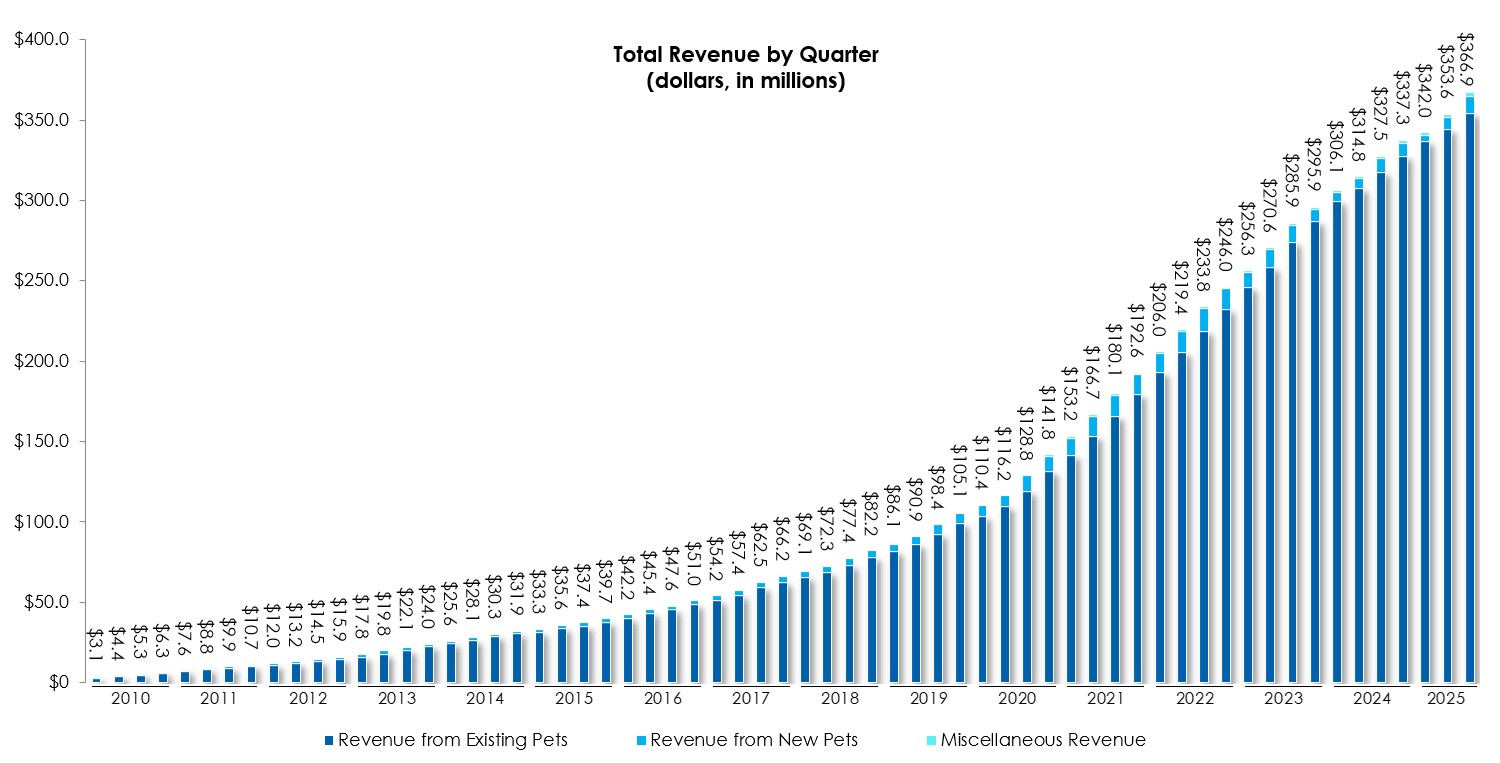
| Total revenue | 366,920 | 327,456 | 1,062,452 | 948,377 | |||||||||||||||||||
| Cost of revenue: | |||||||||||||||||||||||
| Subscription business | 200,766 | 177,365 | 586,098 | 525,237 | |||||||||||||||||||
| Other business | 106,100 | 100,712 | 310,370 | 297,265 | |||||||||||||||||||
Total cost of revenue(1), (2) | 306,866 | 278,077 | 896,468 | 822,502 | |||||||||||||||||||
| Operating expenses: | |||||||||||||||||||||||
Technology and development(1) | 9,887 | 7,933 | 26,545 | 23,083 | |||||||||||||||||||
General and administrative(1) | 18,311 | 16,977 | 58,325 | 46,903 | |||||||||||||||||||
New pet acquisition expense(1) | 21,946 | 18,308 | 62,305 | 53,025 | |||||||||||||||||||
| Depreciation and amortization | 4,051 | 4,381 | 11,804 | 12,542 | |||||||||||||||||||
| Total operating expenses | 54,195 | 47,599 | 158,979 | 135,553 | |||||||||||||||||||
| Loss from investment in joint venture | — | (34) | (305) | (184) | |||||||||||||||||||
| Operating income (loss) | 5,859 | 1,746 | 6,700 | (9,862) | |||||||||||||||||||
| Interest expense | 2,790 | 3,820 | 9,683 | 11,071 | |||||||||||||||||||
| Other (income), net | (3,530) | (3,538) | (18,684) | (9,601) | |||||||||||||||||||
| Income (loss) before income taxes | 6,599 | 1,464 | 15,701 | (11,332) | |||||||||||||||||||
| Income tax (benefit) expense | 726 | 39 | 1,898 | (43) | |||||||||||||||||||
| Net income (loss) | $ | 5,873 | $ | 1,425 | $ | 13,803 | $ | (11,289) | |||||||||||||||
| Net income (loss) per share: | |||||||||||||||||||||||
| Basic | $ | 0.14 | $ | 0.03 | $ | 0.32 | $ | (0.27) | |||||||||||||||
| Diluted | $ | 0.13 | $ | 0.03 | $ | 0.32 | $ | (0.27) | |||||||||||||||
| Weighted average shares of common stock outstanding: | |||||||||||||||||||||||
| Basic | 43,076,695 | 42,233,903 | 42,849,769 | 42,076,998 | |||||||||||||||||||
| Diluted | 43,562,132 | 42,822,505 | 43,550,326 | 42,076,998 | |||||||||||||||||||
(1)Includes stock-based compensation expense as follows: | Three Months Ended September 30, | Nine Months Ended September 30, | |||||||||||||||||||||
| 2025 | 2024 | 2025 | 2024 | ||||||||||||||||||||
| Veterinary invoice expense | $ | 677 | $ | 847 | $ | 2,221 | $ | 2,625 | |||||||||||||||
| Other cost of revenue | 585 | 554 | 1,679 | 1,561 | |||||||||||||||||||
| Technology and development | 1,705 | 1,259 | 4,326 | 3,774 | |||||||||||||||||||
| General and administrative | 4,971 | 4,125 | 14,546 | 11,435 | |||||||||||||||||||
| New pet acquisition expense | 1,561 | 1,555 | 6,013 | 5,743 | |||||||||||||||||||
| Total stock-based compensation expense | $ | 9,499 | $ | 8,340 | $ | 28,785 | $ | 25,138 | |||||||||||||||
(2)The breakout of cost of revenue between veterinary invoice expense and other cost of revenue is as follows: | |||||||||||||||||||||||
Three Months Ended September 30, | Nine Months Ended September 30, | ||||||||||||||||||||||
| 2025 | 2024 | 2025 | 2024 | ||||||||||||||||||||
| Veterinary invoice expense | $ | 263,127 | $ | 238,814 | $ | 766,157 | $ | 703,485 | |||||||||||||||
| Other cost of revenue | 43,739 | 39,263 | 130,311 | 119,017 | |||||||||||||||||||
| Total cost of revenue | $ | 306,866 | $ | 278,077 | $ | 896,468 | $ | 822,502 | |||||||||||||||
| Trupanion, Inc. Condensed Consolidated Balance Sheets (in thousands, except share data) | |||||||||||
| September 30, 2025 | December 31, 2024 | ||||||||||
| (unaudited) | |||||||||||
| Assets | |||||||||||
| Current assets: | |||||||||||
| Cash and cash equivalents | $ | 154,773 | $ | 160,295 | |||||||
| Short-term investments | 193,761 | 147,089 | |||||||||
Accounts and other receivables, net of allowance for credit losses of $1,595 at September 30, 2025 and $1,117 at December 31, 2024 | 302,534 | 274,031 | |||||||||
| Prepaid expenses and other assets | 16,963 | 15,912 | |||||||||
| Total current assets | 668,031 | 597,327 | |||||||||
| Restricted cash | 34,136 | 39,235 | |||||||||
| Long-term investments | 981 | 373 | |||||||||
| Property, equipment, and internal-use software, net | 104,683 | 102,191 | |||||||||
| Intangible assets, net | 24,772 | 13,177 | |||||||||
| Other long-term assets | 7,186 | 17,579 | |||||||||
| Goodwill | 40,384 | 36,971 | |||||||||
| Total assets | $ | 880,173 | $ | 806,853 | |||||||
| Liabilities and stockholders’ equity | |||||||||||
| Current liabilities: | |||||||||||
| Accounts payable | $ | 12,760 | $ | 11,532 | |||||||
| Accrued liabilities and other current liabilities | 43,577 | 33,469 | |||||||||
| Reserve for veterinary invoices | 53,972 | 51,635 | |||||||||
| Deferred revenue | 279,713 | 251,640 | |||||||||
| Long-term debt - current portion | 750 | 1,350 | |||||||||
| Total current liabilities | 390,772 | 349,626 | |||||||||
| Long-term debt | 113,790 | 127,537 | |||||||||
| Deferred tax liabilities | 2,252 | 1,946 | |||||||||
| Other liabilities | 4,797 | 4,476 | |||||||||
| Total liabilities | 511,611 | 483,585 | |||||||||
| Stockholders’ equity: | |||||||||||
Common stock: $0.00001 par value per share, 100,000,000 shares authorized; 44,220,625 and 43,192,339 issued and outstanding at September 30, 2025; 43,516,631 and 42,488,445 shares issued and outstanding at December 31, 2024 | — | — | |||||||||
| Preferred stock: $0.00001 par value per share, 10,000,000 shares authorized; no shares issued and outstanding | — | — | |||||||||
| Additional paid-in capital | 595,802 | 568,302 | |||||||||
| Accumulated other comprehensive income (loss) | 1,379 | (2,612) | |||||||||
| Accumulated deficit | (212,085) | (225,888) | |||||||||
Treasury stock, at cost: 1,028,186 shares at September 30, 2025 and December 31, 2024 | (16,534) | (16,534) | |||||||||
| Total stockholders’ equity | 368,562 | 323,268 | |||||||||
| Total liabilities and stockholders’ equity | $ | 880,173 | $ | 806,853 | |||||||
| Trupanion, Inc. Condensed Consolidated Statements of Cash Flows (in thousands) | |||||||||||||||||||||||
| Three Months Ended September 30, | Nine Months Ended September 30, | ||||||||||||||||||||||
| 2025 | 2024 | 2025 | 2024 | ||||||||||||||||||||
| (unaudited) | |||||||||||||||||||||||
| Operating activities | |||||||||||||||||||||||
| Net income (loss) | $ | 5,873 | $ | 1,425 | $ | 13,803 | $ | (11,289) | |||||||||||||||
| Adjustments to reconcile net income (loss) to cash provided by operating activities: | |||||||||||||||||||||||
| Depreciation and amortization | 4,051 | 4,381 | 11,804 | 12,542 | |||||||||||||||||||
| Stock-based compensation expense | 9,499 | 8,341 | 28,785 | 25,138 | |||||||||||||||||||
| Realized gain on nonmonetary exchange of preferred stock investment | — | — | (7,783) | — | |||||||||||||||||||
| Other, net | 215 | (136) | 1,164 | (453) | |||||||||||||||||||
| Changes in operating assets and liabilities: | |||||||||||||||||||||||
| Accounts and other receivables | (9,912) | (3,794) | (27,927) | (22,020) | |||||||||||||||||||
| Prepaid expenses and other assets | 44 | 101 | (540) | 2,398 | |||||||||||||||||||
| Accounts payable, accrued liabilities, and other liabilities | 10,026 | 1,377 | 11,017 | (350) | |||||||||||||||||||
| Reserve for veterinary invoices | 1,538 | (3,934) | 2,235 | (6,469) | |||||||||||||||||||
| Deferred revenue | 7,904 | 7,535 | 27,668 | 25,088 | |||||||||||||||||||
| Net cash provided by operating activities | 29,238 | 15,296 | 60,226 | 24,585 | |||||||||||||||||||
| Investing activities | |||||||||||||||||||||||
| Purchases of investment securities | (41,020) | (26,125) | (183,021) | (107,375) | |||||||||||||||||||
| Maturities and sales of investment securities | 43,563 | 26,089 | 137,827 | 81,767 | |||||||||||||||||||
| Purchases of property, equipment, and internal-use software | (5,302) | (1,914) | (10,206) | (7,858) | |||||||||||||||||||
| Other | 437 | 490 | 1,639 | 1,552 | |||||||||||||||||||
| Net cash used in investing activities | (2,322) | (1,460) | (53,761) | (31,914) | |||||||||||||||||||
| Financing activities | |||||||||||||||||||||||
| Repayment of debt financing | (188) | (338) | (15,713) | (1,013) | |||||||||||||||||||
| Proceeds from exercise of stock options | 80 | 258 | 1,407 | 729 | |||||||||||||||||||
| Shares withheld to satisfy tax withholding | (1,179) | (802) | (2,867) | (1,390) | |||||||||||||||||||
| Other | (154) | (157) | (614) | (609) | |||||||||||||||||||
| Net cash used in financing activities | (1,441) | (1,039) | (17,787) | (2,283) | |||||||||||||||||||
| Effect of foreign exchange rate changes on cash, cash equivalents, and restricted cash, net | (1,037) | 481 | 701 | 19 | |||||||||||||||||||
| Net change in cash, cash equivalents, and restricted cash | 24,438 | 13,278 | (10,621) | (9,593) | |||||||||||||||||||
| Cash, cash equivalents, and restricted cash at beginning of period | 164,471 | 147,593 | 199,530 | 170,464 | |||||||||||||||||||
| Cash, cash equivalents, and restricted cash at end of period | $ | 188,909 | $ | 160,871 | $ | 188,909 | $ | 160,871 | |||||||||||||||
| The following tables set forth our key operating metrics. | |||||||||||||||||||||||||||||||||||||||||||||||
Nine Months Ended September 30, | |||||||||||||||||||||||||||||||||||||||||||||||
| 2025 | 2024 | ||||||||||||||||||||||||||||||||||||||||||||||
| Total Business: | |||||||||||||||||||||||||||||||||||||||||||||||
| Total pets enrolled (at period end) | 1,654,414 | 1,688,903 | |||||||||||||||||||||||||||||||||||||||||||||
| Subscription Business: | |||||||||||||||||||||||||||||||||||||||||||||||
| Total subscription pets enrolled (at period end) | 1,082,412 | 1,032,042 | |||||||||||||||||||||||||||||||||||||||||||||
| Monthly average revenue per pet | $ | 79.84 | $ | 71.94 | |||||||||||||||||||||||||||||||||||||||||||
| Average pet acquisition cost (PAC) | $ | 278 | $ | 227 | |||||||||||||||||||||||||||||||||||||||||||
| Average monthly retention | 98.33 | % | 98.29 | % | |||||||||||||||||||||||||||||||||||||||||||
| Three Months Ended | |||||||||||||||||||||||||||||||||||||||||||||||
| Sep. 30, 2025 | Jun. 30, 2025 | Mar. 31, 2025 | Dec. 31, 2024 | Sep. 30, 2024 | Jun. 30, 2024 | Mar. 31, 2024 | Dec. 31, 2023 | ||||||||||||||||||||||||||||||||||||||||
| Total Business: | |||||||||||||||||||||||||||||||||||||||||||||||
| Total pets enrolled (at period end) | 1,654,414 | 1,660,455 | 1,667,637 | 1,677,570 | 1,688,903 | 1,699,643 | 1,708,017 | 1,714,473 | |||||||||||||||||||||||||||||||||||||||
| Subscription Business: | |||||||||||||||||||||||||||||||||||||||||||||||
| Total subscription pets enrolled (at period end) | 1,082,412 | 1,066,354 | 1,052,845 | 1,041,212 | 1,032,042 | 1,020,934 | 1,006,168 | 991,426 | |||||||||||||||||||||||||||||||||||||||
| Monthly average revenue per pet | $ | 82.01 | $ | 79.93 | $ | 77.53 | $ | 76.02 | $ | 74.27 | $ | 71.72 | $ | 69.79 | $ | 67.07 | |||||||||||||||||||||||||||||||
| Average pet acquisition cost (PAC) | $ | 290 | $ | 276 | $ | 267 | $ | 261 | $ | 243 | $ | 231 | $ | 207 | $ | 217 | |||||||||||||||||||||||||||||||
| Average monthly retention | 98.33 | % | 98.29 | % | 98.28 | % | 98.25 | % | 98.29 | % | 98.34 | % | 98.41 | % | 98.49 | % | |||||||||||||||||||||||||||||||
| The following table reflects the reconciliation of cash provided by operating activities to free cash flow (in thousands): | |||||||||||||||||||||||
Three Months Ended September 30, | Nine Months Ended September 30, | ||||||||||||||||||||||
| 2025 | 2024 | 2025 | 2024 | ||||||||||||||||||||
| Net cash provided by operating activities | $ | 29,238 | $ | 15,296 | $ | 60,226 | $ | 24,585 | |||||||||||||||
| Purchases of property, equipment, and internal-use software | (5,302) | (1,914) | (10,206) | (7,858) | |||||||||||||||||||
| Free cash flow | $ | 23,936 | $ | 13,382 | $ | 50,020 | $ | 16,727 | |||||||||||||||
| The following tables reflect the reconciliation between GAAP and non-GAAP measures (in thousands except percentages): | ||||||||||||||||||||||||||
Three Months Ended September 30, | Nine Months Ended September 30, | |||||||||||||||||||||||||
| 2025 | 2024 | 2025 | 2024 | |||||||||||||||||||||||
| Veterinary invoice expense | $ | 263,127 | $ | 238,814 | $ | 766,157 | $ | 703,485 | ||||||||||||||||||
| Less: | ||||||||||||||||||||||||||
Stock-based compensation expense(1) | (666) | (830) | (2,188) | (2,535) | ||||||||||||||||||||||
Other business cost of paying veterinary invoices(2) | (85,394) | (82,507) | (247,369) | (239,342) | ||||||||||||||||||||||
| Subscription cost of paying veterinary invoices (non-GAAP) | $ | 177,067 | $ | 155,477 | $ | 516,600 | $ | 461,608 | ||||||||||||||||||
| % of subscription revenue | 70.1 | % | 71.0 | % | 71.0 | % | 73.4 | % | ||||||||||||||||||
| Other cost of revenue | $ | 43,739 | $ | 39,263 | $ | 130,311 | $ | 119,017 | ||||||||||||||||||
| Less: | ||||||||||||||||||||||||||
Stock-based compensation expense(1) | (579) | (536) | (1,661) | (1,479) | ||||||||||||||||||||||
Other business variable expenses(2) | (20,702) | (18,126) | (62,969) | (57,713) | ||||||||||||||||||||||
| Subscription variable expenses (non-GAAP) | $ | 22,458 | $ | 20,601 | $ | 65,681 | $ | 59,825 | ||||||||||||||||||
| % of subscription revenue | 8.9 | % | 9.4 | % | 9.0 | % | 9.5 | % | ||||||||||||||||||
| Technology and development expense | $ | 9,887 | $ | 7,933 | $ | 26,545 | $ | 23,083 | ||||||||||||||||||
| General and administrative expense | 18,311 | 16,977 | 58,325 | 46,903 | ||||||||||||||||||||||
| Less: | ||||||||||||||||||||||||||
Stock-based compensation expense(1) | (6,551) | (5,258) | (18,340) | (14,465) | ||||||||||||||||||||||
Development expenses(3) | (1,199) | (1,474) | (3,551) | (4,307) | ||||||||||||||||||||||
| Fixed expenses (non-GAAP) | $ | 20,448 | $ | 18,178 | $ | 62,979 | $ | 51,214 | ||||||||||||||||||
| % of total revenue | 5.6 | % | 5.6 | % | 5.9 | % | 5.4 | % | ||||||||||||||||||
| New pet acquisition expense | $ | 21,946 | $ | 18,308 | $ | 62,305 | $ | 53,025 | ||||||||||||||||||
| Less: | ||||||||||||||||||||||||||
Stock-based compensation expense(1) | (1,527) | (1,503) | (5,916) | (5,426) | ||||||||||||||||||||||
Other business pet acquisition expense(2) | (5) | (8) | (82) | (31) | ||||||||||||||||||||||
| Subscription acquisition cost (non-GAAP) | $ | 20,414 | $ | 16,797 | $ | 56,307 | $ | 47,568 | ||||||||||||||||||
| % of subscription revenue | 8.1 | % | 7.7 | % | 7.7 | % | 7.6 | % | ||||||||||||||||||
(1) Trupanion employees may elect to take restricted stock units in lieu of cash payment for their bonuses. We account for such expense as stock-based compensation according to GAAP, but we do not include it in any non-GAAP adjustments. Stock-based compensation associated with bonuses was approximately $0.2 million and $0.7 million for the three and nine months ended September 30, 2025, respectively. (2) Excludes the portion of stock-based compensation expense attributable to the other business segment (3) Consists of costs related to product exploration and development that are pre-revenue and historically have been insignificant. | ||||||||||||||||||||||||||
| The following tables reflect the reconciliation of GAAP measures to non-GAAP measures (in thousands, except percentages): | |||||||||||||||||||||||
Three Months Ended September 30, | Nine Months Ended September 30, | ||||||||||||||||||||||
| 2025 | 2024 | 2025 | 2024 | ||||||||||||||||||||
| Operating income (loss) | $ | 5,859 | $ | 1,746 | $ | 6,700 | $ | (9,862) | |||||||||||||||
| Non-GAAP expense adjustments | |||||||||||||||||||||||
| Acquisition cost | 20,419 | 16,805 | 56,389 | 47,599 | |||||||||||||||||||
Stock-based compensation expense(1) | 9,323 | 8,127 | 28,105 | 23,905 | |||||||||||||||||||
Development expenses(2) | 1,199 | 1,474 | 3,551 | 4,307 | |||||||||||||||||||
| Depreciation and amortization | 4,051 | 4,381 | 11,804 | 12,542 | |||||||||||||||||||
| Loss from investment in joint venture | — | (34) | (305) | (184) | |||||||||||||||||||
| Total adjusted operating income (non-GAAP) | $ | 40,851 | $ | 32,567 | $ | 106,854 | $ | 78,675 | |||||||||||||||
| Subscription Business: | |||||||||||||||||||||||
| Subscription operating income (loss) | $ | 7,826 | $ | 3,824 | $ | 13,410 | $ | (4,109) | |||||||||||||||
| Non-GAAP expense adjustments | |||||||||||||||||||||||
| Acquisition cost | 20,414 | 16,797 | 56,307 | 47,568 | |||||||||||||||||||
Stock-based compensation expense(1) | 7,234 | 6,215 | 22,250 | 18,723 | |||||||||||||||||||
Development expenses(2) | 826 | 986 | 2,433 | 2,855 | |||||||||||||||||||
| Depreciation and amortization | 2,790 | 2,929 | 8,087 | 8,315 | |||||||||||||||||||
| Subscription adjusted operating income (non-GAAP) | $ | 39,090 | $ | 30,751 | $ | 102,487 | $ | 73,352 | |||||||||||||||
| Other Business: | |||||||||||||||||||||||
| Other business operating loss | $ | (1,967) | $ | (2,044) | $ | (6,405) | $ | (5,569) | |||||||||||||||
| Non-GAAP expense adjustments | |||||||||||||||||||||||
| Acquisition cost | 5 | 8 | 82 | 31 | |||||||||||||||||||
Stock-based compensation expense(1) | 2,089 | 1,912 | 5,855 | 5,182 | |||||||||||||||||||
Development expenses(2) | 373 | 488 | 1,118 | 1,452 | |||||||||||||||||||
| Depreciation and amortization | 1,261 | 1,452 | 3,717 | 4,227 | |||||||||||||||||||
| Other business adjusted operating income (non-GAAP) | $ | 1,761 | $ | 1,816 | $ | 4,367 | $ | 5,323 | |||||||||||||||
(1) Trupanion employees may elect to take restricted stock units in lieu of cash payment for their bonuses. We account for such expense as stock-based compensation in accordance with GAAP, but we do not include it in any non-GAAP adjustments. Stock-based compensation associated with bonuses was approximately $0.2 million and $0.7 million for the three and nine months ended September 30, 2025, respectively. | |||||||||||||||||||||||
(2) Consists of costs related to product exploration and development that are pre-revenue and historically have been insignificant. | |||||||||||||||||||||||
| The following tables reflect the reconciliation of GAAP measures to non-GAAP measures (in thousands, except percentages): | |||||||||||||||||||||||||||||
Three Months Ended September 30, | Nine Months Ended September 30, | ||||||||||||||||||||||||||||
| 2025 | 2024 | 2025 | 2024 | ||||||||||||||||||||||||||
| Subscription revenue | $ | 252,697 | $ | 218,986 | $ | 727,917 | $ | 628,738 | |||||||||||||||||||||
| Subscription cost of paying veterinary invoices | 177,067 | 155,477 | 516,600 | 461,608 | |||||||||||||||||||||||||
| Subscription variable expenses | 22,458 | 20,601 | 65,681 | 59,825 | |||||||||||||||||||||||||
| Subscription fixed expenses* | 14,082 | 12,157 | 43,149 | 33,953 | |||||||||||||||||||||||||
| Subscription adjusted operating income (non-GAAP) | $ | 39,090 | $ | 30,751 | $ | 102,487 | $ | 73,352 | |||||||||||||||||||||
| Other business revenue | $ | 114,223 | 108,470 | $ | 334,535 | $ | 319,639 | ||||||||||||||||||||||
| Other business cost of paying veterinary invoices | 85,394 | 82,507 | 247,369 | 239,342 | |||||||||||||||||||||||||
| Other business variable expenses | 20,702 | 18,126 | 62,969 | 57,713 | |||||||||||||||||||||||||
| Other business fixed expenses* | 6,366 | 6,021 | 19,830 | 17,261 | |||||||||||||||||||||||||
| Other business adjusted operating income (non-GAAP) | $ | 1,761 | $ | 1,816 | $ | 4,367 | $ | 5,323 | |||||||||||||||||||||
| Revenue | $ | 366,920 | $ | 327,456 | $ | 1,062,452 | $ | 948,377 | |||||||||||||||||||||
| Cost of paying veterinary invoices | 262,461 | 237,984 | 763,969 | 700,950 | |||||||||||||||||||||||||
| Variable expenses | 43,160 | 38,727 | 128,650 | 117,538 | |||||||||||||||||||||||||
| Fixed expenses* | 20,448 | 18,178 | 62,979 | 51,214 | |||||||||||||||||||||||||
| Total business adjusted operating income (non-GAAP) | $ | 40,851 | $ | 32,567 | $ | 106,854 | $ | 78,675 | |||||||||||||||||||||
| As a percentage of revenue: | Three Months Ended September 30, | Nine Months Ended September 30, | |||||||||||||||||||||||||||
| 2025 | 2024 | 2025 | 2024 | ||||||||||||||||||||||||||
| Subscription revenue | 100.0 | % | 100.0 | % | 100.0 | % | 100.0 | % | |||||||||||||||||||||
| Subscription cost of paying veterinary invoices | 70.1 | % | 71.0 | % | 71.0 | % | 73.4 | % | |||||||||||||||||||||
| Subscription variable expenses | 8.9 | % | 9.4 | % | 9.0 | % | 9.5 | % | |||||||||||||||||||||
| Subscription fixed expenses* | 5.6 | % | 5.6 | % | 5.9 | % | 5.4 | % | |||||||||||||||||||||
| Subscription adjusted operating income (non-GAAP) | 15.5 | % | 14.0 | % | 14.1 | % | 11.7 | % | |||||||||||||||||||||
| Other business revenue | 100.0 | % | 100.0 | % | 100.0 | % | 100.0 | % | |||||||||||||||||||||
| Other business cost of paying veterinary invoices | 74.8 | % | 76.1 | % | 73.9 | % | 74.9 | % | |||||||||||||||||||||
| Other business variable expenses | 18.1 | % | 16.7 | % | 18.8 | % | 18.1 | % | |||||||||||||||||||||
| Other business fixed expenses* | 5.6 | % | 5.6 | % | 5.9 | % | 5.4 | % | |||||||||||||||||||||
| Other business adjusted operating income (non-GAAP) | 1.5 | % | 1.7 | % | 1.3 | % | 1.7 | % | |||||||||||||||||||||
| Revenue | 100.0 | % | 100.0 | % | 100.0 | % | 100.0 | % | |||||||||||||||||||||
| Cost of paying veterinary invoices | 71.5 | % | 72.7 | % | 71.9 | % | 73.9 | % | |||||||||||||||||||||
| Variable expenses | 11.8 | % | 11.8 | % | 12.1 | % | 12.4 | % | |||||||||||||||||||||
| Fixed expenses* | 5.6 | % | 5.6 | % | 5.9 | % | 5.4 | % | |||||||||||||||||||||
| Total business adjusted operating income (non-GAAP) | 11.1 | % | 9.9 | % | 10.1 | % | 8.3 | % | |||||||||||||||||||||
*Fixed expenses represent shared services that support both our subscription and other business segments and, as such, are generally allocated to each segment pro-rata based on revenues. | |||||||||||||||||||||||||||||
| The following tables reflect the reconciliation of adjusted EBITDA to net income (loss) (in thousands): | |||||||||||||||||||||||||||||||||||||||||||||||
Nine Months Ended September 30, | |||||||||||||||||||||||||||||||||||||||||||||||
| 2025 | 2024 | ||||||||||||||||||||||||||||||||||||||||||||||
| Net income (loss) | $ | 13,803 | $ | (11,289) | |||||||||||||||||||||||||||||||||||||||||||
| Excluding: | |||||||||||||||||||||||||||||||||||||||||||||||
Stock-based compensation expense(1) | 28,105 | 23,906 | |||||||||||||||||||||||||||||||||||||||||||||
| Depreciation and amortization expense | 11,804 | 12,542 | |||||||||||||||||||||||||||||||||||||||||||||
| Interest income | (9,141) | (9,412) | |||||||||||||||||||||||||||||||||||||||||||||
| Interest expense | 9,683 | 11,071 | |||||||||||||||||||||||||||||||||||||||||||||
| Income tax (benefit) expense | 1,898 | (43) | |||||||||||||||||||||||||||||||||||||||||||||
| Loss from equity method investment | — | (33) | |||||||||||||||||||||||||||||||||||||||||||||
| Realized gain on nonmonetary exchange of preferred stock investment | (7,783) | — | |||||||||||||||||||||||||||||||||||||||||||||
| Adjusted EBITDA | $ | 48,369 | $ | 26,742 | |||||||||||||||||||||||||||||||||||||||||||
| Three Months Ended | |||||||||||||||||||||||||||||||||||||||||||||||
| Sep. 30, 2025 | Jun. 30, 2025 | Mar. 31, 2025 | Dec. 31, 2024 | Sep. 30, 2024 | Jun. 30, 2024 | Mar. 31, 2024 | Dec. 31, 2023 | ||||||||||||||||||||||||||||||||||||||||
| Net income (loss) | $ | 5,873 | $ | 9,413 | $ | (1,483) | $ | 1,656 | $ | 1,425 | $ | (5,862) | $ | (6,852) | $ | (2,163) | |||||||||||||||||||||||||||||||
| Excluding: | |||||||||||||||||||||||||||||||||||||||||||||||
Stock-based compensation expense(1) | 9,323 | 9,268 | 9,514 | 8,036 | 8,127 | 8,381 | 7,398 | 6,636 | |||||||||||||||||||||||||||||||||||||||
| Depreciation and amortization expense | 4,051 | 3,962 | 3,791 | 3,924 | 4,381 | 4,376 | 3,785 | 3,029 | |||||||||||||||||||||||||||||||||||||||
| Interest income | (3,201) | (3,105) | (2,835) | (2,999) | (3,232) | (3,135) | (3,045) | (2,842) | |||||||||||||||||||||||||||||||||||||||
| Interest expense | 2,790 | 3,682 | 3,211 | 3,427 | 3,820 | 3,655 | 3,596 | 3,697 | |||||||||||||||||||||||||||||||||||||||
| Income tax (benefit) expense | 726 | 1,133 | 39 | 38 | 39 | (44) | (38) | 130 | |||||||||||||||||||||||||||||||||||||||
| Goodwill impairment charges | — | — | — | 5,299 | — | — | — | — | |||||||||||||||||||||||||||||||||||||||
| Loss from equity method investment | — | — | — | — | (33) | — | — | — | |||||||||||||||||||||||||||||||||||||||
| Realized gain on nonmonetary exchange of preferred stock investment | — | (7,783) | — | — | — | — | — | — | |||||||||||||||||||||||||||||||||||||||
| Adjusted EBITDA | $ | 19,562 | $ | 16,570 | $ | 12,237 | $ | 19,381 | $ | 14,527 | $ | 7,371 | $ | 4,844 | $ | 8,487 | |||||||||||||||||||||||||||||||
(1) Trupanion employees may elect to take restricted stock units in lieu of cash payment for their bonuses. We account for such expense as stock-based compensation according to GAAP, but we do not include it in any non-GAAP adjustments. Stock-based compensation associated with bonuses was approximately $0.2 million and $0.7 million for the three and nine months ended September 30, 2025, respectively. | |||||||||||||||||||||||||||||||||||||||||||||||