
| Trupanion, Inc. Condensed Consolidated Statements of Operations (in thousands, except share data) | |||||||||||||||||||||||
| Three Months Ended December 31, | Year Ended December 31, | ||||||||||||||||||||||
| 2025 | 2024 | 2025 | 2024 | ||||||||||||||||||||
| (unaudited) | |||||||||||||||||||||||
| Revenue: | |||||||||||||||||||||||
| Subscription business | $ | 261,422 | $ | 227,783 | $ | 989,338 | $ | 856,521 | |||||||||||||||
| Other business | 115,431 | 109,524 | 449,967 | 429,163 | |||||||||||||||||||
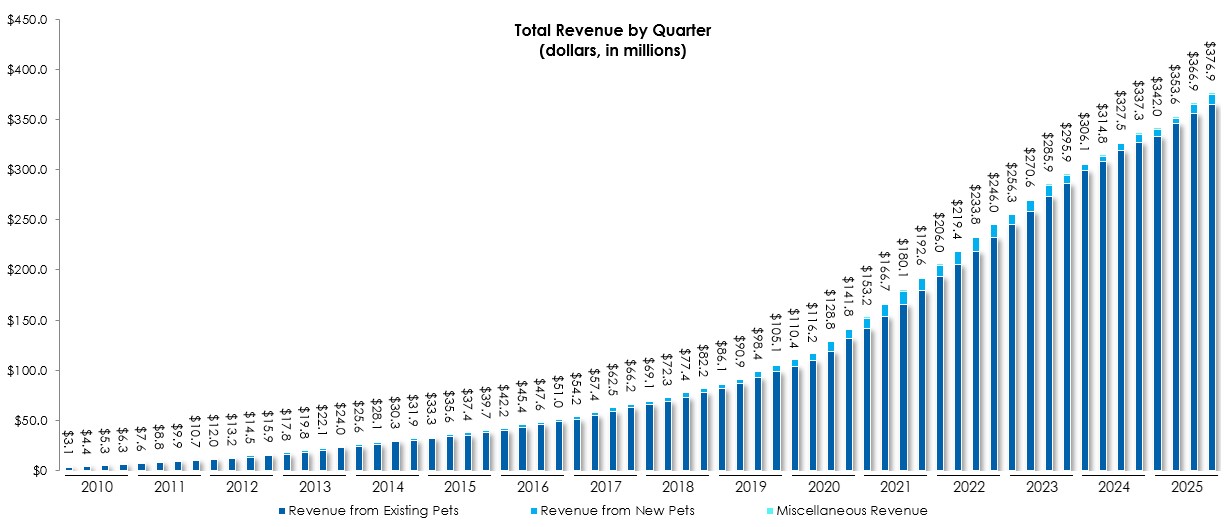
| Total revenue | 376,853 | 337,307 | 1,439,305 | 1,285,684 | |||||||||||||||||||
| Cost of revenue: | |||||||||||||||||||||||
Subscription business(1) | 204,782 | 181,614 | 790,880 | 706,851 | |||||||||||||||||||
| Other business | 107,044 | 102,770 | 417,414 | 400,035 | |||||||||||||||||||
Total cost of revenue(1), (2) | 311,826 | 284,384 | 1,208,294 | 1,106,886 | |||||||||||||||||||
| Operating expenses: | |||||||||||||||||||||||
Technology and development(1) | 11,303 | 8,172 | 37,848 | 31,255 | |||||||||||||||||||
General and administrative(1) | 18,323 | 16,828 | 76,648 | 63,731 | |||||||||||||||||||
Sales and marketing(1) | 23,103 | 18,354 | 85,408 | 71,379 | |||||||||||||||||||
| Goodwill impairment charges | 1,129 | 5,299 | 1,129 | 5,299 | |||||||||||||||||||
| Depreciation and amortization | 4,032 | 3,924 | 15,836 | 16,466 | |||||||||||||||||||
| Total operating expenses | 57,890 | 52,577 | 216,869 | 188,130 | |||||||||||||||||||
| Gain (loss) from investment in joint venture | — | 2 | (305) | (182) | |||||||||||||||||||
| Operating income (loss) | 7,137 | 348 | 13,837 | (9,514) | |||||||||||||||||||
| Interest expense | 4,076 | 3,427 | 13,759 | 14,498 | |||||||||||||||||||
| Other (income), net | (3,232) | (4,773) | (21,916) | (14,374) | |||||||||||||||||||
| Income (loss) before income taxes | 6,293 | 1,694 | 21,994 | (9,638) | |||||||||||||||||||
| Income tax expense (benefit) | 663 | 38 | 2,561 | (5) | |||||||||||||||||||
| Net income (loss) | $ | 5,630 | $ | 1,656 | $ | 19,433 | $ | (9,633) | |||||||||||||||
| Net income (loss) per share: | |||||||||||||||||||||||
| Basic | $ | 0.13 | $ | 0.04 | $ | 0.45 | $ | (0.23) | |||||||||||||||
| Diluted | $ | 0.13 | $ | 0.04 | $ | 0.45 | $ | (0.23) | |||||||||||||||
| Weighted average shares of common stock outstanding: | |||||||||||||||||||||||
| Basic | 42,281,757 | 42,402,323 | 42,958,654 | 42,158,773 | |||||||||||||||||||
| Diluted | 43,572,375 | 42,903,536 | 43,555,884 | 42,158,773 | |||||||||||||||||||
(1) Includes stock-based compensation expense as follows: | Three Months Ended December 31, | Year Ended December 31, | |||||||||||||||||||||
| 2025 | 2024 | 2025 | 2024 | ||||||||||||||||||||
| Veterinary invoice expense | $ | 620 | $ | 677 | $ | 2,841 | $ | 3,460 | |||||||||||||||
| Other cost of revenue | 605 | 585 | 2,284 | 2,063 | |||||||||||||||||||
| Technology and development | 1,710 | 1,705 | 6,036 | 7,279 | |||||||||||||||||||
| General and administrative | 5,025 | 4,971 | 19,571 | 4,934 | |||||||||||||||||||
| New pet acquisition expense | 1,567 | 1,561 | 7,580 | 15,696 | |||||||||||||||||||
| Total stock-based compensation expense | $ | 9,527 | $ | 9,499 | $ | 38,312 | $ | 33,432 | |||||||||||||||
(2) The breakout of cost of revenue between veterinary invoice expense and other cost of revenue is as follows: | |||||||||||||||||||||||
| Three Months Ended December 31, | Year Ended December 31, | ||||||||||||||||||||||
| 2025 | 2024 | 2025 | 2024 | ||||||||||||||||||||
| Veterinary invoice expense | $ | 262,818 | $ | 245,663 | $ | 1,028,975 | $ | 949,148 | |||||||||||||||
| Other cost of revenue | 49,008 | 38,721 | 179,319 | 157,738 | |||||||||||||||||||
| Total cost of revenue | $ | 311,826 | $ | 284,384 | $ | 1,208,294 | $ | 1,106,886 | |||||||||||||||
| Trupanion, Inc. Condensed Consolidated Balance Sheets (in thousands, except share data) | |||||||||||
| December 31, 2025 | December 31, 2024 | ||||||||||
| (unaudited) | |||||||||||
| Assets | |||||||||||
| Current assets: | |||||||||||
| Cash and cash equivalents | $ | 138,024 | $ | 160,295 | |||||||
| Short-term investments | 232,706 | 147,089 | |||||||||
| Accounts and other receivables, net of allowance for doubtful accounts of $1,311 at December 31, 2025 and $1,117 at December 31, 2024 | 301,945 | 274,031 | |||||||||
| Prepaid expenses and other assets | 18,387 | 15,912 | |||||||||
| Total current assets | 691,062 | 597,327 | |||||||||
| Restricted cash | 33,434 | 39,235 | |||||||||
| Long-term investments | 983 | 373 | |||||||||
| Property, equipment, and internal-use software, net | 104,844 | 102,191 | |||||||||
| Other long-term assets | 21,237 | 17,579 | |||||||||
| Intangible assets, net | 24,102 | 13,177 | |||||||||
| Goodwill | 39,382 | 36,971 | |||||||||
| Total assets | $ | 915,044 | $ | 806,853 | |||||||
| Liabilities and stockholders’ equity | |||||||||||
| Current liabilities: | |||||||||||
| Accounts payable | $ | 16,445 | $ | 11,532 | |||||||
| Accrued liabilities and other current liabilities | 56,509 | 33,469 | |||||||||
| Reserve for veterinary invoices | 55,921 | 51,635 | |||||||||
| Deferred revenue | 270,935 | 251,640 | |||||||||
| Long-term debt - current portion | 10,000 | 1,350 | |||||||||
| Total current liabilities | 409,810 | 349,626 | |||||||||
| Long-term debt | 101,784 | 127,537 | |||||||||
| Deferred tax liabilities | 1,510 | 1,946 | |||||||||
| Other liabilities | 18,004 | 4,476 | |||||||||
| Total liabilities | 531,108 | 483,585 | |||||||||
| Stockholders’ equity: | |||||||||||
| Common stock: $0.00001 par value per share, 100,000,000 shares authorized; 44,430,267 and 43,402,081 shares issued and outstanding at December 31, 2025; 43,516,631 and 42,488,455 shares issued and outstanding at December 31, 2024 | — | — | |||||||||
| Preferred stock: $0.00001 par value per share, 10,000,000 shares authorized; no shares issued and outstanding | — | — | |||||||||
| Additional paid-in capital | 604,828 | 568,302 | |||||||||
| Accumulated other comprehensive income (loss) | 2,097 | (2,612) | |||||||||
| Accumulated deficit | (206,455) | (225,888) | |||||||||
| Treasury stock, at cost: 1,028,186 shares at December 31, 2025 and 2024 | (16,534) | (16,534) | |||||||||
| Total stockholders’ equity | 383,936 | 323,268 | |||||||||
| Total liabilities and stockholders’ equity | $ | 915,044 | $ | 806,853 | |||||||
| Trupanion, Inc. Condensed Consolidated Statements of Cash Flows (in thousands) | |||||||||||||||||||||||
| Three Months Ended December 31, | Year Ended December 31, | ||||||||||||||||||||||
| 2025 | 2024 | 2025 | 2024 | ||||||||||||||||||||
| (unaudited) | |||||||||||||||||||||||
| Operating activities | |||||||||||||||||||||||
| Net income (loss) | $ | 5,631 | $ | 1,656 | $ | 19,433 | $ | (9,633) | |||||||||||||||
| Adjustments to reconcile net income (loss) to cash provided by operating activities: | |||||||||||||||||||||||
| Depreciation and amortization | 4,032 | 3,924 | 15,836 | 16,466 | |||||||||||||||||||
| Stock-based compensation expense | 9,527 | 8,294 | 38,312 | 33,432 | |||||||||||||||||||
| Realized gain on nonmonetary exchange of preferred stock investment | — | — | (7,783) | — | |||||||||||||||||||
| Goodwill impairment charges | 1,129 | 5,299 | 1,129 | 5,299 | |||||||||||||||||||
| Other, net | 934 | (1,294) | 2,097 | (1,748) | |||||||||||||||||||
| Changes in operating assets and liabilities: | |||||||||||||||||||||||
| Accounts and other receivables | 715 | 15,303 | (27,211) | (6,717) | |||||||||||||||||||
| Prepaid expenses and other assets | (626) | 817 | (1,166) | 3,215 | |||||||||||||||||||
| Accounts payable, accrued liabilities, and other liabilities | 15,012 | 2,433 | 26,029 | 2,084 | |||||||||||||||||||
| Reserve for veterinary invoices | 1,898 | (4,841) | 4,133 | (11,310) | |||||||||||||||||||
| Deferred revenue | (8,989) | (7,890) | 18,679 | 17,199 | |||||||||||||||||||
| Net cash provided by operating activities | 29,263 | 23,701 | 89,488 | 48,287 | |||||||||||||||||||
| Investing activities | |||||||||||||||||||||||
| Purchases of investment securities | (73,011) | (26,118) | (256,031) | (133,493) | |||||||||||||||||||
| Maturities and sales of investment securities | 34,782 | 45,886 | 172,609 | 127,653 | |||||||||||||||||||
| Purchases of property, equipment, and internal-use software | (3,923) | (1,858) | (14,129) | (9,716) | |||||||||||||||||||
| Other | 26 | 548 | 1,664 | 2,099 | |||||||||||||||||||
| Net cash provided by (used in) investing activities | (42,126) | 18,458 | (95,887) | (13,457) | |||||||||||||||||||
| Financing activities | |||||||||||||||||||||||
| Proceeds from debt financing, net of financing fees | 114,208 | — | 114,208 | — | |||||||||||||||||||
| Repayment of debt financing | (118,725) | (338) | (134,438) | (1,350) | |||||||||||||||||||
| Proceeds from exercise of stock options | 287 | 36 | 1,694 | 752 | |||||||||||||||||||
| Shares withheld to satisfy tax withholding | (845) | (1,142) | (3,712) | (2,519) | |||||||||||||||||||
| Other | — | (230) | (614) | (840) | |||||||||||||||||||
| Net cash used in financing activities | (5,075) | (1,674) | (22,862) | (3,957) | |||||||||||||||||||
| Effect of foreign exchange rate changes on cash, cash equivalents, and restricted cash, net | 487 | (1,826) | 1,189 | (1,877) | |||||||||||||||||||
| Net change in cash, cash equivalents, and restricted cash | (17,451) | 38,659 | (28,072) | 28,996 | |||||||||||||||||||
| Cash, cash equivalents, and restricted cash at beginning of period | 188,909 | 160,871 | 199,530 | 170,464 | |||||||||||||||||||
| Cash, cash equivalents, and restricted cash at end of period | $ | 171,458 | $ | 199,530 | $ | 171,458 | $ | 199,530 | |||||||||||||||
| The following tables set forth our key operating metrics. | |||||||||||||||||||||||||||||||||||||||||||||||
| Year Ended December 31, | |||||||||||||||||||||||||||||||||||||||||||||||
| 2025 | 2024 | ||||||||||||||||||||||||||||||||||||||||||||||
| Total Business: | |||||||||||||||||||||||||||||||||||||||||||||||
| Total pets enrolled (at period end) | 1,647,565 | 1,677,570 | |||||||||||||||||||||||||||||||||||||||||||||
| Subscription Business: | |||||||||||||||||||||||||||||||||||||||||||||||
| Total subscription pets enrolled (at period end) | 1,096,173 | 1,041,212 | |||||||||||||||||||||||||||||||||||||||||||||
| Monthly average revenue per pet | $ | 80.79 | $ | 72.98 | |||||||||||||||||||||||||||||||||||||||||||
| Average pet acquisition cost (PAC) | $ | 288 | $ | 235 | |||||||||||||||||||||||||||||||||||||||||||
| Average monthly retention | 98.34 | % | 98.25 | % | |||||||||||||||||||||||||||||||||||||||||||
| Three Months Ended | |||||||||||||||||||||||||||||||||||||||||||||||
| Dec. 31, 2025 | Sept. 30, 2025 | Jun. 30, 2025 | Mar. 31, 2025 | Dec. 31, 2024 | Sept. 30, 2024 | Jun. 30, 2024 | Mar. 31, 2024 | ||||||||||||||||||||||||||||||||||||||||
| Total Business: | |||||||||||||||||||||||||||||||||||||||||||||||
| Total pets enrolled (at period end) | 1,647,565 | 1,654,414 | 1,660,455 | 1,667,637 | 1,677,570 | 1,688,903 | 1,699,643 | 1,708,017 | |||||||||||||||||||||||||||||||||||||||
| Subscription Business: | |||||||||||||||||||||||||||||||||||||||||||||||
| Total subscription pets enrolled (at period end) | 1,096,173 | 1,082,412 | 1,066,354 | 1,052,845 | 1,041,212 | 1,032,042 | 1,020,934 | 1,006,168 | |||||||||||||||||||||||||||||||||||||||
| Monthly average revenue per pet | $ | 83.56 | $ | 82.01 | $ | 79.93 | $ | 77.53 | $ | 76.02 | $ | 74.27 | $ | 71.72 | $ | 69.79 | |||||||||||||||||||||||||||||||
| Average pet acquisition cost (PAC) | $ | 320 | $ | 290 | $ | 276 | $ | 267 | $ | 261 | $ | 243 | $ | 231 | $ | 207 | |||||||||||||||||||||||||||||||
| Average monthly retention | 98.34 | % | 98.33 | % | 98.29 | % | 98.28 | % | 98.25 | % | 98.29 | % | 98.34 | % | 98.41 | % | |||||||||||||||||||||||||||||||
| The following table reflects the reconciliation of cash provided by operating activities to free cash flow (in thousands): | |||||||||||||||||||||||
| Three Months Ended December 31, | Year Ended December 31, | ||||||||||||||||||||||
| 2025 | 2024 | 2025 | 2024 | ||||||||||||||||||||
| Net cash provided by operating activities | $ | 29,263 | $ | 23,701 | $ | 89,488 | $ | 48,287 | |||||||||||||||
| Purchases of property and equipment | (3,923) | (1,858) | (14,129) | (9,716) | |||||||||||||||||||
| Free cash flow | $ | 25,340 | $ | 21,843 | $ | 75,359 | $ | 38,571 | |||||||||||||||
| The following table reflects the reconciliation between GAAP and non-GAAP measures (in thousands except percentages): | ||||||||||||||||||||||||||
| Three Months Ended December 31, | Year Ended December 31, | |||||||||||||||||||||||||
| 2025 | 2024 | 2025 | 2024 | |||||||||||||||||||||||
| Veterinary invoice expense | $ | 262,818 | $ | 245,663 | $ | 1,028,975 | $ | 949,148 | ||||||||||||||||||
| Less: | ||||||||||||||||||||||||||
Stock-based compensation expense(1) | (614) | (800) | (2,802) | (3,335) | ||||||||||||||||||||||
Other business cost of paying veterinary invoices(2) | (81,452) | (85,378) | (328,821) | (324,720) | ||||||||||||||||||||||
| Subscription cost of paying veterinary invoices (non-GAAP) | $ | 180,752 | $ | 159,485 | $ | 697,352 | $ | 621,093 | ||||||||||||||||||
| % of subscription revenue | 69.1 | % | 70.0 | % | 70.5 | % | 72.5 | % | ||||||||||||||||||
| Other cost of revenue | $ | 49,008 | $ | 38,721 | $ | 179,319 | $ | 157,738 | ||||||||||||||||||
| Less: | ||||||||||||||||||||||||||
Stock-based compensation expense(1) | (600) | (476) | (2,260) | (1,955) | ||||||||||||||||||||||
Other business variable expenses(2) | (25,589) | (17,336) | (88,558) | (75,050) | ||||||||||||||||||||||
| Subscription variable expenses (non-GAAP) | $ | 22,819 | $ | 20,909 | $ | 88,501 | $ | 80,733 | ||||||||||||||||||
| % of subscription revenue | 8.7 | % | 9.2 | % | 8.9 | % | 9.4 | % | ||||||||||||||||||
| Technology and development expense | $ | 11,303 | $ | 8,172 | $ | 37,848 | $ | 31,255 | ||||||||||||||||||
| General and administrative expense | 18,323 | 16,828 | 76,648 | 63,731 | ||||||||||||||||||||||
| Less: | ||||||||||||||||||||||||||
Stock-based compensation expense(1) | (6,617) | (5,277) | (24,958) | (19,742) | ||||||||||||||||||||||
| Goodwill impairment charges | ||||||||||||||||||||||||||
Development expenses(3) | (1,798) | (1,322) | (5,349) | (5,624) | ||||||||||||||||||||||
| Fixed expenses (non-GAAP) | $ | 21,211 | $ | 18,401 | $ | 84,189 | $ | 69,620 | ||||||||||||||||||
| % of total revenue | 5.6 | % | 5.5 | % | 5.8 | % | 5.4 | % | ||||||||||||||||||
| New pet acquisition expense | $ | 23,103 | $ | 18,354 | $ | 85,408 | $ | 71,379 | ||||||||||||||||||
| Less: | ||||||||||||||||||||||||||
Stock-based compensation expense(1) | (1,530) | (1,482) | (7,446) | (6,908) | ||||||||||||||||||||||
Other business pet acquisition expense(2) | (8) | (8) | (90) | (39) | ||||||||||||||||||||||
| Subscription acquisition cost (non-GAAP) | $ | 21,565 | $ | 16,864 | $ | 77,872 | $ | 64,432 | ||||||||||||||||||
| % of subscription revenue | 8.2 | % | 7.4 | % | 7.9 | % | 7.5 | % | ||||||||||||||||||
(1) Trupanion employees may elect to take restricted stock units in lieu of cash payment for their bonuses. We account for such expense as stock-based compensation in accordance with GAAP, but we do not include it in any non-GAAP adjustments. Stock-based compensation associated with bonuses was approximately $0.2 million and $0.8 million for the three and twelve months ended December 31, 2025 and $0.3 million and $1.5 million for the three and twelve months ended December 31, 2024. | ||||||||||||||||||||||||||
(2) Excludes the portion of stock-based compensation expense attributable to the other business segment. | ||||||||||||||||||||||||||
(3) Consists of Costs related to product exploration and development that are pre-revenue and historically have been insignificant | ||||||||||||||||||||||||||
| The following table reflects the reconciliation of GAAP measures to non-GAAP measures (in thousands, except percentages): | |||||||||||||||||||||||
| Three Months Ended December 31, | Year Ended December 31, | ||||||||||||||||||||||
| 2025 | 2024 | 2025 | 2024 | ||||||||||||||||||||
| Operating income (loss) | $ | 7,137 | $ | 348 | $ | 13,837 | $ | (9,514) | |||||||||||||||
| Non-GAAP expense adjustments | |||||||||||||||||||||||
| Acquisition cost | 21,573 | 16,872 | 77,962 | 64,471 | |||||||||||||||||||
Stock-based compensation expense(1) | 9,361 | 8,035 | 37,466 | 31,940 | |||||||||||||||||||
Development expenses(2) | 1,798 | 1,322 | 5,349 | 5,624 | |||||||||||||||||||
| Depreciation and amortization | 4,032 | 3,924 | 15,836 | 16,466 | |||||||||||||||||||
Goodwill impairment charges | 1,129 | 5,299 | 1,129 | 5,299 | |||||||||||||||||||
| Gain (loss) from investment in joint venture | — | 2 | (305) | (182) | |||||||||||||||||||
| Total adjusted operating income (non-GAAP) | $ | 45,030 | $ | 35,798 | $ | 151,884 | $ | 114,468 | |||||||||||||||
| Subscription Business: | |||||||||||||||||||||||
| Subscription operating income (loss) | $ | 9,068 | $ | 2,955 | $ | 22,473 | $ | (1,118) | |||||||||||||||
| Non-GAAP expense adjustments | |||||||||||||||||||||||
| Acquisition cost | 21,656 | 16,864 | 77,872 | 64,432 | |||||||||||||||||||
Stock-based compensation expense(1) | 7,330 | 6,263 | 29,580 | 24,985 | |||||||||||||||||||
Development expenses(2) | 1,248 | 893 | 3,677 | 3,745 | |||||||||||||||||||
| Depreciation and amortization | 2,797 | 2,650 | 10,885 | 10,970 | |||||||||||||||||||
Goodwill impairment charges | 1,129 | 5,299 | 1,129 | 5,299 | |||||||||||||||||||
| Subscription adjusted operating income (non-GAAP) | $ | 43,137 | $ | 34,964 | $ | 145,616 | $ | 108,313 | |||||||||||||||
| Other Business: | |||||||||||||||||||||||
| Other business operating loss | $ | (1,931) | $ | (2,649) | $ | (8,331) | $ | (8,214) | |||||||||||||||
| Non-GAAP expense adjustments | |||||||||||||||||||||||
| Acquisition cost | $ | 8 | $ | 8 | $ | 90 | $ | 39 | |||||||||||||||
Stock-based compensation expense(1) | 2,031 | 1,772 | 7,886 | 6,955 | |||||||||||||||||||
Development expenses(2) | 550 | 429 | 1,672 | 1,879 | |||||||||||||||||||
| Depreciation and amortization | 1,235 | 1,274 | 4,951 | 5,496 | |||||||||||||||||||
| Other business adjusted operating income (non-GAAP) | $ | 1,893 | $ | 834 | $ | 6,268 | $ | 6,155 | |||||||||||||||
(1) Trupanion employees may elect to take restricted stock units in lieu of cash payment for their bonuses. We account for such expense as stock-based compensation in accordance with GAAP, but we do not include it in any non-GAAP adjustments. Stock-based compensation associated with bonuses was approximately $0.2 million and $0.8 million for the three and twelve months ended December 31, 2025 and $0.3 million and $1.5 million for the three and twelve months ended December 31, 2024. | |||||||||||||||||||||||
(2) Consists of costs related to product exploration and development that are pre-revenue and historically have been insignificant. | |||||||||||||||||||||||
| The following table reflects the reconciliation of GAAP measures to non-GAAP measures (in thousands, except percentages): | |||||||||||||||||||||||
| Three Months Ended December 31, | Year Ended December 31, | ||||||||||||||||||||||
| 2025 | 2024 | 2025 | 2024 | ||||||||||||||||||||
| Subscription revenue | $ | 261,422 | $ | 227,783 | $ | 989,338 | $ | 856,521 | |||||||||||||||
| Subscription cost of paying veterinary invoices | 180,752 | 159,485 | 697,352 | 621,093 | |||||||||||||||||||
| Subscription variable expenses | 22,819 | 20,909 | 88,501 | 80,733 | |||||||||||||||||||
| Subscription fixed expenses* | 14,714 | 12,425 | 57,869 | 46,382 | |||||||||||||||||||
| Subscription adjusted operating income (non-GAAP) | $ | 43,137 | $ | 34,964 | $ | 145,616 | $ | 108,313 | |||||||||||||||
| Other business revenue | 115,431 | 109,524 | 449,967 | 429,163 | |||||||||||||||||||
| Other business cost of paying veterinary invoices | 81,452 | 85,378 | 328,821 | 324,720 | |||||||||||||||||||
| Other business variable expenses | 25,589 | 17,336 | 88,558 | 75,050 | |||||||||||||||||||
| Other business fixed expenses* | 6,497 | 5,976 | 26,320 | 23,238 | |||||||||||||||||||
| Other business adjusted operating income (non-GAAP) | $ | 1,893 | $ | 834 | $ | 6,268 | $ | 6,155 | |||||||||||||||
| Revenue | 376,853 | 337,307 | 1,439,305 | 1,285,684 | |||||||||||||||||||
| Cost of paying veterinary invoices | 262,204 | 244,863 | 1,026,173 | 945,813 | |||||||||||||||||||
| Variable expenses | 48,408 | 38,245 | 177,059 | 155,783 | |||||||||||||||||||
| Fixed expenses* | 21,211 | 18,401 | 84,189 | 69,620 | |||||||||||||||||||
| Total business adjusted operating income (non-GAAP) | $ | 45,030 | $ | 35,798 | $ | 151,884 | $ | 114,468 | |||||||||||||||
| Three Months Ended December 31, | Year Ended December 31, | ||||||||||||||||||||||
| As a percentage of revenue: | |||||||||||||||||||||||
| 2025 | 2024 | 2025 | 2024 | ||||||||||||||||||||
| Subscription revenue | 100.0 | % | 100.0 | % | 100.0 | % | 100.0 | % | |||||||||||||||
| Subscription cost of paying veterinary invoices | 69.1 | % | 70.0 | % | 70.5 | % | 72.5 | % | |||||||||||||||
| Subscription variable expenses | 8.7 | % | 9.2 | % | 8.9 | % | 9.4 | % | |||||||||||||||
| Subscription fixed expenses* | 5.6 | % | 5.5 | % | 5.8 | % | 5.4 | % | |||||||||||||||
| Subscription adjusted operating income (non-GAAP) | 16.5 | % | 15.3 | % | 14.7 | % | 12.6 | % | |||||||||||||||
| Other business revenue | 100.0 | % | 100.0 | % | 100.0 | % | 100.0 | % | |||||||||||||||
| Other business cost of paying veterinary invoices | 70.6 | % | 78.0 | % | 73.1 | % | 75.7 | % | |||||||||||||||
| Other business variable expenses | 22.2 | % | 15.8 | % | 19.7 | % | 17.5 | % | |||||||||||||||
| Other business fixed expenses* | 5.6 | % | 5.5 | % | 5.8 | % | 5.4 | % | |||||||||||||||
| Other business adjusted operating income (non-GAAP) | 1.6 | % | 0.8 | % | 1.4 | % | 1.4 | % | |||||||||||||||
| Revenue | 100.0 | % | 100.0 | % | 100.0 | % | 100.0 | % | |||||||||||||||
| Cost of paying veterinary invoices | 69.6 | % | 72.6 | % | 71.3 | % | 73.6 | % | |||||||||||||||
| Variable expenses | 12.8 | % | 11.3 | % | 12.3 | % | 12.1 | % | |||||||||||||||
| Fixed expenses* | 5.6 | % | 5.5 | % | 5.8 | % | 5.4 | % | |||||||||||||||
| Total business adjusted operating income (non-GAAP) | 11.9 | % | 10.6 | % | 10.6 | % | 8.9 | % | |||||||||||||||
*Fixed expenses represent shared services that support both our subscription and other business segments and, as such, are generally allocated to each segment pro-rata based on revenues. | |||||||||||||||||||||||
| The following tables reflect the reconciliation of adjusted EBITDA to net income (loss) (in thousands): | |||||||||||||||||||||||||||||||||||||||||||||||
| Year Ended December 31, | |||||||||||||||||||||||||||||||||||||||||||||||
| 2025 | 2024 | ||||||||||||||||||||||||||||||||||||||||||||||
| Net Income (loss) | $ | 19,433 | $ | (9,633) | |||||||||||||||||||||||||||||||||||||||||||
| Excluding: | |||||||||||||||||||||||||||||||||||||||||||||||
| Stock-based compensation expense | 37,466 | 31,942 | |||||||||||||||||||||||||||||||||||||||||||||
| Depreciation and amortization expense | 15,836 | 16,466 | |||||||||||||||||||||||||||||||||||||||||||||
| Interest income | (12,256) | (12,410) | |||||||||||||||||||||||||||||||||||||||||||||
| Interest expense | 13,759 | 14,497 | |||||||||||||||||||||||||||||||||||||||||||||
| Income tax (benefit) expense | 2,561 | (5) | |||||||||||||||||||||||||||||||||||||||||||||
| Goodwill impairment charges | 1,129 | 5,299 | |||||||||||||||||||||||||||||||||||||||||||||
| Loss from equity method investment | — | (33) | |||||||||||||||||||||||||||||||||||||||||||||
| Realized gain on nonmonetary exchange of preferred stock investment | (7,783) | — | |||||||||||||||||||||||||||||||||||||||||||||
| Adjusted EBITDA | $ | 70,145 | $ | 46,123 | |||||||||||||||||||||||||||||||||||||||||||
| Three Months Ended | |||||||||||||||||||||||||||||||||||||||||||||||
| Dec. 31, 2025 | Sep. 30, 2025 | Jun. 30, 2025 | Mar. 31, 2025 | Dec. 31, 2024 | Sep. 30, 2024 | Jun. 30, 2024 | Mar. 31, 2024 | ||||||||||||||||||||||||||||||||||||||||
| Net Income (loss) | $ | 5,630 | $ | 5,873 | $ | 9,413 | $ | (1,483) | $ | 1,656 | $ | 1,425 | $ | (5,862) | $ | (6,852) | |||||||||||||||||||||||||||||||
| Excluding: | |||||||||||||||||||||||||||||||||||||||||||||||
| Stock-based compensation expense | 9,361 | 9,323 | 9,268 | 9,514 | 8,036 | 8,127 | 8,381 | 7,398 | |||||||||||||||||||||||||||||||||||||||
| Depreciation and amortization expense | 4,032 | 4,051 | 3,962 | 3,791 | 3,924 | 4,381 | 4,376 | 3,785 | |||||||||||||||||||||||||||||||||||||||
| Interest income | (3,115) | (3,201) | (3,105) | (2,835) | (2,999) | (3,232) | (3,135) | (3,045) | |||||||||||||||||||||||||||||||||||||||
| Interest expense | 4,076 | 2,790 | 3,682 | 3,211 | 3,427 | 3,820 | 3,655 | 3,596 | |||||||||||||||||||||||||||||||||||||||
| Income tax (benefit) expense | 663 | 726 | 1,133 | 39 | 38 | 39 | (44) | (38) | |||||||||||||||||||||||||||||||||||||||
| Goodwill impairment charges | 1,129 | — | — | — | 5,299 | — | — | — | |||||||||||||||||||||||||||||||||||||||
| Loss from equity method investment | — | — | — | — | — | (33) | — | — | |||||||||||||||||||||||||||||||||||||||
| Realized gain on nonmonetary exchange of preferred stock investment | — | (7,783) | — | — | — | — | — | ||||||||||||||||||||||||||||||||||||||||
| Adjusted EBITDA | $ | 21,776 | $ | 19,562 | $ | 16,570 | $ | 12,237 | $ | 19,381 | $ | 14,527 | $ | 7,371 | $ | 4,844 | |||||||||||||||||||||||||||||||