☒ ANNUAL REPORT PURSUANT TO SECTION 13 OR 15(d) OF THE SECURITIES EXCHANGE ACT OF 1934
For the fiscal year ended December 31, 2025
or
☐ TRANSITION REPORT PURSUANT TO SECTION 13 OR 15(d) OF THE SECURITIES EXCHANGE ACT OF 1934
For the transition period from ____ to ____
Commission File Number: 001-36537
TRUPANION, INC.
(Exact name of registrant as specified in its charter)
Delaware
83-0480694
(State or other jurisdiction of incorporation or organization)
(I.R.S. Employer Identification Number)
6100 4th Avenue S, Suite 200
Seattle,
Washington
98108
(855)
727 - 9079
(Address, including zip code, and telephone number, including area code, of registrant’s principal executive offices)
Securities registered pursuant to Section 12(b) of the Act:
Title of Each Class
Trading Symbol
Name of Exchange on Which Registered
Common stock, $0.00001 par value per share
TRUP
The NASDAQ Stock Market LLC
Securities registered pursuant to Section 12(g) of the Act: None.
Indicate by check mark if the registrant is a well-known seasoned issuer, as defined in Rule 405 of the Securities Act. ☒Yes☐ No
Indicate by check mark if the registrant is not required to file reports pursuant to Section 13 or Section 15(d) of the Act. ☐ Yes ☒No
Indicate by check mark whether the registrant (1) has filed all reports required to be filed by Section 13 or 15(d) of the Securities Exchange Act of 1934 during the preceding 12 months (or for such shorter period that the registrant was required to file such reports), and (2) has been subject to such filing requirements for the past 90 days. ☒Yes☐ No
Indicate by check mark whether the registrant has submitted electronically every Interactive Data File required to be submitted pursuant to Rule 405 of Regulation S-T (§232.405 of this chapter) during the preceding 12 months (or for such shorter period that the registrant was required to submit such files). ☒ Yes☐ No
Indicate by check mark whether the registrant is a large accelerated filer, an accelerated filer, a non-accelerated filer, a smaller reporting company, or an emerging growth company. See the definitions of "large accelerated filer," "accelerated filer," "smaller reporting company," and "emerging growth company" in Rule 12b-2 of the Exchange Act.
Large accelerated filer
☒
Accelerated filer
☐
Non-accelerated filer
☐
Smaller reporting company
☐
Emerging growth company
☐
If an emerging growth company, indicate by check mark if the registrant has elected not to use the extended transition period for complying with any new or revised financial accounting standards provided pursuant to Section 13(a) of the Exchange Act. ☐
Indicate by check mark whether the registrant has filed a report on and attestation to its management's assessment of the effectiveness of its internal control over financial reporting under Section 404(b) of the Sarbanes-Oxley Act (15 U.S.C. 7262(b)) by the registered public accounting firm that prepared or issued its audit report. ☒
If securities are registered pursuant to Section 12(b) of the Act, indicate by check mark whether the financial statements of the registrant included in the filing reflect the correction of an error to previously issued financial statements. ☐
Indicate by check mark whether any of those error corrections are restatements that required a recovery analysis of incentive-based compensation received by any of the registrant's executive officers during the relevant recovery period pursuant to §240.10D-1(b). ☐
Indicate by check mark whether the registrant is a shell company (as defined in Rule 12b-2 of the Exchange Act). ☐ Yes ☒ No
The aggregate market value of the registrant’s common stock held by non-affiliates as of June 30, 2025, the last business day of the registrant’s most recently completed second fiscal quarter, was approximately $1,324,459,301 using the closing price on that day of $55.35.
As of February 6, 2026, there were approximately 43,430,169 shares of the registrant’s common stock outstanding.
DOCUMENTS INCORPORATED BY REFERENCE Part III incorporates certain information by reference from the definitive proxy statement to be filed by the registrant in connection with the 2026 Annual Meeting of Stockholders (Proxy Statement). The Proxy Statement will be filed by the registrant with the Securities and Exchange Commission pursuant to Regulation 14A not later than 120 days after the end of the registrant’s fiscal year ended December 31, 2025.
This Annual Report on Form 10-K of Trupanion, Inc. contains forward-looking statements within the meaning of the federal securities laws. The words “believe,” “may,” “will,” “potentially,” “estimate,” “target,” “continue,” “anticipate,” “intend,” “could,” “would,” “project,” “plan” and “expect,” and similar expressions that convey uncertainty of future events or outcomes, are intended to identify forward-looking statements.
All statements other than statements of historical fact are forward-looking statements. Forward-looking statements contained in this Annual Report on Form 10-K include, but are not limited to, statements about our expectations regarding:
•trends and predictability of revenue and cost of revenue;
•benefits of underwriting our products, including transitioning our Canadian business to our wholly-owned subsidiary, GPIC Insurance Company;
•availability of reinsurance for the policies we underwrite;
•protection of our intellectual property, including our proprietary software;
•level at which we are able achieve market penetration in the markets where we operate;
•improving operational efficiencies, including processing time for veterinary invoices;
•enhancements to our proprietary software, including expected benefits of such enhancements;
•impact of actions we are taking to improve operational efficiencies and operating costs;
•future acquisitions and our ability to integrate the operations and technology of any acquired company;
•benefits from non-insurance related activities;
•other statements regarding our future operations, financial condition, strategy and plans, prospects and business strategies
These and other forward-looking statements are subject to a number of risks, uncertainties and assumptions, including those described in Part I. Item 1A. “Risk Factors” and elsewhere in this Annual Report on Form 10-K. Moreover, we operate in a very competitive and rapidly changing environment, and new risks emerge from time to time. It is not possible for our management to predict all risks, nor can we assess the impact of all factors on our business or the extent to which any factor, or combination of factors, may cause actual results to differ materially from those contained in any forward-looking statements we may make. In light of these risks, uncertainties and assumptions, the forward-looking events and circumstances discussed in this Annual Report on Form 10-K may not occur and actual results could differ materially and adversely from those anticipated or implied in the forward-looking statements.
You should not rely on forward-looking statements as predictions of future events. We undertake no obligation to update publicly any forward-looking statements for any reason, except as required by law.
Unless otherwise stated or the context otherwise indicates, references to “we,” “us,” “our” and similar references refer to Trupanion, Inc. and its subsidiaries taken as a whole.
2
PART I
Item 1. Business
Our Mission
Our mission is to help loving, responsible pet parents budget and care for their pets.
Company Overview
We provide medical insurance for cats and dogs in the United States, Canada, and certain countries in Continental Europe. Through our data-driven, vertically-integrated approach, we develop and offer high-value medical insurance products, priced to take into account each pet’s unique characteristics and coverage level. Our growing and loyal membership base provides us with highly predictable and recurring revenue.
We operate in two reporting segments: subscription business and other business. We generate revenue in our subscription business segment primarily through insurance premiums, which we refer to as subscription payments, from direct-to-consumer products. We operate our subscription business segment similar to other subscription-based businesses, with a focus on achieving a target margin prior to our new pet acquisition expense and acquiring as many pets as possible at our targeted average estimated internal rate of return. Within our subscription business, we also provide "Powered by Trupanion" pet insurance product offerings marketed by third parties, low and medium average revenue per pet products marketed under the brand names Furkin and PHI Direct in Canada, and a Trupanion branded product in Germany and Switzerland. We either directly underwrite or assume full insurance risk for these products through reinsurance arrangements. We provide a full suite of services and support for these products and they are designed to align with the target margin profile of our subscription business segment. Within this segment we also offer products in certain countries in Continental Europe which are currently underwritten by third parties who pay us commissions that we recognize as revenue.
Our other business segment generates revenue from other product offerings, primarily by underwriting policies on behalf of third parties with whom we generally have a business-to-business relationship. This business segment has, and targets, a significantly lower margin profile than our subscription business segment and is not part of our core business strategy. The largest source of revenue within this segment is from our long-standing contractual relationship as an underwriter for Pets Best Insurance Services ("Pets Best"), a third-party insurance provider we have worked with since 2015. We expect that enrollment from Pets Best will continue to decline as it engages other third-party underwriters. Additional products in this segment include the U.S. Department of Veterans Affairs program and employer-sponsored programs, primarily for companies with animal health related operations.
Our Business
It is very difficult for pet owners, who we refer to as pet parents, to budget for veterinary expenses when their pets become sick or injured. Pet parents do not know whether their pet’s health will be “average,” “lucky,” or “unlucky.” Over the life of a pet, veterinary expense for a lucky versus unlucky pet can vary from $500 to more than $50,000. Even if a pet ends up being “average” over its life, the timing of accidents or illnesses may not align with the pet parent's budget. Further, many pet parents do not know how to budget for the “average” cost of medical care for their pets. Average veterinary expenses often greatly exceed the expectations of pet parents and vary dramatically based on a multitude of factors, including the availability of care by region and the type and extent of treatments advisable and available for specific pet breeds. Consequently, self-insuring is not an effective solution for many pet parents. This challenge has compounded further as the cost of veterinary care has been outpacing inflation, a trend that has been accelerating in recent years due to advancements in medical procedures and technology and due to increased availability of care options.
We provide a solution for the challenge of planning for unexpected costs of veterinary care. Our subscription products, priced specifically for each pet’s unique characteristics and coverage level, help pet parents budget for unforeseen medical expenses. Through our high quality medical insurance products, pet parents are able to ensure coverage for the best care for their pet and avoid treatment decisions being made due to financial constraints, which can frequently lead to the economic euthanasia of a pet. We believe, due to the nature of the reliability of our coverage and the satisfaction of our member base, our subscription business model also provides us with highly predictable and recurring revenue. We believe that providing an exceptional member experience has increased the rate at which our existing members enroll additional pets and/or refer their friends and family, all of which has contributed towards our industry leading retention rates.
Our subscription business’s cost-plus model is designed to spread the risk evenly within categories of pets so our policy holders, which we refer to as members, can better budget for unexpected veterinary costs. We have been collecting comprehensive pet health data for over 25 years. Given the comprehensive and broad coverage of our subscription products and the capabilities of our software to collect and assess data, we believe our data and approach to pricing is unmatched by other pet insurers and provides us with a greater understanding of anticipated veterinary costs. We leverage this data to price our subscription plan for each pet based on their specific circumstances such as breed, age, geography, desired deductible or co-
3
payment and coverage level, so that, in aggregate, the amounts paid by parents of lucky pets helps to cover the veterinary costs incurred by unlucky pets. We believe our actuarial team, working with our granular data, is able to price our subscription products much more accurately than any other players in the pet health insurance industry, enabling us to provide our members with the most accurate cost and highest value proposition relative to coverage level in our industry.
Since launch, our core “Trupanion” branded product has been designed by veterinarians to enable them to practice best medicine – thus recommending the optimal treatment for the pet. As a result, we believe our Trupanion-branded product (the product with our most comprehensive coverage options) enables veterinarians to establish stronger ties and better alignment with our members. Members with a Trupanion-branded product visit their veterinarian more frequently and spend more money on the best course of treatment for their pet.This results in better health outcomes for pets, which we believe creates a flywheel effect that has been the key driver of growth for our subscription business.
Through the use of our proprietary, patented software designed to communicate directly with a veterinary hospital’s practice management system, we are able to offer a differentiated experience to our members. Using our software, veterinary hospitals can receive payment from us directly for approved invoices in seconds, with our members only paying their deductible or co-payment for covered treatments. We believe this unique and patented solution, which is offered free to veterinarians and our members, transforms the pet insurance experience and will help to grow the category.
Through our "Powered by Trupanion" suite of products, which are marketed by third parties, we have broadened our distribution in the retail and corporate worksite channels. Our "Powered by Trupanion" products offer the same experience members with Trupanion branded products receive including veterinary direct payment and access to our 24/7 member support contact center. However, they also include options for varying levels of coverage to meet the different needs of our target pet parents and associated budgetary requirements. In addition, our Furkin and PHI Direct products, available as direct-to-consumer products in Canada, offer further optionality of coverage at different price points.
Our other business segment is comprised of a collective of other product offerings, primarily policies underwritten on behalf of third parties with whom we generally have a business-to-business relationship, and this business segment has, and targets, a significantly lower margin profile than our subscription business segment. The largest source of revenue within this segment is from our long-standing contractual relationship as an underwriter for Pets Best. Additional products in this segment include the U.S. Department of Veterans Affairs program and certain employer sponsored programs, primarily for companies with animal health related operations.
Our key markets are large and under-penetrated, as measured by insured pets:
North America1
Continental Europe2
Household dogs and cats (in thousands)
180,700
165,271
Pet insurance market penetration
3.9
%
8.6
%
1According to NAPHIA, there are approximately 180.7 million household dogs and cats in the United States and Canada. North American Pet Health Insurance Association estimates that the penetration rate for medical insurance for cats and dogs in North America is less than four percent as of April 22, 2025.
2According to internal estimates incorporating figures from FEDIAF European Facts & Figures, GfK Czech consumer panel, and KVL Czech Republic, there are approximately 165 million household dogs and cats in Continental Europe and the estimated penetration rate for medical insurance for cats and dogs is approximately eight and a half percent as of December 31, 2025.
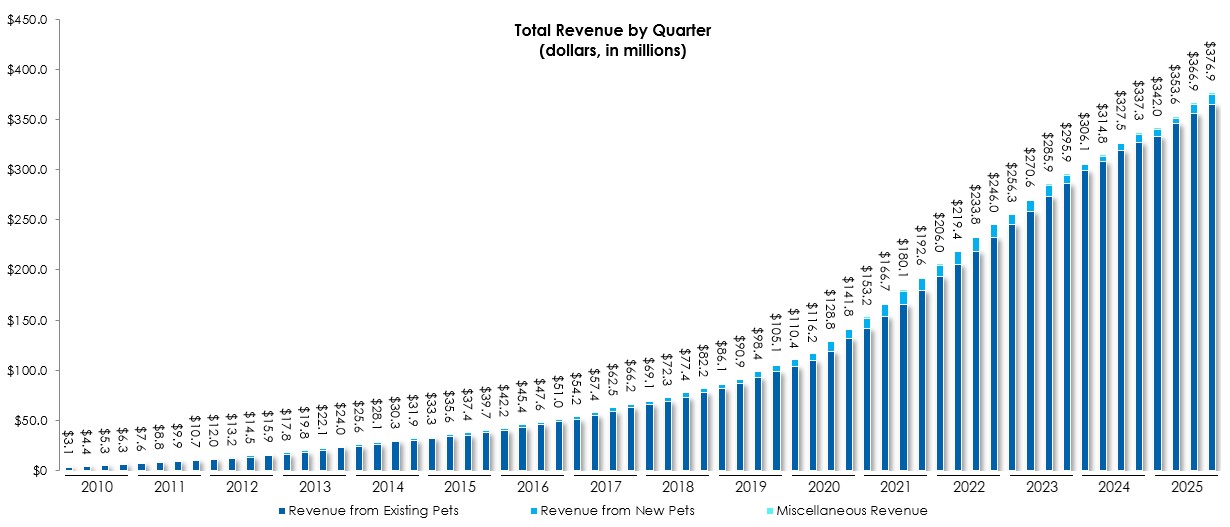
We believe that, over the long-term, pet insurance penetration rates in the markets in which we operate could approach those seen in the United Kingdom or Sweden where approximately 28% and 67%, respectively, of household dogs and cats are insured. Total pets enrolled in our subscription business have grown from 31,200 pets on January 1, 2010 to 1,096,173 pets on December 31, 2025, which represents a compound annual growth rate of 25%. As a result, our subscription business revenue has grown from $19.1 million in 2010 to $989.3 million in 2025, which represents a compound annual growth rate of 28%.
4
Our Strategy
We are focused on attracting and retaining members by providing the highest customer value proposition and best-in-class member experience. To execute on our strategy, we concentrate on the following:
Increasing leads from veterinary hospitals. Our outside team of Territory Partners (who interface directly with veterinarians) work to increase the number of veterinary hospitals that educate their clients about high quality medical insurance, and to increase the rate at which veterinary hospitals refer leads to us.
Increasing referrals from members. We seek to grow the number of existing members that add a pet or refer their friends and family to Trupanion. We do so by focusing on improving the member experience, including increasing the percentage of veterinary invoices that are paid directly to veterinarians through our patented, proprietary software.
Improving conversion. We are investing to increase the rate at which we convert pet parents receiving quotes for our subscription plan into enrolled members.
Targeting a 71% value proposition. We aim to pay veterinary invoices promptly and return 71% of premiums we collect, in the aggregate, to members, which we believe is the highest operationally sustainable value proposition in our industry. Our ability to target the highest value proposition stems from our low-cost operating model and requires we increase our subscription payments in-line with the cost of veterinary care.
Improving retention. Member retention is a key part of our strategy. Our approach to retention includes the assessment of three member cohorts: members in their first year of membership, members receiving rate changes below 20% per year, and members receiving rate changes over 20% per year. As part of our effort to increase retention in these cohorts, we seek to enhance the education of individual pet parents accordingly and invest in improving overall member communication and experience.
Automating payment of veterinary invoices. In line with our low-cost operating model, we use artificial intelligence and machine learning to leverage data to automate the payment of a portion of our veterinary invoices. We intend to increase the percentage of veterinary invoices paid without human intervention with the goal of ensuring that we can process veterinary invoices in seconds, providing settlement at check-out and therefore enhancing our member and veterinary support, while lowering our cost of operations.
Expanding our insurance product offerings. We seek to grow our subscription membership through the addition of new member acquisition channels including employee benefits, retail, and enhanced direct-to-consumer offerings over time. In recent years, we have expanded internationally in certain countries in Continental Europe and entered into relationships with strategic partners who are leaders in their field and are aligned with our goals.
5
Pursuing non-insurance revenue offerings. We intend to continue pursuing opportunities to provide pet parents with complementary products and services. For example, we have invested in a pet food initiative to explore whether pets on a calorie-controlled, high-quality diet have improved health outcomes that can justify a decrease in the cost of their medical insurance.
Sales and Marketing (New Pet Acquisition)
We generate leads for our core Trupanion-branded product through a diverse set of pet parent acquisition channels, which we then aim to convert into members primarily through our website and contact center. These acquisition channels include leads from third parties such as strategic partners and referrals from veterinarians and existing members.
We build awareness of our core Trupanion-branded product predominately through the veterinary community, engaging our team of "Territory Partners". The Trupanion Territory Partners are independent contractors who market our product and are paid fees based on activity in their regions. Their role is to create meaningful, long-term relationships with veterinarians and to educate those veterinarians, and their teams, about the benefits of high quality medical insurance for pets. We believe this structure aligns our interests and provides a platform that we can leverage over time. Our Territory Partner approach has been cultivated over the last 25 years and provides a unique and unmatched moat in our industry. We believe that it would be extremely difficult, costly and time consuming for a competitor to replicate this model and that heavy investment alone would not likely dissolve the competitive advantage this model provides us.
Competition
We compete primarily with pet parents who choose to self-fund their veterinary costs, mainly via credit cards, as well as new and existing pet medical insurance brands.
The vast majority of pet parents in the markets in which we operate do not currently have medical insurance for their pets and those that do have medical insurance for their pets do not typically move from one insurance company to another because pre-existing conditions would likely not be covered following a move. As a result, we are focused primarily on expanding the overall size of our markets by providing pet parents with high value, transparent medical coverage designed for each pet's unique characteristics and coverage level. We view our primary competitive challenge as educating pet parents on why high-quality medical insurance for pets is a better alternative to self-insuring and on the differences between Trupanion's unique lifetime coverage and coverage offered by other providers.
Throughout our operating history we have competed, and continue to compete, against numerous pet insurance brands. In our experience, competing pet medical insurance companies generally fall into one of two segments: (a) traditional providers with low target price points and narrow coverage that is unlikely to cover things most likely to go wrong, like congenital and hereditary conditions, and (b) higher-value providers that offer some form of an annual plan, the cost of which increases as the pet ages.
In recent years, there has been significant consolidation in the pet medical insurance industry resulting in many brands being controlled by a small number of companies.
Competitive Advantages
We believe that we have competitive advantages that position our core Trupanion branded product offerings favorably compared to other brands offered in the marketplace. We believe these include:
•Value Proposition - the broadest coverage and a superior value proposition to any other offerings, in part, due to our vertically integrated structure that allows us to control all aspects of the insurance process and reduce frictional costs;
•Deep Veterinary Relationships - a unique member acquisition strategy that leverages the relationships our Territory Partners have developed in the veterinary community;
•Data Focused Approach - a proprietary database containing over 25 years of comprehensive pet health data enabling us to be more precise in our pricing and pet acquisition expense;
•Direct Veterinary Payments - our patented, proprietary software which allows us to pay veterinary invoices directly at time of treatment.
6
Intellectual Property
We rely on a combination of intellectual property rights, including trade secrets, patents, copyrights, trademarks, and domain names, as well as contractual restrictions, to establish and protect our intellectual property. Foremost, we seek to protect our proprietary position by filing patent applications in the United States and in jurisdictions outside of the United States related to our technology, inventions, and improvements that are important to our business. We hold 13 patents and have 23 patents pending across several countries, including the U.S., in four main patent families related to our: 1) veterinary integration software 2) claims automation 3) pet tracking technology and 4) pet food formulation, manufacturing and integration systems. We additionally rely on data and market exclusivity, and patent term extensions when available. We monitor market activity for potential infringement of our patents and bring litigation claims from time to time. In addition, we control access to our proprietary technology, software, and documentation by entering into confidentiality and invention assignment agreements with our employees and independent contractors and non-disclosure agreements with third parties, such as service providers, vendors, individuals and entities that may be exploring a business relationship with us.
Human Capital Resources
Our Team
We are a mission-driven organization with a diverse team united by a shared passion for pets. Our employees and independent contractors, which we refer to as team members, are our greatest asset, and we focus on attracting great people to our team and offering high-quality experiences to all team members.
We strive to foster an environment where team members with different perspectives and backgrounds can thrive. A core tenet of Trupanion is that we offer a work experience that applies equally to all team members, regardless of role, such as our Benefits offerings described below. This approach extends throughout the way we work together. For example, team members that come into any of our offices work in an open environment where the size of working space is the same for everyone regardless of role or seniority.
As of December 31, 2025, we employed 1,121 people across the U.S., Canada and Europe, with women representing 63% of leadership positions. Our team is further supported by 159 field sales Territory Partners and their associates who represent Trupanion. We also contract with team members in India and the Philippines through third-party service providers.
We have team members working in our Seattle headquarters in the United States, in our offices in the U.K., Germany, and Czechia, and virtually across the U.S., Canada, and Europe. Our Seattle headquarters and our Czechia office are pet friendly.
Benefits
We offer each employee team member substantially the same benefits, regardless of role or level in the organization (with appropriate variations due to the country in which they reside). We also recognize the importance of family and design our benefits plans to support the physical, financial, and emotional wellbeing of team members and their families, including their pets.
Among the benefits we offer include:
•Full medical, dental, and vision benefits at no cost to employees.
•At least four weeks of paid time off and paid floating holidays.
•Five-week sabbatical after five years of employment.
•Free medical health insurance for one pet.
•Paid time off to volunteer at nonprofit organizations.
•A variety of benefits to support employee wellness both at and away from work.
•Seattle headquarters office amenities, including on-site childcare at no cost to employees, free on-site gym, and free dog walking services for office pets during business hours.
Career Development
7
At Trupanion, we are committed to helping everyone grow and thrive along with the company. We are proud to continually see approximately 27% of our employee team members transitioning to new roles within Trupanion each year. Team members have access to ongoing development designed to help them succeed in their roles today, develop skills for the future, and build a career at Trupanion.
A sampling of our development opportunities include:
•Trupanion Embark! – All team members participate in company orientation to learn about our history, culture, product, business model, and operations.
•TruSpark - TruSpark fosters meaningful, two-way connections between Territory Partners and our home office teams, providing valuable insight, context, and support by fostering engagement and collaboration.
•Mentorship – Our Trupanion Women in Leadership ("TWIL") mentorship program creates connection across departments, so team members can learn from and support each other in their development.
•Professional skills – Our continuing education course catalog includes a wide variety of topics related to our business, the animal health industry, and professional skills.
•Leadership Development – Our Leadership Unleashed program offers development for aspiring, new and experienced managers to drive ownership and growth for the future of our business.
Regulation
United States Regulations
Our insurance subsidiaries are required to be licensed to transact insurance business in, and are subject to the comprehensive regulation and supervision in, the jurisdictions where they are domiciled and conduct business. In the United States, our primary insurance subsidiary and underwriter, American Pet Insurance Company ("APIC"), is licensed to do business in all 50 states, Puerto Rico and the District of Columbia. Our subsidiary ZPIC Insurance Company ("ZPIC"), which has not yet begun underwriting activity, is currently licensed to do business in 40 states and the District of Columbia.
Other Jurisdictions Regulations
In Canada, we have transitioned most of our business to our wholly-owned insurance subsidiary, GPIC Insurance Company ("GPIC"). This business was previously written by an unaffiliated Canadian-licensed insurer, Accelerant Insurance Company of Canada ("Accelerant"), formerly known as Omega General Insurance Company.
GPIC is domiciled in Canada and is currently licensed to do business in all provinces and territories in Canada except for Nunavut. GPIC provides us with flexibility to directly underwrite policies as part of our vertical integration approach. Pursuant to the Canadian Office of the Superintendent of Financial Institutions ("OSFI"), we have funded required statutory capital to GPIC, which is, and may continue to be for the foreseeable future, more than the amount we have historically held with our fronting arrangement with Accelerant.
Under the terms of our existing agreements with Accelerant, we retain any financial risk associated with our Canadian business. Accelerant's Canadian insurance operations are supervised and regulated by Canadian federal, provincial and territorial governments and Accelerant is a fully licensed insurer in all of the Canadian provinces and territories in which we do business. Under this arrangement we are required to fund a trust account in accordance with Canadian regulations. As we transition more of our business to GPIC, the amount we are required to fund in this trust account will be reduced. As of December 31, 2025, the account held CAD $8.7 million.
We also own three segregated accounts with Wyndham Insurance Company (SAC) Limited ("WICL"), located in Bermuda, relating to our reinsurance agreements with insurance partners in Canada, Germany and Switzerland. WICL is regulated by the Bermuda Monetary Authority ("BMA"). Insurance companies with a presence in Bermuda are subject to solvency and liquidity standards, certain restrictions on the declaration and payment of dividends and distributions, certain restrictions on the reduction of statutory capital, and auditing and reporting requirements. In addition, BMA has the authority to supervise and, in certain circumstances, investigate and intervene in the affairs of insurance companies. Most significantly, Bermudian law restricts WICL’s ability to declare or pay dividends and the value of WICL’s assets must remain greater than the aggregate of its liabilities, issued share capital, and share premium accounts.
8
For further information regarding these regulatory regimes and how they may materially affect our business, including our financial results and condition and ability to compete in our industry, please see Item 1A. "Risk Factors" and Item 7. "Management's Discussion and Analysis of Financial Condition and Results of Operations - Regulation."
Corporate Information
We were founded in Canada in 2000 as Vetinsurance Ltd. In 2006, we effected a business reorganization whereby Vetinsurance Ltd. became a consolidated subsidiary of Vetinsurance International, Inc., a Delaware corporation. In 2007, we began doing business as Trupanion. In 2013, we formally changed our name to Trupanion, Inc. Our principal executive offices are located at 6100 4th Avenue South, Seattle, Washington 98108, USA, and our telephone number is +1 (855) 727-9079. Our website address is www.trupanion.com. Information contained on, or that can be accessed through, our website is not incorporated by reference, and you should not consider information on our website to be part of this Annual Report on Form 10-K.
Available Information
We are required to file annual, quarterly and other reports, proxy statements and other information with the Securities and Exchange Commission ("SEC") under the Exchange Act. We also make available, free of charge on the investor relations portion of our website at investors.trupanion.com, our annual reports on Form 10-K, quarterly reports on Form 10-Q, current reports on Form 8-K, and amendments to those reports filed or furnished pursuant to Section 13(a) or 15(d) of the Exchange Act as soon as reasonably practicable after they are filed electronically with the SEC. The SEC also maintains an Internet website at www.sec.gov where you can obtain our SEC filings. You can also obtain paper copies of these reports, without charge, by contacting Investor Relations at InvestorRelations@Trupanion.com.
Investors and others should note that we may announce material financial information to our investors using our investor relations website, SEC filings, our annual stockholder meeting, press releases, public conference calls, investor conferences, presentations and webcasts. We regularly use these channels, as well as social media, to communicate with our members and the public about our company, our services and other issues. It is possible that the information we post on these channels, such as social media, could be deemed to be material information.
9
Item 1A. Risk Factors
Investing in our common stock involves a high degree of risk. You should carefully consider the risks and uncertainties described below, together with all of the other information in this report, including our consolidated financial statements and related notes, as well as in our other filings with the SEC, in evaluating our business and before investing in our common stock. The risks and uncertainties described below are not the only ones we face. Additional risks and uncertainties that are not expressly stated, that we are unaware of, or that we currently believe are not material, may also become important factors that affect us. If any of the following risks occur, our business, operating results, financial condition and prospects could be materially harmed. In that event, the price of our common stock could decline, and you could lose part or all of your investment.
Summary of Material Risk Factors
Our business is subject to numerous risks and uncertainties of which you should be aware. Among others, these risks relate to:
•Our significant net losses since inception, ability to achieve and maintain profitability and our ability to maintain our rate of revenue growth in the future;
•Our ability to grow and retain our member base, including uncertainties in the assumptions we use to determine our new pet acquisition spend, variable costs of attracting new members through online channels such as social media or search engines and from leads and referrals generated from Territory Partners, veterinarians and other third parties;
•Our ability to maintain certain levels of surplus capital, and access excess capital for other parts of our business, under applicable insurance regulations;
•Our reliance on Territory Partners, whom we engage as independent contractors rather than employees, and other third parties;
•Our veterinary invoice expense (which may increase with use of our patented software for direct payment of invoices) and our ability to timely and accurately process valid invoices and to identify improper invoices;
•Our ability to comply with numerous laws and regulations applicable to our business, including state, federal and foreign laws relating to insurance, privacy, e-commerce, email and texting, and accounting matters;
•Our ability to react to competitors and alternative financing methods for pet related medical costs;
•Our ability to maintain and enhance our brand;
•Our ability to maintain and scale our infrastructure, to invest in or acquire businesses, products or technologies, or otherwise manage our growth;
•Changes in legal, judicial, social and other environmental conditions, which could result in unexpected claim and coverage liability;
•Our reliance on key personnel and strategic relationships and our ability to maintain these relationships;
•Fluctuations in foreign exchange rates, other issues relating to expanding our operations internationally, and general changes in the global economy that can cause our operating results to vary;
•Our ownership of multiple insurance subsidiaries in different jurisdictions;
•Our ability to maintain effective internal controls and security measures, including measures to mitigate cyber-attacks;
•Our acceptance of automatic fund transfers, credit card and debit card payments;
•Our ability to protect our intellectual property (IP), avoid violating IP rights of others, and maintain relationships with third parties providing necessary IP and technology to us;
•The outcome of litigation or regulatory proceedings;
•Our level of indebtedness, our ability to service our debt, and our ability to comply with covenants that may restrict our operations and limit our ability to expand our business;
•Our ability to initiate substantial underwriting activity by our Canadian subsidiary GPIC in connection with rolling off business and ending our contractual relationship with our fronting partner Accelerant;
•Our ability to utilize net operating loss carryforwards and potential increases in our tax liabilities; and
•Our common stock, including missed earnings guidance, inadequate analyst coverage, trading volatility, lack of dividends, concentrated ownership, and anti-takeover provisions in our governing documents.
10
Risks Related to Our Business and Industry
We have incurred significant cumulative net losses since our inception and may not be able to achieve or maintain profitability in the future.
Prior to 2025, we had incurred significant cumulative net losses since our inception and as of December 31, 2025, we had an accumulated deficit of $206.5 million. We have funded our business through our operations, equity financings, and borrowings under revolving lines of credit and term loans. Our ability to maintain profitability will depend, in significant part, on obtaining new members, retaining our existing members, maintaining relationships with our strategic partners, and ensuring that our expenses, including new pet acquisition expense, do not exceed our revenue. We expect to make significant expenditures and investments in new pet acquisition and product initiatives and these expenditures may not result in additional growth. Our growth in revenue and membership may not be sustainable or may decrease, and we may not generate sufficient revenue to consistently achieve profitability. Additionally, we budget for our expenses based, in significant part, on our estimates of future revenue and many of these expenses are fixed in the short term. As a result, we may be unable to adjust our spending in a timely manner if our revenue falls short of our estimates. Accordingly, any significant shortfall of revenue in relation to our estimates could have an immediate negative effect on our financial results.
We may not maintain our current rate of revenue growth.
Our revenue has increased quickly and substantially in recent years. We believe that our continued revenue growth will depend on, among other factors, our ability to:
•improve our market penetration through cost-efficient and effective pet acquisition programs to attract new members;
•convert leads into enrollments;
•maintain high retention rates;
•increase the lifetime value per pet;
•effectively communicate our value proposition to new and existing members;
•price our subscriptions in relation to actual operating expenses and achieve required regulatory approval for pricing changes;
•achieve our target margin profile to allow continued reinvestment in growth and member experience;
•maintain and increase positive relationships with veterinarians and other referral and lead sources;
•maintain high-performing Territory Partners in our target markets;
•administer and continue to grow our business internationally;
•create and maintain positive relationships with strategic partners, particularly partners who present us with new sales channels and those who create software solutions for veterinary practices;
•continue to offer and develop a portfolio of products and adjacent products with a superior value with competitive features and rates;
•recruit, integrate and retain skilled, qualified and experienced sales professionals who can demonstrate our value proposition to new and existing members;
•provide our members with superior service, including timely and efficient payment of veterinary invoices, and by recruiting, integrating and retaining skilled and experienced personnel who can efficiently review veterinary invoices and process payments;
•generate business to replace revenue generated through our relationship with Pets Best, since we expect our relationship with Pets Best to continue to diminish and our business activity with them will terminate over future periods;
•react to existing and new competitors;
•protect and defend our critical intellectual property;
•increase awareness of and positive associations with medical insurance for pets and our brand;
•react to unexpected developments and general macroeconomic conditions, including pandemics and unfavorable changes in economic conditions, such as inflation, rising interest rates, or a recession; and
•successfully respond to and comply with regulations affecting our business and defend or prosecute any litigation.
You should not rely on our historical rate of revenue growth as an indication of our future performance.
11
We base our decisions regarding new pet acquisition expenditures primarily on the projected internal rate of return on marketing spend. Our estimates and assumptions may not accurately reflect our future results - we may over, or underspend on new pet acquisition, and we may not be able to recover our pet acquisition costs or generate profits from these investments.
We have made and plan to continue to make significant investments to grow our member base. We invested $85.4 million in new pet acquisition expense to acquire new members for the year ended December 31, 2025. We base our decisions regarding our new pet acquisition expenditures primarily on our internal rate of return generated on an average pet. This analysis depends substantially on estimates and assumptions based on our historical experience with pets enrolled in earlier periods, including our key operating metrics. If our estimates and assumptions regarding our internal rate of return and the lifetime value of the pets that we project to acquire and our related decisions regarding investments in new pet acquisition prove incorrect, or if our calculation of internal rate of return and lifetime value of the pets that we project to acquire differs significantly from that of pets acquired in prior periods, we may be unable to recover our new pet acquisition expenses or generate profits from our investment in acquiring new members. Moreover, if our new pet acquisition expenses increase or we invest in member acquisition channels that do not ultimately result in the expected number of new member enrollments or enrollments are at a lower subscription price or cancel before we recoup our acquisition expenses, the return on our investment may be lower than we anticipate irrespective of the lifetime value of the pets that we project to acquire as a result of the new members. If we cannot generate sufficient returns from this investment, we may need to alter our growth strategies, and our growth rate and operating results may be adversely affected. In addition, even if we decrease our average pet acquisition cost, our operating margins may differ from our expectations due to incorrect assumptions relating to existing members adding new pets or referring friends, expenses for member support, and other factors, some of which we do not control.
Our average pet acquisition cost and the number of new pets we enroll depends on a number of factors and assumptions, including the effectiveness of marketing initiatives, including communication of our value proposition, and sales execution by us and our channel partners, changes in costs of media, the mix of our pet acquisition expenditures and the competitive environment. Our average pet acquisition cost has significantly varied over time. In the future, our average pet acquisition cost may vary significantly period to period based upon marketing initiatives we choose to employ, including those related to our brand development. Market recognition and acceptance of any new brands may take longer than expected, requiring us to spend more on our marketing efforts to acquire new pets, which may negatively impact our internal rate of return. We also regularly test new member acquisition channels and marketing initiatives, including direct-to-consumer initiatives, which often are more expensive than our traditional veterinary-focused marketing channels and generally increase our average acquisition costs.
The prices of our subscriptions are based on assumptions and estimates. If our actual experience differs from the assumptions and estimates used in pricing our subscriptions or if we are unable to obtain any necessary regulatory approval for our pricing, our revenue and financial condition could be adversely affected.
The pricing of our subscriptions reflects amounts we expect to pay for a pet’s medical care and we derive these prices from assumptions that we make based on our analytics platform. Our analytics platform draws upon pet data we collect and we use this data to price our policy in response to a number of factors, including a pet’s species, breed, age, gender and location. Factors related to pet location include the current and assumed changes in the cost and availability of veterinary technology and treatments and local veterinary hospital preferences. Some data that feeds into our analytics platform is provided by third-party sources and these sources may limit or prevent us from accessing the data. Additionally, the assumptions we make about breeds and other factors in pricing, such as the estimated impact of inflation and tariffs, may prove to be inaccurate and, accordingly, these pricing analytics may not accurately reflect the expense that we will ultimately incur. Furthermore, if any of our competitors develop similar or better data systems, adopt similar or better underwriting criteria and pricing models or receive our data, our competitive advantage could decline or be lost, which could negatively impact our margins, customer retention, profitability and long-term growth.
The prices of our subscriptions also reflect assumptions and estimates regarding our own operating costs and expenses. We monitor and manage our pricing and overall sales mix to achieve our target returns. If the actual costs, including veterinary invoice expenses, operating costs and expenses within anticipated pricing allowances, are greater than our assumptions and estimates such that the premiums we collect are insufficient to cover these expenses, then our results could be adversely affected and our revenue may be insufficient to consistently achieve or maintain profitability. Conversely, if our pricing assumptions differ from actual results such that we overprice risks, our competitiveness, retention rates, and growth prospects could be adversely affected.
In addition, most states require licensure and regulatory approval prior to marketing new insurance products and increasing prices of our existing products. Our practice has been to regularly reevaluate and adjust the price of our subscriptions, with a goal of achieving our targeted payout ratio, subject to the review and approval of applicable state regulators, who may reduce or disallow our pricing changes. Such review has in the past (for instance, during the COVID-19 pandemic) resulted, and may in the future result, in delayed implementation of pricing changes, which could adversely affect our operating results and financial condition. In addition, we may be prevented by regulators from implementing certain pricing changes, which could require us to raise rates more often than we otherwise may desire. This could damage our reputation with our members and reduce our retention rates, which could significantly damage our brand, result in the loss of expected revenue and otherwise harm our
12
business, operating results and financial condition.
If we are unable to grow our member base and maintain high member retention rates, our growth prospects and revenue will be adversely affected.
Our ability to grow our business depends on retaining and expanding our member base. For the year ended December 31, 2025, we generated approximately 69% of our revenue from our subscription business segment. In order to increase our membership, we must continue to generate leads and convince prospective members of the benefits of medical insurance for pets in general and our subscription business segment in particular. To maintain our existing member base, we need to continue to reinforce the value of our subscription among our members, prospective members, and veterinarians.
We utilize Territory Partners, who are paid fees based on enrollments and retention in their regions, to communicate the benefits of medical insurance to veterinarians through a combination of remote and in-person communications. Veterinarians then educate pet parents, who visit our website or call our contact center to learn more about these benefits, and potentially become members. The efforts of our Territory Partners may not be successful for a variety of reasons, including their ability to effectively communicate our value proposition with veterinarians.
We also have invested in and plan to continue to invest in other third-party channels where our product offerings are complementary and direct-to-consumer member acquisition channels. These other acquisition channels and go-to market plans may involve engaging in sales and promotional activities, and may face unexpected delays, costs or other challenges.
If we fail to establish new or are unable to maintain our existing member acquisition channels, if the cost of our existing sources increases or does not scale as we anticipate, or if we are unable to continue to use any existing channels or programs in any jurisdiction, our member levels and pet acquisition expenses may be adversely affected.
In addition our ability to generate leads could be negatively impacted if any of our products are perceived to be inadequate, unreliable, cumbersome or otherwise do not provide sufficient value, or if our process for paying veterinary invoices is unsatisfactory to the veterinarians and their clients.
We seek to convert pet parents who visit our website and call our contact center into members. The rate at which we convert these visitors into members is a significant factor in the growth of our member base. A number of factors have influenced, and could in the future influence, the conversion rates for any given period, some of which are outside of our control. These factors include:
•the pricing of our subscriptions, including their perceived value, simplicity, and fairness;
•consumers' perception of our subscription compared to offerings from our competitors;
•changes in consumer shopping behaviors due to circumstances outside of our control, such as increased inflation and other economic conditions, and consumers’ ability or willingness to pay for our product;
•our ability to explain and educate consumers regarding the benefits and differences related to our products, including our offerings marketed by third parties, and any potential consumer confusion as we add more products;
•legal or regulatory requirements, including those that make the experience on our website cumbersome or difficult to navigate or that hinder our ability to communicate with potential members quickly and in a way that is more conducive to conversion; and
•system failures or interruptions in our website or contact center.
We have made and plan to continue to make substantial investments in features and enhanced functionalities for our website and support our contact center. These enhancements are designed to help appropriately direct pet parent traffic to the enrollment journey of their choice, increase member engagement, and improve member service. These activities do not directly generate revenue, however, and we may never realize any benefit from these investments. If the expenses that we incur in connection with these activities do not result in sufficient growth in members to offset the cost, our business, operating results and financial condition will be adversely affected. Generally, we see greater conversion through our contact center and if we are unable to drive more potential members to call our contact center, our conversion rates may decline.
13
If we do not retain our existing members or if our marketing initiatives do not result in enrolling more pets or result in enrolling pets that inherently have a lower retention rate, we may not be able to maintain our retention and new pet acquisition rates. In the past, we have experienced reduced retention rates during periods of rapid member growth, as our retention rate generally has been lower during the first year of member enrollment. Members may choose to terminate their subscription for a variety of reasons, including, loss of a pet, increased subscription payments, perceived or actual lack of value, delays or other unsatisfactory experiences in how we review and process veterinary invoice payments, unsatisfactory member service, a change in the economic environment, a more attractive offer from a competitor, changes in our subscription or other reasons, including reasons that are outside of our control. Our cost of acquiring a new member, including sales and promotional activities, is substantially greater than the administrative cost involved in maintaining our relationship with an existing member. If we are not able to successfully retain existing members and limit cancellations, our revenue and operating margins will be adversely impacted and our business, operating results and financial condition would be harmed.
We rely significantly on Territory Partners, veterinarians and other third parties, including strategic partners, to generate leads.
In order for us to continue to implement our business strategy and grow our revenue, we must effectively manage the number and quality of our relationships with Territory Partners, veterinarians and veterinary affiliates, including veterinary purchasing groups and associations, existing members, complementary online and other businesses, animal shelters, breeders and other referral sources, and continue to scale and improve our processes, programs and procedures that support them. Those processes, programs and procedures could become increasingly complex and difficult to manage as we grow. We must also contract with Territory Partners across our target geographies and educate them on our value proposition, so they are more effective in generating leads. In addition, any changes in our industry or the regulatory framework in which we operate could adversely impact our business model, revenue growth, cost structure, and overall operational efficiency.
Veterinary referrals represent our largest member acquisition channel. We spend significant time and resources attracting qualified and engaging Territory Partners and providing them with current information about our business and they, in turn, communicate the benefits of medical insurance for pets to veterinarians. Identifying and engaging quality Territory Partners can be challenging and Territory Partners typically need months or years to build their business before they can generate meaningful income. In addition, our relationship with our Territory Partners may be terminated at any time (for instance, if they feel unsupported or undervalued by us), and, if terminated, we may not recoup the costs associated with educating them about our subscription products, and the relationships with veterinarians developed by that Territory Partner would be unsupported until such time a new Territory Partner is installed. Sometimes a single relationship may be used to cover multiple territories so that a terminated relationship with a Territory Partner could significantly affect our company. Further, if we experience an increase in the rate at which Territory Partner relationships are terminated, we may not develop or maintain relationships with veterinarians as quickly as we have in the past or need to in order to execute our business strategy and our growth and financial performance could be adversely affected.
Territory Partners are independent contractors and, as such, may pose additional risks to our business.
Territory Partners are independent contractors and, accordingly, we do not directly provide the same direction, motivation and oversight over Territory Partners as we otherwise could if Territory Partners were our own employees. Further, Territory Partners may themselves employ or engage others; we refer to these partners and their associates, collectively, as our Territory Partners. We do not control a Territory Partner’s employment or engagement of others, and it is possible that their actions or the actions of their employees and/or contractors could create threatened or actual legal proceedings against us. Moreover, applicable law might prevent or limit our ability to subject our Territory Partners to non-compete obligations and similar restrictions in animal health channels. Similarly, Territory Partners may not require, or applicable law may not permit or may limit a Territory Partner’s ability to subject their employees or service providers tonon-compete obligations.
Territory Partners may decide not to participate in our marketing initiatives and/or training opportunities, accept our introduction of new solutions or comply with our policies and procedures applicable to them, any of which may adversely affect our ability to develop relationships with veterinarians and grow our membership. If we terminate a contract with a Territory Partner, such termination could also trigger contractually obligated termination payments or result in disputes, including threatened or actual legal or regulatory proceedings.
14
We believe that Territory Partners are not and should not be classified as employees under existing interpretations of the applicable laws of the jurisdictions in which we operate. We do not pay or withhold any employment tax with respect to or on behalf of Territory Partners or extend any benefits to them that we generally extend to our employees, and we otherwise treat Territory Partners as independent contractors. Applicable authorities or Territory Partners may in the future challenge this classification. Further, the applicable laws or regulations, including tax laws or interpretations, may change. If it were determined that we had misclassified any of our Territory Partners, we may be subjected to penalties and/or be required to pay withholding taxes, extend employee benefits, provide compensation for unpaid overtime, or otherwise incur substantially greater expenses with respect to Territory Partners. In addition, the costs associated with defending, settling, or resolving pending and future lawsuits or regulatory proceedings (including demands for arbitration) relating to the independent contractor status of Territory Partners could be material to our business.
Any of the foregoing circumstances could have a material adverse impact on our operating results and financial condition.
Our use of capital may be constrained by minimum capital requirements or contractual obligations.
Our insurance subsidiaries are required to maintain minimum levels of surplus capital to support our overall business operations in consideration of our size, scope, jurisdiction, and risk profile. We have in the past and may in the future fail to maintain the amount of risk-based capital required to avoid potentially costly additional regulatory oversight. We are also subject to contractual obligations related to reinsurance agreements with third parties (including Accelerant, who continues to underwrite a minority-portion of our policies in Canada) which require us to fund trust accounts to support the capital requirements of our insurance company partners.
To comply with these regulations and contractual obligations, we may be required to maintain capital that we would otherwise invest in our growth and operations, which may require us to modify our operating plan or marketing initiatives, delay the implementation of new initiatives or development of new technologies, decrease the rate at which we hire additional personnel and enter into relationships with Territory Partners, incur indebtedness or pursue equity or debt financings or otherwise modify our business operations, any of which could have a material adverse effect on our operating results and financial condition.
We operate in a competitive market which could adversely affect our prospects, operating results and financial condition.
We are and will continue to operate in a competitive market. The animal health industry is dynamic and evolving, and future changes could adversely affect us. In addition to pet parents self-financing their pets' medical care, there are traditional insurance companies that provide pet insurance products, either as a stand-alone product or along with a broad range of other insurance products, such as wellness. In addition, new entrants backed by large insurance companies have entered the pet medical insurance market in the past and more may do so in the future, particularly as the pet insurance category becomes more heavily penetrated. Further, traditional “pet insurance” providers may consolidate or take other actions to mimic the efficiencies from our vertically-integrated structure or create other operational efficiencies, which could lead to increased competition. The success of any of these competitors would, in time, affect our prospects, operating results and financial condition.
Some of our current and potential competitors have longer operating histories, larger customer bases, greater brand recognition and significantly greater financial, technical, marketing and other resources than we do. In addition to competing for new enrollments, such competitors may drive up pet acquisition costs and/or make offers that are more attractive to potential employees, referral sources and third-party service providers.
Moreover, some of our existing competitors may consolidate or be acquired, or may enter into new alliances with each other or establish or strengthen cooperative relationships. Any such consolidation, acquisition, alliance or cooperative relationship could adversely affect our ability to compete effectively and result in our loss of market share and could result in a competitor with greater financial, technical, marketing, service and other resources, all of which could harm our business, financial condition, cash flows and results of operations.
To compete effectively, we believe we will need to continue to invest significant resources in pet acquisition, improve our member service levels, enhance the online experience and functionalities of our website and in other technologies and infrastructure, including in our proprietary direct pay software. Failure to compete effectively against our current or future competitors could result in loss of current or potential members, which could adversely affect our pricing, lower our revenue, prevent us from maintaining profitability and diminish our brand strength.
Our actual veterinary invoice expense may exceed our current reserve established for veterinary invoices and may adversely affect our operating results and financial condition.
We maintain a recorded reserve for veterinary invoices that is based on our best estimates of the amount of veterinary invoices we expect to pay, inclusive of an estimate for veterinary invoices we have not yet received, after considering internal factors, including data from our proprietary data analytics platform, experience with similar cases, actual veterinary invoices paid, historical trends involving veterinary invoice payment patterns, patterns of receipt of veterinary invoices, seasonality, pending levels of unpaid veterinary invoices, veterinary invoice processing programs and contractual terms. We may also consider external factors, including changes in the law, court decisions, changes to regulatory requirements and economic conditions.
15
Because reserves are estimates of veterinary invoices that have been incurred but are not yet submitted to us, setting appropriate reserves is an inherently uncertain and complex process that involves significant subjective judgment. Further, in the United States and for a portion of our business in Canada, we do not transfer or cede our risk as an insurer and, therefore, we maintain more risk than we would if we purchased reinsurance.
Rising costs of veterinary care and the increasing availability and usage of more expensive, technologically advanced medical treatments may increase the amount of veterinary invoices we receive. Similarly, industry trends may emerge that are difficult to identify or to predict their impact on us, such as consolidated ownership of veterinary hospitals that increase prices more rapidly than we estimate.
Increases in the number and amount of veterinary invoices we receive could arise from unexpected or other events that are inherently difficult to predict or estimate, such as illness or disease that spreads through the pet population, tainted pet food or supplies or an unusually high number of serious injuries or illnesses. We may experience volatility in the number of veterinary invoices we receive from time to time, and short-term trends may not continue over the longer term. The number or amount of veterinary invoices may be affected by the level of care and attentiveness an owner provides to the pet, the pet’s breed and age (at enrollment) and other factors outside of our control, as well as fluctuations in member retention rates and by new member initiatives that encourage an increase in veterinary invoices and other new member acquisition activities.
The ultimate cost of paying veterinary invoices and the related administration may vary materially from recorded reserves, and such variance may result in adjustments to the reserve for veterinary invoices, which could have a material effect on our operating results and resources available for acquiring additional members.
As more veterinary hospitals install and use our patented proprietary software, the number of veterinary invoices we receive, and our associated expenses, are likely to increase.
Our patented proprietary software is designed to integrate directly with most practice management software systems used by veterinary hospitals and allow us to receive and pay veterinary invoices directly to the hospital. We have found that installation and use of our patented software by a veterinary hospital could increase the number of invoices we receive from that hospital. As more veterinary hospitals install our patented software, we expect the number or amount of veterinary invoices to increase and result in an increase in our cost of revenue, which may have a material adverse effect on our financial condition.
Our business depends on our ability to maintain and scale the infrastructure necessary to operate our technology platform and could be adversely affected by a system failure, security breach, loss of data or cyberattack.
Our business depends on our ability to maintain and scale the infrastructure necessary to operate our technology platform, which includes our analytics and pricing engine, systems for managing veterinary invoice payments, customer relationship management system, billing system, contact center phone system and website. We use these technology frameworks to price our subscriptions, provide quotes to prospective members, enroll members, engage with current members and pay veterinary invoices. Prospective members research and purchase subscriptions through our website and contact center. Our reputation and ability to acquire, retain and serve our members and support our partners depends on the reliable performance of our technology platform and the underlying network systems and infrastructure, and on providing best-in-class member service, including through our contact center and website. As our member base continues to grow, the amount of information collected and stored on the systems and infrastructure supporting our technology platform will continue to grow, and we expect to require an increasing amount of network capacity, computing power and information technology personnel to develop and maintain our technology platform and service our departments involved in member interaction and comply with regulations governing the collection, use, retention, sharing and security of personal information.
We have made, and expect to continue to make, substantial investments in equipment and related network infrastructure to handle the operational demands on our technology platform, including increasing data collection, software development, traffic on our website and the volume of calls at our contact center. The operation of the systems and infrastructure supporting our technology platform is expensive and complex and could experience operational failures. In the event that our data collection, member base or amount of traffic on these systems grows more quickly than anticipated, we may be required to incur significant additional costs to increase the capacity in our systems. Further, our development and implementation activities may not be successful, may not be well-received by veterinarians or by prospective or existing members, particularly if they are costly, cumbersome or unreliable, and we may incur delays or cost overruns or elect to curtail our currently planned expenditures related to them. Even if our system improvements are well-received, they may be or become obsolete due to regulatory or technological reasons or the availability of alternative solutions in the marketplace. If new solutions and enhancements are not successful on a long-term basis or we are required to maintain legacy systems longer than anticipated, we may not realize benefits from these investments, and our business and financial condition could be adversely affected.
16
In addition, any system failure that causes an interruption in or decreases the responsiveness of our services could impair our revenue-generating capabilities, harm our business and operating results and damage our reputation. Any loss or mishandling of data could result in breach of confidence, competitive disadvantage or loss of members, and subject us to potential liability or regulatory action. Any failure of the systems and infrastructure that we rely on could negatively impact our enrollments as well as our relationship with members. If we do not maintain or expand the systems and infrastructure underlying our technology platform successfully, or if we experience operational failures, including those that may impact our proprietary direct pay software, our reputation could be harmed and we could lose current and potential members, which could harm our operating results and financial condition.
Computer viruses, hackers, employee misconduct, and other external hazards could expose our technology platforms to security breaches, cyber-attacks or other disruptions. While we have implemented security measures designed to protect against breaches of security and other interference with our systems and networks, our systems and networks may be subject to breaches or interference and we, and our third-party service providers, will likely continue to experience cybersecurity incidents of varying degrees. Any such event may result in operational disruptions as well as unauthorized access to, the disclosure of, or loss of our proprietary information or our customers’ data and information, which in turn may result in legal claims, regulatory scrutiny and liability, reputational damage, the incurrence of costs to eliminate or mitigate further exposure, the loss of customers or affiliated advisors, or other damage to our business. In addition, the trend toward general public notification of such incidents could exacerbate the harm to our business, financial condition and results of operations. Even if we successfully protect our technology infrastructure and the confidentiality of sensitive data, we could suffer harm to our business and reputation if attempted security breaches are publicized. We cannot be certain that advances in criminal capabilities, discovery of new vulnerabilities, attempts to exploit vulnerabilities in our systems, data thefts, physical system or network break-ins or inappropriate access, or other developments will not compromise or breach the technology or other security measures protecting the networks and systems used in connection with our business.
Third parties to whom we outsource certain of our functions are also subject to these risks. While we can review and assess our third-party providers’ cybersecurity controls, as appropriate, and make changes to our business processes to manage these risks, we cannot ensure that our attempts to keep such information confidential will always be successful. Moreover, our use of third-party services (e.g. cloud technology and software as a service) can make it more difficult to identify and respond to cyberattacks in any of the above situations due to the dynamic nature of these technologies and because we do not directly control these services.
Our business increasingly depends on online technologies and platforms, including Internet affiliate sites, partner channels, generative AI, and social media, to attract potential new members to visit our websites. As our dependency on these online technologies and platforms increases and if the methods for members to obtain information about us are modified, our new member growth could decline, and our business and operating results could be harmed.
We endeavor to drive significant traffic to our website from consumers who search for pet medical insurance on the Internet. The online methods for obtaining information about us has changed over time from Internet search engines to other methods, including Internet affiliate sites, partner channels generative AI, such as Grok and ChatGPT, social media platforms, and other websites that provide articles, reviews, pricing or information about pet insurance. A critical factor in attracting consumers to our websites is dependent on our online presence, including whether and how prominently we appear in search results, on aggregator sites, in news articles and blogs and in social media posts about the pet insurance industry. If we are listed less prominently in, or do not appear for any reason in these online information sources, the traffic to our websites would decline and we may not be able to replace this traffic, which in turn would harm our business, operating results and financial condition. In addition, if we attempt to replace this traffic, we may be required to increase our pet acquisition expenditures, which may adversely impact our business and operating results.
Our success depends in part on our ability to review, process, and pay veterinary invoices timely and accurately.
We believe member satisfaction and retention depends in part on our ability to accurately evaluate and pay veterinary invoices in a timely manner. Many factors can affect our ability to do this, including the training, experience and skill of our personnel, our ability to reduce the number of payment requests made for services not included in our subscription, effectiveness of management, our ability to develop or select and implement appropriate procedures, supporting technologies and systems, changes in our policy and veterinarian compliance with our protocols and procedures. Our failure to pay veterinary invoices, accurately and in a timely manner, or to deploy resources appropriately, could result in unanticipated costs to us, lead to material litigation, undermine member goodwill and our reputation, and impair our brand image and, as a result, materially and adversely affect our competitiveness, financial results, prospects and liquidity.
17
In addition, we automate the payment of veterinary invoices using machine learning. Although we intend to increase the percentage of veterinary invoices paid without human intervention and process veterinary invoices in seconds, our efforts may be unsuccessful for a number of reasons. The data we gather is extensive, and the development, maintenance and operation of our data analytics engine is novel, expensive and complex. We may face unforeseen difficulties, including material performance problems, undetected defects or technical obstacles, for example, with new capabilities incorporating machine learning. If such problems, defects, or obstacles prevent our proprietary algorithms from operating properly, we may incorrectly pay or deny claims made by our customers. Such errors could result in existing members canceling their policies, prospective members declining to purchase our subscription, or improper payments that reduce our resources. Additionally, our artificial intelligence and machine learning algorithms may lead to unintentional bias or discrimination, which could subject us to legal or regulatory liability that has a material and adverse effect on our business, results of operations and financial condition.
State legislatures and insurance regulators have shown interest in insurance companies' use of external data and artificial intelligence in insurance practices, including underwriting, marketing, communicating with customers and prospects, and claims practices. The NAIC has adopted Artificial Intelligence Principles. In addition, a number of states have had legislative or regulatory initiatives relating to the use of external data and artificial intelligence in the insurance industry, such as bulletins issued by the California and Connecticut Departments of Insurance advising insurers of their obligations related to unfair discrimination when using data and artificial intelligence. There is also increasing focus on regulating the use of artificial intelligence and machine learning in Europe such as the proposal by the European Commission for regulation on artificial intelligence using a comprehensive risk-based governance framework. Increased focus on regulation in the United States and foreign jurisdictions could subject us to legal or regulatory liability that has a material and adverse effect on our business, results of operations and financial condition.
We may not identify fraudulent or improperly inflated veterinary invoices.
It is possible that we may pay a veterinary invoice which appears authentic but in fact reflects false services, products or prices. It is also possible that veterinarians will charge insured customers higher amounts than they would charge their non-insured clients for the same service or product, or may alter medical records or exclude information from records. Such activity could lead to unanticipated costs to us and/or to time and expense to recover such costs. They could also lead to strained relationships with veterinarians and/or members, and could adversely affect our competitiveness, financial results and liquidity.
If we are unable to maintain and enhance our brand recognition and reputation, our business and operating results will be harmed.
We believe that maintaining and enhancing our brand recognition and reputation is critical to our relationships with existing members, Territory Partners, veterinarians and others, and to our ability to attract new members, new Territory Partners, and additional supportive veterinarians and their teams. We also believe that the importance of our brand recognition and reputation will continue to increase as competition in our market continues to develop and mature. Our success in this area will depend on a wide range of factors, some of which are out of our control, including the following:
•the efficacy and viability of our pet acquisition programs and initiatives;
•the perceived value of our subscription;
•the quality of service provided, including the fairness, ease and timeliness of reviewing and paying veterinary invoices;
•actions of our competitors, Territory Partners, veterinarians and others;
•positive or negative publicity, including regulatory pronouncements and material on the Internet or social media;
•regulatory and other government-related developments; and
•litigation-related developments.
The promotion of our brand requires us to make substantial investments, and we anticipate that, as our market becomes increasingly competitive, these branding initiatives may become increasingly difficult and expensive. Our brand promotion activities may not be successful or yield increased revenue, and to the extent that these activities result in increased revenue, the increased revenue may not offset the expenses we incur and our operating results could be harmed. If we do not successfully maintain and enhance our brand, our business may not grow which would harm our operating results and financial condition.
Furthermore, negative publicity, whether or not justified, relating to events or activities attributed to us, our employees, Territory Partners, our strategic partners, our affiliates, or others associated with any of these parties, may tarnish our reputation and reduce the value of our brands. Damage to our reputation and loss of brand equity may reduce demand for our services and have an adverse effect on our business, operating results, and financial condition. Moreover, any attempts to rebuild our reputation and restore the value of our brands may be costly and time consuming, and such efforts may not ultimately be successful.
18
We have in the past, and may in the future identify material weaknesses in our internal controls which, if not remediated appropriately or timely, could result in an inability to effectively and timely complete our financial statements, which may result in a loss of investor confidence and an adverse impact to our stock price.
Section 404 of the Sarbanes-Oxley Act of 2002 (the "Sarbanes-Oxley Act") requires that we evaluate and determine the effectiveness of our internal control over financial reporting and provide a management report on the internal control over financial reporting, which must be attested to by our independent registered public accounting firm. We have in the past identified material weaknesses or significant deficiencies in our internal control over financial reporting, which have been remediated. We may, in the future, identify material weaknesses or significant deficiencies in our internal control over financial reporting, which may result in us not detecting material errors in our financial statements on a timely basis. If we, or our independent registered public accounting firm, identify future material weaknesses in our internal control over financial reporting, we are unable to comply with the requirements of Section 404 in a timely manner, we are unable to assert that our internal control over financial reporting is effective or our independent registered public accounting firm is unable to express an opinion as to the effectiveness of our internal control over financial reporting, investors may lose confidence in the accuracy and completeness of our financial reports and the market price of our common stock could be negatively affected. We could also become subject to investigations by the stock exchange on which our securities are listed, the SEC or other regulatory authorities, which could require additional financial and management resources.
If we fail to effectively manage our growth, our business, operating results and financial condition may suffer.
We have experienced, and expect to continue to experience, significant growth in an underpenetrated market, which has placed, and may continue to place, significant demands on our management and our operational, technological and financial systems and infrastructure. We expect that our growth strategy will require us to commit substantial financial, operational and technical resources and this commitment may also result in increased costs (such as member acquisition costs or costs associated with increases in the number or amounts of veterinary invoices received) generated by our business, which could prevent us from achieving profitability and remaining profitable and could impair our ability to compete effectively for business. If we do not effectively manage growth at any time, our financial condition could be harmed and the quality of our services could suffer.
In order to successfully expand our business, we need to hire, integrate and retain in-demand highly skilled and motivated employees and continue to improve our existing systems for operational, data and financial management. These improvements could require significant ongoing capital expenditures and continue to place increasing demands on our management. If we do not successfully implement improvements in these areas, our business, operating results and financial condition will be harmed.
Emerging claim and coverage issues may adversely affect our business.
As industry practices and legal, judicial, social and other environmental conditions change, unexpected and unintended issues related to claims and coverage may emerge, including new or expanded theories of liability. These or other changes could impose new financial obligations on us by extending coverage beyond our underwriting intent or otherwise require us to make unplanned modifications to the products and services that we provide, or cause the delay or cancellation of products and services that we provide. In some instances, these changes may not become apparent until sometime after we have issued subscriptions that are affected by the changes. As a result, the full extent of liability under our subscriptions may not be known for many years after the subscription begins.
Our operating results may vary, which could make period-to-period comparisons less meaningful, and make our future results difficult to predict.
We have historically experienced, and may in the future experience, fluctuations in our revenue, expenses and operating results. Our operating results may fluctuate in the future as a result of a number of factors, many of which are beyond our control. These fluctuations may make comparing our operating results on a period-to-period basis less meaningful and make our future results difficult to predict. You should not rely on our past results as an indication of our future performance. In addition, if revenue levels do not meet our expectations, our operating results and ability to execute on our business plan are likely to be harmed.
Seasonal or periodic variations in the behavior of our members also may cause fluctuations in our financial results. Enrollment in our subscription tends to be discretionary in nature and may be sporadic, reflecting overall economic conditions, budgeting constraints, pet-buying patterns and a variety of other factors, many of which are outside our control.
Due to these and other factors, our financial results for any quarterly or annual period may not meet our expectations or the expectations of investors or analysts that follow our stock and may not be meaningful indications of our future performance.
19
Changes in the economy may affect consumer spending on our subscription and this may negatively impact our business, operating results and financial condition.
Our business may be affected by changes in the economic environment. Members may reduce or eliminate their spending during an economic downturn, resulting in an increase in subscription cancellations and a reduction in the number of new member enrollments. We may experience a material increase in cancellations or a material reduction in our member retention rate in the future, especially in the event of a prolonged recessionary period or a downturn in economic conditions. In addition, media prices and other costs may change with changes in the economic environment, which could increase our new pet acquisition expenses. As a result, our business, operating results and financial condition may be significantly affected by changes in the economic environment.
We depend on key personnel to operate our business and, if we are unable to retain, attract and integrate qualified personnel, our ability to develop and successfully grow our business could be harmed.
Our success depends to a significant extent on the continued services of our leadership team, such as Margi Tooth, our Chief Executive Officer and President. Moreover, the loss of key executives or employees or the departure of members of our board within a short time frame could have a material adverse effect on our business. We have experienced turnover in our management team in the past and may experience similar turnover in the future. We would be adversely affected if we fail to adequately plan for the succession of our senior management and other key employees. Additionally, if we were to lose a large percentage of our current employees in a relatively short time period, or our employees were to engage in a work stoppage or unionize, we may be unable to hire and train new employees quickly enough to prevent disruptions in our operations, which may result in the loss of members, Territory Partners and/or referral sources.
We may continue to create, invest in or acquire businesses, products and technologies, which could divert our management’s attention, result in additional dilution to our stockholders, otherwise disrupt our operations or harm our operating results.
We have in the past created, invested in or acquired complementary businesses, products, technologies and new lines of business, and we may continue to do so in the future. Our ability to successfully evaluate and manage investment opportunities, or make and integrate acquisitions or products, is unproven. For example, we have invested in a pet food initiative, and we believe that pet food will be an important part of our offerings over the long term. We have not, historically, had experience manufacturing, selling, or distributing food products and pet food manufacturing facilities and pet food products are subject to many laws and regulations administered by the United States Department of Agriculture, the Federal Food and Drug Administration, the Occupational Safety and Health Administration, and other federal, state, local, and foreign governmental agencies relating to the production, packaging, labelling, storage, distribution, quality, and safety of food products and the health and safety of employees.
We have also acquired technology intended to enable us to improve our back-end software and facilitate certain expansion efforts, and we may leverage other technologies to help us improve other aspects of our business, but technology integration is complicated, expensive and time consuming, and it may not result in us realizing the intended benefits from the acquisition.
The pursuit of potential new products, investments or acquisitions may divert the attention of management and cause us to incur various expenses in identifying, investigating and pursuing suitable opportunities, whether or not they are consummated. Further, even if we successfully invest in or acquire additional businesses or technologies, we may not achieve the anticipated benefits from the transaction. The investment or acquisition may also expose us to additional risks, including from unknowingly inheriting liabilities that are not adequately covered by contractual remedies. Acquisitions or investments could also result in dilutive issuances of equity securities or the incurrence of debt, which could adversely affect our operating results.
If we do not spend our development budget efficiently or effectively on commercially successful and innovative offerings and products, we may not realize the expected benefits of our strategy. Further, our development efforts with respect to new products and offerings and integrations of acquired businesses could distract management from current operations, and will divert capital and other resources from our more established products and offerings. If an investment or acquisition fails to meet our expectations, our business, operating results and financial condition may suffer.
We may not realize the benefits of our current and planned strategic relationships.
We have developed, maintain, and in the future may seek new strategic relationships with various third parties. For these efforts to be successful, we must negotiate and enter into agreements with these third parties on terms that are attractive to us, and then successfully implement the arrangement, which requires integrating and coordinating their resources and capabilities with our own, which may present challenges relating to technology integration, marketing, branding, regulatory matters, customer support, and other operational matters. These relationships may require several years to implement, may face delays or terminations, and may not be successfully implemented at all. We may be unsuccessful in entering into agreements with acceptable third parties, negotiating favorable terms in these agreements, or achieving the anticipated results over our desired time horizon or at all. In addition, some of our historical strategic relationships have required us to agree to exclusivity, and or other terms that may limit our ability to pursue opportunities we might otherwise pursue. In connection with our strategic
20
relationships, we have in the past and may in the future provide equity consideration, impose contractual holding periods for such securities, impose standstill obligations or include other requirements that terminate in the event the strategic relationship ceases, which may have an adverse effect on our stock price and otherwise cause our business to suffer.
Strategic relationships also involve various risks, depending on their structure, including the following:
•our strategic partnerships may not be successful;
•we may change our strategy or plans and not achieve the intended benefits of our strategic initiatives and relationships;
•we may be unable to convert leads from our strategic referral partners into enrolled pets;
•our strategic partners could terminate their relationships with us;
•our strategic partners may acquire or form alliances with our competitors, thereby reducing or eliminating their business with us;
•we may overpay strategic partners relative to the business the relationship generates; and
•negative publicity and other issues faced by our strategic partners could adversely impact us, including by harming our brand and reputation.
If we are unsuccessful in our strategic relationships, we may not realize the intended benefits of these relationships, lose the investment we have made in these relationships, face difficulty entering into other relationships, and our business may suffer.
Our business and financial condition is subject to risks related to our writing of policies for unaffiliated third parties, including Pets Best.
Our other business segment includes revenues and expenses related to underwriting policies on behalf of third parties that do not carry reference to the Trupanion brand. In the past, our other business segment involved numerous third parties to varying extent, but in recent years this segment has consisted almost entirely of business with Pets Best, a third-party managing general agent. For the year ended December 31, 2025, premiums from policies written for Pets Best, pursuant to our agreements with them, accounted for 30% of our total revenue. Our Pets Best business historically has had, and we expect it to continue to have, significantly lower margins than our subscription business. The contractual relationship with Pets Best and other third parties may be terminated by either party, and the third party may choose to be in a relationship with a different underwriter, including one of our competitors. In administering or marketing a product to consumers, if one of these unaffiliated third parties make an operating decision that adversely affects its business or brand, our business or brand could also be adversely impacted. Further, we rely on the timely dissemination of financial information from these third parties to compile our own financial statements. Failure to receive this information timely, or failure to receive complete and accurate information, could negatively impact our ability to meet regulatory filing requirements, including the filing of our annual audited financial statements.
We and Pets Best have agreed to roll off a portion of our business together, as Pets Best ramps up policies written by other insurers. We do not control the timing or extent of this roll off and, accordingly, it may not proceed as we expect, which could cause our results to fluctuate or have other unexpected impacts on our business. During the roll-off of Pets Best, administration of this business and any similar business in the future may divert our time and attention away from our subscription business segment, which could adversely affect our operating results in the aggregate. Further, the roll-off is expected to result, over time, in significantly reduced premiums (and associated expense) in our other business segment. This reduced revenue stream will reduce the diversification of our premium base and make us more dependent on the success of our subscription business segment, at least in the short term. Further, the reduction of this business could have a material adverse impact on our operating results, financial condition, and stock price.
If the transition of our underwriting activity in Canada to our underwriting subsidiary GPIC from Accelerant, a third-party underwriter, is delayed or unsuccessful, our business, operating results and financial condition may be harmed.
Although we have transitioned most of our Canadian policies to GPIC, our wholly-owned subsidiary, a portion of our business is still written through Accelerant. Under our arrangement with Accelerant, we have assumed all premiums written by Accelerant and the related veterinary invoice expense through an agency agreement and a fronting and administration agreement. GPIC has limited operating history, and as it continues underwriting policies, we will face risks and uncertainties similar to those faced by our United States insurance company APIC. As a relatively new underwriting entity, GPIC may face undue scrutiny from regulators, which may affect its financial position and may require a disproportionate amount of internal administrative resources. With respect to the continued transition itself, we may encounter regulatory delay and challenges, face operational and information technology issues that are new to us, and create confusion for our members. In addition, we may be required to contribute more risk-based capital into GPIC, potentially over a short time frame as our underwritten premiums grow at a rapid pace.
21
We have international operations and are subject to a number of risks associated with international expansion and operations.
We have developed our operations internationally and we may in the future continue exploring opportunities in the geographies where we do not currently operate. Currently, we have pet insurance subsidiaries in Europe that operate in Germany, Switzerland, Belgium, the Czech Republic and Slovakia. We have limited history of marketing, selling, administering and supporting our subscription product for consumers in Europe. In general, international sales and operations may be subject to a number of risks, including the following:
•regulatory rules and practices, including robust privacy regulations, foreign exchange controls, tariffs, tax laws and treaties that are different than those in North America where we primarily operate;
•the costs and resources required to modify our subscription appropriately to suit the needs and expectations of residents and veterinarians in such foreign countries;
•our data analytics platform may have limited applicability in foreign countries, which may impact our ability to develop adequate underwriting criteria and accurately price subscriptions in such countries;
•increased expenses incurred in establishing and maintaining office space and equipment for our international operations;
•technological incompatibility between our patented proprietary software and software used by veterinarians;
•difficulties in modifying our business model or subscription in a manner suitable for any particular foreign country, including any modifications to our Territory Partner model to the extent we determine that our existing model is not suitable for use in foreign countries;
•our lack of experience in marketing to consumers and veterinarians and online engagement in foreign countries, especially if doing so in a foreign language;
•our relative lack of industry connections in many foreign countries;
•our ability to locally hire, integrate and retain highly skilled and motivated employees and establish and improve systems for operational and financial management where appropriate;
•difficulties in managing operations due to language barriers, distance and time zone differences, staffing, cultural differences and business infrastructure constraints, including difficulty in obtaining foreign and domestic visas;
•the uncertainty of protection for intellectual property rights in some countries; and
•general economic and political conditions in these foreign markets.
These and other factors could harm our ability to gain future international revenue and increase our expenses, which would materially impact our business and operating results. The expansion of our existing international operations and any entry into additional international markets could require significant management attention and financial resources, which may detract from management attention and financial resources otherwise available to our existing business. Our failure to successfully manage our international operations and the associated risks effectively could limit the future growth of our business and could have an adverse effect on our operating results and financial condition.
Changes in foreign exchange rates may adversely affect our revenue and operating results.
Our international operations expose us to the risk of changes in currency exchange rates, particularly with respect to our Canada operations. For the year ended December 31, 2025, approximately 16% of our total revenue was generated in Canada, and approximately 1% of our revenue was generated in Europe. Fluctuations in the relative strength of the U.S. dollar compared to the currencies of other jurisdictions in which we operate has in the past and could in the future adversely affect our revenue and operating results. Moreover, in the future, we may continue to expand the number of countries in which we offer products and operate and this could increase our exposure to currency exchange rate fluctuations.
Owning multiple insurance subsidiaries may harm our results of operations.
We currently have insurance subsidiaries in the U.S. and Canada. Our two primary insurance subsidiaries in the U.S. are APIC, domiciled in New York, and ZPIC, domiciled in Missouri. In Canada, our wholly-owned insurance subsidiary, GPIC, underwrites most of our Canadian business. Over time, we may also seek to acquire or establish other insurance subsidiaries, including to support our operations in certain countries in Continental Europe.
Acquisitions and operations of these insurers present a number of risks, including the following:
•Acquiring or forming a new insurance subsidiary may divert the attention of management and cause us to incur various expenses in identifying, investigating and pursuing suitable opportunities, whether or not the acquisition or formation is completed.
•Even if we are successful in forming or acquiring a new insurance subsidiary we may not achieve the anticipated benefits. We may incur additional costs if we decide to sell or dissolve any such subsidiary.
•Each insurance entity will likely require a significant initial minimum capital contribution. It may take a longer period of time to achieve efficiency on these contributions, if ever.
22
•Each insurance entity will be subject to additional regulatory scrutiny in the jurisdiction of incorporation and any additional jurisdictions in which the insurance subsidiary operates. Failure to comply with laws, regulations and guidelines applicable to a new insurance subsidiary could result in significant liability, result in the loss of revenue and otherwise harm our business, operating results and financial condition.
•A supervisory regulator may increase the amount of capital we must hold in an insurance subsidiary, especially if it shows material growth. We may not have easy access to such capital, and using it for this purpose may prevent us from investing in our growth and operations, which may require us to modify our operating plan, delay new initiatives, interfere with personnel growth, incur indebtedness or pursue financings, or otherwise modify our operations, any of which could have a material adverse effect on our operating results and financial condition.
•If the required minimum capital in one of our insurers falls below the required threshold, the responsible regulator may take action, or such a reduction may result in a breach of various contractual relationships, including, for example, with the unaffiliated general agents for which we write medical insurance for pets policies, which may give such parties the ability to cancel their contracts with us and/or sue us for damages related to our risk-based capital levels, which could have a material adverse effect on our financial condition.
•We may not obtain required regulatory approvals in connection with potentially investing a portion of an insurer’s assets, for example in real property.
We may require additional capital to meet our risk-based capital requirements, pursue our business objectives and respond to business opportunities, challenges or unforeseen circumstances. If capital is not available to us at any time, our business, operating results and financial condition may be harmed.
We may require additional capital to meet our risk-based capital requirements, operate or expand our business or respond to unforeseen circumstances. Additional funds may not be available when we need them, on terms that are acceptable to us, or at all. For instance, our arrangement with Aflac requires that, before we issue or sell equity to another investor, we are required to provide Aflac an opportunity to purchase equity allowing them to maintain their ownership percentage. This requirement may introduce delays or prevent us from raising funds through the issuance of securities. If we raise additional funds through the issuance of equity or convertible securities, the percentage ownership of holders of our common stock could be significantly diluted and these newly issued securities may have rights, preferences or privileges senior to those of holders of our common stock. Further, volatility in the equity markets may have an adverse effect on our ability to obtain equity financing or the cost of such financing and, in the event we require additional debt financing, volatility in the debt markets may have an adverse effect on our ability to obtain debt financing or the cost of such financing. Similarly, our access to funds may be impaired if regulatory authorities or rating agencies take negative actions against us. If a combination of these factors were to occur, our internal sources of liquidity may prove to be insufficient and, in such case, we may not be able to successfully obtain additional financing on favorable terms. If funds are unavailable to us on reasonable terms when we need them, we may be unable to meet our risk-based capital requirements, train and support our employees, support Territory Partners, maintain the competitiveness of our technology, pursue business opportunities, service our existing debt, pay veterinary invoices or acquire new members, any of which could have an adverse effect on our business, operating results and financial condition.
If our security measures are breached and unauthorized access is obtained to our data, including our members’ data, we may lose our competitive advantage, our systems may be perceived as not being secure, we may incur third-party liability, and/or be subject to regulatory action.
Our data repository contains proprietary information that we believe gives us a competitive advantage, including data on veterinary invoices received and other data with respect to members, Territory Partners, veterinarians and other third parties. We also collect and utilize demographic and other information from and about prospective and existing members when they visit our website, call our contact center and apply for enrollment. Further, we use tracking technologies, including “cookies,” to help us manage and track our members’ interactions and deliver relevant advice and advertising. Security breaches could expose us to a risk of loss of our data and/or disclosure of this data, either publicly or to a third party who could use the information to gain a competitive advantage. Because techniques used to obtain unauthorized access or to sabotage systems change frequently and generally are not recognized until launched against a target, we may be unable to anticipate these techniques or implement adequate preventative measures. In the event of a loss of our systems or data, we could experience increased costs, delays, legal liability and reputational harm, which in turn may harm our financial condition, damage our brand and result in the loss of members. Such a disclosure also could lead to litigation and possible liability.
In the course of operating our business, we store and/or transmit our members’ confidential information, including credit card and bank account numbers and other private information. Because the methods used to obtain unauthorized access to private information change frequently and may be difficult to detect for long periods of time, security breaches would expose us to a risk of loss of this information, litigation and possible liability. Our payment services are similarly susceptible to credit card and other payment fraud schemes, including unauthorized use of credit cards, debit cards or bank account information, identity theft or merchant fraud.
23
If our security measures are breached as a result of third-party action, employee error, malfeasance or otherwise, and, as a result, someone obtains unauthorized access to our data, including data of our members, our reputation may be damaged, our business may suffer and we could incur significant liability. Because techniques used to obtain unauthorized access or to sabotage systems change frequently and generally are not recognized until launched against a target, we may be unable to anticipate these techniques or implement adequate preventative measures. If an actual or perceived breach of our security occurs, the public perception of the effectiveness of our security measures could be harmed.
In addition, cyber-attacks or acts of terrorism could cause disruptions in our business or the economy as a whole. Our servers and systems may also be vulnerable to computer viruses, break-ins and similar disruptions from unauthorized tampering with our computer systems, which could lead to interruptions, delays, loss of critical data or the unauthorized disclosure of confidential member data. In the event of any disruption to our business, our preparations and plans to address any such disruption may be inadequate or ineffective. Our disaster recovery may be insufficient or inappropriate, and business interruption insurance may be insufficient to compensate us for losses that may occur. Such disruptions could negatively impact our ability to run our business, which could have an adverse effect on our reputation, operating results and financial condition.
We are subject to a number of risks related to accepting automatic fund transfers and credit card and debit card payments.
We accept payments from our members through automatic fund transfers, via credit and debit card, and mobile payment applications. For payments via credit and debit card and mobile payment applications, we pay interchange and other fees, which may increase over time. An increase in the number of members who utilize credit and debit cards and mobile apps to make their payments or an increase in related credit and debit card fees would reduce our margins and could require us to increase our fees, which could cause us to lose members and revenue, or suffer an increase in our operating expenses, either of which could adversely affect our operating results.
If we, or any of our processing vendors or banks have problems with our third-party billing software, or if the billing software malfunctions, it could have an adverse effect on our member satisfaction and new member growth and could cause one or more of the major credit card companies or banks to disallow our continued use of their payment products. In addition, if our billing software fails to work properly and, as a result, we do not automatically charge our members’ credit cards on a timely basis or at all, or a bank withdraws the incorrect amount or fails to timely transfer the correct amount to us, we could lose revenue and harm our member experience, which could adversely affect our business and operating results. Moreover, any of our third-party billing providers could fail to process payments, or could process payments in the wrong amounts, which could result in us failing to collect premiums, could result in increased cancellations and could adversely affect our reputation.
We are also subject to payment card association operating rules, certification requirements and rules governing electronic funds transfers, including the Payment Card Industry Data Security Standard ("PCI DSS"), a security standard applicable to companies that collect, store or transmit certain data regarding credit and debit cards, holders and transactions. We are currently compliant with PCI DSS in North America but our internal compliance efforts are ongoing with respect to acquired businesses. We may not be fully or materially compliant with PCI DSS, or other payment card operating rules in the future. Any failure to comply with the PCI DSS in the future may violate payment card association operating rules, federal and state laws and regulations, and the terms of our contracts with payment processors and merchant banks. Such failure to comply may subject us to fines, penalties, damages and civil liability, and may result in the loss of our ability to accept credit and debit card payments. In addition, there is no guarantee that PCI DSS compliance will prevent illegal or improper use of our payment systems or the theft, loss or misuse of data pertaining to credit and debit cards, credit and debit card holders and credit and debit card transactions.
If we fail to adequately control fraudulent payment processing, we may face civil liability, diminished public perception of our security measures and significantly higher credit card-related costs, each of which could adversely affect our business, operating results and financial condition.
If we are unable to maintain our chargeback rate at acceptable levels, our credit card fees for chargeback transactions, or our fees for many or all categories of credit and debit card transactions, credit card companies and debit card issuers may increase our fees or terminate their relationship with us. Any increases in our credit card and debit card fees could adversely affect our operating results, particularly if we elect not to raise our fees. The termination of our ability to process payments on any major credit or debit card would significantly impair our ability to operate our business.
24
We may face unexpected costs as a result of owning our own headquarters office building.
We own our headquarters office building in Seattle, Washington, and lease a portion of the building to third parties. Our financial condition and cash flow could be materially affected by changes in costs associated with maintaining the building and ensuring it is suitable for our use and that of other tenants and maintain compliance with all environmental and other regulations applicable to ownership of real estate. Failure to attract and retain tenants for our unused space will result in our not receiving rental income and could also cause a reduction in the value of the building. Managing tenants, maintaining the building, and otherwise facing the costs and responsibilities of being the owner of a building may be a distraction from our core business and cause our performance to suffer. We are also exposed to potential third-party liability as the owner of our office building, such as if an accident occurs on the premises.
Failure to adequately protect our intellectual property could substantially harm our business and operating results.
We rely on a combination of intellectual property rights, including trade secrets, patents, copyrights, trademarks and domain names, as well as contractual restrictions, to establish and protect our patented proprietary software and our intellectual property. Despite our efforts to protect our proprietary rights, unauthorized parties may attempt to copy our digital content, pricing analytics, technology, software, branding and functionality, or obtain and use information that we consider proprietary. Moreover, policing our proprietary rights is difficult and may not always be effective. We may need to enforce our rights internationally under the laws of countries that do not protect proprietary rights to as great an extent as do the laws of the United States, which may be expensive and divert management’s attention away from other operations.
Our proprietary software is protected by patents which may not be sufficient to maintain effective product exclusivity because patent rights are limited in time and do not always provide effective protection. Furthermore, we monitor market activity for potential infringement of our patents and bring claims to protect and enforce our patent rights from time to time.Such claims may involve substantial cost, and they may distract management from operating our business. In addition, our efforts may be ineffective, could result in the invalidation of our patent rights, and could substantially harm our operating results. In addition, patents have a limited lifespan (generally 20 years after they are filed in the United States). Once the patent life has expired for our software, our competitors will be able to use our patented technology.
We seek to control access to our proprietary technology, software and documentation by entering into confidentiality and invention assignment agreements with our employees and partners, confidentiality agreements or license agreements with third parties, such as service providers, vendors, individuals and entities that may be exploring a business relationship with us, and terms of use with third parties, such as veterinary hospitals desiring to use our technology, software and documentation. These agreements may not prevent disclosure of intellectual property, trade secrets and/or other confidential information, and may not provide an adequate remedy in the event of misappropriation of trade secrets or any unauthorized disclosure of trade secrets and other confidential information. Costly and time-consuming litigation could be necessary to enforce and determine the scope of our intellectual property rights and related confidentiality, license and nondisclosure provisions, and failure to obtain or maintain trade secret protection, or our competitors being able to obtain our trade secrets or to independently develop technology similar to ours or competing technologies, could adversely affect our competitive business position.
Assertions by third parties of infringement or other violation by us of their intellectual property rights could result in significant costs and substantially harm our business and operating results.
Third parties have in the past and may in the future claim that our services or technologies, including our proprietary software, infringe or otherwise violate their intellectual property rights. We may be subject to legal proceedings and claims, including claims of alleged infringement by us of the intellectual property rights of third parties. Any dispute or litigation regarding intellectual property could be expensive and time consuming, regardless of the merits of any claim, and could divert our management and key personnel from our operations.
If we were to discover or be notified that our services or our proprietary software potentially infringe or otherwise violate the intellectual property rights of others, we may need to obtain licenses from these parties in order to avoid infringement. We may not be able to obtain the necessary licenses on acceptable terms, or at all, and any such license may substantially restrict our use of the intellectual property. Moreover, if we are sued for infringement and lose the lawsuit, we could be required to pay substantial damages or be enjoined from offering the infringing services. Any of the foregoing could cause us to incur significant costs and prevent us from selling or properly administering subscriptions or performing under our other contractual relationships.
The outcome of litigation or regulatory proceedings could subject us to significant monetary damages, restrict our ability to conduct our business, harm our reputation and otherwise negatively impact our business.
From time to time, we have been, and in the future may become, subject to litigation, claims and regulatory proceedings and inquiries, including market conduct examinations and investigations by state insurance regulatory agencies and threatened or filed lawsuits by, among others, government agencies, employees, competitors, stockholders, prospective, current or former members, or business partners.
We cannot predict the outcome of these actions or proceedings, and the cost of defending such actions or proceedings could be
25
material. Further, defending such actions or proceedings could divert our management and key personnel from our business operations. If we are found liable in any action or proceeding, we may have to pay substantial damages or fines, which may have a material adverse effect on our business, operating results, financial condition and prospects. More critically, an adverse result from a proceeding could require us to change the way we conduct our business, including our marketing and sales practices, and such a result may have a greater adverse effect on our business than monetary damages or fines. There may also be negative publicity associated with litigation or regulatory proceedings that could harm our reputation or decrease acceptance of our services. These claims may be costly to defend and may result in assessment of damages, adverse tax consequences and harm to our reputation.
Our substantial indebtedness could adversely affect our financial condition and prevent us from fulfilling our obligations.
We maintain borrowing arrangements. Specifically, in November 2025, we entered into a credit agreement (the "PNC Agreement") with PNC Bank, National Association, acting as the administrative agent, that provides us with $120.0 million in credit consisting of a term loan in an amount of $100.0 million and commitments for revolving loans in an aggregate principal amount at any time outstanding not in excess of $20.0 million (collectively, the "PNC Facility"). We utilized the proceeds from the PNC Facility to repay and extinguish the outstanding balance under our prior credit facility with Piper Sandler Finance, LLC ("Prior Credit Facility").We expect to use a substantial portion of our cash flow to pay interest and principal on our outstanding indebtedness under the PNC Agreement. We may be unable to generate sufficient cash flow from operations, or have future borrowings available, to enable us to repay our indebtedness or to fund other liquidity needs, which may adversely impact our operating results, financial condition, ability to expand our business or meet our risk-based capital requirements.
Among other consequences, our level of indebtedness could:
•require us to use a significant percentage of our cash flow from operations for debt service and the satisfaction of repayment obligations, and not for other purposes that could grow our business;
•limit our ability to borrow money or issue equity to fund our working capital, capital expenditures, acquisitions and debt service requirements;
•cause our interest expense to increase if there is a general increase in interest rates, because a portion of our indebtedness bears interest at floating rates;
•limit our flexibility in planning for or reacting to changes in our business and future business opportunities;
•cause us to be more highly leveraged than some of our competitors, which may place us at a competitive disadvantage;
•make us more vulnerable to a downturn in our business or the economy; and
•limit our ability to exploit business opportunities.
Volatility in the credit markets, including bank failures and the U.S. Federal Reserve Bank’s interest rate decisions may impact our interest payments. We have Secured Overnight Financing Rate (“SOFR”) based floating rate borrowings under the PNC Agreement, which exposes us to variability in interest payments due to changes in the reference interest rates.
Covenants in our PNC Facility may restrict our operations, and if we do not effectively manage our business to comply with these covenants, our financial condition could be adversely affected.
The PNC Agreement contains several affirmative and negative covenants that could restrict our operations, require us to pay the outstanding balance under the PNC Facility if we are unable to comply with such covenants, or limit our ability to enter into particular transactions and to engage in other actions that we may believe are advisable or necessary for our business.Although the PNC Agreement restricts our ability to incur additional indebtedness, these restrictions are subject to a number of qualifications and exceptions, and we could incur substantial additional indebtedness in compliance with these restrictions. This could reduce our ability to satisfy our obligations and further exacerbate the risks to our financial condition.
We may have additional tax liabilities.
We are subject to income tax, premium tax, transaction tax and other taxes in the U.S. and foreign jurisdictions. Judgment is required in determining our provision for income taxes, premium tax, transaction tax and other taxes. In the ordinary course of our business, there are many transactions and calculations where the ultimate tax determination is uncertain. Further, we often make elections for tax purposes which may ultimately not be upheld. Although we believe our tax estimates are reasonable, the final determination of tax audits and any related litigation in the jurisdictions where we are subject to taxation could be materially different from our historical income tax provisions and accruals. The results of an audit or litigation could have a material effect on our consolidated financial statements in the period or periods in which that determination is made.
Our ability to use our net operating loss carryforwards and certain other tax attributes may be limited.
As of December 31, 2025, we had U.S. federal net operating loss carryforwards of approximately $253.6 million that will begin to expire in 2027. Under Sections 382 and 383 of the Internal Revenue Code of 1986, as amended (the "Code"), if a corporation undergoes an “ownership change,” the corporation’s ability to use its pre-change net operating loss carryforwards and other pre-change tax attributes, such as research tax credits, to offset its post-change income taxes may be limited. In general, an
26
“ownership change” occurs if there is a cumulative change in our ownership by “5-percent stockholders” that exceeds 50 percentage points over a rolling three-year period. Similar rules may apply under state tax laws. Pursuant to Sections 382 and 383 of the Code, annual use of our net operating loss carryforwards and credit carryforwards may be limited by previous and future ownership changes.
Risks Related to Compliance with Laws and Regulations
Our business is heavily regulated, and if we fail to comply with the numerous applicable laws and regulations our business and operating results could be harmed.
Our business is heavily regulated. In the United States, insurance is regulated by each state in which we operate, and it is challenging to comply with the requirements of each of these jurisdictions along with the different Canadian federal provincial, and territorial requirements. Furthermore, as we expand internationally, compliance with insurance-related laws, rules and regulations becomes even more difficult and imposes significant costs on our business. Each applicable regulator has broad supervisory power over all insurance-related operations (and certain regulatory oversight of our group of companies), which can include granting and revoking licenses to transact insurance business, and imposing fines and other penalties.
Failure to comply with insurance laws, regulations and guidelines or other laws and regulations applicable to our business could result in significant liability, additional department of insurance licensing requirements, the revocation of licenses in a particular jurisdiction or our inability to sell insurance products, which could significantly increase our operating expenses, result in the loss of our revenue and otherwise harm our business, operating results and financial condition.
Moreover, adverse regulatory action in one jurisdiction could result in penalties and adversely affect our license status or reputation in other jurisdictions. Even if the allegations in any regulatory or other action against us ultimately are determined to be unfounded, we could incur significant time and expense defending against the allegations, and any related negative publicity could harm consumer and third-party confidence in us, which could significantly damage our brand.
In addition, we have received, and may in the future receive, inquiries from regulators regarding our marketing and business practices. These inquires may include investigations regarding a number of our business practices, including the manner in which we market and sell products, the manner in which we write policies for any unaffiliated general agent, and whether any amounts we pay to hospitals or hospital groups (e.g., for electronic claims processing) is appropriate. Any modification of our marketing or business practices in response to regulatory inquiries could harm our business, operating results or financial condition and lead to reputational harm.
New laws may be adopted that may adversely affect our operating results and financial condition.
Existing laws and regulations impose limits on, for instance, our ability to enact price increases for our products. New laws may be adopted that could further affect our business, for example our ability to affect rate increases, to cancel or not issue existing policies, to use artificial intelligence or machine learning, or to market our products in various ways. Implementing changes in order to comply with new laws or regulations could also be time-consuming and costly.
Failure to comply with federal, state and provincial laws and regulations relating to privacy and security of personal information, and civil liabilities relating to breaches of privacy and security of personal information, could create liabilities for us, damage our reputation and harm our business.
We operate internationally and are subject to a variety of regulations that govern the collection, use, retention, sharing and security of personal information. Claims or allegations that we, or the vendors with whom we have contracted, have violated applicable laws or regulations related to privacy and data security could result in negative publicity and a loss of confidence in us by our members, our participating service providers or team members, and may subject us to litigation and/or regulatory action and/or fines, including by credit card companies and the loss of our ability to accept credit and debit card payments. In addition, we have posted privacy policies and practices concerning the collection, use and disclosure of member data on our website. Several companies have incurred penalties for failing to abide by the representations made in their privacy policies and practices. In addition, our use and retention of personal information could lead to civil liability exposure in the event of any disclosure of such information due to hacking, viruses, inadvertent action or other use or disclosure. Several companies have been subject to civil actions, including class actions, relating to this exposure.
27
We have incurred, and will continue to incur, expenses to comply with privacy and security standards and protocols for personal information imposed by law, regulation, self-regulatory bodies, industry standards and contractual obligations. Such laws, standards and regulations, however, are evolving and subject to potentially differing interpretations, and new privacy laws are frequently enacted. Each year, additional jurisdictions promulgate or amend privacy-related laws and regulations. However, in general, we are unable to predict far in advance what additional legislation, standards or regulation in the area of privacy and security of personal information could be enacted or its effect on our operations and business.
Law and regulations of the Internet, email and texting could adversely affect our business.
Many laws governing general commerce on the Internet remain unsettled and it may take years to fully determine whether and how existing laws such as those governing insurance, intellectual property, privacy and taxation apply to the Internet. In addition, the growth and development of the market for electronic commerce and Internet-related advertisements and transactions may prompt calls for more stringent consumer protection laws that may impose additional burdens on companies conducting business and selling subscriptions over the Internet. Any new laws or regulations or new interpretations of existing laws or regulations relating to the Internet could harm our business and we could be forced to incur substantial costs in order to comply with them, which would harm our business, operating results and financial condition.
Additionally, we use phone solicitation, email, and texting to market our services to potential members and/or as a means of communicating with our existing members. The laws and regulations governing the use of phone solicitation, email, and texting continue to evolve, and the growth and development of the market for commerce over the Internet may lead to the adoption of additional legislation. Failure to comply with existing or new laws regarding phone solicitation, text or electronic communications with members could lead to significant damages. We have incurred, and will continue to incur, expenses in our efforts to comply with electronic messaging laws. If new laws or regulations are adopted, or existing laws and regulations are interpreted, to impose additional restrictions on our ability to send email to our members or potential members, we may not be able to communicate with them in a cost-effective manner. In addition to legal restrictions on the use of email for commercial purposes, Internet and email service providers and others attempt to block the transmission of unsolicited email, commonly known as “spam.” Many service providers have relationships with organizations whose purpose it is to detect and notify the Internet and email service providers of entities that the organization believes are sending unsolicited email. If an Internet or email service provider identifies messaging and email from us as “spam” as a result of reports from these organizations or otherwise, we could be placed on a restricted list that will block our emails to members or potential members. If we are restricted or unable to communicate by phone, text or email with our members and potential members as a result of legislation, blockage or otherwise, our business, operating results and financial condition would be harmed.
Regulations that require individuals or entities that sell insurance or process claims to be licensed may be interpreted to apply to our business more broadly than we expect them to, which could require us to modify our business practices, create liabilities, damage our reputation, and harm our business.
Insurance regulations generally require that each individual who sells, solicits or negotiates insurance on our behalf must maintain a valid license in the jurisdiction in which the activity occurs. Regulations also generally prohibit paying an insurance commission to an unlicensed person or entity. Regulations may also require certain individuals who process claims to be licensed. These requirements are subject to a variety of interpretations between jurisdictions. We may not interpret and apply the requirements in the same manner as all applicable regulators, and, even if we have, the requirements or regulatory interpretations of those requirements may change. Regulators have in the past and/or may in the future determine that certain of our personnel or third parties were performing licensable activities without the required license. If such persons were not in fact licensed in any such jurisdiction, we could become subject to conviction for an offense or the imposition of an administrative penalty, and liable for significant penalties. Regulators may also deem payments we make to an unlicensed entity or person to be improper. We would also likely be required to modify our business practices and/or pet acquisition programs, or license the affected individuals, which may be impractical or costly and time-consuming to implement. Any modification of our business or marketing practices in response to regulatory licensing requirements could harm our business, operating results or financial condition.
We are subject to numerous laws and regulations in multiple jurisdictions, and ongoing compliance may be challenging for us.
We are subject to numerous laws and regulations that are administered and enforced by a number of different governmental authorities, including those in the United States, Canada and Europe, each of which exercising a degree of interpretive latitude. For example, in the United States some of the governmental agencies include state insurance regulators, state securities administrators, state attorneys general and federal agencies including the SEC, Internal Revenue Service and the U.S. Department of Justice. There is risk that laws and regulations or any particular regulator’s or enforcement authority’s interpretation of a legal issue may change over time to our detriment, or that changes in the overall legal environment may necessitate changes to our practices that may, in some cases, increase our costs and limit our ability to grow or to improve our results of operations.
28
We may be affected by mandatory participation in plans that could result in contributions from insurance subsidiaries we own.
Certain states have enacted laws that require a property-casualty insurer, which includes a pet insurance company, conducting business in that state to participate in assigned risk plans, reinsurance facilities, joint underwriting associations ("JUAs"), Fair Access to Insurance Requirements ("FAIR") plans and wind pools. In these markets, if the state reinsurance facilities, wind pools, FAIR plans or JUAs recognize a financial deficit, they may in turn have the ability to assess participating insurers, adversely affecting our operating results and financial condition if we are a part of such state reinsurance facilities, wind pools, FAIR plans or JUAs. Additionally, certain jurisdictions require insurers to participate in guaranty funds for impaired or insolvent insurance companies. These funds periodically assess losses against all insurance companies doing business in the jurisdiction. Our operating results and financial condition could be adversely affected by any of these factors.
Our segregated accounts in Bermuda with Wyndham Insurance Company (SAC) Limited, could be adversely impacted by regulatory compliance of an unaffiliated third party.
We maintain three segregated accounts in accordance with Bermuda laws with Wyndham Insurance Company (SAC) Limited ("WICL"). One account, which we call WICL segregated account AX, has entered into a reinsurance agreement with our Canada insurance partner. The second account, WICL Segregated Account Trupanion Germany, has entered into a reinsurance agreement with our German insurance partner. The third account, WICL Segregated Account Switzerland has entered into a reinsurance agreement with our Swiss insurance partner. WICL is a class 3 insurer regulated by the Bermuda Monetary Authority ("BMA"). WICL’s ability to continue operations and pay dividends could impact the ability of our segregated accounts to do the same. WICL’s failure to meet regulatory requirements set forth by the BMA could result in our inability to transact business through our WICL segregated accounts. Further, WICL could be limited from allowing dividends to be paid out of any of our segregated accounts in the event of adverse regulatory actions.
Our accounting is complex and relies upon estimates or judgments relating to our critical accounting policies. If our accounting is erroneous or based on assumptions that change or prove to be incorrect, our operating results could fall below the expectations of securities analysts and investors, resulting in a decline in our stock price.
The preparation of financial statements in conformity with GAAP requires management to make estimates and assumptions that affect the amounts reported in the consolidated financial statements and accompanying notes, and also to comply with many complex requirements and standards. We devote substantial resources to compliance with accounting requirements and we base our estimates on our best judgment, historical experience, information derived from third parties, and on various other assumptions that we believe to be reasonable under the circumstances, the results of which form the basis for making judgments about the values of assets, liabilities, equity, revenue and expenses that are not readily apparent from other sources. However, various factors are causing our accounting to become complex, such as our investments in strategic opportunities and our expansion into foreign markets. The ongoing evolution of our business, international expansion, and entry into complementary businesses, such as pet food, may compound these complexities. Our operating results may be adversely affected if we make accounting errors or our judgments prove to be wrong, assumptions change or actual circumstances differ from those in our assumptions, which could cause our operating results to fall below the expectations of securities analysts and investors or guidance we may have provided, resulting in a decline in our stock price and potential legal claims. Significant judgments, assumptions and estimates used in preparing our consolidated financial statements include those related to revenue recognition, reserve for veterinary invoices, and income taxes.
Risks Related to Ownership of Our Common Stock
Our actual operating results may differ significantly from our guidance.
From time to time we have released, and may continue to release, guidance in quarterly earnings conference call, quarterly earnings releases, or otherwise, regarding our future performance that represents our management’s estimates as of the date of release. This guidance, which includes forward-looking statements, has been and will be based on projections prepared by our management. These projections are not prepared with a view toward compliance with published guidelines of the American Institute of Certified Public Accountants, and neither our independent registered public accounting firm nor any other independent expert or outside party compiles or examines the projections. Accordingly, no such person expresses any opinion or any other form of assurance with respect to the projections. In addition, from time to time we have provided, and may continue to provide, information regarding how we think about the drivers of and our method of calculating our intrinsic value, including related statements regarding discounted cash flows and underlying assumptions (such as pet enrollment, revenue per pet, pet acquisition costs, and other costs and expenses).
29
These statements are based upon a number of assumptions and estimates that, while presented with numerical specificity, are inherently subject to significant business, economic and competitive risks and uncertainties, many of which are beyond our control, including those described in these “Risk Factors” and elsewhere in this report. When we state possible outcomes as high and low ranges, these are intended to provide a sensitivity analysis as variables are changed but are not intended to imply that actual results could not fall outside of the suggested ranges.
Guidance is necessarily speculative in nature, and it can be expected that some or all of the assumptions underlying these statements will not materialize or will vary significantly from actual results. In addition, we change our assumptions and methodologies from time to time. Accordingly, these statements are only estimates of what management believes is reasonable as of the date of release. Actual results may vary and the variations may be material. In light of the foregoing, we urge investors not to rely upon our guidance or other information regarding our view of the drivers and calculation method of our intrinsic value in making an investment decision regarding our common stock. In addition, we do not accept any responsibility for any projections or reports published by any such third parties, and we urge you not to place undue reliance on those statements.
Any failure to successfully implement our operating strategy or the occurrence of any of the events or circumstances set forth in this report, or the other reports we file from time to time, could result in the actual operating results being different from our guidance, and the differences may be adverse and material.
Future securities issuances could result in significant dilution to our stockholders and impair the market price of our common stock.
Future issuances of shares of our common stock, or the perception that these sales may occur, could depress the market price of our common stock and result in dilution to existing holders of our common stock. Acquisitions, strategic investments, partnerships, or alliances could also result in dilutive issuances of equity securities. In addition, we may issue options, restricted stock units, or other stock-based awards to those providing services to us, and to the extent outstanding or future options are exercised or restricted stock units or other stock-based awards are settled for shares of our common stock, there will be further dilution. The amount of dilution could be substantial depending upon the size of our future issuances of securities or exercises or settlement of stock-based awards. Furthermore, we may issue additional equity securities that could have rights senior to those of our common stock, such as pursuant to the “blank check” preferred stock contained in our certificate of incorporation. As a result, purchasers of our common stock bear the risk that future issuances of debt or equity securities may reduce the value of and dilute their ownership interest.
The market price of our common stock has been and is likely to continue to be volatile, and you may be unable to sell your shares at or above the price at which you purchased them.
The market price of our common stock has been and is likely to continue to fluctuate widely. Factors affecting the market price of our common stock include:
•variations in our operating results, earnings per share, cash flows from operating activities, and key operating metrics, and how those results compare to analyst expectations;
•forward-looking guidance that we provide to the public and industry and financial analysts related to future revenue and results of operations, and any change in that guidance or our failure to achieve the results reflected in that guidance;
•the net increases in the number of members, either independently or as compared with published expectations of industry, financial or other analysts that cover our company;
•changes to our subscription, strategic alliances, acquisitions or significant agreements by us or by our competitors;
•recruitment or departure of key personnel;
•factors relating to our other business segment;
•issuance of common stock or other securities to certain partners;
•the economy as a whole and market conditions in our industry;
•trading activity by a limited number of stockholders who together beneficially own a majority of our outstanding common stock;
•publications and public statements by financial analysts and other finance industry professionals and activists (or the cessation of coverage by key financial analysts);
•the number of shares of our stock trading on a regular basis; and
•any other factors discussed in these risk factors.
In addition, if the market for stock in our industry or the stock market in general experiences uneven investor confidence, the market price of our common stock could decline for reasons unrelated to our business, operating results or financial condition. Some companies that have experienced volatility in the trading price of their stock have been the subject of securities class action litigation. If we are the subject of such litigation, it could result in substantial costs and a diversion of our management’s attention and resources.
We do not intend to pay dividends on our common stock and, therefore, any returns will be limited to the value of our stock.
30
We have never declared or paid any cash dividends on our common stock. Other than potential repurchases of our common stock, we currently intend to retain all available funds and any future earnings for the development, operation and expansion of our business and do not anticipate declaring or paying any cash dividends for the foreseeable future. Any return to stockholders will therefore be limited to the increase, if any, of our stock price.
Concentrated ownership of our common stock could limit your ability to influence the outcome of matters subject to stockholder approval. This concentration may also create a risk of sudden changes in our common stock price.
As of December 31, 2025 we had 6 five percent or greater stockholders who, along with their affiliates, held in the aggregate 52.9% of the voting power of our outstanding common stock. Therefore, these stockholders may have the ability to influence us through this ownership position, and if they vote similarly, may be able to determine all matters requiring stockholder approval. For example, these stockholders may be able to control elections of directors, amendments of our organizational documents, or approval of any merger, sale of assets, or other major corporate transaction. This may prevent or discourage unsolicited acquisition proposals or offers for our common stock that you or other stockholders may feel are in your or their best interest as one of our stockholders. Further, the sale by a major stockholder of a significant portion of their holdings (particularly entities affiliated with BlackRock, Inc. that hold 11.9% of our outstanding common stock) could have a material adverse effect on the market price of our common stock.
Provisions in our restated certificate of incorporation, restated bylaws and Delaware law might discourage, delay or prevent a change in control of our company or changes in our management and, therefore, depress the market price of our common stock.
Our restated certificate of incorporation and restated bylaws contain provisions that could depress the market price of our common stock by acting to discourage, delay or prevent a change in control of our company or changes in our management that the stockholders of our company may deem advantageous. These provisions, among other things:
•permit only the board of directors to establish the number of directors and fill vacancies on the board;
•require super-majority voting to amend some provisions in our restated certificate of incorporation and restated bylaws;
•authorize the issuance of “blank check” preferred stock that our board could use to implement a stockholder rights plan (also known as a “poison pill”);
•eliminate the ability of our stockholders to call special meetings of stockholders;
•prohibit stockholder action by written consent, which requires all stockholder actions to be taken at a meeting of our stockholders;
•prohibit cumulative voting; and
•establish advance notice requirements for nominations for election to our board or for proposing matters that can be acted upon by stockholders at annual stockholder meetings.
In addition, Section 203 of the Delaware General Corporation Law may discourage, delay or prevent a change in control of our company. Section 203 imposes certain restrictions on mergers, business combinations and other transactions between us and holders of 15% or more of our common stock. Moreover, applicable insurance laws require that any person or entity acquiring direct or indirect control of an insurer obtain prior regulatory approval, which may impede potential acquisitions.
We have an Employee Severance and Change in Control Plan that applies to each employee of our company. This plan provides certain benefits to our employees in the event there is a change in control of our company and an employee is terminated under certain conditions. Potential acquirers may determine that the possible payments and acceleration of equity under this plan make an acquisition of our company unattractive.
31
Item 1B. Unresolved Staff Comments
None.
Item 1C. Cybersecurity
Our Board of Directors oversees our enterprise risk management ("ERM") program, and cybersecurity is a core component of that oversight. Our cybersecurity practices are fully integrated into our ERM framework and follow recognized standards, including those developed by NIST, ISO, and applicable industry regulations such as the NYDFS Cybersecurity Regulation and PCI DSS. Our approach focuses on protecting the confidentiality, integrity, and availability of our systems and data by identifying, preventing, mitigating, and responding to cybersecurity threats and incidents.
Risk Management and Strategy
Our cybersecurity risk management program focuses on the following areas:
•Technical Safeguards. We implement multiple layers of technical controls—including firewalls, intrusion detection and prevention systems, Managed Detection and Response (MDR), anti-malware tools, and access-control systems. We continuously evaluate and improve these safeguards through security assessments and threat intelligence.
•Incident Response and Recovery. We maintain formal incident response and recovery plans that outline our approach to cybersecurity events. These plans are regularly tested and refined to ensure their effectiveness.
•Third-Party Risk Management. We apply a risk-based approach to evaluating and managing cybersecurity risks arising from third parties, including vendors, service providers, Territory Partners, and other external users whose systems or actions could affect our operations.
•Education. All team members complete regular, mandatory training on security fundamentals, cybersecurity threats, physical security risks, and appropriate response practices.
•Governance. Our management Risk Committee supports the ERM program and provides regular updates to the Board of Directors. The Chief Information Security Officer ("CISO"), who reports to the Chief Information Officer ("CIO"), leads our cybersecurity program and provides frequent briefings to the CEO, executive leadership, and the Board’s Audit Committee.
•Collaboration. Our cybersecurity processes are designed to identify, prevent, escalate, and mitigate threats through cross-functional coordination. This structure allows management to make timely decisions about business impacts and disclosures when necessary.
We routinely evaluate the effectiveness of our cybersecurity measures through audits, assessments, tabletop exercises, threat modeling, and vulnerability testing. Independent third parties also conduct audits and reviews of our control environment and operating effectiveness. Results are shared with the management Risk Committee and the Board, and we update our documentation, processes, and controls based on these findings.
Governance
The Board of Directors, in collaboration with the management Risk Committee, oversees cybersecurity risk within the broader ERM program. The Board receives regular updates from the Risk Committee and the CISO on topics such as emerging threats, standards, vulnerability assessments, third-party evaluations, and overall program status. Any cybersecurity incident meeting established reporting thresholds is promptly escalated to the Board and monitored until resolved.
The Audit Committee of the Board of Directors, in collaboration with management, reviews our major financial and cyber risk exposures and the steps management has taken to monitor such exposures, including our procedures and any related policies, with respect to risk assessment and risk management.
Our Information Security team, led by the CISO and supported by the management Risk Committee, executes our cybersecurity program and coordinates incident response and recovery activities. Multidisciplinary teams monitor prevention, detection, mitigation, and remediation efforts in real time and escalate issues to the Risk Committee as needed.
During the period covered by this report, cybersecurity threats, including those related to past incidents, have not materially affected our business strategy, operations, or financial condition, and as of the date of this report we do not believe such threats are reasonably likely to have a material impact in the future. For a discussion of the risks we face relating to cybersecurity threats, please see "Risk Factors."
Item 2. Properties
Our principal executive offices are located at 6100 4th Avenue South, Seattle, Washington. We purchased the building in August 2018 and occupy 99,828 square feet.
Item 3. Legal Proceedings
32
Information with respect to this item may be found in Note 8 of Item 8, “Financial Statements and Supplementary Data”, under the caption, “Legal Proceedings” which information is incorporated herein by reference.
Item 4. Mine Safety Disclosures
Not applicable.
33
PART II
Item 5. Market for Registrant’s Common Equity, Related Stockholder Matters, and Issuer Purchases of Equity Securities
Recent Sales of Unregistered Securities
Pursuant to a marketing agreement between us and a strategic distributor, we agreed to issue shares of our common stock to the distributor as partial consideration for sales made through the distributor’s marketing channels of white-label pet insurance and wellness products that we create and administer under the agreement. The number of shares we issue is determined quarterly, based on a percentage of revenue from such product sales divided by the volume weighted average price per share for the preceding quarter or, if lower, for the three months ended December 5, 2021. The shares we issue are subject to various restrictions, including a minimum holding period of two years and customary transfer restrictions for shares acquired in a private placement. During the quarter ended December 31, 2025, we issued 3,620 shares of our common stock to the distributor in respect of product sales that occurred in the quarter ended September 30, 2025. We offered and sold these shares in reliance upon the exemption from the registration set forth under Section 4(a)(2) of the Securities Act, and the regulations promulgated thereunder relating to sales by an issuer not involving any public offering, and in reliance on similar exemptions under applicable state laws.
Market for our Common Stock
Our common stock began trading on the New York Stock Exchange ("NYSE") under the symbol “TRUP” on July 18, 2014. Prior to that time, there was no public market for our common stock. On June 17, 2016, we voluntarily transferred the listing of our common stock from the NYSE to the NASDAQ Global Market of the NASDAQ Stock Market LLC (NASDAQ) where our common stock continues to be traded under the symbol “TRUP”.
Dividend Policy
We have never declared or paid cash dividends on our common stock. Other than potential repurchases of our common stock, we currently intend to retain all available funds and any future earnings for the development, operation and expansion of our business and do not anticipate declaring or paying any cash dividends for the foreseeable future. Any further determination to pay dividends on our common stock will be at the discretion of our board of directors, subject to applicable laws, and will depend on our financial condition, results of operations, capital requirements, general business conditions and other factors that our board of directors considers relevant.
Holders of Record
As of February 6, 2026, there were 23 registered stockholders of record of our common stock. The actual number of stockholders is greater than this number of record holders, and includes stockholders who are beneficial owners, whose shares are held of record by banks, brokers, and other financial institutions.
Securities Authorized for Issuance under Equity Compensation Plans
The information called for by this item is incorporated by reference to our Proxy Statement for the Annual Meeting of Stockholders to be held in 2026. See Part III, Item 12 “Security Ownership of Certain Beneficial Owners and Management and Related Stockholder Matters.”
Stock Performance Graph
The following shall not be deemed “filed” for purposes of Section 18 of the Exchange Act, or incorporated by reference into any of our other filings under the Exchange Act or the Securities Act, except to the extent we specifically incorporate it by reference into such filing.
This chart compares the stockholder return on an investment of $100 over the five years from December 31, 2020 through December 31, 2025 for (1) our common stock, (2) the S&P Small Cap 600 Index, (3) the NASDAQ-100 Technology Sector Index, and (4) the Russell 2000 Index. All values assume the reinvestment of any dividends; however, no dividends have been declared on our common stock to date. The stockholder return on the following graph is not necessarily indicative of future performance.
34
12/31/2020
12/31/2021
12/31/2022
12/31/2023
12/31/2024
12/31/2025
Trupanion Inc.
$
100.00
$
110.29
$
39.70
$
25.49
$
40.26
$
31.22
S&P Small Cap 600 Index
$
100.00
$
125.27
$
103.45
$
117.81
$
125.85
$
131.18
NASDAQ-100 Technology Sector Index
$
100.00
$
126.98
$
76.27
$
127.14
$
136.21
$
166.80
Russell 2000 Index
$
100.00
$
113.69
$
89.18
$
102.64
$
112.93
$
125.68
35
Item 6. [Reserved]
36
Item 7. Management’s Discussion and Analysis of Financial Condition and Results of Operations
Please read the following discussion and analysis of our financial condition and results of operations together with our consolidated financial statements and related notes included under Part II, Item 8 of this Annual Report on Form 10-K.
This section of this Form 10-K generally discusses 2025 and 2024 items and year-to-year comparisons between 2025 and 2024. Discussions of 2023 items and year-to-year comparisons between 2024 and 2023 that are not included in this Form 10-K can be found in "Management's Discussion and Analysis of Financial Condition and Results of Operations" in Part II, Item 7 of the Company's Annual Report on Form 10-K for the fiscal year ended December 31, 2024.
Overview
We provide medical insurance for cats and dogs in the United States, Canada, and certain countries in Continental Europe. Through our data-driven, vertically-integrated approach, we develop and offer high-value medical insurance products, priced to take into account each pet’s unique characteristics and coverage level. Our growing and loyal membership base provides us with highly predictable and recurring revenue.
We operate in two reporting segments: subscription business and other business. We generate revenue in our subscription business segment primarily through insurance premiums, which we refer to as subscription payments from direct-to-consumer products. We operate our subscription business segment similar to other subscription-based businesses, with a focus on achieving a target margin prior to our new pet acquisition expense and acquiring as many pets as possible at our targeted average estimated internal rate of return. Within our subscription business, we also provide "Powered by Trupanion" pet insurance product offerings marketed by third parties, low and medium average revenue per pet products marketed under the brand names Furkin and PHI Direct in Canada, and a Trupanion branded product in Germany and Switzerland. We either directly underwrite or assume full insurance risk for these products through reinsurance arrangements. We provide a full suite of services and support for these products and they are designed to align with the target margin profile of our subscription business segment. Within this segment, we also offer products in certain countries in Continental Europe, which are currently underwritten by third parties who pay us commissions that we recognize as revenue.
We generate leads for our subscription business segment from a diverse set of member acquisition channels, which we then seek to convert into members through our contact center, website and other direct-to-consumer activities. These channels include referrals from third-parties such as veterinarians and existing members. Veterinary hospitals represent our largest referral source. Our “Territory Partners” create relationships with veterinary hospital teams through face-to-face visits. Territory Partners are dedicated to cultivating direct veterinary relationships and helping those veterinarians understand the benefits of high-quality medical insurance. Veterinarians then educate pet parents, who visit our website or call our contact center to learn more about, and potentially enroll in, a Trupanion product. We also receive a significant number of new leads from existing members adding pets and referring their friends and family members. Our direct-to-consumer acquisition channels serve as important resources for pet parent education and drive new member leads and conversion. We monitor average pet acquisition cost to evaluate the efficiency in acquiring new members and measure effectiveness based on our targeted return on investment.
Our other business segment generates revenue from other product offerings, primarily by underwriting policies on behalf of third parties with whom we generally have a business-to-business relationship. This business segment has, and targets, a significantly lower margin profile than our subscription business segment and is not part of our core business strategy. The largest source of revenue within this segment is from our long-standing contractual relationship as an underwriter for Pets Best, a third-party insurance provider we have worked with since 2015. We expect that enrollment from Pets Best will continue to decline as it engages other third-party underwriters. Additional products in this segment include the U.S. Department of Veterans Affairs program and employer-sponsored programs, primarily for companies with animal health related operations.
37
Key Operating Metrics
The following tables set forth total enrolled pets in our subscription and our other business segment and key operating metrics for our subscription business for the years ended December 31, 2025, 2024 and 2023, and for each of the last eight fiscal quarters.
Year Ended December 31,
2025
2024
2023
Total Business:
Total pets enrolled (at period end)
1,647,565
1,677,570
1,714,473
Subscription Business:
Total subscription pets enrolled (at period end)
1,096,173
1,041,212
991,426
Monthly average revenue per pet
$
80.79
$
72.98
$
65.26
Average pet acquisition cost (PAC)
$
288
$
235
$
228
Average monthly retention
98.34
%
98.25
%
98.49
%
Three Months Ended
Dec. 31, 2025
Sep. 30, 2025
Jun. 30, 2025
Mar. 31, 2025
Dec. 31, 2024
Sep. 30, 2024
Jun. 30, 2024
Mar. 31, 2024
Total Business:
Total pets enrolled (at period end)
1,647,565
1,654,414
1,660,455
1,667,637
1,677,570
1,688,903
1,699,643
1,708,017
Subscription Business:
Total subscription pets enrolled (at period end)
1,096,173
1,082,412
1,066,354
1,052,845
1,041,212
1,032,042
1,020,934
1,006,168
Monthly average revenue per pet
$
83.56
$
82.01
$
79.93
$
77.53
$
76.02
$
74.27
$
71.72
$
69.79
Average pet acquisition cost (PAC)
$
320
$
290
$
276
$
267
$
261
$
243
$
231
$
207
Average monthly retention
98.34
%
98.33
%
98.29
%
98.28
%
98.25
%
98.29
%
98.34
%
98.41
%
Total pets enrolled and total subscription pets enrolled include certain pet enrollments in European markets, where policies are currently underwritten by third parties and Trupanion is acting as an insurance broker. Per pet metrics, however, exclude these European policies, as their revenue is currently earned from commissions, as opposed to the subscription payments earned by the remainder of our subscription business.
Total pets enrolled. Total pets enrolled reflects the number of pets enrolled in one of the insurance products offered in our subscription business segment or our other business segment at the end of each period presented. We monitor total pets enrolled because it provides an indication of the growth of our consolidated business.
Total subscription pets enrolled. Total subscription pets enrolled reflects the number of pets enrolled in one of the insurance products offered in our subscription business segment at the end of each period presented. We monitor total subscription pets enrolled because it provides an indication of the growth of our subscription business. Because our subscription business has a significantly higher margin profile than our other business, changes in the rate of growth of our subscription pet enrollment tend to have a greater impact on our consolidated performance.
Monthly average revenue per pet. Monthly average revenue per pet is calculated as amounts billed in a given period for subscriptions divided by the total number of subscription pet months in the period. Total subscription pet months in a period represents the sum of all subscription pets enrolled for each month during the period. We monitor monthly average revenue per pet because it is an indicator of the per pet unit economics of our subscription business.
38
Average pet acquisition cost. Average pet acquisition cost ("PAC") is calculated as net acquisition cost divided by the total number of new subscription pets enrolled in that period. Net acquisition cost, a non-GAAP financial measure, is calculated in a reporting period as new pet acquisition expense, excluding stock-based compensation expense, other business segment expense, offset by sign-up fee revenue. We exclude stock-based compensation expense because the amount varies from period to period based on number of awards issued and market-based valuation inputs. We offset sign-up fee revenue because it is a one-time charge to some new members collected at the time of enrollment used to partially offset initial setup costs, which are included in new pet acquisition expenses. We exclude other business segment pet acquisition expense because that does not relate to subscription enrollments. We monitor average pet acquisition cost to evaluate the efficiency in acquiring new members and measure effectiveness based on our targeted return on investment.
Average monthly retention. Average monthly retention is measured as the monthly retention rate of enrolled subscription pets for each applicable period averaged over the 12 months prior to the period end date. As such, our average monthly retention rate as of December 31, 2025 is an average of each month’s retention from January 1, 2025 through December 31, 2025. We calculate monthly retention as the number of pets that remain after subtracting all pets that cancel during a month, including pets that enroll and cancel within that month, divided by the total pets enrolled at the beginning of that month. We monitor average monthly retention because it provides a measure of member satisfaction and allows us to calculate the implied average subscriber life in months.
39
Non-GAAP Financial Measures
In addition to our results determined in accordance with U.S. GAAP, we believe the following non-GAAP financial measures are useful in evaluating our operating performance. We use the following non-GAAP financial information to evaluate our ongoing operations and for internal planning and forecasting purposes. We believe that these non-GAAP financial measures, when taken collectively, may be helpful to investors in providing consistency and comparability with past financial performance. However, non-GAAP financial information is presented for supplemental informational purposes only, has limitations as an analytical tool, and should not be considered in isolation, or as a substitute for, the directly comparable financial measures prepared in accordance with GAAP.
We calculate these non-GAAP financial measures by excluding certain non-cash or non-recurring expenses. We exclude non-recurring transactions and restructuring expenses as they are not indicative of our operating performance. We exclude stock-based compensation as it is non-cash in nature. Although stock-based compensation expenses are expected to remain recurring expenses for the foreseeable future, we believe excluding them allows investors to make meaningful comparisons between our recurring core business operating results and those of other companies. We define non-GAAP development expenses as operating expenses incurred to develop new products and offerings that are pre-revenue. We define non-GAAP fixed expenses as the total of technology and development expense and general and administrative expense, less stock-based compensation expense, non-recurring transaction and restructuring expense, and development expenses related to exploring and developing new products and offerings that generally are in the pre-revenue stage or not at scale.
40
The following tables present the reconciliation of our non-GAAP financial measures from corresponding GAAP measures for years ended December 31, 2025, 2024 and 2023, and for each of the last eight fiscal quarters (in thousands, except percentages).
Year Ended December 31,
2025
2024
2023
Veterinary invoice expense
$
1,028,975
$
949,148
$
831,055
Less:
Stock-based compensation expense(1)
(2,802)
(3,335)
(3,450)
Other business cost of paying veterinary invoices(2)
(328,821)
(324,720)
(287,858)
Subscription cost of paying veterinary invoices (non-GAAP)
$
697,352
$
621,093
$
539,747
% of subscription revenue
70.5
%
72.5
%
75.7
%
Other cost of revenue
$
179,319
$
157,738
$
146,534
Less:
Stock-based compensation expense(1)
(2,260)
(1,955)
(1,544)
Other business variable expenses(2)
(88,558)
(75,050)
(75,756)
Subscription variable expenses (non-GAAP)
$
88,501
$
80,733
$
69,234
% of subscription revenue
8.9
%
9.4
%
9.7
%
Technology and development expense
$
37,848
$
31,255
$
21,403
General and administrative expense
76,648
63,731
60,207
Less:
Stock-based compensation expense(1)
(24,958)
(19,742)
(19,869)
Non-recurring transaction or restructuring expenses (3)
—
—
(4,175)
Development expenses(4)
(5,349)
(5,624)
(5,100)
Fixed expenses (non-GAAP)
$
84,189
$
69,620
$
52,466
% of total revenue
5.8
%
5.4
%
4.7
%
New pet acquisition expense
$
85,408
$
71,379
$
77,372
Less:
Stock-based compensation expense(1)
(7,446)
(6,908)
(7,000)
Other business pet acquisition expense(2)
(90)
(39)
(200)
Subscription acquisition cost (non-GAAP)
$
77,872
$
64,432
$
70,172
% of subscription revenue
7.9
%
7.5
%
9.8
%
(1)Trupanion employees may elect to take restricted stock units in lieu of cash payment for their bonuses. We account for such expense as stock-based compensation in accordance with GAAP, but we do not include it in any non-GAAP adjustments. Stock-based compensation associated with bonuses was approximately $0.8 million, $1.5 million and $1.3 million for the years ended December 31, 2025, 2024 and 2023, respectively.
(2)Excludes the portion of stock-based compensation expense attributable to the other business segment.
(3)Consists of business acquisition transaction expenses, severance and legal costs due to certain executive departures, and a $3.8 million non-recurring settlement of accounts receivable in 2023 related to uncollected premiums in connection with the transition of underwriting a third-party business to other insurers.
(4)Consists of costs related to product exploration and development that are pre-revenue and historically have been insignificant
41
Three Months Ended
Dec. 31, 2025
Sep. 30, 2025
Jun. 30, 2025
Mar. 31, 2025
Dec. 31, 2024
Sep. 30, 2024
Jun. 30, 2024
Mar. 31, 2024
Veterinary invoice expense
$
262,818
$
263,127
$
255,580
$
247,450
$
245,663
$
238,814
$
231,102
$
233,569
Less:
Stock-based compensation expense(1)
(614)
(666)
(758)
(763)
(800)
(830)
(843)
(862)
Other business cost of paying veterinary invoices(2)
(81,452)
(85,394)
(82,706)
(79,269)
(85,378)
(82,507)
(75,622)
(81,213)
Subscription cost of paying veterinary invoices (non-GAAP)
$
180,752
$
177,067
$
172,116
$
167,418
$
159,485
$
155,477
$
154,637
$
151,494
% of subscription revenue
69.1
%
70.1
%
71.1
%
71.8
%
70.0
%
71.0
%
74.1
%
75.3
%
Other cost of revenue
$
49,008
$
43,739
$
43,150
$
43,422
$
38,721
$
39,263
$
43,429
$
36,325
Less:
Stock-based compensation expense(1)
(600)
(579)
(601)
(482)
(476)
(536)
(523)
(420)
Other business variable expenses(2)
(25,589)
(20,702)
(20,531)
(21,736)
(17,336)
(18,126)
(23,091)
(16,498)
Subscription variable expenses (non-GAAP)
$
22,819
$
22,458
$
22,018
$
21,204
$
20,909
$
20,601
$
19,815
$
19,407
% of subscription revenue
8.7
%
8.9
%
9.1
%
9.1
%
9.2
%
9.4
%
9.5
%
9.6
%
Technology and development expense
$
11,303
$
9,887
$
8,586
$
8,072
$
8,172
$
7,933
$
8,190
$
6,960
General and administrative expense
18,323
18,311
20,122
19,892
16,828
16,977
15,253
14,673
Less:
Stock-based compensation expense(1)
(6,617)
(6,551)
(6,393)
(5,396)
(5,277)
(5,258)
(4,949)
(4,258)
Development expenses(3)
(1,798)
(1,199)
(946)
(1,406)
(1,322)
(1,474)
(1,655)
(1,178)
Fixed expenses (non-GAAP)
$
21,211
$
20,448
$
21,369
$
21,162
$
18,401
$
18,178
$
16,839
$
16,197
% of total revenue
5.6
%
5.6
%
6.0
%
6.2
%
5.5
%
5.6
%
5.3
%
5.3
%
New pet acquisition expense
$
23,103
$
21,946
$
19,843
$
20,516
$
18,354
$
18,308
$
17,874
$
16,843
Less:
Stock-based compensation expense(1)
(1,530)
(1,527)
(1,516)
(2,873)
(1,482)
(1,503)
(2,066)
(1,857)
Other business pet acquisition expense(2)
(8)
(5)
(74)
(3)
(8)
(8)
(10)
(13)
Subscription acquisition cost (non-GAAP)
$
21,565
$
20,414
$
18,253
$
17,640
$
16,864
$
16,797
$
15,798
$
14,973
% of subscription revenue
8.2
%
8.1
%
7.5
%
7.6
%
7.4
%
7.7
%
7.6
%
7.4
%
(1)Trupanion employees may elect to take restricted stock units in lieu of cash payment for their bonuses. We account for such expense as stock-based compensation in accordance with GAAP, but we do not include it in any non-GAAP adjustments. Stock-based compensation associated with bonuses was approximately $0.2 million, $0.3 million and $0.7 million for the three months ended December 31, 2025, 2024 and 2023, respectively. (2)Excludes the portion of stock-based compensation expense attributable to the other business segment (3)Consists of costs related to product exploration and development that are pre-revenue and historically have been insignificant
42
When determining our PAC, we calculate net acquisition cost for a more comparable metric across periods. Net acquisition cost, a non-GAAP financial measure, is calculated in a reporting period as GAAP new pet acquisition expense, excluding stock-based compensation expense, other business segment expense, and pet acquisition expense for commission-based policies, offset by sign-up fee revenue. We exclude stock-based compensation expense because the amount varies from period to period based on the number of awards issued and market-based valuation inputs. We exclude other business segment pet acquisition expense because it does not relate to subscription enrollments. We exclude pet acquisition expense for commission-based policies because the revenue of these products is earned from commissions from a third-party underwriter, as opposed to the subscription payments earned by the remainder of our subscription business. We offset sign-up fee revenue because it is a one-time charge to some new members collected at the time of enrollment used to partially offset initial setup costs, which are included in new pet acquisition expenses.
The following tables reconcile GAAP new pet acquisition expense to non-GAAP net acquisition cost (in thousands) for the years ended December 31, 2025, 2024, and 2023, and for each of the last eight fiscal quarters:
Year Ended December 31,
2025
2024
2023
New pet acquisition expense
$
85,408
$
71,379
$
77,372
Net of sign-up fee revenue
(4,307)
(4,061)
(4,527)
Excluding:
Stock-based compensation expense(1)
(7,446)
(6,908)
(7,000)
Other business pet acquisition expense
(90)
(39)
(200)
Pet acquisition expense for commission-based policies
(3,184)
(3,345)
(3,443)
Net acquisition cost
$
70,381
$
57,026
$
62,202
Three Months Ended
Dec. 31, 2025
Sep. 30, 2025
Jun. 30, 2025
Mar. 31, 2025
Dec. 31, 2024
Sep. 30, 2024
Jun. 30, 2024
Mar. 31, 2024
New pet acquisition expense
$
23,103
$
21,946
$
19,843
$
20,516
$
18,354
$
18,308
$
17,874
$
16,843
Net of sign-up fee revenue
(1,049)
(1,157)
(1,061)
(1,040)
(906)
(1,100)
(1,036)
(1,019)
Excluding:
Stock-based compensation expense(1)
(1,530)
(1,527)
(1,516)
(2,873)
(1,482)
(1,503)
(2,066)
(1,857)
Other business pet acquisition expense
(8)
(5)
(74)
(3)
(8)
(8)
(10)
(13)
Pet acquisition expense for commission-based policies
(869)
(790)
(927)
(598)
(1,125)
(634)
(754)
(832)
Net acquisition cost
$
19,647
$
18,467
$
16,265
$
16,002
$
14,833
$
15,063
$
14,008
$
13,122
Components of Operating Results
General
We operate in two reporting segments: subscription business and other business. We generate revenue in our subscription business segment primarily by subscription payments from direct-to-consumer products. We operate our subscription business segment similar to other subscription-based businesses, with a focus on achieving a target margin prior to our pet acquisition expense and acquiring as many pets as possible at our targeted average estimated internal rate of return. Within our subscription business, we also currently provide "Powered by Trupanion" pet insurance product offerings marketed by third parties, low and medium average revenue per pet products marketed under the brand names Furkin and PHI Direct in Canada, and a Trupanion branded product in Germany and Switzerland. We either directly underwrite or assume full insurance risk for these products through reinsurance arrangements. We provide a full suite of services and support for these products and they are designed to align with the target margin profile of our subscription business segment. Within this segment we also offer products in certain countries in Continental Europe, which are currently underwritten by third parties who pay us commissions that we recognize as revenue.
43
Our other business segment generates revenue from other product offerings, primarily by underwriting policies on behalf of third parties with whom we generally have a business-to-business relationship. This business segment has and targets, a significantly lower margin profile than our subscription business and is not part of our core business strategy. The largest source of revenue within this segment is from our long-standing contractual relationship with Pets Best, a third party insurance provider we have worked with since 2015. Additional products in this segment include the U.S. Department of Veterans Affairs program and employer-sponsored programs, primarily for companies with animal health related operations.
Revenue
We generate revenue in our subscription business segment primarily from subscription payments for our pet medical insurance. Subscription payments are paid at the beginning of each subscription period. In most cases, our members authorize us to directly charge their credit card, debit card or bank account through automatic funds transfer. Subscription revenue is recognized on a pro rata basis over the policy term. Membership may be canceled at any time without penalty, and we issue a refund for the unused portion of the canceled membership. In addition to subscription payments, we generate a small amount of revenue from charging a one-time sign-up fee collected at the time of new enrollment to partially offset initial setup costs. Sign-up fees are related to Trupanion’s obligation to provide insurance coverage and are recognized over the policy term. We also generate a portion of our subscription business segment revenue through commissions earned in certain European markets, where policies are currently underwritten by third parties and Trupanion is acting as an insurance broker.
We generate revenue in our other business segment primarily from writing policies on behalf of third parties where we do not undertake direct consumer marketing. This segment also includes revenue from other pet insurance products that have a significantly lower margin profile from our subscription business.
Cost of Revenue
Cost of revenue in each of our segments is comprised of the following:
Veterinary invoice expense
Veterinary invoice expense includes our costs to review and pay veterinary invoices, administer the payments, and provide member services, and other operating expenses directly or indirectly related to this process. We also accrue for veterinary invoices that have been incurred but not yet received and for the estimated internal costs of processing those invoices. This also includes amounts paid by unaffiliated general agents on our behalf, and an estimate of amounts incurred and not yet paid for our other business segment.
Other cost of revenue
Other cost of revenue for the subscription business segment includes direct and indirect member service expenses, Territory Partner commissions per member renewal, payment processing fees and premium tax expenses. Other cost of revenue for the other business segment includes the commissions we pay to unaffiliated general agents, costs to administer the programs in the other business segment and premium taxes on the sales in this segment.
Operating Expenses
Our operating expenses are classified into five categories: technology and development, general and administrative, new pet acquisition expense, goodwill impairment charges, and depreciation and amortization. For each category, except goodwill impairment charges and depreciation and amortization, the largest component is personnel costs, which include salaries, employee benefit costs, bonuses and stock-based compensation expense.
Technology and development
Technology and development expenses primarily consist of personnel costs and related expenses for our technology staff, which includes information technology development, security, infrastructure support, and third-party services. It also includes expenses associated with development in new geographies and new products and offerings.
General and administrative
General and administrative expenses consist primarily of personnel costs and related expenses for our finance, actuarial, human resources, regulatory, legal and general management functions, as well as facilities and professional services.
New pet acquisition expense
New pet acquisition expenses primarily consist of costs to acquire a pet (including costs associated directly to supporting the first year of a member), personnel costs, costs to educate veterinarians and consumers about the benefits of Trupanion, costs to generate leads and to convert leads into enrolled pets, as well as print, online and promotional advertising costs.
Goodwill impairment charges
44
Goodwill impairment charges consist of impairment charges taken on goodwill balances arising from acquisitions. For further details on goodwill impairment charges refer to Note 4, Goodwill and Intangible Assets, included in Item 8 of this report.
Depreciation and amortization
Depreciation and amortization expenses consist of depreciation of property, equipment, and software developed for internal use, as well as amortization of finite-lived intangible assets.
Gain (loss) from investment in joint venture
Gain (loss) from investment in joint venture consists of the share of income and losses from our equity method investment in a joint venture in Australia, as well as income and expenses associated with administrative services provided to the joint venture. In March 2025, we restructured this relationship from a joint venture to a brand license and services arrangement.
Stock-based compensation
Stock-based compensation is included in the cost and expense line items above. Stock-based compensation will vary depending on corporate performance and terms of the awards under our equity incentive plan. For example, when we have delivered strong performance, stock-based compensation may increase as a result of incentive-based awards under our equity incentive plan.
Factors Affecting Our Performance
Average monthly retention. Our performance depends on our ability to continue to retain our existing and newly enrolled pets and is impacted by our ability to provide a best-in-class value and member experience. Our ability to retain enrolled pets depends on a number of factors, including the actual and perceived value of our services and the quality of our member experience, the ease and transparency of the process for reviewing and paying veterinary invoices for our members, the rate of veterinary inflation and of our pricing adjustments, and the competitive environment. In addition, other initiatives across our business may temporarily impact retention and make it difficult for us to improve or maintain this metric. For example, if the number of new pets enrolled increases at a faster rate than our historical experience, our average monthly retention rate could be adversely impacted, as our retention rate is generally lower during the first year of member enrollment.
Investment in pet acquisition. We have made and may continue to make significant investments to grow our member base. Our pet acquisition cost and the number of new members we enroll depends on a number of factors, including the amount we have available and we elect to invest in pet acquisition activities in any particular period in the aggregate and by channel, the frequency of existing members adding a pet or referring their friends or family, the effectiveness of our sales execution and marketing initiatives, changes in costs of media, the mix of our pet acquisition expenditures and the competitive environment. Our average pet acquisition cost has in the past significantly varied, and in the future may significantly vary, from period to period based upon specific marketing initiatives and estimated rates of return on pet acquisition spend. We also regularly test new member acquisition channels and marketing initiatives, which may be more expensive than our traditional marketing channels and may increase our average pet acquisition costs. We continually assess our pet acquisition activities by monitoring the estimated return on PAC spend both on a detailed level by acquisition channel and in the aggregate.
Timing of price adjustments. Our subscription business’s cost-plus model depends on our ability to estimate our operating costs and expenses, including veterinary invoice expenses, and to adjust our pricing to achieve our target margins. We regularly reevaluate and adjust the price of our subscriptions, with a goal of achieving our targeted payout ratio, subject to the review and approval of regulators where applicable. This makes it important for us to accurately estimate our costs and to promptly implement pricing adjustments, which generally roll onto our book of insured pets over the succeeding twelve months following any applicable regulatory approval. As a result, we may have timing mismatches during which our pricing does not reflect our current expense profile. In periods of rapid increases in veterinary invoice expenses, including periods of significant inflation, this timing mismatch may have a significant impact on our margin profile.
Timing of initiatives. Over time, we plan to implement new initiatives to improve our member experience, make modifications to our subscription plan, introduce new coverage plans, pursue pet food or other adjacent opportunities, improve our technology, increase the number of veterinary hospitals using our patented direct pay software, and find other ways to maintain a strong value proposition for our members. The implementation of such initiatives could impact our expense profile and result in us incurring expenses that may not always directly coincide with revenue increases, resulting in fluctuations in revenue and profitability in our subscription business segment.
Mix of sales. The relative mix of our business by geography, pet age, species, breed, and other factors impacts the monthly average revenue per pet we receive. For example, prices from our plans could vary depending on the relative cost of veterinary care in different countries or areas or whether the pet is a dog or a cat. As our mix of business between products and geographies changes, our metrics, such as our monthly average revenue per pet, and our exposure to foreign exchange
fluctuations will be impacted. We expect our international business, additional product offerings and "Powered by Trupanion" plans to grow and, in turn, we expect these effects to increase.
Other business segment. Our other business segment primarily includes other product offerings that are materially different from those in our subscription business segment. In addition, we expect the growth rate and margin profile of this segment to be significantly different from our subscription business segment. We do not undertake marketing efforts for and are not the primary interface with the customers of the third parties for whom we underwrite other business segment policies. Our relationships in our other business segment are generally subject to termination provisions and are non-exclusive, including our contractual relationship with Pets Best. Accordingly, we have limited influence on the volume of business of this segment. Loss of an entire program via contract termination could result in the associated policies and revenue being lost over a period of 12 to 18 months, which could have a material impact on our results of operations. In some cases, we have structured exclusive relationships, but those relationships have been and may continue to be subject to limitations on the number of enrolled pets as to which we will write policies for the third party. We may enter into additional relationships in this segment in the future, if we believe they will be beneficial, which could impact our operating results.
45
Results of Operations
The following tables set forth our results of operations for the periods presented both in absolute dollars and as a percentage of total revenue for those periods. The period-to-period comparison of financial results is not necessarily indicative of future results.
Year Ended December 31,
2025
2024
2023
(in thousands)
Revenue:
Subscription business
$
989,338
$
856,521
$
712,906
Other business
449,967
429,163
395,699
Total revenue
1,439,305
1,285,684
1,108,605
Cost of revenue:
Subscription business
790,880
706,851
613,686
Other business
417,414
400,035
363,903
Total cost of revenue(1)
1,208,294
1,106,886
977,589
Operating expenses:
Technology and development(1)
37,848
31,255
21,403
General and administrative(1)
76,648
63,731
60,207
New pet acquisition expense(1)
85,408
71,379
77,372
Goodwill impairment charges
1,129
5,299
—
Depreciation and amortization
15,836
16,466
12,474
Total operating expenses
216,869
188,130
171,456
Loss from investment in joint venture
(305)
(182)
(219)
Operating income (loss)
13,837
(9,514)
(40,659)
Interest expense
13,759
14,498
12,077
Other (income), net
(21,916)
(14,374)
(7,701)
Income (loss) before income taxes
21,994
(9,638)
(45,035)
Income tax expense (benefit)
2,561
(5)
(342)
Net income (loss)
$
19,433
$
(9,633)
$
(44,693)
(1) Includes stock-based compensation expense as follows:
Year Ended December 31,
2025
2024
2023
(in thousands)
Veterinary invoice expense(2)
$
2,841
$
3,460
$
3,667
Other cost of revenue(2)
2,284
2,063
1,612
Technology and development
6,036
4,934
2,846
General and administrative
19,571
15,696
17,717
New pet acquisition expense
7,580
7,279
7,319
Total stock-based compensation expense
$
38,312
$
33,432
$
33,161
(2) Veterinary invoice expense and Other cost of revenue together comprise stock-based compensation expense included within Total cost of revenue.
46
Year Ended December 31,
2025
2024
2023
(as a percentage of revenue)
Revenue
100
%
100
%
100
%
Cost of revenue
84
86
88
Operating expenses:
Technology and development
3
2
2
General and administrative
5
5
5
New pet acquisition expense
6
6
7
Goodwill impairment charges
—
—
—
Depreciation and amortization
1
1
1
Total operating expenses
15
14
15
Loss from investment in joint venture
—
—
—
Operating income (loss)
1
(1)
(4)
Interest expense
(1)
1
1
Other expense (income), net
2
(1)
(1)
Income (loss) before income taxes
2
(1)
(4)
Income tax expense (benefit)
—
—
—
Net income (loss)
2
%
(1)
%
(4)
%
Stock-based compensation expense:
Year Ended December 31,
2025
2024
2023
(as a percentage of revenue)
Cost of revenue
—
%
—
%
—
%
Technology and development
—
—
—
General and administrative
1
1
2
New pet acquisition expense
1
1
1
Total stock-based compensation expense
2
%
2
%
3
%
Year Ended December 31,
2025
2024
2023
(as a percentage of subscription revenue)
Subscription business revenue
100
%
100
%
100
%
Subscription business cost of revenue
80
83
86
47
Comparison of the years ended December 31, 2025, 2024, and 2023
Revenue
Year Ended December 31,
% Change
2025
2024
2023
2025 vs. 2024
2024 vs. 2023
(in thousands, except percentages, pet and per pet data)
Revenue:
Subscription business
$
989,338
$
856,521
$
712,906
16%
20%
Other business
449,967
429,163
395,699
5
8
Total revenue
$
1,439,305
$
1,285,684
$
1,108,605
12
16
Percentage of Revenue by Segment:
Subscription business
69
%
67
%
64
%
Other business
31
33
36
Total revenue
100
%
100
%
100
%
Total pets enrolled (at period end)
1,647,565
1,677,570
1,714,473
(2)
(2)
Total subscription pets enrolled (at period end)
1,096,173
1,041,212
991,426
5
5
Monthly average revenue per pet
$
80.79
$
72.98
$
65.26
11
12
Average monthly retention
98.34
%
98.25
%
98.49
%
Year ended December 31, 2025 compared to year ended December 31, 2024. Total revenue increased by $153.6 million, or 12%, to $1,439.3 million for the twelve months ended December 31, 2025. Revenue from our subscription business segment increased by $132.8 million, or 16%, to $989.3 million for the twelve months ended December 31, 2025. This increase was primarily due to an 11% increase in monthly average revenue per pet and an increase in subscription pet months (the sum of pets enrolled for each month during a period) for policies underwritten by Trupanion. Our subscription pets enrolled increased by 54,961 pets, or 5%, to 1,096,137 for the twelve months ended at December 31, 2025, which was consistent with the growth rate of pets enrolled in the prior year period. Revenue from our other business segment increased by $20.8 million, or 5%, to $450 million for the twelve months ended December 31, 2025. This increase was primarily driven by a 20% increase in monthly average revenue per pet in this segment, partially offset by a decrease in pet months primarily reflecting the expected run-off of pets we historically insured for Pets Best.
48
Cost of Revenue
Year Ended December 31,
% Change
2025
2024
2023
2025 vs. 2024
2024 vs. 2023
(in thousands, except percentages, pet and per pet data)
Cost of Revenue:
Subscription business:
Veterinary invoice expense
$
700,154
$
624,428
$
543,196
12%
15%
Other cost of revenue
90,726
82,423
70,490
10
17
Total cost of revenue
$
790,880
$
706,851
$
613,686
12
15
Other business:
Veterinary invoice expense
$
328,821
$
324,720
$
287,859
1
13
Other cost of revenue
88,593
75,315
76,044
18
(1)
Total cost of revenue
$
417,414
$
400,035
$
363,903
4
10
Percentage of Revenue by Segment:
Subscription business:
Veterinary invoice expense
71
%
73
%
76
%
Other cost of revenue
9
10
10
Total cost of revenue
80
83
86
Other business:
Veterinary invoice expense
73
76
73
Other cost of revenue
20
18
19
Total cost of revenue
93
94
92
Total pets enrolled (at period end)
1,647,565
1,677,570
1,714,473
(2)
(2)
Total subscription pets enrolled (at period end)
1,096,173
1,041,212
991,426
5
5
Monthly average revenue per pet
$
80.79
$
72.98
$
65.26
11
12
Year ended December 31, 2025 compared to year ended December 31, 2024. Total cost of revenue for our subscription business segment increased by $84.0 million, or 12%, to $790.9 million, for the twelve months ended December 31, 2025. This increase was driven by a $75.7 million, or 12%, increase in veterinary invoice expense and an $8.3 million, or 10%, increase in other cost of revenue. The 12% increase in veterinary invoice expense was primarily driven by an 8% increase in veterinary invoice expense per pet and an increase in total subscription pet months for policies underwritten by Trupanion. The 10% increase in other cost of revenue was primarily due to general increases in costs attributable to growth in our membership and subscription revenue. Subscription business total cost of revenue decreased from 83% to 80% of revenue year-over-year primarily due to growth in subscription revenue outpacing growth in subscription veterinary invoice expense.
Total cost of revenue for our other business segment increased by $17.4 million, or 4%, to $417.4 million for the twelve months ended December 31, 2025. This increase was driven by a $4.1 million, or 1%, increase in veterinary invoice expense and a $13.3 million, or 18% increase in other cost of revenue. The 1% increase in veterinary invoice expense was primarily driven by a 16% increase in veterinary invoice expense per pet, partially offset by a decrease in pet months in this segment primarily reflecting the expected run-off of pets we historically insured for Pets Best. Within our other business segment, fluctuations in other cost of revenue are largely driven by trends in revenue and veterinary invoice expense. Total cost of revenue for the other business segment decreased from 94% to 93% of revenue year-over-year.
49
Technology and Development Expenses
Year Ended December 31,
% Change
2025
2024
2023
2025 vs. 2024
2024 vs. 2023
(in thousands, except percentages)
Technology and development
$
37,848
$
31,255
$
21,403
21%
46%
Percentage of total revenue
3
%
2
%
2
%
Year ended December 31, 2025 compared to year ended December 31, 2024. Technology and development expenses increased by $6.6 million, or 21%, to $37.8 million for the twelve months ended December 31, 2025. This increase was primarily due to a $4.7 million increase in general compensation and other employee-related expenses, a $1.3 million reduction in capitalized expenditures related to internally developed software projects, and a $0.7 million increase in new product exploration and development expenses. Technology and development expenses increased from 2% to 3% of total revenue year-over-year.
General and Administrative Expenses
Year Ended December 31,
% Change
2025
2024
2023
2025 vs. 2024
2024 vs. 2023
(in thousands, except percentages)
General and administrative
$
76,648
$
63,731
$
60,207
20%
6%
Percentage of total revenue
5
%
5
%
5
%
Year ended December 31, 2025 compared to year ended December 31, 2024. General and administrative expenses increased by $12.9 million, or 20%, to $76.6 million for the twelve months ended December 31, 2025. This increase was driven by increases of $12.1 million in general compensation and other employee-related expenses and $1.9 million in underwriting fees related to our Canadian business, partially offset by a $0.8 million decrease in professional services and a $0.3 million decrease in other miscellaneous expenses. General and administrative expenses remained constant at 5% of total revenue year-over-year.
New Pet Acquisition Expense
Year Ended December 31,
% Change
2025
2024
2023
2025 vs. 2024
2024 vs. 2023
(in thousands, except pet and per pet data)
New pet acquisition expense
$
85,408
$
71,379
$
77,372
20%
(8)%
Percentage of total revenue
6
%
6
%
7
%
Subscription Business:
Total subscription pets enrolled (at period end)
1,096,173
1,041,212
991,426
5
5
Average pet acquisition cost (PAC)
$
288
$
235
$
228
23
3
Year ended December 31, 2025 compared to year ended December 31, 2024. New pet acquisition expenses increased by $14.0 million, or 20%, to $85.4 million for the twelve months ended December 31, 2025. This increase was primarily driven by increased marketing spend as we have begun deploying more capital to acquire new pets in a disciplined manner. New pet acquisition expense as a percentage of revenue remained constant at 6% as we were able to stay disciplined with our discretionary pet acquisition spend.
50
Depreciation and Amortization
Year Ended December 31,
% Change
2025
2024
2023
2025 vs. 2024
2024 vs. 2023
(in thousands, except percentages)
Depreciation and amortization
$
15,836
$
16,466
$
12,474
(4)%
32%
Percentage of total revenue
1
%
1
%
1
%
Year ended December 31, 2025 compared to year ended December 31, 2024. Depreciation and amortization expense decreased by $0.6 million, or 4%, to $15.8 million for the twelve months ended December 31, 2025, primarily driven by fewer internally developed software projects placed in-service during the period.
Total Other Expense (Income), Net
Year Ended December 31,
% Change
2025
2024
2023
2025 vs. 2024
2024 vs. 2023
(in thousands, except percentages)
Interest expense
$
13,759
$
14,498
$
12,077
(5)%
20%
Other (income), net
(21,916)
(14,374)
(7,701)
52
87
Total other (income) expense, net
$
(8,157)
$
124
$
4,376
(6,678)%
(97)%
Percentage of total revenue
1
%
—
%
—
%
Year ended December 31, 2025 compared to year ended December 31, 2024. Total other (income) expense, net increased by $8.3 million from expense of $0.1 million to income of $8.2 million for the twelve months ended December 31, 2025, primarily due to a $7.8 million realized gain on the nonmonetary exchange of our Baystride preferred stock investment for intellectual property developed by Baystride and a $0.7 million decrease in interest expense.
Income Tax Expense (Benefit)
Year ended December 31, 2025 compared to year ended December 31, 2024. Income tax expense (benefit) increased by $2.6 million from a benefit of less than $0.1 million to expense of $2.6 million for the twelve months ended December 31 2025, primarily due to the transfer of our Canadian insurance business to GPIC, resulting in an increase in taxable income in Canada where it is unable to be offset by historical U.S. losses.
Stock-Based Compensation
Year ended December 31, 2025 compared to year ended December 31, 2024. Stock-based compensation is included in the cost and expense line items in the consolidated statements of operations, discussed above. Stock-based compensation expense increased from $33.4 million to $38.3 million for the twelve months ended December 31, 2025. The amount of stock-based compensation recognized largely reflects the timing and vesting of our annual performance grants, calculated according to our equity incentive plan.
51
Quarterly Results of Operations
The following tables contain selected quarterly financial information for the years ended December 31, 2025 and 2024. The unaudited quarterly information has been prepared on a basis consistent with the audited consolidated financial statements and includes all adjustments that we consider necessary for a fair presentation of the information shown. These quarterly operating results for any fiscal quarter are not necessarily indicative of the operating results for any full fiscal year or future period.
Consolidated Statements of Operations Data:
Three Months Ended
Dec. 31, 2025
Sep. 30, 2025
Jun. 30, 2025
Mar. 31, 2025
Dec. 31, 2024
Sep. 30, 2024
Jun. 30, 2024
Mar. 31, 2024
(in thousands)
Revenue:
Subscription business
$
261,422
$
252,697
$
242,156
$
233,064
$
227,783
$
218,986
$
208,618
$
201,134
Other business
115,431
114,223
111,401
108,911
109,524
108,470
106,182
104,987
Total revenue
376,853
366,920
353,557
341,975
337,307
327,456
314,800
306,121
Cost of revenue:
Subscription business
204,782
200,766
195,488
189,845
181,614
177,365
175,740
172,132
Other business
107,044
106,100
103,242
101,027
102,770
100,712
98,791
97,762
Total cost of revenue(1)
311,826
306,866
298,730
290,872
284,384
278,077
274,531
269,894
Operating expenses:
Technology and development(1)
11,303
9,887
8,586
8,072
8,172
7,933
8,190
6,960
General and administrative(1)
18,323
18,311
20,122
19,892
16,828
16,977
15,253
14,673
New pet acquisition expense(1)
23,103
21,946
19,843
20,516
18,354
18,308
17,874
16,843
Goodwill impairment charges
1,129
—
—
—
5,299
—
—
—
Depreciation and amortization
4,032
4,051
3,962
3,791
3,924
4,381
4,376
3,785
Total operating expenses
57,890
54,195
52,513
52,271
52,577
47,599
45,693
42,261
Gain (loss) from investment in joint venture
—
—
—
(305)
2
(34)
(47)
(103)
Operating income (loss)
7,137
5,859
2,314
(1,473)
348
1,746
(5,471)
(6,137)
Interest expense
4,076
2,790
3,682
3,211
3,427
3,820
3,655
3,596
Other (income), net
(3,232)
(3,530)
(11,914)
(3,240)
(4,773)
(3,538)
(3,220)
(2,843)
Income (loss) before income taxes
6,293
6,599
10,546
(1,444)
1,694
1,464
(5,906)
(6,890)
Income tax expense (benefit)
663
726
1,133
39
38
39
(44)
(38)
Net income (loss)
$
5,630
$
5,873
$
9,413
$
(1,483)
$
1,656
$
1,425
$
(5,862)
$
(6,852)
(1) Includes stock-based compensation expense as follows (in thousands):
52
Three Months Ended
Dec. 31, 2025
Sep. 30, 2025
Jun. 30, 2025
Mar. 31, 2025
Dec. 31, 2024
Sep. 30, 2024
Jun. 30, 2024
Mar. 31, 2024
(in thousands)
Veterinary invoice expense(2)
$
620
$
677
$
774
$
770
$
835
$
847
$
854
$
924
Other cost of revenue(2)
605
585
605
489
502
554
541
466
Technology and development
1,710
1,705
1,470
1,151
1,160
1,259
1,261
1,254
General and administrative
5,025
4,971
5,047
4,528
4,261
4,125
3,861
3,449
New pet acquisition expense
1,567
1,561
1,560
2,892
1,536
1,555
2,129
2,059
Total stock-based compensation expense
$
9,527
$
9,499
$
9,456
$
9,830
$
8,294
$
8,340
$
8,646
$
8,152
(2) Veterinary invoice expense and Other cost of revenue together comprise stock-based compensation expense included within Total cost of revenue (in thousands).
Three Months Ended
Dec. 31, 2025
Sep. 30, 2025
Jun. 30, 2025
Mar. 31, 2025
Dec. 31, 2024
Sep. 30, 2024
Jun. 30, 2024
Mar. 31, 2024
(as a percentage of revenue)
Revenue
100
%
100
%
100
%
100
%
100
%
100
%
100
%
100
%
Cost of revenue
83
84
84
85
84
85
87
88
Operating expenses:
Technology and development
3
3
2
2
2
2
3
2
General and administrative
5
5
6
6
5
5
5
5
New pet acquisition expense
6
6
6
6
5
6
6
6
Goodwill impairment charges
—
—
—
—
2
—
—
—
Depreciation and amortization
1
1
1
1
1
1
1
1
Total operating expenses
15
15
15
15
15
14
15
14
Gain (loss) from investment in joint venture
—
—
—
—
—
—
—
—
Operating income (loss)
2
2
1
—
—
1
(2)
(2)
Interest expense
(1)
(1)
(1)
1
1
1
1
1
Other (income), net
1
1
3
(1)
(1)
(1)
(1)
(1)
Income (loss) before income taxes
2
2
3
—
1
—
(2)
(2)
Income tax expense (benefit)
—
—
—
—
—
—
—
—
Net income (loss)
2
%
2
%
3
%
—
%
—
%
—
%
(2)
%
(2)
%
Three Months Ended
Dec. 31, 2025
Sep. 30, 2025
Jun. 30, 2025
Mar. 31, 2025
Dec. 31, 2024
Sep. 30, 2024
Jun. 30, 2024
Mar. 31, 2024
(as a percentage of subscription revenue)
Subscription business revenue
100
%
100
%
100
%
100
%
100
%
100
%
100
%
100
%
Subscription business cost of revenue
78
79
81
81
80
81
84
86
53
Liquidity and Capital Resources
The following table summarizes our cash flows for the periods indicated (in thousands):
Year Ended December 31,
2025
2024
2023
Net cash provided by operating activities
$
89,488
$
48,287
$
18,638
Net cash provided by (used in) investing activities
(95,887)
(13,457)
7,639
Net cash provided by (used in) financing activities
(22,862)
(3,957)
59,126
Effect of foreign exchange rates on cash, cash equivalents, and restricted cash, net
1,189
(1,877)
424
Net change in cash, cash equivalents, and restricted cash
$
(28,072)
$
28,996
$
85,827
Our primary requirements for liquidity are paying veterinary invoices, funding and growing our operations, funding our capital requirements, investing in new member acquisition, investing in enhancements to our member experience, and servicing debt. We have certain contractual obligations in the normal course of business, including obligations and commitments relating to our credit arrangements, non-cancellable vendor purchase agreements, as well as future payments of veterinary invoices. Refer to Note 9, Reserve for Veterinary Invoices, included in Item 8 of Part II of this 10-K, for further details on anticipated cash outflows.
Most recently, our primary source of liquidity has been cash provided by our operations. We believe our operating cash flow is sufficient to fund our operations and capital requirements for the next 12 months. As we continue to grow and consider strategic opportunities, however, we may explore additional financing to fund our operations and growth or for strategic purposes. Financing could include equity, equity-linked, or debt financing. Additional financing may not be available to us on acceptable terms, or at all. If our capital surplus grows relative to the rate of growth of our business, we may also generate cash for operations and growth, via dividends or other methods, from one or more of our underwriting entities.
As of December 31, 2025, we had $370.7 million in cash, cash equivalents and short-term investments, of which $320.7 million was held by our insurance entities. Outside of insurance entities, we held $50.0 million in cash, cash equivalents and short-term investments with an additional $5.0 million available under our PNC Facility.
In April 2021, our board of directors approved a share repurchase program, pursuant to which we may, between May 2021 and May 2026, repurchase outstanding shares of our common stock. While our board of directors has approved the program, any repurchase activity is subject to quarterly assessment and board approval, based on various factors including available cash, our stock price relative to our estimated intrinsic value, forecasted operating results, and available opportunities to deploy capital. We repurchased no shares under this program during the year ended December 31, 2025.
Operating Cash Flows
Net cash provided by operating activities was $89.5 million for the year ended December 31, 2025, compared to $48.3 million for the year ended December 31, 2024. This increase was primarily driven by improved operating results largely driven by higher revenue and improved Subscription Business margins and timing differences in other working capital activities. Changes in accounts receivable and deferred revenue were primarily related to annual policies with annual payment terms within our Other Business segment. Changes in our reserve for veterinary invoices are driven by multiple factors, including ongoing analysis of claims frequency and severity. Additionally, changes in our accounts payable, accrued liabilities, and other liabilities are primarily due to differences in timing of payments.
Investing Cash Flows
Net cash used in investing activities was $95.9 million for the year ended December 31, 2025, primarily consisting of purchases of investment securities of $256.0 million as well as $14.1 million of capital expenditures primarily related to the development of internal-use software focused on member experience, claims processing and internal policy management improvements, partially offset by $172.6 million in sales and maturities of investment securities. Net cash used in investing activities was $13.5 million for the year ended December 31, 2024, primarily consisting of purchases of investment securities of $133.5 million as well as $9.7 million of capital expenditures primarily related to the development of internal-use software focused on member experience, claims processing, and internal policy management improvements, partially offset by $127.7 million in sales and maturities of investment securities.
Financing Cash Flows
Net cash used in financing activities was $22.9 million for the year ended December 31, 2025, primarily consisting of $131.9 million of repayments on the Prior Credit Facility and $2.5 million of repayments on the PNC Facility as well as $3.7 million in shares withheld to satisfy tax withholdings, partially offset by $114.2 million in proceeds from debt financing, net of financing fees. Net cash used in financing activities was $4.0 million for the year ended December 31, 2024, primarily consisting of $2.5 million in shares withheld to satisfy tax withholdings and $1.4 million in repayments on the Prior Credit Facility.
54
Long-Term Debt
Prior Credit Facility
Our Prior Credit Facility provided us with up to $150.0 million of credit, and we had outstanding term loans totaling $116.2 million prior to repayment. In November 2025, we repaid all amounts under the Prior Credit Facility utilizing proceeds from our new PNC facility.
PNC Facility
In November 2025, we entered into a credit agreement (the "PNC Agreement") with PNC Bank, National Association, as the administrative agent. The PNC Agreement provides for a term loan facility of $100.0 million and a revolving credit facility of $20.0 million (collectively, the "PNC Facility"). The PNC Facility matures in November 2028.
Loans under the PNC Facility bear interest at a reference rate plus an applicable margin, which will generally be the SOFR reference rate plus 2.75% per annum. The Company will make quarterly principal payments of $2.5 million on the term loan facility. The Company may voluntarily prepay loans or reduce revolving commitments under the PNC Facility at any time without premium or penalty.
The loans under the PNC Agreement are secured by substantially all of our assets. The PNC Agreement contains financial and other covenants, including quarterly financial ratios, and it includes limitations on, among other things, indebtedness, liens, investments, and mergers or similar transactions.
Regulation
The majority of our investments are held by our insurance entities to satisfy risk-based capital requirements (also referred to as minimum capital requirements) of applicable state and federal regulators. These regulatory requirements provide a method for analyzing the minimum amount of capital (statutory capital and surplus plus other adjustments) appropriate for an insurance company to support its overall business operations, taking into account the risk characteristics of the company’s assets, liabilities and certain other items. An insurance entity cannot use this capital for general operating expenses without regulatory approval. An insurance company found to have insufficient statutory capital based on its risk-based or minimum capital test requirements or otherwise fails to satisfy other applicable statutory requirements may be subject to varying levels of additional regulatory oversight.
As of December 31, 2025, our insurance entities collectively held $88.1 million in cash and cash equivalents, to be used for operating expenses of our insurance entities, $232.6 million in short-term investments and $299.6 million in other current assets. In addition to minimum capital requirements the majority of assets in our insurance entities are subject to dividend rules and regulations prescribed by jurisdictions in which they are authorized to operate.
We are subject to comprehensive regulation and supervision in the jurisdictions where we conduct business, including requirements regarding our capital structure, ownership, financial condition, general business operations, transactions between affiliated entities and payment of dividends from our insurance subsidiaries. We are also subject to market conduct examinations of our management and operations.
The National Association of Insurance Commissioners ("NAIC") has approved a series of uniform statutory accounting principles applicable in some form in all states. Developed to ensure insurance companies maintain sufficient capital to pay claims and remain solvent, these principles conservatively value assets and liabilities and usually result in differences from financial statements prepared in accordance with U.S. GAAP. The NAIC has also adopted risk-based capital requirements for life, health and property and casualty insurance companies, which require APIC and ZPIC to maintain certain levels of surplus to support our overall business operations in consideration of our size and risk profile. If we fail to maintain the amount of risk-based capital required, we will be subject to additional regulatory oversight. To comply with these regulations, we may be required to maintain capital that we would otherwise invest in our growth and operations.
NAIC also has adopted a pet insurance model act to establish regulatory standards for the pet insurance industry, related to how insurers enforce waiting periods, certain policy conditions, and the sale of pet insurance in general. As of January 2026, approximately 17 states have either adopted these NAIC standards or have enacted their own versions.
Although U.S. federal law generally does not directly regulate the insurance industry, various federal regulatory and legislative changes have been proposed in the past and could be proposed in the future, including proposed federal regulation that could supplement or replace the current system of state regulation of insurers. It is not possible to predict whether any of these proposals might be adopted, or the effect federal involvement in insurance may have on us.
American Pet Insurance Company ("APIC")
APIC, our wholly-owned insurance subsidiary domiciled in New York, underwrites all of our policies in the U.S. As our business in the U.S. grows, the amount of capital we are required to maintain to satisfy our risk-based capital requirements will also increase, though risk-based capital requirements also take our overall rate of growth into consideration. Recently, our other business segment growth has slowed and, we currently expect that to continue, which would reduce capital requirements. In May 2025 and February 2026, APIC distributed extraordinary dividends of $26.0 million and $14.9 million to Trupanion, Inc, respectively. APIC's primary regulator is the New York Department of Financial Services ("NY DFS").
55
ZPIC Insurance Company ("ZPIC")
ZPIC, our wholly-owned insurance subsidiary domiciled in Missouri, has not yet begun underwriting activity, but we have funded its required statutory capital. We formed this insurance subsidiary to provide us flexibility as to the insurance entity we use to market and write policies in the United States. ZPIC's primary regulator is the Missouri Department of Commerce and Insurance ("MODCI").
GPIC Insurance Company ("GPIC")
GPIC, our wholly-owned insurance subsidiary domiciled in Canada underwrites the majority of our policies in Canada. We are continuing to transition the remaining portion of our insurance activity in Canada to GPIC from a fronting arrangement with Accelerant Insurance Company of Canada (formerly Omega General Insurance Company) ("Accelerant"). Pursuant to the Canadian Office of the Superintendent of Financial Institutions ("OSFI") regulations, we have contributed CAD $29.5 million to GPIC as the required statutory capital for this subsidiary. The capital we maintain at GPIC is, and may continue to be for the foreseeable future, more than the amount that we historically held subject to our fronting arrangement with Accelerant.
Under the terms of our agreements with Accelerant, we retain any financial risk associated with our Canadian business, Accelerant's Canadian insurance operations are supervised and regulated by Canadian federal, provincial and territorial governments and Accelerant is a fully licensed insurer in all of the Canadian provinces and territories in which we do business. As we transition more of the business to GPIC, the amount we are required to fund in the Canadian trust account will be reduced. As of December 31, 2025, the account held CAD $8.7 million.
Wyndham Insurance Company (SAC) Limited ("WICL") Segregated Account AX, Wyndham Insurance Company (SAC) Limited Segregated Account Trupanion Germany, and Wyndham Insurance Company (SAC) Limited Segregated Account Trupanion Switzerland
WICL is domiciled in Bermuda and regulated by the Bermuda Monetary Authority ("BMA"). WICL Segregated Account AX was established by WICL, with Trupanion, Inc. as the shareholder, to enter into a reinsurance agreement with Accelerant for our business activity in Canada. All of the assets and liabilities of WICL Segregated Account AX are legally segregated from other assets and liabilities within WICL, and all shares of the segregated account are owned by Trupanion, Inc. Trupanion, Inc. received dividends of $15.6 million, $7.0 million, and $5.3 million from WICL Segregated Account AX in March, July, and November 2025, respectively, as permitted under our agreements with WICL. As required by OSFI regulations related to our reinsurance agreement with Accelerant, we are required to maintain a Canadian Reinsurance Trust account with the greater of CAD $2.0 million or 120% of unearned Canadian premium plus 20% of outstanding Canadian claims, including all incurred but not reported claims. As of December 31, 2025, the account held CAD $8.7 million which we expect will continue to decrease as we rollover our Canadian book of business to GPIC.
WICL Segregated Account Trupanion Germany and WICL Segregated Account Trupanion Switzerland were established in the third quarter of 2024 by WICL, with Trupanion, Inc. as the shareholder, for purposes of entering into reinsurance agreements with underwriters in Germany and Switzerland, respectively. All of the assets and liabilities of WICL Segregated Account Trupanion Germany and WICL Segregated Account Trupanion Switzerland are legally segregated from other assets and liabilities within WICL, and all shares of the segregated accounts are owned by Trupanion, Inc.
Though we are not directly regulated by the BMA, WICL's regulation and compliance impacts us as it could have an adverse impact on our ability to secure dividends from our WICL segregated accounts. WICL is regulated by the BMA under the Insurance Act of 1978 ("Insurance Act") and the Segregated Accounts Company Act of 2000. The Insurance Act imposes on Bermuda insurance companies, solvency and liquidity standards, certain restrictions on the declaration and payment of dividends and distributions, certain restrictions on the reduction of statutory capital, and auditing and reporting requirements, and grants the BMA powers to supervise and, in certain circumstances, to investigate and intervene in the affairs of insurance companies. Under the Insurance Act, WICL, as a class 3 insurer, is required to maintain available statutory capital and surplus at a level equal to or in excess of a prescribed minimum established by reference to net written premiums and loss reserves.
Under the Bermuda Companies Act 1981, as amended, a Bermuda company may not declare or pay a dividend or make a distribution out of contributed surplus if there are reasonable grounds for believing that: (a) the company is, or would after the payment be, unable to pay its liabilities as they become due; or (b) the realizable value of the company’s assets would thereby be less than its liabilities. The Segregated Accounts Company Act of 2000 further requires that dividends out of a segregated account can only be paid to the extent that the account remains solvent and the value of its assets remain greater than the aggregate of its liabilities and its issued share capital and share premium accounts.
ContractualObligations
We enter into long-term contractual obligations and commitments in the normal course of business, consisting primarily of debt obligations and non-cancellable vendor service agreements. In November 2025, we entered into the PNC Agreement, which provides up to $120.0 million of credit, including $100.0 million term loan and $20.0 million revolving loan facility. We used the proceeds under the PNC Agreement to repay all amounts due and outstanding under our Prior Credit Facility. The PNC
56
Agreement will require us to repay the underlying obligations over a three-year term at SOFR plus a margin. Refer to Note 11, Debt, included in Item 8 of Part II of this report for further details regarding the credit agreements, including interest and future principal repayments.
Critical Accounting Policies and Significant Estimates
Our discussion and analysis of our financial condition and results of operations is based upon our consolidated financial statements, which have been prepared in accordance with GAAP. The preparation of these consolidated financial statements requires us to make estimates and judgments that affect the reported amounts of assets and liabilities and the disclosure of contingent assets and liabilities as of the date of the consolidated financial statements, as well as the reported revenue and expenses during the reporting periods.
Critical accounting policies and estimates are those that we consider the most important to the portrayal of our financial condition and results of operations because they require our most difficult, subjective or complex judgments, often as a result of the need to make estimates about the effect of matters that are inherently uncertain. Generally, we base our estimates on historical experience and on various other factors that we believe to be reasonable under the circumstances. Actual results may differ from these estimates.
Reserve for Veterinary Invoices
The reserve for veterinary invoices represents our estimate of future amounts we will pay for veterinary claims that have been incurred but not yet paid as of the reporting date. The reserve also includes our best estimate of related internal processing costs. We use the paid development method and other commonly used actuarial methods to estimate reserves for veterinary invoices for our subscription business and for the majority of our other business segment. Paid loss development factors measure the pattern of veterinary invoice payments over time and are used to estimate ultimate loss incurred. These factors are derived from historical paid loss triangles and reflect observed claim settlement patterns and any operational or external changes affecting claim payments including, but not limited to:
•the number of veterinary invoices we expect to receive,
•the average cost of those veterinary invoices,
•the time elapsed between the date of loss and the date of payment,
•the members chosen deductible,
•the appropriate segmentation between product lines or claim processing method, and
•the expected cost to process and administer claim payments
As of each reporting date, we also utilize subsequent claims payment activities to monitor and reevaluate previously established reserves. If estimates are determined to be materially different than originally reported, we record “development” in the results of operations in the period the estimates are changed. Development is unfavorable when losses ultimately settle for more than the amount reserved or subsequent estimates indicate a basis for reserve increases on unresolved claims. Development is favorable when losses ultimately settle for less than the amount reserved, or subsequent estimates indicate a basis for reducing loss reserves on unresolved claims.
As of December 31, 2025, our reserve for veterinary invoices was $55.9 million, consisting of $53.4 million for the amount we expect to pay in the future for veterinary invoices dated between January 1, 2025 and December 31, 2025, inclusive of related processing costs, and a reserve of $2.5 million for invoices dated prior to January 1, 2025. We believe the reserve amount as of December 31, 2025 is adequate, and we do not believe that there are any reasonably likely changes in the facts or circumstances underlying key assumptions that would result in the reserve balance being insufficient in an amount that would have a material impact on our reported results, financial position or liquidity. The ultimate liability, however, may be in excess of or less than the amount we have reserved.
For the year ended December 31, 2025, we paid $46.6 million for veterinary invoices dated on or before December 31, 2024, including related processing costs. Our reserve estimate for these expenses was $51.6 million as of December 31, 2024. As of December 31, 2025, we had a favorable development on veterinary invoice reserves of $2.5 million for the year ended December 31, 2024. Refer to Note 9, Reserve for Veterinary Invoices, in Item 8 of Part II of this report, for further details.
57
Income Taxes
We determine our deferred tax assets and liabilities based on the differences between the financial reporting and tax basis of assets and liabilities. The deferred tax assets and liabilities are measured using the enacted tax rates that will be in effect when the differences are expected to reverse. A valuation allowance is recorded when it is more likely than not that the deferred tax asset will not be recovered. We apply judgment in the determination of the consolidated financial statement recognition and measurement of a tax position taken or expected to be taken in a tax return. Although we believe our assumptions, judgments and estimates are reasonable, changes in tax laws or our interpretation of tax laws and the resolution of any tax audits could significantly impact the amounts provided for income taxes in our consolidated financial statements.
58
Item 7A. Quantitative and Qualitative Disclosures About Market Risks
Market risk is the risk of loss arising from adverse changes in market rates and prices, such as interest rates (inclusive of credit spreads) and other relevant market rate or price changes. Market risk is directly influenced by the volatility and liquidity in the markets in which the related underlying assets are traded. The following is a discussion of our primary market risk exposures and how those exposures are managed as of December 31, 2025. Our market risk sensitive instruments are primarily entered into for purposes other than trading.
Interest Rate Risk
The primary market risks to our investment portfolio are interest rate risk and credit risk associated with investments in fixed maturity securities. The objective of our investment activities is to maintain principal and the majority of our investments are short-term in nature. Changes in interest rates have a direct impact on the market valuation of our fixed maturity investment securities. Certain securities are held in an unrealized loss position, but we do not intend to sell and believe we will not be required to sell any of these securities before their anticipated recovery. We manage interest rate risk by investing in securities with relatively short durations. A hypothetical 100 basis point interest rate increase would not have a material effect on the fair value of our investments. For additional information regarding our investments, refer to Note 5, Investments, included in Item 8 of this report.
Additionally, we are exposed to interest rate risk as a result of our debt. Our PNC Facility bears interest at a floating base rate plus an applicable margin. As of December 31, 2025, our aggregate outstanding indebtedness was $111.8 million. A hypothetical 100 basis point interest rate increase would increase our annual interest expense by $1.1 million.
Foreign Currency Exchange Risk
We generate approximately 16% of our revenue in Canada. As our operations in Canada or the United States grow on an absolute basis and/or relative to one another, our results of operations and cash flows will be subject to fluctuations due to changes in foreign currency exchange rates. A 10% change in the Canadian currency exchange rate could have a material impact on our consolidated financial condition or results of operations. A hypothetical change of this magnitude would have increased or decreased our total revenues by approximately $23.3 million, total expenses by approximately $22.3 million, and would have had a net impact of $1.0 million on income for the year ended December 31, 2025. To date, we have not entered into any material foreign currency hedging contracts although we may do so in the future. Currently, our European foreign currency risk is immaterial.
59
Item 8. Financial Statements and Supplementary Data
Report of Independent Registered Public Accounting Firm
To the Stockholders and the Board of Directors of Trupanion, Inc.
Opinion on the Financial Statements
We have audited the accompanying consolidated balance sheets of Trupanion, Inc. (the Company) as of December 31, 2025 and 2024, the related consolidated statements of operations, comprehensive income (loss), stockholders' equity and cash flows for each of the three years in the period ended December 31, 2025, and the related notes and financial statement schedule listed in the Index at Item 15(a)(2) (collectively referred to as the “consolidated financial statements”). In our opinion, the consolidated financial statements present fairly, in all material respects, the financial position of the Company at December 31, 2025 and 2024, and the results of its operations and its cash flows for each of the three years in the period ended December 31, 2025, in conformity with U.S. generally accepted accounting principles.
We also have audited, in accordance with the standards of the Public Company Accounting Oversight Board (United States) (PCAOB), the Company's internal control over financial reporting as of December 31, 2025, based on criteria established in Internal Control—Integrated Framework issued by the Committee of Sponsoring Organizations of the Treadway Commission (2013 framework), and our report dated February 13, 2026 expressed an unqualified opinion thereon.
Basis for Opinion
These financial statements are the responsibility of the Company’s management. Our responsibility is to express an opinion on the Company’s financial statements based on our audits. We are a public accounting firm registered with the PCAOB and are required to be independent with respect to the Company in accordance with the U.S. federal securities laws and the applicable rules and regulations of the Securities and Exchange Commission and the PCAOB.
We conducted our audits in accordance with the standards of the PCAOB. Those standards require that we plan and perform the audit to obtain reasonable assurance about whether the financial statements are free of material misstatement, whether due to error or fraud. Our audits included performing procedures to assess the risks of material misstatement of the financial statements, whether due to error or fraud, and performing procedures that respond to those risks. Such procedures included examining, on a test basis, evidence regarding the amounts and disclosures in the financial statements. Our audits also included evaluating the accounting principles used and significant estimates made by management, as well as evaluating the overall presentation of the financial statements. We believe that our audits provide a reasonable basis for our opinion.
Critical Audit Matter
The critical audit matter communicated below is a matter arising from the current period audit of the financial statements that was communicated or required to be communicated to the audit committee and that: (1) relates to accounts or disclosures that are material to the financial statements and (2) involved our especially challenging, subjective, or complex judgments. The communication of the critical audit matter does not alter in any way our opinion on the consolidated financial statements, taken as a whole, and we are not, by communicating the critical audit matter below, providing a separate opinion on the critical audit matter or on the account or disclosures to which it relates.
61
Reserve for Veterinary Invoices
Description of the Matter
The Company’s reserve for veterinary invoices totaled $55.9 million as of December 31, 2025. As discussed in Note 1 and Note 9 to the consolidated financial statements, the reserve for veterinary invoices is an estimate of the future amount the Company will pay for veterinary claims that have been incurred but not yet paid as of the reporting date. The reserve also includes the Company's estimate of related internal processing costs. The Company’s reserve for veterinary invoices is based on an actuarial analysis of observed claim settlement patterns including, but not limited to, the number of veterinary invoices the Company expects to receive, the average cost of those veterinary invoices, the time elapsed between the date of loss and the date of payment, the appropriate segmentation between product lines or claim processing method, and the expected cost to process and administer claim payments.
Auditing the Company’s reserve for veterinary invoices is complex and required the involvement of our actuarial specialists due to the sensitivity of the estimated reserve to management’s assumptions. Estimating the ultimate cost to settle the reserve for veterinary invoices is subjective due to the possibility that the actual veterinary invoice payments may not be comparable to historical trends experienced by the Company.
How We Addressed the Matter in Our Audit
We obtained an understanding, evaluated the design and tested the operating effectiveness of the Company’s controls over the process for estimating the reserve for veterinary invoices. This included, among other procedures, understanding management review controls in place over the review and approval of methods and assumptions used in estimating the reserve for veterinary invoices. To test the reserve for veterinary invoices, our audit procedures included, among others, testing the completeness and accuracy of the data used in the actuarial analyses by testing reconciliations of the underlying historical veterinary paid invoice data recorded in the source systems to the Company’s actuarial analyses, and comparing a sample of paid veterinary invoices to source documentation. With the assistance of EY actuarial specialists, we evaluated the appropriateness of the actuarial methods and assumptions used to estimate the reserve for veterinary invoices by comparing such methods and assumptions to our expectations of those used for the specific type of insurance, current and historical invoice payment patterns, and any operational or external changes affecting claim payments. We also compared management’s recorded reserves to a range of reasonable reserve estimates calculated independently by our EY actuarial specialists. Additionally, we performed a hindsight analysis of the prior period estimates using subsequent claims development.
/s/ Ernst & Young LLP
We have served as the Company’s auditor since 2012.
Seattle, Washington
February 13, 2026
62
Trupanion, Inc. Consolidated Statements of Operations (in thousands, except share data)
Year Ended December 31,
2025
2024
2023
Revenue
$
1,439,305
$
1,285,684
$
1,108,605
Cost of revenue:
Veterinary invoice expense(1)
1,028,975
949,148
831,055
Other cost of revenue(1)
179,319
157,738
146,534
Total cost of revenue
1,208,294
1,106,886
977,589
Operating expenses:
Technology and development(1)
37,848
31,255
21,403
General and administrative(1)
76,648
63,731
60,207
New pet acquisition expense(1)
85,408
71,379
77,372
Goodwill impairment charges
1,129
5,299
—
Depreciation and amortization
15,836
16,466
12,474
Total operating expenses
216,869
188,130
171,456
Loss from investment in joint venture
(305)
(182)
(219)
Operating income (loss)
13,837
(9,514)
(40,659)
Interest expense
13,759
14,498
12,077
Other (income), net
(21,916)
(14,374)
(7,701)
Income (loss) before income taxes
21,994
(9,638)
(45,035)
Income tax expense (benefit)
2,561
(5)
(342)
Net income (loss)
$
19,433
$
(9,633)
$
(44,693)
Net income (loss) per share:
Basic
$
0.45
$
(0.23)
$
(1.08)
Diluted
$
0.45
$
(0.23)
$
(1.08)
Weighted average shares of common stock outstanding:
Basic
42,958,654
42,158,773
41,436,882
Diluted
43,555,884
42,158,773
41,436,882
(1)Includes stock-based compensation expense as follows:
Veterinary invoice expense
$
2,841
$
3,460
$
3,667
Other cost of revenue
2,284
2,063
1,612
Technology and development
6,036
4,934
2,846
General and administrative
19,571
15,696
17,717
New pet acquisition expense
7,580
7,279
7,319
63
Trupanion, Inc. Consolidated Statements of Comprehensive Income (Loss) (in thousands)
Year Ended December 31,
2025
2024
2023
Net income (loss)
$
19,433
$
(9,633)
$
(44,693)
Other comprehensive income (loss):
Foreign currency translation adjustments
3,833
(3,037)
2,712
Net unrealized gain on available-for-sale debt securities
876
22
3,992
Other comprehensive income (loss), net of taxes
4,709
(3,015)
6,704
Comprehensive income (loss)
$
24,142
$
(12,648)
$
(37,989)
64
Trupanion, Inc. Consolidated Balance Sheets (in thousands, except share data)
December 31,
2025
2024
Assets
Current assets:
Cash and cash equivalents
$
138,024
$
160,295
Short-term investments
232,706
147,089
Accounts and other receivables, net of allowance for credit losses of $1,311 at December 31, 2025 and $1,117 at December 31, 2024
301,945
274,031
Prepaid expenses and other assets
18,387
15,912
Total current assets
691,062
597,327
Restricted cash
33,434
39,235
Long-term investments
983
373
Property, equipment, and internal-use software, net
104,844
102,191
Intangible assets, net
24,102
13,177
Other long-term assets
21,237
17,579
Goodwill
39,382
36,971
Total assets
$
915,044
$
806,853
Liabilities and stockholders’ equity
Current liabilities:
Accounts payable
$
16,445
$
11,532
Accrued liabilities and other current liabilities
56,509
33,469
Reserve for veterinary invoices
55,921
51,635
Deferred revenue
270,935
251,640
Long-term debt - current portion
10,000
1,350
Total current liabilities
409,810
349,626
Long-term debt
101,784
127,537
Deferred tax liabilities
1,510
1,946
Other liabilities
18,004
4,476
Total liabilities
531,108
483,585
Stockholders’ equity:
Common stock: $0.00001 par value per share, 100,000,000 shares authorized; 44,430,267 and 43,402,081 shares issued and outstanding at December 31, 2025 and 43,516,631 and 42,488,445 shares issued and outstanding at December 31, 2024
—
—
Preferred stock: $0.00001 par value per share, 10,000,000 shares authorized; no shares issued and outstanding
—
—
Additional paid-in capital
604,828
568,302
Accumulated other comprehensive income (loss)
2,097
(2,612)
Accumulated deficit
(206,455)
(225,888)
Treasury stock, at cost: 1,028,186 shares at December 31, 2025 and 2024
(16,534)
(16,534)
Total stockholders’ equity
383,936
323,268
Total liabilities and stockholders’ equity
$
915,044
$
806,853
65
Trupanion, Inc.
Consolidated Statements of Stockholders’ Equity
(in thousands, except share amounts)
Common Stock
Additional Paid-in Capital
Accumulated Other Comprehensive Income (Loss)
Accumulated Deficit
Treasury Stock
Total Stockholders' Equity
Shares
Amount
Balance at January 1, 2023
41,013,158
$
—
$
499,694
$
(6,301)
$
(171,562)
$
(16,534)
$
305,297
Issuance of common stock in connection with the Company's equity award programs, net of tax withholdings
845,708
—
1,118
—
—
—
1,118
Stock-based compensation expense
—
—
35,296
—
—
—
35,296
Other comprehensive income
—
—
—
6,704
—
—
6,704
Net loss
—
—
—
—
(44,693)
—
(44,693)
Balance at December 31, 2023
41,858,866
—
536,108
403
(216,255)
(16,534)
303,722
Issuance of common stock in connection with the Company's equity award programs, net of tax withholdings
629,579
—
(1,743)
—
—
—
(1,743)
Stock-based compensation expense
—
—
33,937
—
—
—
33,937
Other comprehensive loss
—
—
—
(3,015)
—
—
(3,015)
Net loss
—
—
—
—
(9,633)
—
(9,633)
Balance at December 31, 2024
42,488,445
—
568,302
(2,612)
(225,888)
(16,534)
323,268
Issuance of common stock in connection with the Company's equity award programs, net of tax withholdings
913,636
—
(2,015)
—
—
—
(2,015)
Stock-based compensation expense
—
—
38,541
—
—
—
38,541
Other comprehensive income
—
—
—
4,709
—
—
4,709
Net income
—
—
—
—
19,433
—
19,433
Balance at December 31, 2025
43,402,081
$
—
$
604,828
$
2,097
$
(206,455)
$
(16,534)
$
383,936
66
Trupanion, Inc. Consolidated Statements of Cash Flows (in thousands)
Year Ended December 31,
2025
2024
2023
Operating activities
Net income (loss)
$
19,433
$
(9,633)
$
(44,693)
Adjustments to reconcile net income (loss) to cash provided by operating activities:
Depreciation and amortization
15,836
16,466
12,474
Stock-based compensation expense
38,312
33,432
33,161
Realized gain on nonmonetary exchange of preferred stock investment
(7,783)
—
—
Goodwill impairment charges
1,129
5,299
—
Other, net
2,097
(1,748)
1,347
Changes in operating assets and liabilities:
Accounts and other receivables
(27,211)
(6,717)
(35,440)
Prepaid expenses and other assets
(1,166)
3,215
(1,907)
Accounts payable, accrued liabilities, and other liabilities
26,029
2,084
1,644
Reserve for veterinary invoices
4,133
(11,310)
19,485
Deferred revenue
18,679
17,199
32,567
Net cash provided by operating activities
89,488
48,287
18,638
Investing activities
Purchases of investment securities
(256,031)
(133,493)
(165,936)
Maturities and sales of investment securities
172,609
127,653
190,270
Purchases of property, equipment, and internal-use software
(14,129)
(9,716)
(18,280)
Other
1,664
2,099
1,585
Net cash provided by (used in) investing activities
(95,887)
(13,457)
7,639
Financing activities
Proceeds from debt financing, net of financing fees
114,208
—
60,102
Repayment of debt financing
(134,438)
(1,350)
(1,717)
Proceeds from exercise of stock options
1,694
752
2,655
Shares withheld to satisfy tax withholding
(3,712)
(2,519)
(1,536)
Other
(614)
(840)
(378)
Net cash provided by (used in) financing activities
(22,862)
(3,957)
59,126
Effect of foreign exchange rate changes on cash, cash equivalents, and restricted cash, net
1,189
(1,877)
424
Net change in cash, cash equivalents, and restricted cash
(28,072)
28,996
85,827
Cash, cash equivalents, and restricted cash at beginning of period
199,530
170,464
84,637
Cash, cash equivalents, and restricted cash at end of period
$
171,458
$
199,530
$
170,464
Supplemental disclosures
Interest paid
$
13,085
$
13,191
$
12,100
Noncash investing and financing activities:
Purchases of property, equipment, and internal-use software included in accounts payable and accrued liabilities
129
534
887
Right-of-use asset obtained in exchange for lease liability
14,452
—
—
Purchase of intellectual property in exchange for preferred stock investment
14,783
—
—
67
Trupanion, Inc.
Notes to Consolidated Financial Statements
1. Nature of Operations and Summary of Significant Accounting Policies
Description of Business
Trupanion, Inc. (collectively with its wholly-owned subsidiaries, the "Company") provides medical insurance for cats and dogs in the United States, Canada, and certain countries in Continental Europe. Through its data-driven, vertically-integrated approach, the Company develops and offers high-value medical insurance products, priced to take into account each pet's unique characteristics and coverage level.
Basis of Presentation
The consolidated financial statements have been prepared in accordance with U.S. generally accepted accounting principles ("GAAP") and include the accounts of the Company and its wholly-owned subsidiaries. All intercompany accounts and transactions have been eliminated in consolidation.
Certain immaterial prior year amounts have been reclassified to conform with the current year's presentation. These reclassifications had no impact on net earnings, total assets, total liabilities, total shareholders' equity, or cash flows.
Use of Estimates
The preparation of consolidated financial statements in conformity with GAAP requires management to make estimates and assumptions that affect the amounts reported in the consolidated financial statements and accompanying notes. Actual results could differ from such estimates.
Cash, Cash Equivalents and Restricted Cash
The Company considers all highly liquid investments with an original maturity of three months or less to be cash equivalents. At times, cash on deposit may be in excess of the applicable federal deposit insurance corporation limits.
The Company considers any cash account not held in trust for a third party that is contractually restricted to withdrawal or use to be restricted cash. The Company is required to maintain certain restricted cash balances to comply with insurance company regulations. As of December 31, 2025, the Company was in compliance with all requirements.
Accounts and Other Receivables
Accounts and other receivables are comprised of trade receivables and other miscellaneous receivables and are carried at their estimated collectible amounts. Trade receivables are primarily related to the Company’s other business segment where the Company generates revenue from underwriting policies through unaffiliated general agents. These policies are typically annual policies, with monthly payment terms through the end of the twelve-month period. The Company had $281.9 million and $252.0 million accounts receivable associated with underwriting these policies as of December 31, 2025 and 2024, respectively.
Deferred Acquisition Costs
The Company incurs certain costs, including premium taxes, enrollment-based bonuses, and referral fees that directly relate to the successful acquisition of new or renewal customer contracts. These costs are deferred and are included in prepaid expenses and other assets on the consolidated balance sheet and amortized over the related policy term to the applicable financial statement line item, either new pet acquisition expense or other cost of revenue. Deferred acquisition costs as of December 31, 2025 and 2024 were $8.5 million and $7.5 million, respectively. Amortized deferred acquisition costs classified within new pet acquisition expense amounted to $9.3 million, $6.9 million, and $6.0 million and amortized deferred acquisition costs classified within other cost of revenue amounted to $55.3 million, $51.5 million, and $45.6 million, for the years ended December 31, 2025, 2024, and 2023, respectively.
68
Investments
The Company invests in investment grade fixed maturity securities of varying maturities. Available-for-sale securities are reported at fair value with unrealized gains and losses included in accumulated other comprehensive income (loss). Held-to-maturity securities are reported at amortized cost. Premiums or discounts on fixed maturity securities are amortized or accreted over the life of the security and included as interest income within Other (income), net. There were $1.0 million in realized gains and $0.1 million in realized losses on sales of fixed maturity securities during the year ended December 31, 2025, $0.4 million in realized gains and $0.3 million in realized losses on sales of fixed maturity securities during the year ended December 31, 2024, and $0.3 million in realized gains and $0.9 million in realized losses on sales of fixed maturity securities during the years ended December 31, 2023.
Each reporting period, the Company evaluates whether declines in fair value of its investments below carrying value are the result of expected credit losses. This evaluation includes the Company's ability and intent to hold these investments until recovery of carrying value occurs, including an evaluation of all available information relevant to the collectability of the security, including past events, current conditions, and reasonable and supportable forecasts. Expected credit losses are recorded as an allowance through other (income), net within the Company's consolidated statements of operations.
Fair Value of Financial Instruments
The Company is required to disclose information on all assets and liabilities reported at fair value that enables an assessment of the inputs used in determining the reported fair values. The fair value hierarchy prioritizes valuation inputs based on the observable nature of those inputs. The fair value hierarchy applies only to the valuation inputs used in determining the reported fair value of the investments and is not a measure of the investment credit quality. The hierarchy defines three levels of valuation inputs:
Level 1 - Quoted prices in active markets for identical assets or liabilities
Level 2 - Inputs other than quoted prices that are observable for the asset or liability, either directly or indirectly
Level 3 - Unobservable inputs that reflect the Company's own assumptions about the assumptions market participants would use in pricing the asset or liability
The Company's financial instruments, in addition to those presented in Note 7, Fair Value, include cash and cash equivalents, accounts receivable, accounts payable, and accrued liabilities. The carrying amounts of accounts receivable, accounts payable, and accrued liabilities approximate fair value because of the short-term nature of these instruments.
Property, Equipment, and Internal-Use Software
Property, equipment, and internal-use software primarily consists of building, land and land improvements, office equipment, and internal-use software related to the Company’s website and internal support systems. Internal-use software is capitalized during the application development stage of the project. Property and equipment is recorded at cost and depreciated using the straight-line method over the estimated useful life of the respective asset:
Land
Not depreciable
Land improvements
10
years
Building
39
years
Software
3
to
5
years
Office equipment
3
to
5
years
Goodwill and Intangible Assets
Goodwill and indefinite-lived intangible assets are not amortized. The Company reviews these assets for impairment at least annually or if indicators of potential impairment exist. Acquired finite-lived intangibles are amortized on a straight-line basis over the estimated useful lives of the assets. The Company recognized impairment charges on goodwill totaling $1.1 million and $5.3 million during the years ended December 31, 2025 and 2024, respectively, and no goodwill impairment charges during the year ended December 31, 2023. The Company recognized no impairment on indefinite-lived intangible assets during the years ended December 31, 2025, 2024, and 2023. See Note 4 to these financial statements for further details on goodwill and related impairment charges.
69
Asset Impairment
Long-lived assets, including property, equipment, internal-use software, and finite-lived intangible assets, are reviewed for impairment when events or changes in circumstances indicate that the carrying amount of an asset may not be recoverable. Should an impairment exist, the impairment loss would be measured as the amount the asset's carrying value exceeds its fair value. The Company recognized no impairment losses on long-lived assets, including property, equipment, internal-use software, and finite-lived intangible assets for the years ended December 31, 2025, 2024, and 2023.
Reserve for Veterinary Invoices
Reserve for veterinary invoices is an estimate of the future amount the Company will pay for veterinary claims that have been incurred but not yet paid as of the reporting date. The reserve also includes the Company's estimate of related internal processing costs. To determine the accrual, the Company makes assumptions based on its historical experience, including the number of veterinary invoices we expect to receive, the average cost of those veterinary invoices, the time elapsed between the date of loss and the date of payment, the member's chosen deductible, and the Company's expected cost to process and administer the payments. As of each balance sheet date, the Company reevaluates its reserve and adjusts the estimate for new information.
Deferred Revenue
Deferred revenue is primarily related to the Company’s other business segment where the Company generates revenue from underwriting policies through unaffiliated general agents. These policies are typically annual policies for which revenue is recognized pro-rata over the twelve-month policy period. Deferred revenue also consists of subscription payments received or billed in advance of the subscription services within the Company's subscription business.
Revenue Recognition
Revenue is recognized pro-rata over the term of the customer contracts. The Company generates revenue primarily from subscription payments and through underwriting policies for unaffiliated general agents. For the year ended December 31, 2025, premiums from policies sourced by general agents accounted for 30% of our total revenue, and one general agent sourced members whose premiums accounted for over 10% of our total revenue.
Veterinary Invoice Expense
Veterinary invoice expense includes the Company’s costs to review and pay veterinary invoices, administer the payments, and provide member services, and other operating expenses directly or indirectly related to this process. The Company also accrues for veterinary claims that have been incurred but not yet paid and the estimated cost of processing these invoices. Veterinary invoice expense also includes amounts paid by unaffiliated general agents on our behalf, and an estimate of amounts incurred and not yet paid for the other business segment.
Other Cost of Revenue
Other cost of revenue for the subscription business segment includes direct and indirect member service expenses, Territory Partner renewal commissions, credit card transaction fees and premium tax expenses. Other cost of revenue for the other business segment includes the commissions the Company pays to unaffiliated general agents and costs to administer the programs in the other business segment.
Technology and Development
Technology and development expenses primarily consist of personnel costs and related expenses for the Company's technology staff, which includes information technology development, security, infrastructure support, and third-party services. It also includes expenses associated with development in new geographies and new products and offerings..
General and Administrative
General and administrative expenses consist primarily of personnel costs and related expenses for the Company’s finance, actuarial, human resources, legal, regulatory, and general management functions, as well as facilities and professional services.
New Pet Acquisition Expense
New pet acquisition expenses primarily consist of costs to acquire a pet (including costs associated directly to supporting the first year of a member), personnel costs, costs to educate veterinarians and consumers about the benefits of Trupanion, costs to generate leads and to convert leads into enrolled pets, as well as print, online and promotional advertising costs.
70
Other (Income), Net
Other (income), net, totaled $21.9 million, $14.4 million, and $7.7 million, including interest income of $12.3 million, $12.4 million, and $9.0 million for the years ended December 31, 2025, 2024, and 2023. Refer to Note 6, Other Investments, for more information on amounts recorded to Other (income), net in relation to the Company's preferred stock investment in Baystride, Inc.
Advertising
Advertising costs are expensed as incurred. Advertising costs amounted to $23.8 million, $13.3 million and $16.9 million, in the years ended December 31, 2025, 2024 and 2023, respectively. The Company records advertising costs within New pet acquisition expense.
Stock-Based Compensation
Compensation expense related to stock-based transactions, including employee and non-employee restricted stock units, is measured and recognized in the financial statements based on fair value. The fair value of restricted stock units is the common stock price as of the measurement date.
Stock-based compensation expense for stock options and restricted stock units is recognized on a straight-line basis over the requisite service period, which is generally the vesting period of the respective award. The Company recognizes forfeitures when they occur.
Income Taxes
The Company uses the asset and liability approach for accounting and reporting income taxes. Deferred tax assets and liabilities are recognized for future tax consequences attributable to differences between the financial statement carrying amounts of existing assets and liabilities, and their respective tax bases, operating loss, and tax credit carryforwards.
Deferred tax assets and liabilities are measured using enacted tax rates expected to apply to taxable income in the years in which those temporary differences are expected to be recovered or settled. The effect of a tax rate change is recognized in the period that includes the enactment date. Valuation allowances are provided for when it is considered more likely than not that deferred tax assets will not be realized.
The Company recognizes the effect of income tax positions only if those positions are more likely than not of being sustained. Recognized income tax positions are measured at the largest amount that is greater than a 50% likelihood of being realized. Penalties and interest are classified as a component of income taxes.
Foreign Currency Translation
The Company’s consolidated financial statements are reported in U.S. dollars. Assets and liabilities denominated in foreign currencies were translated to U.S. dollars, the reporting currency, at the exchange rates in effect on the balance sheet date. Revenue and expenses denominated in foreign currencies were translated to U.S. dollars using a weighted average rate for the relevant reporting period. Cumulative translation adjustments of $0.7 million, $(3.1) million, and $(0.1) million were recorded in accumulated other comprehensive income (loss) as of December 31, 2025, 2024, and 2023, respectively.
Leases
The Company, at the inception of a contract, determines whether a contract is or contains a lease. The Company records right-of-use ("ROU") assets and lease obligations for its operating leases which are initially recognized based on the discounted future lease payments over the term of the lease. The Company records right-of-use assets within Other Long-Term Assets and lease obligations within Other Liabilities. If the rate implicit in the Company's leases is not readily determinable, the Company's applicable incremental borrowing rate is used in calculating the present value of the sum of the lease payments. Lease term is defined as the non-cancellable period of the lease plus any options to extend or terminate the lease when it is reasonably certain that the Company will exercise the option. The Company has elected not to recognize ROU asset and lease obligations for its short-term leases, which are defined as leases with an initial term of 12 months or less.
Acquisition of Intellectual Property
The Company’s intellectual property acquisition was determined to be an asset acquisition in accordance with ASC 805-50, Business Combinations. To conclude if a transaction is an asset acquisition, the Company considers if substantially all of the fair value of the gross assets acquired are concentrated in a single identifiable asset or group of similar identifiable assets. The Company then considers if the acquired set of assets consist of inputs and processes that contribute to the creation of outputs.
71
The acquired assets are recognized based on their cost to the Company, which includes related transaction costs. The Company allocates the purchase price based on relative fair value of the assets acquired. Refer to Note 6 for further discussion on the Company's acquisition of intellectual property.
Nonmonetary Exchange
The Company accounts for nonmonetary exchanges at fair value. If the transaction lacks commercial substance or fair value is not determinable, the asset received is recorded at the carrying amount of the asset surrendered. The Company evaluates each transaction individually to determine the appropriate accounting treatment.
Accumulated Other Comprehensive Income Reclassifications
The Company’s available-for-sale securities are reported at fair value with unrealized gains and losses included in accumulated other comprehensive income (loss). Upon realization, through sale or maturity, realized gains and losses are reclassified out of accumulated other comprehensive income (loss) on a specific identification basis. The Company has made a policy election to report the reclassification of accumulated other comprehensive income (loss), net from the beginning to the end of the period within our Statement of Comprehensive Income (Loss) and Note 14, Accumulated Comprehensive Income (Loss)
Insurance Operations
Effective January 1, 2015, the Company formed a segregated account in Bermuda as part of Wyndham Insurance Company (SAC) Limited (WICL) and entered into a revised fronting and reinsurance arrangement with Accelerant Insurance Company of Canada, formerly known as Omega General Insurance Company, to include its newly formed segregated account. The Company maintains all risk with the business written in Canada and consolidates the entity in its financial statements. Dividends are allowed subject to the Segregated Accounts Company Act of 2000, which allows for dividends only to the extent that the entity remains solvent and the value of its assets remain greater than the aggregate of its liabilities and its issued share capital and share premium accounts.
A portion of the Company's business in Canada is written by Accelerant and the risk is assumed by the Company through a fronting and reinsurance agreement. Premiums are recognized and earned pro rata over the terms of the related customer contracts. Revenue recognized under this agreement in 2025, 2024, and 2023 was $127.2 million, $206.7 million and $167.6 million, respectively, and deferred revenue relating to this arrangement at December 31, 2025 and 2024 was $1.3 million and $11.3 million, respectively. Reinsurance revenue was 9%, 16%, and 15% of total revenue in 2025, 2024, and 2023, respectively. Cash designated for the purpose of paying claims related to this reinsurance agreement was $5.9 million and $7.2 million at December 31, 2025 and 2024, respectively. In addition, as required by the Canadian Office of the Superintendent of Financial Institutions regulations related to the Company’s reinsurance agreement with Accelerant, the Company is required to fund a Canadian Trust account with the greater of CAD $2.0 million or 120% of unearned Canadian premium plus 20% of outstanding Canadian claims, including all incurred but not reported claims. As of December 31, 2025, the account balance was CAD $8.7 million and the Company was in compliance with all requirements.
During 2025, the Company began directly underwriting a material portion of its Canadian business through its wholly-owned insurance subsidiary, GPIC. The Company has not transferred any risk to third-party reinsurers.
Concentrations of Credit Risk
Financial instruments, which potentially subject the Company to concentration of credit risk, consist primarily of cash and cash equivalents, investments, and debt. The Company manages its risk by investing cash equivalents and investment securities in money market instruments and securities of the U.S. government, U.S. government agencies and high-credit-quality issuers of debt securities.
Recent Accounting Pronouncements
In December 2023, the Financial Accounting Standards Board ("FASB") issued ASU 2023-09, which improves and expands upon annual income tax disclosures, primarily relating to rate reconciliation and income taxes paid information. The Company adopted ASU 2023-09 for the fiscal year ended December 31, 2025. Refer to the Company's updated annual income tax disclosures in Note 17, Income Taxes.
In November 2024, the FASB issued ASU 2024-03, which requires public business entities to disclose additional information about specific expense categories in the notes to the financial statements at interim and annual reporting periods. The ASU is effective for annual periods beginning after December 15, 2026, and interim periods beginning after December 15, 2027, with early adoption permitted. The Company is evaluating the impact of this ASU on its consolidated financial statements.
72
In September 2025, the FASB issued ASU 2025-06, which modernizes the accounting for software costs that are accounted for under Subtopic 350-40, Intangibles-Goodwill and Other-Internal-Use Software. The ASU is effective for annual periods beginning after December 15, 2027, and interim reporting periods within those annual reporting periods. The Company is currently evaluating the impact of adopting ASU 2025-06.
2. Net Income (Loss) per Share
Basic net income (loss) per share is computed using the weighted average number of shares of common stock outstanding during the period. Diluted net income (loss) per share is calculated using the weighted average number of shares of common stock plus, when dilutive, potential shares of common stock outstanding using the treasury-stock method. Potential shares of common stock outstanding include stock options, and unvested restricted stock units.
The components of basic and diluted earnings per share were as follows (in thousands, except share and per share information):
As of December 31,
2025
2024
2023
Basic earnings per share:
Net income (loss)
$
19,433
$
(9,633)
$
(44,693)
Shares used in computation:
Weighted average shares of common stock outstanding
42,958,654
42,158,773
41,436,882
Basic earnings per share
$
0.45
$
(0.23)
$
(1.08)
Diluted earnings per share:
Net income (loss)
$
19,433
$
(9,633)
$
(44,693)
Shares used in computation:
Weighted average shares of common stock outstanding
42,958,654
42,158,773
41,436,882
Stock options
233,377
—
—
Restricted stock units
363,853
—
—
Weighted average number of shares
43,555,884
42,158,773
41,436,882
Diluted earnings per share
$
0.45
$
(0.23)
$
(1.08)
The following potentially dilutive equity securities were not included in the diluted earnings per share of common stock calculation because they would have had an antidilutive effect:
Year Ended December 31,
2025
2024
2023
Stock options
—
347,334
408,970
Restricted stock units
1,129,314
970,739
714,382
3. Property, Equipment, and Internal-Use Software, Net
Property, equipment, and internal-use software, net consisted of the following (in thousands):
December 31,
2025
2024
Land and improvements
$
15,911
$
15,911
Building and improvements
49,402
49,359
Software
83,672
64,368
Office equipment and other
5,038
6,123
Construction in progress
9,764
16,070
Property, equipment, and internal-use software, at cost
163,787
151,831
Less: Accumulated depreciation
(58,943)
(49,640)
Property, equipment, and internal-use software, net
$
104,844
$
102,191
73
Depreciation expense related to property, equipment, and internal-use software was $11.2 million, $11.2 million and $6.7 million for the years ended December 31, 2025, 2024 and 2023, respectively.
4. Goodwill and Intangible Assets
Goodwill arises from business acquisitions in which the purchase price exceeds the fair value of tangible and intangible assets acquired less assumed liabilities. The carrying values of goodwill and other intangible assets with indefinite lives are reviewed at least annually for possible impairment. The Company may first assess qualitative factors in order to determine if goodwill and indefinite-lived intangible assets are impaired. If through qualitative assessment it is determined that it is more likely than not that goodwill or indefinite-lived assets are not impaired, no further testing is required. If it is determined more likely than not that goodwill or indefinite-lived assets are impaired, the Company’s impairment testing continues with the estimation of reporting unit fair value using a combination of a market approach and an income (discounted cash flow) approach, at the reporting unit level. Estimates of fair value are based on the best information available to the Company as of the assessment date.
As of December 31, 2025, all of the Company's goodwill has been assigned to two reporting units within our Subscription Business operating segment: Trupanion Core - North America and PetExpert.
The following is a summary of goodwill by reportable segment for the years ended December 31, 2025 and 2024 (in thousands):
Subscription Business
Balance as of January 1, 2024
$
43,713
Impairment charges
(5,229)
Effects of foreign currency
(1,513)
Balance as of December 31, 2024
36,971
Impairment charges
(1,129)
Effects of foreign currency
3,540
Balance as of December 31, 2025
$
39,382
As of December 31, 2025 and 2024, goodwill consisted of the following (in thousands):
December 31,
2025
2024
Goodwill, gross
$
45,740
$
42,200
Accumulated impairment losses
(6,358)
(5,229)
Goodwill, net
$
39,382
$
36,971
In the fourth quarter of 2025, the Company performed its annual goodwill impairment test for both reporting units with assigned goodwill and recognized impairment charges of $1.1 million on the goodwill of PetExpert, based on the fair value assessments performed after circumstances indicated that the goodwill of this reporting unit more likely than not had become impaired. These circumstances primarily related to the Company’s decision to slow expansion efforts as the Company focuses capital allocation on reporting units operating within the Company's stated financial guardrails.
In the fourth quarter of 2024, the Company performed its annual goodwill impairment test for all three reporting units with assigned goodwill and recognized impairment charges of $2.7 million and $2.5 million on the goodwill of Smart Paws and PetExpert, respectively, based on the fair value assessments performed after circumstances indicated that the goodwill of these reporting units more likely than not had become impaired. These circumstances primarily related to the Company’s decision to slow expansion efforts as the Company focuses capital allocation on reporting units operating within the Company's stated financial guardrails.
Following the impairment charges taken in 2024 and 2025, no goodwill remains for Smart Paws and $6.8 million of goodwill remains for PetExpert, which could be further impaired in the future if this reporting unit fails to meet its revised financial projections.
The Company determined that the Trupanion Core – North America reporting unit was not at risk of goodwill impairment as of December 31, 2025 and 2024.
The following table presents the detail of intangible assets other than goodwill for the periods presented (in thousands):
74
Gross Carrying Value
Accumulated Amortization
Net Carrying Value
Weighted Average Remaining Useful Life as of December 31, 2025(1)
December 31, 2025
Licenses
$
4,773
$
—
$
4,773
N/A
Trade name
1,369
(732)
637
4.8
Developed technologies
17,781
(15,515)
2,266
0.6
Customer relationships
8,874
(8,417)
457
0.3
Patents, trademarks, and other
17,459
(1,490)
15,969
2.6
Total Intangibles
$
50,256
$
(26,154)
$
24,102
0.8
December 31, 2024
Licenses
$
4,773
$
—
$
4,773
Trade name
1,271
(531)
740
Developed technologies
16,835
(12,106)
4,729
Customer relationships
8,180
(6,394)
1,786
Patents, trademarks, and other
2,556
(1,407)
1,149
Total Intangibles
$
33,615
$
(20,438)
$
13,177
(1) Does not include intangible assets not yet placed in service.
The Company acquired an insurance company in 2007, which originally included licenses in 23 states. These licenses were valued at $4.8 million. The Company is currently licensed in all 50 states, the District of Columbia and Puerto Rico. Insurance licenses are renewed annually upon payment of various fees assessed by the issuing state. Renewal costs are expensed as incurred. Insurance licenses are considered an indefinite-lived intangible asset given the planned renewal of the certificates of authority and applicable licenses for the foreseeable future.
Additionally, as detailed in Note 6, Other Investments, during 2025 the Company acquired intellectual property developed by Baystride, Inc., valued at $14.8 million on the acquisition date. This cost will be amortized over the intellectual property's estimated useful lives of 20 years once the patent is approved.
Amortization expense associated with intangible assets was $4.6 million, $5.3 million, and $5.7 million for the years ended December 31, 2025, 2024, and 2023, respectively.
As of December 31, 2025, expected amortization expense relating to definite-lived intangible assets for each of the next five years and thereafter is as follows (in thousands):
Year ending December 31(1):
Amortization Expense
2026
$
1,590
2027
1,477
2028
172
2029
172
2030
149
Thereafter
136
Total
$
3,696
(1) Does not include intangible assets not yet placed in service.
5. Investments
Available-for sale securities are classified as short-term versus long-term investments based on whether they represent the investment of funds available for current operations. Currently, all available-for-sale securities are considered short-term in nature. Held-to-maturity securities are classified as short-term versus long-term investments based on their maturity dates. The amortized cost, gross unrealized holding gains and losses, and estimated fair value of long-term and short-term investments by major security type and class of security were as follows as of December 31, 2025 and 2024 (in thousands):
75
Amortized Cost
Gross Unrealized Holding Gains
Gross Unrealized Holding Losses
Fair Value
As of December 31, 2025
Long-term investments:
Held-to-maturity investments
U.S. treasury securities
$
983
$
5
$
—
$
988
$
983
$
5
$
—
$
988
Short-term investments:
Available-for-sale investments
U.S. treasury securities
$
103,643
$
523
$
(8)
$
104,158
Mortgage-backed securities and collateralized mortgage obligations
24,501
201
(15)
24,687
Other asset-backed securities
23,685
152
—
23,837
Corporate bonds
47,311
527
(3)
47,835
$
199,140
$
1,403
$
(26)
$
200,517
Held-to-maturity investments
U.S. treasury securities
$
9,757
$
10
$
—
$
9,767
Foreign Treasury Securities
18,263
—
—
18,263
Certificates of deposit
4,169
—
—
4,169
$
32,189
$
10
$
—
$
32,199
Amortized Cost
Gross Unrealized Holding Gains
Gross Unrealized Holding Losses
Fair Value
As of December 31, 2024
Long-term investments:
Held-to-maturity investments
U.S. treasury securities
$
373
$
—
$
(1)
$
372
$
373
$
—
$
(1)
$
372
Short-term investments:
Available-for-sale investments
U.S. treasury securities
$
70,175
$
318
$
(202)
$
70,291
Mortgage-backed securities and collateralized mortgage obligations
12,576
80
(60)
12,596
Other asset-backed securities
15,830
134
(8)
15,956
Corporate bonds
35,382
284
(43)
35,623
$
133,963
$
816
$
(313)
$
134,466
Held-to-maturity investments
U.S. treasury securities
$
10,591
$
16
$
(1)
$
10,606
Certificates of deposit
2,032
—
—
2,032
$
12,623
$
16
$
(1)
$
12,638
76
Future maturities of investments classified as available-for-sale and held-to-maturity are as follows (in thousands):
December 31, 2025
Amortized Cost
Fair Value
Available-for-sale:
Due under one year
$
5
$
5
Due after one year through five years
150,949
151,988
Due after five years through ten years
—
—
Due after ten years
—
—
$
150,954
$
151,993
Available-for-sale collateralized:
Due under one year
$
7,165
$
7,200
Due after one year through five years
31,925
32,162
Due after five years through ten years
8,868
8,925
Due after ten years
228
237
$
48,186
$
48,524
Held-to-maturity:
Due under one year
$
32,189
$
32,199
Due after one year through five years
983
988
$
33,172
$
33,187
The following tables present the gross unrealized losses and related fair values for the Company's investment in available-for-sale securities, grouped by duration of time in a continuous unrealized loss position as of December 31, 2025 and December 31, 2024 (in thousands):
Less than 12 Months
12 Months or More
Total
Fair Value
Gross Unrealized Losses
Fair Value
Gross Unrealized Losses
Fair Value
Gross Unrealized Losses
December 31, 2025
U.S. treasury securities
$
5,139
$
(8)
$
—
$
—
$
5,139
$
(8)
Mortgage-backed securities and collateralized mortgage obligations
2,893
(3)
967
(12)
3,860
(15)
Other asset-backed securities
—
—
—
—
—
—
Corporate bonds
2,700
(3)
—
—
2,700
(3)
Total
$
10,732
$
(14)
$
967
$
(12)
$
11,699
$
(26)
77
Less than 12 Months
12 Months or More
Total
Fair Value
Gross Unrealized Losses
Fair Value
Gross Unrealized Losses
Fair Value
Gross Unrealized Losses
December 31, 2024
U.S. treasury securities
$
27,769
$
(202)
$
—
$
—
$
27,769
$
(202)
Mortgage-backed securities and collateralized mortgage obligations
1,538
(20)
1,359
(40)
2,897
(60)
Other asset-backed securities
186
(1)
1,737
(7)
1,923
(8)
Corporate bonds
6,461
(40)
736
(3)
7,197
(43)
Total
$
35,954
$
(263)
$
3,832
$
(50)
$
39,786
$
(313)
As of December 31, 2025, 14 of the securities held were in an unrealized loss position. Unrealized losses on available-for-sale investments relate to interest rate changes. The Company does not expect material credit losses from its available-for-sale investments, considering the composition of the investment portfolio and the credit rating of these investments. The Company determined it is not likely to, and does not intend to, sell securities currently in a loss position prior to a potential recovery of their cost basis. The Company does not expect material credit losses from its held-to-maturity investments, considering the composition of the investment portfolio and the credit loss history of these investments.
Proceeds from the sales of fixed maturity investments classified as available-for-sale were $141.7 million and $77.1 million during the years ended December 31, 2025 and 2024, respectively.
6. Other Investments
Preferred Stock Investment and Nonmonetary Exchange
The Company invested $7.0 million in the preferred stock of a variable interest entity, Baystride, Inc. ("Baystride"), a U.S.-based privately held corporation operating in the pet food industry. The Company did not have power over the activities that most significantly impact the economic performance of the entity and was, therefore, not the primary beneficiary. The preferred stock investment in the entity was redeemable and, therefore, was accounted for as an available-for-sale debt security and measured at fair value at each balance sheet date — see Note 7.
On June 3, 2025, the Company entered into a purchase agreement for intellectual property developed by Baystride. In exchange for this intellectual property, the Company transferred all of its Baystride preferred stock back to Baystride. The Company concluded that the transaction met the definition of a nonmonetary exchange and an asset acquisition.
The Company determined that the cost to acquire the intellectual property was $14.9 million, which was comprised of the fair value of the Baystride preferred stock relinquished of $14.8 million and direct transaction costs of $0.1 million. The acquired intellectual property has been recorded as a patent within Intangible assets, net on the Company's consolidated balance sheet and will be amortized over a 20-year useful life. The nonmonetary exchange resulted in a gain of $7.8 million, calculated as the difference between the Company's initial $7.0 million investment in Baystride's preferred stock and its $14.8 million fair value on the transaction date. This gain was recorded to Other (income), net within the Company's consolidated statement of operations.
Additionally, the Company had extended a $7.0 million revolving line of credit to Baystride to fund its inventory purchases. Borrowing amounts were subject to limitations based on Baystride’s forecasted revenues and inventory balances. The Company's investment and amounts loaned under the line of credit were recorded in other long-term assets on its consolidated balance sheet. The outstanding loan balance under the line of credit, including accrued interest, was paid in full and extinguished in July 2025 and was $1.6 million as of December 31, 2024.
Allowance for Credit Losses
78
The Company regularly evaluates its investments for expected credit losses. The Company considers past events, current conditions, and reasonable and supportable forecasts in estimating an allowance for credit losses. Additionally, the Company considers the ultimate collection of cash flows from its investments and whether the Company has the intent to sell, or if it is more likely than not the Company would be required to sell the security prior to recovery of its amortized cost. Such evaluations are revised as conditions change and new information becomes available. Based on these considerations, the Company established an allowance for credit losses of $1.7 million in the fourth quarter of 2023 related to its investment in the Baystride preferred stock. The credit loss allowance was reversed in the fourth quarter of 2024 as the fair value of the Company's investment in Baystride was determined to have recovered to an amount above the original investment amount. There was no change to the allowance for credit losses in 2025 prior to the exchange of the investment for intellectual property.
Investment in Joint Venture
In September 2018, the Company acquired a non-controlling equity interest in a joint venture in Australia, whereby it had committed to licensing certain intellectual property and contributing up to $2.2 million AUD upon the achievement of specific operational milestones over a period of at least four years from the agreement execution date. As of December 31, 2024, the Company had contributed $1.5 million AUD. This equity investment was accounted for using the equity method and was classified in other long-term assets on the Company's consolidated balance sheet. The Company's share of income and losses from this equity method investment were included in gain (loss) from investment in joint venture on its consolidated statement of operations. Also included in this line item were income and expenses associated with administrative services provided to the joint venture. In March 2025, the Company restructured this relationship from a joint venture to a brand licenses and services agreement.
79
7. Fair Value
Fair Value Disclosures
The following table summarizes, by major security type, the Company's assets that are measured at fair value on a recurring basis, and placement within the fair value hierarchy (in thousands):
As of December 31, 2025
Fair Value
Level 1
Level 2
Level 3
Assets
Money market funds
$
46,818
$
46,818
$
—
$
—
Fixed maturities:
Mortgage-backed securities and collateralized mortgage obligations
24,687
—
24,687
—
Other asset-backed securities
23,837
—
23,837
—
Corporate bonds
47,835
—
47,835
—
U.S. Treasury securities
104,158
—
104,158
—
Total
$
247,335
$
46,818
$
200,517
$
—
As of December 31, 2024
Fair Value
Level 1
Level 2
Level 3
Assets
Money market funds
$
91,534
$
91,534
$
—
$
—
Fixed maturities:
Mortgage-backed securities and collateralized mortgage obligations
12,596
—
12,596
—
Other asset-backed securities
15,956
—
15,956
—
Corporate bonds
35,623
—
35,623
—
U.S. Treasury securities
70,291
—
70,291
—
Preferred stock investment
7,916
—
—
7,916
Total
$
233,916
$
91,534
$
134,466
$
7,916
The Company measures the fair value of money market funds, classified as Level 1, based on quoted prices in active markets for identical assets. The fair values of the Company's fixed maturity investments classified as Level 2 are based on either recent trades in inactive markets or quoted market prices of similar instruments and other significant inputs derived from or corroborated by observable market data. Held-to-maturity investments are carried at amortized cost and the fair value and changes in unrealized gains and losses are disclosed in Note 5, Investments. The fair value of these investments is determined in the same manner as available-for-sale securities and are considered either a Level 1 or Level 2 measurement.
The Company recognizes transfers between levels of the fair value hierarchy on the date of the event or change in circumstances that caused the transfer. There were no transfers between levels for the years ended December 31, 2025 and 2024.
The Company's preferred stock investment (see Note 6) was accounted for as an available-for-sale debt security, and measured at fair value at each balance sheet date and as of the transaction date. The estimated fair value of the preferred stock investment was a Level 3 measurement derived by discounted cash flow and market valuation techniques which utilized certain unobservable inputs such as the value of the underlying enterprise, volatility, time to liquidity and market interest rates. Significant changes in any of these unobservable inputs would result in a change in the fair value measurement.
80
The following table presents the change in fair value of the Company’s preferred stock investment previously carried at fair value and classified as Level 3 (in thousands):
December 31,
2025
2024
Balance at beginning of period
$
7,916
$
5,326
Unrealized gain included in other comprehensive income (loss)
—
916
Reversal of cumulative unrealized gain included in other comprehensive income (loss)
(916)
—
Recovery of credit loss included in earnings
—
1,674
Realized gain on nonmonetary exchange of preferred stock investment in Other (income), net
7,783
—
Exchange of preferred stock for intellectual property
(14,783)
—
Balance at end of period
$
—
$
7,916
Fair Value Disclosures - Other Assets and Liabilities
The Company's other long-term assets balance also included notes receivable of $2.5 million and $4.3 million as of December 31, 2025 and 2024, respectively, recorded at their estimated collectible amount. The Company estimates that the carrying value of the notes receivable approximates the fair value. The estimated fair value represents a Level 3 measurement within the fair value hierarchy and is based on market interest rates and the assessed creditworthiness of the third party.
The Company estimates the fair value of long-term debt based upon rates currently available to the Company for debt with similar terms and remaining maturities. This is a Level 3 measurement. Based upon the terms of the debt, the carrying amount of long-term debt approximated fair value at December 31, 2025.
8. Commitments and Contingencies
Legal Proceedings
From time to time the Company is or may become subject to various legal proceedings arising in the ordinary course of business, including proceedings involving members, other entities or regulatory bodies. Estimated liabilities are recorded when it is both probable that a liability has been incurred and the amount of the loss can be reasonably estimated. At this time, the Company does not believe any such matters to be material individually or in the aggregate. These views are subject to change following the outcome of future events or the results of future developments.
9. Reserve for Veterinary Invoices
The reserve for veterinary invoices is an estimate of the future amount the Company will pay for insurance claims that have not been paid prior to the reporting date. The reserve also includes the Company's estimate of related internal processing costs. The reserve estimate involves actuarial projections and is based on management's assessment of facts and circumstances currently known, and assumptions about anticipated claims development patterns. The Company uses generally accepted actuarial methodologies, such as paid loss development methods, in estimating the amount of the reserve for veterinary invoices. The reserve is made for each of the Company's segments, subscription and other business, and is continually refined as the Company receives and pays veterinary invoices. Changes in management's assumptions and estimates may have a relatively large impact on the reserve and associated expense.
Reserve for veterinary invoices
Summarized below are the changes in the total liability for the Company's subscription business segment (in thousands):
81
Year Ended December 31,
Subscription
2025
2024
2023
Reserve at beginning of year
$
23,084
$
31,548
$
21,543
Veterinary invoices during the period related to:
Current year
696,897
623,928
540,396
Prior years
3,257
500
2,800
Total veterinary invoice expense
700,154
624,428
543,196
Amounts paid during the period related to:
Current year
668,897
598,593
506,294
Prior years
25,050
30,875
23,001
Total paid
693,947
629,468
529,295
Non-cash expenses
2,927
3,424
3,896
Reserve at end of period
$
26,364
$
23,084
$
31,548
The Company had unfavorable development on veterinary invoice reserves of $3.3 million for the year ended December 31, 2025, including unfavorable development of $1.1 million attributable to accident year 2024 and unfavorable development of $2.2 million attributable to accident year 2023 and prior. The unfavorable development for accident years 2024 and 2023 was primarily driven by higher than expected frequency of claims. Non-cash expenses are primarily comprised of stock-based compensation for employees performing claims processing related duties.
Summarized below are the changes in total liability for the Company's other business segment (in thousands):
Year Ended December 31,
Other Business
2025
2024
2023
Reserve at beginning of year
$
28,551
$
31,690
$
22,191
Veterinary invoices during the period related to:
Current year
334,572
326,018
287,361
Prior years
(5,751)
(1,298)
498
Total veterinary invoice expense
328,821
324,720
287,859
Amounts paid during the period related to:
Current year
306,221
298,596
256,616
Prior years
21,594
29,263
21,744
Total paid
327,815
327,859
278,360
Reserve at end of period
$
29,557
$
28,551
$
31,690
The Company had favorable development on veterinary invoice reserves for the other business segment of $5.8 million for the year ended December 31, 2025, including favorable development on veterinary invoice reserves of $5.6 million attributable to accident year 2024 and favorable development of $0.2 million attributable to accident year 2023 and prior. The favorable development for accident year 2024 was driven by lower than expected frequency and to a lesser extent, lower than expected severity in the fourth quarter of 2024.
Reserve for veterinary invoices, by year of occurrence
In the following tables, the cumulative veterinary invoice expenses represent the total expense from received invoices as of December 31, 2025, by year the veterinary invoice relates to, referred to as the year of occurrence. Information for years 2022 through 2024 is provided as required supplementary information. Amounts in these tables are presented on a constant currency basis to remove the impact of changes in the foreign currency exchange rate on development. The cumulative expenses as of the end of each year are revalued using the currency exchange rate as of December 31, 2025. Due to variability in internal and external sources of claims data, and the lack of comparability of claim count information between those sources, it is impractical for the Company to disclose claim frequency information. As such, the cumulative number of veterinary invoices received is not included in the disclosures below.
82
The following table summarizes the development of veterinary invoice expense, on a constant currency basis, for the Company's subscription business segment by year of occurrence (in thousands, except for cumulative number of veterinary invoices data):
Cumulative veterinary invoice expenses
Reserve
As of December 31,
As of December 31,
Subscription
2022
2023
2024
2025
2025
Year of Occurrence
(unaudited)
(unaudited)
(unaudited)
2022
$
435,185
$
436,489
$
436,924
$
437,682
$
—
2023
$
538,622
$
537,497
$
538,090
$
—
2024
$
623,658
$
624,627
$
1,291
2025
$
699,554
$
25,073
$
2,299,953
$
26,364
The following table summarizes the development of veterinary invoice expense, on a constant currency basis, for the Company's other business segment by year of occurrence (in thousands, except for cumulative number of veterinary invoices data):
Cumulative veterinary invoice expenses
Reserve
As of December 31,
As of December 31,
Other Business
2022
2023
2024
2025
2025
Year of Occurrence
(unaudited)
(unaudited)
(unaudited)
2022
$
211,717
$
212,156
$
211,777
$
211,959
$
16
2023
$
287,356
$
286,253
$
285,798
$
49
2024
$
326,018
$
320,461
$
1,141
2025
$
334,579
$
28,351
$
1,152,797
$
29,557
Cumulative paid veterinary invoice expense
In the following tables, amounts are by the year the veterinary invoice relates to, referred to as the year of occurrence. Amounts in these tables are presented on a constant currency basis to remove the impact of changes in the foreign currency exchange rate. The cumulative amounts paid as of the end of each year are revalued using the currency exchange rate as of December 31, 2025. Information for years 2022 through 2024 is provided as required supplementary information.
The following table summarizes the amounts paid for veterinary invoices, inclusive of related internal processing costs and reported on a constant currency basis, for the subscription segment (in thousands):
Year Ended December 31,
Subscription
2022
2023
2024
2025
Year of Occurrence
(unaudited)
(unaudited)
(unaudited)
2022
$
414,550
$
435,156
$
436,924
$
437,682
2023
$
508,540
$
536,318
$
538,090
2024
$
601,611
$
623,336
2025
$
674,481
$
2,273,589
Total amounts unpaid and recorded as a liability
$
26,364
83
The following table summarizes the amounts paid for veterinary invoices, inclusive of related internal processing costs and reported on a constant currency basis, for the other business segment (in thousands):
Year Ended December 31,
Other Business
2022
2023
2024
2025
Year of Occurrence
(unaudited)
(unaudited)
(unaudited)
2022
$
190,019
$
211,211
$
211,761
$
211,943
2023
$
256,611
$
285,140
$
285,749
2024
$
298,596
$
319,320
2025
$
306,228
$
1,123,240
Total amounts unpaid and recorded as a liability
$
29,557
10. Leases
The Company leases certain office space and buildings from third parties and recognizes lease expense on a straight-line basis over the lease term. During the year ended December 31, 2025, we entered into a lease for a building to use as a manufacturing facility for our pet food initiative. The tables below present information regarding the Company's lease assets and liabilities (in thousands):
As of December 31,
2025
2024
Assets
Operating lease right-of-use assets
$
14,688
$
362
Total lease assets
14,688
362
Liabilities
Current
Operating lease liabilities
767
—
Long-term
Operating lease liabilities
13,397
362
Total lease liabilities
$
14,164
$
362
The Company's lease costs recognized in the Consolidated Statements of Operations consist of the following (in thousands):
Year ended December 31,
2025
2024
2023
Operating lease cost
$
454
$
87
$
151
Total lease costs
$
454
$
87
$
151
84
Other lease information is as follows:
Year ended December 31,
2025
2024
Weighted-average remaining lease term - operating leases
9.9
8.5
Weighted-average discount rate - operating leases
7.66
%
10.38
%
The following table summarizes the Company's future minimum lease payments during the next five fiscal years and thereafter (in thousands):
Year Ending December 31,
Operating Leases
2026
$
919
2027
1,212
2028
1,220
2029
1,453
2030
2,700
Thereafter
14,449
Total undiscounted lease obligations
$
21,953
Imputed interest
7,789
Net lease obligations
$
14,164
11. Debt
Prior Credit Facility
On March 25, 2022, the Company entered into a credit agreement with Piper Sandler Finance, LLC, acting as the administrative agent, that provided the Company with $150.0 million in credit (the "Prior Credit Facility"). The Prior Credit Facility obligated the Company to repay 0.25% of any then-outstanding Term Loans, together with accrued and unpaid interest, on a quarterly basis.
In June 2025, the Company made a $14.9 million principal repayment on the Initial Term Loan in addition to the 0.25% quarterly mandatory repayment. In November 2025, the Company repaid the Prior Credit Facility in full utilizing proceeds from its new Credit Facility.
In connection with repayment of the Prior Credit Facility, the Company recognized a loss of $1.6 million, recorded within Interest expense, which reflected the portion of debt issuance cost that was unamortized at the time of extinguishment.
PNC Facility
On November 4, 2025, the Company entered into a credit agreement with PNC Bank, National Association acting as the administrative agent, that provides the Company with $120.0 million in credit (the "PNC Facility") consisting of:
(a) an initial term loan in an aggregate principal amount of $100.0 million ("PNC Initial Term Loan"), which was funded at closing;
(b) commitments for revolving loans in an aggregate principal amount at any time outstanding not in excess of $20.0 million (PNC Revolving Loans), of which $15.0 million was drawn and the rest may be drawn at any time prior to maturity.
The PNC Facility is secured by substantially all assets of the Company and its subsidiaries. Proceeds from the PNC Facility were utilized to pay off the Prior Credit Facility. The credit agreement with PNC Bank contains financial and other covenants. As of December 31, 2025, the Company was in compliance with all financial and other covenants.
To the extent not previously paid, the PNC Facility is due and payable on November 4, 2028. The Company will make quarterly principal payments of $2.5 million on the PNC Initial Term Facility. The Company may voluntarily prepay loans or reduce revolving commitments under the PNC Facility at any time without premium or penalty.
Loans under the PNC Facility bear interest at a reference rate plus an applicable margin, which will generally be the SOFR reference rate plus 2.75% per annum. The stated interest rate as of December 31, 2025 was approximately 6.42% for the aggregate outstanding term loans. The Company incurred total debt issuance cost of approximately $0.8 million, which is reported in the consolidated balance sheet as a direct reduction from the carrying amount of the PNC Facility, and is amortized as interest expense over the term of three years.
85
Future principal payments on outstanding borrowings as of December 31, 2025 are as follows (in thousands):
Year Ending December 31,
December 31, 2025
2026
$
10,000
2027
10,000
2028
92,500
Total
$
112,500
12. Stock-Based Compensation
Stock-based compensation expense includes restricted stock units granted to employees and other service providers and has been reported in the Company’s Consolidated Statements of Operations depending on the function performed by the employee or other service provider. Stock-based compensation expense recognized in each category of the Consolidated Statements of Operations for the years ended December 31, 2025, 2024 and 2023 was as follows (in thousands):
Year Ended December 31,
2025
2024
2023
Veterinary invoice expense
$
2,841
$
3,460
$
3,667
Other cost of revenue
2,284
2,063
1,612
Technology and development
6,036
4,934
2,846
General and administrative
19,571
15,696
17,717
New pet acquisition expense
7,580
7,279
7,319
Total expensed stock-based compensation
38,312
33,432
33,161
Capitalized stock-based compensation
229
505
2,135
Total stock-based compensation
$
38,541
$
33,937
$
35,296
Stock Options
The grant date fair value of stock option awards are estimated on the date of grant using the Black-Scholes option-pricing model. The Company did not grant any new stock options during the years ended December 31, 2025, 2024, and 2023.
86
The following table presents information regarding stock options granted, exercised and forfeited for the periods presented:
Number of Options
Weighted Average Exercise Price per Share
Aggregate Intrinsic Value (in thousands)
Outstanding as of January 1, 2023
629,650
$
13.53
$
21,410
Granted
—
—
—
Exercised
(213,848)
12.47
3,720
Forfeited
(6,832)
12.80
—
Outstanding as of December 31, 2023
408,970
14.09
6,715
Granted
—
—
—
Exercised
(61,136)
12.91
1,590
Forfeited
(500)
14.93
—
Outstanding as of December 31, 2024
347,334
14.30
11,775
Granted
—
—
—
Exercised
(142,572)
11.90
3,620
Forfeited
(7,530)
9.82
—
Outstanding as of December 31, 2025
197,232
16.20
4,175
Exercisable at December 31, 2025
197,232
$
16.20
$
4,175
As of December 31, 2025, stock options outstanding and stock options exercisable had a weighted average remaining contractual life of 1.1 years.
The Company has not granted any new stock options since 2017 and all outstanding options vested prior to January 1, 2022. The Company issues authorized shares upon the exercise of stock options.
87
Restricted Stock Units
The following table presents information regarding restricted stock units granted, vested, and forfeited for the years ended December 31, 2025, 2024 and 2023 is as follows:
Number of Shares
Weighted Average Grant Date Fair Value per Share
Unvested shares as of January 1, 2023
1,112,552
$
84.46
Granted
366,870
26.77
Vested
(669,413)
72.52
Forfeited
(95,627)
79.60
Unvested shares as of December 31, 2023
714,382
66.64
Granted
957,168
29.21
Vested
(629,217)
57.46
Forfeited
(71,594)
44.00
Unvested shares as of December 31, 2024
970,739
37.35
Granted
1,043,549
45.37
Vested
(864,810)
43.78
Forfeited
(134,704)
35.83
Unvested shares as of December 31, 2025
1,014,774
$
40.32
As of December 31, 2025, the Company had 1,014,774 unvested restricted stock units. Stock-based compensation expenses of $37.8 million related to unvested restricted stock units are expected to be recognized over a weighted average period of approximately 1.9 years.
In March 2023, two executives terminated employment with the Company and one executive signed a separation agreement effective June 1, 2023. In conjunction with these departures, the Company accelerated the vesting of certain RSUs as of the termination date and extended the purchase date of certain vested options from 90 to 365 days. These award modifications resulted in the recognition of $4.8 million share-based compensation expense during the year ended December 31, 2023.
13. Stockholders’ Equity
Common Stock and Preferred Stock
As of December 31, 2025, the Company had 100,000,000 shares of common stock authorized and 43,402,081 shares of common stock outstanding. Holders of common stock are entitled to one vote on each matter properly submitted to the stockholders of the Company except those related to matters concerning possible outstanding preferred stock. At December 31, 2025, the Company had 10,000,000 shares of undesignated preferred stock authorized for future issuance and did not have any outstanding shares of preferred stock. The holders of common stock are also entitled to receive dividends as and when declared by the board of directors of the Company (the Board), whenever funds are legally available. These rights are subordinate to the dividend rights of holders of any senior classes of stock outstanding at the time. The Company does not intend to declare or pay any cash dividends in the foreseeable future.
Share Repurchase Program
In April 2021, the Board approved a share repurchase program, pursuant to which the Company may, between May 2021 and May 2026, repurchase outstanding shares of the Company's common stock, to be recorded as treasury stock. The Company repurchased no shares during the years ended December 31, 2025 and 2024.
88
14. Accumulated Comprehensive Income (Loss)
A summary of the components of accumulated other comprehensive income (loss) is as follows (in thousands):
Foreign Currency Translation
Net Unrealized Gain (Loss) on Available-for-Sale Securities
Total
Balance as of January 1, 2023
$
(2,788)
$
(3,513)
$
(6,301)
Other comprehensive income
2,712
3,992
6,704
Balance as of December 31, 2023
$
(76)
$
479
$
403
Other comprehensive income (loss)
(3,037)
22
(3,015)
Balance as of December 31, 2024
$
(3,113)
$
501
$
(2,612)
Other comprehensive income
3,833
876
4,709
Balance as of December 31, 2025
$
720
$
1,377
$
2,097
In connection with the nonmonetary exchange discussed in Note 6, the Company reclassified $0.9 million of previously unrealized gain from Accumulated other comprehensive income (loss) to Other (income), net during the twelve months ended December 31, 2025.
89
15. Segments
The Company has two reporting segments: subscription business and other business. The subscription business segment generates revenue primarily from subscription payments related to the Company's direct-to-consumer products. The other business segment generates revenue from other product offerings, primarily by underwriting policies on behalf of third parties with whom the Company has a business-to-business relationship. The other business segment has, and targets, a lower margin profile than the Company's subscription business segment. The Company does not undertake marketing efforts for these policies and has a business-to-business relationship with these third-parties.
The Company's chief operating decision maker is its Chief Executive Officer. The chief operating decision maker reviews revenue and operating income (loss) to evaluate segment performance. Revenue, veterinary invoice expense, other cost of revenue, new pet acquisition expenses and goodwill impairment charges are generally directly attributed to each segment. Other operating expenses, such as technology and development expense, general and administrative expense, and depreciation and amortization, are generally allocated proportionately based on revenue in each segment. Interest and other expenses and income taxes are not allocated to the segments, nor included in the measure of segment profit or loss. The Company does not analyze discrete segment balance sheet information related to long-term assets.
Operating income (loss) of the Company’s segments was as follows (in thousands):
Year Ended December 31,
2025
2024
2023
Subscription business:
Revenue
$
989,338
$
856,521
$
712,906
Veterinary invoice expense
700,154
624,428
543,196
Other cost of revenue
90,726
82,423
70,490
Technology and development
26,016
20,822
13,765
General and administrative
52,686
42,457
36,256
New pet acquisition expense
85,269
71,240
77,172
Goodwill impairment charges
1,129
5,299
—
Depreciation and amortization
10,885
10,970
8,021
Subscription business operating income (loss)
22,473
(1,118)
(35,994)
Other business:
Revenue
449,967
429,163
395,699
Veterinary invoice expense
328,821
324,720
287,859
Other cost of revenue
88,593
75,315
76,044
Technology and development
11,832
10,433
7,638
General and administrative
23,962
21,274
23,951
New pet acquisition expense
139
139
200
Depreciation and amortization
4,951
5,496
4,453
Other business operating loss
(8,331)
(8,214)
(4,446)
Loss from investment in joint venture
(305)
(182)
(219)
Total operating income (loss)
13,837
(9,514)
(40,659)
Interest expense
13,759
14,498
12,077
Other (income), net
(21,916)
(14,374)
(7,701)
Income (loss) before income taxes
$
21,994
$
(9,638)
$
(45,035)
90
The following table presents the Company’s revenue by geographic region of the member (in thousands):
Year Ended December 31,
2025
2024
2023
United States
$
1,197,807
$
1,073,150
$
935,312
Canada and other
241,498
212,534
173,293
Total revenue
$
1,439,305
$
1,285,684
$
1,108,605
Substantially all of the Company’s long-lived assets were located in the United States as of December 31, 2025 and 2024.
91
16. Dividend Restrictions and Statutory Surplus
The Company’s business operations are conducted through subsidiaries. In the U.S., the Company has two insurance subsidiaries: American Pet Insurance Company ("APIC"), domiciled in New York, and ZPIC Insurance Company ("ZPIC"), domiciled in Missouri. ZPIC does not yet underwrite any business. The Company also owns an insurance Company domiciled in Canada, GPIC Insurance Company ("GPIC"), and three segregated cell businesses in Bermuda, Wyndham Segregated Accounts AX, Trupanion Germany, and Trupanion Switzerland. In addition to general state law restrictions on payments of dividends and other distributions to stockholders applicable to all corporations, insurance companies are subject to further regulations that, among other things, may require such companies to maintain certain levels of equity and restrict the amount of dividends and other distributions that may be paid to their parent corporations.
Applicable regulations generally restrict the ability of the insurance entities to pay dividends to its holding company parent. These restrictions are based in part on the prior year’s statutory income and surplus. In the United States, dividends up to specified levels are generally considered ordinary and may be paid without prior approval. Dividends, in larger amounts, known as extraordinary dividends, are subject to approval by the insurer's domiciliary state regulator. An extraordinary dividend or distribution is generally defined as a dividend or distribution that, in the aggregate in any 12-month period, exceeds the lesser of (i) 10% of surplus as of the preceding December 31 or (ii) the insurer’s adjusted net investment income for the 12-month period immediately preceding the declaration or distribution of the current dividend increased by the excess, if any, of net investment income over dividends declared or distributed during the period commencing thirty-six months prior to the declaration or distribution of the current dividend and ending twelve months prior thereto, and not including realized capital gains. APIC paid an extraordinary dividend of $26.0 million to the Company during the year ended December 31, 2025, and ordinary dividends to the Company in 2024 and 2023 of $4.2 million and $7.6 million, respectively.
The Company's insurance subsidiary in Canada, GPIC, is regulated by the Canadian Office of the Superintendent of Financial Institutions ("OSFI") and is required to maintain prescribed minimum capital and solvency levels, including compliance with OSFI's Minimum Capital Test ("MCT"). Dividends may not be paid if the subsidiary would fail to meet applicable regulatory capital requirements following the payment of the dividend. Payment of dividends requires advance notice to OSFI and must be supported by a comprehensive analysis, including projections demonstrating capital adequacy and liquidity following the proposed dividend. OSFI has the authority to restrict or prohibit dividend payments if it determines that such payments would be imprudent or could adversely affect GPIC's financial condition.
The Company's insurance subsidiaries in Bermuda are regulated by the Bermuda Monetary Authority. Under the Bermuda Companies Act of 1981, as amended, a Bermuda company may not declare or pay a dividend or make a distribution out of contributed surplus if there are reasonable grounds for believing that: (a) the company is, or would be after the payment, unable to pay its liabilities as they become due; or (b) the realizable value of the company’s assets would thereby be less than its liabilities. The Segregated Accounts Company Act of 2000 further requires that dividends out of a segregated account can only be paid to the extent that the cell remains solvent. The value of its assets must remain greater than the aggregate of its liabilities, issued share capital, and share premium accounts. Per our contractual agreements with Wyndham Insurance Company (SAC) Limited, the allowable dividend is equivalent to the positive undistributed profit attributable to the shares. Wyndham Segregated Account AX paid the Company dividends totaling $27.9 million, $8.6 million, and $7.3 million during the years ended December 31, 2025, 2024 and 2023, respectively.
The statutory net income for 2025, 2024 and 2023 and statutory capital and surplus at December 31, 2025, 2024 and 2023, for APIC were as follows (in thousands):
As of December 31,
2025
2024
2023
Statutory net income
$
54,572
$
49,007
$
40,076
Statutory capital and surplus
$
275,052
$
245,484
$
199,613
As of December 31, 2025, APIC maintained $275.1 million of statutory capital and surplus which was above the company action level risk-based capital requirement of $106.0 million.
92
The statutory net income for 2025, 2024 and 2023 and statutory capital and surplus at December 31, 2025, 2024 and 2023, for GPIC were as follows (in thousands):
As of December 31,
2025
2024
2023
Statutory net income(1)
$
8,045
$
128
$
16
Statutory capital and surplus(1)
$
37,684
$
8,639
$
8,516
(1)Amounts presented in CAD
As of December 31, 2025, GPIC maintained CAD $37.7 million of statutory capital and surplus which was above the required capital of CAD $10.1 million to maintain the minimum capital ratio of 100%.
During the year ended December 31, 2025, the Company funded $15.3 million, $0.3 million, $0.4 million and $0.8 million in total of statutory capital to GPIC, ZPIC, Trupanion Germany and Trupanion Switzerland, respectively, and no capital to APIC. During the year ended December 31, 2024, the Company funded $1.1 million, $0.2 million, $0.1 million and $0.2 million of statutory capital to APIC, ZPIC, Trupanion Germany and Trupanion Switzerland, respectively, and no capital to GPIC. ZPIC currently maintains $7.5 million of capital to remain licensed in certain U.S. states and will be required to maintain a level of surplus as determined by its respective domiciliary regulator when it begins underwriting policies.
As of December 31, 2025, the Company had $11.5 million on deposit with various U.S. states in which it is licensed to write policies.
17. Income Taxes
Income (loss) before income taxes was as follows for the years ended December 31, 2025, 2024 and 2023 (in thousands):
Year Ended December 31,
2025
2024
2023
United States
$
17,223
$
(758)
$
(41,019)
Foreign
4,771
(8,880)
(4,016)
Total
$
21,994
$
(9,638)
$
(45,035)
The components of income tax expense (benefit) were as follows (in thousands):
Year Ended December 31,
2025
2024
2023
Current:
U.S. federal(1)
$
—
$
120
$
(8)
U.S. state
243
—
—
Foreign
2,897
610
464
3,140
730
456
Deferred:
U.S. federal(1)
—
(48)
7
U.S. state and local
1
—
—
Foreign
(580)
(687)
(805)
(579)
(735)
(798)
Income tax expense (benefit)
$
2,561
$
(5)
$
(342)
(1) These items include both federal and state components of tax expense (benefit) in 2024 and 2023 as the Company adopted ASU 2023-09 on a prospective basis.
The Company's effective tax rate reconciliation for the year ended December 31, 2025 has been prepared in accordance with ASU 2023-09 on a prospective basis. Effective tax rate reconciliations for prior periods are presented in accordance with
93
guidance in effect at the time and have not been updated to conform to the new disclosure requirements. As a result, the rate reconciliation for the current year may not be directly comparable to those of prior periods.
A reconciliation of income tax expense at the statutory federal income tax rate and income taxes as reflected in the financial statements is presented below:
Consolidated Rate Reconciliation Current Year (ASU 2023-09)
Year Ended December 31,
2025
U.S. federal tax at statutory rate
$
4,619
21.0
%
Domestic federal
Tax credits
(193)
(0.9)
Change in valuation allowance
(4,574)
(20.8)
Nontaxable or nondeductible items:
Equity compensation
834
3.8
Other permanent adjustments
355
1.6
Other adjustments:
Other
(35)
(0.2)
U.S. state income taxes, net of federal income tax effect(1)
233
1.1
Foreign tax effects:
Canada
Statutory rate difference between Canada and U.S.
(532)
(2.4)
Provincial taxes(2)
1,023
4.7
Other
2
—
Czechia
Goodwill impairment
237
1.1
Other
(127)
(0.6)
Germany
353
1.6
Other foreign jurisdictions
360
1.6
Worldwide changes in unrecognized tax benefits
6
—
Effective income tax rate
$
2,561
11.6
%
(1) State taxes in Oregon make up the majority (greater than 50 percent) of the tax effect in this category.
(2) State and local taxes in Ontario, British Columbia, and Alberta make up the majority of the tax effect in this category.
Consolidated Rate Reconciliation Prior Year (legacy guidance)
Year Ended December 31,
2024
2023
Federal income taxes at statutory rate
21.0
%
21.0
%
U.S. state income taxes, net of federal income tax effect
5.0
7.9
Equity compensation
(16.3)
(9.2)
Change in valuation allowance
2.9
(19.1)
Other, net
(0.4)
(0.1)
Credits
1.2
0.3
Goodwill impairment
(13.4)
—
Effective income tax rate
—
%
0.8
%
94
The principal components of the Company’s deferred tax assets and liabilities were as follows (in thousands):
As of December 31,
2025
2024
Deferred tax assets:
Deferred revenue
$
11,070
$
10,798
Accruals and reserves
2,592
1,932
Net operating loss carryforwards
67,928
67,674
Depreciation and amortization
—
3,387
Lease Liability
3,100
—
Equity compensation
1,347
1,323
Credits
1,541
1,297
Other
803
977
Total deferred tax assets
88,381
87,388
Deferred tax liabilities:
Deferred costs
(1,657)
(1,569)
Right-of-use Asset
(3,303)
—
Intangible assets
(1,813)
(2,302)
Other
(1,130)
(623)
Total deferred tax liabilities
(7,903)
(4,494)
Total deferred taxes
80,478
82,894
Less deferred tax asset valuation allowance
(81,802)
(84,707)
Net deferred tax liability
$
(1,324)
$
(1,813)
At December 31, 2025, the Company had U.S. federal, U.S. state, and foreign net operating loss carryforwards of $67.9 million (tax-effected, net of federal benefit) and U.S. federal income tax credits of $1.5 million. Use of carryforwards is limited based on the future income of the Company. The federal net operating loss carryforwards will begin to expire in 2027. Foreign net operating loss carryforwards will begin to expire in 2026. U.S. federal income tax credits will begin to expire in 2036. Pursuant to Sections 382 and 383 of the Internal Revenue Code, annual use of the Company’s net operating loss carryforwards and credit carryforwards may be limited if the Company experiences an ownership change. As of December 31, 2025, the utilization of approximately$0.3 million of net operating losses are subject to limitation as a result of prior ownership changes; however, subsequent ownership changes may further affect the limitation in future years.
A valuation allowance is required to reduce the deferred tax assets reported if, based on the weight of available evidence, it is more likely than not that some portion or all of the deferred tax assets will not be realized. After consideration of all the evidence, both positive and negative, the Company has recorded a full valuation allowance against its U.S. Federal, the majority of its U.S. State, and a portion of its foreign deferred tax assets as of December 31, 2025, 2024, and 2023 because the Company’s management has determined that it is more likely than not that these assets will not be fully realized.
For the year ended December 31, 2025, the Company recognized a net decrease of $2.9 million in valuation allowance against its net deferred tax assets associated with U.S. federal and certain foreign and U.S. state jurisdictions, primarily attributable the utilization of net operating losses in certain jurisdictions.
The Company is open to examination by the U.S. federal tax jurisdiction for the years ended December 31, 2021 through 2025, and is also open to examination for 2006 and forward with respect to net operating loss carryforwards generated and carried forward from those years in the United States. The Company is subject to taxation in various states and countries, and may be subject to audit or examination by the relevant authorities in respect to those particular jurisdictions primarily for 2018 and thereafter.
On July 4, 2025, the One Big Beautiful Bill Act ("2025 U.S. Tax Act") was enacted in the United States. Among the changes, the 2025 U.S. Tax Act restores immediate expensing of domestic research and development costs and modifies certain international provisions. The 2025 U.S. Tax Act did not have a material impact on the current year effective rates for income taxes or cash taxes paid. While we continue to evaluate the impact for future years, we do not anticipate a material impact for income taxes or cash taxes paid.
95
Many countries have enacted the Organization for Economic Cooperation and Development’s 15% global minimum tax regime. The legislation did not have a material impact on our current year effective rates for income taxes or for cash taxes paid, however we continue to monitor developments and evaluate impacts, if any, of these rules on our results of operations and cash flows.
For the year ended December 31, 2025, the Company intends to invest substantially all of its foreign subsidiary earnings, as well as its capital in its foreign subsidiaries, indefinitely outside of the U.S. in those jurisdictions in which it would incur significant, additional costs upon repatriation of such amounts. A deferred tax liability related to taxes due upon repatriation to the U.S. has not been recorded.
The Company is booking Global Intangible Low-Taxed Income ("GILTI") on a current basis and is not booking deferred taxes related to GILTI.
The Company accounts for uncertain tax positions based on a two-step process of evaluating recognition and measurement criteria. The first step assesses whether the tax position is more likely than not to be sustained upon examination by the taxing authority, including resolution of any appeals or litigation, on the basis of the technical merits of the position. If the tax position meets the more-likely-than-not criteria, the portion of the tax benefit greater than 50% likely to be realized upon settlement with the relevant taxing authority is recognized in the financial statements.
A reconciliation of the beginning and ending amount of gross unrecognized tax benefits is as follows (in thousands):
Year Ended December 31,
2025
2024
2023
Balance, beginning of year
$
83
$
80
$
151
Increases (decreases) to tax positions related to prior periods
6
3
(72)
Increases (decreases) to tax positions related to the current year
1
—
1
Balance, end of year
$
90
$
83
$
80
The Company's disaggregated presentation of net cash paid for income taxes for the year ended December 31, 2025 has been prepared in accordance with ASU 2023-09 on a prospective basis. As a result, the net cash paid for income taxes for the current year may not be directly comparable to those of prior periods.
Net cash paid for income taxes in 2025 consisted of the following:
December 31, 2025
Federal
$
—
State
Oregon
149
Other
47
Foreign
Canada - Federal
250
Canada - British Columbia
95
Canada - Ontario
94
United Kingdom
405
Other
5
Total
$
1,045
The Company paid income taxes of $0.5 million and $0.6 million in the years ended December 31, 2024 and 2023, respectively.
18. Employee Benefits
The Company has a 401(k) plan for its U.S. employees. The plan allows employees to contribute a percentage of their pretax earnings annually, subject to limitations imposed by the Internal Revenue Service. The plan also allows the Company to make a
96
matching contribution, subject to certain limitations. The Company made matching contributions of $0.8 million for the year ended December 31, 2025, and no matching contributions during the years ended December 31, 2024 and 2023.
97
Item 9. Changes in and Disagreements with Accountants on Accounting and Financial Disclosure
None.
Item 9A. Controls and Procedures
Evaluation of Disclosure Controls and Procedures
Our management, with the participation of our Chief Executive Officer ("CEO") and Chief Financial Officer ("CFO"), has evaluated the effectiveness of our disclosure controls and procedures (as defined in Rules 13a-15(e) and 15d-15(e) under the Exchange Act), as of the end of the period covered by this Annual Report on Form 10-K. Based on such evaluation, our CEO and CFO have concluded that as of December 31, 2025, the disclosure controls and procedures were effective.
Management’s Report on Internal Control over Financial Reporting
Our management is responsible for establishing and maintaining adequate internal control over financial reporting, as such term is defined under Rule 13a-15(f) and 15d-15(f) under the Exchange Act. Our internal control over financial reporting is designed to provide reasonable assurance regarding the reliability of financial reporting and the preparation of financial statements for external purposes in accordance with U.S. GAAP and includes those policies and procedures that: (1) pertain to the maintenance of records that in reasonable detail accurately and fairly reflect our transactions and the dispositions of our assets; (2) provide reasonable assurance that our transactions are recorded as necessary to permit preparation of financial statements in accordance with U.S. GAAP and that our receipts and expenditures are being made only in accordance with authorizations of our management and directors; and (3) provide reasonable assurance regarding prevention or timely detection of unauthorized acquisition, use or disposition of our assets that could have a material effect on our financial statements.
Management has assessed the effectiveness of our internal control over financial reporting as of December 31, 2025, using the criteria set forth by the Committee of Sponsoring Organizations of the Treadway Commission ("COSO") in Internal Control—Integrated Framework (2013). As a result of this assessment, management concluded that, as of December 31, 2025, our internal control over financial reporting was effective in providing reasonable assurance regarding the reliability of financial reporting and the preparation of financial statements for external purposes in accordance with U.S. GAAP.
In addition, Ernst & Young LLP has issued a report on our internal control over financial reporting as of December 31, 2025, and its report appears below.
Changes in Internal Control
There have been no changes in our internal control over financial reporting identified in management’s evaluation pursuant to Rules 13a-15(f) or 15d-15(f) of the Exchange Act during the period covered by this Annual Report on Form 10-K that materially affected, or are reasonably likely to materially affect, our internal control over financial reporting.
Limitations on Effectiveness of Controls and Procedures
In designing and evaluating the disclosure controls and procedures, management recognizes that any controls and procedures, no matter how well designed and operated, can provide only reasonable assurance of achieving the desired control objectives. In addition, the design of disclosure controls and procedures must reflect the fact that there are resource constraints and that management is required to apply judgment in evaluating the benefits of possible controls and procedures relative to their costs.
98
Report of Independent Registered Public Accounting Firm
To the Stockholders and the Board of Directors of Trupanion, Inc.
Opinion on Internal Control Over Financial Reporting
We have audited Trupanion, Inc.’s internal control over financial reporting as of December 31, 2025, based on criteria established in Internal Control—Integrated Framework issued by the Committee of Sponsoring Organizations of the Treadway Commission (2013 framework) (the COSO criteria). In our opinion, Trupanion, Inc. (the Company) maintained, in all material respects, effective internal control over financial reporting as of December 31, 2025, based on the COSO criteria.
We also have audited, in accordance with the standards of the Public Company Accounting Oversight Board (United States) (PCAOB), the consolidated balance sheets of the Company as of December 31, 2025 and 2024, the related consolidated statements of operations, comprehensive income (loss), stockholders’ equity and cash flows for each of the three years in the period ended December 31, 2025, and the related notes and financial statement schedule listed in the Index at Item 15(a)(2) and our report dated February 13, 2026, expressed an unqualified opinion thereon.
Basis for Opinion
The Company’s management is responsible for maintaining effective internal control over financial reporting and for its assessment of the effectiveness of internal control over financial reporting included in the accompanying Management’s Report on Internal Control over Financial Reporting. Our responsibility is to express an opinion on the Company’s internal control over financial reporting based on our audit. We are a public accounting firm registered with the PCAOB and are required to be independent with respect to the Company in accordance with the U.S. federal securities laws and the applicable rules and regulations of the Securities and Exchange Commission and the PCAOB.
We conducted our audit in accordance with the standards of the PCAOB. Those standards require that we plan and perform the audit to obtain reasonable assurance about whether effective internal control over financial reporting was maintained in all material respects.
Our audit included obtaining an understanding of internal control over financial reporting, assessing the risk that a material weakness exists, testing and evaluating the design and operating effectiveness of internal control based on the assessed risk, and performing such other procedures as we considered necessary in the circumstances. We believe that our audit provides a reasonable basis for our opinion.
Definition and Limitations of Internal Control Over Financial Reporting
A company’s internal control over financial reporting is a process designed to provide reasonable assurance regarding the reliability of financial reporting and the preparation of financial statements for external purposes in accordance with generally accepted accounting principles. A company’s internal control over financial reporting includes those policies and procedures that (1) pertain to the maintenance of records that, in reasonable detail, accurately and fairly reflect the transactions and dispositions of the assets of the company; (2) provide reasonable assurance that transactions are recorded as necessary to permit preparation of financial statements in accordance with generally accepted accounting principles, and that receipts and expenditures of the company are being made only in accordance with authorizations of management and directors of the company; and (3) provide reasonable assurance regarding prevention or timely detection of unauthorized acquisition, use, or disposition of the company’s assets that could have a material effect on the financial statements.
Because of its inherent limitations, internal control over financial reporting may not prevent or detect misstatements. Also, projections of any evaluation of effectiveness to future periods are subject to the risk that controls may become inadequate because of changes in conditions, or that the degree of compliance with the policies or procedures may deteriorate.
/s/ Ernst & Young LLP
Seattle, Washington
February 13, 2026
99
Item 9B. Other Information
Rule 10b5-1 Plan
On December 2, 2025, Murray Low, a member of our Board of Directors, adopted a trading plan intended to satisfy Rule 10b5-1 to sell up to 20,020 shares of Trupanion, Inc. common stock over a period ending on December 31, 2026, subject to certain conditions.
No other officers nor directors of the Company adopted, modified, or terminated a "Rule 10b5-1 trading arrangement" or a "non-Rule 10b5-1 trading arrangement," as defined in Item 408(a) of Regulation S-K, during the three months ended December 31, 2025.
Item 9C. Disclosure Regarding Foreign Jurisdictions that Prevent Inspections
Not applicable.
100
PART III
Item 10. Directors, Executive Officers and Corporate Governance
Information required by this item is incorporated herein by reference to our Proxy Statement with respect to our 2026 Annual Meeting of Stockholders to be filed with the SEC within 120 days of the end of the fiscal year covered by this Annual Report.
Item 11. Executive Compensation
Information required by this item is incorporated herein by reference to our Proxy Statement with respect to our 2026 Annual Meeting of Stockholders to be filed with the SEC within 120 days of the end of the fiscal year covered by this Annual Report.
Item 12. Security Ownership of Certain Beneficial Owners and Management and Related Stockholder Matters
Information required by this item is incorporated herein by reference to our Proxy Statement with respect to our 2026 Annual Meeting of Stockholders to be filed with the SEC within 120 days of the end of the fiscal year covered by this Annual Report.
Item 13. Certain Relationships and Related Transactions and Director Independence
Information required by this item is incorporated herein by reference to our Proxy Statement with respect to our 2026 Annual Meeting of Stockholders to be filed with the SEC within 120 days of the end of the fiscal year covered by this Annual Report.
Item 14. Principal Accountant Fees and Services
Information required by this item is incorporated herein by reference to our Proxy Statement with respect to our 2026 Annual Meeting of Stockholders to be filed with the SEC within 120 days after the end of the fiscal year covered by this Annual Report.
101
PART IV
Item 15. Exhibits, Financial Statement Schedules
(a)(1) Financial Statements
We have filed the financial statements listed in the Index to Financial Statements as a part of this Annual Report on Form 10-K.
(a)(2) Financial Statement Schedules
Schedule I Condensed Financial Information of Registrant
No other financial statement schedules have been provided because the information called for is not required or is shown either in the financial statements or notes thereto.
(a)(3) Exhibits
The following exhibits are filed as part of this Annual Report on Form 10-K or are incorporated herein by reference.
XBRL Instance Document - the instance does not appear in the Interactive Data File because its XBRL tags are embedded within the Inline XBRL document.
X
101.SCH
Inline XBRL Taxonomy Extension Schema With Embedded LinkBase Documents.
X
104
Cover Page Interactive Data File (formatted in Inline XBRL and contained in Exhibit 101)
X
+
Indicates a management contract or compensatory plan or arrangement.
†
Registrant has omitted portions of the referenced exhibit pursuant to a request for confidential treatment under Rule 24b-2 promulgated under the Exchange Act. The omitted portions of this exhibit have been filed separately with the SEC.
*
This certification is deemed not filed for purpose of section 18 of the Exchange Act or otherwise subject to the liability of that section, nor shall it be deemed incorporated by reference into any filing under the Securities Act or the Exchange Act.
103
Item 16. Form 10-K Summary
None.
104
SIGNATURES
Pursuant to the requirements of Section 13 or 15(d) of the Securities Exchange Act of 1934, the registrant has duly caused this report to be signed on its behalf by the undersigned, thereunto duly authorized, in the city of Seattle, state of Washington, on this 13th day of February, 2026.
TRUPANION, INC.
By:
/s/ Margi Tooth
Margi Tooth
Chief Executive Officer
POWER OF ATTORNEY
KNOW ALL PERSONS BY THESE PRESENTS, that each person whose signature appears below hereby constitutes and appoints Margi Tooth and Fawwad Qureshi, and each of them, as his or her true and lawful attorneys-in-fact, proxies and agents, each with full power of substitution, for him or her in any and all capacities, to sign any and all amendments to this Annual Report on Form 10-K, and to file the same, with all exhibits thereto and other documents in connection therewith, with the Securities and Exchange Commission, granting unto said attorneys-in-fact, proxies and agents full power and authority to do and perform each and every act and thing requisite and necessary to be done in connection therewith, as fully for all intents and purposes as he or she might or could do in person, hereby ratifying and confirming all that said attorneys-in-fact, proxies and agents, or their or his or her substitute or substitutes, may lawfully do or cause to be done by virtue hereof.
Pursuant to the requirements of the Securities Exchange Act of 1934, this report has been signed below by the following persons on behalf of the registrant and in the capacities and on the dates indicated.
105
Date: February 13, 2026
/s/ Margi Tooth
Margi Tooth
Chief Executive Officer and Director
(Principal Executive Officer)
Date: February 13, 2026
/s/ Fawwad Qureshi
Fawwad Qureshi Chief Financial Officer
(Principal Financial and Accounting Officer)
Date: February 13, 2026
/s/ Darryl Rawlings
Darryl Rawlings Chairperson of the Board
Date: February 13, 2026
/s/ Max Broden
Max Broden Director
Date: February 13, 2026
/s/ Jacqueline Davidson
Jacqueline Davidson Director
Date: February 13, 2026
/s/ Paulette Dodson
Paulette Dodson Director
Date: February 13, 2026
/s/ Richard Enthoven
Richard Enthoven Director
Date: February 13, 2026
/s/ Murray Low
Murray Low Director
Date: February 13, 2026
/s/ Betsy McLaughlin
Betsy McLaughlin Director
Date: February 13, 2026
/s/ Howard Rubin
Howard Rubin Director
Date: February 13, 2026
/s/ Bradley Powell
Bradley Powell Director
106
Schedule I - Condensed Financial Information of Registrant
Trupanion, Inc.
Condensed Statements of Operations and Comprehensive Income (Loss)
(Parent Company Only, in thousands)
Year Ended December 31,
2025
2024
2023
Expenses:
Veterinary invoice expense
$
394
$
290
$
253
Other cost of revenue
458
347
240
Technology and development
264
1,934
1,507
General and administrative
4,532
3,915
5,345
New pet acquisition expense
3,088
1,422
806
Depreciation and amortization
1,042
941
494
Total expenses
9,778
8,849
8,645
Loss from investment in joint venture
(324)
(192)
(237)
Operating loss
(10,102)
(9,041)
(8,882)
Interest expense
13,599
14,345
11,998
Other (income), net
(63,294)
(16,303)
(14,442)
Income (loss) before income taxes and loss in undistributed earnings of subsidiaries
39,593
(7,083)
(6,438)
Income tax (benefit)
(18,973)
(18,939)
(15,766)
Loss in undistributed earnings of subsidiaries
(39,133)
(21,489)
(54,021)
Net income (loss)
$
19,433
$
(9,633)
$
(44,693)
Other comprehensive income (loss), net of taxes:
Other comprehensive income (loss) of subsidiaries
4,709
(3,015)
6,704
Other comprehensive income (loss)
4,709
(3,015)
6,704
Comprehensive income (loss)
$
24,142
$
(12,648)
$
(37,989)
107
Trupanion, Inc.
Condensed Balance Sheets
(Parent Company Only)
(In thousands, except share data)
December 31,
2025
2024
Assets
Current assets:
Cash and cash equivalents
$
13,850
$
11,951
Accounts and other receivables
6
1,194
Prepaid expenses and other assets
96
815
Total current assets
13,952
13,960
Restricted cash
27,115
25,406
Property, equipment, and internal-use software, net
4,134
4,180
Intangible assets, net
5,818
5,869
Other long-term assets
2,491
12,415
Advances to and investments in subsidiaries
444,341
392,898
Total assets
$
497,851
$
454,728
Liabilities and stockholders’ equity
Current liabilities:
Accounts payable, accrued liabilities, and other current liabilities
$
1,075
$
1,488
Long-term debt - current portion
10,000
1,350
Total current liabilities
11,075
2,838
Long-term debt
101,784
127,537
Deferred tax liabilities
1,056
1,057
Other liabilities
—
28
Total liabilities
113,915
131,460
Stockholders’ equity:
Common stock: $0.00001 par value per share, 100,000,000 shares authorized; 44,430,267 and 43,402,081 shares issued and outstanding at December 31, 2025 and 43,516,631 and 42,488,445 shares issued and outstanding at December 31, 2024
—
—
Preferred stock: $0.00001 par value per share, 10,000,000 shares authorized; no shares issued and outstanding
—
—
Additional paid-in capital
604,828
568,302
Accumulated other comprehensive income (loss)
2,097
(2,612)
Accumulated deficit
(206,455)
(225,888)
Treasury stock, at cost: 1,028,186 shares at December 31, 2025 and 2024
(16,534)
(16,534)
Total stockholders’ equity
383,936
323,268
Total liabilities and stockholders’ equity
$
497,851
$
454,728
108
Trupanion, Inc.
Condensed Statements of Cash Flows
(Parent Company Only, in thousands)
Year Ended December 31,
2025
2024
2023
Operating activities
Net income (loss)
$
19,433
$
(9,633)
$
(44,693)
Adjustments to reconcile net income (loss) to cash provided by operating activities:
(Income) loss attributable to investments in subsidiaries
(14,729)
8,707
39,184
Realized gain on preferred stock investment
(7,783)
—
—
Dividends from subsidiaries
53,862
12,782
14,837
Depreciation and amortization
1,042
941
494
Stock-based compensation expense
8,109
6,178
4,575
Other, net
3,040
(395)
4,200
Changes in operating assets and liabilities
1,968
507
6,194
Net cash provided by operating activities
64,942
19,087
24,791
Investing activities
Purchases of property, equipment, and internal-use software
(945)
(1,201)
(172)
Advances to and investments in subsidiaries
(39,687)
(13,526)
(87,198)
Other
1,546
2,157
1,586
Net cash used in investing activities
(39,086)
(12,570)
(85,784)
Financing activities
Proceeds from debt financing, net of financing fees
114,208
—
59,972
Repayment of debt financing
(134,438)
(1,350)
(1,225)
Proceeds from exercise of stock options
1,694
752
2,655
Shares withheld to satisfy tax withholding
(3,712)
(2,519)
(1,536)
Net cash (used in) provided by financing activities
(22,248)
(3,117)
59,866
Net change in cash, cash equivalents, and restricted cash
3,608
3,400
(1,127)
Cash, cash equivalents, and restricted cash at beginning of period
37,357
33,957
35,084
Cash, cash equivalents, and restricted cash at end of period
$
40,965
$
37,357
$
33,957
1. Organization and Presentation
The accompanying condensed financial statements present the financial position, results of operations and cash flows for Trupanion, Inc. These condensed unconsolidated financial statements should be read in conjunction with the consolidated financial statements of Trupanion, Inc. and its subsidiaries and the notes thereto (the Consolidated Financial Statements). Investments in subsidiaries are accounted for using the equity method of accounting. Trupanion, Inc. received cash dividends from subsidiaries of $53.9 million, $12.8 million and $14.9 million for the years ended December 31, 2025, 2024 and 2023, respectively. These cash dividends were recorded within Trupanion, Inc.'s other income and were eliminated within the consolidated financial statements of Trupanion, Inc.
Additional information about Trupanion, Inc.’s accounting policies pertaining to intangible assets, commitments and contingencies, stock-based compensation, stockholders’ equity, and income taxes are set forth in Notes 4, 8, 12, 13, and 17, respectively, to the Consolidated Financial Statements.
Compensation expense related to stock-based transactions, including employee and non-employee stock option awards, and restricted stock units is measured and recognized in the financial statements based on fair value. Effective January 1, 2023, we entered into an intercompany agreement with a non-insurance subsidiary whereby stock-based compensation costs are allocated to this entity. Stock-based compensation expenses of $30.2 million and $27.3 million were included within equity (loss) in undistributed earnings of subsidiaries within the Condensed Statements of Operations and Comprehensive Loss and in advances to and investments in subsidiaries in the Condensed Balance Sheets for the years ended December 31, 2025 and 2024, respectively. There was no impact to net income (loss) as a result of this intercompany agreement.