.2 BCP Investment Corporation
• • • • • • • • •
▪ ▪ ▪ ▪ ▪ ▪
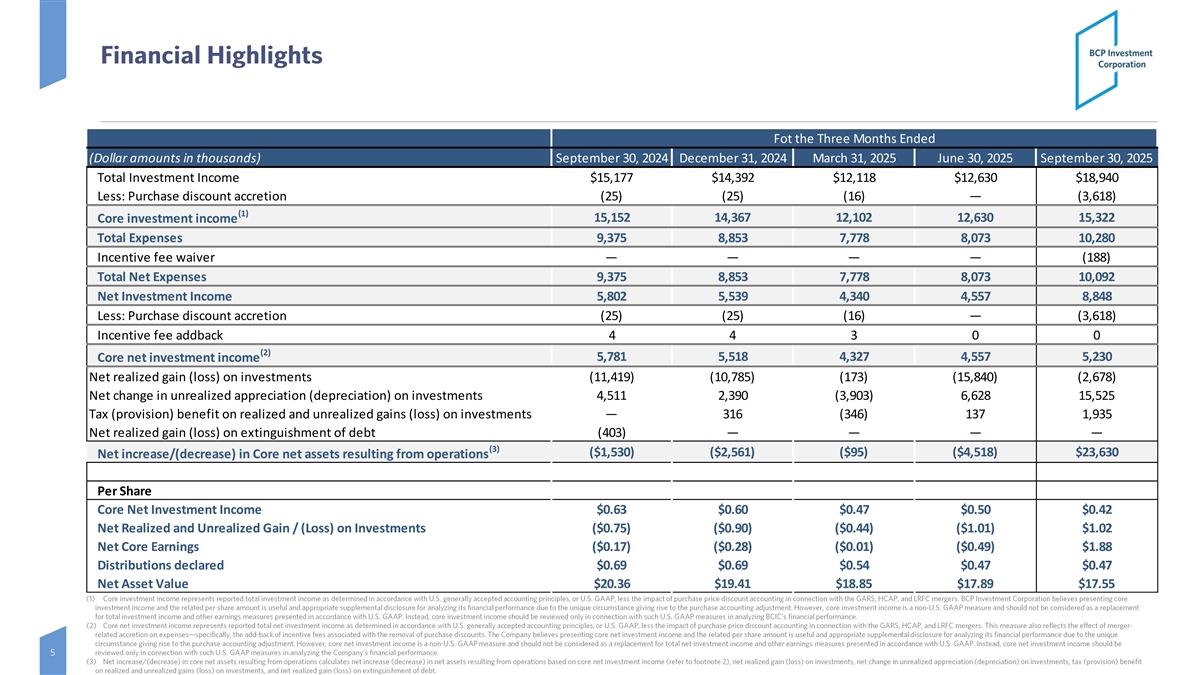
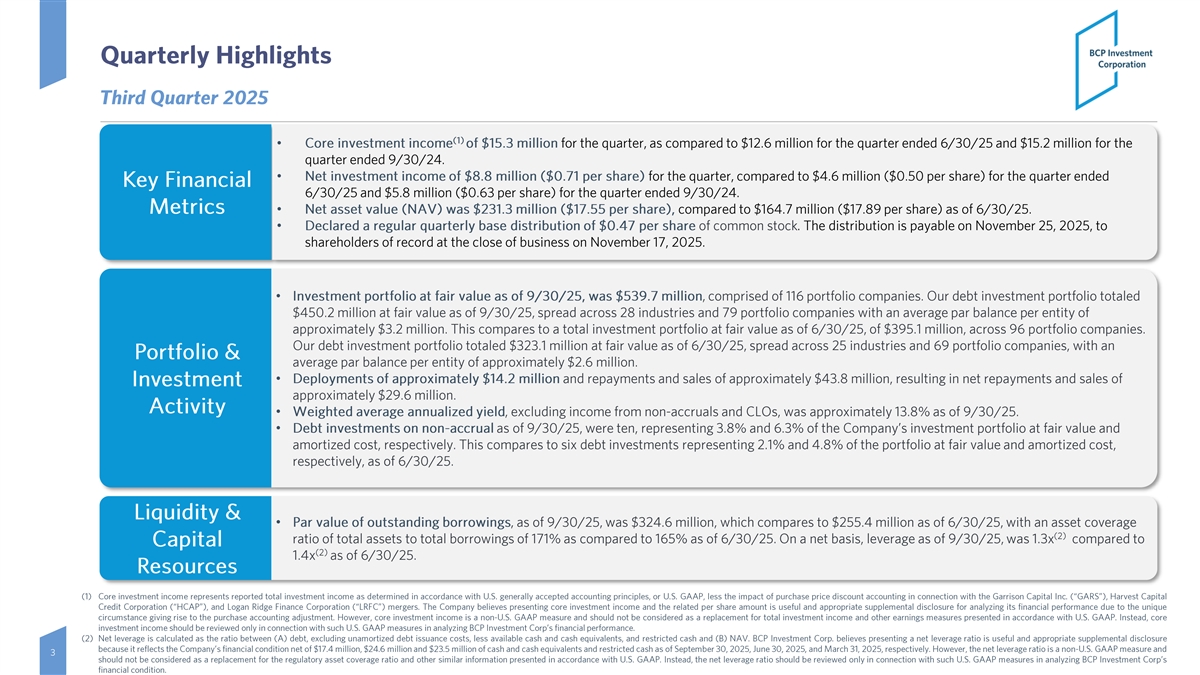
Fot the Three Months Ended (Dollar amounts in thousands) September 30, 2024 December 31, 2024 March 31, 2025 June 30, 2025 September 30, 2025 Total Investment Income $15,177 $14,392 $12,118 $12,630 $18,940 Less: Purchase discount accretion (25) (25) (16)— (3,618) (1) Core investment income 15,152 14,367 12,102 12,630 15,322 Total Expenses 9,375 8,853 7,778 8,073 10,280 Incentive fee waiver———— (188) Total Net Expenses 9,375 8,853 7,778 8,073 10,092 Net Investment Income 5,802 5,539 4,340 4,557 8,848 Less: Purchase discount accretion (25) (25) (16)— (3,618) Incentive fee addback 4 4 3 0 0 (2) 5,781 5,518 4,327 4,557 5,230 Core net investment income Net realized gain (loss) on investments (11,419) (10,785) (173) (15,840) (2,678) Net change in unrealized appreciation (depreciation) on investments 4,511 2,390 (3,903) 6,628 15,525 Tax (provision) benefit on realized and unrealized gains (loss) on investments— 316 (346) 137 1,935 Net realized gain (loss) on extinguishment of debt (403)———— (3) ($1,530) ($2,561) ($95) ($4,518) $23,630 Net increase/(decrease) in Core net assets resulting from operations Per Share Core Net Investment Income $0.63 $0.60 $0.47 $0.50 $0.42 Net Realized and Unrealized Gain / (Loss) on Investments ($0.75) ($0.90) ($0.44) ($1.01) $1.02 Net Core Earnings ($0.17) ($0.28) ($0.01) ($0.49) $1.88 Distributions declared $0.69 $0.69 $0.54 $0.47 $0.47 Net Asset Value $20.36 $19.41 $18.85 $17.89 $17.55
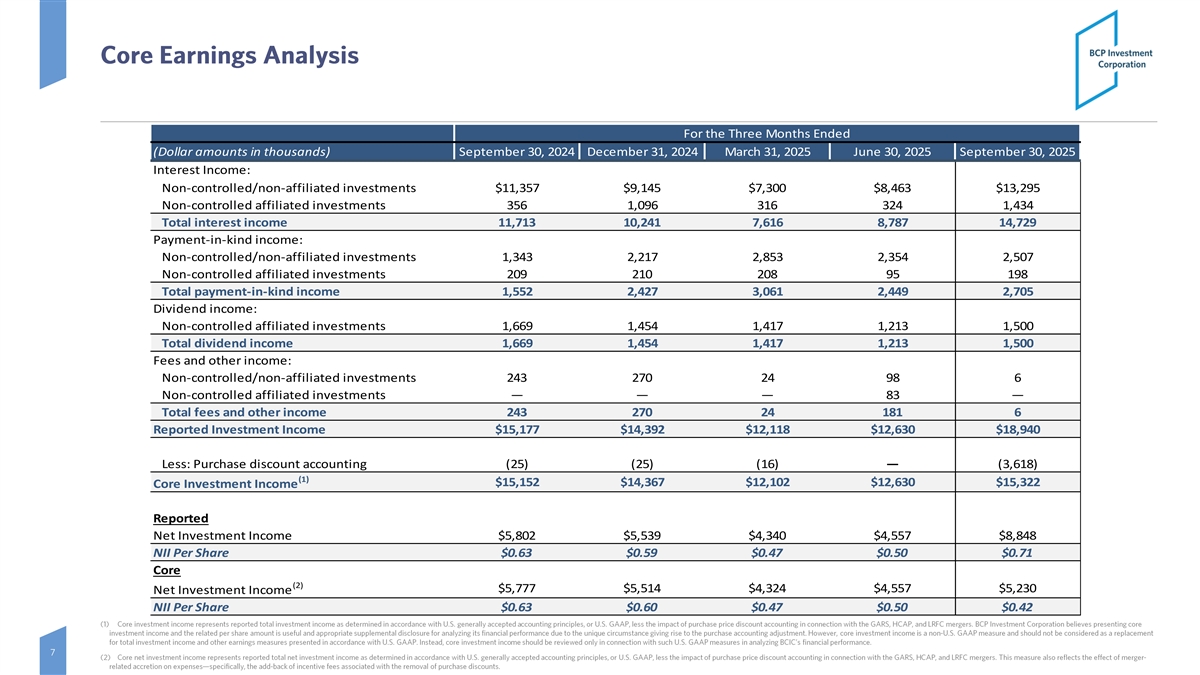
For the Three Months Ended (Dollar amounts in thousands) September 30, 2024 December 31, 2024 March 31, 2025 June 30, 2025 September 30, 2025 Interest Income: Non-controlled/non-affiliated investments $11,357 $9,145 $7,300 $8,463 $13,295 Non-controlled affiliated investments 356 1,096 316 324 1,434 Total interest income 11,713 10,241 7,616 8,787 14,729 Payment-in-kind income: Non-controlled/non-affiliated investments 1,343 2,217 2,853 2,354 2,507 Non-controlled affiliated investments 209 210 208 95 198 Total payment-in-kind income 1,552 2,427 3,061 2,449 2,705 Dividend income: Non-controlled affiliated investments 1,669 1,454 1,417 1,213 1,500 Total dividend income 1,669 1,454 1,417 1,213 1,500 Fees and other income: Non-controlled/non-affiliated investments 243 270 24 98 6 Non-controlled affiliated investments——— 83— Total fees and other income 243 270 24 181 6 Reported Investment Income $15,177 $14,392 $12,118 $12,630 $18,940 Less: Purchase discount accounting (25) (25) (16)— (3,618) (1) $15,152 $14,367 $12,102 $12,630 $15,322 Core Investment Income Reported Net Investment Income $5,802 $5,539 $4,340 $4,557 $8,848 NII Per Share $0.63 $0.59 $0.47 $0.50 $0.71 Core (2) $5,777 $5,514 $4,324 $4,557 $5,230 Net Investment Income NII Per Share $0.63 $0.60 $0.47 $0.50 $0.42
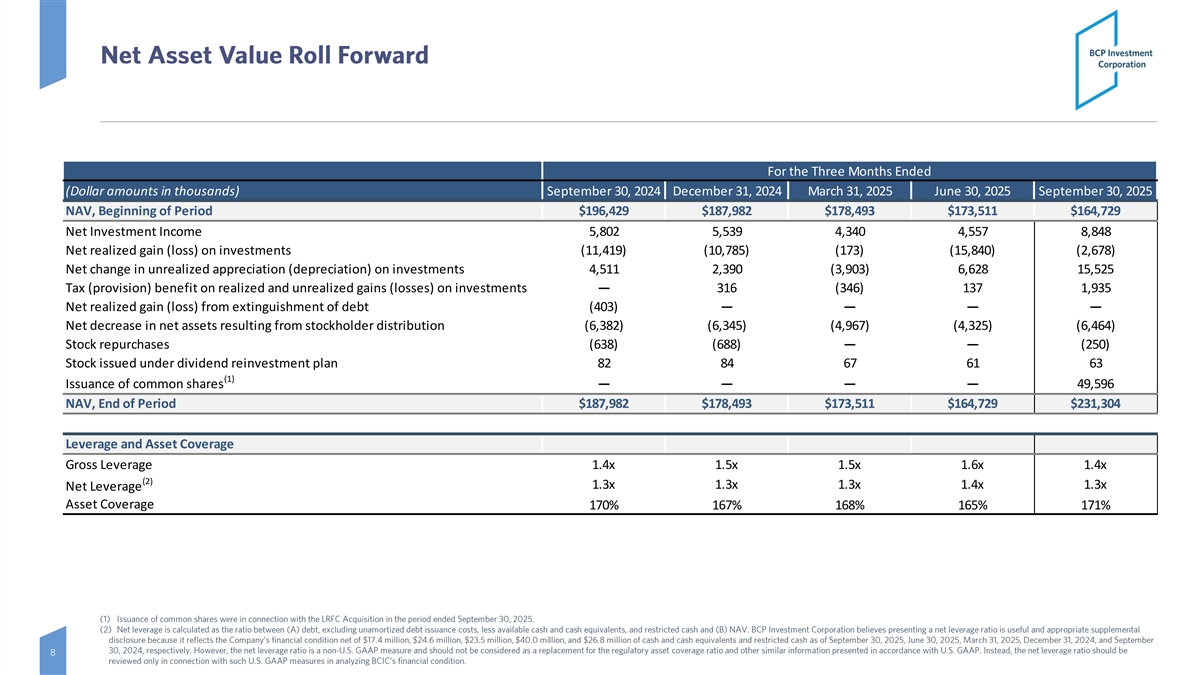
For the Three Months Ended (Dollar amounts in thousands) September 30, 2024 December 31, 2024 March 31, 2025 June 30, 2025 September 30, 2025 NAV, Beginning of Period $196,429 $187,982 $178,493 $173,511 $164,729 Net Investment Income 5,802 5,539 4,340 4,557 8,848 Net realized gain (loss) on investments (11,419) (10,785) (173) (15,840) (2,678) Net change in unrealized appreciation (depreciation) on investments 4,511 2,390 (3,903) 6,628 15,525 Tax (provision) benefit on realized and unrealized gains (losses) on investments— 316 (346) 137 1,935 Net realized gain (loss) from extinguishment of debt (403)———— Net decrease in net assets resulting from stockholder distribution (6,382) (6,345) (4,967) (4,325) (6,464) Stock repurchases (638) (688)—— (250) Stock issued under dividend reinvestment plan 82 84 67 61 63 (1) Issuance of common shares———— 49,596 NAV, End of Period $187,982 $178,493 $173,511 $164,729 $231,304 Leverage and Asset Coverage Gross Leverage 1.4x 1.5x 1.5x 1.6x 1.4x (2) 1.3x 1.3x 1.3x 1.4x 1.3x Net Leverage Asset Coverage 170% 167% 168% 165% 171%
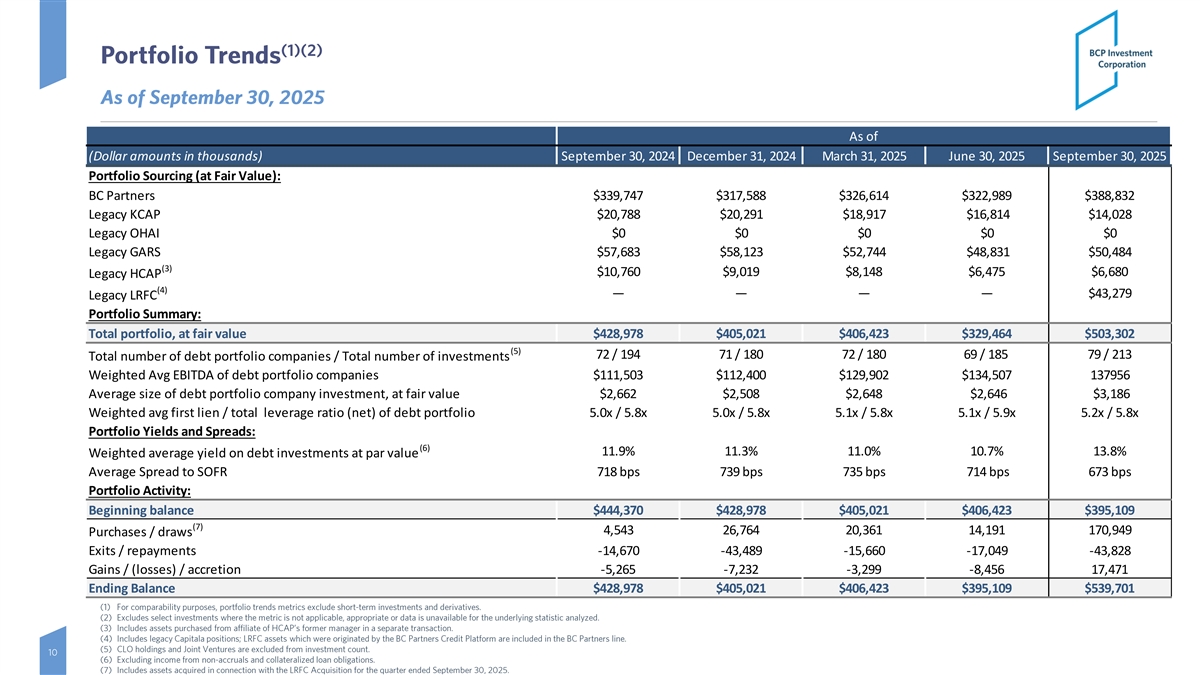
As of (Dollar amounts in thousands) September 30, 2024 December 31, 2024 March 31, 2025 June 30, 2025 September 30, 2025 Portfolio Sourcing (at Fair Value): BC Partners $339,747 $317,588 $326,614 $322,989 $388,832 Legacy KCAP $20,788 $20,291 $18,917 $16,814 $14,028 Legacy OHAI $0 $0 $0 $0 $0 Legacy GARS $57,683 $58,123 $52,744 $48,831 $50,484 (3) $10,760 $9,019 $8,148 $6,475 $6,680 Legacy HCAP (4) ———— $43,279 Legacy LRFC Portfolio Summary: Total portfolio, at fair value $428,978 $405,021 $406,423 $329,464 $503,302 (5) 72 / 194 71 / 180 72 / 180 69 / 185 79 / 213 Total number of debt portfolio companies / Total number of investments Weighted Avg EBITDA of debt portfolio companies $111,503 $112,400 $129,902 $134,507 137956 Average size of debt portfolio company investment, at fair value $2,662 $2,508 $2,648 $2,646 $3,186 Weighted avg first lien / total leverage ratio (net) of debt portfolio 5.0x / 5.8x 5.0x / 5.8x 5.1x / 5.8x 5.1x / 5.9x 5.2x / 5.8x Portfolio Yields and Spreads: (6) 11.9% 11.3% 11.0% 10.7% 13.8% Weighted average yield on debt investments at par value Average Spread to SOFR 718 bps 739 bps 735 bps 714 bps 673 bps Portfolio Activity: Beginning balance $444,370 $428,978 $405,021 $406,423 $395,109 (7) 4,543 26,764 20,361 14,191 170,949 Purchases / draws Exits / repayments -14,670 -43,489 -15,660 -17,049 -43,828 Gains / (losses) / accretion -5,265 -7,232 -3,299 -8,456 17,471 Ending Balance $428,978 $405,021 $406,423 $395,109 $539,701

Appendix
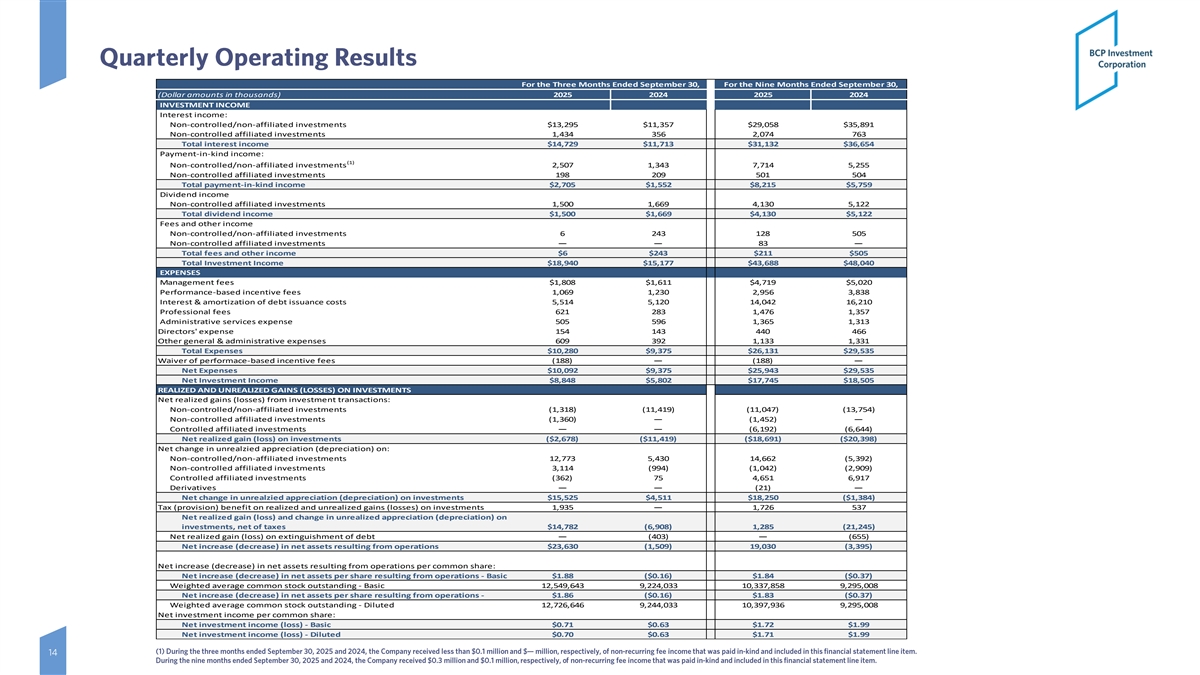
For the Three Months Ended September 30, For the Nine Months Ended September 30, (Dollar amounts in thousands) 2025 2024 2025 2024 INVESTMENT INCOME Interest income: Non-controlled/non-affiliated investments $13,295 $11,357 $29,058 $35,891 Non-controlled affiliated investments 1,434 356 2,074 763 Total interest income $14,729 $11,713 $31,132 $36,654 Payment-in-kind income: (1) Non-controlled/non-affiliated investments 2,507 1,343 7,714 5,255 Non-controlled affiliated investments 198 209 501 504 Total payment-in-kind income $2,705 $1,552 $8,215 $5,759 Dividend income Non-controlled affiliated investments 1,500 1,669 4,130 5,122 Total dividend income $1,500 $1,669 $4,130 $5,122 Fees and other income Non-controlled/non-affiliated investments 6 243 128 505 Non-controlled affiliated investments—— 83 — Total fees and other income $6 $243 $211 $505 Total Investment Income $18,940 $15,177 $43,688 $48,040 EXPENSES Management fees $1,808 $1,611 $4,719 $5,020 Performance-based incentive fees 1,069 1,230 2,956 3,838 Interest & amortization of debt issuance costs 5,514 5,120 14,042 16,210 Professional fees 621 283 1,476 1,357 Administrative services expense 505 596 1,365 1,313 Directors' expense 154 143 440 466 Other general & administrative expenses 609 392 1,133 1,331 Total Expenses $10,280 $9,375 $26,131 $29,535 Waiver of performace-based incentive fees (188)— (188)— Net Expenses $10,092 $9,375 $25,943 $29,535 Net Investment Income $8,848 $5,802 $17,745 $18,505 REALIZED AND UNREALIZED GAINS (LOSSES) ON INVESTMENTS Net realized gains (losses) from investment transactions: Non-controlled/non-affiliated investments (1,318) (11,419) (11,047) (13,754) Non-controlled affiliated investments (1,360)— (1,452)— Controlled affiliated investments—— (6,192) (6,644) Net realized gain (loss) on investments ($2,678) ($11,419) ($18,691) ($20,398) Net change in unrealzied appreciation (depreciation) on: Non-controlled/non-affiliated investments 12,773 5,430 14,662 (5,392) Non-controlled affiliated investments 3,114 (994) (1,042) (2,909) Controlled affiliated investments (362) 75 4,651 6,917 Derivatives—— (21)— Net change in unrealzied appreciation (depreciation) on investments $15,525 $4,511 $18,250 ($1,384) Tax (provision) benefit on realized and unrealized gains (losses) on investments 1,935 — 1,726 537 Net realized gain (loss) and change in unrealized appreciation (depreciation) on investments, net of taxes $14,782 (6,908) 1,285 (21,245) Net realized gain (loss) on extinguishment of debt— (403)— (655) Net increase (decrease) in net assets resulting from operations $23,630 (1,509) 19,030 (3,395) Net increase (decrease) in net assets resulting from operations per common share: Net increase (decrease) in net assets per share resulting from operations - Basic $1.88 ($0.16) $1.84 ($0.37) Weighted average common stock outstanding - Basic 12,549,643 9,224,033 10,337,858 9,295,008 Net increase (decrease) in net assets per share resulting from operations - $1.86 ($0.16) $1.83 ($0.37) Weighted average common stock outstanding - Diluted 12,726,646 9,244,033 10,397,936 9,295,008 Net investment income per common share: Net investment income (loss) - Basic $0.71 $0.63 $1.72 $1.99 Net investment income (loss) - Diluted $0.70 $0.63 $1.71 $1.99
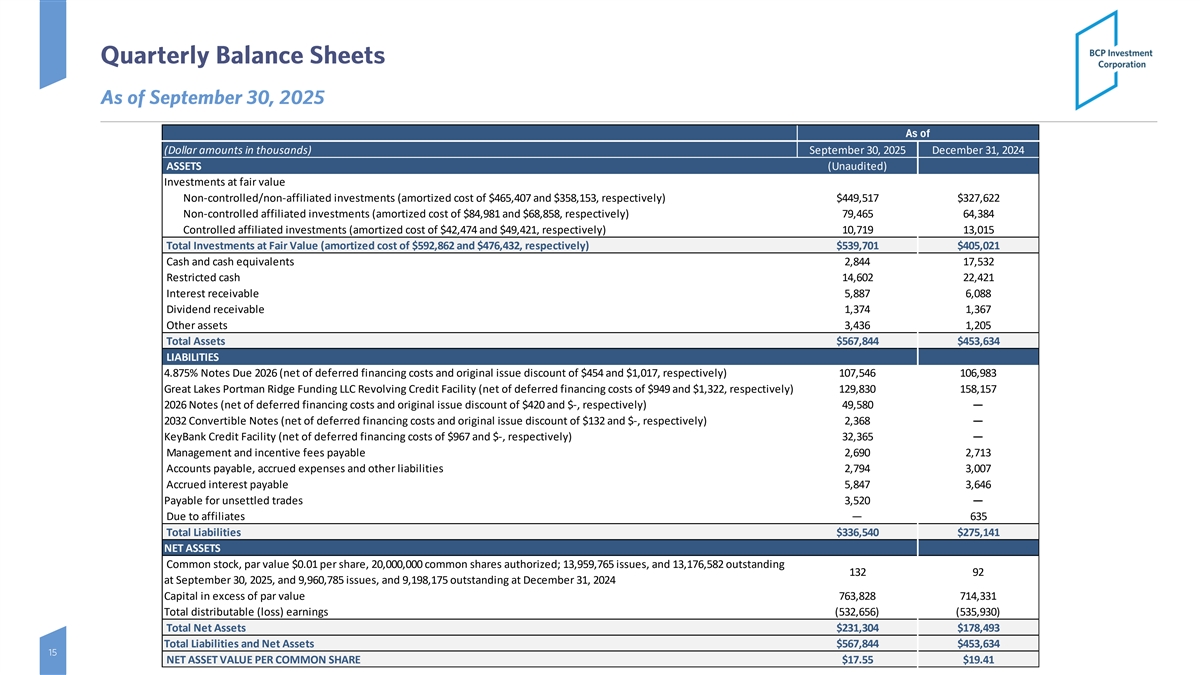
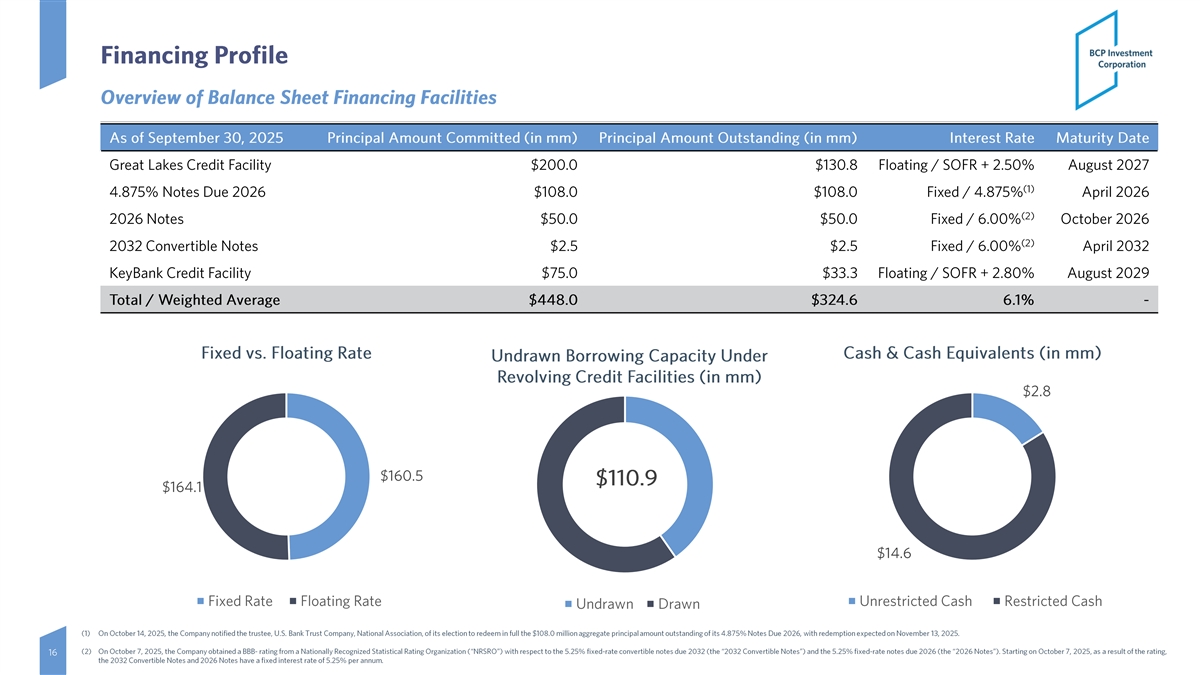
As of (Dollar amounts in thousands) September 30, 2025 December 31, 2024 ASSETS (Unaudited) Investments at fair value Non-controlled/non-affiliated investments (amortized cost of $465,407 and $358,153, respectively) $449,517 $327,622 Non-controlled affiliated investments (amortized cost of $84,981 and $68,858, respectively) 79,465 64,384 Controlled affiliated investments (amortized cost of $42,474 and $49,421, respectively) 10,719 13,015 Total Investments at Fair Value (amortized cost of $592,862 and $476,432, respectively) $539,701 $405,021 Cash and cash equivalents 2,844 17,532 Restricted cash 14,602 22,421 Interest receivable 5,887 6,088 Dividend receivable 1,374 1,367 Other assets 3,436 1,205 Total Assets $567,844 $453,634 LIABILITIES 4.875% Notes Due 2026 (net of deferred financing costs and original issue discount of $454 and $1,017, respectively) 107,546 106,983 Great Lakes Portman Ridge Funding LLC Revolving Credit Facility (net of deferred financing costs of $949 and $1,322, respectively) 129,830 158,157 2026 Notes (net of deferred financing costs and original issue discount of $420 and $-, respectively) 49,580— 2032 Convertible Notes (net of deferred financing costs and original issue discount of $132 and $-, respectively) 2,368— KeyBank Credit Facility (net of deferred financing costs of $967 and $-, respectively) 32,365— Management and incentive fees payable 2,690 2,713 Accounts payable, accrued expenses and other liabilities 2,794 3,007 Accrued interest payable 5,847 3,646 Payable for unsettled trades 3,520— Due to affiliates— 635 Total Liabilities $336,540 $275,141 NET ASSETS Common stock, par value $0.01 per share, 20,000,000 common shares authorized; 13,959,765 issues, and 13,176,582 outstanding 132 92 at September 30, 2025, and 9,960,785 issues, and 9,198,175 outstanding at December 31, 2024 Capital in excess of par value 763,828 714,331 Total distributable (loss) earnings (532,656) (535,930) Total Net Assets $231,304 $178,493 Total Liabilities and Net Assets $567,844 $453,634 NET ASSET VALUE PER COMMON SHARE $17.55 $19.41