
GALIANO GOLD INC.
MANAGEMENT'S DISCUSSION AND ANALYSIS
For the years ended December 31, 2023 and 2022
(Expressed in United States dollars)
TABLE OF CONTENTS
|
GALIANO GOLD INC. MANAGEMENT'S DISCUSSION AND ANALYSIS FOR THE YEARS ENDED DECEMBER 31, 2023 AND 2022 |
This Management's Discussion and Analysis ("MD&A") of Galiano Gold Inc. ("Galiano" or the "Company") has been prepared by management as of February 16, 2024 and should be read in conjunction with the Company's audited consolidated annual financial statements, and the notes thereto, for the years ended December 31, 2023 and 2022, which were prepared in accordance with International Financial Reporting Standards ("IFRS") as issued by the International Accounting Standards Board.
Galiano was incorporated on September 23, 1999, under the Business Corporations Act of British Columbia, Canada.
Additional information on the Company, including its most recent Annual Information Form ("AIF"), is available under the Company's SEDAR+ profile at www.sedarplus.ca and the Company's website: www.galianogold.com.
All dollar amounts herein are expressed in United States dollars ("US dollars") unless otherwise stated. References to $ means US dollars and C$ are to Canadian dollars.
This MD&A contains forward-looking statements and should be read in conjunction with the risk factors described in sections "12. Risks and uncertainties" and "15. Cautionary statements" at the end of this MD&A.
|
GALIANO GOLD INC. MANAGEMENT'S DISCUSSION AND ANALYSIS FOR THE YEARS ENDED DECEMBER 31, 2023 AND 2022 |
1. Fourth quarter and full year 2023 highlights
The Asanko Gold Mine ("the AGM") is a 50:50 joint venture ("JV") with Gold Fields Limited ("Gold Fields"), which is managed and operated by Galiano. Galiano owns a 45% equity interest in the entity that holds the AGM mining licenses.
1.1 Acquisition of Gold Fields' 45% interest in AGM JV
On December 21, 2023, the Company announced it had entered into a binding share purchase agreement (the "SPA") with subsidiaries of Gold Fields to acquire its 45% interest in the AGM JV (the "Acquisition"). The strategic rationale of the Acquisition is to consolidate ownership of the AGM, one of the largest gold mines in West Africa, and establish Galiano as a growing gold producer with robust financial strength. Upon closing of the Acquisition, the Company will own a 90% interest in the AGM with the Government of Ghana continuing to hold a 10% free-carried interest (non-controlling interest).
The Acquisition is expected to close in the first quarter of 2024, pending receipt of customary regulatory approvals in Ghana. Conditional approvals of the Toronto Stock Exchange (“TSX”) and the NYSE American (“NYSE American”) have been received as of the date of this MD&A. Refer to section 2.1(a) for details on consideration payable to Gold Fields.
1.2 Key Metrics of the AGM JV (on a 100% basis)
Safety: There were no lost-time injuries ("LTI") and one total recordable injury ("TRI") recorded during the fourth quarter, resulting in 12‐month rolling LTI and TRI frequency rates of 0.50 and 1.65 per million employee hours worked, respectively.
Production performance: Gold production of 31,947 ounces during the fourth quarter. 2023 annual gold production of 134,077 ounces, exceeding the top end of upward revised guidance of between 120,000 to 130,000 ounces.
Milling performance: Achieved mill throughput of 1.5 million tonnes (“Mt”) of ore at a grade of 0.8 grams per tonne (“g/t”) during the fourth quarter. Metallurgical recovery in Q4 2023 was 84%. Mill throughput for 2023 totaled 6.1 Mt, a new record for the AGM.
Cost performance: Total cash costs1 of $1,352 per gold ounce (“/oz”) and all-in sustaining costs1 (“AISC”) of $2,065/oz for the three months ended December 31, 2023. Full year 2023 AISC1 amounted to $1,522/oz, at the lower end of downward revised guidance of between $1,500/oz to $1,600/oz. Q4 2023 AISC1 was elevated as anticipated due to higher sustaining capital expenditures related to Abore waste stripping and implementation of a water treatment system at the tailings storage facility (“TSF”).
Cash flow generation: The JV generated positive cash flow from operations of $24.1 million and Free Cash Flow1 of $2.3 million during the fourth quarter. Full year 2023 Free Cash Flow1 totaled $48.4 million.
Financial performance: Gold revenue of $59.3 million generated from 30,555 gold ounces sold at an average realized price of $1,942/oz during the fourth quarter. Net income of $3.7 million and Adjusted EBITDA1 of $9.0 million during the fourth quarter.
Restart of mining: Hard rock mining operations at the AGM restarted on October 1, 2023, with waste stripping activities ongoing. The Abore pit remains on track to deliver higher grade ore to the processing plant, as compared to the current stockpile processing, in Q2 2024.
Exploration focus: Infill drilling at Abore, designed to convert inferred Mineral Resources to the indicated Mineral Resource category, and early stage drill testing at the Gyagyatreso prospect were completed. Other 2023 exploration programs included drilling at Midras South to advance the deposit towards a potential maiden Mineral Reserve estimate, and at Nkran to support potential Mineral Resource upgrades. Preliminary exploration work was also undertaken across the AGM’s regional greenfields targets – with focus on the Aburi and Sky Gold concessions.
Robust liquidity: $138.7 million in cash and cash equivalents, $5.7 million in gold sales receivables, $5.1 million in gold on hand and no debt as of December 31, 2023.
__________________________________________
1 See "8. Non-IFRS measures"
|
GALIANO GOLD INC. MANAGEMENT'S DISCUSSION AND ANALYSIS FOR THE YEARS ENDED DECEMBER 31, 2023 AND 2022 |
1.3 Highlights of the Company
Consolidation of AGM JV: On December 21, 2023, the Company announced the execution of the SPA to acquire Gold Fields’ 45% interest in the AGM JV.
Stable balance sheet: Cash and cash equivalents of $55.3 million as at December 31, 2023 and no debt.
Earnings: Net loss of $5.8 million or $0.03 per common share during the fourth quarter, which includes the Company’s share of the JV’s net earnings for the quarter and a downward fair value adjustment on the Company’s preferred shares in the JV.
2. Business overview
As of the date of this MD&A, Galiano owns a 45% equity interest in the entity that holds the AGM mining licenses and gold exploration tenements and a 50% equity interest in an exploration entity (collectively the "joint venture" or "JV") on the Asankrangwa Gold Belt in the Republic of Ghana ("Ghana"), West Africa. Galiano is the operator of the JV and currently receives a gross annual service fee from the JV of $7.3 million. Gold Fields also owns a 45% equity interest in the AGM, with the Government of Ghana owning a 10% free-carried interest.
The AGM consists of four main open-pit mining areas: Abore, Miradani North, Nkran and Esaase, multiple satellite deposits and a carbon-in-leach ("CIL") processing plant, with a current capacity of 5.8 Mt per annum.
In addition to its interest in the AGM, the Company holds the 100% owned Asumura property in Ghana.
Galiano is focused on creating a sustainable business capable of value creation for all stakeholders through production, exploration, accretive business acquisitions and disciplined deployment of its financial resources. The Company's shares are listed on TSX and the NYSE American under the symbol "GAU".
2.1 Key business developments in 2023
a) Acquisition of Gold Fields' 45% interest in AGM JV
The Company announced on December 21, 2023 it had entered into a binding SPA with Gold Fields to acquire its 45% interest in the AGM JV, increasing Galiano's equity interest in the AGM to 90%. Under the terms of the SPA, total consideration payable to Gold Fields will comprise the following:
$65.0 million cash payment on closing of the Acquisition, equivalent to Gold Fields' effective interest in the cash balance at the JV;
the issuance of 28.5 million common shares of the Company on closing of the Acquisition, resulting in Gold Fields owning approximately 19.9% of the Company's issued and outstanding common shares;
$55.0 million of deferred consideration comprised of a:
$25.0 million cash payment on or before December 31, 2025; and
$30.0 million cash payment on or before December 31, 2026 (collectively "Deferred Consideration").
The Deferred Consideration is to be paid in cash subject to the Company's right to satisfy up to 20% of each payment with common shares, subject to Gold Fields not owning more than 19.9% of the Company's issued and outstanding common shares at that time; and
Gold Fields will also receive a 1% net smelter return royalty (the "Nkran Royalty") on production from the Nkran deposit beginning upon 100,000 gold ounces being produced, and subject to a maximum of 447,000 gold ounces of production. Galiano has a right of first refusal on any full or partial disposition of the Nkran Royalty by Gold Fields.
|
GALIANO GOLD INC. MANAGEMENT'S DISCUSSION AND ANALYSIS FOR THE YEARS ENDED DECEMBER 31, 2023 AND 2022 |
Upon closing of the Acquisition, Galiano will enter into an amended investor rights agreement with Gold Fields, which includes a 12-month standstill period and other customary rights, including a pre-emptive right for Gold Fields to maintain its ownership interest as at closing of the Acquisition.
The Acquisition is not subject to shareholder votes, but is subject to various closing conditions, including receipt of all required regulatory approvals in North America and Ghana, which includes the approvals of the TSX and NYSE American (conditional approvals received as of the date of this MD&A). The Acquisition is expected to close in the first quarter of 2024.
b) Mining restart at the AGM
The AGM recommenced mining operations on October 1, 2023 in accordance with the life-of-mine (“LOM”) plan. Waste stripping activities at Abore are ongoing and the deposit is scheduled to deliver higher grade mill feed, as compared to the current stockpile processing, in the second quarter of 2024.
As Esaase was previously mined from 2018 to 2022, all infrastructure and permits are in place to allow a restart of mining when planned.
c) Changes to Board and Management
Gordon Fretwell did not stand for re‐election at the Company's Annual General Meeting and as such resigned as a director of the Company effective June 1, 2023.
On April 1, 2023, Krista Muhr joined the Company as Senior Vice President, Investor Relations. Mrs. Muhr brings 20 years of experience working with public companies in the global metals and mining sector with strong ESG (as defined herein) and capital market credentials at senior levels.
2.2 Updated NI 43-101 Technical Report
The Company published the details of a new LOM plan for the AGM on March 28, 2023 in a National Instrument 43-101 ("NI 43-101") technical report titled "NI 43‐101 Technical Report and Feasibility Study for Asanko Gold Mine, Ghana" with an effective date of December 31, 2022 (the "2023 Technical Report"), which included the reinstatement of Mineral Reserves and demonstrated an improved long-term outlook for the mine. The 2023 Technical Report was prepared independently by SRK Consulting (Canada) Inc. Highlights of the 2023 Technical Report, on a 100% basis, include:
Proven Mineral Reserves of 7.2 Mt at 0.67 g/t for 0.2 million ounces ("Moz") gold contained and Probable Mineral Reserves of 41.7 Mt at 1.43 g/t for 1.9 Moz gold contained. Mineral Reserves were reported assuming a gold price of $1,500/oz.
Measured Mineral Resources of 7.4 Mt at 0.67 g/t for 0.2 Moz gold contained and Indicated Mineral Resources of 75.0 Mt at 1.39 g/t for 3.3 Moz gold contained, inclusive of Mineral Reserves. Mineral Resources were reported assuming a gold price of $1,800/oz.
Inferred Mineral Resources of 25.1 Mt at 1.34 g/t for 1.1 Moz gold contained.
21% increase in total Measured and Indicated ounces and a 251% increase in total inferred ounces compared to the previous technical report dated February 28, 2022.
Robust mine economics with a $343 million after-tax net present value discounted at 5% ("NPV5%") and a $478 million pre-tax NPV5%, applying a $1,700/oz gold price.
Low cash costs: $905/oz average total cash costs1 and $1,143/oz average AISC1 over the LOM.
Increased production profile: annual average gold production of 254,000 ounces from 2025 to 2030, inclusive, and LOM average annual production of 217,000 ounces per year.
|
GALIANO GOLD INC. MANAGEMENT'S DISCUSSION AND ANALYSIS FOR THE YEARS ENDED DECEMBER 31, 2023 AND 2022 |
For further information regarding the Mineral Reserve and Mineral Resource estimates and to review scientific and technical information contained in the 2023 Technical Report, readers are encouraged to read the entire 2023 Technical Report found under the Company's SEDAR+ profile at www.sedarplus.ca.
|
GALIANO GOLD INC. MANAGEMENT'S DISCUSSION AND ANALYSIS FOR THE YEARS ENDED DECEMBER 31, 2023 AND 2022 |
2.3 Financial and operating highlights
| Three months ended December 31, | Year ended December 31, | |||||||||||
| (All amounts in 000's of US dollars, unless otherwise stated) | 2023 | 2022 | 2023 | 2022 | ||||||||
| Galiano Gold Inc. | ||||||||||||
| Net (loss) income | (5,758 | ) | 28,500 | 26,085 | 40,809 | |||||||
| Adjusted EBITDA1 | 98 | 8,169 | 26,754 | 28,827 | ||||||||
| Cash and cash equivalents | 55,270 | 56,111 | 55,270 | 56,111 | ||||||||
| Asanko Gold Mine (100% basis) | ||||||||||||
| Financial results | ||||||||||||
| Revenue | 59,514 | 57,808 | 256,543 | 297,136 | ||||||||
| Income from mine operations | 8,675 | 19,167 | 81,483 | 71,653 | ||||||||
| Net income | 3,664 | 83,712 | 69,940 | 103,223 | ||||||||
| Adjusted net income1 | 3,664 | 19,627 | 69,940 | 58,058 | ||||||||
| Adjusted EBITDA1 | 9,020 | 22,810 | 82,899 | 79,248 | ||||||||
| Cash and cash equivalents | 138,655 | 91,271 | 138,655 | 91,271 | ||||||||
| Cash generated from operating activities | 24,058 | 11,135 | 100,720 | 75,479 | ||||||||
| Free cash flow1 | 2,285 | 5,528 | 48,373 | 43,780 | ||||||||
| AISC margin1 | (3,758 | ) | 16,930 | 51,787 | 70,664 | |||||||
| Key mine performance data | ||||||||||||
| Gold produced (ounces) | 31,947 | 34,090 | 134,077 | 170,342 | ||||||||
| Gold sold (ounces) | 30,555 | 34,202 | 134,163 | 167,849 | ||||||||
| Average realized gold price ($/oz) | 1,942 | 1,686 | 1,908 | 1,767 | ||||||||
| Total cash costs ($ per gold ounce sold)1 | 1,352 | 1,031 | 1,148 | 1,157 | ||||||||
| AISC ($ per gold ounce sold)1 | 2,065 | 1,191 | 1,522 | 1,346 | ||||||||
|
GALIANO GOLD INC. MANAGEMENT'S DISCUSSION AND ANALYSIS FOR THE YEARS ENDED DECEMBER 31, 2023 AND 2022 |
2.4 Environmental, Social and Corporate Governance ("ESG")
Sustainability is at the core of the Company's business strategy. The Company believes that a comprehensive sustainability strategy is integral to meeting its strategic objectives in positively supporting relationships with its internal and external stakeholders, improve its risk management, reduce the AGM's cost of production and both directly and indirectly benefit the catchment communities that the Company operates in, beyond the life of the mine.
The Company implements its sustainability program with a focus on four key areas: (1) protecting human rights; (2) ensuring the occupational health and safety of employees and local communities; (3) advancing the socio-economic welfare and health of local catchment communities; and (4) managing environmental impacts of operations and exploration activities. For further details on the Company's sustainability program, refer to the Company's 2022 Sustainability Report (the "2022 Sustainability Report") published on July 27, 2023, which is available on the Company's website at www.galianogold.com. The disclosures and metrics of the 2022 Sustainability Report align with international reporting standards including the Global Reporting Initiative and the Metals and Mining Standards of the Sustainability Accounting Standards Board.
In May 2023, the Canadian Parliament passed Bill S-211, an act to enact the Fighting Against Forced Labour and Child Labour in Supply Chains Act and to amend the Customs Tariff. This will require Canadian companies to annually report on the due diligence steps they are taking to both identify and address labour risks in their supply chain. The Company has determined that it meets the criteria to adhere to these reporting requirements and will provide a detailed report and respond to a questionnaire on measures it has taken to identify, address, and prevent forced labour, prison labour, and child labour in its supply chain. The Company intends to submit its report and the questionnaire by no later than May 31, 2024, to the Minister of Public Safety and Emergency Preparedness.
In June 2023, the International Sustainability Standards Board ("ISSB") released its inaugural IFRS Sustainability Disclosure Standards, specifically IFRS S1 "General Requirements for Disclosure of Sustainability-related Financial Information" and IFRS S2 "Climate-related Disclosures", the purpose of which is to standardize a single, global baseline of sustainability disclosures for capital markets. IFRS S1 provides a set of disclosure requirements designed to enable companies to communicate to investors about the sustainability-related risks and opportunities they face over the short, medium and long term. IFRS S2 sets out specific climate-related disclosures and is designed to be used in conjunction with IFRS S1. Both standards fully incorporate the recommendations of the Task Force on Climate-related Financial Disclosures ("TCFD"). IFRS S1 and IFRS S2 are effective for annual reporting periods beginning on or after January 1, 2024, with early adoption permitted.
Although the ISSB has issued IFRS S1 and IFRS S2, the standards are not currently mandated in Canada. The Canadian Securities Administrators are responsible for Canadian reporting issuer disclosure requirements. The Canadian Sustainability Standards Board (“CSSB”) was formed to review the final ISSB standards and consider their suitability for adoption in Canada. Consultation efforts by the CSSB are currently underway and decisions about adoption, including how effective dates are determined in Canada, will be part of the CSSB’s initial discussions.
In March 2022, the United States Securities and Exchange Commission ("SEC") announced plans to enhance and standardize climate-related disclosures for reporting issuers. The proposed disclosure rules would require reporting issuers to disclose both climate-related risks that are reasonably likely to have a material impact on their business, results of operations or financial condition, in addition to Scope 1, Scope 2, and certain Scope 3 emissions. The SEC has yet to finalize its ESG disclosure rules for reporting issuers. It is not yet clear how the SEC's ESG disclosure rules will interact with Canadian standards.
During 2023, the Company advanced its development of Climate-Related Financial Disclosures with the completion of an assessment of our alignment with the TCFD recommendations. The Company is currently evaluating how the ISSB's sustainability disclosure standards will impact its disclosure obligations.
|
GALIANO GOLD INC. MANAGEMENT'S DISCUSSION AND ANALYSIS FOR THE YEARS ENDED DECEMBER 31, 2023 AND 2022 |
2.5 Macroeconomic factors
During the three months ended December 31, 2023, the average London PM gold price was $1,972/oz, while gold prices traded in a range from $1,810/oz to $2,149/oz. With inflation readings in the US declining from prior year benchmarks, market participants (CME Group) forecast that the US Federal Reverse will begin cutting its overnight lending rate in 2024. In response to this market view, the yield on US 10-year Treasuries moved significantly lower from a high of 5.02% on October 23, 2023 to 3.87% on December 29, 2023. Concurrently, the US dollar displayed weakness during this period relative to most major global currencies as future interest rate cuts generally indicate less demand for US dollars. It is largely viewed that a weaker US dollar is a positive for gold prices.
Gold prices trading near all-time highs benefitted the JV's operating performance during the quarter, and consequently the Company's share of the JV's net income. Management continues to implement and evaluate opportunities to hedge the JV's gold price risk, particularly in light of capital expenditures expected during the periods following the restart of mining operations.
In October 2023, the International Monetary Fund ("IMF") and the Ghana government reached a staff-level agreement on the first review of its $3 billion financing arrangement over a 3-year period (the "IMF Loan"). The first tranche of the IMF loan totaling $600 million was paid in May 2023, and a second tranche of $600 million was approved in January 2024 following a debt restructuring plan between Ghana and its creditors.
3. Guidance and outlook
3.1 2023 Guidance for the AGM JV (100% basis)
During the year ended December 31, 2023, the AGM produced 134,077 ounces of gold, exceeding the upper end of revised production guidance of between 120,000 to 130,000 ounces of gold (originally 100,000 to 120,000 ounces and revised upwards to 120,000 to 130,000 ounces in Q2 2023).
Full year 2023 AISC1 amounted to $1,522/oz, in line with revised cost guidance of between $1,500/oz to $1,600/oz (originally $1,900/oz to $1,975/oz, revised downward to between $1,650/oz to $1,750/oz in Q1 2023 and further revised downward to between $1,500/oz to $1,600/oz in Q3 2023). As highlighted in the 2023 Technical Report, AISC1 was elevated in 2023 compared to the expected LOM average primarily due to waste stripping necessary to recommence mining, beginning at Abore, which will benefit future years production, as well as higher expenditures on the TSF.
Sustaining capital expenditure for 2023 amounted to $31.0 million (excluding capitalized waste stripping at Abore), which was lower than revised guidance of $37 million (originally $38 million and revised to $43 million in Q2 2023 and again to $37 million in Q3 2023). Sustaining capital was lower than guidance due to timing of completion of a TSF lift and implementation of a water treatment system at the TSF. Capitalized waste stripping costs at Abore totaled $10.9 million in 2023 compared to revised guidance of $13 million. Waste stripping activities at Abore were impacted by slower than expected contractor mobilization and heavier precipitation during Ghana's rainy season; however, Abore is still on track to deliver higher grade ore, than the current stockpile processing, by the second quarter of 2024.
Development capital expenditure for 2023 amounted to $6.7 million, which was lower than revised guidance of $10 million (originally $24 million and revised to $17 million in Q2 2023 and again to $10 million in Q3 2023). Development capital was lower than guidance due to timing of site establishment activities at Miradani North.
Exploration spend for 2023 amounted to $14.1 million, largely in line with guidance of $15 million.
3.2 2024 Guidance for the AGM JV (100% basis)
The Company will provide guidance for its consolidated business after closing of the Acquisition.
__________________________________________
1 See "8. Non-IFRS measures"
|
GALIANO GOLD INC. MANAGEMENT'S DISCUSSION AND ANALYSIS FOR THE YEARS ENDED DECEMBER 31, 2023 AND 2022 |
4. Results of the AGM
All results of the AGM in this section are on a 100% basis, unless otherwise noted. For the three months and year ended December 31, 2023, the Company's attributable equity interest in the AGM was 45%.
4.1 Operating performance
The following table and subsequent discussion provide a summary of the operating performance of the AGM (on a 100% basis) for the three months and years ended December 31, 2023 and 2022, unless otherwise noted.
| Three months ended December 31, | Year ended December 31, | |||||||||||
| Key mine performance data of the AGM (100% basis) | 2023 | 2022 | 2023 | 2022 | ||||||||
| Mining | ||||||||||||
| Ore tonnes mined (000 t) | 22 | - | 22 | 1,894 | ||||||||
| Waste tonnes mined (000 t) | 3,415 | - | 3,415 | 6,706 | ||||||||
| Total tonnes mined (000 t) | 3,437 | - | 3,437 | 8,600 | ||||||||
| Strip ratio (waste:ore) | 155.2 | - | 155.2 | 3.5 | ||||||||
| Average gold grade mined (g/t) | 0.7 | - | 0.7 | 1.6 | ||||||||
| Mining cost ($/t mined) | 4.30 | - | 7.81 | 6.46 | ||||||||
| Ore transportation | ||||||||||||
| Ore tonnes trucked (000 t) | 657 | 503 | 3,448 | 3,414 | ||||||||
| Ore transportation cost ($/t trucked) | 6.54 | 6.19 | 6.01 | 6.12 | ||||||||
| Processing | ||||||||||||
| Tonnes milled (000 t) | 1,486 | 1,518 | 6,082 | 5,829 | ||||||||
| Average mill head grade (g/t) | 0.8 | 0.8 | 0.8 | 1.1 | ||||||||
| Average recovery rate (%) | 84% | 80% | 82% | 80% | ||||||||
| Processing cost ($/t milled) | 9.94 | 10.06 | 10.09 | 10.09 | ||||||||
| G&A costs ($/t milled)2 | 5.55 | 4.20 | 4.60 | 5.16 | ||||||||
| Gold produced (ounces) | 31,947 | 34,090 | 134,077 | 170,342 | ||||||||
| Gold sold (ounces) | 30,555 | 34,202 | 134,163 | 167,849 | ||||||||
| All-in sustaining costs1 | ||||||||||||
| AISC ($ per gold ounce sold)1 | 2,065 | 1,191 | 1,522 | 1,346 | ||||||||
| AISC margin ($ per gold ounce s old)1 | (123 | ) | 495 | 386 | 421 | |||||||
2 Excludes Galiano's service fee for the three months and years ended December 31, 2023 and 2022, and for the three months and year ended December 31, 2022 severance costs associated with the AGM's workforce restructuring.
a) Health and safety
There were no LTIs and one TRI reported during the quarter, and the rolling 12‐month LTI and TRI frequency rates were 0.50 and 1.65, respectively. The Company reports recordable LTI and TRI cases in accordance with the International Council on Mining and Metals' (ICMM) Mining Principles.
b) Mining
During the quarter, waste stripping activities at Abore commenced with 3.4 Mt of waste rock mined. Mining cost per tonne for the quarter amounted to $4.30 per tonne (“/t”). Mining cost per tonne for the year ended December 31, 2023 is higher than Q4 2023 due to the fact that certain mining overhead costs were incurred during the first nine months of 2023, however there were no associated tonnes mined.
|
GALIANO GOLD INC. MANAGEMENT'S DISCUSSION AND ANALYSIS FOR THE YEARS ENDED DECEMBER 31, 2023 AND 2022 |
c) Ore transportation
During the quarter, 0.7 Mt of stockpiled ore was trucked from the Esaase pit to the processing plant, moderately higher than the 0.5 Mt in Q4 2022. Total ore transportation costs in Q4 2023 were $6.54/t and higher than the comparative period due to higher diesel prices.
d) Processing
The AGM produced 31,947 ounces of gold during Q4 2023, as the processing plant achieved milling throughput of 1.5 Mt of ore at a grade of 0.8 g/t with metallurgical recovery averaging 84%. Recoveries continued to improve from 73% in Q1 2023, when the mill feed comprised predominately Esaase fresh ore, to 84% in Q4 2023 due to the composition of the feed blend processed having a higher percentage of oxide ore during the current quarter.
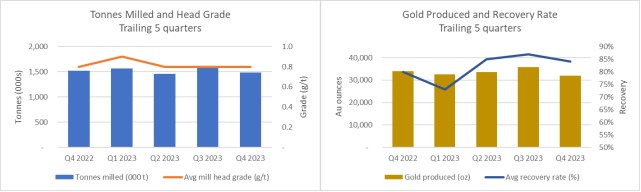
A portion of the low grade stockpiled ore processed during the quarter had no accounting book value, and as such had no mining cost attributed to it. Stockpiled ore fed to the processing plant during the quarter yielded ounces that were in line with expectations. The nature of stockpiled ore, however, can result in highly variably grades and metallurgical recoveries; therefore, the current quarter performance may not be indicative of future performance.
Processing cost per tonne for Q4 2023 was $9.94, in line with the $10.06 unit rate in Q4 2022, while on an absolute basis processing costs were largely unchanged quarter-on-quarter.
e) Total cash costs and AISC
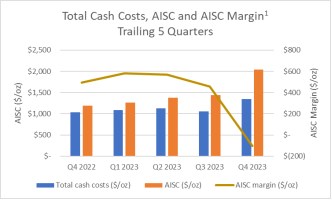
For the three months and year ended December 31, 2023, total cash costs1 were $1,352/oz and $1,148/oz, respectively, compared to the three months and year ended December 31, 2022 of $1,031/oz and $1,157/oz, respectively. Gold sales volumes decreased by 11% in Q4 2023, which had the effect of increasing fixed costs on a per ounce basis. Additionally, a portion of the mill feed during Q4 2023 included stockpiled ore which had a higher average cost, resulting in higher production costs. The AGM also recorded a $2.3 million provision against supplies inventory during Q4 2023, resulting in a $75/oz increase to total cash costs1.
|
GALIANO GOLD INC. MANAGEMENT'S DISCUSSION AND ANALYSIS FOR THE YEARS ENDED DECEMBER 31, 2023 AND 2022 |
Relative to Q3 2023, total cash costs1 were higher in Q4 2023, increasing by 28% from $1,056/oz to $1,352/oz. Total cash costs per ounce1 were higher in Q4 2023 primarily due to 14% fewer gold ounces sold as well as recording the aforementioned supplies inventory provision.
For the three months and year ended December 31, 2023, AlSC1 for the AGM amounted to $2,065/oz and $1,522/oz, respectively, compared to $1,191/oz and $1,346/oz in the comparative periods of 2022. The increase in AlSC1 from Q4 2022 to Q4 2023 was predominantly due to the increase in total cash costs per ounce1 described above, and higher sustaining capital expenditures ($504/oz increase) to support the restart of mining in Q4 2023 (including pre-stripping activities at Abore), implementation of a water treatment system and a TSF lift.
Relative to Q3 2023, AlSC1 increased by 43% from $1,445/oz to $2,065/oz. The increase in AISC1 was primarily due to the increase in total cash costs per ounce1 described above and higher sustaining capital expenditures ($293/oz increase) to support the restart of mining in Q4 2023 and implementation of a water treatment system.
For the three months and year ended December 31, 2023, the AGM incurred non-sustaining capital expenditures and exploration expenditures of $5.6 million and $20.8 million, respectively, compared to $3.0 million and $16.8 million during the comparative periods in 2022. Non-sustaining capital expenditures and exploration expenditures during Q4 2023 related primarily to Abore site preparations, Abore Mineral Resource conversion drilling and work performed on various greenfield exploration targets.
4.2 Exploration update
The JV holds a district-scale land package of 476km2 on the prospective and underexplored Asankrangwa Gold Belt. The following exploration programs were undertaken during the year to evaluate the current and potential expanded mineralization of several of the AGM's deposits to improve the Mineral Resource estimate and to assess the broader potential of these deposits. Additionally, work was undertaken to identify new growth targets across the wider regional AGM tenements.
Based on the positive results reported in the Company's news release dated October 25, 2023, the Company has confirmed the primary mineralized zones at Nkran are contiguous and remain open at the southern end of the deposit. The mineralized zones currently extend up to 185m immediately along strike to the south of the proposed Nkran Cut 3 pit shell. Drilling highlights from the Nkran South program included the following:
Refer to the Company's news release dated October 25, 2023 for additional information regarding these drill results, including data verification and quality assurance and quality control measures.
Early results returned strong intercepts outside the current reserve pit shell including 36m @ 2.1 g/t gold from 278m and 21m @ 2.6 g/t gold from 226m, highlighting potential pit expansion opportunities. Refer to the Company's news release dated October 25, 2023 for additional information regarding these drill results, including data verification and quality assurance and quality control measures.
|
GALIANO GOLD INC. MANAGEMENT'S DISCUSSION AND ANALYSIS FOR THE YEARS ENDED DECEMBER 31, 2023 AND 2022 |
Drilling highlights from the Midras South program included the following:
Refer to the Company's news release dated October 25, 2023 for additional information regarding these drill results, including data verification and quality assurance and quality control measures.
Drilling highlights from the Gyagyatreso program included the following:
Drill results received to date demonstrate that mineralization is present over at least 2 kilometers of strike length. The full extent of the surficial geochemical anomaly has not yet been tested and mineralization remains open along strike to the southwest and northeast. Refer to the Company's news release dated October 25, 2023 for additional information regarding these drill results, including data verification and quality assurance and quality control measures.
Akwasiso - a drill program has been planned to evaluate the underground potential of the Akwasiso deposit. The program consists of 4 deep holes totaling approximately 2,500m which was completed as planned during the quarter. Results of the drilling have better delineated the shape of the Akwasiso intrusive at depth and will be used to evaluate future opportunities.
Kaniago West - Drilling at Kaniago West is aimed at evaluating the strike and depth extent of the deposit in order to assess potential economic viability. As of December 31, 2023, 17 holes have been completed for 5,204m. Modeling of these results will be conducted in 2024 in order to assess the viability of a potential resource at Kaniago West.
In addition to the drill programs above, the JV also initiated geophysical surveys and soil sampling programs on several regional greenfield targets across the AGM's tenements with an objective of identifying new potential drill targets. Highlights of this work include the identification of significant surficial geochemical targets at the Sky Gold B and Aburi concessions, where follow up work and potential drill testing is planned for 2024.
Refer to the Company's news release dated October 25, 2023 for additional information regarding these soil survey results.
|
GALIANO GOLD INC. MANAGEMENT'S DISCUSSION AND ANALYSIS FOR THE YEARS ENDED DECEMBER 31, 2023 AND 2022 |
4.3 Financial results
The following table presents excerpts of the financial results of the JV for the three months and years ended December 31, 2023 and 2022. These results are presented on a 100% basis.
Three months and years ended December 31, 2023 and 2022
| Three months ended December 31, | Year ended December 31, | |||||||||||
| 2023 | 2022 | 2023 | 2022 | |||||||||
| (in thousands of US dollars) | $ | $ | $ | $ | ||||||||
| Revenue | 59,514 | 57,808 | 256,543 | 297,136 | ||||||||
| Cost of sales: | ||||||||||||
| Production costs | (42,900 | ) | (32,518 | ) | (146,805 | ) | (179,849 | ) | ||||
| Depreciation and depletion | (4,350 | ) | (3,222 | ) | (13,613 | ) | (30,767 | ) | ||||
| Royalties | (3,589 | ) | (2,901 | ) | (14,642 | ) | (14,867 | ) | ||||
| Income from mine operations | 8,675 | 19,167 | 81,483 | 71,653 | ||||||||
| Impairment reversal on MPP&E | 63,200 | - | 63,200 | |||||||||
| Exploration and evaluation expenditures | (2,162 | ) | (1,188 | ) | (7,434 | ) | (10,536 | ) | ||||
| General and administrative expenses | (760 | ) | 504 | (2,732 | ) | (20,753 | ) | |||||
| Income from operations | 5,753 | 81,683 | 71,317 | 103,564 | ||||||||
| Finance expense | (3,226 | ) | (1,036 | ) | (5,589 | ) | (6,471 | ) | ||||
| Finance income | 1,381 | 567 | 4,602 | 801 | ||||||||
| Foreign exchange (loss ) gain | (244 | ) | 2,498 | (390 | ) | 5,329 | ||||||
| Net income for the period | 3,664 | 83,712 | 69,940 | 103,223 | ||||||||
| Adjusted net income for the period1 | 3,664 | 19,627 | 69,940 | 58,058 | ||||||||
| Average realized price per gold ounce sold ($/oz) | 1,942 | 1,686 | 1,908 | 1,767 | ||||||||
| Average London PM fix ($/oz) | 1,972 | 1,726 | 1,939 | 1,800 | ||||||||
| Gold sold (ounces) | 30,555 | 34,202 | 134,163 | 167,849 | ||||||||
1 Non-IFRS measure. Adjusted net income as presented in the table was derived by adjusting the net income of the JV for the three months and year ended December 31, 2022 by the $18.0 million severance provision associated with restructuring the AGM's workforce, as well as for the impairment reversal recorded on MPP&E in Q4 2022.
a) Revenue
During Q4 2023, the AGM sold 30,555 ounces of gold at an average realized gold price of $1,942/oz for total revenue of $59.5 million (including $0.2 million of by-product silver revenue). During Q4 2022, the AGM sold 34,202 ounces of gold at an average realized gold price of $1,686/oz for total revenue of $57.8 million (including $0.1 million of by-product silver revenue). The increase in revenue quarter-on-quarter was due to a 15% increase in realized gold prices relative to Q4 2022, partly offset by an 11% reduction in sales volumes.
During the year ended December 31, 2023, the AGM sold 134,163 ounces of gold at an average realized gold price of $1,908/oz for total revenue of $256.5 million (including $0.6 million of by-product silver revenue). During the comparative period of 2022, the AGM sold 167,849 ounces of gold at an average realized gold price of $1,767/oz for total revenue of $297.1 million (including $0.6 million of by-product silver revenue). The decrease in revenue year-on-year was due to a 20% reduction in sales volumes, partly offset by an 8% increase in realized gold prices.
The AGM continues to sell all the gold it produces to a special purpose vehicle of Red Kite Opportunities Master Fund Limited ("Red Kite") under an offtake agreement (the "Offtake Agreement"). The terms of the Offtake Agreement require the AGM to sell 100% of its gold production up to a maximum of 2.2 million ounces to Red Kite. As of December 31, 2023, 1,601,268 gold ounces have been delivered to Red Kite under the Offtake Agreement (December 31, 2022 - 1,467,105 gold ounces delivered).
|
GALIANO GOLD INC. MANAGEMENT'S DISCUSSION AND ANALYSIS FOR THE YEARS ENDED DECEMBER 31, 2023 AND 2022 |
During the three months and year ended December 31, 2023, the AGM sold a portion of its production to the Bank of Ghana under the country's gold buying program. As agreed with Red Kite, gold ounces sold to the Bank of Ghana were considered delivered under the Offtake Agreement, and in consideration the AGM paid to Red Kite a "make whole" payment which was calculated in a similar manner to a nine‐day quotational period. The "make whole" payments made to Red Kite were recognized as a reduction of revenues.
b) Production costs and royalties
During the three months and year ended December 31, 2023, the AGM incurred production costs of $42.9 million and $146.8 million, respectively, compared to $32.5 million and $179.8 million in the comparative periods of 2022, respectively.
Production costs were higher in Q4 2023 primarily due to a portion of the mill feed including stockpiled ore which had a higher average cost, resulting in higher production costs. The AGM also recorded a $2.3 million provision against supplies inventory and a $5.0 million provision related to a contract dispute with a former mining contractor. These factors were partly offset by 11% fewer gold ounces sold in Q4 2023.
Production costs were lower in 2023 primarily due to 20% fewer gold ounces sold, lower mining contractor costs and processing ore that had no carrying value for accounting purposes. Labour costs were also lower in 2023 resulting from restructuring the AGM's workforce at the end of Q1 2022 ($4.8 million decrease). These factors were partly offset by inflationary pressures on key reagents and other consumables in 2023 and a $15.3 million reversal of previously recorded net realizable value adjustments on stockpile inventory in 2022, of which $11.0 million was credited against production costs.
The Ghanaian government charges a 5% royalty on revenues earned through sales of minerals from the AGM’s concessions. The AGM’s Akwasiso mining concession is also subject to a further 2% net smelter return royalty payable to the previous owner of the mineral tenement, and the Esaase concession is subject to a 0.5% net smelter return royalty payable to the Bonte Liquidation Committee. The Akwasiso and Esaase royalties are presented in production costs.
On April 3, 2023, the Government of Ghana imposed a special levy, the Growth and Sustainability Levy ("GSL"), on all companies operating in Ghana with an effective date of May 1, 2023. The purpose of the GSL is to support growth and fiscal sustainability of the Ghanaian economy. For mining companies in Ghana, the GSL is levied at a rate of 1% of gold revenues for the fiscal years 2023 to 2025. The JV has presented the 1% GSL as royalties expense in the Statement of Operations.
Royalties payable to the Government of Ghana are presented as a component of cost of sales and amounted to $3.6 million and $14.6 million for the three months and year ended December 31, 2023, respectively (three months and year ended December 31, 2022 - $2.9 million and $14.9 million, respectively). Royalties expense was higher in Q4 2023 due to higher earned revenue and the introduction of the GSL in April 2023, while royalties expense was lower in 2023 due to lower revenue, partly offset by the GSL.
c) Depreciation and depletion
Depreciation and depletion on mineral properties, plant and equipment (“MPP&E”) recognized during Q4 2023 was $4.4 million compared to $3.2 million in Q4 2022. Depreciation and depletion expense was higher in Q4 2023 due to processing stockpiled ore that had a higher cost, higher depreciation on capitalized leases and a $63.2 million impairment reversal on MPP&E recorded at December 31, 2022. These factors were partly offset by fewer gold ounces sold in Q4 2023.
Depreciation and depletion on MPP&E recognized during the year ended December 31, 2023 was $13.6 million compared to $30.8 million in the comparative period of 2022. Depreciation and depletion expense was lower in 2023 due to fewer gold ounces sold; lower depreciation on mining related assets due to the temporary cessation of mining at the end of Q2 2022; processing existing stockpiles that had no carrying value for accounting purposes; and lower depreciation on capitalized leases. These factors were partly offset by the impairment reversal on MPP&E described above and recorded at December 31, 2022.
d) Exploration and evaluation ("E&E") expenditures
During the three months and year ended December 31, 2023, the AGM recorded E&E expenses of $2.2 million and $7.4 million, respectively, (see 4.2 "Exploration update") compared to $1.2 million and $10.5 million of E&E expenses in the comparative periods of 2022, respectively. E&E expenses during the quarter related to Midras South infill drilling, Gyagyatreso first-pass drilling, trenching greenfield targets and general overhead costs, and were higher in Q4 2023 relative to the comparative period due to timing of drilling campaigns. E&E expense was higher for the year ended December 31, 2022 as drilling programs were undertaken on several mining concessions to support the AGM's updated Mineral Reserve and Mineral Resource estimates.
|
GALIANO GOLD INC. MANAGEMENT'S DISCUSSION AND ANALYSIS FOR THE YEARS ENDED DECEMBER 31, 2023 AND 2022 |
e) General and administrative ("G&A") expenses
During the three months and year ended December 31, 2023, the AGM recorded G&A expenses of $0.8 million and $2.7 million, respectively, compared to a credit of $0.5 million and an expense of $20.8 million in the comparative periods of 2022, respectively.
The lower G&A expense in Q4 2022 was due to actual severance payouts associated with the AGM's workforce restructuring being less than previous estimates, resulting in the reversal of a portion of severance provisions. G&A expense was higher for the year ended December 31, 2022 due to the recognition of an $18.0 million severance provision related to the AGM's workforce restructuring undertaken at the end of Q1 2022. Notwithstanding the severance provision, G&A expenses in 2023 were comparable to 2022.
f) Finance expense
Finance expense for the three months and year ended December 31, 2023 was $3.2 million and $5.6 million, respectively, compared to $1.0 million and $6.5 million during the comparative periods of 2022, respectively. Finance expense was higher in Q4 2023 due to an unrealized loss on the AGM's zero cost gold collar ("ZCCs") hedges and higher interest expense on capitalized leases.
For the year ended December 31, 2023, finance expense was lower due to a $2.9 million provision related to a Ghana Revenue Authority ("GRA") audit recorded in Q3 2022. This was partly offset by 2023 including a $1.0 million unrealized loss on ZCCs hedges and higher interest expense on capitalized leases. All gold hedges for the period January to December 2023 expired unutilized. In 2022, the AGM did not have any gold hedging instruments.
g) Finance income
Finance income of $1.4 million and $4.6 million for the three months and year ended December 31, 2023, respectively, were higher than the comparative periods in 2022 due to higher interest rates earned on cash and short-term investments (maturities of 90 days or less).
h) Legal provision
A services provider of the AGM filed a dispute with an arbitration tribunal alleging the AGM breached the terms of a services agreement and claimed approximately $25 million in damages. The arbitrator ruled in favour of the AGM that there had not been a breach of any terms of the contract, yet made an award to the counterparty of approximately $13 million plus interest for services rendered. The AGM, consistent with the arbitration ruling, maintains the view that there was no breach of contract and all contractual amounts were paid as due. The AGM therefore is undertaking an appeals process in the Court of Appeal in Ghana. A provision of $7.0 million has been recorded as of December 31, 2023 as management's best estimate to settle the claim (December 31, 2022 - $2.0 million). While the Company cannot reasonably predict the ultimate outcome of these actions, and inherent uncertainties exist in predicting such outcomes, the Company believes the estimated provision is reasonable based on the information currently available.
|
GALIANO GOLD INC. MANAGEMENT'S DISCUSSION AND ANALYSIS FOR THE YEARS ENDED DECEMBER 31, 2023 AND 2022 |
4.4 Cash flows
The following table provides a summary of cash flows for the AGM on a 100% basis for the three months and years ended December 31, 2023 and 2022:
| Three months ended December 31, | Year ended December 31, | |||||||||||
| 2023 | 2022 | 2023 | 2022 | |||||||||
| (in thousands of US dollars) | $ | $ | $ | $ | ||||||||
| Cash provided by (used in): | ||||||||||||
| Operating activities | 24,058 | 11,135 | 100,720 | 75,479 | ||||||||
| Investing activities | (20,934 | ) | (5,099 | ) | (50,706 | ) | (16,452 | ) | ||||
| Financing activities | (1,236 | ) | (531 | ) | (2,209 | ) | (15,590 | ) | ||||
| Impact of foreign exchange on cash and cash equivalents | (93 | ) | (36 | ) | (421 | ) | (1,377 | ) | ||||
| Increase in cash and cash equivalents during the period | 1,795 | 5,469 | 47,384 | 42,060 | ||||||||
| Cash and cash equivalents, beginning of period | 136,860 | 85,802 | 91,271 | 49,211 | ||||||||
| Cash and cash equivalents, end of period | 138,655 | 91,271 | 138,655 | 91,271 | ||||||||
a) Cash flows from operating activities
The increase in operating cash flows during the three months and year ended December 31, 2023 was largely driven by higher realized gold prices and lower working capital tie-up.
b) Cash used in investing activities
During Q4 2023, the AGM invested $22.3 million in additions to MPP&E, compared to $5.7 million in Q4 2022, and earned $1.4 million of interest on cash balances. Total cash expenditure on MPP&E during the quarter included $18.8 million of sustaining capital related primarily to raising the height of the TSF, implementation of a water treatment system at the TSF and waste stripping at Abore. Development and exploration capital expenditure was $3.5 million primarily related to Abore site preparations and haul road diversions and Mineral Resource conversion drilling at Abore.
The increase in cash flows invested in MPP&E in Q4 2023 resulted from capital investments to execute the AGM’s LOM plan as outlined in the 2023 Technical Report, which included higher sustaining capital expenditures ($14.9 million increase) and higher development capital ($1.7 million increase) relative to Q4 2022.
During the year ended December 31, 2023, the AGM invested $55.3 million in additions to MPP&E, compared to $17.2 million in the comparative period of 2022, and earned $4.6 million of interest on cash balances. Total cash expenditure on MPP&E during 2023 included $41.9 million of sustaining capital related mainly to raising the height of the TSF, implementation of a water treatment system and waste stripping at Abore, and $13.4 million of development and exploration capital expenditure for site preparations and haul road construction at Abore, Nkran South extension drilling and Abore conversion and infill drilling.
The increase in cash flows invested in MPP&E in 2023 resulted from higher sustaining capital expenditures ($30.9 million increase) related to raising the height of the TSF, implementation of a water treatment system and waste stripping at Abore, and higher development and exploration capital ($7.2 million increase) related to drilling programs at Nkran South and Abore, and development activities to support a restart of mining at Abore.
c) Cash used in financing activities
For the three months ended December 31, 2023, cash used in financing activities related to lease payments on the JV's mining service contract as well as reclamation bond deposits.
For the year ended December 31, 2023, cash used in financing activities related to lease payments on the JV's mining service contract, fees associated with the JV's revolving credit facility ("RCF") and reclamation bond deposits.
The increase in cash used in financing activities during Q4 2023 relative to Q4 2022 was due to higher lease payments on mining contracts and payment of reclamation bond deposits.
|
GALIANO GOLD INC. MANAGEMENT'S DISCUSSION AND ANALYSIS FOR THE YEARS ENDED DECEMBER 31, 2023 AND 2022 |
The decrease in cash used in financing activities during the year ended December 31, 2023, relative to the comparative period, was due to the temporary cessation of mining activities in 2022 resulting in lower mining contractor lease payments in the current year.
d) Liquidity position
In October 2019, the JV entered into a $30.0 million RCF with Rand Merchant Bank ("RMB"). During the year ended December 31, 2022, the maturity date of the RCF was extended to September 30, 2023 (with utilization subject to credit review) and was subject to a facility maintenance fee of 0.70% per annum. The JV is currently in discussions with RMB to extend the term of the RCF.
As at December 31, 2023, the JV held cash and cash equivalents of $138.7 million, $5.7 million in gold sales receivables and $5.1 million in gold on hand. This compares to December 31, 2022 when the JV held $91.3 million in cash and cash equivalents, $2.7 million in receivables from gold sales and $3.6 million in gold on hand. The Company does not control the funds of the JV. The liquidity of the Company is further discussed in section "7. Liquidity and capital resources".
e) Gold price hedges
During the year ended December 31, 2023, the AGM entered into ZCCs to mitigate gold price risk during a period of elevated capital investment. All gold hedges in 2023 expired unutilized.
As of the date of this MD&A, the AGM has entered into ZCCs covering approximately 50% of the AGM's forecast gold production for the first half of 2024 with put strikes of $1,900/oz and call strikes between $2,097/oz to $2,173/oz. The January 2024 ZCCs expired unutilized.
|
GALIANO GOLD INC. MANAGEMENT'S DISCUSSION AND ANALYSIS FOR THE YEARS ENDED DECEMBER 31, 2023 AND 2022 |
5. Results of the Company
5.1 Financial performance
The following table is a summary of the Consolidated Statements of Operations and Comprehensive Income (Loss) of the Company for the three months ended December 31, 2023 and 2022 and the years ended December 31, 2023, 2022 and 2021.
| Three months ended December 31, | Year ended December 31, | ||||||||||||||
| 2023 | 2022 | 2023 | 2022 | 2021 | |||||||||||
| (in thousands of US dollars, except per share amounts) | $ | $ | $ | $ | $ | ||||||||||
| Share of net income related to joint venture | 1,728 | 46,517 | 31,670 | 46,517 | (51,528 | ) | |||||||||
| Service fee earned as operators of joint venture | 1,463 | 1,418 | 5,747 | 5,413 | 5,071 | ||||||||||
| General and administrative expenses | (5,419 | ) | (2,854 | ) | (15,286 | ) | (11,100 | ) | (13,477 | ) | |||||
| Exploration and evaluation expenditures | (43 | ) | (938 | ) | (2,009 | ) | (1,411 | ) | (642 | ) | |||||
| (Loss) income from operations and joint venture | (2,271 | ) | 44,143 | 20,122 | 39,419 | (60,576 | ) | ||||||||
| Impairment reversal (loss) on investment in joint venture | - | 7,631 | - | 7,631 | (7,631 | ) | |||||||||
| Impairment of exploration and evaluation assets | - | (1,628 | ) | - | (1,628 | ) | - | ||||||||
| Transaction costs | (378 | ) | - | (378 | ) | - | - | ||||||||
| Finance income | (3,163 | ) | (16,046 | ) | 6,255 | 1,036 | 257 | ||||||||
| Finance expense | (5 | ) | (5,623 | ) | (23 | ) | (5,647 | ) | (925 | ) | |||||
| Foreign exchange gain (loss) | 59 | 23 | 109 | (2 | ) | (8 | ) | ||||||||
| Net (loss) income and comprehensive (loss) income for the period | (5,758 | ) | 28,500 | 26,085 | 40,809 | (68,883 | ) | ||||||||
| Weighted average number of shares outstanding: | |||||||||||||||
| Basic | 224,955,192 | 224,943,453 | 224,946,412 | 224,943,453 | 224,729,084 | ||||||||||
| Diluted | 224,955,192 | 224,952,360 | 225,176,714 | 224,947,807 | 224,729,084 | ||||||||||
| Net (loss) income per share: | |||||||||||||||
| Basic | (0.03 | ) | 0.13 | 0.12 | 0.18 | (0.31 | ) | ||||||||
| Diluted | (0.03 | ) | 0.13 | 0.12 | 0.18 | (0.31 | ) | ||||||||
a) Share of net income related to the AGM JV
For the three months and year ended December 31, 2023, the Company recognized its 45% interest in the JV's net earnings which amounted to $1.7 million and $31.7 million, respectively, compared to $46.5 million in the comparative periods of 2022. The Company did not recognize its share of the JV's net income from Q1 2022 to Q3 2022 as the recoverable amount of the Company's investment in the JV was estimated to be nil at March 31, 2022, June 30, 2022 and September 30, 2022, which resulted in the amount recognized in Q4 2022 to be higher than normal.
b) Service fee earned as operators of the AGM JV
Under the terms of the Joint Venture Agreement ("JVA"), the Company is the operator of the AGM and, in consideration for managing the operations of the mine, currently receives a gross annual service fee from the JV of $7.3 million (originally $6.0 million per annum, but adjusted annually for inflation). For the three months and year ended December 31, 2023, the Company earned a gross service fee of $1.8 million (less withholding taxes payable in Ghana of $0.3 million) and $7.2 million (less withholding taxes payable in Ghana of $1.4 million), respectively.
During the three months and year ended December 31, 2022, the Company earned a gross service fee of $1.8 million (less withholding taxes of $0.4 million) and $6.8 million (less withholding taxes of $1.4 million), respectively. The increase in the gross service fee during 2023 was due to an annual inflationary adjustment made in Q3 2023.
|
GALIANO GOLD INC. MANAGEMENT'S DISCUSSION AND ANALYSIS FOR THE YEARS ENDED DECEMBER 31, 2023 AND 2022 |
c) G&A expenses
G&A expenses for the three months and years ended December 31, 2023 and 2022 comprised the following:
| Three months ended December 31, | Year ended December 31, | |||||||||||
| 2023 | 2022 | 2023 | 2022 | |||||||||
| (in thousands of US dollars) | $ | $ | $ | $ | ||||||||
| Wages, benefits and consulting | (1,753 | ) | (1,370 | ) | (6,276 | ) | (6,515 | ) | ||||
| Office, rent and administration | (274 | ) | (342 | ) | (1,316 | ) | (1,324 | ) | ||||
| Professional and legal | (76 | ) | (179 | ) | (458 | ) | (724 | ) | ||||
| Share-based compensation | (3,072 | ) | (751 | ) | (6,164 | ) | (1,646 | ) | ||||
| Travel, marketing, investor relations and regulatory | (208 | ) | (176 | ) | (929 | ) | (745 | ) | ||||
| Depreciation | (36 | ) | (36 | ) | (143 | ) | (146 | ) | ||||
| Total G&A expense | (5,419 | ) | (2,854 | ) | (15,286 | ) | (11,100 | ) | ||||
G&A expenses in Q4 2023 were $2.6 million higher than Q4 2022 primarily due to a $2.3 million increase in share-based compensation expense resulting from an increase in the fair value of cash‐settled long‐term incentive plan awards linked to the Company's share price. Wages and benefits were higher in Q4 2023 due to a higher accrual for short-term incentive compensation.
G&A expenses in 2023 were $4.2 million higher than 2022 mainly due to a $4.5 million increase in share-based compensation expense resulting from an increase in the fair value of cash‐settled long‐term incentive plan awards linked to the Company's share price and the vesting of the related awards over the year. Additionally, 2022 share‐based compensation expense was reduced by awards forfeited resulting from employee resignations. The increase in share-based compensation expense was partly offset by lower audit fees in 2023.
d) E&E expenditures
E&E expenses for the three months and year ended December 31, 2023 were $0.9 million lower and $0.6 million higher than the comparative periods in 2022, respectively. E&E expense was higher in 2023 due to a Phase 1 drilling campaign undertaken on the Company's wholly owned Asumura property in Ghana, which was initiated in Q4 2022 completed in the first half of 2023.
e) Finance income
Finance income includes changes in the fair value of the Company's preferred share investment in the JV and interest earned on cash and short-term investments with maturities less than 90 days. For the three months and year ended December 31, 2023, the Company recognized a $3.9 million downward and a $3.4 million upward fair value adjustment, respectively, on its preferred shares in the JV (three months and year ended December 31, 2022 - a $22.2 million downward fair value adjustment ($16.6 million through finance income and $5.6 million through finance expense) and a $5.6 million downward fair value adjustment through finance expense, respectively). The upward fair value adjustment on preferred shares in 2023 related to an earlier time period of expected cash distributions and a change in forecast timing of distributions.
Relative to the comparative periods in 2022, interest earned on cash balances and short-term investments was $0.2 million and $1.9 million higher during the three months and year ended December 31, 2023, respectively, due to rising interest rates.
|
GALIANO GOLD INC. MANAGEMENT'S DISCUSSION AND ANALYSIS FOR THE YEARS ENDED DECEMBER 31, 2023 AND 2022 |
6. Selected quarterly financial data
The following table provides a summary of unaudited financial data for the last eight quarters. Except for basic and diluted income (loss) per share, the totals in the following table are presented in thousands of US dollars.
| 2023 | 2022 | |||||||||||||||||
| Q4 | Q3 | Q2 | Q1 | Q4 | Q3 | Q2 | Q1 | |||||||||||
| $ | $ | $ | $ | $ | $ | $ | $ | |||||||||||
| Share of net income related to joint venture | 1,728 | 9,628 | 11,007 | 9,307 | 46,517 | - | - | - | ||||||||||
| Service fee earned as operators of joint venture | 1,463 | 1,448 | 1,418 | 1,418 | 1,418 | 1,381 | 1,307 | 1,307 | ||||||||||
| General and administrative expenses | (5,419 | ) | (2,869 | ) | (3,148 | ) | (3,850 | ) | (2,854 | ) | (3,490 | ) | (2,004 | ) | (2,752 | ) | ||
| Exploration and evaluation expenditures | (43 | ) | (81 | ) | (472 | ) | (1,413 | ) | (938 | ) | (281 | ) | (55 | ) | (137 | ) | ||
| (Loss) income from operations and joint venture | (2,271 | ) | 8,126 | 8,805 | 5,462 | 44,143 | (2,390 | ) | (752 | ) | (1,582 | ) | ||||||
| Impairment reversal on investment in joint venture | - | - | - | - | 7,631 | - | - | - | ||||||||||
| Impairment of exploration and evaluation assets | - | - | - | - | (1,628 | ) | - | - | - | |||||||||
| Other (expense) income | (3,487 | ) | 3,263 | 3,156 | 3,031 | (21,646 | ) | 3,670 | 13,318 | 45 | ||||||||
| Net (loss) income for the period | (5,758 | ) | 11,389 | 11,961 | 8,493 | 28,500 | 1,280 | 12,566 | (1,537 | ) | ||||||||
| Basic and diluted (loss) income per share | ($0.03 | ) | $0.05 | $0.05 | $0.04 | $0.13 | $0.01 | $0.06 | ($0.01 | ) | ||||||||
| Adjusted net (loss) income for the period1 | (5,758 | ) | 11,389 | 11,961 | 8,493 | (6,010 | ) | 1,280 | 12,566 | (1,537 | ) | |||||||
| Adjusted basic and diluted (loss) income per share1 | ($0.03 | ) | $0.05 | $0.05 | $0.04 | ($0.03 | ) | $0.01 | $0.06 | ($0.01 | ) | |||||||
| EBITDA1 | (2,554 | ) | 8,161 | 8,870 | 5,519 | 50,205 | (2,378 | ) | (727 | ) | (1,534 | ) | ||||||
The results of the Company are heavily influenced by its share of profits and losses related to the JV, which is directly related to the underlying performance of the AGM.
From Q1 2022 to Q3 2022, the Company did not recognize its share of the JV’s net earnings as the recoverable amount of the Company’s equity investment in the JV was estimated to be nil during those periods. Other income for Q2 2022 and Q3 2022 includes a $13.2 million and a $3.4 million positive fair value adjustment on the Company’s preferred shares in the JV, respectively, largely driven by strong operating performance resulting in improved working capital of the AGM.
During Q4 2022, as a result of the JV’s reinstatement of Mineral Reserves in the AGM’s 2023 Technical Report, the Company recommenced the recognition of its share of the JV’s net earnings and also recognized a $7.6 million impairment reversal on its equity investment in the JV, leading to a significant increase in net income over the prior quarters. Other expense in Q4 2022 includes a $22.2 million negative fair value adjustment on the Company’s preferred shares in the JV resulting from a change in the timing of expected cash distributions and applying a higher discount rate to forecast preferred share redemptions primarily due to a Ghana country risk premium applied resulting from the economic conditions in the country at that time. Additionally, the Company also recognized a $1.6 million impairment on its wholly owned Mali exploration assets in Q4 2022.
During Q1 2023 to Q3 2023, improvements in net income and EBITDA1 over prior periods are reflective of the JV’s underlying performance and rising gold price environment. The reduction in net earnings during Q4 2023 was primarily due to a $3.9 million downward fair value adjustment on the Company’s preferred shares in the JV resulting from a change in forecast timing of distributions and higher G&A expense due to higher share-based compensation expense, as described in section 5.1.c.
|
GALIANO GOLD INC. MANAGEMENT'S DISCUSSION AND ANALYSIS FOR THE YEARS ENDED DECEMBER 31, 2023 AND 2022 |
7. Liquidity and capital resources
A key financial objective of the Company is to actively manage its cash balance and liquidity in order to meet the Company's strategic plans, as well as those of the JV in accordance with the JVA. The Company shares control of the JV and aims to manage the JV in such a manner as to generate positive cash flows from the AGM's operating activities in order to fund its operating, capital and project development requirements, and to return capital to the JV partners. A summary of the Company's net assets and key financial ratios related to liquidity are presented in the table below. Note that the December 31, 2023 and December 31, 2022 balances below do not include any assets or liabilities of the JV.
| December 31, 2023 | December 31, 2022 | |||||
| (in thousands of US dollars, except outstanding shares and options) | $ | $ | ||||
| Cash and cash equivalents | 55,270 | 56,111 | ||||
| Other current assets | 1,824 | 2,494 | ||||
| Non-current assets | 156,208 | 121,289 | ||||
| Total assets | 213,302 | 179,894 | ||||
| Current liabilities | 11,988 | 5,804 | ||||
| Non-current liabilities | 396 | 399 | ||||
| Total liabilities | 12,384 | 6,203 | ||||
| Total equity | 200,918 | 173,691 | ||||
| Working capital | 45,106 | 52,801 | ||||
| Total common shares outstanding | 224,972,786 | 224,943,453 | ||||
| Total stock options outstanding | 12,575,335 | 8,497,170 | ||||
| Key financial ratios | ||||||
| Current ratio1 | 4.76 | 10.10 | ||||
| Total liabilities -to-equity | 0.06 | 0.04 |
1 Non-IFRS measure. The current ratio is calculated as Total Assets divided by Total Liabilities as reported in the Company's financial statements for the periods presented.
Subsequent to the original JV transaction with Gold Fields, other than the JV service fee, the Company has no current direct sources of revenue and any cash flows generated by the AGM are not within the Company's exclusive control as the distribution of cash from the JV is governed by the JVA. The JVA provides that "Distributable Cash" will be calculated and distributed quarterly, if available. Further information regarding the definition of "Distributable Cash" is included in section "8.3 EBITDA and Adjusted EBITDA". However, given the Company's cash balance and interest earned thereon, zero debt and ongoing service fee receipts from the JV, the Company believes it is in a position to meet all working capital requirements, contractual obligations and other financial commitments as they fall due (see "Commitments" below) during the next 12 months, including consideration payable to Gold Fields following the closing of the Acquisition to acquire their 45% interest in the AGM JV.
On December 21, 2022, the Company filed a final short form base shelf prospectus (the "Prospectus") under which the Company may sell from time-to-time common shares, warrants, subscription receipts, units, debt securities and/or share purchase contracts of the Company, up to an aggregate of $300 million. The Prospectus has a term of 25-months from the filing date. As of the date of this MD&A, no securities have been issued under the Prospectus.
|
GALIANO GOLD INC. MANAGEMENT'S DISCUSSION AND ANALYSIS FOR THE YEARS ENDED DECEMBER 31, 2023 AND 2022 |
7.1 Commitments
The following table summarizes the Company's contractual obligations as at December 31, 2023 and December 31, 2022. Note the following table excludes commitments and liabilities of the JV for the periods presented.
| Within | December | December | ||||||||||||||||
| (in thousands of US dollars) | 1 year | 1 - 3 years | 4 - 5 years | Over 5 years | 31, 2023 | 31, 2022 | ||||||||||||
| Accounts payable, accrued liabilities and payable due to related party | 5,724 | - | - | - | 5,724 | 3,173 | ||||||||||||
| Long-term incentive plan (cash-settled awards) | 6,139 | 318 | - | - | 6,457 | 2,716 | ||||||||||||
| Corporate office leases | 135 | 90 | - | - | 225 | 348 | ||||||||||||
| Total | 11,998 | 408 | - | - | 12,406 | 6,237 |
The Company intends to utilize cash on hand to settle the above noted commitments. In addition to the above commitments, the Company has provided various parent company guarantees related to the unfunded portion of the AGM's reclamation bonds in the amount of $8.2 million (December 31, 2022 - $5.9 million).
Refer to note 2 of the Company’s consolidated annual financial statements for the years ended December 31, 2023 and 2022 for a discussion on the consideration payable to Gold Fields under the Acquisition.
7.2 Contingencies
Due to the nature of its business, the Company and/or the JV may from time to time be subject to regulatory investigations, claims, lawsuits and other proceedings in the ordinary course of its business. While the Company cannot reasonably predict the ultimate outcome of any such actions, and inherent uncertainties exist in predicting such outcomes, the Company believes that the ultimate resolution of these actions is not reasonably likely to have a material adverse effect on the Company's or the JV's financial condition or future results of operations.
7.3 Cash flows
The following table provides a summary of the Company's cash flows for the three months and years ended December 31, 2023 and 2022:
| Three months ended December 31, | Year ended December 31, | |||||||||||
| 2023 | 2022 | 2023 | 2022 | |||||||||
| (in thousands of US dollars) | $ | $ | $ | $ | ||||||||
| Cash provided by (used in): | ||||||||||||
| Operating activities | (1,574 | ) | 842 | (3,634 | ) | 1,784 | ||||||
| Investing activities | 759 | 536 | 2,864 | 1,032 | ||||||||
| Financing activities | (14 | ) | (31 | ) | (108 | ) | (130 | ) | ||||
| Impact of foreign exchange on cash and cash equivalents | 20 | 48 | 37 | (96 | ) | |||||||
| (Decrease) increase in cash and cash equivalents during the period | (809 | ) | 1,395 | (841 | ) | 2,590 | ||||||
| Cash and cash equivalents, beginning of period | 56,079 | 54,716 | 56,111 | 53,521 | ||||||||
| Cash and cash equivalents, end of period | 55,270 | 56,111 | 55,270 | 56,111 | ||||||||
a) Cash (used in) provided by operating activities
During Q4 2023, the Company utilized cash flows in operations of $1.6 million (three months ended December 31, 2022 - generated cash flows from operations of $0.8 million) due to corporate head office expenses, net of JV service fee receipts.
The increase in cash used in operating activities from Q4 2022 to Q4 2023 was largely driven by a positive working capital movement in Q4 2022 due to higher accounts payable and collecting the Company's service fee receivable from the JV.
|
GALIANO GOLD INC. MANAGEMENT'S DISCUSSION AND ANALYSIS FOR THE YEARS ENDED DECEMBER 31, 2023 AND 2022 |
During the year ended December 31, 2023, the Company utilized cash flows in operations of $3.6 million (year ended December 31, 2022 - generated cash flows from operations of $1.8 million) due to corporate head office expenses, net of JV service fee receipts.
The increase in cash used in operating activities from 2022 to 2023 was largely driven by collection of historical JV service fee receivables in 2022 and higher long-term incentive plan award payouts in 2023.
b) Cash provided by investing activities
During the three months and year ended December 31, 2023, cash provided by investing activities amounted to $0.8 million and $2.9 million, respectively, and related to interest earned on cash balances and short-term investments (with maturities less than 90 days).
The increase in cash provided by investing activities during 2023 was due to higher interest rates earned on cash balances and short-term investments.
8. Non-IFRS measures
The Company has included certain non-IFRS performance measures throughout this MD&A. These performance measures are employed by management to assess the Company's operating and financial performance and to assist in business decision-making. The Company believes that, in addition to conventional measures prepared in accordance with IFRS, certain investors and other stakeholders use this information to evaluate the Company's operating and financial performance; however, as explained elsewhere herein, these non-IFRS performance measures do not have any standardized meaning and therefore may not be comparable to similar measures presented by other issuers. Accordingly, these performance measures are intended to provide additional information and should not be considered in isolation or as a substitute for measures of performance prepared in accordance with IFRS.
The JV does not calculate this information for use by both JV partners, rather it is calculated by the Company solely for the Company's own disclosure purposes.
8.1 Operating cash costs and total cash costs per gold ounce
The Company has included the non-IFRS performance measures of operating cash costs and total cash costs per gold ounce sold on a by-product basis throughout this MD&A. The Company follows the recommendations of the Gold Institute Production Cost Standard (the "Gold Institute"). The Gold Institute, which ceased operations in 2002, was a non-regulatory body and represented a global group of suppliers of gold and gold products. The production cost standard developed by the Gold Institute remains the generally accepted standard of reporting cash costs of production by many gold mining companies. Management uses operating cash costs and total cash costs per gold ounce sold to monitor the operating performance of the JV. The Company believes that, in addition to conventional measures prepared in accordance with IFRS, some investors use this information to evaluate the Company's performance and ability to generate cash flow. Other companies may calculate operating cash costs and total cash costs per gold ounce sold differently.
The following table provides a reconciliation of operating and total cash costs per gold ounce sold of the AGM to production costs of the AGM on a 100% basis (the nearest IFRS measure) as presented in the notes to the consolidated annual financial statements of the Company for the years ended December 31, 2023 and 2022.
|
GALIANO GOLD INC. MANAGEMENT'S DISCUSSION AND ANALYSIS FOR THE YEARS ENDED DECEMBER 31, 2023 AND 2022 |
| Three months ended December 31, | Year ended December 31, | |||||||||||
| 2023 | 2022 | 2023 | 2022 | |||||||||
| (in thousands of US dollars, except per ounce amounts) | $ | $ | $ | $ | ||||||||
| Production costs as reported | 42,900 | 32,518 | 146,805 | 179,849 | ||||||||
| Other adjustments 4 | (5,000 | ) | - | (7,000 | ) | - | ||||||
| Adjusted production costs | 37,900 | 32,518 | 139,805 | 179,849 | ||||||||
| Share-based compensation expense included in production costs | - | (1 | ) | 142 | 47 | |||||||
| By-product revenue | (183 | ) | (151 | ) | (591 | ) | (604 | ) | ||||
| Total operating cash costs | 37,717 | 32,366 | 139,356 | 179,292 | ||||||||
| Royalties | 3,589 | 2,901 | 14,642 | 14,867 | ||||||||
| Total cash costs | 41,306 | 35,267 | 153,998 | 194,159 | ||||||||
| Gold ounces sold | 30,555 | 34,202 | 134,163 | 167,849 | ||||||||
| Operating cash costs per gold ounce sold ($/oz) | 1,234 | 946 | 1,039 | 1,068 | ||||||||
| Total cash costs per gold ounce sold ($/oz) | 1,352 | 1,031 | 1,148 | 1,157 | ||||||||
4 Production costs for the three months and year ended December 31, 2023 have been adjusted for a $5.0 million and a $7.0 million legal provision, respectively, attributable to prior period mining costs.
8.2 AISC per gold ounce
In June 2013, the World Gold Council, a non-regulatory association of many of the world's leading gold mining companies established to promote the use of gold to industry, provided guidance for the calculation of "AISC per gold ounce" in an effort to encourage improved understanding and comparability of the total costs associated with mining an ounce of gold. The Company has adopted the reporting of "AISC gold ounce", which is a non-IFRS performance measure. The Company believes that the AISC per gold ounce measure provides additional insight into the costs of producing gold by capturing all of the expenditures required for the discovery, development and sustaining of gold production and allows the Company to assess its ability to support capital expenditures to sustain future production from the generation of operating cash flows. The Company believes that, in addition to conventional measures prepared in accordance with IFRS, some investors use this information to evaluate the JV's performance and ability to generate cash flow, distribution of which is subject to the terms of the JVA. Other companies may calculate AISC per gold ounce sold differently.
AISC adjusts total cash costs for G&A expenses, reclamation cost accretion, sustaining capitalized stripping costs, sustaining capital expenditures and lease payments and interest expense on the AGM's mining and service lease agreements. Sustaining capital expenditures, capitalized stripping costs, reclamation cost accretion and lease payments and interest expense on lease agreements are not line items on the AGM's financial statements. Sustaining capital expenditures are defined as those capital expenditures which do not materially benefit annual or life of mine gold ounce production at a mine site. A material benefit to a mine site is considered to be at least a 10% increase in annual or life of mine production, net present value, or reserves compared to the remaining life of mine of the operation. As such, sustaining costs exclude all expenditures at the AGM's new projects and certain expenditures at the AGM's operating sites which are deemed expansionary in nature. Capitalized stripping costs represent costs incurred at steady-state operations during the period; these costs are generally not considered expansionary in nature as the stripping phase is expected to take less than 12 months and resulting ore production is of a short-term duration. Reclamation cost accretion represents the growth in the AGM's decommissioning provision due to the passage of time. This amount does not reflect cash outflows, but it is considered to be representative of the periodic costs of reclamation and remediation. Lease payments on mining and service lease agreements represent cash outflows while interest expense represents the financing component inherent in the lease. Reclamation cost accretion and lease interest are included in finance expense in the AGM's results as disclosed in the notes to the consolidated annual financial statements of the Company for the years ended December 31, 2023 and 2022.
All-in sustaining margin per ounce is calculated as the difference between the average realized gold price for the period and AISC per gold ounce sold. All-in sustaining margin is calculated as all-in sustaining margin per ounce multiplied by the number of gold ounces sold during the period.
|
GALIANO GOLD INC. MANAGEMENT'S DISCUSSION AND ANALYSIS FOR THE YEARS ENDED DECEMBER 31, 2023 AND 2022 |
The following table provides a reconciliation of AISC of the AGM to production costs and various operating expenses of the AGM on a 100% basis (the nearest IFRS measure), as presented in the notes to the consolidated annual financial statements of the Company for the years ended December 31, 2023 and 2022.
| Three months ended December 31, | Year ended December 31, | |||||||||||
| 2023 | 2022 | 2023 | 2022 | |||||||||
| (in thousands of US dollars except per ounce amounts) | $ | $ | $ | $ | ||||||||
| Total cash costs (as reconciled above) | 41,306 | 35,267 | 153,998 | 194,159 | ||||||||
| General and administrative expenses - JV 5 | 745 | 387 | 2,698 | 2,752 | ||||||||
| Sustaining capital expenditures (see table below) | 18,826 | 3,841 | 41,886 | 10,978 | ||||||||
| Reclamation cost accretion | 574 | 708 | 2,394 | 2,527 | ||||||||
| Sustaining lease payments (see table below) | 839 | 508 | 1,641 | 15,247 | ||||||||
| Interest on lease liabilities | 808 | 14 | 1,601 | 207 | ||||||||
| All-in sustaining cost | 63,098 | 40,725 | 204,218 | 225,870 | ||||||||
| Gold ounces sold | 30,555 | 34,202 | 134,163 | 167,849 | ||||||||
| All-in sustaining cost per gold ounce sold ($/oz) - JV | 2,065 | 1,191 | 1,522 | 1,346 | ||||||||
| Average realized price per gold ounce sold ($/oz) | 1,942 | 1,686 | 1,908 | 1,767 | ||||||||
| All-in sustaining margin ($/oz) | (123 | ) | 495 | 386 | 421 | |||||||
| All-in sustaining margin | (3,758 | ) | 16,930 | 51,787 | 70,664 | |||||||
5 Excluded from G&A costs of the AGM are $15 and $34 of share-based compensation expense for the three months and year ended December 31, 2023, respectively. Excluded from the G&A costs of the AGM is a credit of $6 and $34 of share-based compensation expense, and a credit of $0.9 million and an expense of $18.0 million related to one-time severance charges, for the three months and year ended December 31, 2022, respectively.
For the three months and year ended December 31, 2023, the Company incurred corporate G&A expenses, net of the JV service fee, of $0.8 million and $3.2 million, respectively, which excludes share-based compensation expense and depreciation expense totaling $3.1 million and $6.3 million, respectively (three months and year ended December 31, 2022 - G&A expenses, net of the JV service fee, of $0.6 million and $3.9 million, respectively, which excludes share‐based compensation expense and depreciation expense totaling $0.8 million and $1.8 million, respectively).
The Company's attributable gold ounces sold for the three months and year ended December 31, 2023 were 13,750 and 60,373, respectively (three months and year ended December 31, 2022 - 15,391 and 75,532 gold ounces, respectively), resulting in additional AISC for the Company of $62/oz and $54/oz for the periods presented, respectively, in addition to the AGM's AISC presented in the above table (three months and year ended December 31, 2022 - $42/oz and $52/oz, respectively).
The following table reconciles sustaining capital expenditures to cash flows used in investing activities of the AGM on a 100% basis (the nearest IFRS measure), as presented in the notes to the consolidated annual financial statements of the Company for the years ended December 31, 2023 and 2022.
| Three months ended December 31, | Year ended December 31, | |||||||||||
| 2023 | 2022 | 2023 | 2022 | |||||||||
| (in thousands of US dollars) | $ | $ | $ | $ | ||||||||
| Cash used in investing activities - JV | 20,934 | 5,099 | 50,706 | 16,452 | ||||||||
| Less: | ||||||||||||
| Non-sustaining capital expenditures | (3,459 | ) | (1,806 | ) | (13,383 | ) | (6,167 | ) | ||||
| Change in AP related to capital expenditures not included in AISC | 1 | (13 | ) | 1 | (87 | ) | ||||||
| Interest earned on cash balances | 1,350 | 561 | 4,562 | 780 | ||||||||
| Total sustaining capital expenditures | 18,826 | 3,841 | 41,886 | 10,978 | ||||||||
Refer to section "4.1(e) Total cash costs and AISC" for a discussion on non-sustaining capital expenditures.
|
GALIANO GOLD INC. MANAGEMENT'S DISCUSSION AND ANALYSIS FOR THE YEARS ENDED DECEMBER 31, 2023 AND 2022 |
The following table reconciles sustaining lease payments to cash flows used in financing activities of the AGM on a 100% basis (the nearest IFRS measure), as presented in the notes to the consolidated annual financial statements of the Company for the years ended December 31, 2023 and 2022.
| Three months ended December 31, | Year ended December 31, | |||||||||||
| 2023 | 2022 | 2023 | 2022 | |||||||||
| (in thousands of US dollars) | $ | $ | $ | $ | ||||||||
| Cash used in financing activities - JV | 1,236 | 531 | 2,209 | 15,590 | ||||||||
| Less: | ||||||||||||
| Fees paid on revolving credit facility | (51 | ) | (23 | ) | (222 | ) | (343 | ) | ||||
| Reclamation bond deposits | (346 | ) | - | (346 | ) | - | ||||||
| Total sustaining lease payments | 839 | 508 | 1,641 | 15,247 | ||||||||
8.3 EBITDA and Adjusted EBITDA
Earnings before interest, taxes, depreciation and amortization ("EBITDA") provides an indication of the Company's continuing capacity to generate income from operations before considering the Company's financing decisions and costs of amortizing capital assets. Accordingly, EBITDA comprises net income excluding interest expense, interest income, amortization and depletion and income taxes. Adjusted EBITDA adjusts EBITDA to exclude non-recurring items and non-cash items and includes the calculated Adjusted EBITDA of the JV ("Adjusted EBITDA"). Other companies may calculate EBITDA and Adjusted EBITDA differently. The JV does not calculate this information for use by both JV partners, rather it is calculated by the Company solely for the Company's own disclosure purposes.
The following table provides a reconciliation of EBITDA and Adjusted EBITDA attributable to the Company based on its economic interest in the JV to net income (the nearest IFRS measure) of the Company per the consolidated annual financial statements of the Company for the years ended December 31, 2023 and 2022. All adjustments are shown net of estimated income tax.
| Three months ended December 31, | Year ended December 31, | |||||||||||
| 2023 | 2022 | 2023 | 2022 | |||||||||
| (in thousands of US dollars ) | $ | $ | $ | $ | ||||||||
| Net (loss) income for the period | (5,758 | ) | 28,500 | 26,085 | 40,809 | |||||||
| Add back (deduct): | ||||||||||||
| Depreciation expense | 36 | 36 | 143 | 146 | ||||||||
| Finance income | 3,163 | 16,046 | (6,255 | ) | (1,036 | ) | ||||||
| Finance expense | 5 | 5,623 | 23 | 5,647 | ||||||||
| EBITDA for the period | (2,554 | ) | 50,205 | 19,996 | 45,566 | |||||||
| Add back (deduct): | ||||||||||||
| Adjustment for non-cash long-term incentive plan compensation | 321 | 219 | 1,123 | 119 | ||||||||
| Share of net income related to joint venture | (1,728 | ) | (46,517 | ) | (31,670 | ) | (46,517 | ) | ||||
| Impairment reversal on investment in joint venture | - | (7,631 | ) | - | (7,631 | ) | ||||||
| Impairment loss on exploration and evaluation assets | - | 1,628 | - | 1,628 | ||||||||
| Galiano's attributable interest in JV Adjusted EBITDA (below) | 4,059 | 10,265 | 37,305 | 35,662 | ||||||||
| Adjusted EBITDA for the period | 98 | 8,169 | 26,754 | 28,827 | ||||||||
The following table reconciles the JV's EBITDA and Adjusted EBITDA for the three months and years ended December 31, 2023 and 2022 to the results of the JV as disclosed in note 10 to the consolidated annual financial statements of the Company for the years ended December 31, 2023 and 2022.
|
GALIANO GOLD INC. MANAGEMENT'S DISCUSSION AND ANALYSIS FOR THE YEARS ENDED DECEMBER 31, 2023 AND 2022 |
| Three months ended December 31, | Year ended December 31, | |||||||||||
| 2023 | 2022 | 2023 | 2022 | |||||||||
| (in thousands of US dollars) | $ | $ | $ | $ | ||||||||
| JV net income for the period | 3,664 | 83,712 | 69,940 | 103,223 | ||||||||
| Add back (deduct): | ||||||||||||
| JV depreciation and depletion expense | 4,350 | 3,222 | 13,613 | 30,767 | ||||||||
| JV finance income | (1,381 | ) | (567 | ) | (4,602 | ) | (801 | ) | ||||
| JV finance expense | 3,226 | 1,036 | 5,589 | 6,471 | ||||||||
| JV EBITDA for the period | 9,859 | 87,403 | 84,540 | 139,660 | ||||||||
| Add back (deduct): | ||||||||||||
| Impairment reversal on MPP&E | - | (63,200 | ) | - | (63,200 | ) | ||||||
| JV severance costs | - | (885 | ) | - | 18,035 | |||||||
| JV lease payments (capitalized leases) | (839 | ) | (508 | ) | (1,641 | ) | (15,247 | ) | ||||
| JV Adjusted EBITDA for the period | 9,020 | 22,810 | 82,899 | 79,248 | ||||||||
| Galiano's attributable interest in JV Adjusted EBITDA for the period | 4,059 | 10,265 | 37,305 | 35,662 | ||||||||
While the above figure reflects an estimate of the Company's "attributable interest" in Adjusted EBITDA generated from the AGM, cash and cash equivalents held by the JV are not within the Company's exclusive control as the distribution of cash from the JV is governed by the JVA. The JVA provides that "Distributable Cash" will be calculated and distributed quarterly, if available. "Distributable Cash" means an amount to be calculated at each calendar quarter-end, as being the lesser of (i) cash and cash equivalents which are projected at that time to be surplus to all the JV companies taken together, after providing for all amounts anticipated to be required to be paid during a period of at least the ensuing two calendar quarters in order to pay the net obligations (net of anticipated revenues during such two subsequent quarters) which will arise out of the operations contemplated by the current approved program and budget while also providing for retention of a reasonable amount of cash and cash equivalents for working capital, contingencies and reserves, all of which factors shall be considered by the management committee; and (ii) the maximum amount permissible for distributions to shareholders of a particular JV company at that time in accordance with applicable law and the terms of any third party loan or other agreement in effect which limits distributions from the JV companies ("Distributable Cash"). Distributable Cash is to be paid out by the JV in certain priority generally to interest and principal of loans, redemption of the preferred shares issued by Shika Group Finance (of which shares each partner holds 132.4 million preferred shares as at December 31, 2023, after redemptions paid by the JV in 2019, 2020 and 2021) and finally as dividends on common shares of Asanko Gold Ghana Ltd. (which the JV partners own 45% each and the Government of Ghana holds 10%).
8.4 Free Cash Flow
The Company uses the financial measure Free Cash Flow, which is a non-IFRS financial measure, to supplement information in its consolidated annual financial statements ("Free Cash Flow"). Free Cash Flow does not have any standardized meaning prescribed under IFRS, and therefore it may not be comparable to similar measures employed by other companies. The Company believes that in addition to conventional measures prepared in accordance with IFRS, the Company and certain investors and analysts use this information to evaluate the JV's performance with respect to its operating cash flow capacity to meet non-discretionary outflows of cash. Free Cash Flow is calculated as cash flows from operating activities of the JV adjusted for cash flows associated with sustaining and non-sustaining capital expenditures and payments made to mining and services contractors for leases capitalized under IFRS 16.
The following table provides a reconciliation of Free Cash Flow of the AGM to its cash flows from operating activities on a 100% basis (the nearest IFRS measure), as presented in the notes to the consolidated annual financial statements of the Company for the years ended December 31, 2023 and 2022.
|
GALIANO GOLD INC. MANAGEMENT'S DISCUSSION AND ANALYSIS FOR THE YEARS ENDED DECEMBER 31, 2023 AND 2022 |
| Three months ended December 31, | Year ended December 31, | |||||||||||
| 2023 | 2022 | 2023 | 2022 | |||||||||
| (in thousands of US dollars ) | $ | $ | $ | $ | ||||||||
| Cash flows from operating activities - JV | 24,058 | 11,135 | 100,720 | 75,479 | ||||||||
| Less: | ||||||||||||
| Cash flows used in investing activities - JV | (20,934 | ) | (5,099 | ) | (50,706 | ) | (16,452 | ) | ||||
| Lease payments (capitalized leases) | (839 | ) | (508 | ) | (1,641 | ) | (15,247 | ) | ||||
| JV Free Cash Flow for the period | 2,285 | 5,528 | 48,373 | 43,780 | ||||||||
9. Summary of outstanding share data
As of the date of this MD&A, there were 224,997,453 common shares of the Company issued and outstanding and 12,570,668 stock options outstanding (with exercise prices ranging between C$0.53 and C$2.20 per share). The fully diluted outstanding share count at the date of this MD&A is 237,568,121.
10. Related party transactions
As at December 31, 2023, the Company's related parties are its subsidiaries and the JV, and key management personnel (being directors and executive officers of the Company). During the normal course of operations, the Company enters into transactions with its related parties. During the three months and year ended December 31, 2023, all related party transactions were in the normal course of business including compensation payments to key management personnel.
During the three months and year ended December 31, 2023, other than compensation paid to key management personnel, the only related party transactions were with the JV in respect of the Company's service fee as operator of the AGM and costs incurred by the JV on behalf of the Company in respect of its wholly owned Asumura property. For the three months and year ended December 31, 2023, the JV service fee was comprised of a gross service fee of $1.8 million and $7.2 million, respectively, less withholding taxes payable in Ghana of $0.3 million and $1.4 million (three months and year ended December 31, 2022 - gross service fee of $1.8 million and $6.8 million, respectively, less withholding taxes payable in Ghana of $0.4 million and $1.4 million, respectively). As at December 31, 2023, the Company had a $1.0 million receivable owing from the JV in relation to the Company's service fee earned for being the operator of the JV (December 31, 2022 - $1.7 million).
During the three months and year ended December 31, 2023, the JV provided administrative and exploration services on the Company's Asumura property totaling nil and $0.2 million, respectively (three months and year ended December 31, 2022 - $0.1 million and $0.3 million, respectively). As at December 31, 2023, the Company had a payable due to the JV in the amount of $3.2 million relating to reimbursement for third party supplier costs and administrative and exploration services performed by the JV on the Company's wholly owned Asumura property in Ghana (December 31, 2022 - $1.4 million). The Company has no other contractual or other commitments related to these services.
In addition to the service fee earned as operator of the JV and administrative and exploration services performed by the JV on the Company's Asumura property in Ghana, the Company's related party transactions included compensation paid to key management personnel, which was as follows for the years presented:
| Year ended December 31, | ||||||
| 2023 | 2022 | |||||
| $ | $ | |||||
| Salaries and benefits | 1,873 | 1,942 | ||||
| Share-based compensation | 4,671 | 1,343 | ||||
| Total compensation | 6,544 | 3,285 | ||||
|
GALIANO GOLD INC. MANAGEMENT'S DISCUSSION AND ANALYSIS FOR THE YEARS ENDED DECEMBER 31, 2023 AND 2022 |
11. Critical accounting policies and estimates
11.1 Estimates and judgements
The preparation of financial statements in conformity with IFRS requires management to make estimates and assumptions that affect amounts reported in the financial statements and accompanying notes. Management believes the estimates and assumptions used in the consolidated annual financial statements are reasonable; however, actual results could differ from those estimates and could impact future results of operations and cash flows. The Company's significant accounting judgements and estimates are presented in note 6 of the audited consolidated annual financial statements for the years ended December 31, 2023 and 2022.
There were no material changes to the Company's or JV's significant accounting judgements or estimates during the year ended December 31, 2023, except as disclosed in the Company's audited consolidated annual financial statements for the years ended December 31, 2023 and 2022.
11.2 Changes in Accounting Policies including Initial Adoption
(a) Accounting standards adopted during the year
The Company adopted the following new IFRS standard effective January 1, 2023. The nature and impact of the new standard on the Company's current period financial statements, if any, are outlined below. Adoption of the standard was made in accordance with the applicable transitional provisions.
Amendments to IAS 1
On February 12, 2021, the IASB issued Disclosure of Accounting Policies (Amendments to IAS 1 and IFRS Practice Statement 2, Making Materiality Judgements). The amendments help companies provide useful accounting policy disclosures and include requiring companies to disclose their material accounting policies rather than their significant accounting policies; clarifying that accounting policies related to immaterial transactions, other events or conditions are themselves immaterial and as such need not be disclosed; and clarifying that not all accounting policies that relate to material transactions, other events or conditions are themselves material to a company's financial statements. The amendments are effective for annual periods beginning on or after January 1, 2023, with early adoption permitted. The amendments to IAS 1 did not have a material impact on the Company's annual consolidated financial statements for the year ended December 31, 2023.
(b) Accounting standards and amendments issued but not yet adopted
There were no accounting standards or amendments to existing standards issued but not yet adopted as of December 31, 2023 that are expected to have a material effect on the Company's or the JV's financial statements in the future.
12. Risks and uncertainties
12.1 Financial instruments and risk
The Company's business, operations and future prospects are subject to significant risks. For details of these risks, refer to the risk factors set forth in the Company's most recently filed AIF for the year ended December 31, 2022, which can be found under the Company's SEDAR+ profile at www.sedarplus.ca, and the Company's most recently filed Form 40-F Annual Report for the year ended December 31, 2022, which can be found on EDGAR at www.sec.gov.
Management is not aware of any significant changes to the risks identified in the Company's most recently filed AIF, with the exception of risks related to the restart of mining which have reduced due to a successful restart of mining on October 1, 2023, risks related to the Company's ability to close the Acquisition and risks related to the expected benefits of the Acquisition, nor has the Company's mitigation of those risks changed significantly during the year ended December 31, 2023, except for the ZCCs gold hedging strategy previously mentioned. Additional risks and uncertainties not presently known to the Company or that the Company currently considers immaterial may also impair the business, operations, prospects and share price of the Company and/or the JV. If any of the risks actually occur, the business of the Company and/or the JV may be harmed, and its financial condition and results of operations may suffer significantly.
|
GALIANO GOLD INC. MANAGEMENT'S DISCUSSION AND ANALYSIS FOR THE YEARS ENDED DECEMBER 31, 2023 AND 2022 |
a) Financial instruments
As at December 31, 2023, the Company's financial instruments consist of cash and cash equivalents, accounts receivable, receivable due from related party, preferred shares in the JV, accounts payable and accrued liabilities, related party payables and long-term incentive plan liabilities. The Company classifies cash and cash equivalents, accounts receivable and related party receivables as financial assets measured at amortized cost, while accounts payable and accrued liabilities and related party payables are classified as other financial liabilities and measured at amortized cost. The preferred shares in the JV and long-term incentive plan liabilities are a financial asset and a financial liability, respectively, measured at fair value through profit or loss, and both fall within Level 3 of the fair value hierarchy. Refer to note 9 of the Company's audited consolidated annual financial statements for the year ended December 31, 2023 for discussion on the significant assumptions made in determining the fair value of the preferred shares.
The credit risk, liquidity risk and market risk associated with the Company's financial instruments are disclosed in note 22 of the Company's consolidated annual financial statements for the years ended December 31, 2023 and 2022. There were no material changes to credit risk, liquidity risk or market risk, nor how the Company manages these risks, during the three months and year ended December 31, 2023.
As at December 31, 2023, the carrying and fair values of the Company's financial instruments by category are as follows:
| Fair value through profit or loss |
Amortized cost | Carrying value | Fair value | |||||||||
| $ | $ | $ | $ | |||||||||
| Financial assets: | ||||||||||||
| Cash and cash equivalents | - | 55,270 | 55,270 | 55,270 | ||||||||
| Receivables and receivable due from related party | - | 1,060 | 1,060 | 1,060 | ||||||||
| Preferred shares in AGM JV | 70,165 | - | 70,165 | 70,165 | ||||||||
| Total financial assets | 70,165 | 56,330 | 126,495 | 126,495 | ||||||||
| Financial liabilities: | ||||||||||||
| Accounts payable, accrued liabilities and payable due to related party1 | 6,139 | 5,724 | 11,863 | 11,863 | ||||||||
| Long-term incentive plan liabilities | 318 | - | 318 | 318 | ||||||||
| Lease liability | - | 203 | 203 | 203 | ||||||||
| Total financial liabilities | 6,457 | 5,927 | 12,384 | 12,384 |
1 Accounts payable includes the current portion of long-term incentive plan liabilities, which are measured at fair value through profit or loss.
13. Internal control
13.1 Disclosure Controls and Procedures
Evaluation of Disclosure Controls and Procedures are designed to provide reasonable assurance that all relevant information gathered and reported to senior management, including the Company's Chief Executive Officer ("CEO") and Chief Financial Officer ("CFO"), on a timely basis so that appropriate decisions can be made regarding public disclosure. Internal control over financial reporting is a process designed to provide reasonable assurance regarding the reliability of financial reporting and the preparation of financial statements for external purposes in accordance with IFRS. Management of the Company, with the participation of the CEO and the CFO, have evaluated the design and operating effectiveness of the Company's disclosure controls and procedures and the design as required by Canadian and United States securities legislation, and have concluded that, as of December 31, 2023, such disclosure controls and procedures were effective.
|
GALIANO GOLD INC. MANAGEMENT'S DISCUSSION AND ANALYSIS FOR THE YEARS ENDED DECEMBER 31, 2023 AND 2022 |
13.2 Internal Control over Financial Reporting
The Company's management, with the participation of its CEO and CFO, is responsible for establishing and maintaining adequate internal control over financial reporting. Under the supervision of the CEO and CFO, the Company's internal control over financial reporting is a process designed to provide reasonable assurance regarding the reliability of financial reporting and the preparation of financial statements for external purposes in accordance with IFRS. The Company's internal control over financial reporting includes policies and procedures that:
The Company's management, with the participation of its CEO and CFO, assessed the effectiveness of the Company's internal control over financial reporting. In making this assessment, management used the criteria set forth in Internal Control - Integrated Framework (2013) issued by the Committee of Sponsoring Organizations of the Treadway Commission (COSO). Based on this assessment, management and the CEO and CFO have concluded that, as of December 31, 2023, the Company's internal control over financial reporting was effective.
13.3 Changes in Internal Control over Financial Reporting
There has been no change in the Company's internal control over financial reporting during the three months ended December 31, 2023 that has materially affected, or is reasonably likely to materially affect, the Company's internal control over financial reporting.
13.4 Limitations of controls and procedures
The Company's management, including the CEO and CFO, believes that any disclosure controls and procedures or internal control over financial reporting, no matter how well conceived and operated, can provide only reasonable, not absolute, assurance that the objectives of the control system are met. Further, the design of a control system must reflect the fact that there are resource constraints, and the benefits of controls must be considered relative to their costs. Because of the inherent limitations in all control systems, they cannot provide absolute assurance that all control issues and instances of fraud, if any, within the Company have been prevented or detected. These inherent limitations include the realities that judgements in decision-making can be faulty, and that breakdowns can occur because of simple error or mistake. Additionally, controls can be circumvented by the individual acts of some persons, by collusion of two or more people, or by unauthorized override of the control. The design of any control system also is based in part upon certain assumptions about the likelihood of future events, and there can be no assurance that any design will succeed in achieving its stated goals under all potential future conditions. Accordingly, because of the inherent limitations in a cost-effective control system, misstatements due to error or fraud may occur and not be detected.
14. Qualified Persons
The exploration information in this MD&A has been reviewed and approved by Mr. Chris Pettman, P.Geo, Vice President Exploration of Galiano. For further information regarding the exploration information in this MD&A, including the Quality Control and Quality Assurance and data verification measures taken with respect to such exploration information, please see the Company's news release dated October 25, 2023 and filed on the Company's SEDAR+ profile at www.sedarplus.ca. All other scientific and technical information contained in this MD&A has been approved by Mr. Richard Miller, P.Eng., Vice President Technical Services of Galiano. Mr. Pettman and Mr. Miller are "Qualified Persons" as defined by NI 43-101.
|
GALIANO GOLD INC. MANAGEMENT'S DISCUSSION AND ANALYSIS FOR THE YEARS ENDED DECEMBER 31, 2023 AND 2022 |
15. Cautionary statements
15.1 Cautionary statement on forward-looking information
The Company cautions readers regarding forward-looking statements found in this MD&A and in any other statement made by, or on behalf of the Company. Generally, forward-looking information can be identified by the use of forward-looking terminology such as "plans", "expects", "estimates", "anticipates", or variations of such words and phrases or statements that certain actions, events or results "may", "could", or "might" occur. Forward-looking statements are made based on management's beliefs, estimates and opinions and are given only as of the date of this MD&A. Such statements may constitute "forward-looking information" within the meaning of the United States Private Securities Litigation Reform Act of 1995 and applicable Canadian securities legislation.
Forward-looking statements are statements not based on historical information and which relate to future operations, strategies, financial results or other developments. Forward-looking statements reflect the Company's current views with respect to expectations, beliefs, assumptions, estimates and forecasts about the business of the JV and the Company and the industry and markets in which the JV and the Company operate. Forward-looking statements include, but are not limited to, statements with respect to:
|
GALIANO GOLD INC. MANAGEMENT'S DISCUSSION AND ANALYSIS FOR THE YEARS ENDED DECEMBER 31, 2023 AND 2022 |
Forward-looking statements are not guarantees of future performance and involve risks, uncertainties and assumptions, which are difficult to predict. These uncertainties and contingencies can affect actual results and could cause actual results to differ materially from those expressed in any forward-looking statements made by or on behalf of the Company. The JV and the Company's actual future results or performance are subject to certain risks and uncertainties, including but not limited to:
|
GALIANO GOLD INC. MANAGEMENT'S DISCUSSION AND ANALYSIS FOR THE YEARS ENDED DECEMBER 31, 2023 AND 2022 |
Forward-looking statements are necessarily based upon estimates and assumptions, which are inherently subject to significant business, economic and competitive uncertainties and contingencies, many of which are beyond the Company's control and many of which, regarding future business decisions, are subject to change. Assumptions underlying the Company's expectations regarding forward-looking statements or information contained in this MD&A include, among others:
|
GALIANO GOLD INC. MANAGEMENT'S DISCUSSION AND ANALYSIS FOR THE YEARS ENDED DECEMBER 31, 2023 AND 2022 |
Although the Company has attempted to identify important factors that could cause actual results or events to differ materially from those described in the forward-looking statements, you are cautioned that this list is not exhaustive and there may be other factors that the Company has not identified. Furthermore, the Company undertakes no obligation to update or revise any forward-looking statements included in, or incorporated by reference in, this MD&A if these beliefs, estimates and opinions or other circumstances should change, except as otherwise required by applicable law.
Historical results of operations and trends that may be inferred from the following discussions and analysis may not necessarily indicate future results from operations. Historically, the Company's operations have been primarily funded from debt and share issuances, as well as the exercise of stock options. The Company has had and may have future capital requirements in excess of its currently available resources. In the event the Company's plans change, its assumptions change or prove inaccurate, or its capital resources in addition to projected cash flow, if any, prove to be insufficient to fund its future operations, the Company may be required to seek additional financing.
Although the Company has to-date been able to raise capital, there can be no assurance that the Company will have sufficient financing to meet its future capital requirements or that additional financing will be available on terms acceptable to the Company in the future.
15.2 Cautionary note for United States investors
All technical disclosure in this MD&A has been prepared in accordance with the requirements of the securities laws in effect in Canada, which differ materially from the requirements of United States securities laws applicable to domestic Unites States issuers. The terms "mineral reserves", "proven mineral reserves", "probable mineral reserves", "mineral resources", "measured mineral resources", "indicated mineral resources" and "inferred mineral resources" used in this MD&A are in reference to the mining terms defined in the Canadian Institute of Mining, Metallurgy and Petroleum Standards, as adopted by National Instrument 43-101 Standards of Disclosure for Mineral Projects. The Company's disclosure of mineralization and other technical information herein may differ significantly from the information that would be disclosed had the Company prepared the reserve and resource estimates under the standards adopted under the rule of the SEC applicable to domestic United States issuers. Accordingly, the disclosure in this MD&A regarding the JV's mineral properties is not comparable to the disclosure of United States issuers subject to the SEC's mining disclosure requirements.