Please wait
Management’s Discussion and Analysis
and
Consolidated Financial Statements
June 30, 2026
| | | | | | | | |
| INTERNATIONAL FINANCE CORPORATION | Page 2 |
| | |
| Management's Discussion and Analysis | |
June 30, 2026
| | | | | | | | |
Contents | |
Section I: | Selected Financial Data | |
Section II: | Executive Summary | |
Section III: | Client Services | |
Section IV: | Liquid Assets | |
Section V: | Funding Resources | |
Section VI: | Risk Management | |
Section VII: | Critical Accounting Policies | |
Section VIII: | Results of Operations | |
Section IX: | Governance and Control | |
Section X: | Appendix | |
| Glossary of Terms | |
| Abbreviations and Acronyms | |
| | | | | | | | |
| INTERNATIONAL FINANCE CORPORATION | Page 3 |
| | |
| Management's Discussion and Analysis | |
June 30, 2026
| | | | | | | | |
| INTERNATIONAL FINANCE CORPORATION | Page 4 |
| | |
| Management's Discussion and Analysis | |
June 30, 2026
| | | | | | | | |
List of Figures | |
Figure 1: | Sources and Uses of Income | |
Figure 2: | Income Measures | |
Figure 3: | Own Account and PCM Commitments | |
Figure 4: | Disbursements | |
Figure 5: | Investments | 11 |
Figure 6: | Liquid Assets | 11 |
Figure 7: | Borrowings | 11 |
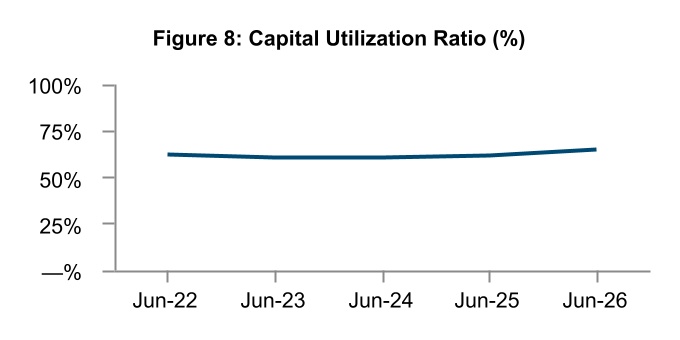
Figure 8: | Capital Utilization Ratio | 11 |
Figure 9: | IFC’s Investment Project Cycle | |
Figure 10: | IFC’s Investment Portfolio Management | |
Figure 11: | Disbursed Investment Portfolio Distribution by Region | |
Figure 12: | Carrying Value of Loan Portfolio | |
Figure 13: | Currency Composition of Disbursed Loan Portfolio | |
Figure 14: | Carrying Value of Equity Investment Portfolio | |
Figure 15: | Carrying Value of Debt Security Portfolio | |
Figure 16: | IFC's Funding Resources | |
Figure 17: | Borrowings Outstanding | |
Figure 18: | IFC’s Enterprise Risk Management Framework | |
Figure 19: | Risk Governance Structure | |
Figure 20: | Management Risk Committee Structure | |
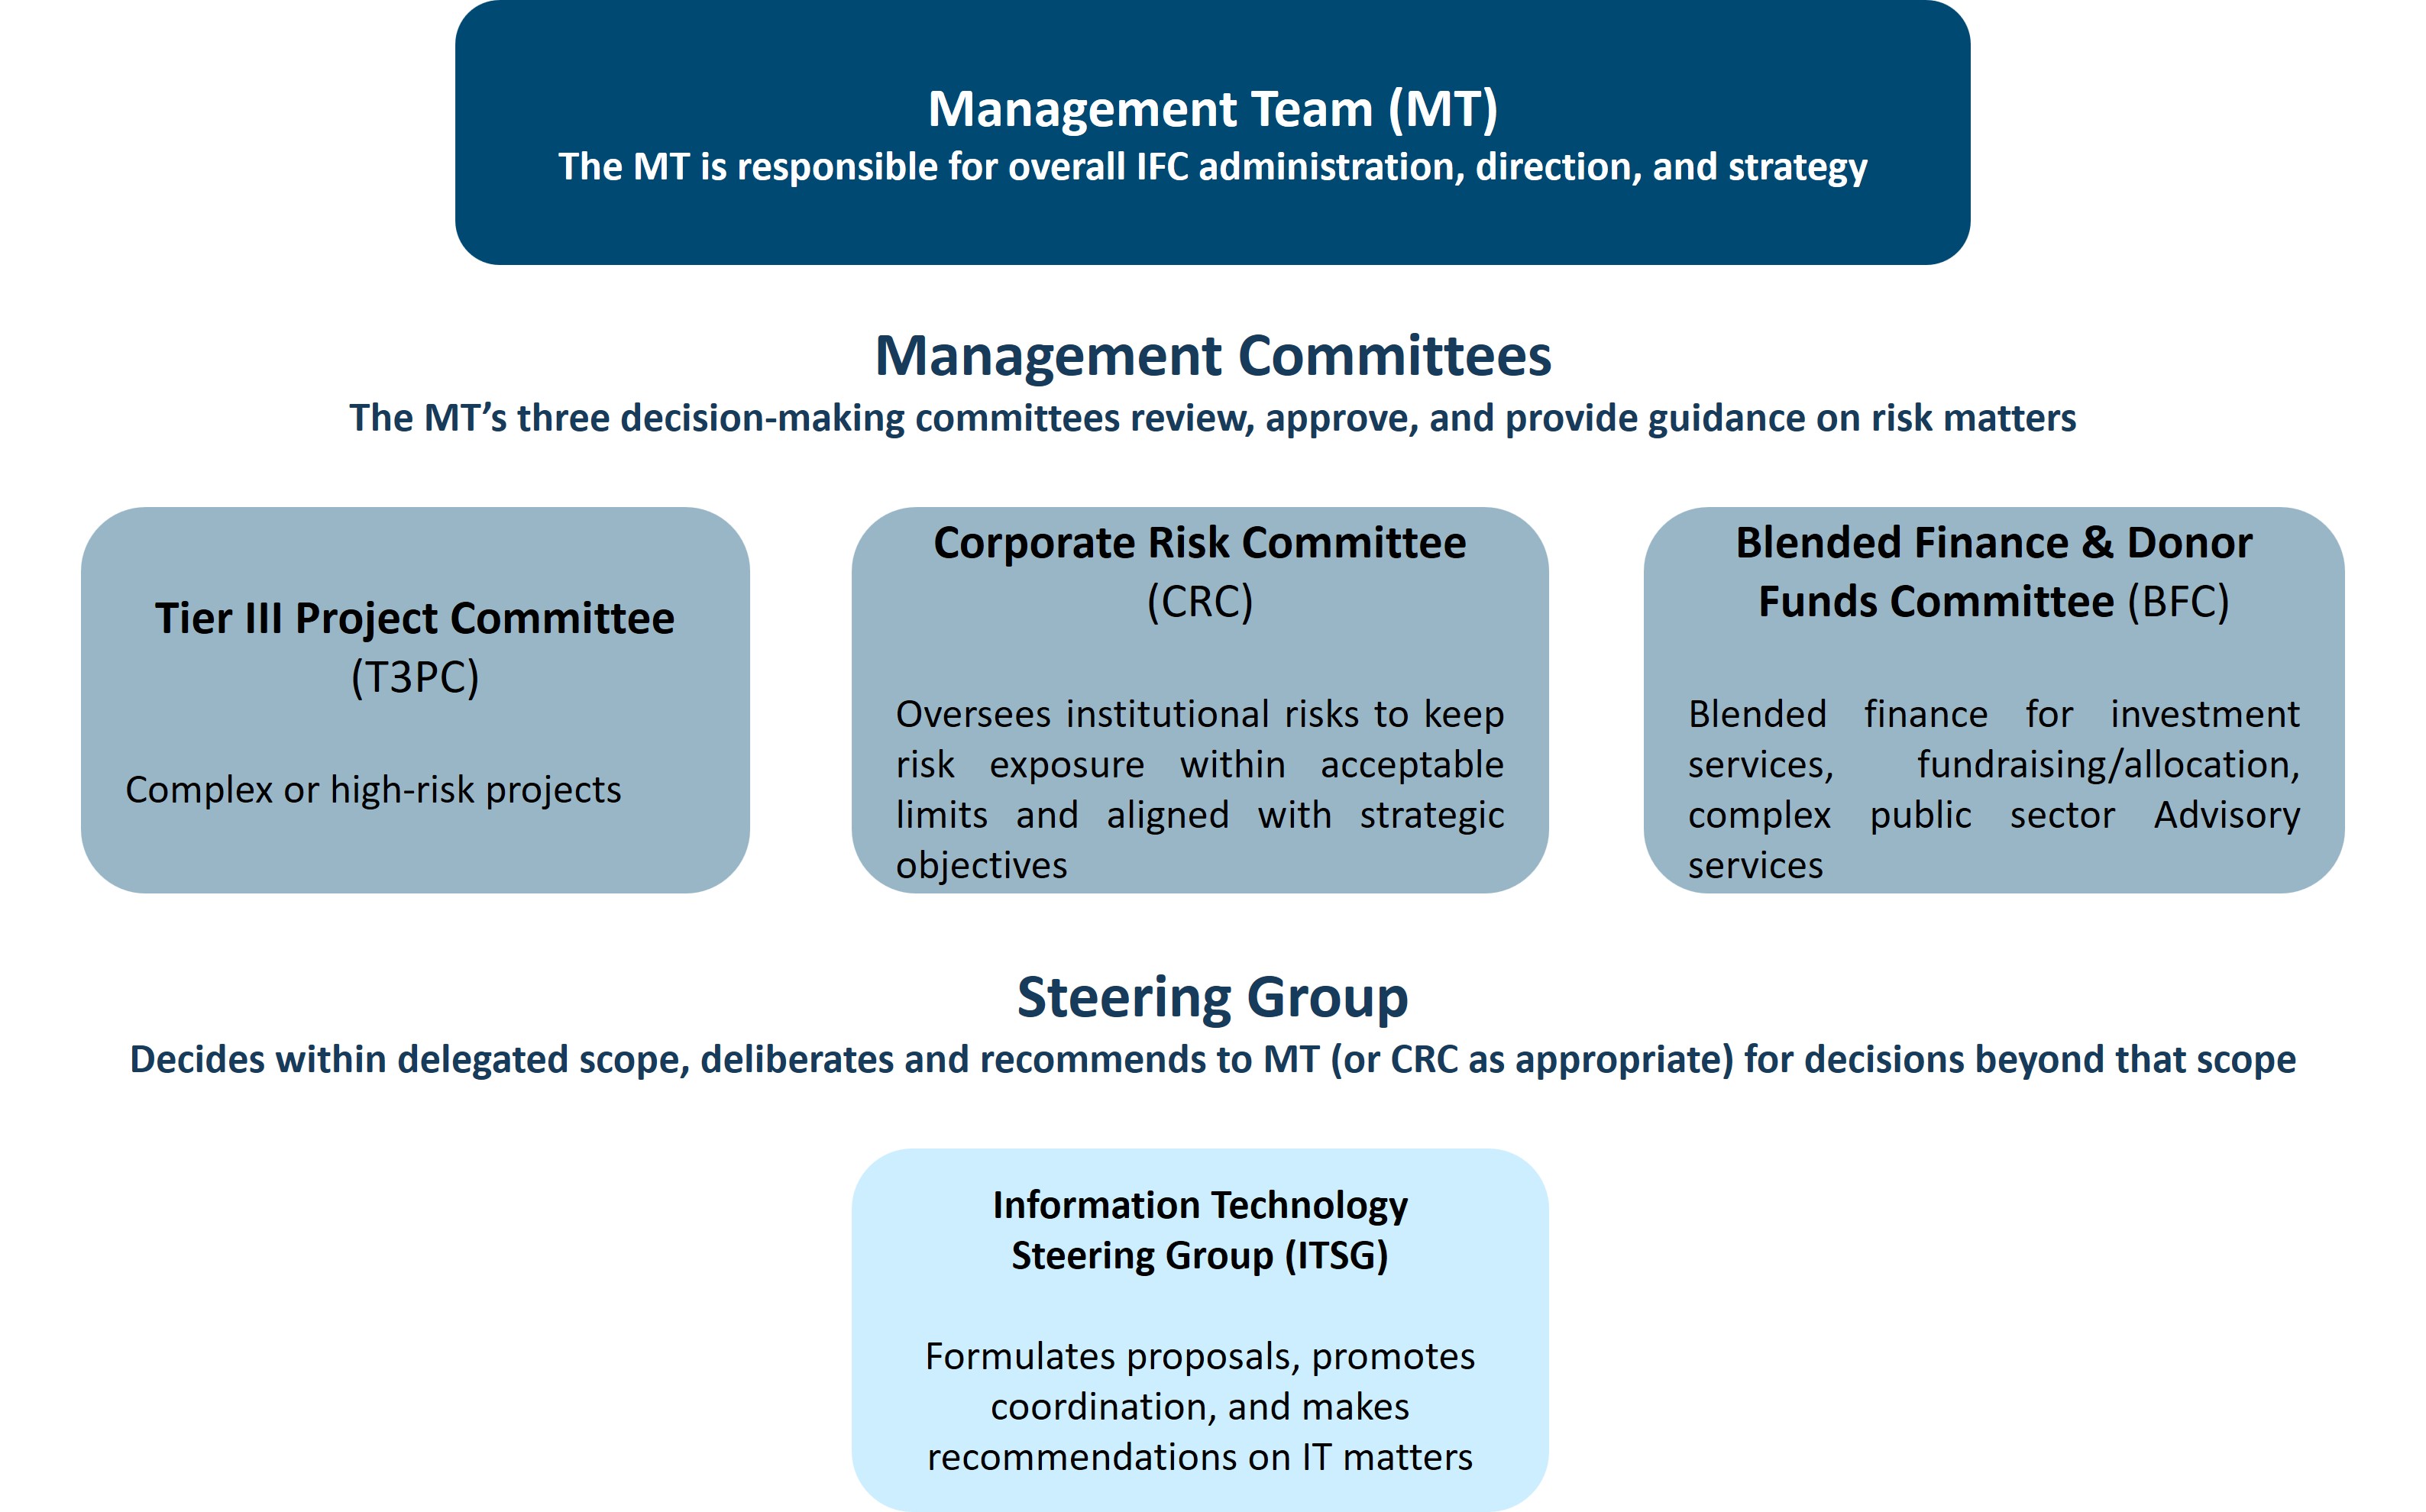
Figure 21: | IFC’s Management Decision Making Governance | |
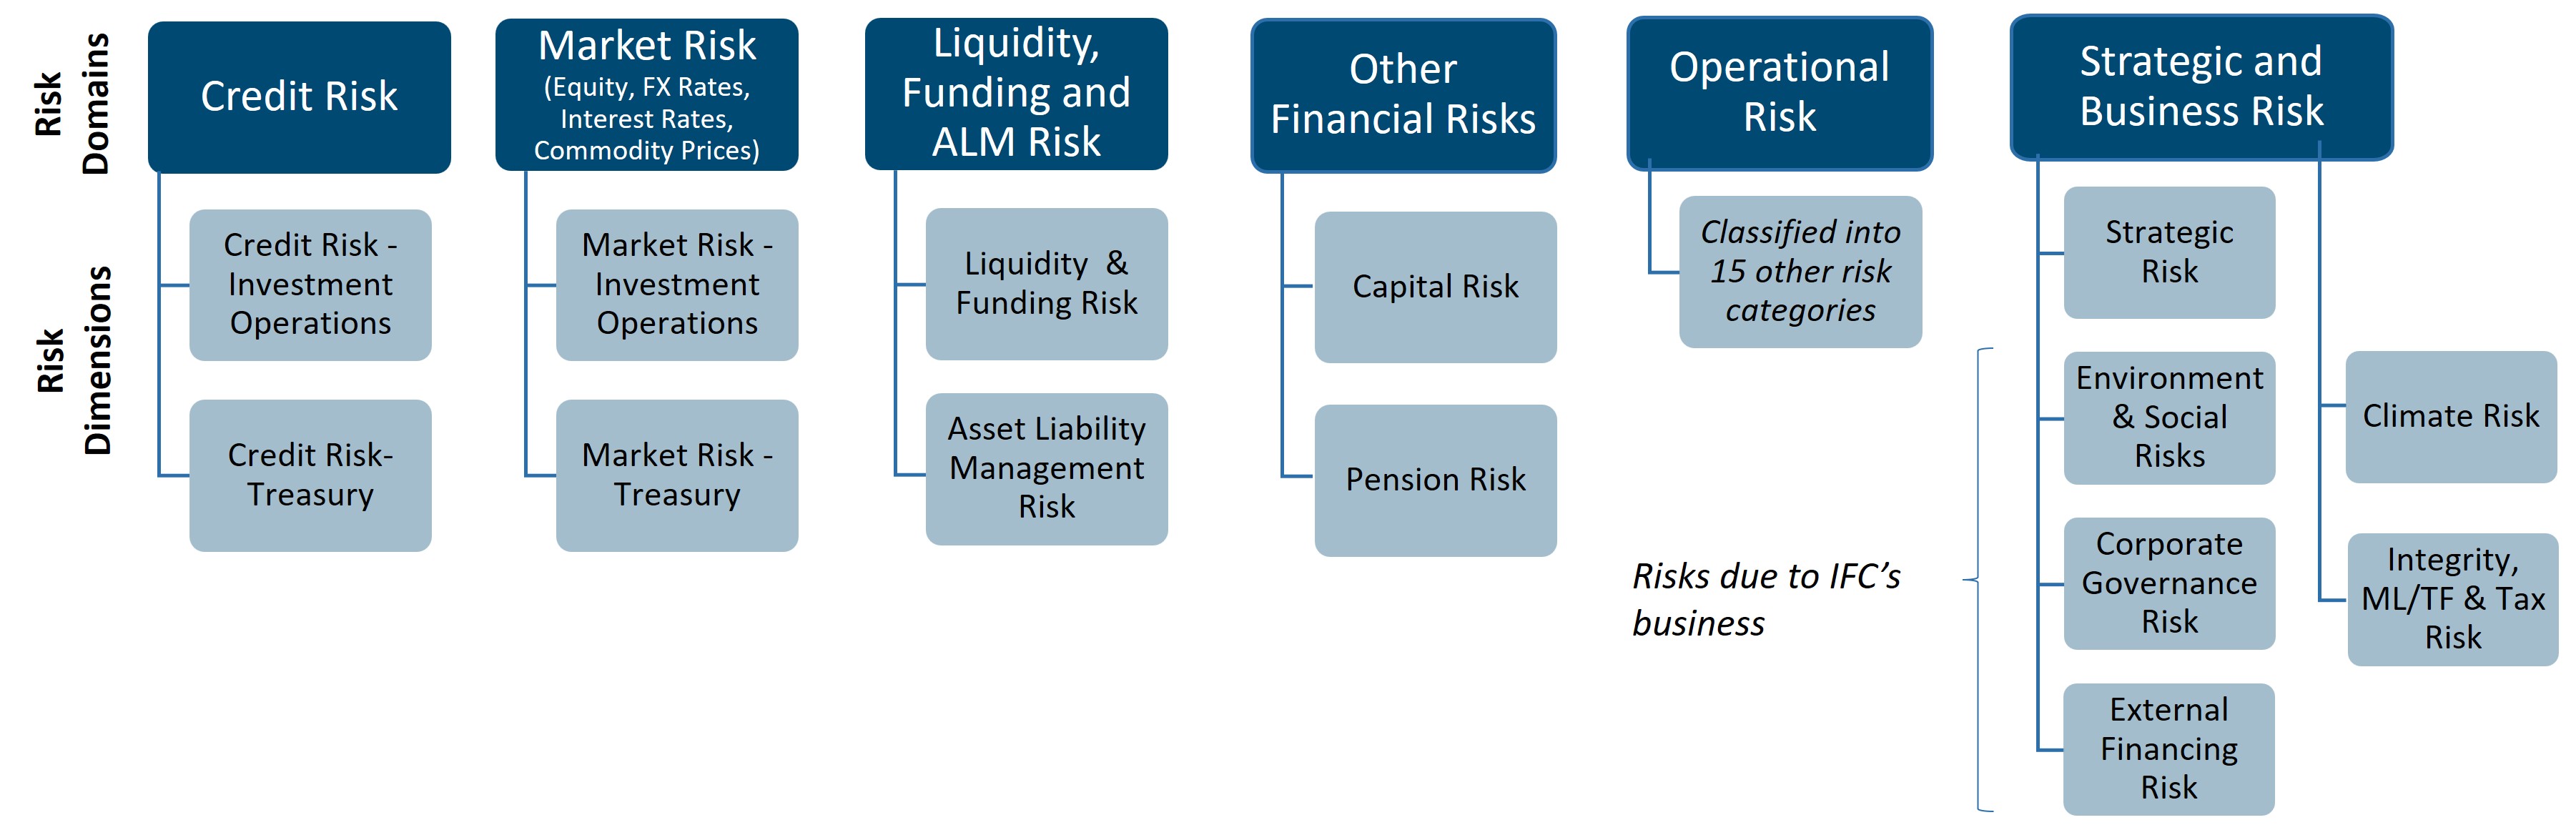
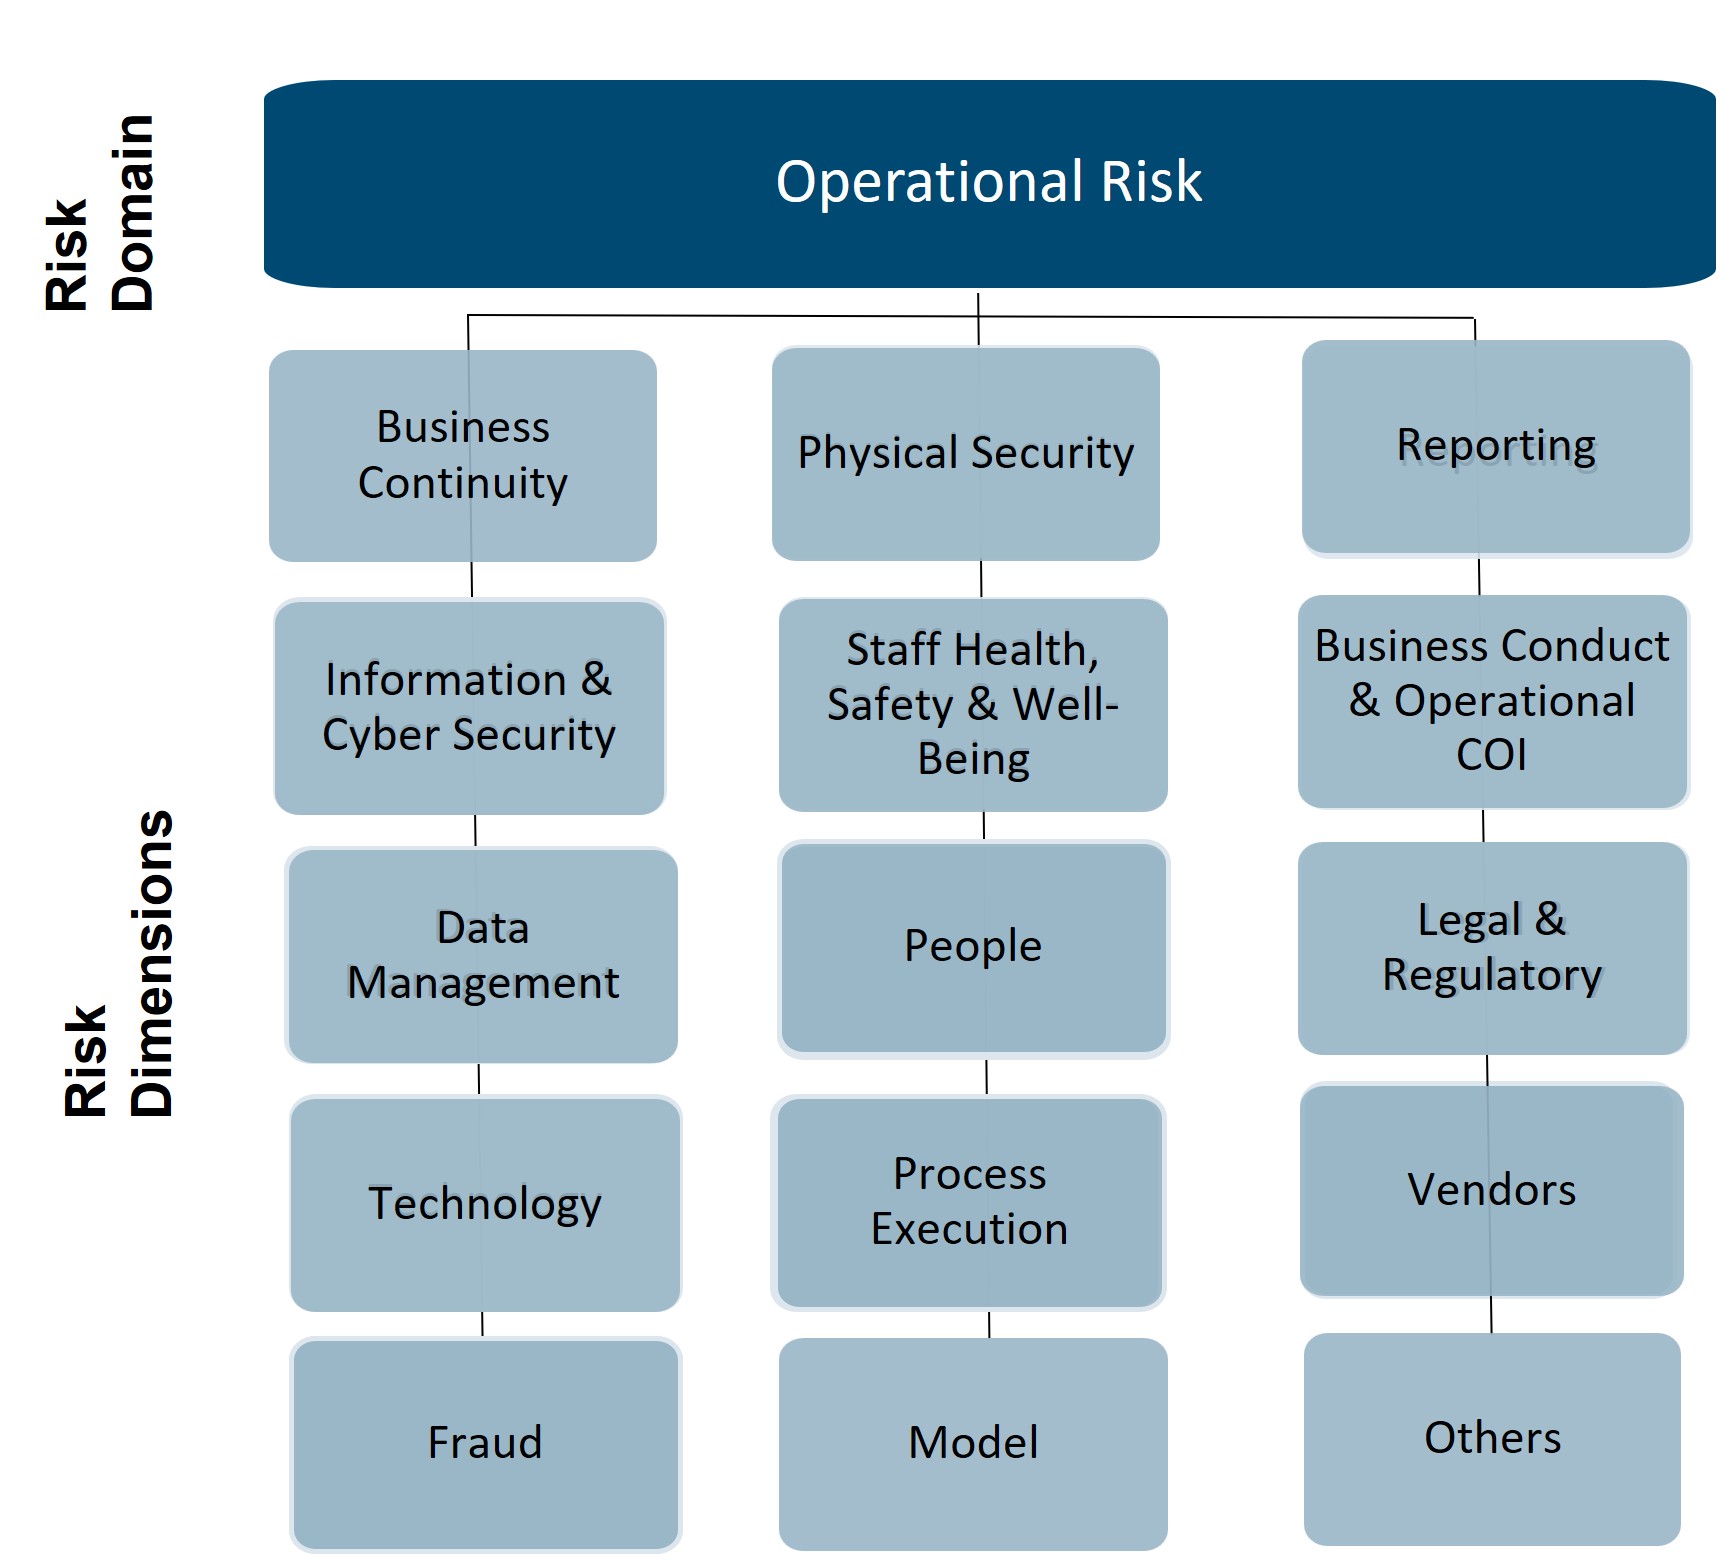
Figure 22: | IFC’s Risk Taxonomy | |
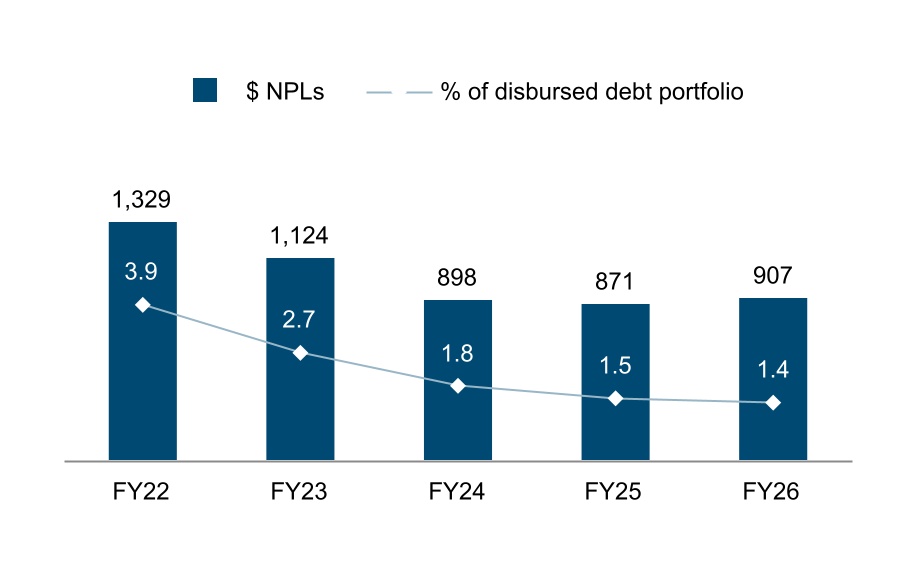
Figure 23: | NPLs as Percentage of Disbursed Debt Portfolio | |
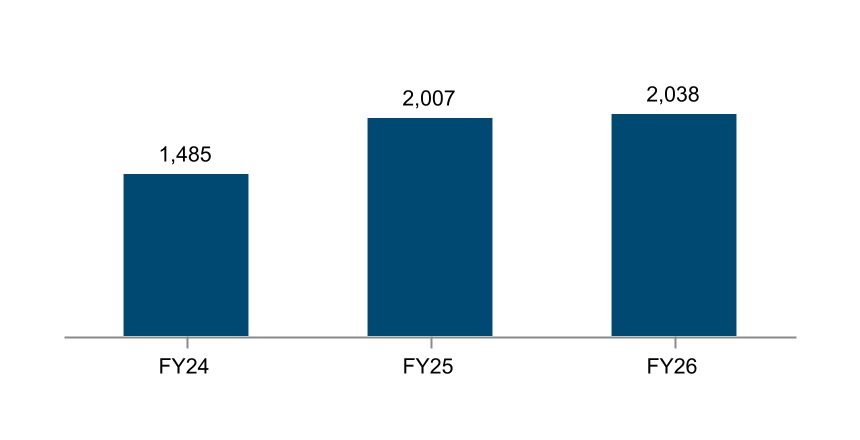
Figure 24: | IFC's Net Income FY24 – FY26 | |
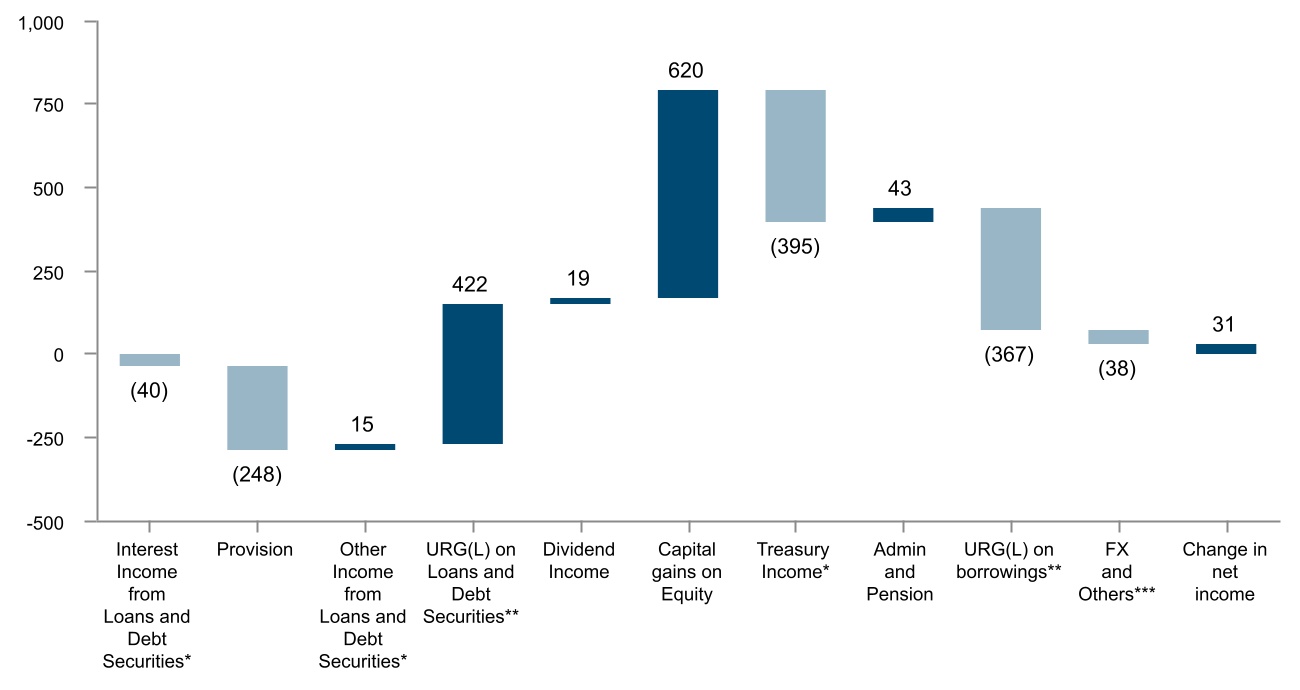
Figure 25: | Change in Net Income FY26 vs FY25 | |
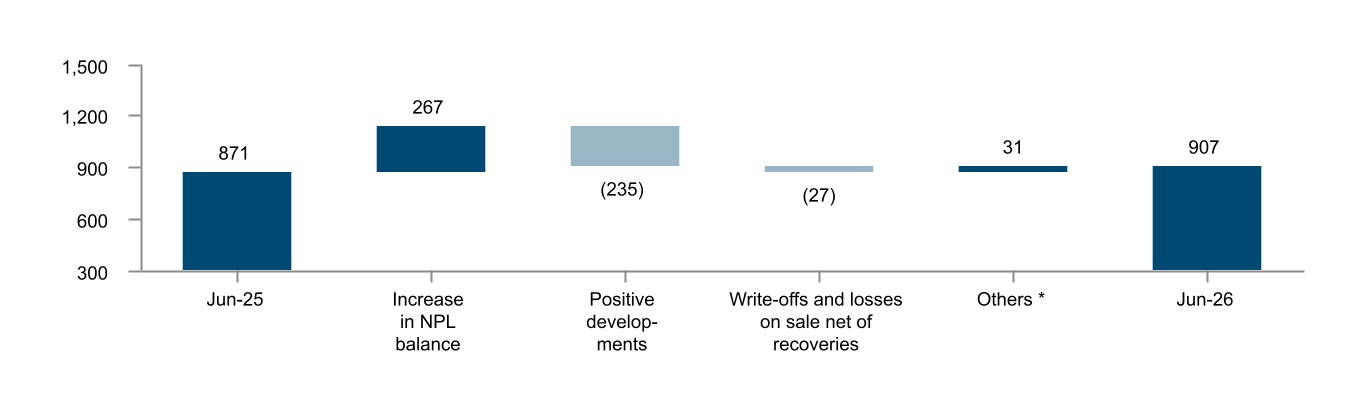
Figure 26: | Non-performing Loans | |
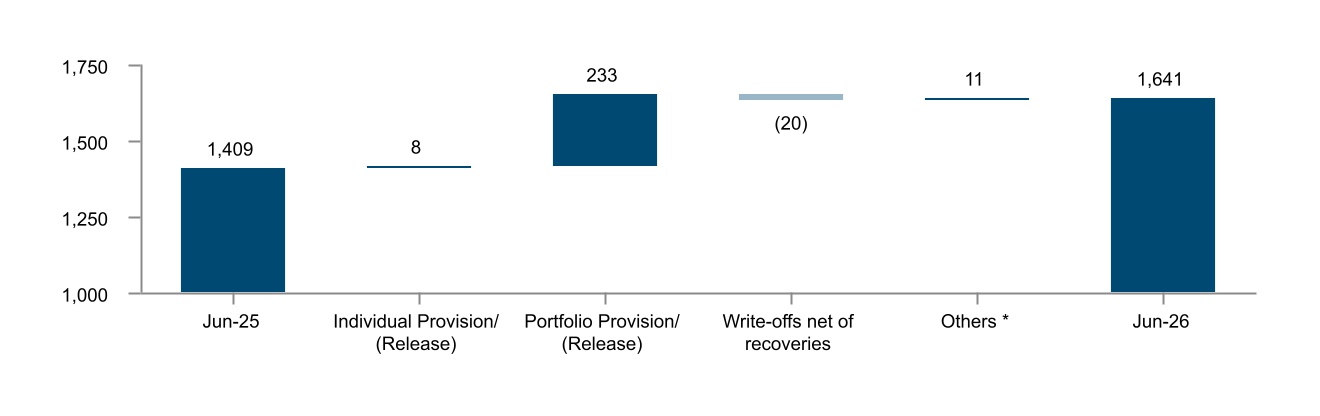
Figure 27: | Reserve against Losses for Disbursed and Undisbursed Loans | |
Figure 28: | Governance Structure | |
| | | | | | | | |
| INTERNATIONAL FINANCE CORPORATION | Page 5 |
| | |
| Management's Discussion and Analysis | |
SECTION l: SELECTED FINANCIAL DATA
This Management’s Discussion and Analysis (MD&A) discusses the financial results of the International Finance Corporation (IFC or the Corporation) for the fiscal year ended June 30, 2026 (FY26). The MD&A contains forward looking statements which may be identified by such terms as “anticipates”, “believes”, “expects”, “intends”, “plans”, “aims” or words of similar meaning. Such statements involve a number of assumptions and estimates that are based on current expectations, which are subject to risks and uncertainties beyond IFC’s control. Consequently, actual future results could differ materially from those currently anticipated. IFC undertakes no obligation to update any forward-looking statements.
The table below presents selected financial data as of June 30, 2026, June 30, 2025 and for the years ended on June 30, 2026, June 30, 2025 and June 30, 2024. Certain reclassifications of prior years’ information have been made to conform with the current year’s presentation.
Table 1: Financial Data Summary | | | | | | | | | | | | | | | | | | | | | |
| For the year ended June 30, |
(US$ in millions) | 2026 (FY26) | | 2025 (FY25) | | 2024 (FY24) | | | | |
| | | | | | | | | |
| | | | | | | | | |
| | | | | | | | | |
| | | | | | | | | |
| | | | | | | | | |
Statements of Operations | | | | | | | | | |
Net income (Section VIII) | $ | 2,038 | | | $ | 2,007 | | | $ | 1,485 | | | | | |
Allocable income (Section II) | 1,743 | | | 1,710 | | | 1,558 | | | | | |
| | | | | | | | | | | | | | | | | |
(US$ in millions) | June 30, 2026 | | June 30, 2025 | | | | | | |
Balance Sheets | | | | | | | | | |
Total assets | $ | 137,518 | | | $ | 129,740 | | | | | | | |
Liquid assets a (Section IV) | 44,401 | | | 44,784 | | | | | | | |
Investments (Section III) | 75,815 | | | 67,520 | | | | | | | |
Loans | 48,234 | | | 42,229 | | | | | | | |
Equity Investments | 13,485 | | | 11,777 | | | | | | | |
Debt Securities | 14,096 | | | 13,514 | | | | | | | |
Borrowings outstanding including fair value adjustments (Section V) | 76,383 | | | 71,450 | | | | | | | |
Total capital (Section V) | 43,308 | | | 40,928 | | | | | | | |
_________ | | | | | | | | | |
a Net of securities sold under repurchase agreements, payable for cash collateral received and associated derivatives. | | | | | | |
| | | | | | | | | |
Capital Utilization Ratio | June 30, 2026 | | June 30, 2025 | | | | | | |
Capital Utilization Ratio (CUR) | 64.8% | | 61.6% | | | | | | |
| | | | | | | | |
| INTERNATIONAL FINANCE CORPORATION | Page 6 |
| | |
| Management's Discussion and Analysis | |
SECTION ll: EXECUTIVE SUMMARY
This executive summary highlights selected information and may not contain all of the information that is important to readers of this document. For a complete description of IFC’s FY26 performance, as well as the risks and critical accounting estimates affecting IFC, this MD&A should be read in its entirety.
IFC is the largest global development institution focused on the private sector in emerging markets. Established in 1956, IFC is owned by 186 member countries, a group that collectively determines its policies. IFC is a member of the World Bank Group (WBG)1 and is a legal entity separate and distinct from the other WBG institutions, with its own Articles of Agreement, share capital, financial structure, management, and staff. Membership in IFC is open only to member countries of IBRD. IFC is not liable for the obligations of the other WBG institutions.
As one of the WBG entities, IFC's mission is to end extreme poverty and boost shared prosperity on a livable planet. Central to this mission is job creation, recognized as a key driver of sustainable development. The WBG's approach to job creation is anchored in three pillars in five high-impact sectors. The three pillars are: establishing critical infrastructure as a foundation for employment, fostering a business-enabling regulatory environment that sets clear, predictable and consistent policies and regulations, and mobilizing private capital to supplement public finance and catalyze investment at scale. The five sectors are: infrastructure and energy, smallholder agriculture and agribusiness, health, tourism, and value-added manufacturing. IFC plays a pivotal role in the third pillar by mobilizing private sector investment, scaling equity financing, deepening local capital markets, and expanding support to Micro, Small, and Medium Enterprises (MSME). To achieve these ambitions, IFC is tailoring approaches to country specific contexts, strengthening investor engagement, upskilling in key areas, and enhancing its capacity to manage both financial and non-financial risks. IFC is also deepening collaboration across the WBG through the Knowledge Bank, which unifies the expertise of the WBG across five verticals (People, Prosperity, Planet, Infrastructure, and Digital) to empower clients with integrated public and private sector solutions, accelerate thought leadership and innovation, and equip frontline staff with timely and actionable knowledge. By extending IFC's private sector expertise across this broader institutional platform, the Knowledge Bank directly reinforces job creation as the WBG's unifying development goal.
Recent initiatives underscore IFC’s strategic focus on Private Capital Mobilization (PCM) and job creation. In September 2025, IFC launched the Emerging Markets Securitization Program (EMSP), a new originate-to-distribute model to attract institutional private capital to emerging markets, by repackaging portions of IFC loans into rated securities issued by a special purpose vehicle. The initial issuance was $510 million in September 2025 followed by the second issuance of $509 million in June 2026, and the program is expected to scale in upcoming years. In February 2026, IFC signed the fourth round of the Managed Co-Lending Portfolio Program (MCPP) for Financial Institutions, with 19 global insurers pledging $6 billion in unfunded credit capacity for eligible senior loans to commercial banks and Non-Bank Financial Institutions. By transferring a portion of IFC's credit risk to the insurer panel, the program enables IFC to deploy larger volumes of financing to financial institution clients across emerging markets. Continuing to expand its originate-to-distribute toolkit, IFC signed its inaugural Trade Finance Synthetic Securitization in May 2026, a first-of-its-kind $500 million synthetic securitization designed to mobilize private capital to support trade finance in emerging markets and low-income and fragile and conflict-affected states.
Aligned with the objectives of the 2018 capital increase, IFC has continued to grow its footprint in the poorest member countries and fragile areas. IFC remains committed to delivering impact at scale by proactively adapting to the evolving global landscape while leveraging its unique strengths within the WBG to create opportunities and improve living standards for millions worldwide. Ongoing geopolitical conflicts, including those in the Middle East, continue to create a challenging environment for growth and development across emerging markets and developing economies. In response, the WBG is actively engaging with governments, the private sector, development partners, and other stakeholders to address these challenges – and IFC is working to sustain investment flows and support private sector resilience across its member countries.
FINANCIAL BUSINESS MODEL
IFC helps developing countries achieve sustainable growth by financing private sector investment, mobilizing capital in international financial markets, and providing advisory services to businesses and governments. IFC’s principal investment products are loans, equity investments, debt securities and guarantees. IFC also mobilizes private capital for development by attracting private capital to invest in projects through a diverse set of products and initiatives. Unlike most other development institutions, IFC does not accept host government guarantees of repayment. IFC raises virtually all of the funds for its lending activities through the issuance of debt obligations in the international capital markets, while maintaining a small borrowing window with IBRD. Equity investments are funded from capital (net worth). Proceeds of borrowings from market sources or net worth not immediately disbursed for investments are managed internally by IFC in its liquid asset portfolio.
1 The other institutions of the WBG are the International Bank for Reconstruction and Development (IBRD) and the International Development Association (IDA), collectively the World Bank, the Multilateral Investment Guarantee Agency (MIGA), and the International Centre for Settlement of Investment Disputes (ICSID).
| | | | | | | | |
| INTERNATIONAL FINANCE CORPORATION | Page 7 |
| | |
| Management's Discussion and Analysis | |
IFC’s capital base and its assets and liabilities, other than its equity investments, are primarily denominated in U.S. dollars ($ or US$) or swapped into U.S. dollars. Overall, IFC seeks to minimize foreign exchange and interest rate risks arising from its loans, debt securities and liquid assets by closely matching the currency and rate basis of its assets in various currencies with liabilities having the same characteristics. IFC generally manages non-equity investment related and certain lending related residual currency and interest rate risks by utilizing currency and interest rate swaps and other derivative instruments.
Sources and Uses of Income
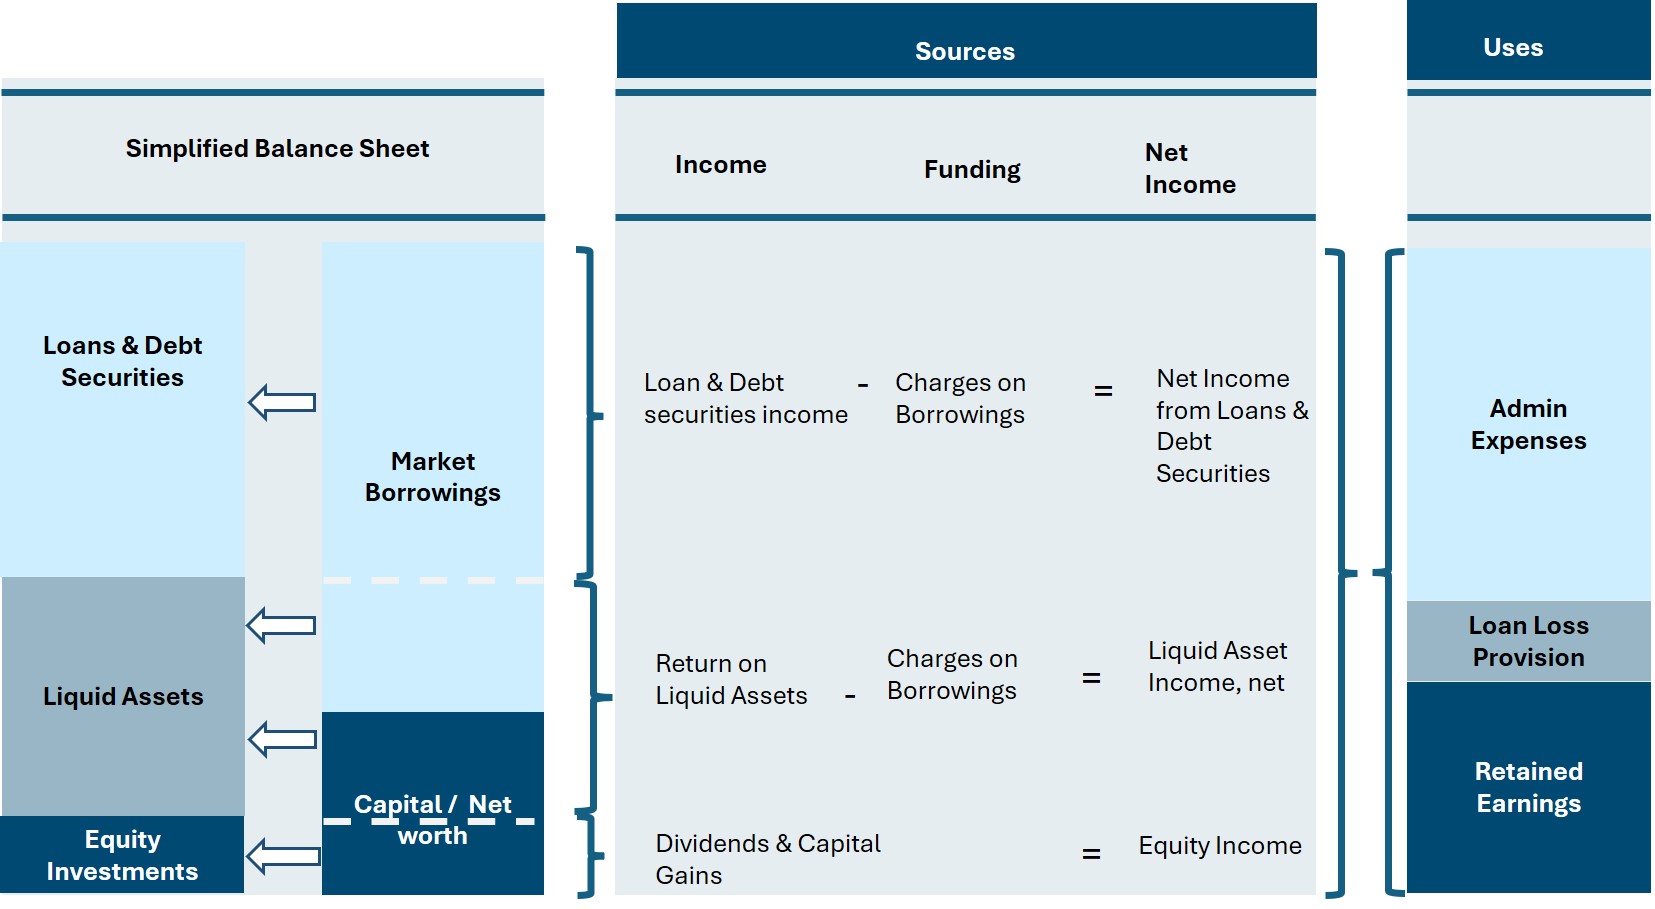
IFC’s primary sources of income are from its loans, debt securities, equity investments and liquid assets. The income generated covers administrative expenses and provisions for losses. For loans, debt securities and liquid assets, income is largely in the form of interest income net of charges on borrowings, as well as capital gains. IFC’s equity investments generate income through capital gains, as well as dividends (figure below).
Figure 1: Sources and Uses of Income
BASIS OF PREPARATION OF IFC’S CONSOLIDATED FINANCIAL STATEMENTS
IFC’s financial statements are prepared in accordance with accounting principles generally accepted in the United States of America (U.S. GAAP), and are independently audited on an annual basis. IFC’s accounting policies are discussed in more detail in Section VII: Critical Accounting Policies, and in Note A to IFC’s consolidated financial statements as of and for the year ended June 30, 2026 (FY26 consolidated financial statements).
Non-GAAP Measures
Management uses certain non-GAAP financial measures to evaluate the underlying operations and financial performance of IFC. A non-GAAP financial measure is a measure that is adjusted to exclude, include, or reclassify certain items or components from the most directly comparable measure calculated in accordance with U.S. GAAP and reported in the audited financial statements.
Allocable Income
IFC uses allocable income, a non-GAAP measure, as the basis for making net income allocation decisions. IFC defines allocable income as net income after certain adjustments. These adjustments primarily relate to unrealized gains and losses on IFC's loans, debt securities, equity investments and borrowings, income from the Post-retirement Contribution Reserve Fund (PCRF) and expenses related to prior year allocations. See more details in Section V: Funding Resources – Capital and Retained Earnings.
| | | | | | | | |
| INTERNATIONAL FINANCE CORPORATION | Page 8 |
| | |
| Management's Discussion and Analysis | |
The tables below outline a comparative breakdown of IFC's Statements of Operations, including a reconciliation of IFC’s net income to allocable income for the respective years ended on June 30, 2026, June 30, 2025 and June 30, 2024, as well as key Balance Sheet components and key financial ratios as of June 30, 2026 and June 30, 2025.
Table 2: Summary of Financial Results | | | | | | | | | | | | | | | | | | | | | |
| For the year ended June 30, |
(US$ in millions) | 2026 | | 2025 | | 2024 | | | | |
Consolidated statements of operations highlights | | | | | | | | | |
Income from loans and guarantees, including realized gains and losses on loans and associated derivatives | $ | 3,269 | | | $ | 3,373 | | | $ | 3,204 | | | | | |
Provision for losses on loans, off-balance sheet credit exposures and other receivables | (308) | | | (56) | | | (9) | | | | | |
Income from equity investments, including realized and unrealized gains and losses on equity and associated derivatives | 1,156 | | | 517 | | | 142 | | | | | |
Income from debt securities, including realized gains and losses on debt securities and associated derivatives | 819 | | | 819 | | | 811 | | | | | |
Release of provision (provision) for losses on available-for-sale debt securities | 10 | | | 6 | | | (12) | | | | | |
Income from liquid asset trading activities | 1,965 | | | 2,298 | | | 2,391 | | | | | |
Charges on borrowings | (3,579) | | | (3,596) | | | (3,815) | | | | | |
Other income | 616 | | | 602 | | | 587 | | | | | |
Administrative and other expenses | (2,020) | | | (2,028) | | | (1,827) | | | | | |
Foreign currency transaction losses on non-trading activities | (60) | | | (43) | | | (115) | | | | | |
Income before net unrealized gains and losses on loans, debt securities, borrowings and related derivatives | 1,868 | | | 1,892 | | | 1,357 | | | | | |
Net unrealized gains on loans, debt securities, borrowings and related derivatives | 170 | | | 115 | | | 128 | | | | | |
Net income | 2,038 | | | 2,007 | | | 1,485 | | | | | |
Adjustments to reconcile net income to allocable income | | | | | | | | | |
Unrealized (gains) losses on loans and debt securities a | (38) | | 384 | | (182) | | | | |
Unrealized (gains) losses on equity investments a | (474) | | (157) | | 231 | | | | |
Unrealized (gains) losses on borrowings a | (132) | | (499) | | 54 | | | | |
PCRF income | (16) | | (25) | | (30) | | | | |
Expenses funded by prior years’ allocations b | 365 | | | — | | — | | | | |
Allocable income | $ | 1,743 | | | $ | 1,710 | | | $ | 1,558 | | | | | |
_________ |
a Unrealized gains and losses on loans, debt securities, equity investments and borrowings presented in this table include unrealized gains and losses from associated derivatives. b Effective March 2026, to better measure income generated by current year activities, the allocable income (a non-GAAP performance measure) calculation has been refined by adding back expenses funded by prior years' approved allocations – $194 million for FY26 and a one-time adjustment of $171 million relating to FY25. |
| | | | | | | | |
| INTERNATIONAL FINANCE CORPORATION | Page 9 |
| | |
| Management's Discussion and Analysis | |
| | | | | | | | | | | | | | | | | |
(US$ in millions) | June 30, 2026 | | June 30, 2025 | | | | | | |
Consolidated balance sheets highlights | | | | | | | | | |
Total assets | $ | 137,518 | | | $ | 129,740 | | | | | | | |
Liquid assets a | 44,401 | | | 44,784 | | | | | | | |
Investments | 75,815 | | | 67,520 | | | | | | | |
Loans | 48,234 | | | 42,229 | | | | | | | |
Equity Investments | 13,485 | | | 11,777 | | | | | | | |
Debt Securities | 14,096 | | | 13,514 | | | | | | | |
Borrowings outstanding, including fair value adjustments | 76,383 | | | 71,450 | | | | | | | |
Total capital | 43,308 | | | 40,928 | | | | | | | |
of which | | | | | | | | | |
General reserve | 14,275 | | | 12,913 | | | | | | | |
Cumulative fair value and other adjustments | 818 | | | 158 | | | | | | | |
Unallocated net income | 1,743 | | | 1,881 | | | | | | | |
Other reserves | 504 | | | 350 | | | | | | | |
Accumulated other comprehensive income (AOCI) | 1,672 | | | 1,617 | | | | | | | |
Paid-in capital | 24,296 | | | 24,009 | | | | | | | |
_________ |
a Net of securities sold under repurchase agreements, payable for cash collateral received and associated derivatives. |
Table 3: Key Financial Ratios
| | | | | | | | | | | | | | |
| |
| | | | | | |
| | | | | | |
| | | | | | |
| | | | | | |
| | | | | | |
| | | | | | |
| | | | | | |
(US$ in billions, except ratios) | June 30, 2026 | | June 30, 2025 | | | |
Overall liquidity ratio a | 78.6% | | 71.6% | | | |
Debt to equity ratio b | 2.0 | | 2.0 | | | |
Total reserve against losses on loans to total committed portfolio c | 2.9% | | 2.8% | | | |
Capital measures: | | | | | | |
Capital Available d | $ | 40.7 | | $ | 39.0 | | | |
Capital Required e | 26.4 | | 24.0 | | | |
CUR f | 64.8% | | 61.6% | | | |
_________ |
a IFC’s overall liquidity ratio is calculated as IFC’s liquidity, plus undrawn borrowing commitments from IBRD, divided by the next three years’ estimated net cash requirements. The ratio stood at 78.6% as of June 30, 2026, above the minimum Board approved requirement of 45%. |
b Debt to equity (leverage) ratio is defined as outstanding borrowings plus committed guarantees divided by total capital (comprised of paid-in capital, retained earnings and AOCI). IFC’s debt to equity ratio as of June 30, 2026 was well within the maximum of 4 required by the policy approved by IFC’s Board of Directors. |
c Total reserve against losses on loans to total committed portfolio is defined as reserve against losses on loans as a percentage of the total committed loans at amortized cost. |
d Capital Available: Resources available to absorb potential losses, calculated as: The sum of IFC's paid-in capital, General Reserve, unallocated net income and AOCI, minus the pension surplus of each pension plan, and PCRF assets. |
e Capital Required: Aggregate minimum Economic Capital required to maintain IFC’s AAA/Aaa rating. |
f CUR is defined as Capital Required divided by Capital Available. |
| | | | | | | | |
| INTERNATIONAL FINANCE CORPORATION | Page 10 |
| | |
| Management's Discussion and Analysis | |
FINANCIAL PERFORMANCE SUMMARY
IFC’s financial performance has been influenced by its results from operations, changes in interest rates, foreign exchange rate movements, and the volatility of emerging equity markets in FY26.
Net income and allocable income
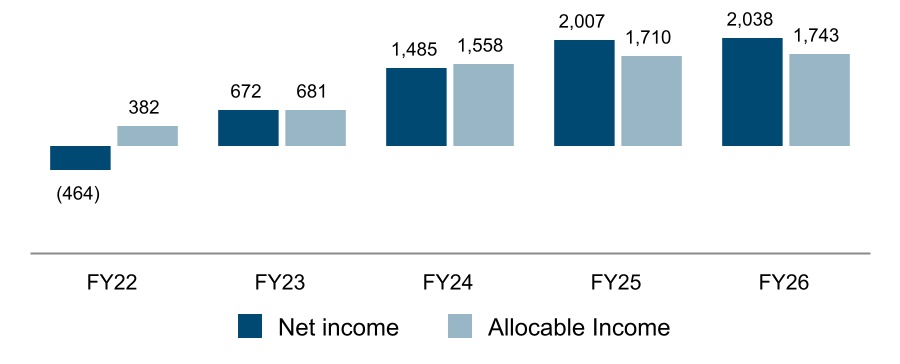
IFC reported net income of $2,038 million in FY26 ($2,007 million – the year ended June 30, 2025 (FY25)). Allocable income totaled $1,743 million in FY26 ($1,710 million – FY25). Net income increased slightly by $31 million, primarily driven by higher equity income and higher loans and debt securities income, which were largely offset by lower treasury income and lower unrealized gains on borrowings. Effective March 2026, to better measure income generated by current year activities, the calculation of allocable income has been refined by adding back expenses funded by prior-years' approved allocations totaling $365 million – $194 million for FY26 and a one-time adjustment of $171 million relating to FY25. Excluding this adjustment, allocable income decreased by $332 million compared to FY25, primarily due to lower treasury income.
Figure 2: Income Measures (US$ in millions)
On August 5, 2026, the Board of Directors approved the allocation of $173 million to the Creating Markets Advisory Window (CMAW) reserve, $125 million to the Funding Mechanism for Technical Assistance and Advisory Services (FMTAAS) reserve, and $1,385 million to the General Reserve from IFC's FY26 net income. This designation is expected to be noted with approval by the Board of Governors in the fiscal year ended June 30, 2027 (FY27). In addition, the Board of Directors approved the transfer of $100 million from the Surplus account to the Frontier Opportunities Fund (FOF) and recommended to IFC's Board of Governors a transfer of $60 million to the Surplus account from IFC’s FY26 net income. See more details in Section V: Funding Resources – Capital and Retained Earnings.
Investment Operations
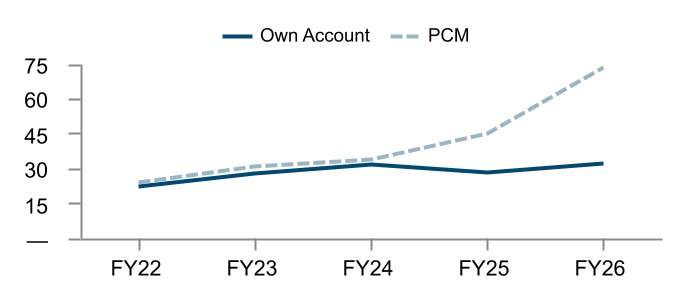
Beginning in FY26, IFC’s investment commitments (a non-GAAP performance measure) comprise Own Account and Private Capital Mobilization (PCM) commitments. Own account commitments represent investments made by IFC using its own borrowings or capital. PCM commitments reflect the assessed amount of private financial resources committed alongside IFC commitments, whether through financing, guarantees or technical assistance. PCM is included in the WBG's scorecard and is in accordance with the methodology harmonized across Multilateral Development Banks and European Development Financial Institutions. Amounts mobilized are generally not recorded as IFC's financial transactions. Refer to Section III: Client Services for details.
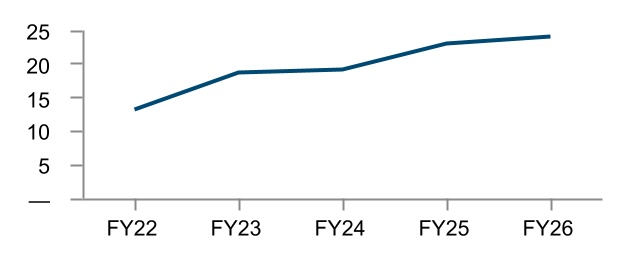
In FY26, IFC’s commitments comprised $32.0 billion from its own account ($28.3 billion – FY25) and $73.6 billion from PCM ($45.1 billion – FY25). IFC disbursed $24.0 billion in FY26 ($23.0 billion – FY25) excluding guarantees. See more details in Section III: Client Services.
Figure 3: Own Account and PCM Commitments (US$ in billions) Figure 4: Disbursements (US$ in billions)
| | | | | | | | |
| INTERNATIONAL FINANCE CORPORATION | Page 11 |
| | |
| Management's Discussion and Analysis | |
| | |
Investment Portfolio |
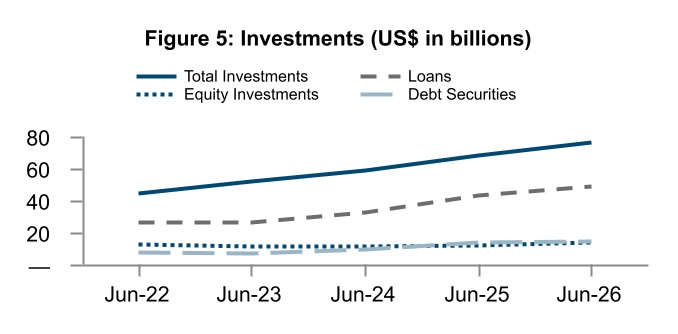
The carrying valuea of IFC's outstanding investment portfolio was $75.8 billion as of June 30, 2026, an increase of $8.3 billion compared to June 30, 2025. The portfolio's growth primarily resulted from the $8.1 billion of net disbursements (disbursements net of repayments, prepayments, and divestments) during FY26 driven by IFC’s high level of commitments in recent years. |
| | |
Liquid Assets |
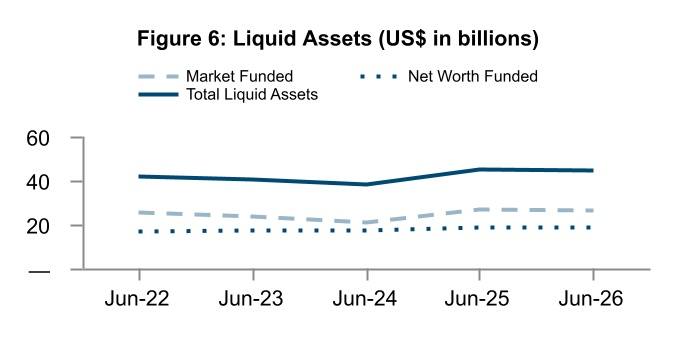
The Net Asset Value (NAV) of the liquid asset portfolio decreased by $383 million to $44.4 billion as of June 30, 2026 from June 30, 2025. This reflected a decline of $469 million in the Market Funded portfolio due to the net loan disbursements exceeding net inflows from borrowings. The Net Worth Funded portfolio increased slightly as the increase from paid-in capital and retained earnings was largely offset by net equity disbursements. |
| | |
Borrowings |
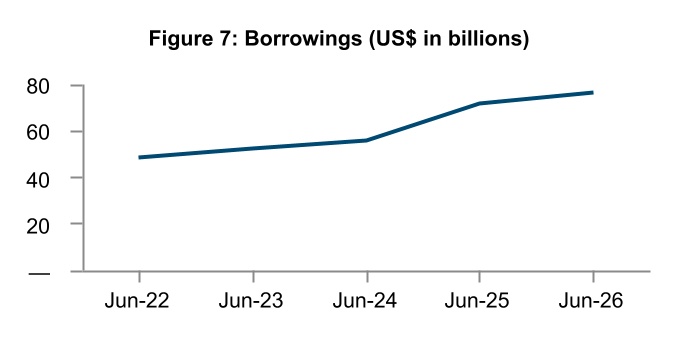
Borrowings outstanding (including fair value adjustments) increased by $4.9 billion from $71.5 billion as of June 30, 2025 to $76.4 billion as of June 30, 2026, mainly due to net new issuances of $6.2 billion. New borrowings in FY26 were $30.6 billion as compared to $35.6 billion in FY25, including $19.6 billion under the medium and long-term borrowing program, $10.3 billion under the short-term discount note program, and $740 million from securitized borrowings issued through securitization Special Purpose Vehicles (SPVs). |
Economic Capital Framework
| | |
IFC’s Capital Adequacy, as measured by Capital Utilization Ratio (CUR), was 64.8% as of June 30, 2026, up from 61.6% as of June 30, 2025. The change was attributable to increases in Capital Required outweighing the increase in Capital Available. Capital Available was primarily driven by the growth in retained earnings and paid-in capital. The increase in Capital Required was mainly driven by the need for additional capital to support the Equity portfolio. |
_________
a Please refer to Section III: Client Services Disbursed Investment Portfolio section for the definition of carrying value.
| | | | | | | | |
| INTERNATIONAL FINANCE CORPORATION | Page 12 |
| | |
| Management's Discussion and Analysis | |
SECTION lll: CLIENT SERVICES
BUSINESS OVERVIEW
For all new investments, IFC articulates the expected impact on sustainable development and, as projects mature, assesses the quality of the development benefits realized. IFC’s strategic focus areas are aligned to advance the WBG’s global priorities.
INVESTMENT SERVICES
IFC’s investments are normally made in its developing member countries. IFC's Articles of Agreement mandate that IFC shall invest in productive private enterprises. The existence of a government or other public interest in such an enterprise does not necessarily preclude IFC from making an investment therein under certain circumstances, such as if such enterprises are organized under local commercial and corporate law, operate free of host government control in a market context and according to profitability criteria, and/or are in the process of being completely or partially privatized.
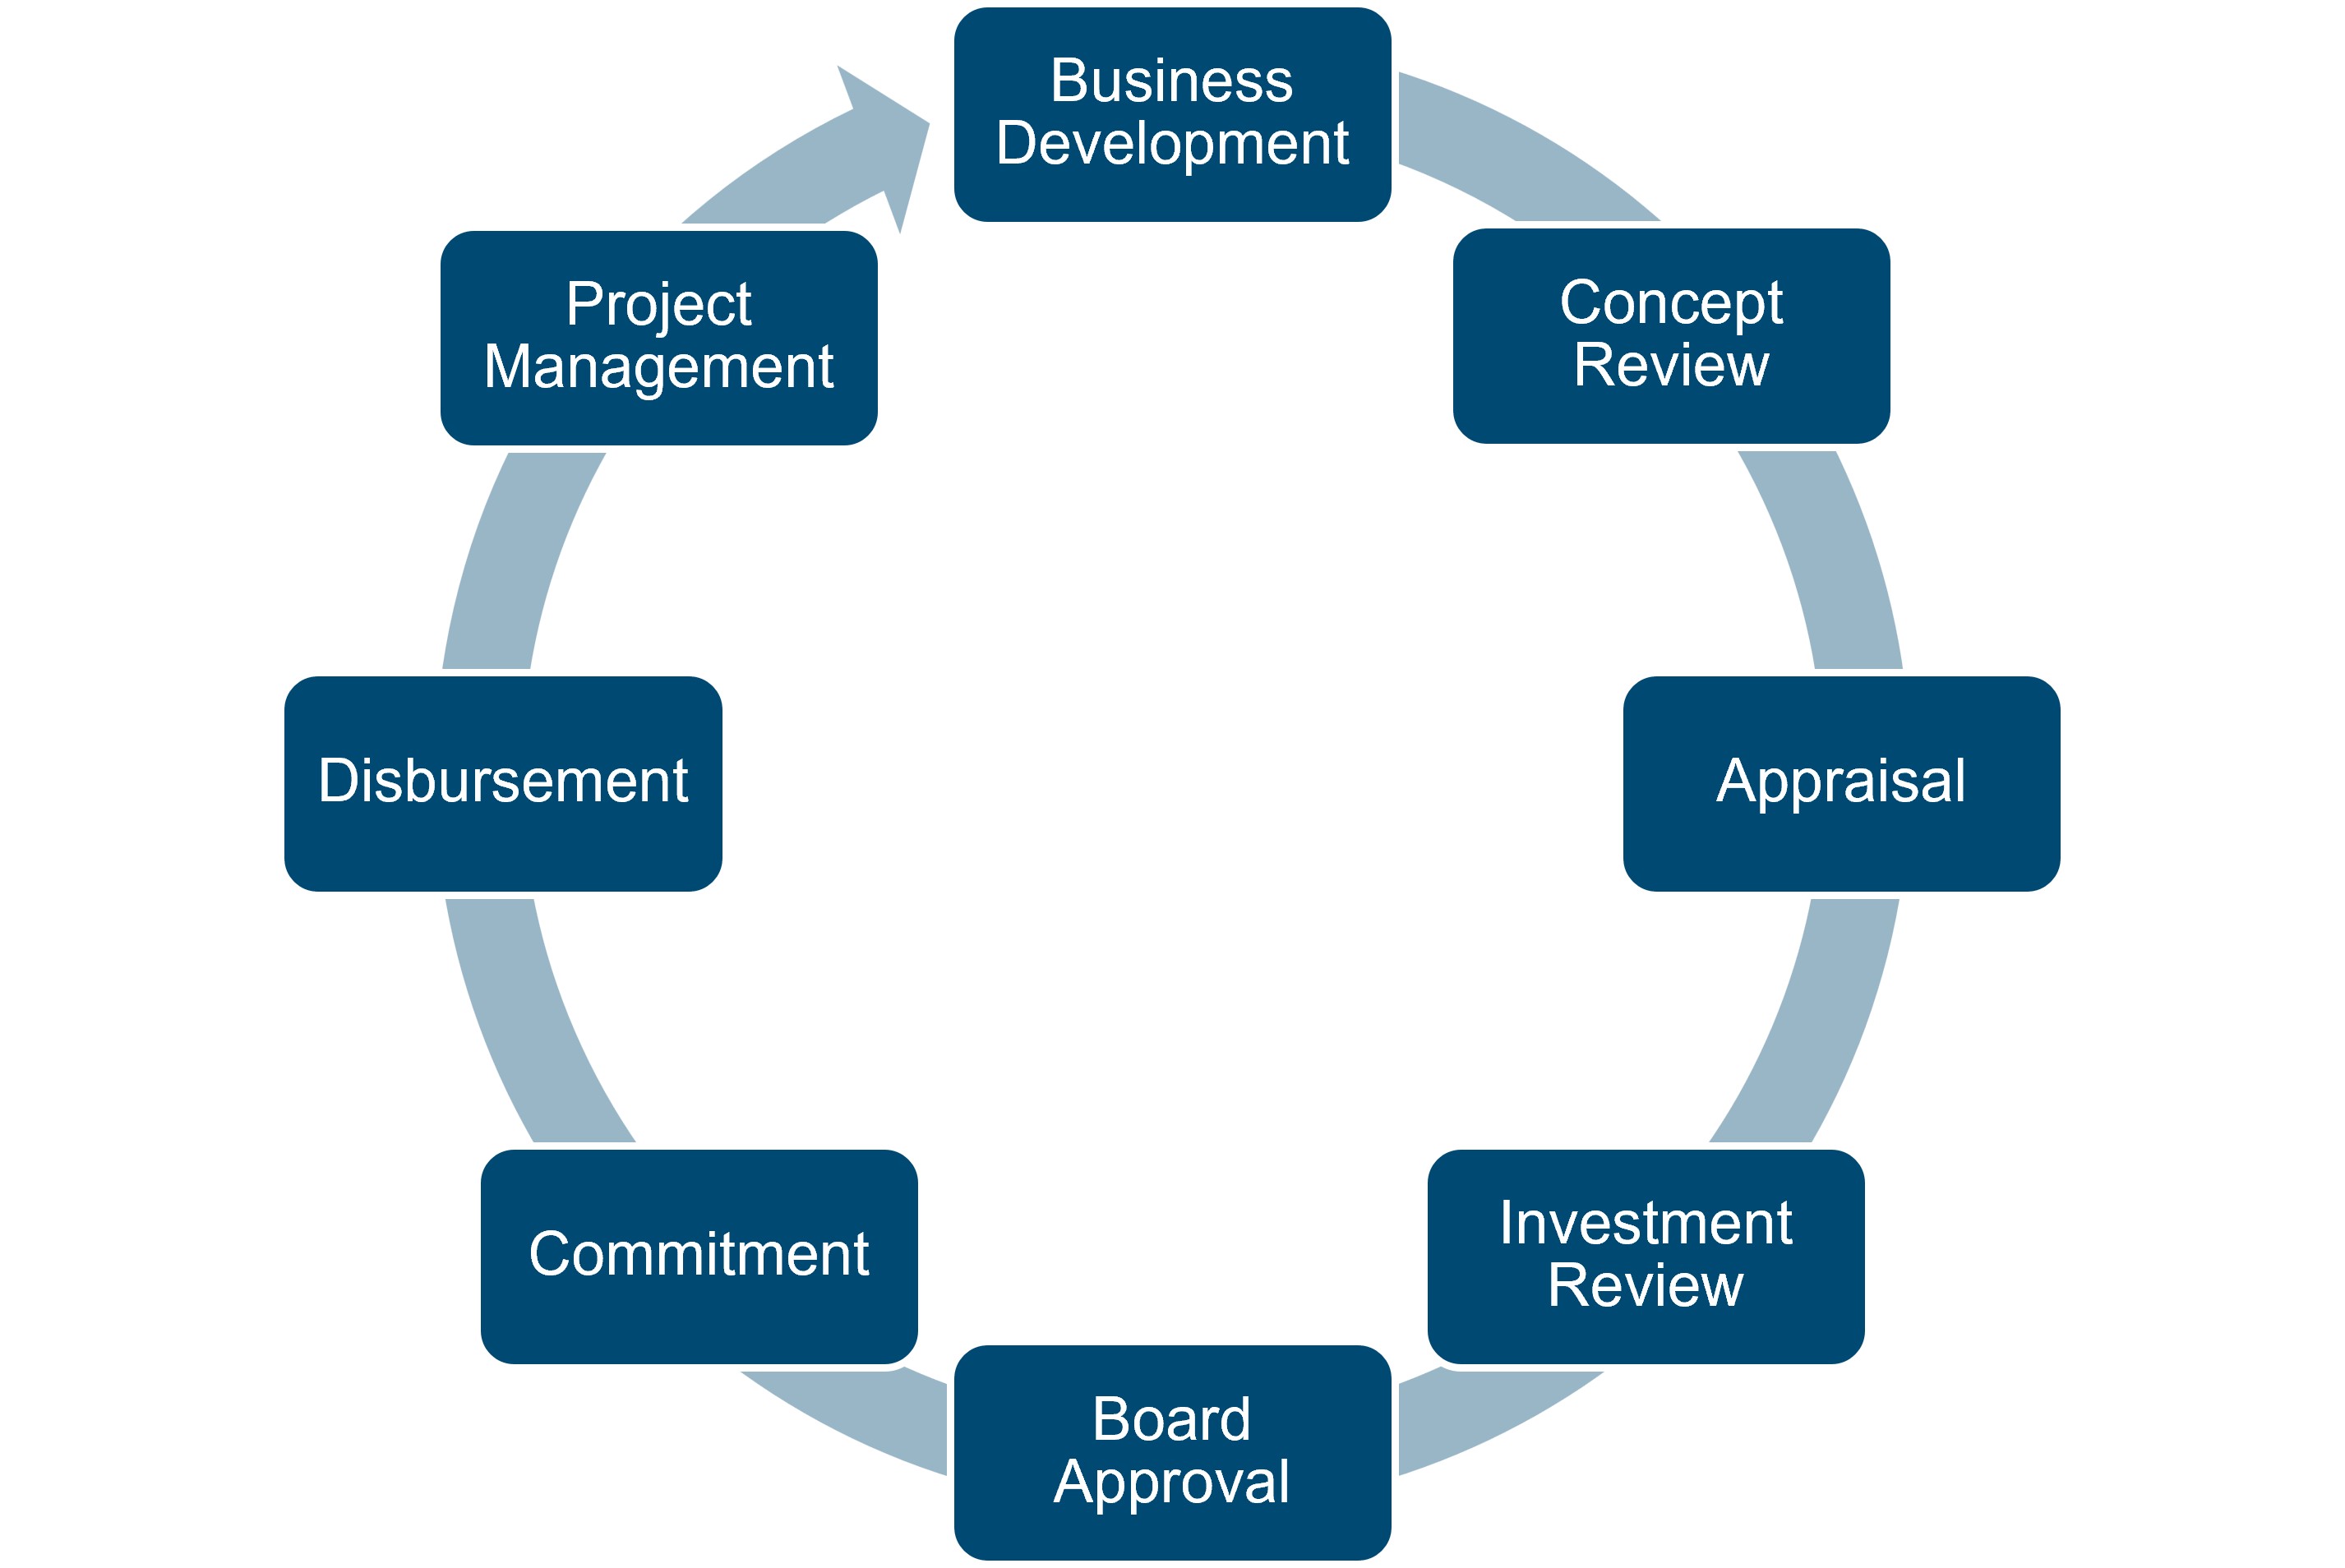
IFC’s investment project cycle generally includes the following stages:
Figure 9: IFC’s Investment Project Cycle
IFC’s investment products and services are designed to meet the needs of clients in different industries – principally infrastructure, manufacturing, agribusiness, disruptive technologies and funds, services, and financial markets. Investment services product lines include: loans, equity investments, debt securities, trade and supply chain finance, guarantees and partial credit guarantees, securitizations, Client Risk Management services, blended finance, and private capital mobilized, discussed below.
IFC supervises its investments by closely monitoring project performance and ensuring compliance with contractual obligations and IFC’s policies and procedures.
INVESTMENT PRODUCTS
Loans – IFC finances projects and companies through loans from its own account, typically for maturities of five to ten years. IFC also makes loans to intermediary banks, leasing companies, and other financial institutions for on-lending. While IFC’s loans have traditionally been denominated in the major currencies, IFC has made it a priority to structure local currency products. IFC has provided funding in 88 local currencies. Pricing of IFC’s loans reflects market conditions and country and project risks, and loans are typically variable rate (or swapped into variable rate). IFC also mobilizes additional financing from third parties through syndications and parallel loans to increase funding capacity as detailed under mobilization products.
| | | | | | | | |
| INTERNATIONAL FINANCE CORPORATION | Page 13 |
| | |
| Management's Discussion and Analysis | |
Equity Investments – Equity investments provide developmental support and long-term growth capital that private enterprises need. IFC invests directly in companies’ equity, and also through private-equity funds. IFC is an active minority growth investor, typically holding stakes of up to 20 percent of a company’s equity, depending on sector/growth stage. IFC’s direct equity investments are typically in the form of common or preferred stock. Additionally, IFC invests in funds providing long-term growth capital to established businesses, aiming to scale operations, improve Environmental and Social (E&S) standards, and eventually prepare investee companies for public listings. Equity investments are usually denominated in the currency of the country in which the investment is made. IFC also uses put and call options, profit participation features, conversion features, warrants and other types of instruments in managing its equity investments. IFC also invests in mezzanine/quasi-equity instruments, such as convertible debt, subordinated loans with equity-like features, and other structured instruments that combine elements of debt and equity to align risk and return profiles with project needs.
Debt Securities – Investments typically in the form of bonds and notes, securitized debt obligations (e.g., Asset-Backed Securities (ABS), Mortgage-Backed Securities (MBS), and other collateralized debt obligations) and preferred shares that are mandatorily redeemable by the issuer or puttable to the issuer by IFC, to support capital market development and provide diversified financial solutions to clients.
Trade and Supply Chain Finance – IFC’s Trade and Supply Chain Finance programs offer guarantees, risk-sharing facilities, loans and other structured products to support trade and supply chains in emerging markets. IFC’s Global Trade Finance Program guarantees trade-related payment obligations of approved financial institutions. Separately, the Global Trade Liquidity Program offers risk sharing for trade in developing member countries. IFC also has a number of other Trade and Supply Chain Finance related programs, including Global Trade Supplier Finance, Global Supply Chain Finance Program, Global Warehouse Finance Program, and Global Trade Structured Transactions Program among others.
Guarantees and Partial Credit Guarantees – IFC provides guarantees for debt instruments, including portfolio risk sharing facilities, and trade obligations of clients. These guarantees cover commercial as well as noncommercial risks. While IFC provides local currency guarantees, the client is generally obligated to reimburse IFC in U.S. dollar terms when a guarantee is called. A partial credit guarantee represents a promise of full and timely debt service payment up to a predetermined amount. Typically, the sum that IFC pays out under a guarantee covers creditors subject to the terms of the guarantee and applicable conditions, including eligibility of claims.
Securitizations – IFC invests in domestic or cross-border securitizations and provides credit enhancement to transactions through funded or unfunded participations, mainly at the mezzanine level.
Client Risk Management Services – IFC extends long-maturity risk management products (e.g., swaps) to clients in developing member countries to allow them to hedge their interest rate, currency, and commodity-price exposures.
Blended Finance – IFC blends concessional funds, typically from development partners, alongside its own commercial funding, using a number of complementary tools to crowd in private sector financing that would otherwise not be available to projects with high development impact.
Private Capital Mobilization (PCM) commitments reflect the assessed amount of private financial resources committed alongside IFC commitments, whether through financing, guarantees or technical assistance. PCM has two elements: Private Direct Mobilization (PDM) and Private Indirect Mobilization (PIM). PDM is the financing provided by a private entity on commercial terms due to the active and direct involvement of IFC, including through guarantees, leading to the commitment. Transactions will only be counted as PDM when there is supporting evidence, including a mandate letter, fees linked to financial commitment, or other auditable evidence of the active and direct role of IFC in mobilizing funds to the clients from private third-party investors. PIM is financing or investment by private entities in a project in which IFC is also a co-financier and/or guarantor, without playing an active and direct role to mobilize private investors.
| | | | | | | | |
| INTERNATIONAL FINANCE CORPORATION | Page 14 |
| | |
| Management's Discussion and Analysis | |
INVESTMENT PORTFOLIO MANAGEMENT
At the core of IFC’s approach to portfolio management is the objective to build and proactively manage a portfolio that produces strong financial results and development impact. IFC implements this approach through a combination of strong presence on the ground and deep sector expertise, which enables IFC to stay close to its clients and markets, monitor trends and anticipate impacts of external factors.
Active portfolio management depends on timely and accurate information to drive business decisions. Regional investment teams regularly review the regional industry portfolio with IFC’s senior management and risk teams to ensure continued oversight and assess broad trends as well as performance of select projects. Additionally, quarterly reviews of IFC’s portfolio results are presented to the Board. IFC's investment and portfolio teams, largely based in field offices, complement global reviews with asset-by-asset quarterly assessments for investments.
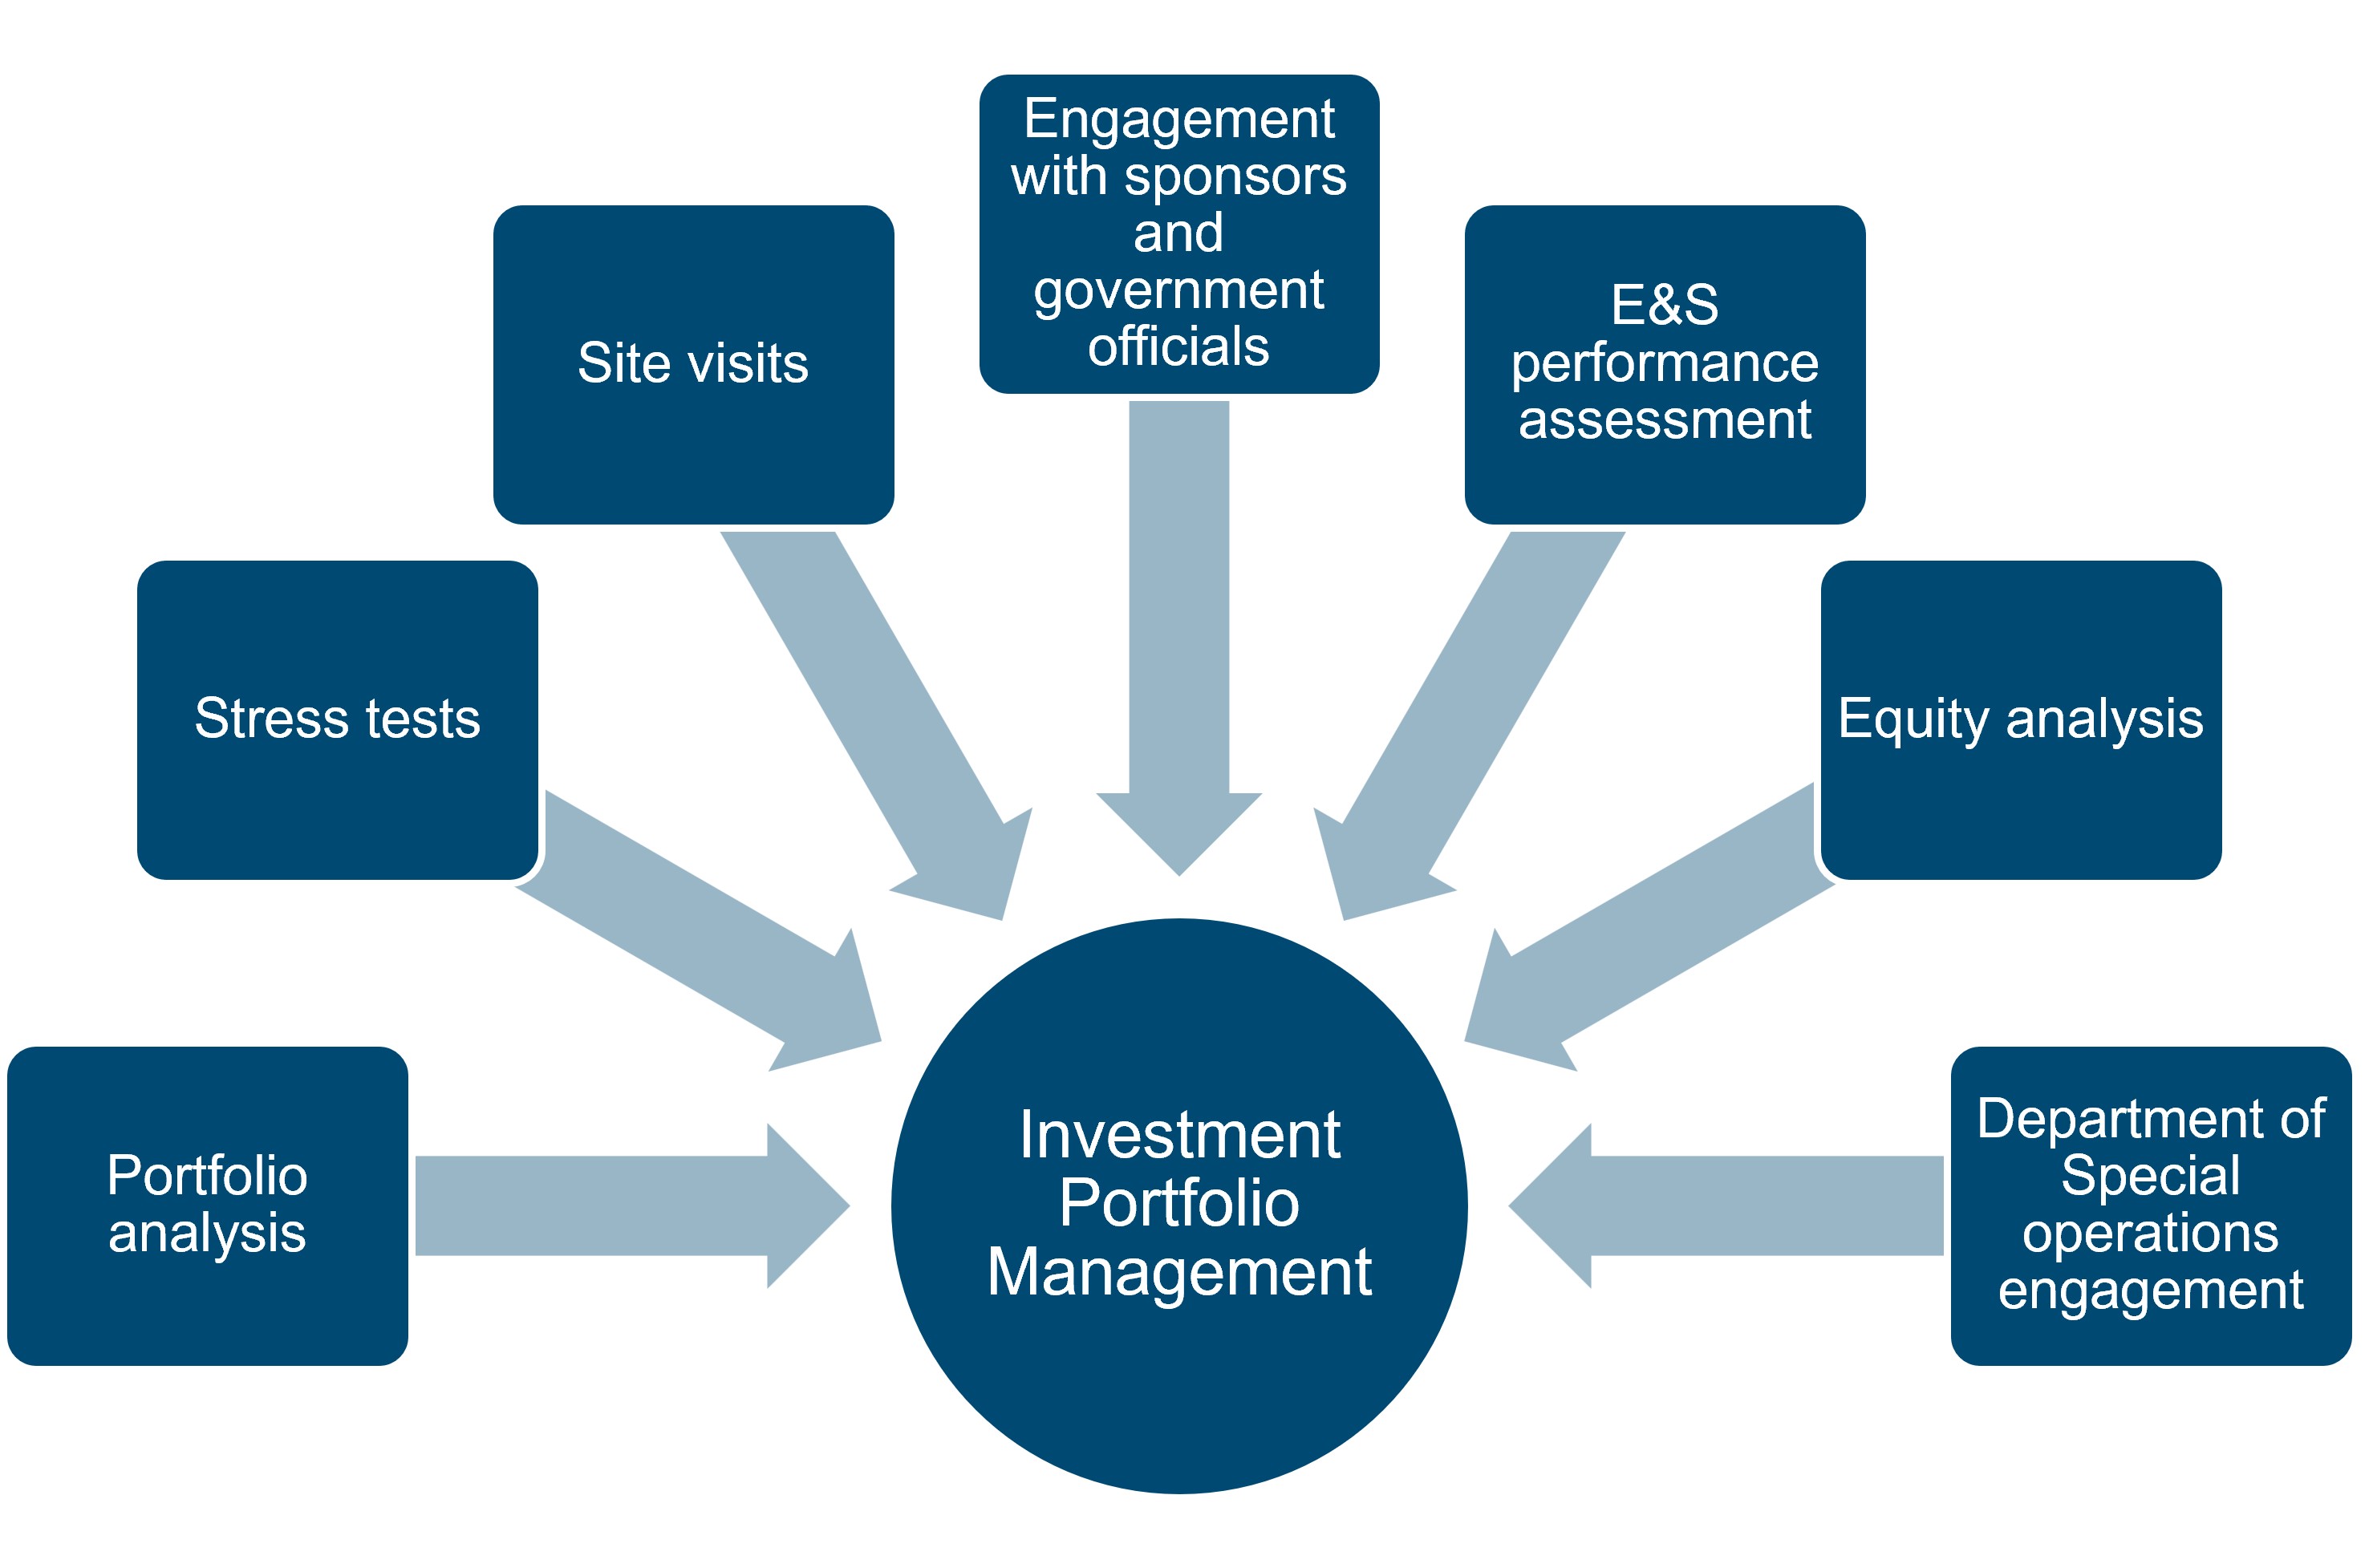
Figure 10: IFC’s Investment Portfolio Management
At the corporate level, IFC combines portfolio analysis with sector and local expertise along with project knowledge and projections of global macroeconomic and market trends to inform decisions about program and strategy. IFC also regularly conducts stress tests to assess the performance of the portfolio against possible macroeconomic developments, and to identify and address risks.
At the project level, IFC’s multidisciplinary teams, including investment and sector specialists with deep industry expertise, closely monitor investment performance and compliance with investment agreements. IFC does this through site visits to evaluate project implementation, and through active engagement with sponsors and government officials, where relevant, to seek to identify potential problems early on and formulate appropriate solutions. IFC also monitors clients’ E&S performance in a risk-based manner and measures financial performance and development results.
IFC closely assesses its equity portfolio on an ongoing basis including proactively identifying assets ready for divestments where IFC’s development role has been completed. This rebalancing of the equity portfolio is the result of an analysis that takes into account market conditions, opportunities, expected returns, and risks, and is adjusted periodically as required. To improve its governance structure, IFC has appointed Global Equity Heads, who focus on strategic business development, central oversight and management of IFC’s larger and more complex equity positions throughout the investment lifecycle and established a specialized equity risk unit focused on the same assets.
For projects in financial distress, IFC’s Department of Special Operations determines the appropriate remedial actions to optimize the Corporation’s overall return on a net present value basis while minimizing reputational risk and, where possible, maximizing developmental impact. It seeks to keep the project operational to achieve the intended development impact and negotiates agreements with creditors and shareholders to share the burden of restructuring. Investors and other partners participating in IFC’s operations are kept regularly informed, and IFC consults or seeks their consent as appropriate.
IFC continues to invest in information-technology systems to better support the management of its portfolio, and continuously enhance its governance, through the Operations Management Department, which works closely with stakeholders both in the global industry and regional departments.
| | | | | | | | |
| INTERNATIONAL FINANCE CORPORATION | Page 15 |
| | |
| Management's Discussion and Analysis | |
INVESTMENT PROGRAM
Commitments
IFC’s own account investments supported 449 Long-Term finance projects in FY26 (346 – FY25). The table below outlines a comparative breakdown of IFC's commitments in FY26 and FY25:
Table 4: IFC Commitments | | | | | | | | | | | | | | | | | |
| For the year ended June 30, |
(US$ in millions) | 2026 | | 2025 | | Variance |
Long-Term Finance Own Account Commitments a, b | | | | | |
Loans | $ | 15,171 | | | $ | 14,262 | | | $ | 909 | |
Equity Investments | 3,539 | | | 2,061 | | | 1,478 | |
Guarantees | 2,729 | | | 1,845 | | | 884 | |
Client Risk Management | 50 | | | 21 | | | 29 | |
Total Long-Term Finance Own Account Commitments | $ | 21,489 | | | $ | 18,189 | | | $ | 3,300 | |
| | | | | |
Short-Term Finance Own Account | 10,488 | | | 10,095 | | | 393 | |
Total Own Account Commitments | $ | 31,977 | | | $ | 28,284 | | | $ | 3,693 | |
Private Capital Mobilization c | | | | | |
Private Direct Mobilization | $ | 51,527 | | | $ | 34,202 | | | $ | 17,325 | |
Private Indirect Mobilization | 22,056 | | | 10,872 | | | 11,184 | |
Total Private Capital Mobilization | $ | 73,583 | | | $ | 45,074 | | | $ | 28,509 | |
___________ | | | | | |
a Starting FY26 Q2 (three months ended December 31, 2025), commitments are presented as net commitments, excluding cancellations relating to commitments approved in the same fiscal year. The changes were applied prospectively. LTF Own Account commitments for the year ended June 30, 2025 would be $17,974 million on a net commitments basis. |
b Debt security commitments are included in loans or equity investments based on their predominant characteristics. |
c PCM as reported represents long-term finance PCM and excludes Public Direct Mobilization of $9.0 billion in FY26 ($3.9 billion in FY25) |
INVESTMENT DISBURSEMENTS
During FY26, IFC disbursed $24.0 billion for its own account ($23.0 billion - FY25) as presented in the table below:
Table 5: Disbursements of IFC’s Investment Portfolio
| | | | | | | | | | | | | | | | | | | |
| For the year ended June 30, |
(US$ in millions) | 2026 | | 2025 | | Variance | | |
Loans | $ | 17,525 | | | $ | 17,574 | | | $ | (49) | | | |
Equity Investments | 2,535 | | | 1,710 | | | 825 | | | |
Debt Securities | 3,963 | | | 3,742 | | | 221 | | | |
Total Investment Disbursements | $ | 24,023 | | | $ | 23,026 | | | $ | 997 | | | |
INVESTMENT PORTFOLIO
IFC’s total disbursed investment portfolio (a non-GAAP performance measure) was $76.6 billion as of June 30, 2026 ($68.5 billion – June 30, 2025), as presented in the table below:
Table 6: Disbursed Investment Portfolio
| | | | | | | | | | | | | | | | | | | | | | | | |
| June 30, 2026 | | June 30, 2025 | |
(US$ in millions) | Disbursed Investment | | As a % of Total | | Disbursed Investment | | As a % of Total | |
Loans | $ | 49,899 | | | 65 | % | | $ | 43,694 | | | 64 | % | |
Equity Investments | 12,655 | | | 17 | | | 11,441 | | | 17 | | |
Debt Securities | 14,061 | | | 18 | | | 13,414 | | | 19 | | |
Total Disbursed Investment Portfolio | $ | 76,615 | | | 100 | % | | $ | 68,549 | | | 100 | % | |
| | | | | | | | |
| INTERNATIONAL FINANCE CORPORATION | Page 16 |
| | |
| Management's Discussion and Analysis | |
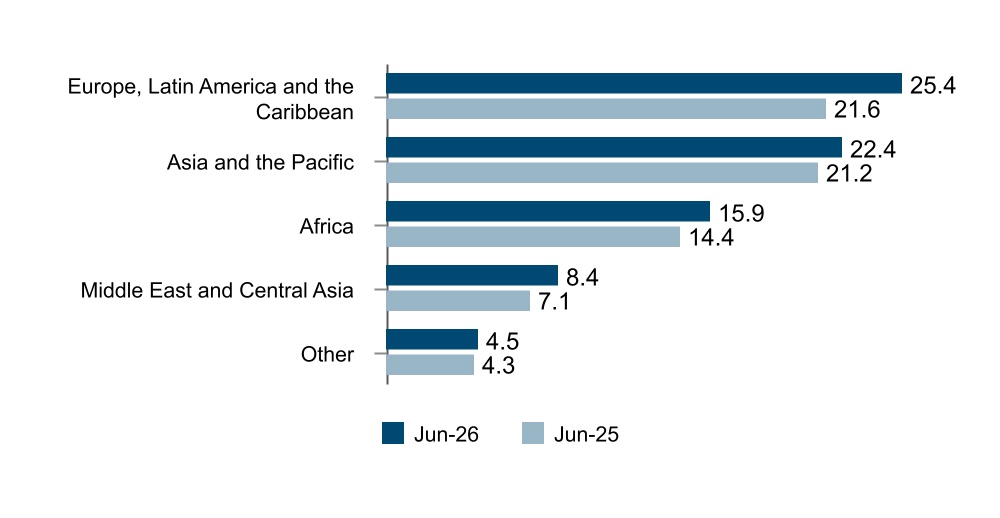
IFC’s disbursed investment portfolio is diversified by geographic region. The distribution of the portfolio by geographical region as of June 30, 2026 and June 30, 2025 is shown below:
Figure 11: Disbursed Investment Portfolio Distribution by Region (US$ in billions)
IFC’s disbursed investment portfolio is also diversified by industry sector. The distribution of the portfolio by industry sector as of June 30, 2026 and June 30, 2025 is shown below:
Table 7: Disbursed Investment Portfolio Distribution by Industry Sector
| | | | | | | | | | | | | | | | | | | | | | | |
| |
| June 30, 2026 | | June 30, 2025 |
(US$ in millions) | Disbursed Investment | | As a % of Total | | Disbursed Investment | | As a % of Total |
Finance & Insurance | $ | 33,397 | | | 44 | % | | $ | 29,528 | | | 43 | % |
Collective Investment Vehicles | 6,339 | | | 8 | | | 5,533 | | | 8 | |
Electric Power | 6,221 | | | 8 | | | 5,406 | | | 8 | |
Construction and Real Estate | 3,676 | | | 5 | | | 3,029 | | | 4 | |
Chemicals | 3,623 | | | 5 | | | 3,319 | | | 5 | |
Transportation and Warehousing | 3,226 | | | 4 | | | 2,885 | | | 4 | |
Industrial & Consumer Products | 2,968 | | | 4 | | | 2,721 | | | 4 | |
Agriculture and Forestry | 2,626 | | | 3 | | | 2,593 | | | 4 | |
Telecommunication and Information | 2,460 | | | 3 | | | 2,081 | | | 3 | |
Wholesale and Retail Trade | 1,895 | | | 2 | | | 2,027 | | | 3 | |
Others | 10,184 | | | 14 | | | 9,427 | | | 14 | |
Total | $ | 76,615 | | | 100 | % | | $ | 68,549 | | | 100 | % |
The breakdown of the committed investment portfolio (sum of (i) committed but undisbursed balance; and (ii) disbursed and outstanding balance) as of June 30, 2026 and June 30, 2025 is presented in the table below:
Table 8: Committed Investment Portfolio
| | | | | | | | | | | | | | | | | |
| |
(US$ in millions) | June 30, 2026 | | June 30, 2025 | | Variance |
Loans and loan-like debt securities a | $ | 72,699 | | | $ | 65,473 | | | $ | 7,226 | |
Equity and equity-like debt securities a | 17,650 | | | 15,624 | | | 2,026 | |
Guarantees and Client Risk Management | 11,735 | | | 9,103 | | | 2,632 | |
Total Committed Investment Portfolio | $ | 102,084 | | | $ | 90,200 | | | $ | 11,884 | |
_______ | | | | | |
a Loan-like and equity-like instruments are reported as debt securities on IFC’s consolidated financial statements. |
| | | | | | | | |
| INTERNATIONAL FINANCE CORPORATION | Page 17 |
| | |
| Management's Discussion and Analysis | |
The carrying value of IFC’s investment portfolio comprises: (i) the disbursed investment portfolio; (ii) less reserve against losses on loans and debt securities; (iii) unamortized deferred loan origination fees; (iv) less disbursed amounts allocated to equity related options reported separately in derivative assets; (v) unrealized gains and losses on equity investments held by consolidated Variable Interest Entities (VIEs); and (vi) unrealized gains and losses on investments. The breakdown of IFC's investment portfolio as of June 30, 2026 and June 30, 2025 is presented in the table below:
Table 9: The Carrying Value of IFC’s Investment Portfolio
| | | | | | | | | | | | | | | | | | | |
| | | |
(US$ in millions) | June 30, 2026 | | June 30, 2025 | | Variance | | |
Loans | $ | 48,234 | | | $ | 42,229 | | | $ | 6,005 | | | |
Equity Investments | 13,485 | | | 11,777 | | | 1,708 | | | |
Debt Securities | 14,096 | | | 13,514 | | | 582 | | | |
Total Investments | $ | 75,815 | | | $ | 67,520 | | | $ | 8,295 | | | |
| | | | | | | |
Loans
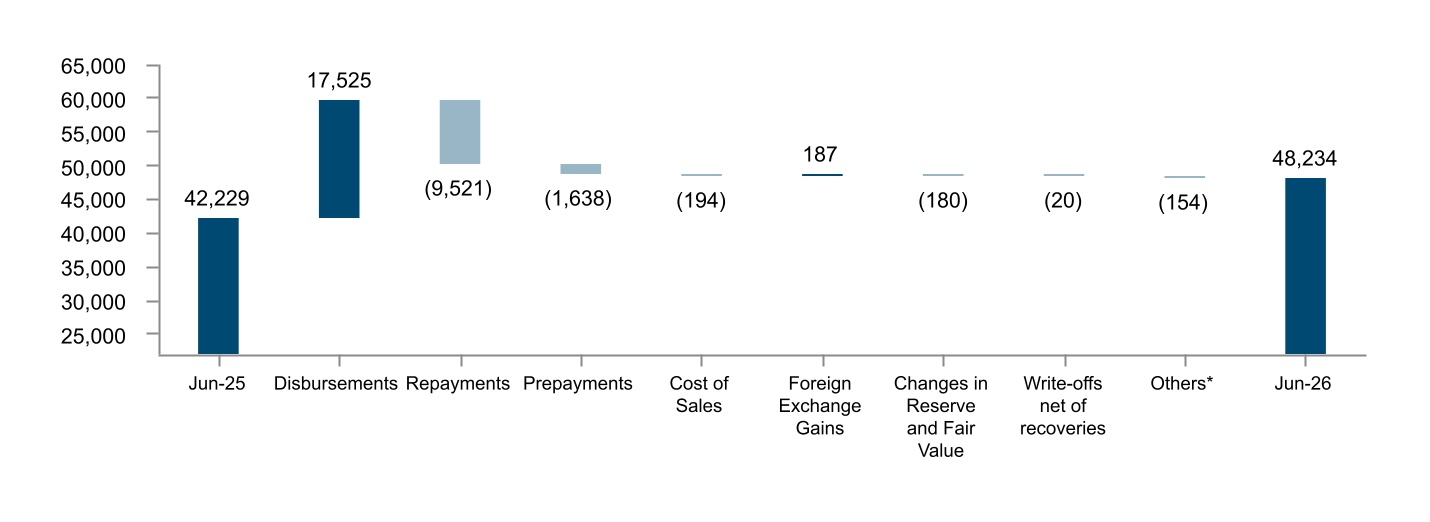
The carrying value of IFC’s loan portfolio, increased by $6.0 billion (14%) to $48.2 billion as of June 30, 2026. The increase was primarily driven by net disbursements (disbursements net of repayment, prepayment, and cost of sales) and foreign exchange gains, partially offset by changes in reserves and fair value. See breakdown of the movement in the figure below.
Figure 12: Carrying Value of Loan Portfolio (US$ in millions)
_______
* Mainly represents capitalized interest, unamortized deferred fees and transfers to debt securities and equity.
The weighted average contractual interest rate on loans was 6.5% and 6.7% as of June 30, 2026 and June 30, 2025.
IFC offers local currency products. To manage its risk exposure, IFC typically hedges local currency loan cash flows back into U.S. dollars using swaps, or funds local currency loans with local currency bond issuances. The outstanding local currency denominated loans were $8.9 billion as of June 30, 2026, a $738 million increase from June 30, 2025. This includes loans in a number of frontier market currencies such as Tanzanian shilling, Bangladeshi taka, new Romanian lei, Kenyan shilling, Kazakhstani tenge, Nigerian naira and Tunisian dinar.
| | | | | | | | |
| INTERNATIONAL FINANCE CORPORATION | Page 18 |
| | |
| Management's Discussion and Analysis | |
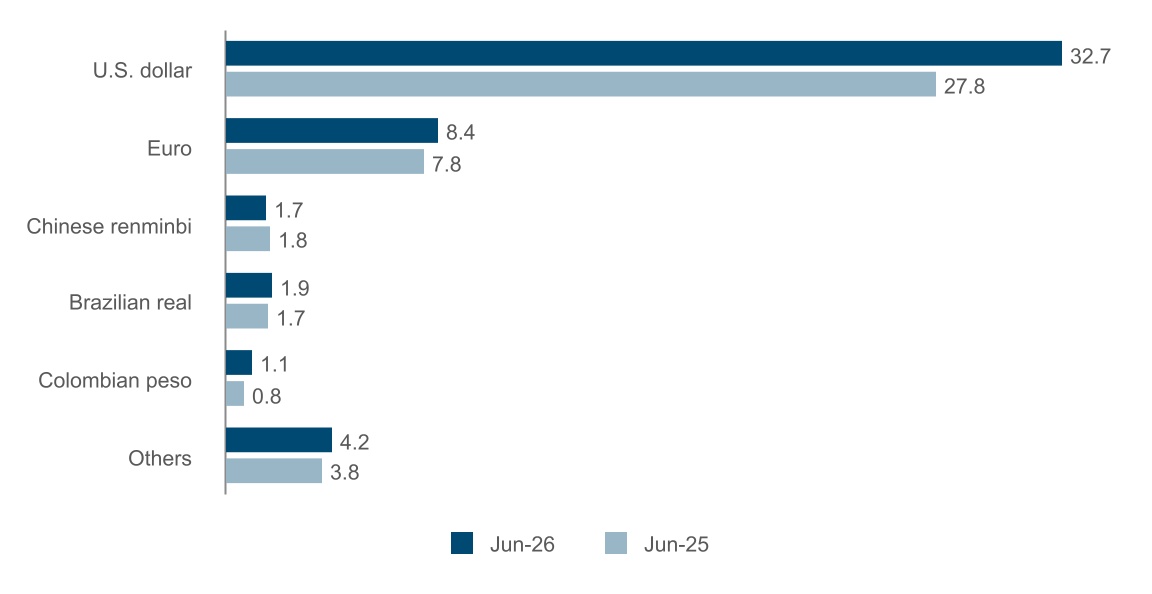
As of June 30, 2026, 65% of IFC’s disbursed loan portfolio was denominated in U.S. dollars (64% – June 30, 2025). After the effect of interest rate swaps and currency swaps, IFC’s loans are principally denominated in variable rate U.S. dollars. The currency composition of the disbursed loan portfolio (before swaps) as of June 30, 2026 and June 30, 2025 is shown below:
Figure 13: Currency Composition of Disbursed Loan Portfolio (US$ in billions)
Equity Investments
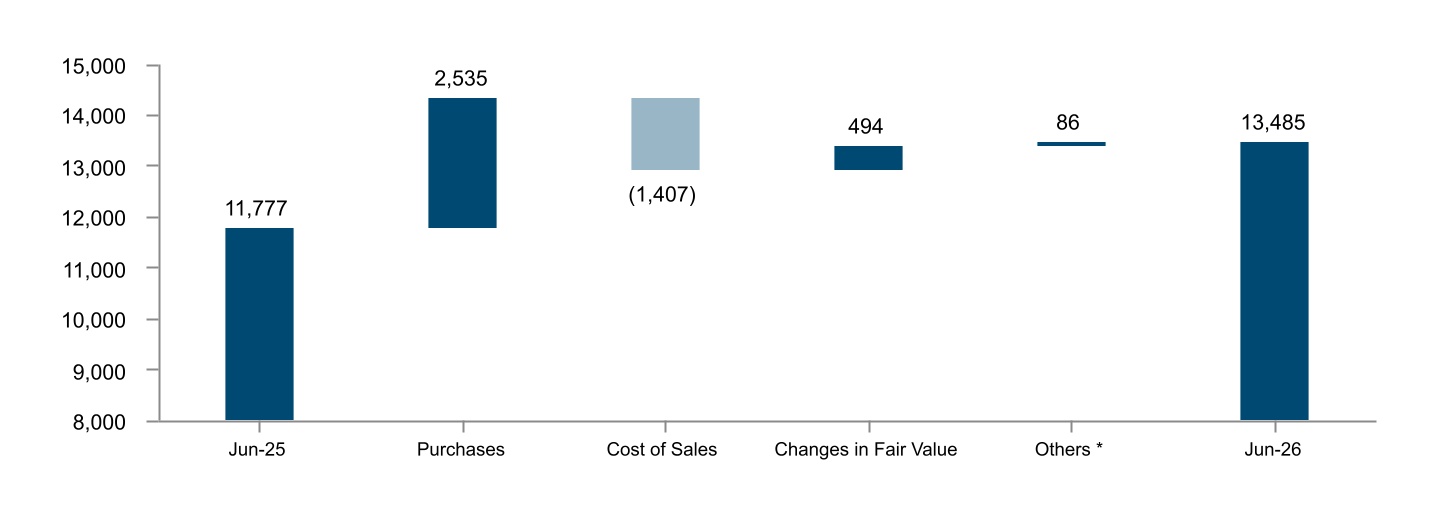
The carrying value of IFC’s equity investment portfolio, increased by $1.7 billion (14.5%) to $13.5 billion as of June 30, 2026. The increase was mainly due to net purchases (purchases net of sales) and changes in fair value. See breakdown of the movement in the figure below.
Figure 14: Carrying Value of Equity Investment Portfolio (US$ in millions)
_________
* Mainly represents liquidations, conversions, and transfers from loans and debt securities to equity investments.
| | | | | | | | |
| INTERNATIONAL FINANCE CORPORATION | Page 19 |
| | |
| Management's Discussion and Analysis | |
Debt Securities
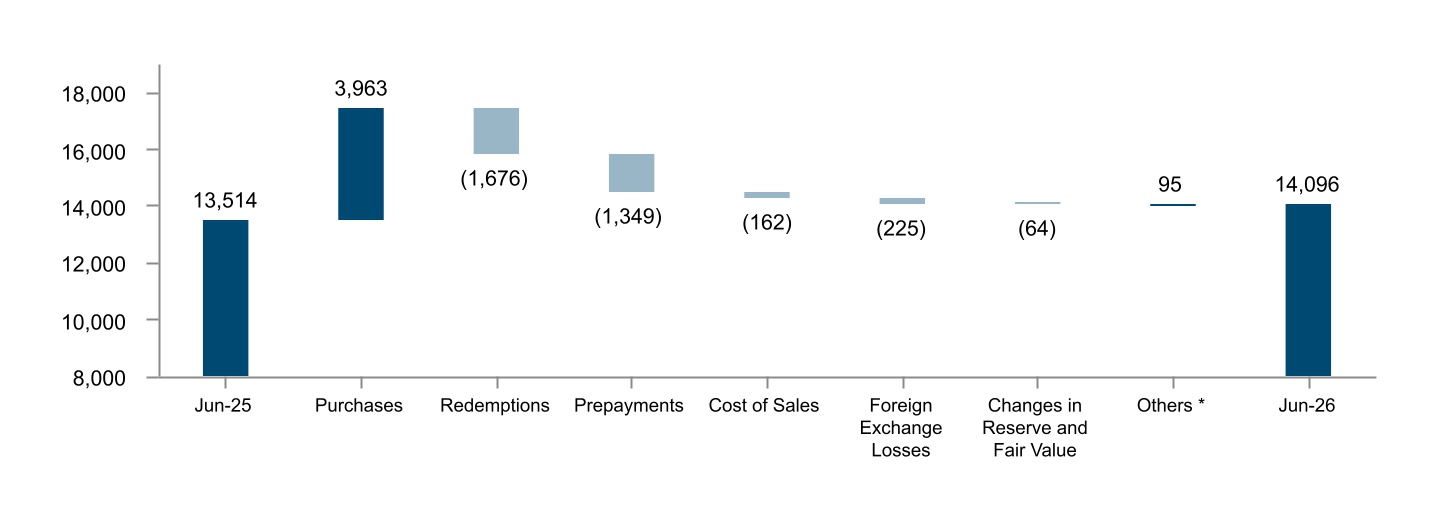
The carrying value of IFC’s debt security portfolio, increased by $582 million (4.3%) to $14.1 billion as of June 30, 2026. The increase was primarily driven by net purchases (purchases net of redemptions and prepayments) partially offset by foreign exchange losses. See breakdown of this movement in figure below:
Figure 15: Carrying Value of Debt Security Portfolio (US$ in millions)
_________
* Mainly represents conversions and transfers from loans to debt securities and capitalized interest.
Guarantees and Partial Credit Guarantees
IFC provides guarantees for loans and debt securities, including portfolio risk sharing facilities and trade obligations of clients, and covering both commercial and non-commercial risks. Outstanding guarantees (i.e., not called) totaling $8.1 billion were outstanding as of June 30, 2026 ($6.6 billion – June 30, 2025).
MCPP
MCPP creates diversified portfolios of emerging market private sector loans. MCPP builds a loan portfolio for an investor that mirrors the portfolio IFC is creating for its Own Account. Investors pledge capital upfront and then as IFC identifies eligible projects, investor exposure is allocated alongside IFC’s own investment in accordance with the terms of the managed co-lending agreement.
As of June 30, 2026, twenty four (eighteen – June 30, 2025) global investors have pledged $25.2 billion ($19.2 billion – June 30, 2025) to the MCPP, with certain programs investing across all sectors and others focused on real sector exclusively. Investors have also approved funding for 415 projects totaling $17.1 billion across 73 countries as of June 30, 2026, up from 371 projects totaling $14.4 billion across 72 countries as of June 30, 2025. Of which, $13.1 billion ($11.6 billion – June 30, 2025) has been committed. IFC will continue to deploy the remaining funds raised as IFC identifies projects that meet investors’ investment criteria.
Private Sector Window (PSW)
The IDA-IFC-MIGA Private Sector Window (PSW) was created under IDA's Eighteenth Replenishment of Resources (IDA18) to mobilize private sector investment in IDA-eligible countries and IDA-eligible Fragile and Conflict-affected Situations (FCS). Under IDA's Twenty First Replenishment of Resources (IDA21), $3.2 billion has been allocated to the PSW, including $500 million capital set aside by IFC. During FY26, $564 million was approved under the IDA21 PSW envelope, including $92 million under IFC’s capital set-aside.
IFC-managed funds
IFC’s Equity Mobilization Department (AMC) invests third-party capital and IFC capital, enabling outside investors to invest alongside IFC in developing markets. Investors in funds managed by IFC’s Equity Mobilization Department have included sovereign wealth funds, national pension funds, multilateral and bilateral development institutions, national development agencies and international financial institutions.
| | | | | | | | |
| INTERNATIONAL FINANCE CORPORATION | Page 20 |
| | |
| Management's Discussion and Analysis | |
As of June 30, 2026, IFC’s Equity Mobilization Department managed multiple funds (collectively referred to as the AMC Funds), in its capacity as General Partner (GP)/Manager of these funds. However, none of these funds require consolidation by IFC, because the third party limited partners of these funds have a substantive ability to remove IFC as GP/Manager. All of IFC’s Equity Mobilization Department’s Funds are investment companies and are required to report their investment assets at fair value through net income. IFC’s commitment ownership interests in these AMC Funds are shown in the following table:
Table 10: IFC’s Commitment Ownership Interests in AMC Funds
| | | | | |
AMC Funds | IFC’s commitment ownership interest |
| |
| |
IFC African, Latin American and Caribbean Fund, LP | 20% |
IFC Catalyst Funds a | 18% |
IFC Global Infrastructure Fund, LP | 17% |
IFC Financial Institutions Growth Fund, LP | 30% |
IFC Global Emerging Markets Fund of Funds b | 19% |
IFC Middle East and North Africa Fund, LP | 37% |
IFC Emerging Asia Fund, LP | 22% |
IFC GEMFOF 2 SMA, LP | —% |
IFC Emerging Markets Sustainability Fund of Funds, LP | —% |
TfL IFC Growth and Sustainability, LP | —% |
_________ | |
|
a The commitment ownership interest of 18% reflects IFC’s ownership interest taking into consideration the overall commitments for the IFC Catalyst Funds, which comprises IFC Catalyst Fund, LP, IFC Catalyst Fund (UK), LP and IFC Catalyst Fund (Japan), LP (collectively, IFC Catalyst Funds). IFC does not have a commitment ownership interest in either the IFC Catalyst Fund (UK), LP or the IFC Catalyst Fund (Japan), LP. |
b The commitment ownership interest of 19% reflects IFC’s ownership interest taking into consideration the current committed amounts for the IFC Global Emerging Markets Fund of Funds, which comprises IFC Global Emerging Markets Fund of Funds, LP and IFC Global Emerging Markets Fund of Funds (Japan Parallel), LP. IFC does not have a commitment ownership interest in the IFC Global Emerging Markets Fund of Funds (Japan Parallel), LP. |
| | | | | | | | |
| INTERNATIONAL FINANCE CORPORATION | Page 21 |
| | |
| Management's Discussion and Analysis | |
During FY26, IFC Capitalization (Subordinated Debt) Fund, LP and IFC Capitalization (Equity) Fund, LP were liquidated. AMC Funds and their activities as of and for FY26 and FY25 are summarized as follows:
Table 11: AMC Funds
| | | | | | | | | | | | | | | | | | | | | | | | | | |
| | | | | |
| Through June 30, 2026 | For the year ended |
| Total funds raised since inception | Cumulative investment commitments a | June 30, 2026 | June 30, 2025 |
(US$ in millions) | Total | From IFC | From other investors | Committed Amount b | Disbursed Amount | Committed Amount b | Disbursed Amount |
Current Funds | | | | | | | | |
IFC African, Latin American and Caribbean Fund, LP | $ | 1,000 | | $ | 200 | | $ | 800 | | $ | 863 | | $ | — | | $ | — | | $ | — | | $ | — | |
IFC Catalyst Fund, LP, IFC Catalyst Fund (UK), LP and IFC Catalyst Fund (Japan), LP (collectively, Catalyst Funds) | 418 | | 75 | | 343 | | 361 | | — | 4 | — | 5 |
IFC Global Infrastructure Fund, LP c | 1,430 | | 200 | | 1,230 | | 902 | | — | — | — | — |
IFC Global Emerging Markets Fund of Funds, LP and IFC Global Emerging Markets Fund of Funds (Japan Parallel), LP (collectively, GEM Funds) | 800 | | 150 | | 650 | | 757 | | — | 34 | — | 29 |
IFC Middle East and North Africa Fund, LP | 162 | | 60 | | 102 | | 74 | | — | — | — | — |
IFC Financial Institutions Growth Fund, LP | 505 | | 150 | | 355 | | 356 | | — | — | 2 | 2 |
IFC Emerging Asia Fund, LP | 693 | | 150 | | 543 | | 592 | | — | — | 2 | 2 |
IFC GEMFOF 2 SMA, LP d | 100 | | — | | 100 | | 56 | | 15 | 11 | 41 | 18 |
IFC Emerging Markets Sustainability Fund of Funds, LP | 139 | | — | | 139 | | 127 | | 71 | 39 | 56 | 15 |
TfL IFC Growth and Sustainability, LP d | 125 | | — | | 125 | | 14 | | — | 4 | 14 | 1 |
Current Funds Total | $ | 5,372 | | $ | 985 | | $ | 4,387 | | $ | 4,102 | | $ | 86 | | $ | 92 | | $ | 115 | | $ | 72 | |
| | | | | | | | |
Former Funds | | | | | | | | |
IFC Capitalization (Subordinated Debt) Fund, LP | $ | 1,725 | | $ | 225 | | $ | 1,500 | | $ | 1,614 | | $ | — | | $ | — | | $ | — | | $ | — | |
IFC Capitalization (Equity) Fund, LP | 1,275 | | 775 | | 500 | | 1,214 | | — | | — | | — | | — | |
Africa Capitalization Fund, Ltd. | 182 | | — | | 182 | | 130 | | — | | — | | — | | — | |
China-Mexico Fund, LP e | 1,200 | | — | 1,200 | | 362 | | — | — | — | — |
IFC Russian Bank Capitalization Fund, LP | 550 | | 250 | | 300 | | 82 | | — | | — | | — | — |
Women Entrepreneurs Debt Fund, LP | 115 | | 30 | | 85 | | 110 | | — | | — | | — | — |
Former Funds Total | $ | 5,047 | | $ | 1,280 | | $ | 3,767 | | $ | 3,512 | | $ | — | | $ | — | | $ | — | | $ | — | |
Grand Total | $ | 10,419 | | $ | 2,265 | | $ | 8,154 | | $ | 7,614 | | $ | 86 | | $ | 92 | | $ | 115 | | $ | 72 | |
_________ |
a Net of commitment cancellations. |
b Committed amount made by AMC Funds. Excludes commitment cancellations from prior periods. |
c Includes co-investment fund managed by AMC on behalf of Fund LPs. |
d Fund is in investment period. |
e AMC ceased to be the manager of the China-Mexico Fund, LP on September 15, 2023. |
| | | | | | | | |
| INTERNATIONAL FINANCE CORPORATION | Page 22 |
| | |
| Management's Discussion and Analysis | |
UPSTREAM AND ADVISORY SERVICES
Upstream project/sector development and Advisory Services are central to IFC's corporate strategy and overall mission, particularly in supporting IFC's delivery in IDA/FCS member countries, and reaching more MSME, which are critical to job creation. By creating enabling conditions, supporting early-stage project development, and providing targeted advice, IFC translates ideas into viable and impactful investments.
Strategic Alignment & Delivery
IFC's Articles of Agreement underline a lead role for the Corporation in private sector development – "to stimulate, and to help create conditions conducive to the flow of private capital, domestic and foreign, into productive investment in member countries." Upstream and Advisory Services help facilitate the realization of this role and transform IFC’s business development.
IFC's advisory role is delivered in close coordination with IBRD, IDA, and MIGA to create the conditions and opportunities that mobilize and enable private capital in emerging markets. This is achieved by linking regulatory reforms, project preparation, and advisory support to a robust pipeline of bankable projects and accelerating PCM. Core IFC Advisory offerings include:
i.Public-private partnerships (PPPs): IFC advises governments on structuring PPPs to improve access to infrastructure and services, while supporting reforms to attract investment and spur job creation.
ii.Policy support and market development: In collaboration with the IBRD and IDA, IFC advises on policies and designs market-shaping activities to support future private investments, particularly in IDA and FCS markets.
iii.Industry transformation: IFC helps industries adopt best practices and standards to boost productivity and resilience and drive systemic change across priority sectors.
iv.Firm-level support: IFC provides technical advice and market insights to companies, including SMEs, to help them meet international standards, improve sustainability and inclusion, enhance competitiveness, and strengthen investment readiness and financial management.
v.Project development: IFC contributes to feasibility work and de-risks early-stage project development, including through catalytic funding, to prove business models in nascent sectors and difficult markets. The Collaboration and Co-Development (CnCs) project type enables IFC to co-invest with private sector clients to facilitate project preparation and development activities across IFC industries.
vi.Thought leadership and global learning: IFC works with global experts to develop solutions for urgent development challenges and fosters peer learning through its global networks. Furthermore, the advisory function leads standard-setting results-based evaluation and impact measurement, recognized by independent evaluation groups.
Upstream and Advisory Services are especially impactful in the poorest and most fragile contexts, where IFC supports clients in improving environmental, social, and governance practices, including gender inclusion. In these challenging markets, structured initiatives identify resilient local corporate champions, providing comprehensive diagnostics and advisory services to bridge the gap from capacity building to active investment. These efforts also help countries expand access to electricity, connect farmers with supply chains, and tap into the economic potential of digital innovation.
Differentiated delivery: Where conventional finance does not reach on its own, Upstream & Advisory develops bespoke solutions. In IDA-FCS markets, this means building resilient local businesses, deploying blended finance to absorb first-loss risk, and managing non-financial risks proactively. In FY26, Upstream and Advisory enabled $3.4 billion of IFC’s commitments in IDA-FCS.
| | | | | | | | |
| INTERNATIONAL FINANCE CORPORATION | Page 23 |
| | |
| Management's Discussion and Analysis | |
Program Expenditures
As of June 30, 2026, the IFC Advisory Services portfolio totaled $1.6 billion ($1.5 billion – June 30, 2025). FY26 program expenditures amounted to $291 million ($290 million – FY25) with a maintained program spend focus on IFC's strategic priority areas – IDA-eligible countries at 46%, FCS at 25%, and climate adaptation & mitigation at 31% (compared to 47%, 26% and 34% respectively in FY25).
Table 12: IFC Advisory Services – Program Expenditures by Region
| | | | | | | | | | | | | | | | | | | | | | | |
| For the year ended June 30, |
| 2026 | | 2025 |
(US$ in millions) | Program Expenditure a | | As a % of Total | | Program Expenditure a | | As a % of Total |
Africa | $ | 103 | | | 35 | % | | $ | 101 | | | 35 | % |
Europe, Latin America and the Caribbean | 73 | | 25 | | | 68 | | 23 | |
Asia and the Pacific | 64 | | 22 | | | 63 | | 22 | |
Middle East and Central Asia | 29 | | 10 | | | 31 | | 11 | |
World | 22 | | 8 | | | 27 | | 9 | |
| | | | | | | |
Total Program Expenditures | $ | 291 | | | 100 | % | | $ | 290 | | | 100 | % |
__________ | | | | | | | |
a The program expenditure presented herein is based on the Operational reporting methodology, which includes all project expenditures associated with an Advisory project. This does not include program expenditure associated with IFC’s Upstream project development or knowledge activities. |
Table 13: IFC Advisory Services – Program Expenditures by Business Area
| | | | | | | | | | | | | | | | | | | | | | | |
| For the year ended June 30, |
| 2026 | | 2025 |
(US$ in millions) | Program Expenditure a | | As a % of Total | | Program Expenditure a | | As a % of Total |
Financial Institutions | $ | 72 | | | 25 | % | | $ | 71 | | | 25 | % |
Transaction Advisory | 61 | | 21 | | | 56 | | 19 | |
Country Advisory & Economics | 51 | | 17 | | | 59 | | 20 | |
Manufacturing Agribusiness & Services | 42 | | 14 | | | 37 | | 13 | |
Infrastructure & Natural Resources | 25 | | 9 | | | 23 | | 8 | |
E&S Advice & Solutions / Gender & Economic Inclusion | 10 | | 3 | | | 12 | | 4 | |
Disruptive Technologies & Funds | 5 | | 2 | | | 7 | | 2 | |
Other Advisory | 25 | | 9 | | | 25 | | 9 | |
Total Program Expenditures | $ | 291 | | | 100 | % | | $ | 290 | | | 100 | % |
__________ | | | | | | | |
a The program expenditure presented herein is based on the Operational reporting methodology, which includes all project expenditures associated with an Advisory project. This does not include program expenditure associated with IFC’s Upstream project development or knowledge activities. |
| | | | | | | | |
| INTERNATIONAL FINANCE CORPORATION | Page 24 |
| | |
| Management's Discussion and Analysis | |
SECTION IV: LIQUID ASSETS
Liquid assets are funded from two sources: borrowings from the market and capital (net worth), and are managed in several sub-portfolios related to these sources. Proceeds of borrowings from market sources not immediately disbursed for loans and loan-like debt securities are managed internally by IFC against money market benchmarks within the Market Funded portfolio. The portion of IFC’s net worth not invested in equity and equity-like investments is managed internally by IFC against a U.S. Treasury benchmark within the Net Worth Funded portfolio. Refer to Section V: Funding Resources for additional details on borrowings.
IFC generally invests its liquid assets in highly rated fixed and floating rate instruments issued by, or unconditionally guaranteed by, governments, government agencies and instrumentalities, multilateral organizations, and high quality corporate issuers. These include Asset-Backed Securities (ABS), Mortgage-Backed Securities (MBS), time deposits, and other unconditional obligations of banks and financial institutions. Diversification across multiple dimensions ensures a favorable risk return profile. IFC manages the individual liquid asset portfolios on an aggregate portfolio basis against each portfolio's benchmark within specified risk parameters. In implementing these portfolio management strategies, IFC utilizes derivative instruments, principally currency and interest rate swaps, foreign exchange forward contracts, and futures and options, and it takes positions in various industry sectors and countries.
IFC’s liquid assets are accounted for as trading portfolios. The Net Asset Value (NAV) of IFC's liquid asset portfolio as of June 30, 2026 and June 30, 2025 is presented in the table below:
Table 14: Liquid Asset Portfolio NAV
| | | | | | | | | | | | | | | | | |
(US$ in millions) | June 30, 2026 | | June 30, 2025 | | Variance |
Market Funded portfolio | $ | 26,033 | | | $ | 26,502 | | | $ | (469) | |
Net Worth Funded portfolio | 18,368 | | | 18,282 | | | 86 | |
Total Liquid Asset portfolio | $ | 44,401 | | | $ | 44,784 | | | $ | (383) | |
The decline in the Market Funded portfolio was primarily due to the net loan disbursements exceeding net inflows from borrowings. The Net Worth Funded portfolio increased slightly, as the increase from paid-in capital and retained earnings was largely offset by net equity disbursements.
| | | | | | | | |
| INTERNATIONAL FINANCE CORPORATION | Page 25 |
| | |
| Management's Discussion and Analysis | |
SECTION V: FUNDING RESOURCES
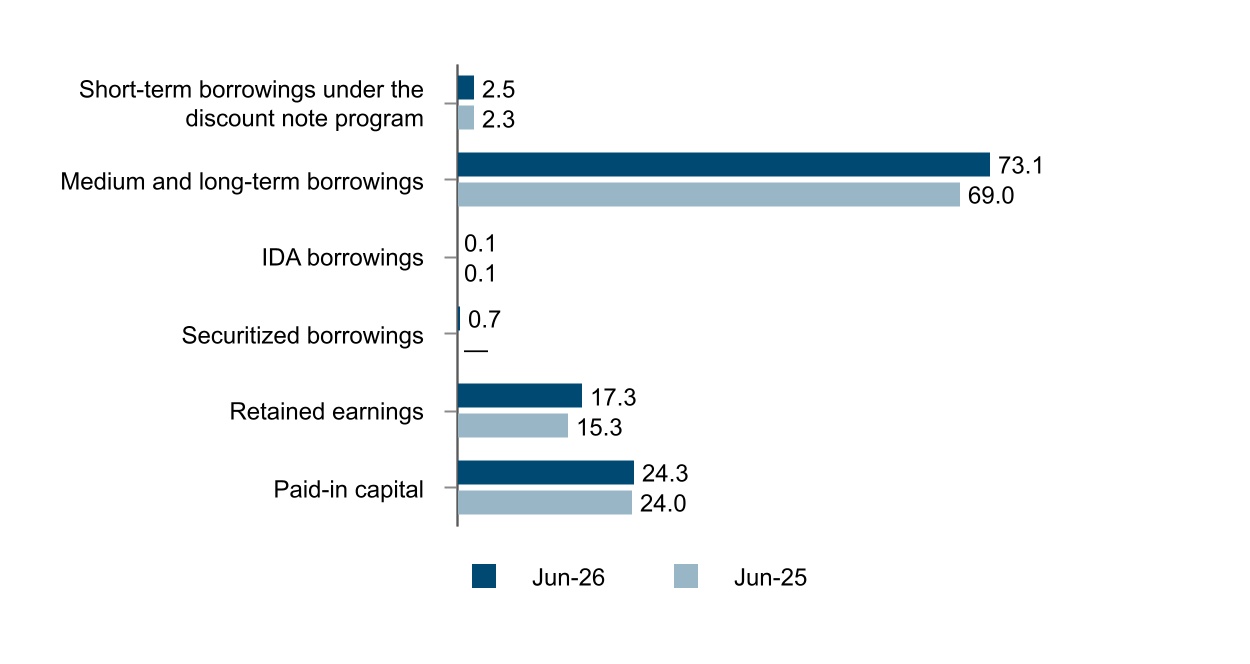
IFC’s funding resources (comprising borrowings after fair value adjustments, paid-in capital and retained earnings) as of June 30, 2026 and June 30, 2025 are as follows:
Figure 16: IFC's Funding Resources (US$ in billions)
BORROWINGS
The major source of IFC’s borrowings is the international capital markets. Under IFC's Articles of Agreement, IFC may borrow in the public markets of a member country only with approvals from that member, together with the member in whose currency the borrowing is denominated.
Substantially all borrowings are carried at fair value under the Fair Value Option. The outstanding borrowings (including fair value adjustments) on IFC's consolidated balance sheets as of June 30, 2026 and June 30, 2025 are presented in the table below:
Table 15: Borrowings Outstanding
| | | | | | | | | | | | | | | | | |
(US$ in millions) | June 30, 2026 | | June 30, 2025 | | Variance |
Short-term borrowings under the discount note program | $ | 2,537 | | | $ | 2,337 | | | $ | 200 | |
Medium and long-term borrowings | 73,082 | | | 68,999 | | | 4,083 | |
IDA borrowings | 82 | | | 114 | | | (32) | |
General market borrowings | 75,701 | | | 71,450 | | | 4,251 | |
Securitized borrowings a | 682 | | | — | | | 682 | |
Total borrowings | $ | 76,383 | | | $ | 71,450 | | | $ | 4,933 | |
_________ |
a Represents notes issued to the third-party investors by consolidated VIEs under IFC's EMSP. See the discussion below and Note N to the consolidated financial statements for further details. |
| | | | | | | | |
| INTERNATIONAL FINANCE CORPORATION | Page 26 |
| | |
| Management's Discussion and Analysis | |
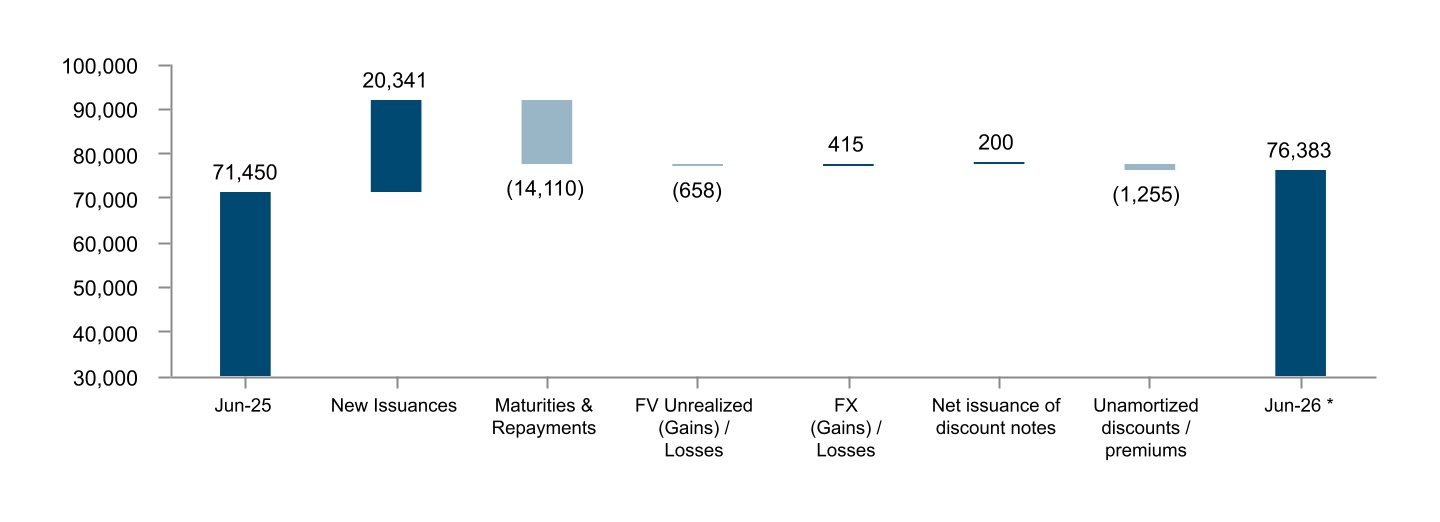
The increase in outstanding borrowings was primarily driven by net new issuances, partially offset by unamortized discounts and premiums as shown in figure below:
Figure 17: Borrowings Outstanding (US$ in millions)
_________
* Total outstanding borrowings include $682 million in securitized borrowings under the EMSP as of June 30, 2026.
General Market Borrowings
IFC’s borrowings are generally swapped into floating-rate obligations denominated in U.S. dollars. On occasion, IFC uses its borrowings as a tool to promote capital markets development or to directly support clients in emerging and frontier markets and this can result in raising local currency funds that are not swapped. As of June 30, 2026, non-U.S. dollar denominated market borrowings without interest rate or currency hedges accounted for 1% of the total borrowings from market sources (1% – June 30, 2025), with outstanding balances amounting to $890 million ($614 million – June 30, 2025). These borrowings were denominated in various currencies, mainly in new Romanian lei, Kenyan shilling, and Georgian lari.
IFC maintains short-term discount note programs in U.S. dollars and Chinese renminbi as a tool to provide additional funding and liquidity management. These programs support IFC’s trade finance and supply chain initiatives and expand the availability of short-term local currency finance. The discount note programs offer issuances with maturities ranging from overnight to one year.
During FY26, IFC raised $29.9 billion in general market borrowings ($35.6 billion – FY25), comprising $19.6 billion under the medium and long-term borrowing program ($26.9 billion – FY25) and $10.3 billion under the short-term discount note program ($8.7 billion – FY25).
Securitized Borrowings
IFC raised $740 million in FY26 through its EMSP, ($0 – FY25), under which, a pool of IFC loan participations are transferred to Special Purpose Vehicles (SPVs) that issue a series of notes to third-party investors. These notes are secured by, and have recourse only to, the assets held within the respective SPVs, and are presented separately from IFC's general market borrowings to reflect their distinct structure and recourse profile. During FY26, $54 million of EMSP notes were repaid. See Note N to the consolidated financial statements for further details.
| | | | | | | | |
| INTERNATIONAL FINANCE CORPORATION | Page 27 |
| | |
| Management's Discussion and Analysis | |
CAPITAL AND RETAINED EARNINGS
As of June 30, 2026 and June 30, 2025, IFC’s capital comprised the following:
Table 16: IFC's Capital | | | | | | | | | | | |
(US$ in millions) | June 30, 2026 | | June 30, 2025 |
| | | |
Authorized capital | $ | 25,080 | | | $ | 25,080 | |
Subscribed capital | 24,296 | | | 24,511 | |
Less: unpaid portion of subscriptions | — | | | (502) | |
Paid-in capital | 24,296 | | | 24,009 | |
AOCI | 1,672 | | | 1,617 | |
Retained earnings | 17,340 | | | 15,302 | |
| | | |
| | | |
Total Capital | $ | 43,308 | | | $ | 40,928 | |
Following the Spring Meetings in April 2018, the Board of Governors endorsed a financing package, which comprised: (i) a three-step capital raising process which involved the conversion of $17.0 billion of retained earnings into paid-in capital, alongside a General Capital Increase and Selective Capital Increase to raise up to $5.5 billion in additional paid-in capital; (ii) the suspension of grants to IDA after the IDA 18 replenishment; and (iii) internal measures for increased efficiency. As of June 30, 2026, IFC’s authorized capital stock remained at 25,079,991 shares, each with $1,000 par value (unchanged from June 30, 2025).
As of April 16, 2026, the subscription and payment periods for the 2018 Selective Capital Increase (SCI) and General Capital Increase (GCI) were closed. All 353,192 unsubscribed and unpaid shares under the 2018 GCI and SCI were released into the pool of authorized and unissued shares. As of June 30, 2026, payments of $4.7 billion (GCI – $3.9 billion and SCI – $807 million) were received from 141 member countries.
Net Income Allocations
Management recommends allocations of net income to the Board at the end of each fiscal year, to support IFC's operations as well as other developmental activities. Recommendations are based on IFC's allocable income. As discussed previously, effective March 2026, to better measure income generated by current year activities, the allocable income calculation has been refined by adding back expenses funded by prior years' approved allocations. Amounts allocated to other developmental activities are determined based on a Board-approved income-based (sliding scale) formula and on a principles-based Board-approved financial distribution policy, and are subject to the Board approval. Consistent with the Board-approved framework, no allocations to other developmental activities are made if IFC’s CUR exceeds 88%. The framework also prioritizes future net income allocations based on IFC’s CUR to the CMAW, established in fiscal year 2018 to support market creation in IDA-eligible countries and FCS, and to the FMTAAS up to a specified cushion.
Effective from FY25, the Undesignated Retained Earnings line in the Financial Statements, excluding amounts relating to the current year's net income, has been renamed and is referred to as IFC's General Reserve, and IFC's current year's net income adjusted for fair value, expenditures against reserves, and other adjustments, is reflected in a separate line within Retained Earnings, referred to as Unallocated Net Income. For further details, please refer to Note H to the FY26 consolidated financial statements.
As of June 30, 2026 and June 30, 2025, retained earnings comprised the following:
Table 17: IFC's Retained Earnings Composition
| | | | | | | | | | | |
(US$ in millions) | June 30, 2026 | | June 30, 2025 |
General Reserve | $ | 14,275 | | | $ | 12,913 | |
| | | |
Other Reserves | | | |
CMAW Reserve | 168 | | | 101 | |
FMTAAS Reserve | 127 | | | 140 | |
SME Ventures Reserve | 9 | | | 9 | |
FOF Reserve | 100 | | | 100 | |
Surplus | 100 | | | — | |
| | | |
Other Reserves | 504 | | | 350 | |
Cumulative fair value and other adjustmentsa | 818 | | | 158 | |
Unallocated Net Income | 1,743 | | | 1,881 | |
Total Retained Earnings | $ | 17,340 | | | $ | 15,302 | |
__________ | | | |
a Other adjustments include income associated with PCRF. | | | |
| | | | | | | | |
| INTERNATIONAL FINANCE CORPORATION | Page 28 |
| | |
| Management's Discussion and Analysis | |
FY26 Net Income Allocations
On August 5, 2026, the Board of Directors approved the allocation of $173 million to the CMAW reserve, $125 million to the FMTAAS reserve, and $1,385 million to the General Reserve from IFC's FY26 net income. This designation is expected to be noted with approval by the Board of Governors in FY27. In addition, the Board of Directors approved the transfer of $100 million from the Surplus account to the FOF and recommended to IFC's Board of Governors a transfer of $60 million to the Surplus account from IFC’s FY26 net income.
FY25 Net Income Allocations
On September 30, 2025, the Board of Directors approved the allocation of $178 million to the CMAW reserve, $70 million to the FMTAAS reserve, and $1,362 million to the General Reserve from IFC's FY25 net income. This approval was noted by the Board of Governors on October 17, 2025. Additionally, the Board of Governors approved the allocation of $100 million from IFC’s FY25 net income to the Surplus account and delegated to the Board of Directors the authority to approve the transfer of $100 million from the Surplus account to the FOF.
| | | | | | | | |
| INTERNATIONAL FINANCE CORPORATION | Page 29 |
| | |
| Management's Discussion and Analysis | |
SECTION VI: RISK MANAGEMENT
ENTERPRISE RISK MANAGEMENT
IFC provides investments and advisory services to the private sector in emerging markets and is therefore exposed to a range of potential financial and non-financial impacts. Active monitoring and sound management of evolving risks remain critical pillars in terms of fulfilling IFC’s mission.
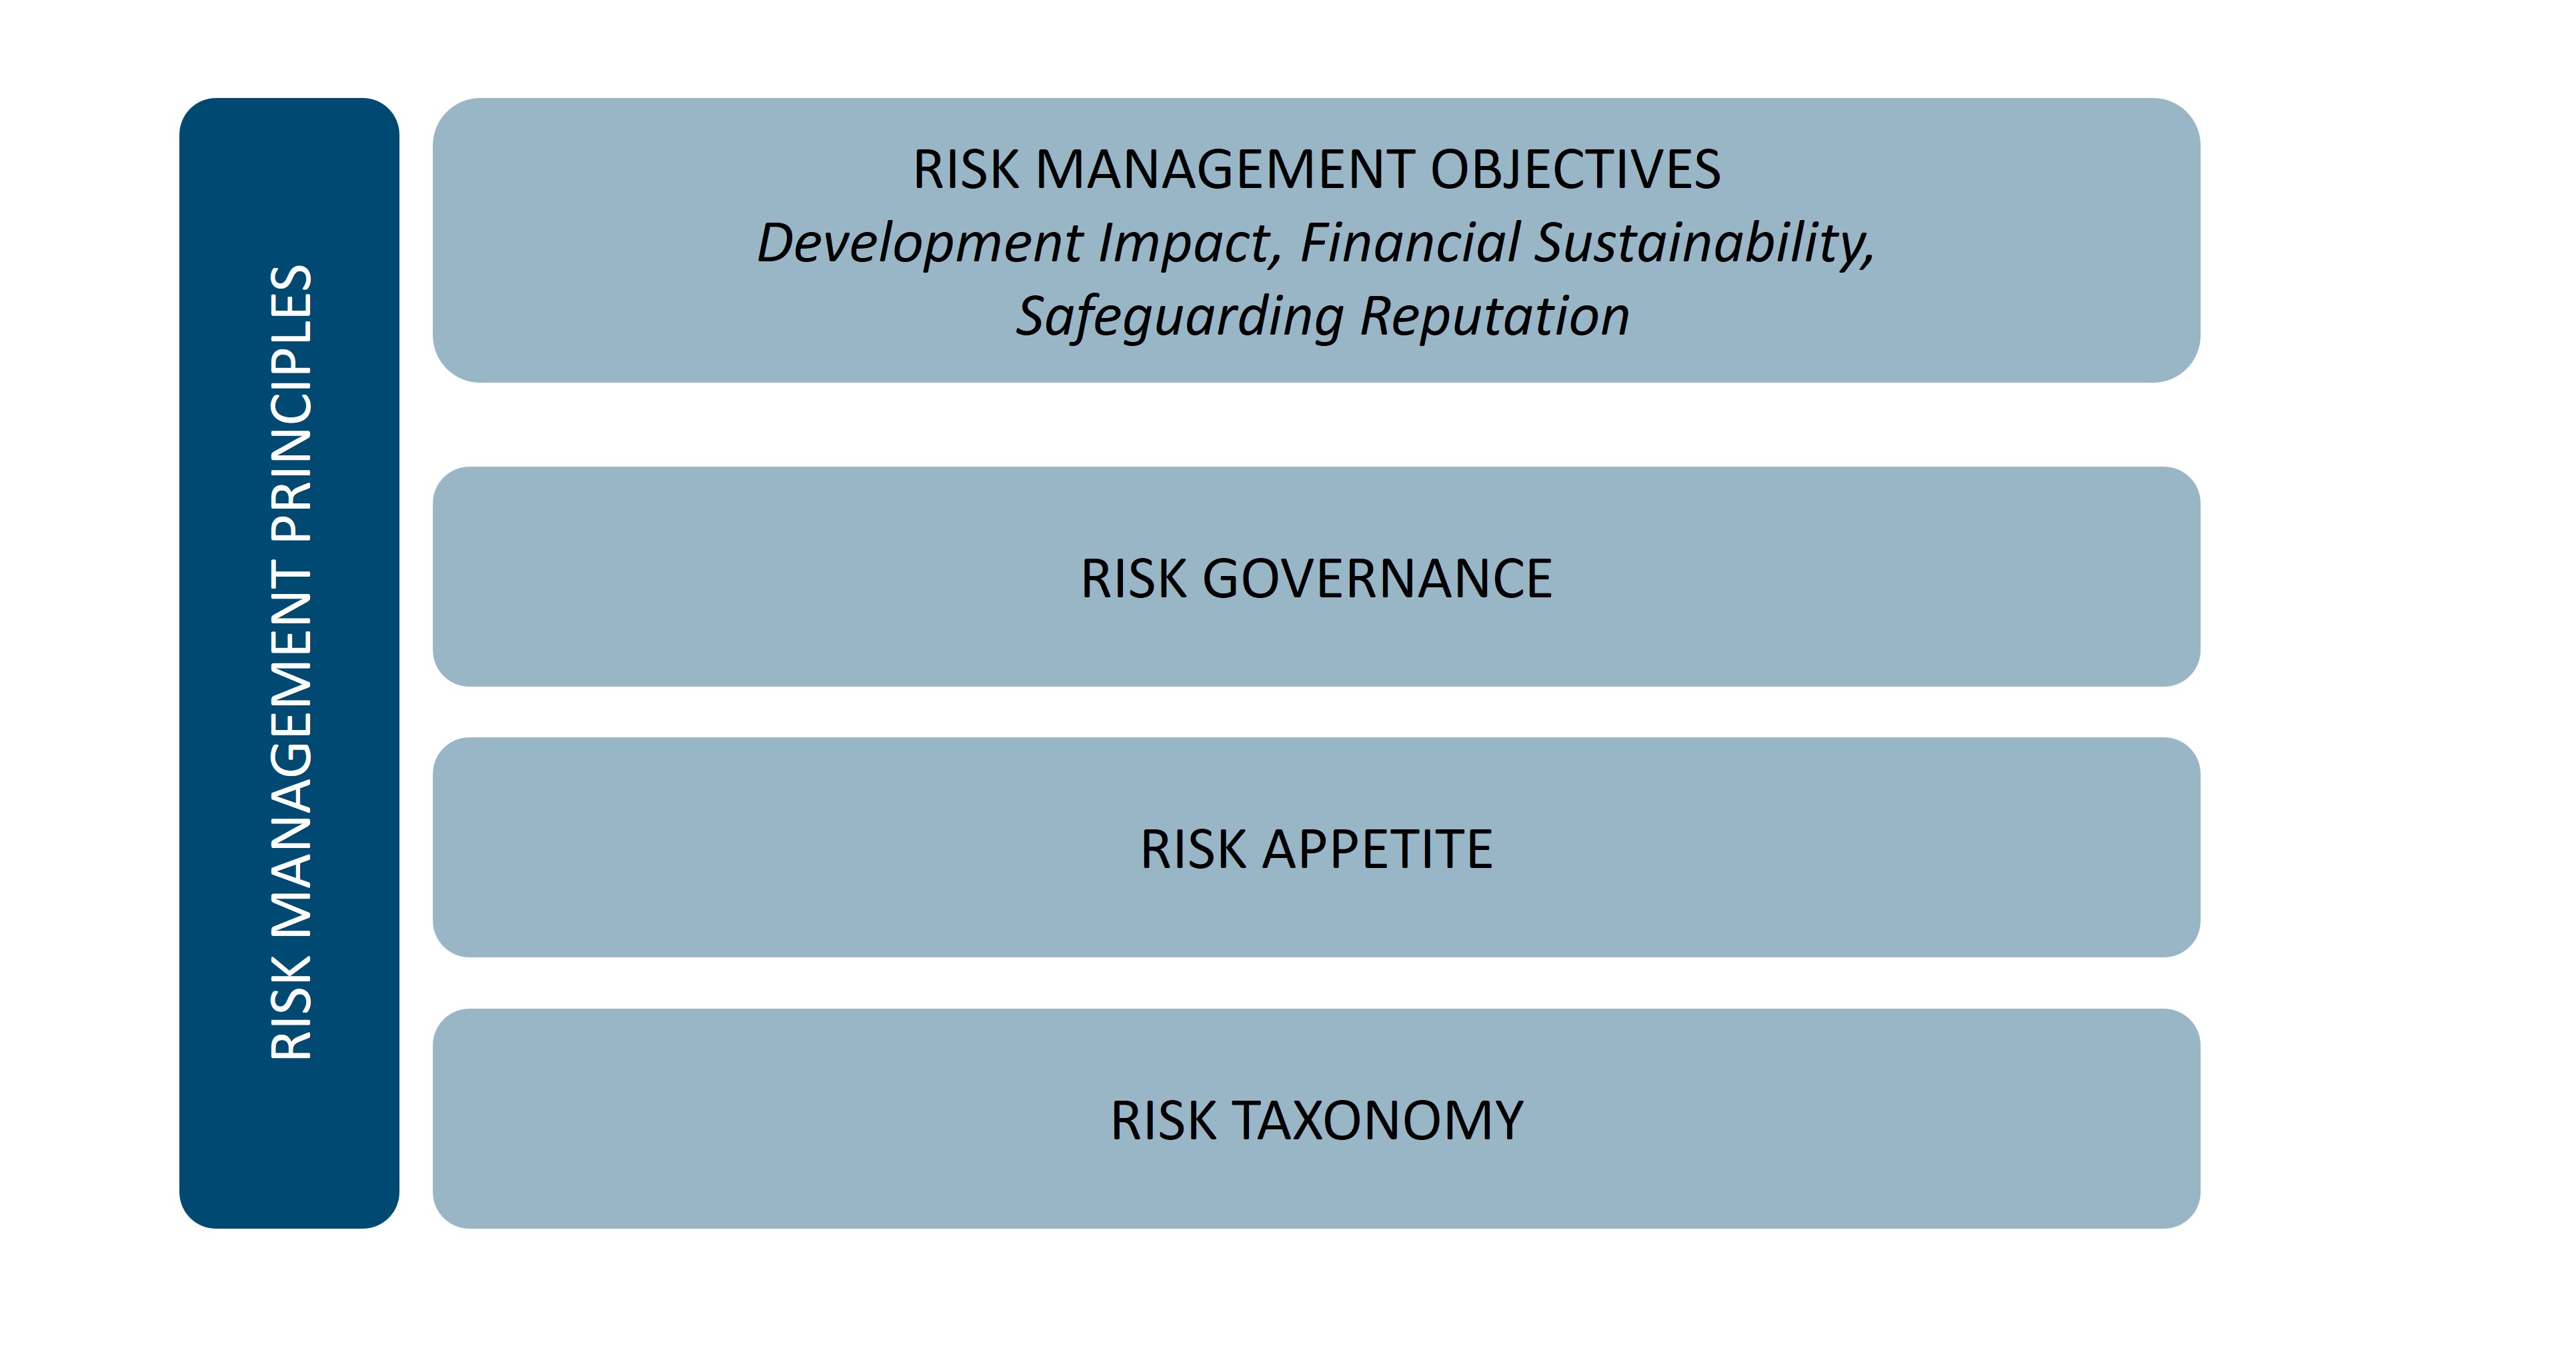
In addition to supporting its mission, IFC’s enterprise risk management framework (ERM) is designed to enable the prudent management of potential financial, non-financial and reputational impacts that originate from the Corporation’s business activities. In this context, IFC’s risk management efforts are designed specifically to help align the Corporation’s performance with its strategic direction. The framework defines:
▪Key risk management objectives for managing risks.
▪A standard classification of roles and responsibilities for risk management, to differentiate and thereby clarify how different parts of the Corporation contribute towards the overall management of risk through a well-defined risk governance mechanism.
▪A risk appetite component to ascertain the level and type of risk that IFC is able and willing to assume in its exposure and business activities.
▪A risk taxonomy for categorizing risks across the organization, to help ensure that risk management efforts are coordinated and aligned across the distinct parts of the organization that share responsibility for managing different aspects of risk.
▪Cross-cutting risk management principles to ensure that business decisions are based on a thorough understanding of risks and that risks and rewards are balanced appropriately. Another principle is that IFC will be selective in undertaking activities that could cause significant adverse reputational impact.
IFC’s risk culture is central to all aspects of IFC’s risk management efforts. One of the key objectives of the framework is to embed a strong risk culture in the Corporation while ascertaining that tools and capabilities are in place to facilitate risk management and decision-making at different levels of the organization.
Figure 18: IFC’s Enterprise Risk Management Framework
| | | | | | | | |
| INTERNATIONAL FINANCE CORPORATION | Page 30 |
| | |
| Management's Discussion and Analysis | |
Key Risk Management Objectives
IFC has defined three explicit Risk Management Objective Statements at the corporate level which are derived from IFC’s purpose, business scope, strategic objectives, and the risks that it faces.
▪Development Impact – IFC will maximize developmental impact by focusing on the World Bank Group’s mission to end extreme poverty and boost shared prosperity on a livable planet, while maintaining financial sustainability and safeguarding its brand.
▪Financial Sustainability – IFC will generate and maintain sufficient financial resources, conduct its business and manage risk consistent with standards implied by a AAA/Aaa rating.
▪Safeguarding Reputation – In determining what engagements and activities to pursue, IFC will assess whether any potential adverse impact to its reputation is in balance with the potential development impact.
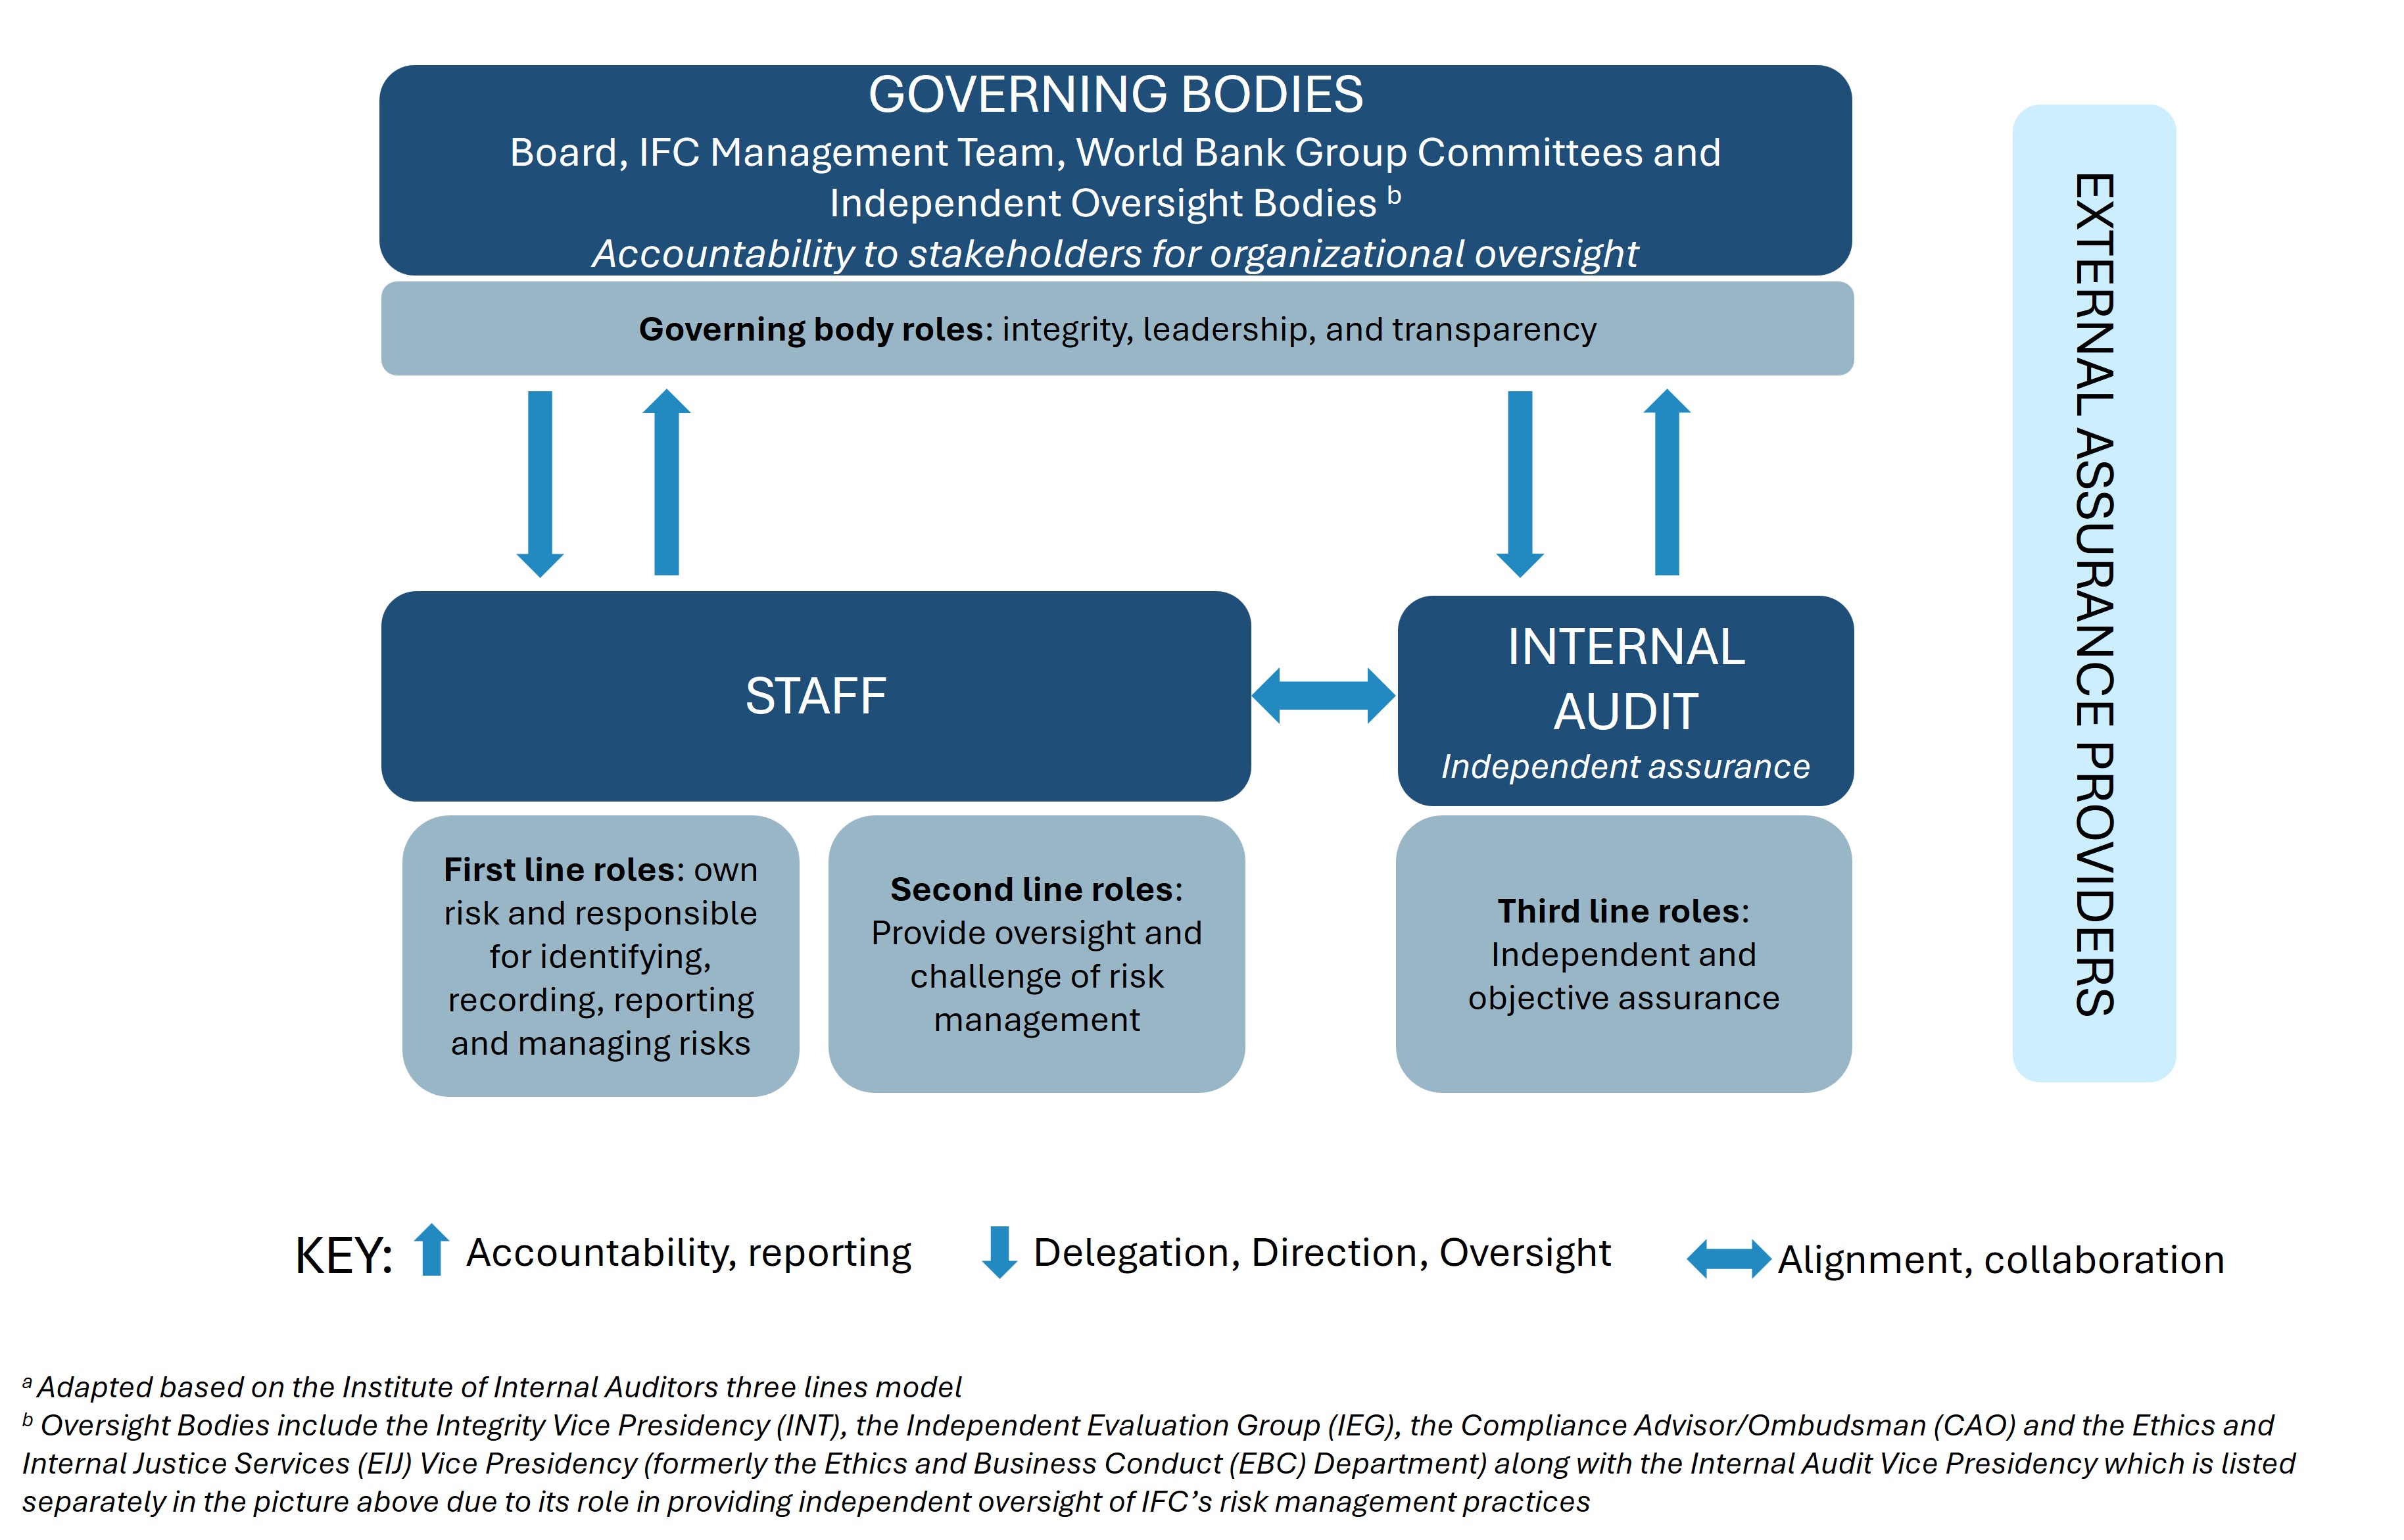
Figure 19: Risk Governance Structure a
IFC’s Enterprise Risk Management follows the shared-responsibility principle, and IFC’s risk governance structure is built on the “three lines model” as defined below:
▪1st Line – All staff engaged in the business origination, revenue generating and client facing areas of IFC and all associated support functions including Investment, Advisory and Treasury staff which are not risk, control or compliance monitoring functions.
▪2nd Line – Staff in risk, controllers, legal, compliance and communication functions independent of the first line provide oversight and challenge over all IFC’s risk activities.
▪3rd Line – Internal Audit provides independent oversight.
From an organizational standpoint, four distinct groups govern the risks that IFC undertakes during its day-to-day business activities:
▪Independent Oversight Bodies:
i.The WBG Internal Audit Vice Presidency provides independent oversight of IFC’s risk management practices.
| | | | | | | | |
| INTERNATIONAL FINANCE CORPORATION | Page 31 |
| | |
| Management's Discussion and Analysis | |
ii.The Integrity Vice Presidency investigates allegations of fraud, corruption, and staff misconduct in IFC’s operations and in WBG-financed operations impacting IFC.
iii.The Independent Evaluation Group assesses the relevance, efficacy and efficiency of IFC’s operational programs and activities (and their contributions to development effectiveness).
iv.The Compliance Advisor/Ombudsman serves as an independent recourse mechanism for stakeholders in projects supported by IFC.
v.The Ethics and Internal Justice Services Vice Presidency (EIJ) promotes the WBG's Core Values, and provides ethical advisory and conflict resolution services to staff.
▪The Board: IFC’s Articles of Agreement outline the composition, roles and responsibilities of IFC’s Board of Governors and Board of Directors. The Board of Directors is responsible for the general operations of the Corporation. The Audit Committee of the Board of Directors plays a key role in overseeing risk management at IFC.
▪World Bank Group (WBG) Risk Committees are Management Committees which exercise oversight of risks for the WBG institutions.
Figure 20: Management Risk Committee Structure
During FY26, as part of the World Bank Group’s strategic efforts to scale impact, enhance operational efficiency, and deliver greater value to our clients, a WBG Enterprise Risk Committee and a WBG Administrative and Risk Committee were established, and the WBG Finance and Risk Committee and WBG Asset and Liability Management Committee are being granted an expanded purview across the WBG institutions under a unified governance framework.
i.The Enterprise Risk Committee (ERC), a WBG committee chaired by the WBG Chief Risk Officer, aims to strengthen enterprise-wide risk oversight and better manage reputation and franchise risks among stakeholders across the World Bank Group. ERC provides a senior-level forum to elevate critical and cross-cutting risks, supports more integrated risk-informed decision-making, and reinforces institutional resilience and trust. The ERC helps to streamline risk-related processes and reporting, with a focus on applying institutional expertise more effectively while reducing unnecessary burden on operational teams.
ii.The Finance and Risk Committee (FRC), a Vice President-level WBG committee, chaired by the Managing Director and WBG Chief Financial Officer (MDCFO), is in the process of being expanded as the principal financial policy-setting committee for IBRD, IDA, IFC, and MIGA, as well as for World Bank Group Trust Funds. The FRC will be responsible for decisions relating to financial sustainability, capital resources, and financial risk appetites across the WBG institutions. It endorses, clears or approves new or changes to existing policies, products, structures, and frameworks that have material financial or risk implications for any of the WBG institutions and World Bank Group Trust Funds.
iii.The Asset and Liability Management Committee (ALCO), a Vice President-level WBG committee chaired by the MDCFO, is responsible for continuous monitoring of balance sheet and ALM positions of the WBG Institutions, and decision-making on ALM matters. ALCO establishes and reviews ALM frameworks of the WBG institutions under the ALM policies established by their respective Boards; monitors financial positions, outlooks and ALM activities; and ensures prudent balance sheet management and compliance with applicable policies and risk limits.
| | | | | | | | |
| INTERNATIONAL FINANCE CORPORATION | Page 32 |
| | |
| Management's Discussion and Analysis | |
iv.The Administrative and Risk Committee (ARC), a WBG committee chaired by the Managing Director and Chief Administrative Officer (MDCAO), functions as the principal forum for administrative risk matters. It provides oversight to ensure a group-wide view of how these risks are interconnected and of emerging threats, using risk management mechanisms.
▪IFC’s Management Team: Under the direction of its Managing Director (MD), IFC’s Management Team (MT) is responsible for the Corporation’s day-to-day operations including the management of existing and potential risks. The MT carries out its responsibilities through three IFC Management Committees:
i.The Tier III Project Committee (T3PC), which is a decision-making body to review new projects (investment or advisory) that meet certain risk criteria including certain economic capital thresholds, nominal investment amounts, credit ratings and/or complex E&S and/or integrity issues. The T3PC does not set policy recommendations or directives but can approve exceptions to IFC’s operational directives as appropriate, for individual projects (unless otherwise specified in that directive).
ii.The Corporate Risk Committee (CRC), which is primarily responsible for overseeing risks to IFC not covered by the WBG Committees. The CRC reviews and approves all such institutional risk-related matters.
iii.The Blended Finance and Donor Funds Committee (BFC), which is primarily responsible for the terms, proper allocation and utilization of donor funds, IFC’s blended finance facilities, IDA/PSW funds at Concept and Investment Review Meeting (IRM) stage and allocation and utilization of grants at or above US$ 1 million. The BFC also reviews and approves public sector/government-facing advisory projects that meet certain criteria.
The IFC MT is also supported by the Information and Technology Steering Group (ITSG), which formulates proposals, develops new ideas, considers refinements, promotes coordination, and makes recommendations regarding IFC’s IT strategy, investment plans and work programs for approval by the MT.
IFC MT has delegated to the above IFC Committees the authority to make certain decisions and to grant permitted exceptions to IFC Directives. Figure below depicts IFC’s management decision-making governance structure:
Figure 21: IFC’s Management Decision Making Governance
| | | | | | | | |
| INTERNATIONAL FINANCE CORPORATION | Page 33 |
| | |
| Management's Discussion and Analysis | |
As part of ongoing efforts to strengthen enterprise-wide risk oversight and advance the One WBG approach, the Vice President and World Bank group Chief Risk Officer (CRO) is leading the implementation of a more integrated risk management structure across the World Bank Group institutions, in order to strengthen group-wide risk oversight, enhance risk governance, and align risk management with strategic priorities across the WBG institutions. As part of this initiative, IFC staff are being integrated into the World Bank Group’s financial, operational, model and E&S risk functions under newly appointed leadership and revised organizational structure. Implementation of this initiative will continue throughout FY27.
Enterprise Level Risk Appetite
IFC’s Risk Appetite is the level and type of risk that IFC is able and willing to assume in its exposure and business activities. IFC has in place a Risk Appetite (RA) framework which has been approved by IFC’s Corporate Risk Committee. The purpose of the RA framework is to: (i) compare and contrast IFC’s risk appetite against its risk exposure; (ii) communicate the target level of risks to stakeholders; (iii) provide context for the risk policies and frameworks; (iv) make informed decisions; and (v) report on risks to the Board and management.
On the financial risks faced by IFC, one of the ways in which the risk appetite is expressed is by key financial policies approved by its Board of Directors as detailed below:
▪Capital Adequacy Policy – IFC is required to maintain a minimum level of total resources (Capital Available) to absorb potential losses for all on- and off-balance sheet exposures, estimated at levels consistent with maintaining a AAA/Aaa rating.
▪Leverage Policy – IFC’s outstanding debt plus guarantees held must not exceed four times its net worth.
▪Overall Liquidity Policy – Minimum liquidity (liquid assets) must be sufficient at all times to cover at least 45% of IFC’s estimated net cash requirements for the next three years. All liquid assets are managed in accordance with an investment authorization approved by the Board.
▪Matched Funding Policy – Loans are funded with liabilities that have similar characteristics in terms of interest rate basis, currency, and maturity, except for new products, approved by the Board of Directors, involving asset-liability mismatches.
Risk Categorization
IFC has adopted the following risk taxonomy and risk categorizations as part of its ERM framework. It should be noted that some of the risks in the taxonomy may be related and as such are not mutually exclusive or totally independent of one another. Operational Risk Dimensions are further classified into a third level called Risk Drivers. Examples of Risk Drivers include misconduct, improper business or market practices etc.
Figure 22: IFC’s Risk Taxonomy
| | | | | | | | |
| INTERNATIONAL FINANCE CORPORATION | Page 34 |
| | |
| Management's Discussion and Analysis | |
Figure 22 (continued) : IFC’s Risk Taxonomy
CREDIT RISK
IFC defines credit risk as the risk of loss of principal or loss of an expected financial return due to credit events such as a default or downgrade in credit ratings or any other failure to meet a contractual obligation that results in financial loss. IFC is exposed to credit risk in its Debt portfolio2 and to investment and counterparty credit risk in its liquid asset portfolio.
Investment Operations
Credit risk in investment projects is actively managed throughout the project life cycle. Investment teams are responsible for gathering the necessary information from the client and other relevant stakeholders to verify the financial viability of each project, and for assigning a Credit Rating (CR) at defined stages in the project approval process. The credit risk, investment size, product type and other project-related risks determine the authority level required for the approval of each transaction. Projects are subject to independent credit review either at a specific project level or at a portfolio level under a small project delegation. A credit officer within the independent Risk Management Vice Presidency participates in the specific project level approval process. Projects are approved with reference to a number of operational and prudential limits approved by the CRC, including limits related to single project or client exposure, single country exposure, and sector concentration; these are detailed below:
▪IFC’s total exposure to a country, for the purpose of setting exposure limits, is measured as the amount of economic capital required to support its investment portfolio in that country. Exposure limits are set for each country based on the size of its economy. Sub-limits apply for certain sector exposures within a country.
▪IFC’s total exposure to a single client or client group may not exceed stipulated economic capital and nominal limits based on the credit rating for the client.
▪Individual Investment Limits are applied at the individual project or client level to prevent excessive concentrations.
▪Preferential debt exposure to a country is limited by reference to that country’s total medium and long-term external debt.
▪IFC’s total equity and quasi-equity exposure (outstanding exposure net of specific reserve) shall not exceed IFC’s net worth.
2 Debt portfolio herein the section includes loans and loan-like debt securities.
| | | | | | | | |
| INTERNATIONAL FINANCE CORPORATION | Page 35 |
| | |
| Management's Discussion and Analysis | |
IFC’s investment projects are actively supervised after commitment. Credit ratings are reviewed regularly for each project, with frequency depending on the level of credit rating assigned, and revised if new material information is received. The Risk Management Vice Presidency and Products & Client Vice Presidency, manage top down and bottom-up stress testing against emerging risks on IFC’s portfolio. Additionally, IFC performs quarterly portfolio reviews at the senior management level for the Debt and Equity3 portfolio. When projects show signs of financial distress, immediate attention is key to improving potential outcomes. Seasoned “workout” professionals from IFC’s Department of Special Operations in the Risk Management Vice Presidency, focus on distressed projects to implement the restructuring or possible recovery of IFC’s exposure.
The credit risk of loans is quantified in terms of the probability of default, loss given default and exposure at risk. These risk parameters are used in processes such as determining risk-based returns, project-based capital allocation, exposure limits and for establishing the reserve against losses on loans under the Current Expected Credit Losses accounting standard.
Selected indicators of credit risk exposure in IFC’s Debt Portfolio, together with the five-year trend of Non-Performing Loans (NPLs), are provided below:
Table 18: IFC’s Debt Portfolio Credit Risk Indicators
| | | | | | | | | | | |
(US$ in millions, except for %) | | | |
INDICATOR | June 30, 2026 | June 30, 2025 | Variance |
NPLs as % of the debt portfolio | 1.4 | % | 1.5 | % | (0.1) | % |
Principal amount outstanding on NPLs | $ | 907 | | $ | 871 | | $ | 36 | |
| | | |
| | | |
Total reserve against losses on loans as % of NPLs | 180.9 | % | 161.8 | % | 19.1 | % |
| | | |
Figure 23: NPLs as Percentage of Disbursed Debt Portfolio (US$ in millions, except for %)
Additional details are provided in Section VIII: Results of Operations (Provision for Losses on Loans, Available-for-sale Debt Securities, Off-balance-sheet Credit Exposures and Other Receivables).
Credit Risk - Treasury
IFC manages its exposures to investments and counterparties to mitigate potential losses from the failure by a counterparty to fulfill its contractual obligations. Eligible investments and counterparties are predominantly sovereign governments, government agencies, structured finance instruments, banks, and financial institutions with high-quality credit ratings issued by leading international credit rating agencies.
Details of applicable financial policies and guidelines are provided below:
•Counterparties are selected based on standard eligibility criteria, with a tenor limit for deposits and repurchase agreements.
•Counterparties for derivative instruments are generally restricted to banks and financial institutions with high-quality credit ratings from leading international credit rating agencies; for the sole purpose of funding local currency loans, eligibility is extended to central banks and select local banks.
3 Equity portfolio herein the section includes equity and equity-like debt securities.
| | | | | | | | |
| INTERNATIONAL FINANCE CORPORATION | Page 36 |
| | |
| Management's Discussion and Analysis | |
•Exposures to individual counterparties are subject to exposure limits.
•IFC signs agreements with counterparties that typically require the posting of collateral when net mark-to-market exposures exceed certain predetermined thresholds.
•For exchange-traded instruments, credit risk is limited by restricting transactions to a list of authorized exchanges, contract types, and dealers.
Treasury counterparties remain well diversified by sector and geography. In accordance with its agreements with counterparties, as of June 30, 2026, IFC held $540 million in cash as collateral for changes in mark-to-market exposures on open trades, with no securities collateral received as of June 30, 2026 ($346 million in cash and $0 in securities – June 30, 2025). In terms of Treasury’s credit profile, IFC invests its liquid assets in deposits with highly-rated banks and in securities for which the ratings are generally A- or higher, reflecting the primary objective of principal protection.
MARKET RISK
Market risk is the risk of losses due to movement in market factors such as interest rates, credit spreads, equity, foreign exchange or commodity prices. IFC’s exposure to market risk is mitigated by its matched funding policy, whereby it uses derivative instruments to convert loans funded from market borrowings, and the market borrowings themselves, into floating rate U.S. dollar assets and liabilities with similar duration. Similarly, market risk resulting from derivative transactions with clients, to facilitate clients’ risk management, is typically mitigated by entering into offsetting positions with highly rated market counterparties. IFC’s exposure to unhedged market risk arises primarily from its listed and unlisted equity investments in emerging markets, its quasi-equity loans, and its net worth funded treasury liquid asset portfolio.
Equity Investments
The risk of loss in value of IFC’s emerging markets equity investments is mitigated primarily by applying the same limits framework, decision-making process and portfolio management methods as described above for its lending operations. IFC has a multi-year horizon for its equity investments and accepts short-term price volatility of these investments, which can be significant.
During FY26, equity markets rose strongly, though with intra-year volatility due to geopolitical events. Emerging markets significantly outperformed developed markets. The S&P 500, representing US markets, rose 21%, while Europe’s largest stocks, as measured by Euro Stoxx 50, rose 19%. Emerging markets, represented by Morgan Stanley Capital International (MSCI) Emerging Market total return index, rose 44%, helped by strong corporate earnings and significant investment inflows (returns were concentrated in markets where IFC does not invest). The U.S. dollar weakened slightly (1.5%) against a basket of emerging market currencies (JPMorgan EM currency index).
Liquid Asset Portfolio
Market risk in IFC’s liquid asset portfolio is managed according to the risk appetite chosen by IFC Management using derivatives and other financial instruments such as over-the-counter foreign exchange forward agreements, interest rate and currency swaps, and exchange-traded interest rate futures. Overall market risk exposure is also subject to daily monitoring, which limit interest rate, credit spread, and foreign exchange risk.
Interest rate volatility remained the largest driver of market risk in IFC’s Liquid Asset portfolio due to the unhedged investments in U.S. Treasury securities funded from IFC’s net worth. To manage risks associated with interest rate, foreign exchange, and credit spread risks, a system of limits has been employed and closely monitored on a daily basis to ensure ongoing compliance throughout the fiscal year.
LIQUIDITY, FUNDING AND ASSET LIABILITY MANAGEMENT (ALM) RISK
IFC defines liquidity and funding risk as the risk that, over a specific horizon, IFC will be unable to meet the demand for additional funds required to support its operations due to either funding or liquidity issues or both. IFC faces liquidity risk in its core development finance activities because its investments (loans, equity investments and debt securities), are predominantly illiquid in nature due to the lack of capital flows, the infrequency of transactions, and the lack of price transparency in many emerging markets. To offset this risk, IFC maintains appropriate liquid assets funded from its net worth and market borrowings. IFC manages the risk of mismatches in foreign exchange rates, interest rates, and maturity dates between balance sheet assets and liabilities primarily through the use of derivative instruments, such as cross-currency and interest rate swaps, to hedge these exposures.
Liquid Asset Portfolio
Liquidity risk in the liquid asset portfolio is addressed by liquidity coverage ratios and strict investment eligibility criteria defined in Directives approved by the Corporate Risk Committee. Liquidity coverage ratios include time horizons between 30 days and 3 years, and consider both normal and stressed cash flow requirements. Examples of eligibility criteria include minimum issuance sizes required for bond investments, and limits on the percentage of total bond issuance held by IFC. Consequently, a significant portion of the liquid asset portfolio is invested in highly liquid securities such as high-quality sovereign, sovereign-guaranteed, and supranational fixed income instruments. IFC expects to continue to be able to realize these assets as needed to meet its cash requirements, even in a liquidity crisis.
| | | | | | | | |
| INTERNATIONAL FINANCE CORPORATION | Page 37 |
| | |
| Management's Discussion and Analysis | |
Funding
IFC’s funding operations ensure that IFC has the funds required for its lending operations, and that it has sufficient liquidity to safeguard its AAA/Aaa rating and fulfill its counter-cyclical role. IFC can access a variety of funding markets, including the U.S. dollar market, pound sterling market, and the Australian dollar market, as well as private placement and retail markets. IFC’s discount note program complements its traditional funding sources by providing swift access to short-term funding. IFC’s AAA/Aaa rating is critical to the Corporation’s ability to maintain its low cost of funds. Regular issuance in a variety of markets serves to sustain investor confidence and maintain a diversified investor base.
Asset–Liability Management
While IFC’s matched-funding policy helps mitigate currency and interest rate risk, IFC is still exposed to residual market risks in the market borrowings-funded portion of the balance sheets. The aggregate position in each lending currency is monitored and the risk is managed within the limits established for each currency and the total exposure for all currencies. Residual interest rate risk may arise from differing interest rate reset dates on assets and liabilities or from assets that may become mismatched with hedges over time due to write-downs, prepayments, or rescheduling. The residual interest rate risk is managed by measuring the sensitivity of the present value of assets and liabilities in each currency to a one basis point change in interest rates and managing exposures to within the established limits for each currency and the total exposure for all currencies.
OTHER FINANCIAL RISKS
IFC also faces Capital Risk and Pension risk. Capital risk is the risk to IFC’s AAA/Aaa rating resulting from a low capital adequacy position, in which available capital falls below the level of capital required to support IFC’s activities. Pension Risk is the risk that IFC’s defined-benefit pension plan is underfunded, leading to the need for additional financial support by IFC.
Capital Risk
From a financial sustainability perspective, the capital required to maintain a AAA/Aaa rating is assessed using an economic capital framework, which is the foundation of financial risk management at IFC. Economic capital acts as a “common currency of risk” across the organization, providing IFC with an objective, quantifiable measure of risk that can be applied consistently across business lines, products, regions, and sectors. IFC holds economic capital for credit, market, and operational risks. The economic capital framework covers IFC’s entire balance sheet – loans, debt securities, equity investments, and Treasury assets- and economic capital is used for limit-setting, pricing, and risk-adjusted performance measurement. The primary measure of capital adequacy is IFC’s CUR, which is the ratio of Capital Required for the current portfolio to the Capital Available to support future commitments.
Throughout FY26, IFC’s CUR was well within the established threshold of < 88%.
Pension Risk
IFC participates, along with IBRD and MIGA, in pension and post-retirement benefit plans. The Staff Retirement Plan and Trust (SRP), Retired Staff Benefits Plan and Trust (RSBP), and Post-Employment Benefit Plan (PEBP) (collectively called the “Plans”) are defined benefit plans and cover all WBG employees, retirees and their beneficiaries. Costs, assets, and liabilities associated with the Plans are allocated among IBRD, IFC, and MIGA, based on their employees' respective participation in the Plans. Pension Risk is defined as the risk that IFC’s defined-benefit pension plan is underfunded, leading to the need for additional financial support by IFC.
There are two committees that govern the Plans. From a governance standpoint, both committees are independent of IFC and the Board: (i) The Pension Finance Committee (PFC), which is responsible for the financial management of the Plans and is supported by the Pension Finance Administrator; and (ii) The Pension Benefits Administration Committee (PBAC), which is responsible for the administration of the benefits of the Plans.
The key policies underpinning the financial management of the Plans, including the determination of WBG contributions and the investment of Plan assets, are the funding and investment policies. The objective of these policies is to ensure that the Plans have sufficient assets to meet benefit payments over the long-term. The funding policy, as approved by the PFC, establishes the rules that determine the WBG’s contributions.
In FY26, the WBG’s rate for contributions to the Plans was 12.39% of net salaries. More details about the WBG’s pension plan can be found in Section XI: Pension and Other Post-retirement Benefits of IBRD’s MD&A.
| | | | | | | | |
| INTERNATIONAL FINANCE CORPORATION | Page 38 |
| | |
| Management's Discussion and Analysis | |
OPERATIONAL RISK MANAGEMENT
Consistent with the Basel Framework, IFC defines operational risk as the risk of loss resulting from inadequate or failed internal processes, people and systems, or from external events, and holds economic capital against such risks. Given IFC’s business model, both financial and non-financial potential impacts are considered in assessment of operational risk.
IFC recognizes the importance of operational risk management activities, which are embedded in its business operations. As part of its business activities, IFC is exposed to a range of operational risks including physical security, staff health and safety; technology, information, and data security; business continuity; and execution, delivery, and process management risks. IFC’s approach to managing operational risks includes a dedicated program and robust processes for identifying, assessing, prioritizing, responding to, and monitoring risks. IFC, aggregates, analyzes, and reports on key Risk Indicators (RIs), internal and external events, and emerging risks.
IFC’s Operational Risk Management (ORM) program conforms to a Directive approved by the Corporate Risk Committee, which defines the management of, and roles and responsibilities for, operational risk management in the Corporation.
IFC’s ORM team acts as the second line for operational risk management, in line with the “Three Lines” industry standard model. The ORM team provides a consolidated ORM report to IFC’s Corporate Risk Committee and contributes to the Quarterly Finance and Risk Report (QFRR) and Annual Risk Report (ARR) which are World Bank Group Reports presented to the Audit Committee (AC) of the Board. The team also provides advice and guidance to business stakeholders on operational risk matters and best practices.
During FY26, IFC continued to expand its operational risk program. IFC focused on enhancing the quarterly risk reports to the CRC and the Audit Committee as well as developing an integrated ORM framework at the WBG-level. Also, during FY26, IFC continued to implement and expand the use of traditional operational risk management tools such as Risk and Control Self-Assessments (RCSA), recording and analysis of operational risk events, and monitoring of RIs.
IFC continues to utilize risk transfer mechanisms, including insurance, at both the project and the institutional levels for mitigation of low probability/frequency and high impact operational risks. IFC insures its corporate assets and operations against catastrophic losses and cyber-related risks where commercially viable.
Cybersecurity Risk Management
IFC’s operations rely on the secure processing, storage and transmission of confidential and other information in computer systems and networks. Like other financial institutions, cybersecurity risk continues to be significant for IFC due to the evolving sophistication and complexity of the cyber threat landscape. These risks are unavoidable and IFC seeks to manage them on a cost-effective basis consistent with its risk appetite.
To protect the security of its computer systems, software, networks and other technology assets, IFC benefits from the WBG’s cybersecurity risk management program, consisting of cybersecurity policies, procedures, compliance and awareness initiatives. A multi-layered approach for cybersecurity risk management is employed to prevent and detect malicious activity, both from within the organization and from external sources. In response to emerging cyber threats such as malware including ransomware, denial of service, phishing attacks and artificial intelligence related risks, IFC adapts its technical and process-level controls and implements initiatives to raise awareness to mitigate the risk. When relying on third-party vendors for technology-enabled services, additional measures are applied to gain assurance regarding the security of IFC’s information and technology assets including, as appropriate, legal and cybersecurity contractual safeguards in third-party vendor agreements and the review and monitoring of third-party control environments.
The WBG’s cybersecurity risk management program periodically assesses the maturity and effectiveness of IFC’s cyber defenses through risk mitigation techniques, including but not limited to, targeted testing, internal and external audits, incident response desktop exercises and industry benchmarking.
STRATEGIC AND BUSINESS RISK
These are risks that are specific to IFC given its mission and strategy and include Strategic Risk, Environment & Social Risk, Climate Risk, Corporate Governance Risk, Integrity Risk, Anti-Money Laundering/ Combating the Financing of Terrorism (AML/CFT) Risk and External Financing Risk.
Strategic Risk
IFC defines strategic risk as the risk associated with initial strategy selection, execution, or modification over time, resulting in a lack of achievement of overall objectives.
IFC uses the Anticipated Impact Measurement and Monitoring (AIMM) system as an ex-ante assessment tool to enable IFC staff to measure and monitor the anticipated development impact of investment and advisory projects. The AIMM system evaluates a project’s development impact along two dimensions – project outcomes and market outcomes.
| | | | | | | | |
| INTERNATIONAL FINANCE CORPORATION | Page 39 |
| | |
| Management's Discussion and Analysis | |
▪Project outcomes – These refer to a project’s direct effects on stakeholders (including employees, customers, suppliers, and the community); the direct, indirect, and induced effects on the economy and society overall; and the effects on the environment and social sustainability.
▪Market outcomes – These refer to a project’s potential for generating systemic, sector-wide changes that enhance market competitiveness, resilience, integration, inclusiveness, and sustainability.
The AIMM system is now fully integrated into IFC’s operations, allowing development impact considerations to be weighed against a range of strategic objectives, including volume, financial return, risk, and thematic priorities.
Environment and Social (E&S) Risk
Environment and Social (E&S) risk is the risk that IFC is unable to effectively engage with and influence clients to fulfill the requirements of IFC’s E&S Performance Standards, within a reasonable period of time, potentially causing significant or material adverse impacts to people or the environment and lead to negative financial impact or reputational harm to IFC.
IFC manages E&S risk at both the portfolio and project levels. At the portfolio level, IFC continuously strengthens its E&S risk management framework through enhanced due diligence and supervision practices, contextual risk assessment, internal and external capacity building, and improved systems and procedures. At the project level, E&S risks are managed in accordance with IFC’s Sustainability Policy and E&S Review Procedures. IFC provides capacity building, guidance, and support to its clients in identifying, assessing and mitigating E&S risks through standards, guidelines, guidance notes, good practice notes, tip sheets, handbooks, tools and training.
As part of the broader WBG functional integration, a new integrated E&S Risk structure became effective in January 2026. Under this structure, E&S responsibilities are formally separated between “E&S Makers” (frontline operational teams responsible for E&S execution) and “E&S Checkers” (a centralized risk monitoring unit providing independent oversight). The WBG Chief Risk Officer oversees the global WBG E&S Risk Department, which serves as a dedicated second line of defense to ensure sustainability, accountability, and alignment with WBG standards.
The E&S Risk Department provides independent, second-line oversight of E&S risks across WBG operations to help ensure that risks are appropriately identified, assessed, monitored, and mitigated. In this role, the department:
▪Works closely with E&S operational teams to validate risks, monitor corrective actions, support cross-regional learning, and promote timely, consistent, and actionable escalation of key E&S risk issues;
▪Leads E&S risk oversight activities through early identification of emerging risks, structured portfolio reviews, watch list management, heightened monitoring, and targeted interventions; and
▪Oversees grievance management across the full lifecycle, from intake to closure, including tracking, assessment, escalation where needed, and analysis of grievance trends to inform risk mitigation and promote more consistent E&S risk management across the portfolio.
Corporate Governance Risk
Corporate governance risk is the risk that IFC’s investment clients have inadequate corporate governance which could lead to negative financial impact or reputational harm to IFC.
IFC promotes better standards of corporate governance and disclosures across emerging markets and builds internal and external capacity to identify, assess and mitigate these risks. IFC has integrated its corporate governance offering both in its investment and advisory services, providing internal support for assessing corporate governance risks at the project level; building capacity through internal and external training, practice notes, tip sheets, handbooks, tools, training and other knowledge products; and providing advice to clients and market intermediaries. IFC offers advice and support across a range of themes, including governance of E&S, climate governance, women on boards and in business leadership, and sustainability reporting are integrated into the offering. For both investment clients and advisory services clients, corporate governance practices are evaluated utilizing the well established IFC Corporate Governance Methodology.
Climate Risk
Climate Risk, as defined by IFC, encompasses the actual or potential negative effects of climate-related conditions and events on IFC's investments, corporate operations, reputation or consolidated financial statements. There are two primary climate-related risk categories: (1) physical risks and (2) transition risks.
“Physical risks” include both “acute” and “chronic” physical risks to business operations. Acute physical risks are event-driven, stemming from short-term extreme weather events like hurricanes, floods, tornadoes, wildfires, storms, drought or heatwaves. Chronic physical risks emerge from longer-term shifts in climate patterns, such as progressive changes in precipitation and temperature which could lead to rising sea levels, alteration of ecosystems, desertification, water scarcity, soil degradation, and deterioration of marine ecology.
| | | | | | | | |
| INTERNATIONAL FINANCE CORPORATION | Page 40 |
| | |
| Management's Discussion and Analysis | |
“Transition risks” are attributable to the global shift towards a lower-carbon economy. These risks are multifaceted and arise from changes in law or regulation, public policies, technological breakthroughs, shifts in investor and public sentiment, and disruptive innovations in business models aimed at addressing climate change.
These risks could carry financial and non-financial implications for IFC.
Integrity, Money Laundering and Terrorist Financing, and Tax Risks
These are interrelated risks that IFC’s Clients may have ineffective governance structures and/or controls to manage exposure to integrity risk, Money Laundering and Terrorist Financing (ML/TF) risk and tax risk. Integrity risks are the risks of engaging with external institutions or persons whose background or activities, may have adverse reputational and, often, financial impact on IFC.
IFC works with a wide range of clients and partners in Investment Operations, Upstream and Advisory Services activities, from multinational to small companies, and from government institutions to non-governmental organizations. Thus, each transaction or service opportunity presents unique integrity risks, affected by different factors, including the type of engagement, financial instrument, structure, geography and duration of the engagement. IFC conducts integrity due diligence on clients and partners to manage these risks and to mitigate them where it reasonably can, both before engagement and on an ongoing basis during the engagement.
ML/TF risk is the risk that IFC’s financial intermediary clients may have ineffective controls to manage exposure to money laundering and terrorist financing risk, subjecting IFC to potential integrity, reputational, or financial risk. IFC conducts Anti-Money Laundering (AML) / Combating the Financing of Terrorism (CFT) due diligence on financial institution clients and funds in addition to its integrity due diligence to determine whether:
▪the client’s AML/CFT procedures and controls are structured to comply with relevant AML/CFT standards;
▪the AML/CFT procedures and controls are appropriate for the client’s business and operating environments;
IFC has been strengthening its AML capacity, through in-house training of its business teams and roll out of technical capacity building programs (e.g., to promote the use of technology in managing AML/CFT risks).
Tax risk is the risk that IFC’s clients or projects may be structured to evade taxes or facilitate abusive tax planning. To address this, a systematic approach to tax due diligence (TDD) is applied through the World Bank Group’s Intermediate Jurisdictions policy and IFC’s Tax Due Diligence Procedures. TDD seeks to verify: (i) compliance of intermediate jurisdictions with globally accepted tax standards with primary focus on tax transparency; (ii) the rationale for the use of intermediate jurisdictions; (iii) arm’s length pricing of cross-border inter-group transactions, along with other key tax risk flags that examine the tax guidance of the underlying project company. These established processes apply to all investment projects and ultimately aim to mitigate the risks of abusive tax structuring by IFC’s clients that risk eroding the tax base of project countries. IFC is raising awareness of TDD through targeted trainings for regional and industry teams. In addition, IFC promotes responsible tax practices among its current and prospective clients as well as contributes to global tax policy discussions on topics relevant to its TDD processes.
IFC is currently conducting a review of the World Bank Group’s Intermediate Jurisdictions policy and its implementation.
External Financing Risk
As well as using its own resources to invest in and provide advice to clients, IFC raises additional funds from public and private sector institutional investors, lenders, and donors through several different mechanisms. External financing risk is the risk that when entrusted with oversight of such funds, IFC does not meet its contractual obligations to the third parties involved.
To mitigate this risk, IFC works within agreed frameworks which establish IFC's responsibilities and obligations with respect to the third parties. For example, where financing to clients is mobilized through B Loans or MCPP, the specialized Syndications Department follows defined processes to identify co-financiers, advise on structuring, and monitor compliance with investment agreements. In some cases, financing from third parties, including donors, is administered through trust funds. IFC has processes in place for clearing all IFC trust fund proposals and agreements and overseeing IFC's trust fund portfolio.
| | | | | | | | |
| INTERNATIONAL FINANCE CORPORATION | Page 41 |
| | |
| Management's Discussion and Analysis | |
SECTION VII: CRITICAL ACCOUNTING POLICIES
IFC’s accounting policies, as well as estimates made by Management, are integral to its financial reporting. Some of these accounting policies require Management to make difficult, complex, and subjective judgments as these relate to matters inherently uncertain and susceptible to change. Note A to IFC’s FY26 consolidated financial statements contains a summary of IFC’s significant accounting policies, including a discussion of recently adopted accounting standards and accounting and financial reporting developments. Certain of these policies are considered to be “critical” to the portrayal of IFC’s financial condition and results of operations, since they require Management to make difficult, complex or subjective judgments, some of which may relate to matters that are inherently uncertain.
These policies include:
▪Determining the fair value of equity investments, debt securities, loans, liquid assets, borrowings, and derivatives;
▪Determining the level of reserve against losses in the loan portfolio;
▪Determining the level and nature of impairment for debt securities carried at fair value with changes in fair value being reported in Other Comprehensive Income (OCI); and
▪Determining the future pension and post-retirement benefit costs and obligations using actuarial assumptions based on financial market interest rates, past experience, and best estimate of future benefit cost changes and economic conditions.
Many of IFC’s financial instruments are classified in accordance with the fair value hierarchy established by accounting standards for fair value measurements and disclosures which permit the fair value and/or impairment to be estimated based on internally developed models or methodologies utilizing significant inputs that are unobservable.
VALUATION OF FINANCIAL INSTRUMENTS
IFC reports at fair value all of its derivative instruments, liquid asset trading securities, equity investments, investments in debt securities and certain borrowings, and loans. In addition, various investment agreements contain embedded or standalone derivatives that, for accounting purposes, are separately accounted for as derivative assets or liabilities. IFC classifies all financial instruments accounted for at fair value based on the fair value hierarchy established by accounting standards for fair value measurements and disclosures as described in more detail in Notes A and L to IFC’s FY26 consolidated financial statements.
IFC’s regional and industry departments are primarily responsible for determining the fair value of IFC’s equity investments and equity derivatives. The Investment Valuation Unit in the Investment and Credit Risk Department in the Risk Management Vice Presidency, and the Treasury Valuation Unit in the Treasury Department in the integrated World Bank Group Treasury Vice Presidency, are responsible for determining the fair value of debt securities, loans, and related derivatives. The Investment Valuation Unit provides oversight over the overall fair valuation process by monitoring and reviewing the fair values of IFC’s investment portfolio.
IFC’s borrowings are fair valued by the Treasury Valuation Unit. Third party independent vendor prices are used to price the vast majority of IFC’s liquid assets. The vendor prices are evaluated by the Treasury Valuation Unit who maintains oversight for the pricing of liquid assets. All of IFC’s financial instruments in its liquid asset portfolios are managed according to an investment authority approved by the Board of Directors.
The change in fair value of borrowings carried at fair value resulting from changes in instrument-specific credit risk is reported in Other Comprehensive Income, while the remaining change in fair value is reported in Net Income.
Many of IFC’s financial instruments accounted for at fair value are valued based on unadjusted quoted market prices or using models where the significant assumptions and inputs are market-observable. The fair values of financial instruments valued using models where the significant assumptions and inputs are not market-observable are generally estimated using complex pricing models of the net present value of estimated future cash flows. Management makes numerous assumptions in developing pricing models, including an assessment about the counterparty’s financial position and prospects, the appropriate discount rates, interest rates, and related volatility and expected movement in foreign currency exchange rates. Changes in assumptions could have a significant impact on the amounts reported as assets and liabilities and the related unrealized gains and losses reported in the income statement and Other Comprehensive Income. The fair value computations affect both the Investment services and Treasury segments of IFC (see Note M to the FY26 consolidated financial statements for further discussion of IFC’s business segments).
RESERVE AGAINST LOSSES ON LOANS AND OFF-BALANCE SHEET CREDIT ARRANGEMENTS
In accordance with ASC Topic 326, Financial Instruments-Credit Losses (ASC 326), IFC recognizes a reserve for credit losses that is deducted from the amortized cost basis of loans to present the net amount expected to be collected on loans on the balance sheets. IFC uses a credit loss methodology that reflects an estimate of expected credit losses over the remaining contractual life of a loan, considering forward-looking information. The process for determining the reserve against credit losses is discussed in Note A to IFC’s FY26 consolidated financial statements.
| | | | | | | | |
| INTERNATIONAL FINANCE CORPORATION | Page 42 |
| | |
| Management's Discussion and Analysis | |
The determination of the reserve against credit losses is based on complex inputs and assumptions, which require a high degree of judgment. In particular, the forecast of key economic variables relevant to the loan portfolio is one of the critical assumptions to IFC’s estimation of expected credit losses. Information and events, with respect to the borrower and/or the economic and political environment in which it operates, that are considered in determining a loss reserve include, but are not limited to, the borrower’s financial difficulties, assessing the risk of breach of contract, bankruptcy/reorganization, credit rating downgrade as well as geopolitical conflict, financial/economic crisis, commodity price decline, adverse local government action and natural disaster. The risks inherent in the portfolio that are considered in determining the portfolio reserve are those proven to exist by past experience and include: country systemic risk; the risk of correlation or contagion of losses between markets; uninsured and uninsurable risks; nonperformance under guarantees and support agreements; and opacity of, or misrepresentation in a borrower's financial statements.
IFC recognizes a reserve against credit losses on off-balance sheet credit exposures for guarantees that are not measured at fair value and other off-balance sheet arrangements. Methodologies for estimating the reserve for credit losses on off-balance sheet credit exposures, including loans committed but not disbursed, are generally consistent with methodologies for estimating the reserve for credit losses for the disbursed loan portfolio.
IFC periodically reviews these variables and reassesses the adequacy of the reserve against credit losses accordingly. Actual losses may differ from expected losses owing to unforeseen changes in any of the variables affecting the creditworthiness or estimates inherent in the exposure measurements.
IFC’s regional and industry departments are primarily responsible for individual loss reserve and for credit risk and facility risk ratings which are used for the portfolio loss reserve. A critical component of the portfolio loss reserve calculations is the annual reevaluation of Current Expected Credit Losses (CECL) methodology and assumptions, which are a collective effort of the WBG Controllers, Credit Risk, Corporate Risk Management, Department of Special Operations, Economics, and Global Debt Analytics. The Loss Provisioning Governance Committee is the final approving authority for these assumptions. The Portfolio Review team in WBG Controllers provides oversight over the loss provisioning process by monitoring and reviewing individual loss provisions and compiling inputs to run the portfolio loss provisioning calculations for IFC's investments subject to loss provisioning.
IFC records benefits from freestanding credit enhancements separately from the reserve against credit losses.
IMPAIRMENT OF DEBT SECURITIES
For all debt security investments classified as available-for-sale, IFC assesses impairment each quarter. In accordance with ASC 326, IFC established an impairment model to determine whether all or a portion of the unrealized loss is a credit loss, and recognizes a reserve for credit losses. When impairment is identified, the entire impairment is recognized in net income if certain conditions are met (as detailed in Note A to IFC’s FY26 consolidated financial statements). IFC considers all relevant information including the extent to which fair value has been less than amortized cost, whether IFC intends to sell the debt security or whether it is more likely than not that IFC will be required to sell the debt security, the payment structure of the obligation and the ability of the issuer to make scheduled interest or principal payments, any changes to the ratings of a security, and relevant adverse conditions specifically related to the security, an industry or geographic sector.
PENSION AND OTHER POST-RETIREMENT BENEFITS
IFC, along with IBRD and MIGA, participates in pension and post-retirement benefit plans that cover substantially all of its staff members. The underlying actuarial assumptions used to determine the Projected Benefit Obligations (PBO), accumulated benefit obligations, and the funded status associated with these plans are based on financial market interest rates, experience, and management’s best estimate of future benefit changes and economic conditions. All costs, assets and liabilities associated with these plans are allocated between IBRD, IFC and MIGA based upon their employees’ respective participation in the plans. IFC reimburses IBRD for its proportionate share of any contributions made to these plans by IBRD. Contributions to these plans are calculated as a percentage of salary. For further details, please refer to Note O to the FY26 consolidated financial statements.
| | | | | | | | |
| INTERNATIONAL FINANCE CORPORATION | Page 43 |
| | |
| Management's Discussion and Analysis | |
SECTION VIII: RESULTS OF OPERATIONS
OVERVIEW
The overall market environment has a significant influence on IFC’s financial performance. The main elements of IFC’s net income and other comprehensive income, and influences on the level and variability of net income and other comprehensive income from period to period are shown below:
Table 19: Main Elements of Net Income and Other Comprehensive Income
| | | | | |
ELEMENTS | SIGNIFICANT INFLUENCES |
Net income: | |
Yield on interest earning assets (principally loans) | Market conditions including spread levels and degree of competition. Nonaccruals and recoveries of interest on loans formerly in nonaccrual status, and income from participation notes on individual loans are also included in income from loans. |
Liquid asset income | Realized and unrealized gains and losses on the liquid asset portfolio, in particular the portion of the liquid asset portfolio funded by net worth, which are driven by external factors such as the interest rate environment and liquidity of certain asset classes within the liquid asset portfolio. |
Income from the equity investment portfolio | Global climate for emerging markets equities, fluctuations in currency markets and company-specific performance for equity investments. Overall performance of the equity portfolio. |
Provision for losses on loans, guarantees, and available-for-sale debt securities | Risk assessment of borrowers, probability of default, loss given default, and expected balance at default considering prepayment and disbursement assumptions used to estimate expected utilization rates. |
Other income and expenses | Level of advisory services provided by IFC to its clients, the level of expenses from the staff retirement and other benefits plans, the approved and actual administrative expenses, and other budget resources. |
Gains and losses on loans, debt securities, borrowings and related derivatives | Principally, differences between changes in fair values of borrowings, excluding issuer’s credit spread, and associated derivative instruments; and unrealized gains or losses associated with the investment portfolio including puts, warrants, and stock options, which in part are dependent on the global climate for emerging markets. These securities may be valued using internally developed models or methodologies, utilizing inputs that may be observable or non-observable. |
| |
Other comprehensive income: | |
Unrealized gains and losses on debt securities accounted for as available-for-sale | Global climate for emerging markets, fluctuations in currency and commodity markets and company-specific performance, and consideration of the extent to which unrealized losses are considered a credit loss. Debt securities may be valued using internally developed models or methodologies, utilizing inputs that may be observable or non-observable. |
Unrealized gains and losses attributable to instrument-specific credit risk on borrowings at fair value under the Fair Value Option | Fluctuations in IFC’s own credit spread measured against reference rate, resulting from changes over time in market pricing of credit risk. As credit spreads widen, unrealized gains are recorded, and when credit spreads narrow, unrealized losses are recorded. |
Unrecognized net actuarial gains and losses and unrecognized prior service costs on benefit plans | Returns on pension plan assets and the key assumptions underlying PBO, including financial market interest rates, staff expenses, past experience, and management’s best estimate of future benefit cost changes and economic conditions. |
| | | | | | | | |
| INTERNATIONAL FINANCE CORPORATION | Page 44 |
| | |
| Management's Discussion and Analysis | |
IFC’s net income for the past three fiscal years ended June 30, 2026 are presented below:
Figure 24: IFC's Net Income FY24 – FY26 (US$ in millions)
The following paragraphs detail significant variances between FY26 and FY25 covering the periods included in IFC’s FY26 consolidated financial statements. The $31 million increase in net income was primarily due to the following:
Figure 25: Change in Net Income FY26 vs FY25 (US$ in millions)
_________
* Income from loans and debt securities and treasury income are net of allocated charges on borrowings
** Includes associated derivatives
*** Others mainly represents service fees, and net advisory service expenses
| | | | | | | | |
| INTERNATIONAL FINANCE CORPORATION | Page 45 |
| | |
| Management's Discussion and Analysis | |
A more detailed analysis of the components of IFC’s net income is as follows:
Income from Loans and Guarantees, including Realized Gains and Losses on Loans and Associated Derivatives
Income from loans and guarantees, including realized gains and losses on loans and associated derivatives for FY26 amounted to $3.3 billion. This represents a decrease of $104 million compared to $3.4 billion in FY25, as higher interest income from higher average outstanding balances was more than offset by the impact of lower interest rates.
Non-performing Loans (NPLs)
NPLs increased by $36 million to $907 million4 of the disbursed loan portfolio as of June 30, 2026. The increase was largely due to $267 million new NPL additions partially offset by $235 million of positive developments and $27 million net write-offs. Of the new NPLs recognized in FY26, the five largest loans accounted for a total of $175 million.
Figure 26: Non-performing Loans (US$ in millions)
_________
* Mainly represents balance changes due to deferrals, restructuring, disbursements, interest capitalization, conversions and foreign exchange gains/losses.
Provision for Losses on Loans, Off-Balance-Sheet Credit Exposures and Other Receivables, and Available-for-sale Debt Securities
IFC recorded a net provision of $298 million in FY26 ($50 million – FY25), for losses on loans, off-balance-sheet credit exposures and other receivables, as well as available-for-sale debt securities, analyzed as follows:
Table 20: Portfolio and Individual Provision (Release of Provision)
| | | | | | | | | | | | | | | | | |
| For the year ended June 30, |
(US$ in millions) | 2026 | | 2025 | | Variance |
Portfolio provision (release) | | | | | |
Disbursed loans | $ | 178 | | | $ | 74 | | | $ | 104 | |
Undisbursed loans | 55 | | | (85) | | | 140 | |
Off-balance sheet credit exposures and Other Receivables | 59 | | | 47 | | | 12 | |
Individual provision (release) | | | | | |
Disbursed loans | 5 | | | 17 | | | (12) | |
Undisbursed loans | 3 | | | 2 | | | 1 | |
Off-balance sheet credit exposures and Other Receivables | 8 | | | 1 | | | 7 | |
Available-for-sale debt securities | (10) | | | (6) | | | (4) | |
Total | $ | 298 | | | $ | 50 | | | $ | 248 | |
Total portfolio provision increased in FY26 mainly due to net new commitments and disbursements as well as a refinement to the loss given default methodology for the unsecured covenant lite program. Individual provision in FY26 were lower than FY25, mainly due to project-specific improvements.
4 Includes $118 million reported as debt securities and $74 million reported as loans under Fair Value Option on the Balance Sheets as of June 30, 2026 ($142 million debt securities and $97 million Fair Value Option loans – June 30, 2025).
| | | | | | | | |
| INTERNATIONAL FINANCE CORPORATION | Page 46 |
| | |
| Management's Discussion and Analysis | |
Reserve against losses on loans disbursed and loans committed but not disbursed increased by $232 million to $1.6 billion as of June 30, 2026 analyzed as follows:
Figure 27: Reserve against Losses for Disbursed and Undisbursed Loans (US$ in millions)
_________
* Mainly represents balance changes due to deferrals, restructuring, disbursements, interest capitalization, conversions and foreign exchange gains/losses. Graph presents the reserve against losses on disbursed and committed but not disbursed loan portfolio only (without Guarantees and Debt Securities) .
The breakdown of the total reserve against losses on loans disbursed and loans committed but not disbursed and the reserve coverage ratio as of June 30, 2026 and June 30, 2025 are presented in the table below:
Table 21: Reserve Against Losses on Loans Disbursed and Loans Committed but not Disbursed and Reserve Coverage Ratio
| | | | | | | | | | | | | | | | | | | | | | | | | | | | | | | | | | | |
| June 30, 2026 | | June 30, 2025 | | Variance |
(US$ in millions, unless otherwise noted) | Reserve | | Reserve coverage ratio a | | Reserve | | Reserve coverage ratioa | | Reserve | | Reserve coverage ratioa |
Reserve against losses on disbursed loans | | | | | | | | | | | |
Portfolio reserve | $ | 1,132 | | | 2.4 | % | | $ | 953 | | | 2.4 | % | | $ | 179 | | | — | % |
Individual reserve | 316 | | | 27.8 | | | 320 | | | 21.8 | | | (4) | | | 6.0 | |
| 1,448 | | | 3.0 | | | 1,273 | | | 3.1 | | | 175 | | | (0.1) | |
Reserve against losses on loans committed but not disbursed | | | | | | | | | | | |
Portfolio reserve | 188 | | | 2.3 | | | 134 | | | 1.7 | | | 54 | | | 0.6 | |
Individual reserve | 5 | | | 10.6 | | | 2 | | | 5.7 | | | 3 | | | 4.9 | |
| 193 | | | 2.3 | | | 136 | | | 1.7 | | | 57 | | | 0.6 | |
Total reserve | $ | 1,641 | | | 2.9 | % | | $ | 1,409 | | | 2.8 | % | | $ | 232 | | | 0.1 | % |
_________
a Reserve coverage ratio is calculated as the reserve over related disbursed loans balances or reserve over related loans committed but not disbursed balances.
The decrease in individual reserve against losses on disbursed loans mainly reflected changes in the composition of the impaired disbursed loan portfolio and project-specific developments.
In FY26, the top ten largest individual provisions and top ten largest individual releases of provision comprised 85% and 83% of the total individual provisions and total individual releases of provision, respectively, for losses on loans.
Income from equity investments, including realized and unrealized gains and losses on equity and associated derivatives
IFC divests equity investments where (i) its developmental role has been fulfilled, (ii) pre-determined sales trigger levels have been met, and (iii) where applicable, lock-ups have expired. Gains and losses on equity investments and associated derivatives include both realized and unrealized gains or losses.
| | | | | | | | |
| INTERNATIONAL FINANCE CORPORATION | Page 47 |
| | |
| Management's Discussion and Analysis | |
Income from equity investments and associated derivatives (consisting of dividends, and net capital gains) is further analyzed below:
Table 22: Income from Equity Investments, Including Realized and Unrealized Gains and Losses on Equity and Associated Derivatives
| | | | | | | | | | | | | | | | | | | | | | | | | | | | | | | | | | | | | | |
| For the year ended June 30, |
(US$ in millions) | 2026 | | 2025 | | | | | | | | | | | | | | | | | | | | | | | Variance |
Net realized gains | $ | 522 | | | $ | 219 | | | | | | | | | | | | | | | | | | | | | | | | 303 | |
Net unrealized gains | 474 | | | 157 | | | | | | | | | | | | | | | | | | | | | | | | 317 | |
| | | | | | | | | | | | | | | | | | | | | | | | | | |
| | | | | | | | | | | | | | | | | | | | | | | | | | |
Dividend income, custody, fees and other | 160 | | | 141 | | | | | | | | | | | | | | | | | | | | | | | | 19 | |
Total income from equity investments, including realized and unrealized gains and losses on equity and associated derivatives | $ | 1,156 | | | $ | 517 | | | | | | | | | | | | | | | | | | | | | | | | $ | 639 | |
The increase of $639 million primarily reflects higher unrealized gains of $317 million due to improvements in fair valuation, and higher realized gains of $303 million driven by strong market momentum. In FY26, the top five investments with net capital gains generated gains of $324 million, while the top five investments with net capital losses incurred losses of $156 million. In comparison, in FY25 the top five investments with net capital gains had gains of $239 million and the top five investments with net losses recorded capital losses of $200 million.
Income from Debt Securities and Realized Gains and Losses on Debt Securities, and Associated Derivatives
Income from debt securities and associated derivatives remained unchanged at $819 million in FY26 compared to prior year.
Income from Liquid Asset Trading Activities
Income from liquid asset trading activities gross of funding costs and net of funding costs are analyzed in the table below:
Table 23: Income from Liquid Asset Trading Activities
| | | | | | | | | | | | | | | | | |
| For the year ended June 30, |
(US$ in millions) | 2026 | | 2025 | | Variance |
Liquid asset income, gross of funding costs | | | | | |
Market Funded portfolio | $ | 1,242 | | | $ | 1,190 | | | $ | 52 | |
Net Worth Funded portfolio | 723 | | | 1,108 | | | (385) | |
Total | $ | 1,965 | | | $ | 2,298 | | | $ | (333) | |
Liquid asset income, net of funding costs | | | | | |
Market Funded portfolio | $ | 100 | | | $ | 52 | | | $ | 48 | |
Net Worth Funded portfolio | 534 | | | 977 | | | (443) | |
Total | $ | 634 | | | $ | 1,029 | | | $ | (395) | |
The decrease of $395 million (net of funding costs) primarily reflects the decline in mark-to-market in the Net Worth Funded portfolio, driven by rising treasury yields in FY26. Net income on the Market Funded portfolio was higher in FY26, mainly due to foreign exchange gains on local-currency investments held to fund upcoming disbursements.
Charges on Borrowings
IFC’s charges on borrowings of $3.6 billion in FY26 were relatively flat compared to FY25. Charges on borrowings in FY26 included $103 million expenses from short-term discount notes ($113 million – FY25), $2 million in respect of borrowings from IDA ($3 million – FY25), and $15 million expenses from securitized borrowings ($0 – FY25).
The weighted average cost of IFC’s general market borrowings, after the effects of borrowing-related derivatives, and excluding short-term borrowings, was 4.1% as of June 30, 2026, a decrease from 4.8% as of June 30, 2025 due to the decrease of Secured Overnight Financing Rate. The weighted average cost for securitized borrowings was 4.8% as of June 30, 2026.
| | | | | | | | |
| INTERNATIONAL FINANCE CORPORATION | Page 48 |
| | |
| Management's Discussion and Analysis | |
Other Income
Other income increased modestly by $14 million with its components analyzed in the table below:
Table 24: Other Income | | | | | | | | | | | | | | | | | |
| For the year ended June 30, |
(US$ in millions) | 2026 | | 2025 | | Variance |
Upstream and Advisory Services Income | $ | 251 | | | $ | 259 | | | $ | (8) | |
Service Fees | 143 | | | 150 | | | (7) | |
Investment gains on PEBP assets | 118 | | 77 | | | 41 | |
Fees collected from clients | 23 | | 18 | | | 5 | |
PCRF Income | 16 | | 25 | | | (9) | |
Other reimbursable arrangements | 11 | | 15 | | | (4) | |
Other Miscellaneous Income | 54 | | 58 | | | (4) | |
Total | $ | 616 | | | $ | 602 | | | $ | 14 | |
Administrative and Other Expenses
Administrative and other expenses decreased modestly by $8 million. The components are analyzed in the table below:
Table 25: Administrative and Other Expenses | | | | | | | | | | | | | | | | | |
| For the year ended June 30, |
(US$ in millions) | 2026 | | 2025 | | Variance |
Administrative expenses a | $ | 1,691 | | | $ | 1,679 | | | $ | 12 | |
Upstream and Advisory services expenses | 378 | | 373 | | | 5 | |
Income from pension and other postretirement benefit plans | (79) | | | (24) | | | (55) | |
Other Expenses | 30 | | | — | | | 30 | |
Total | $ | 2,020 | | | $ | 2,028 | | | $ | (8) | |
_________ | | | | | |
a Includes pension service cost of $188 million and $207 million in FY26 and FY25 respectively. |
Foreign Currency Transaction Gains and Losses on Non-Trading Activities
Foreign currency transaction gains and losses are recognized in both net income and other comprehensive income. For debt securities classified as available-for-sale, the gains or losses from foreign currency transactions are reported in other comprehensive income, while the impact from the associated derivatives are reported in net income. The net foreign exchange related gains (losses) are analyzed in the table below:
Table 26: Foreign Currency Transaction Gains and Losses on Non-Trading Activities | | | | | | | | | | | | | | | | | | | |
| For the year ended June 30, |
(US$ in millions) | 2026 | | 2025 | | Variance | | |
Reported in Net Income | $ | (60) | | | $ | (43) | | | $ | (17) | | | |
Reported in Other Comprehensive Income, net of reclassifications to net income upon sale or repayment | 17 | | 72 | | | (55) | | | |
Total | $ | (43) | | | $ | 29 | | | $ | (72) | | | |
Net Unrealized Gains and Losses on Loans, Debt Securities, Borrowings and Related Derivatives
IFC reported $38 million of unrealized gains on loans, debt securities, net of associated derivatives in FY26 compared to $384 million of losses in FY25. The change was primarily driven by increase in fair valuation on derivatives associated with loans and debt securities. Changes in the fair value of derivatives are recognized in the consolidated statements of operations, while certain offsetting changes in the fair value of hedged loans are not, as those loans are measured at amortized cost.
IFC reported $132 million of unrealized gains on borrowings net of associated derivatives in FY26 compared to $499 million unrealized gains in FY25. The $499 million of unrealized gains in FY25 includes a one-time reclassification of $231 million gains from AOCI to net income, due to a refinement of the methodology to calculate changes in IFC's own credit spread.
| | | | | | | | |
| INTERNATIONAL FINANCE CORPORATION | Page 49 |
| | |
| Management's Discussion and Analysis | |
Unrecognized Net Actuarial Gains and Losses and Unrecognized Prior Service Costs on Benefits Plans
Unrecognized pension adjustments largely represent the unrecognized net actuarial gains and losses on benefit plans. Actuarial gains and losses occur when actual results differ from expected results in determining the funded status of the pension plans. Since the pension plans are long-term, changes in asset returns and discount rates cause volatility in comprehensive income. Given its long-term planning horizon for pension plans, Management is focused mainly on ensuring that contributions to pension plans appropriately reflect long-term assumptions about asset returns and discount rates.
During FY26, IFC recorded a net pension gain of $405 million ($404 million of unrecognized net actuarial gains and a $1 million reduction of prior service cost). This gain was mainly driven by the higher than expected asset returns. As the Plans are managed with a long-term horizon, results over shorter time periods may be impacted positively or negatively by market fluctuations.
For discussion of IFC’s financial results for the year ended June 30, 2025 as compared to the year ended June 30, 2024, see Section VIII: Results of Operations in IFC’s Management’s Discussion and Analysis and Consolidated Financial Statements for the year ended June 30, 2025.
| | | | | | | | |
| INTERNATIONAL FINANCE CORPORATION | Page 50 |
| | |
| Management's Discussion and Analysis | |
SECTION IX: GOVERNANCE AND CONTROL
SENIOR MANAGEMENT
The following is a list of the principal officers of IFC as of June 30, 2026:
| | | | | |
President | Ajay Banga |
Managing Director | Makhtar Diop |
Regional Vice President, Africa | Ethiopis Tafara |
Regional Vice President, Europe, Latin America & the Caribbean | Alfonso García Mora |
Regional Vice President, Middle East and Central Asia | John Gandolfo a |
Regional Vice President, Asia and the Pacific | Sarvesh Suri |
Vice President, Strategy and Operations Support | Elena Bourganskaia |
| |
Vice President and General Counsel, Legal, Institutional Risk and Governance | Ramit Nagpal |
Vice President, Products & Clients | Mohamed Gouled |
Vice President and Chief Risk Officer | Federico Galizia |
Vice President and Chief Financial Officer | John Gandolfo |
_________ | |
a John Gandolfo was the acting Regional Vice President, Middle East and Central Asia, effective November 9, 2025. Imad N. Fakhoury was announced as IFC Regional Vice President, Middle East and Central Asia effective July 1, 2026. |
As part of ongoing efforts to scale impact, boost efficiency, and deliver greater value to our clients across the World Bank Group (WBG), IFC is implementing organizational changes to integrate certain functions within WBG Vice Presidencies. IFC will continue to operate as a separate legal entity, with its external obligations unchanged. These changes are designed to strengthen synergies, streamline operations, and support delivery of the WBG’s strategic priorities while maintaining IFC’s AAA/Aaa credit rating.
Effective October 1, 2025, IFC’s Controllership function has been integrated into the WBG Controllership Vice Presidency, with Zinga Venner appointed as Vice President and WBG Controller. Separately, Anshula Kant, Managing Director and WBG Chief Financial Officer, responsible for financial management, reporting, and risk management across the WBG, will be retiring at the end of November 2026.
Effective January 1, 2026, IFC’s Treasury function has been integrated into the WBG Treasury Vice Presidency, with Jorge Familiar Calderon appointed as Vice President and WBG Treasurer, to improve internal efficiencies. Notably, IFC’s market-facing activities–including market funding and investment approaches–continue to operate separately from other WBG entities. In conjunction with this integration, effective the same date, John Gandolfo was appointed as IFC Vice President and Chief Financial Officer, overseeing global investor relationships, debt & equity mobilization solutions, blended finance, IFC-specific treasury solutions, and financial strategy, planning and reporting.
Effective January 1, 2026, the following additional organizational changes took effect:
•The Global Products & Clients Vice Presidency was created to replace the Industries Vice Presidency, to focus on client relationship management, centrally managed products (including private equity, venture capital, and trade finance), and new product development across regions and sectors.
•The Strategy & Operations Support Vice Presidency links IFC's strategy and resources with operational delivery, including Development Impact Measurement and Operations Management functions.
•The Risk Management Vice Presidency will maintain its core risk management responsibilities of providing independent risk oversight and management across IFC’s operations.
•The Economics and Private Sector Development Vice Presidency has completed its sunset with the Economics & Market Research and Gender & Economic Inclusion departments integrated into the WBG Knowledge Bank.
In parallel with these changes, and as part of the WBG’s broader transformation, the Knowledge Bank has been established to unify expertise of each WBG institution in a single structure and strengthen the value proposition for both sovereign and private sector clients. To lead this effort, Paschal Donohoe was appointed as Managing Director and WBG Chief Knowledge Officer effective November 24, 2025.
| | | | | | | | |
| INTERNATIONAL FINANCE CORPORATION | Page 51 |
| | |
| Management's Discussion and Analysis | |
The FY26 consolidated financial statements reflect the organization structure at June 30, 2026.
Figure 28: Governance Structure
BUSINESS CONDUCT
The WBG promotes a positive work environment in which staff members understand their ethical obligations to the institutions. In support of this commitment, the institutions have in place a Code of Conduct. The WBG has both an Ethics Help Line and a Fraud and Corruption hotline. A third-party service offers many methods of worldwide communication. Reporting channels include telephone, mail, email, or confidential submission through a website.
IFC has procedures in place for receiving, retaining, and handling recommendations and concerns relating to business conduct identified during the accounting, internal control and auditing processes.
WBG staff rules clarify and codify the staff’s obligations in reporting suspected fraud, corruption, or other misconduct that may threaten the operations or governance of the WBG. These rules also offer protection from retaliation.
GENERAL GOVERNANCE
IFC’s decision-making structure consists of the Board of Governors, the Board of Directors, the President, the Managing Director, Management and staff. The Board of Governors is the highest decision-making authority. Governors are appointed by their member governments for a five-year term, which is renewable. The Board of Governors may delegate authority to the Board of Directors to exercise any of its powers, except those reserved to the Board of Governors under IFC's Articles of Agreement.
BOARD OF DIRECTORS
In accordance with IFC's Articles of Agreement, Directors are appointed or elected every two years by their member governments. The Board currently has 25 Directors who represent all member countries. Directors are neither officers nor staff of IFC. The President is the only member of the Board from management, and he serves as a non-voting member and as Chairman of the Board.
The Board is required to consider proposals made by the President on the use of IFC’s net income and other policies that affect its general operations. The Board is also responsible for presenting to the Board of Governors, at the Annual Meetings, audited accounts, an administrative budget, and an annual report on operations and policies and other matters.
The Board and its committees are in continuous sessions based in Washington DC, as business requires. Each committee’s terms of reference establish its respective roles and responsibilities. As committees do not vote on issues, their role is primarily to serve the Board in discharging its responsibilities.
The committees are made up of eight members and function under their respective stipulated terms of reference. These committees are as follows:
▪Audit Committee – assists the Board in overseeing IFC’s finances, accounting, risk management and internal controls (see further explanation below).
| | | | | | | | |
| INTERNATIONAL FINANCE CORPORATION | Page 52 |
| | |
| Management's Discussion and Analysis | |
▪Budget Committee – assists the Board in approving IFC’s budget and in overseeing the preparation and execution of IFC’s business plans. The committee provides guidance to management on strategic directions.
▪Committee on Development Effectiveness – supports the Board in assessing IFC’s development effectiveness, providing guidance on strategic directions, and monitoring the quality and results of operations.
▪Committee on Governance and Executive Directors’ Administrative Matters – assists the Board on issues related to the governance, the Board’s own effectiveness, and the administrative policy applicable to Directors’ offices.
▪Human Resources Committee – strengthens the efficiency and effectiveness of the Board in discharging its oversight responsibility on IFC’s human resources strategy, policies and practices, and their alignment with the business needs of the organization.
AUDIT COMMITTEE
Membership
The Audit Committee consists of eight Directors. Membership in the Committee is determined by the Board, based on nominations by the Chairman of the Board, following informal consultation with Directors.
Key Responsibilities
The Audit Committee is appointed by the Board for the primary purpose of assisting the Board in overseeing IFC’s finances, accounting, risk management, internal controls and institutional integrity. Specific responsibilities include:
▪Oversight of the integrity of IFC’s financial statements.
▪Appointment, qualifications, independence and performance of the external auditor.
▪Oversight of the performance of the Group Internal Audit function
▪Adequacy and effectiveness of financial and accounting policies and internal controls and the mechanisms to deter, prevent and penalize fraud and corruption in IFC operations and corporate procurement.
▪Effective management of financial, fiduciary, and compliance risks in IFC.
▪Oversight of the institutional arrangements and processes for risk management across IFC.
In carrying out its role, the Audit Committee discusses financial issues and policies that affect IFC’s financial position and capital adequacy with Management, external auditors, and internal auditors. It recommends the annual audited financial statements for approval to the Board. The Audit Committee monitors and reviews developments in corporate governance and its own role on an ongoing basis.
Executive Sessions
Under the Audit Committee’s terms of reference, it may convene in executive session at any time, without Management’s presence. The Audit Committee meets separately in executive session with the external and internal auditors.
Access to Resources and to Management
Throughout the year, the Audit Committee receives a large volume of information to enable it to carry out its duties, and meets both formally and informally throughout the year to discuss relevant matters. It has complete access to Management, and reviews and discusses with Management topics considered in its terms of reference.
The Audit Committee has the authority to seek advice and assistance from outside legal, accounting, or other advisors as it deems necessary.
AUDITOR INDEPENDENCE
The appointment of the external auditor for IFC is governed by a set of Board-approved principles. These include:
▪Limits on the external auditor's provision of non-audit-related services
▪Requiring all audit-related services to be pre-approved on a case-by-case basis by the Board, upon recommendation of the Audit Committee, and
▪Renewal of the external audit contract every five years, with a limit of two consecutive terms and mandatory rotation thereafter.
The external auditor may provide non-prohibited, non-audit related services subject to monetary limits. Broadly, the list of prohibited non-audit services include those that would put the external auditor in the roles typically performed by management and in a position of auditing their own work, such as accounting services, internal audit services, and provision of investment advice. The total non-audit services fees over the term of the relevant external audit contract shall not exceed 70% of the audit fees over the same period.
| | | | | | | | |
| INTERNATIONAL FINANCE CORPORATION | Page 53 |
| | |
| Management's Discussion and Analysis | |
Communication between the external auditor and the Audit Committee is ongoing and carried out as often as deemed necessary by either party. The Audit Committee meets periodically with the external auditor and individual committee members have independent access to the external auditor. IFC’s external auditors also follow the communication requirements with the Audit Committees as set out under generally accepted auditing standards in the United States.
EXTERNAL AUDITORS
The external auditor is appointed to a five-year term, with a limit of two consecutive terms, and is subject to annual reappointment based on the recommendation of the Audit Committee and approval of a resolution by the Board.
In May 2022, IFC’s Board approved Deloitte & Touche, LLP as IFC’s external auditor for a second five-year term commencing in FY24.
INTERNAL CONTROL
Internal Control Over Financial Reporting
Each fiscal year, Management evaluates the internal controls over financial reporting to determine whether any changes made in these controls during the fiscal year materially affect, or would be reasonably likely to materially affect IFC’s internal control over financial reporting. The internal control framework promulgated by the Committee of Sponsoring Organizations of the Treadway Commission (COSO), “Internal Control – Integrated Framework (2013)” provides guidance for designing, implementing and conducting internal control and assessing its effectiveness. IFC uses the 2013 COSO framework to assess the effectiveness of the internal control over financial reporting. As of June 30, 2026, management maintained effective internal control over financial reporting. See “Management’s report regarding effectiveness of Internal Control over Financial Reporting” for additional information.
IFC’s internal control over financial reporting as of June 30, 2026, has been audited by Deloitte & Touche LLP, an independent auditor, as stated in their report, which is included herein.
Disclosure Controls and Procedures
Disclosure controls and procedures are designed to ensure that information required to be disclosed is gathered and communicated to Management, as appropriate, to allow timely decisions regarding required disclosure by IFC. Management conducted an evaluation of the effectiveness of such controls and procedures and the President, the Managing Director and Executive Vice President, the Managing Director and World Bank Group Chief Financial Officer (MDCFO), the Vice President and Chief Financial Officer, and the Vice President and World Bank Group Controller have concluded that these controls and procedures were effective as of June 30, 2026.
| | | | | | | | |
| INTERNATIONAL FINANCE CORPORATION | Page 54 |
| | |
| Management's Discussion and Analysis | |
SECTION X: APPENDIX
GLOSSARY OF TERMS
Allocable income: IFC uses allocable income (a non-GAAP measure) as the basis for making net income allocations. IFC defines allocable income as net income after certain adjustments. These adjustments primarily relate to unrealized gains and losses on IFC's loans, debt securities, equity investments and borrowings, as well as income from the Post-retirement Contribution Reserve Fund and expenses funded by prior years’ allocations.
Board: The Board of Directors as established by IFC’s Articles of Agreement.
Capital Adequacy: A measure of IFC’s ability to withstand unexpected shocks as IFC is required to maintain a minimum level of capital available–calculated as Balance Sheet Capital less Designated Retained Earnings, minus Pension surplus of each pension plan, and minus PCRF assets–equal to total potential losses for all on- and off-balance-sheet exposures estimated at levels consistent with maintaining IFC's AAA/Aaa rating.
Capital Available: Under IFC’s economic capital framework, resources available to absorb potential losses, calculated as: Sum of IFC’s Paid in Capital, General Reserve, Unallocated Net Income and AOCI, minus Pension Surplus of each pension plan and PCRF assets.
Capital Required: Aggregate minimum Economic Capital required to maintain IFC’s AAA/Aaa rating.
Capital Utilization Ratio (CUR): A ratio to measure IFC's capital adequacy expressed as Capital Required divided by Capital Available.
Credit spread: A credit spread is the difference in yield between two bonds of similar maturity but different credit quality.
Economic Capital (EC): Minimum USD amount of capital required to meet expected and unexpected losses. For Financial Product(s), calculated as Exposure at Risk multiplied by Economic Capital Ratio for relevant product/sub-product.
IDA18: IDA's Eighteenth Replenishment of Resources.
IDA21: IDA’s Twenty First Replenishment of Resources.
IDA-eligible countries: Countries eligible to borrow from IDA on concessional terms.
IFC's Equity Mobilization Department: IFC’s Equity Mobilization Department (AMC), a division of IFC effective January 31, 2020, invests third-party capital and IFC capital, enabling outside investors to invest alongside IFC in developing markets. Investors in funds managed by AMC have included sovereign wealth funds, national pension funds, multilateral and bilateral development institutions, national development agencies and international financial institutions. These funds collectively are referred to as the AMC Funds.
Private Capital Mobilization (PCM): Amount of private financial resources contributed alongside IFC commitments, whether financing, guarantees or technical assistance, measured as the sum of private direct and private indirect mobilization. Private Direct Mobilization (PDM) is financing from a private entity on commercial terms due to IFC’s active and direct involvement. Private Indirect Mobilization (PIM) is financing from private entities provided in connection with a specific activity for which IFC is providing financing but doesn’t play a direct role that leads to the commitment of the private entity’s finance. PCM is included in the WBG's scorecard.
Upstream: Upstream activities aim to unlock and/or create new, additional investment opportunities for which IFC is likely to be a financial partner. Upstream activities comprise IFC engagements which aim to (i) Support the creation and realization of specific projects, for which IFC is a likely finance partner (Transaction Upstream); and/or have a wider market or sectoral impact to facilitate private sector investment, for which in turn IFC could be a potential financing partner (Creating Markets Upstream).
U.S. GAAP: Accounting principles generally accepted in the United States of America.
World Bank: The World Bank consists of IBRD and IDA.
World Bank Group (WBG): The World Bank Group consists of IBRD, IDA, IFC, MIGA, and ICSID.
| | | | | | | | |
| INTERNATIONAL FINANCE CORPORATION | Page 55 |
| | |
| Management's Discussion and Analysis | |
ABBREVIATIONS AND ACRONYMS | | | | | | | | | | | | | | | | | | | | |
ABS | : | Asset-Backed Securities | | MD&A | : | Management’s Discussion and Analysis |
AIMM | : | Anticipated Impact Measurement and Monitoring | | MDCAO | : | Managing Director and Chief Administrative Officer |
ALCO | : | Asset and Liability Management Committee | | MDCFO | : | Managing Director and WBG Chief Financial Officer |
ALM | : | Asset Liability Management | | MIGA | : | Multilateral Investment Guarantee Agency |
AMC | : | Asset Management Company | | ML/TF | : | Money Laundering And Terrorist Financing |
AML/CFT | : | Anti-Money Laundering/ Combating the Financing of Terrorism | | MSME | : | Micro, Small, and Medium Enterprise |
AOCI | : | Accumulated Other Comprehensive Income | | MT | : | IFC’s Management Team |
BFC | : | Blended Finance and Donor Funds Committee | | NAV | : | Net Asset Value |
CECL | : | Current Expected Credit Losses | | NPLs | : | Non-performing Loans |
CMAW | : | Creating Markets Advisory Window | | OCI | : | Other Comprehensive Income |
COSO | : | Committee of Sponsoring Organizations of the Treadway Commission | | ORM | : | IFC’s Operational Risk Management |
CR | : | Credit Rating | | PBO | : | Projected Benefit Obligations |
CRC | : | Corporate Risk Committee | | PCM | : | Private Capital Mobilization |
CRO | : | Chief Risk Officer | | PCRF | : | Post-retirement Contribution Reserve Fund |
CUR | : | Capital Utilization Ratio | | PDM | : | Private Direct Mobilization |
E&S | : | Environmental and Social | | PEBP | : | Post-Employment Benefit Plan |
EMSP | : | Emerging Markets Securitization Program | | PFC | : | Pension Finance Committee |
ERC | : | Enterprise Risk Committee | | PIM | : | Private Indirect Mobilization |
FCS | : | Fragile and Conflict-Affected Situations | | PPPs | : | Public-Private Partnerships |
FMTAAS | : | Funding Mechanism for Technical Assistance and Advisory Services | | PSW | : | Private Sector Window |
FOF | : | Frontier Opportunities Fund | | RA | : | Risk Appetite |
FRC | : | Finance and Risk Committee | | RCSA | : | Risk and Control Self-Assessments |
FX | : | Foreign Exchange | | REIT | : | Real estate investment trusts |
GCI | : | General Capital Increase | | RIs | : | Risk Indicators |
GP | : | General Partner | | RSBP | : | Retired Staff Benefits Plan |
IBRD | : | International Bank for Reconstruction and Development | | SAA | : | Strategic Asset Allocation |
ICSID | : | International Centre for Settlement of Investment Disputes | | SCI | : | Selective Capital Increase |
IDA | : | International Development Association | | SMEs | : | Small and Medium Enterprises |
IDA-PSW | : | IDA Private Sector Window | | SPV | : | Special Purpose Vehicles |
IFC or the Corporation | : | International Finance Corporation | | SRP | : | Staff Retirement Plan |
ISDA | : | International Swaps and Derivatives Association | | TDD | : | Tax Due Diligence |
MBS | : | Mortgage-Backed Securities | | UJV | : | Unincorporated Joint Ventures |
MCPP | : | Managed Co-Lending Portfolio Program | | VIEs | : | Variable Interest Entities |
| | | | | | | | |
| INTERNATIONAL FINANCE CORPORATION | 56 |
CONSOLIDATED FINANCIAL STATEMENTS
June 30, 2026
| | | | | |
Contents | Page |
| |
Management’s Report regarding Effectiveness of Internal Control over Financial Reporting | |
Independent Auditor’s Report on the Effectiveness of Internal Control over Financial Reporting | |
Independent Auditor’s Report | |
Consolidated Balance Sheets | |
Consolidated Statements of Operations | |
Consolidated Statements of Comprehensive Income | |
Consolidated Statements of Changes in Capital | |
Consolidated Statements of Cash Flows | |
Supplementary Information | |
Consolidated Statement of Capital Stock and Voting Power | |
Notes to Consolidated Financial Statements | |
Management's Report Regarding Effectiveness of
Internal Control over Financial Reporting
August 6, 2026
The management of the International Finance Corporation (IFC) is responsible for the preparation, integrity, and fair presentation of its published consolidated financial statements. The consolidated financial statements have been prepared in accordance with accounting principles generally accepted in the United States of America (US GAAP) and include amounts based on informed judgments and estimates made by management.
The consolidated financial statements have been audited by an independent audit firm, which was given unrestricted access to all financial records and related data, including minutes of all meetings of the Board of Directors and their Committees. Management believes that all representations made to the independent auditors during their audit of IFC's consolidated financial statements and audit of its internal control over financial reporting were valid and appropriate. The independent auditors’ reports accompany the audited consolidated financial statements.
Management is responsible for establishing and maintaining effective internal control over financial reporting for financial statement presentations in conformity with US GAAP. Management maintains a comprehensive system of controls intended to ensure that transactions are executed in accordance with management's authorization, assets are safeguarded, and financial records are reliable. The system of internal control contains monitoring mechanisms, and actions are taken to correct deficiencies identified. Management believes that internal control over financial reporting supports the integrity and reliability of the external consolidated financial statements.
There are inherent limitations in the effectiveness of any internal control, including the possibility of human error and the circumvention or overriding of controls. Accordingly, even effective internal controls can provide only reasonable assurance with respect to financial statement preparation. Further, because of changes in conditions, the effectiveness of internal controls may vary over time.
IFC assessed its internal control over financial reporting for financial statement presentation in conformity with US GAAP as of June 30, 2026. This assessment was based on the criteria for effective internal control over financial reporting described in the Internal Control - Integrated Framework (2013) issued by the Committee of Sponsoring Organizations of the Treadway Commission. Based upon this assessment, management believes that IFC maintained effective internal control over financial reporting presented in conformity with US GAAP as of June 30, 2026. The independent audit firm that audited the consolidated financial statements has issued an Independent Auditor’s Report which expresses an opinion on IFC’s internal control over financial reporting.
The Board of Directors has appointed an Audit Committee responsible for monitoring the accounting practices and internal controls of IFC. The Audit Committee is comprised entirely of Directors who are independent of IFC's management. The Audit Committee is responsible for recommending to the Board of Directors the selection of independent auditors. It meets periodically with management, the independent auditors, and the internal auditors to ensure that they are carrying out their responsibilities. The Audit Committee is responsible for performing an oversight role by reviewing and monitoring the financial, accounting and auditing procedures of IFC in addition to reviewing IFC's financial reports. The independent auditors and the internal auditors have full and free access to the Audit Committee, with or without the presence of management, to discuss the adequacy of internal control over financial reporting and any other matters which they believe should be brought to the attention of the Audit Committee.
INDEPENDENT AUDITOR’S REPORT
President and Board of Directors
International Finance Corporation
Opinion on Internal Control over Financial Reporting
We have audited the internal control over financial reporting of International Finance Corporation and its consolidated entities ("IFC") as of June 30, 2026, based on the criteria established in the Internal Control - Integrated Framework (2013) issued by the Committee of Sponsoring Organizations of the Treadway Commission (COSO). In our opinion, IFC maintained, in all material respects, effective internal control over financial reporting as of June 30, 2026, based on criteria established in Internal Control - Integrated Framework (2013) issued by COSO.
We also have audited, in accordance with auditing standards generally accepted in the United States of America (GAAS), the consolidated financial statements as of and for the year ended June 30, 2026 of IFC, and our report dated August 6, 2026, expressed an unmodified opinion on those financial statements.
Basis for Opinion
We conducted our audit in accordance with GAAS. Our responsibilities under those standards are further described in the Auditor’s Responsibilities for the Audit of Internal Control over Financial Reporting section of our report. We are required to be independent of IFC and to meet our other ethical responsibilities, in accordance with the relevant ethical requirements relating to our audit. We believe that the audit evidence we have obtained is sufficient and appropriate to provide a basis for our audit opinion.
Responsibilities of Management for Internal Control over Financial Reporting
Management is responsible for designing, implementing, and maintaining effective internal control over financial reporting, and for its assessment about the effectiveness of internal control over financial reporting, included in the accompanying Management's Report Regarding Effectiveness of Internal Control over Financial Reporting.
Auditor’s Responsibilities for the Audit of Internal Control over Financial Reporting
Our objectives are to obtain reasonable assurance about whether effective internal control over financial reporting was maintained in all material respects and to issue an auditor’s report that includes our opinion on internal control over financial reporting. Reasonable assurance is a high level of assurance but is not absolute assurance and therefore is not a guarantee that an audit of internal control over financial reporting conducted in accordance with GAAS will always detect a material weakness when it exists.
In performing an audit of internal control over financial reporting in accordance with GAAS, we:
•Exercise professional judgment and maintain professional skepticism throughout the audit.
•Obtain an understanding of internal control over financial reporting, assess the risks that a material weakness exists, and test and evaluate the design and operating effectiveness of internal control over financial reporting based on the assessed risk.
Definition and Inherent Limitations of Internal Control over Financial Reporting
An entity's internal control over financial reporting is a process effected by those charged with governance, management, and other personnel, designed to provide reasonable assurance regarding the preparation of reliable financial statements in accordance with accounting principles generally accepted in the United States of America. An entity's internal control over financial reporting includes those policies and procedures that (1) pertain to the maintenance of records that, in reasonable detail, accurately and fairly reflect the transactions and dispositions of the assets of the entity; (2) provide reasonable assurance that transactions are recorded as necessary to permit preparation of financial statements in accordance with accounting principles generally accepted in the United States of America, and that receipts and expenditures of the entity are being made only in accordance with authorizations of management and those charged with governance; and (3) provide reasonable assurance regarding prevention, or timely detection and correction of unauthorized acquisition, use, or disposition of the entity's assets that could have a material effect on the financial statements.
Because of its inherent limitations, internal control over financial reporting may not prevent, or detect and correct, misstatements. Also, projections of any assessment of effectiveness to future periods are subject to the risk that controls may become inadequate because of changes in conditions, or that the degree of compliance with the policies or procedures may deteriorate.
August 6, 2026
INDEPENDENT AUDITOR’S REPORT
President and Board of Directors
International Finance Corporation
Opinion
We have audited the consolidated financial statements of International Finance Corporation and its consolidated entities ("IFC"), which comprise the consolidated balance sheets as of June 30, 2026 and 2025, and the related consolidated statements of operations, comprehensive income, changes in capital and cash flows for each of the three years in the period ended June 30, 2026, and the related notes to the consolidated financial statements (collectively referred to as the "financial statements").
In our opinion, the accompanying financial statements present fairly, in all material respects, the financial position of IFC as of June 30, 2026 and 2025, and the results of its operations and its cash flows for each of the three years in the period ended June 30, 2026, in accordance with accounting principles generally accepted in the United States of America.
We have also audited, in accordance with auditing standards generally accepted in the United States of America (GAAS), IFC's internal control over financial reporting as of June 30, 2026, based on criteria established in Internal Control — Integrated Framework (2013) issued by the Committee of Sponsoring Organizations of the Treadway Commission and our report dated August 6, 2026, expressed an unmodified opinion on IFC’s internal control over financial reporting.
Basis for Opinion
We conducted our audits in accordance with GAAS. Our responsibilities under those standards are further described in the Auditor’s Responsibilities for the Audit of the Financial Statements section of our report. We are required to be independent of IFC and to meet our other ethical responsibilities, in accordance with the relevant ethical requirements relating to our audits. We believe that the audit evidence we have obtained is sufficient and appropriate to provide a basis for our audit opinion.
Responsibilities of Management for the Financial Statements
Management is responsible for the preparation and fair presentation of the financial statements in accordance with accounting principles generally accepted in the United States of America, and for the design, implementation, and maintenance of internal control relevant to the preparation and fair presentation of financial statements that are free from material misstatement, whether due to fraud or error.
In preparing the financial statements, management is required to evaluate whether there are conditions or events, considered in the aggregate, that raise substantial doubt about IFC’s ability to continue as a going concern for one year after the date that the financial statements are issued.
Auditor’s Responsibilities for the Audit of the Financial Statements
Our objectives are to obtain reasonable assurance about whether the financial statements as a whole are free from material misstatement, whether due to fraud or error, and to issue an auditor’s report that includes our opinion. Reasonable assurance is a high level of assurance but is not absolute assurance and therefore is not a guarantee that an audit conducted in accordance with GAAS will always detect a material misstatement when it exists. The risk of not detecting a material misstatement resulting from fraud is higher than for one resulting from error, as fraud may involve collusion, forgery, intentional omissions, misrepresentations, or the override of internal control. Misstatements are considered material if there is a substantial likelihood that, individually or in the aggregate, they would influence the judgment made by a reasonable user based on the financial statements.
In performing an audit in accordance with GAAS, we:
•Exercise professional judgment and maintain professional skepticism throughout the audit.
•Identify and assess the risks of material misstatement of the financial statements, whether due to fraud or error, and design and perform audit procedures responsive to those risks. Such procedures include examining, on a test basis, evidence regarding the amounts and disclosures in the financial statements.
•Obtain an understanding of internal control relevant to the audit in order to design audit procedures that are appropriate in the circumstances.
•Evaluate the appropriateness of accounting policies used and the reasonableness of significant accounting estimates made by management, as well as evaluate the overall presentation of the financial statements.
•Conclude whether, in our judgment, there are conditions or events, considered in the aggregate, that raise substantial doubt about IFC’s ability to continue as a going concern for a reasonable period of time.
We are required to communicate with those charged with governance regarding, among other matters, the planned scope and timing of the audit, significant audit findings, and certain internal control-related matters that we identified during the audit.
Report on Supplementary Information
Our audits were conducted for the purpose of forming an opinion on the financial statements as a whole. The supplementary information listed in the table of contents is presented for the purpose of additional analysis and is not a required part of the financial statements. This supplementary information is the responsibility of IFC’s management and was derived from and relates directly to the underlying accounting and other records used to prepare the financial statements. Such information has been subjected to the auditing procedures applied in our audits of the financial statements and certain additional procedures, including comparing and reconciling such information directly to the underlying accounting and other records used to prepare the financial statements or to the financial statements themselves, and other additional procedures in accordance with GAAS. In our opinion, such information is fairly stated in all material respects in relation to the financial statements as a whole.
Other Information Included in Management’s Discussion and Analysis and Financial Statements
Management is responsible for the other information included in Management’s Discussion and Analysis and Financial Statements. The other information comprises the information included in Management’s Discussion and Analysis and Financial Statements but does not include the financial statements and our auditor’s report thereon. Our opinion on the financial statements does not cover the other information, and we do not express an opinion or any form of assurance thereon.
In connection with our audits of the financial statements, our responsibility is to read the other information and consider whether a material inconsistency exists between the other information and the financial statements, or the other information otherwise appears to be materially misstated. If, based on the work performed, we conclude that an uncorrected material misstatement of the other information exists, we are required to describe it in our report.
August 6, 2026
| | | | | | | | |
| INTERNATIONAL FINANCE CORPORATION | Page 62 |
CONSOLIDATED BALANCE SHEETS
as of June 30, 2026 and June 30, 2025
| | | | | | | | | | | |
|
(US$ in millions) | June 30, 2026 | | June 30, 2025 |
Assets | | | |
Cash and due from banks – Note C | $ | 443 | | | $ | 1,232 | |
| | | |
| | | |
Investments - Trading – Notes C and L | 47,674 | | | 47,974 | |
(includes $6,015 and $6,676 securities pledged to creditors under repurchase and collateral agreements as of June 30, 2026 and June 30, 2025, respectively) | | | |
Securities purchased under resale agreements and receivable for cash collateral pledged – Notes C, L and P | 1,203 | | | 2,213 | |
Investments – Notes B, D, E, F, G, L and N | | | |
Loans – Notes D, E, L and N | 48,234 | | | 42,229 | |
(includes $2,061 and $1,947 loans held at fair value as of June 30, 2026 and June 30, 2025, respectively; net of reserve against losses of $1,448 and $1,273 at June 30, 2026 and June 30, 2025, respectively) | | | |
| | | |
| | | |
Equity investments – Notes B, D, G, L and N | 13,485 | | | 11,777 | |
| | | |
Debt securities – Notes D, F, L and N | 14,096 | | | 13,514 | |
(includes available-for-sale securities of $320 and $560, with associated amortized cost of $347 and $609, and reserve against credit losses of $7 and $16 as of June 30, 2026 and June 30, 2025, respectively) | | | |
Total investments | 75,815 | | | 67,520 | |
Derivative assets – Notes B, C, J, L and P | 3,006 | | | 3,005 | |
Receivables and other assets – Notes B, C, M, N and Q | 9,377 | | | 7,796 | |
Total assets | $ | 137,518 | | | $ | 129,740 | |
Liabilities and capital | | | |
Liabilities | | | |
Securities sold under repurchase agreements and payable for cash collateral received – Notes C and P | $ | 5,100 | | | $ | 4,893 | |
Borrowings – Notes B, K and L | | | |
Borrowings, at amortized cost | 2,917 | | | 2,657 | |
Borrowings, at fair value | 73,466 | | | 68,793 | |
| | | |
| | | |
Total borrowings | 76,383 | | | 71,450 | |
Derivative liabilities – Notes B, C, J, L and P | 5,815 | | | 6,620 | |
Payables and other liabilities – Notes B, C, E, M, N, O and R | 6,912 | | | 5,849 | |
Total liabilities | 94,210 | | | 88,812 | |
Capital | | | |
Authorized capital, shares of $1,000 par value each | | | |
(25,079,991 shares as of June 30, 2026 and June 30, 2025) | | | |
Subscribed capital | 24,296 | | | 24,511 | |
Less: unpaid portion of subscriptions | — | | | (502) | |
Paid-in capital | 24,296 | | | 24,009 | |
Accumulated other comprehensive income – Note H | 1,672 | | | 1,617 | |
Retained earnings – Note H | 17,340 | | | 15,302 | |
Total capital | 43,308 | | | 40,928 | |
| | | |
| | | |
Total liabilities and capital | $ | 137,518 | | | $ | 129,740 | |
The notes to Consolidated Financial Statements are an integral part of these statements.
| | | | | | | | |
| INTERNATIONAL FINANCE CORPORATION | Page 63 |
CONSOLIDATED STATEMENTS OF OPERATIONS
for the three years ended June 30, 2026, June 30, 2025 and June 30, 2024
| | | | | | | | | | | | | | | | | | | | | |
|
| | | | | |
(US$ in millions) | | | | | 2026 | | 2025 | | 2024 |
Income from investments | | | | | | | | | |
Income from loans and guarantees, including realized gains and losses on loans and associated derivatives – Note E | | | | | $ | 3,269 | | | $ | 3,373 | | | $ | 3,204 | |
Provision for losses on loans, off-balance-sheet credit exposures and other receivables – Note E | | | | | (308) | | | (56) | | | (9) | |
Income from equity investments, including realized and unrealized gains and losses on equity and associated derivatives – Note G | | | | | 1,156 | | | 517 | | | 142 | |
Income from debt securities, including realized gains and losses on debt securities and associated derivatives – Note F | | | | | 819 | | | 819 | | | 811 | |
Release of provision (provision) for losses on available-for-sale debt securities – Note F | | | | | 10 | | | 6 | | | (12) | |
Total income from investments | | | | | 4,946 | | | 4,659 | | | 4,136 | |
Income from liquid asset trading activities – Note C | | | | | 1,965 | | | 2,298 | | | 2,391 | |
Charges on borrowings | | | | | (3,579) | | | (3,596) | | | (3,815) | |
Income from investments and liquid asset trading activities, after charges on borrowings | | | | | 3,332 | | | 3,361 | | | 2,712 | |
Other income | | | | | | | | | |
Upstream and Advisory services income – Note M | | | | | 251 | | | 259 | | | 268 | |
Service fees | | | | | 143 | | | 150 | | | 131 | |
Other – Note T | | | | | 222 | | | 193 | | | 188 | |
Total other income | | | | | 616 | | | 602 | | | 587 | |
Other expenses | | | | | | | | | |
Administrative expenses – Notes B and O | | | | | (1,691) | | | (1,679) | | | (1,516) | |
Upstream and Advisory services expenses – Note M | | | | | (378) | | | (373) | | | (339) | |
| | | | | | | | | |
| | | | | | | | | |
Other, net – Note O | | | | | 49 | | | 24 | | | 28 | |
Total administrative and other expenses | | | | | (2,020) | | | (2,028) | | | (1,827) | |
Foreign currency transaction losses on non-trading activities | | | | | (60) | | | (43) | | | (115) | |
Income before net unrealized gains and losses on loans, debt securities, borrowings and related derivatives | | | | | 1,868 | | | 1,892 | | | 1,357 | |
Net unrealized gains on loans, debt securities, borrowings and related derivatives – Note I | | | | | 170 | | | 115 | | | 128 | |
| | | | | | | | | |
| | | | | | | | | |
Net income – Note M | | | | | $ | 2,038 | | | $ | 2,007 | | | $ | 1,485 | |
| | | | | | | | | |
| | | | | | | | | |
The notes to Consolidated Financial Statements are an integral part of these statements.
| | | | | | | | |
| INTERNATIONAL FINANCE CORPORATION | Page 64 |
CONSOLIDATED STATEMENTS OF COMPREHENSIVE INCOME
for the three years ended June 30, 2026, June 30, 2025 and June 30, 2024
| | | | | | | | | | | | | | | | | | | | | |
| | | | | | | | | |
| | | | | |
(US$ in millions) | | | | | 2026 | | 2025 | | 2024 |
Net income – Note M | | | | | $ | 2,038 | | | $ | 2,007 | | | $ | 1,485 | |
Other comprehensive income (loss) | | | | | | | | | |
| | | | | | | | | |
| | | | | | | | | |
| | | | | | | | | |
| | | | | | | | | |
Net unrealized gains on debt securities arising during the period - Note H | | | | | 22 | | | 68 | | | 121 | |
| | | | | | | | | |
| | | | | | | | | |
| | | | | | | | | |
| | | | | | | | | |
| | | | | | | | | |
| | | | | | | | | |
| | | | | | | | | |
| | | | | | | | | |
Net unrealized (losses) gains on borrowings arising during the period - Note H | | | | | (372) | | | (268) | | | 74 | |
Net unrecognized actuarial gains and unrecognized prior service credits on benefit plans – Note H and O | | | | | 405 | | | 860 | | | 130 | |
Total other comprehensive income | | | | | 55 | | | 660 | | | 325 | |
Total comprehensive income | | | | | $ | 2,093 | | | $ | 2,667 | | | $ | 1,810 | |
The notes to Consolidated Financial Statements are an integral part of these statements.
| | | | | | | | |
| INTERNATIONAL FINANCE CORPORATION | Page 65 |
CONSOLIDATED STATEMENTS OF
CHANGES IN CAPITAL
for the three years ended June 30, 2026, June 30, 2025 and June 30, 2024
| | | | | | | | | | | | | | | | | | | | | | | |
| | | | | | | |
(US$ in millions) | Retained earnings - Note H | | Accumulated other comprehensive income - Note H | | Paid-in capital | | Total capital |
As of June 30, 2023 | $ | 11,810 | | | $ | 632 | | | $ | 22,596 | | | $ | 35,038 | |
Year ended June 30, 2024 | | | | | | | |
Net income | 1,485 | | | — | | | — | | | 1,485 | |
Other comprehensive income | — | | | 325 | | | — | | | 325 | |
Payments received for subscribed capital | — | | | — | | | 624 | | | 624 | |
As of June 30, 2024 | $ | 13,295 | | | $ | 957 | | | $ | 23,220 | | | $ | 37,472 | |
Year ended June 30, 2025 | | | | | | | |
Net income | 2,007 | | | — | | | — | | | 2,007 | |
Other comprehensive income | — | | | 660 | | | — | | | 660 | |
Payments received for subscribed capital | — | | | — | | | 789 | | | 789 | |
As of June 30, 2025 | $ | 15,302 | | | $ | 1,617 | | | $ | 24,009 | | | $ | 40,928 | |
Year ended June 30, 2026 | | | | | | | |
Net income | 2,038 | | | — | | | — | | | 2,038 | |
Other comprehensive income | — | | | 55 | | | — | | | 55 | |
Payments received for subscribed capital | — | | | — | | | 287 | | | 287 | |
As of June 30, 2026 | $ | 17,340 | | | $ | 1,672 | | | $ | 24,296 | | | $ | 43,308 | |
The notes to Consolidated Financial Statements are an integral part of these statements.
| | | | | | | | |
| INTERNATIONAL FINANCE CORPORATION | Page 66 |
CONSOLIDATED STATEMENTS OF CASH FLOWS
for the three years ended June 30, 2026, June 30, 2025 and June 30, 2024
| | | | | | | | | | | | | | | | | |
|
| For the year ended June 30, |
(US$ in millions) | 2026 | | 2025 | | 2024 |
Cash flows from investing activities | | | | | |
Loan disbursements | $ | (17,534) | | | $ | (17,063) | | | $ | (14,235) | |
Investments in equity securities and related derivatives | (2,535) | | | (1,712) | | | (1,535) | |
Investments in debt securities | (3,963) | | | (3,742) | | | (3,115) | |
Loan repayments | 11,159 | | | 11,892 | | | 8,860 | |
Debt securities repayments | 3,025 | | | 1,749 | | | 1,216 | |
Proceeds from sales of loans | 188 | | | 44 | | | 2 | |
Proceeds from sales of equity investments and redemptions | 1,908 | | | 1,419 | | | 1,394 | |
Proceeds from sales of debt securities | 158 | | | 19 | | | 36 | |
Loan origination fees received | 107 | | | 102 | | | 109 | |
Other investing activities, net | — | | | — | | | (9) | |
Investment in fixed assets, net | (128) | | | (101) | | | (91) | |
Net cash used in investing activities | (7,615) | | | (7,393) | | | (7,368) | |
Cash flows from financing activities | | | | | |
Medium and long-term borrowings | | | | | |
Issuance | 21,995 | | | 28,328 | | | 17,242 | |
Retirement | (18,428) | | | (15,440) | | | (14,142) | |
Change in derivatives associated with borrowings, net | 340 | | | (860) | | | (203) | |
Securitized borrowings, net | 686 | | | — | | | — | |
Short-term borrowings, net | 472 | | | 138 | | | (306) | |
Capital subscriptions | 287 | | | 789 | | | 624 | |
| | | | | |
Net cash provided by financing activities | 5,352 | | | 12,955 | | | 3,215 | |
Cash flows from operating activities | | | | | |
| | | | | |
| | | | | |
Net income | 2,038 | | | 2,007 | | | 1,485 | |
Adjustments to reconcile net income to net cash provided by (used in) operating activities: | | | | | |
Realized losses (gains) on loans and debt securities, net | 10 | | | 22 | | | (7) | |
| | | | | |
Gains on equity investments | (996) | | | (405) | | | (14) | |
| | | | | |
Provision | 298 | | | 50 | | | 21 | |
| | | | | |
| | | | | |
Depreciation expenses, amortization of net discounts, premiums and loan origination fees | 82 | | | 74 | | | 103 | |
Foreign currency transaction losses on non-trading activities | 60 | | | 43 | | | 115 | |
Net unrealized gains on loans, debt securities, borrowings and related derivatives | (170) | | | (115) | | | (128) | |
| | | | | |
Net discounts paid and realized gains on retirement of borrowings | (103) | | | (123) | | | (138) | |
Change in accrued income on loans and debt securities (after swaps), net | (2) | | | 37 | | | (210) | |
Change in accrued expenses on borrowings (after swaps), net | 22 | | | (21) | | | 73 | |
Change in liquid asset trading portfolio | 445 | | | (7,035) | | | 2,320 | |
Change in derivatives associated with loans and client risk management, net | (16) | | | 482 | | | 240 | |
Change in payables and other liabilities | 515 | | | 902 | | | 207 | |
Change in receivables and other assets | (711) | | | (1,053) | | | (176) | |
Net cash provided by (used in) operating activities | 1,472 | | | (5,135) | | | 3,891 | |
Change in cash and due from banks | (791) | | | 427 | | | (262) | |
Effect of exchange rate changes on cash and due from banks | 2 | | | 24 | | | (8) | |
Net change in cash and due from banks | (789) | | | 451 | | | (270) | |
Beginning cash and due from banks | 1,232 | | | 781 | | | 1,051 | |
Ending cash and due from banks | $ | 443 | | | $ | 1,232 | | | $ | 781 | |
| | | | | |
| | | | | |
| | | | | |
| | | | | |
| | | | | |
| | | | | |
| | | | | |
The notes to Consolidated Financial Statements are an integral part of these statements.
| | | | | | | | |
| INTERNATIONAL FINANCE CORPORATION | Page 67 |
CONSOLIDATED STATEMENTS OF CASH FLOWS
for the three years ended June 30, 2026, June 30, 2025 and June 30, 2024
| | | | | | | | | | | | | | | | | |
| | | | | |
| For the year ended June 30, |
(US$ in millions) | 2026 | | 2025 | | 2024 |
Supplemental disclosure | | | | | |
Change in ending balances resulting from currency exchange rate fluctuations: | | | | | |
Loans outstanding | $ | 187 | | | $ | 827 | | | $ | (356) | |
Debt securities | (225) | | | 183 | | | (175) | |
Loan and debt security-related currency swaps | (38) | | | (936) | | | 566 | |
Borrowings | (415) | | | (1,102) | | | 360 | |
Borrowing-related currency swaps | 428 | | | 1,094 | | | (333) | |
Charges on borrowings paid, net | $ | 3,660 | | | $ | 3,739 | | | $ | 3,875 | |
Non-cash items: | | | | | |
Loan and debt security conversion to equity, net | $ | 97 | | | $ | 36 | | | $ | 21 | |
| | | | | |
| | | | | |
The notes to Consolidated Financial Statements are an integral part of these statements.
| | | | | | | | |
| INTERNATIONAL FINANCE CORPORATION | Page 68 |
| | | | | | | | | | | | | | | | | | | | | | | | | | | | | | | | |
SUPPLEMENTARY INFORMATION: CONSOLIDATED STATEMENT OF CAPITAL STOCK AND VOTING POWER as of June 30, 2026 |
(US$ in thousands) | Capital Stock | Voting Power | | | Capital Stock | Voting Power |
Members | Amount
paid | Percent of total | Number of votes | Percent of total | | Members | Amount
paid | Percent of total | Number of votes | Percent of total |
Afghanistan | 1,727 | | 0.01 | | 9,403 | | 0.04 | | | Ecuador | 26,002 | | 0.11 | | 33,678 | | 0.13 | |
Albania | 14,248 | | 0.06 | | 21,924 | | 0.09 | | | Egypt, Arab Republic of | 130,957 | | 0.54 | | 138,633 | | 0.54 | |
Algeria | 71,468 | | 0.29 | | 79,144 | | 0.31 | | | El Salvador | 702 | | 0.00 | | 8,378 | | 0.03 | |
Angola | 19,194 | | 0.08 | | 26,870 | | 0.10 | | | Equatorial Guinea | 1,034 | | 0.00 | | 8,710 | | 0.03 | |
Antigua and Barbuda | 99 | | 0.00 | | 7,775 | | 0.03 | | | Eritrea | 7,129 | | 0.03 | | 14,805 | | 0.06 | |
Argentina | 415,040 | | 1.71 | | 422,716 | | 1.64 | | | Estonia | 14,036 | | 0.06 | | 21,712 | | 0.08 | |
Armenia | 11,796 | | 0.05 | | 19,472 | | 0.08 | | | Eswatini | 6,533 | | 0.03 | | 14,209 | | 0.06 | |
Australia | 463,234 | | 1.91 | | 470,910 | | 1.83 | | | Ethiopia | 2,036 | | 0.01 | | 9,712 | | 0.04 | |
Austria | 193,216 | | 0.80 | | 200,892 | | 0.78 | | | Fiji | 4,394 | | 0.02 | | 12,070 | | 0.05 | |
Azerbaijan | 23,830 | | 0.10 | | 31,506 | | 0.12 | | | Finland | 153,635 | | 0.63 | | 161,311 | | 0.63 | |
Bahamas, The | 4,997 | | 0.02 | | 12,673 | | 0.05 | | | France | 1,184,438 | | 4.88 | | 1,192,114 | | 4.63 | |
Bahrain | 13,313 | | 0.05 | | 20,989 | | 0.08 | | | Gabon | 12,411 | | 0.05 | | 20,087 | | 0.08 | |
Bangladesh | 94,274 | | 0.39 | | 101,950 | | 0.40 | | | Gambia, The | 717 | | 0.00 | | 8,393 | | 0.03 | |
Barbados | 4,734 | | 0.02 | | 12,410 | | 0.05 | | | Georgia | 16,390 | | 0.07 | | 24,066 | | 0.09 | |
Belarus | 42,439 | | 0.17 | | 50,115 | | 0.19 | | | Germany | 1,261,691 | | 5.19 | | 1,269,367 | | 4.93 | |
Belgium | 495,347 | | 2.04 | | 503,023 | | 1.96 | | | Ghana | 54,282 | | 0.22 | | 61,958 | | 0.24 | |
Belize | 1,730 | | 0.01 | | 9,406 | | 0.04 | | | Greece | 67,514 | | 0.28 | | 75,190 | | 0.29 | |
Benin | 2,128 | | 0.01 | | 9,804 | | 0.04 | | | Grenada | 1,576 | | 0.01 | | 9,252 | | 0.04 | |
Bhutan | 5,490 | | 0.02 | | 13,166 | | 0.05 | | | Guatemala | 8,265 | | 0.03 | | 15,941 | | 0.06 | |
Bolivia | 17,034 | | 0.07 | | 24,710 | | 0.10 | | | Guinea | 5,680 | | 0.02 | | 13,356 | | 0.05 | |
Bosnia and Herzegovina | 7,115 | | 0.03 | | 14,791 | | 0.06 | | | Guinea-Bissau | 137 | | 0.00 | | 7,813 | | 0.03 | |
Botswana | 2,094 | | 0.01 | | 9,770 | | 0.04 | | | Guyana | 15,557 | | 0.06 | | 23,233 | | 0.09 | |
Brazil | 476,644 | | 1.96 | | 484,320 | | 1.88 | | | Haiti | 10,009 | | 0.04 | | 17,685 | | 0.07 | |
Brunei Darussalam | 2,503 | | 0.01 | | 10,179 | | 0.04 | | | Honduras | 5,657 | | 0.02 | | 13,333 | | 0.05 | |
Bulgaria | 56,666 | | 0.23 | | 64,342 | | 0.25 | | | Hungary | 128,885 | | 0.53 | | 136,561 | | 0.53 | |
Burkina Faso | 8,849 | | 0.04 | | 16,525 | | 0.06 | | | Iceland | 2,619 | | 0.01 | | 10,295 | | 0.04 | |
Burundi | 2,300 | | 0.01 | | 9,976 | | 0.04 | | | India | 1,007,597 | | 4.15 | | 1,015,273 | | 3.95 | |
Cabo Verde | 1,071 | | 0.00 | | 8,747 | | 0.03 | | | Indonesia | 309,305 | | 1.27 | | 316,981 | | 1.23 | |
Cambodia | 3,943 | | 0.02 | | 11,619 | | 0.05 | | | Iran, Islamic Republic of | 11,010 | | 0.05 | | 18,686 | | 0.07 | |
Cameroon | 11,453 | | 0.05 | | 19,129 | | 0.07 | | | Iraq | 6,349 | | 0.03 | | 14,025 | | 0.05 | |
Canada | 796,137 | | 3.28 | | 803,813 | | 3.12 | | | Ireland | 22,493 | | 0.09 | | 30,169 | | 0.12 | |
Central African Republic | 907 | | 0.00 | | 8,583 | | 0.03 | | | Israel | 28,522 | | 0.12 | | 36,198 | | 0.14 | |
Chad | 11,600 | | 0.05 | | 19,276 | | 0.07 | | | Italy | 796,137 | | 3.28 | | 803,813 | | 3.12 | |
Chile | 123,783 | | 0.51 | | 131,459 | | 0.51 | | | Jamaica | 41,910 | | 0.17 | | 49,586 | | 0.19 | |
China | 739,505 | | 3.04 | | 747,181 | | 2.90 | | | Japan | 1,800,442 | | 7.41 | | 1,808,118 | | 7.03 | |
Colombia | 133,679 | | 0.55 | | 141,355 | | 0.55 | | | Jordan | 11,756 | | 0.05 | | 19,432 | | 0.08 | |
Comoros | 107 | | 0.00 | | 7,783 | | 0.03 | | | Kazakhstan | 35,355 | | 0.15 | | 43,031 | | 0.17 | |
Congo, Democratic Republic of | 19,833 | | 0.08 | | 27,509 | | 0.11 | | | Kenya | 30,811 | | 0.13 | | 38,487 | | 0.15 | |
Congo, Republic of | 999 | | 0.00 | | 8,675 | | 0.03 | | | Kiribati | 978 | | 0.00 | | 8,654 | | 0.03 | |
Costa Rica | 10,742 | | 0.04 | | 18,418 | | 0.07 | | | Korea, Republic of | 323,047 | | 1.33 | | 330,723 | | 1.29 | |
Cote d'Ivoire | 39,129 | | 0.16 | | 46,805 | | 0.18 | | | Kosovo | 14,231 | | 0.06 | | 21,907 | | 0.09 | |
Croatia | 31,889 | | 0.13 | | 39,565 | | 0.15 | | | Kuwait | 172,149 | | 0.71 | | 179,825 | | 0.70 | |
Cyprus | 20,936 | | 0.09 | | 28,612 | | 0.11 | | | Kyrgyz Republic | 16,834 | | 0.07 | | 24,510 | | 0.10 | |
Czechia | 97,365 | | 0.40 | | 105,041 | | 0.41 | | | Lao People's Democratic Republic | 3,065 | | 0.01 | | 10,741 | | 0.04 | |
Denmark | 204,148 | | 0.84 | | 211,824 | | 0.82 | | | Latvia | 21,043 | | 0.09 | | 28,719 | | 0.11 | |
Djibouti | 160 | | 0.00 | | 7,836 | | 0.03 | | | Lebanon | 1,029 | | 0.00 | | 8,705 | | 0.03 | |
Dominica | 1,221 | | 0.01 | | 8,897 | | 0.03 | | | Lesotho | 1,892 | | 0.01 | | 9,568 | | 0.04 | |
Dominican Republic | 14,977 | | 0.06 | | 22,653 | | 0.09 | | | Liberia | 1,580 | | 0.01 | | 9,256 | | 0.04 | |
| | | | | | | | | | |
| | | | | | | | | | |
| | | | | | | | | | |
The notes to Consolidated Financial Statements are an integral part of these statements.
| | | | | | | | |
| INTERNATIONAL FINANCE CORPORATION | Page 69 |
| | | | | | | | | | | | | | | | | | | | | | | | | | | | | | | | |
SUPPLEMENTARY INFORMATION: CONSOLIDATED STATEMENT OF CAPITAL STOCK AND VOTING POWER as of June 30, 2026 |
(US$ in thousands) | Capital Stock | Voting Power | | | Capital Stock | Voting Power |
Members | Amount
paid | Percent of total | Number of votes | Percent of total | | Members | Amount
paid | Percent of total | Number of votes | Percent of total |
Libya | 13,127 | | 0.05 | | 20,803 | | 0.08 | | | Saudi Arabia | 583,805 | | 2.40 | | 591,481 | | 2.30 | |
Lithuania | 22,912 | | 0.09 | | 30,588 | | 0.12 | | | Senegal | 17,986 | | 0.07 | | 25,662 | | 0.10 | |
Luxembourg | 23,835 | | 0.10 | | 31,511 | | 0.12 | | | Serbia | 22,215 | | 0.09 | | 29,891 | | 0.12 | |
Madagascar | 6,834 | | 0.03 | | 14,510 | | 0.06 | | | Seychelles | 598 | | 0.00 | | 8,274 | | 0.03 | |
Malawi | 17,833 | | 0.07 | | 25,509 | | 0.10 | | | Sierra Leone | 3,504 | | 0.01 | | 11,180 | | 0.04 | |
Malaysia | 126,614 | | 0.52 | | 134,290 | | 0.52 | | | Singapore | 8,789 | | 0.04 | | 16,465 | | 0.06 | |
Maldives | 751 | | 0.00 | | 8,427 | | 0.03 | | | Slovak Republic | 48,786 | | 0.20 | | 56,462 | | 0.22 | |
Mali | 5,274 | | 0.02 | | 12,950 | | 0.05 | | | Slovenia | 17,679 | | 0.07 | | 25,355 | | 0.10 | |
Malta | 15,807 | | 0.07 | | 23,483 | | 0.09 | | | Solomon Islands | 282 | | 0.00 | | 7,958 | | 0.03 | |
Marshall Islands | 5,055 | | 0.02 | | 12,731 | | 0.05 | | | Somalia, Federal Republic of | 633 | | 0.00 | | 8,309 | | 0.03 | |
Mauritania | 1,632 | | 0.01 | | 9,308 | | 0.04 | | | South Africa | 132,805 | | 0.55 | | 140,481 | | 0.55 | |
Mauritius | 18,291 | | 0.08 | | 25,967 | | 0.10 | | | South Sudan | 14,334 | | 0.06 | | 22,010 | | 0.09 | |
Mexico | 349,668 | | 1.44 | | 357,344 | | 1.39 | | | Spain | 418,348 | | 1.72 | | 426,024 | | 1.66 | |
Micronesia, Federated States of | 5,673 | | 0.02 | | 13,349 | | 0.05 | | | Sri Lanka | 73,319 | | 0.30 | | 80,995 | | 0.31 | |
Moldova | 14,181 | | 0.06 | | 21,857 | | 0.08 | | | St. Kitts and Nevis | 4,864 | | 0.02 | | 12,540 | | 0.05 | |
Mongolia | 2,271 | | 0.01 | | 9,947 | | 0.04 | | | St. Lucia | 1,610 | | 0.01 | | 9,286 | | 0.04 | |
Montenegro | 10,130 | | 0.04 | | 17,806 | | 0.07 | | | Sudan | 846 | | 0.00 | | 8,522 | | 0.03 | |
Morocco | 94,303 | | 0.39 | | 101,979 | | 0.40 | | | Suriname | 4,727 | | 0.02 | | 12,403 | | 0.05 | |
Mozambique | 2,455 | | 0.01 | | 10,131 | | 0.04 | | | Sweden | 263,049 | | 1.08 | | 270,725 | | 1.05 | |
Myanmar | 5,078 | | 0.02 | | 12,754 | | 0.05 | | | Switzerland | 431,268 | | 1.78 | | 438,944 | | 1.71 | |
Namibia | 3,080 | | 0.01 | | 10,756 | | 0.04 | | | Syrian Arab Republic | 1,479 | | 0.01 | | 9,155 | | 0.04 | |
Nepal | 9,825 | | 0.04 | | 17,501 | | 0.07 | | | Tajikistan | 13,388 | | 0.06 | | 21,064 | | 0.08 | |
Netherlands | 549,384 | | 2.26 | | 557,060 | | 2.17 | | | Tanzania | 11,454 | | 0.05 | | 19,130 | | 0.07 | |
New Zealand | 47,437 | | 0.20 | | 55,113 | | 0.21 | | | Thailand | 129,382 | | 0.53 | | 137,058 | | 0.53 | |
Nicaragua | 8,105 | | 0.03 | | 15,781 | | 0.06 | | | Timor-Leste | 8,558 | | 0.04 | | 16,234 | | 0.06 | |
Niger | 1,121 | | 0.00 | | 8,797 | | 0.03 | | | Togo | 6,161 | | 0.03 | | 13,837 | | 0.05 | |
Nigeria | 270,840 | | 1.11 | | 278,516 | | 1.08 | | | Tonga | 1,226 | | 0.01 | | 8,902 | | 0.03 | |
North Macedonia | 5,932 | | 0.02 | | 13,608 | | 0.05 | | | Trinidad and Tobago | 31,352 | | 0.13 | | 39,028 | | 0.15 | |
Norway | 172,251 | | 0.71 | | 179,927 | | 0.70 | | | Tunisia | 34,902 | | 0.14 | | 42,578 | | 0.17 | |
Oman | 14,123 | | 0.06 | | 21,799 | | 0.08 | | | Türkiye | 187,498 | | 0.77 | | 195,174 | | 0.76 | |
Pakistan | 208,397 | | 0.86 | | 216,073 | | 0.84 | | | Turkmenistan | 6,176 | | 0.03 | | 13,852 | | 0.05 | |
Palau | 191 | | 0.00 | | 7,867 | | 0.03 | | | Tuvalu | 520 | | 0.00 | | 8,196 | | 0.03 | |
Panama | 9,856 | | 0.04 | | 17,532 | | 0.07 | | | Uganda | 8,370 | | 0.03 | | 16,046 | | 0.06 | |
Papua New Guinea | 13,588 | | 0.06 | | 21,264 | | 0.08 | | | Ukraine | 77,458 | | 0.32 | | 85,134 | | 0.33 | |
Paraguay | 6,504 | | 0.03 | | 14,180 | | 0.06 | | | United Arab Emirates | 30,750 | | 0.13 | | 38,426 | | 0.15 | |
Peru | 91,697 | | 0.38 | | 99,373 | | 0.39 | | | United Kingdom | 1,184,438 | | 4.88 | | 1,192,114 | | 4.63 | |
Philippines | 133,679 | | 0.55 | | 141,355 | | 0.55 | | | United States | 4,341,278 | | 17.87 | | 4,348,954 | | 16.91 | |
Poland | 96,139 | | 0.40 | | 103,815 | | 0.40 | | | Uruguay | 30,729 | | 0.13 | | 38,405 | | 0.15 | |
Portugal | 90,989 | | 0.37 | | 98,665 | | 0.38 | | | Uzbekistan | 42,311 | | 0.17 | | 49,987 | | 0.19 | |
Qatar | 16,150 | | 0.07 | | 23,826 | | 0.09 | | | Vanuatu | 1,507 | | 0.01 | | 9,183 | | 0.04 | |
Romania | 50,571 | | 0.21 | | 58,247 | | 0.23 | | | Venezuela, Republica Bolivariana de | 210,347 | | 0.87 | | 218,023 | | 0.85 | |
Russian Federation | 784,211 | | 3.23 | | 791,887 | | 3.08 | | | Viet Nam | 9,653 | | 0.04 | | 17,329 | | 0.07 | |
Rwanda | 4,899 | | 0.02 | | 12,575 | | 0.05 | | | Yemen, Republic of | 5,452 | | 0.02 | | 13,128 | | 0.05 | |
Samoa | 1,327 | | 0.01 | | 9,003 | | 0.04 | | | Zambia | 17,500 | | 0.07 | | 25,176 | | 0.10 | |
Sao Tome and Principe | 3,347 | | 0.01 | | 11,023 | | 0.04 | | | Zimbabwe | 24,513 | | 0.10 | | 32,189 | | 0.13 | |
* May differ from the sum of individual percentages shown because of rounding | | Total June 30, 2026 | 24,296,130 | | 100.00* | 25,723,866 | | 100.00* |
| | Total June 30, 2025 | 24,009,096 | | 100.00* | 25,419,906 | | 100.00* |
The notes to Consolidated Financial Statements are an integral part of these statements.
| | | | | | | | |
| INTERNATIONAL FINANCE CORPORATION | Page 70 |
| | | | | | | | |
NOTES TO CONSOLIDATED FINANCIAL STATEMENTS |
PURPOSE
The International Finance Corporation (IFC), an international organization, was established in 1956 to further economic development in its member countries by encouraging the growth of private enterprise. IFC is a member of the World Bank Group (WBG), which also comprises the International Bank for Reconstruction and Development (IBRD), the International Development Association (IDA), the Multilateral Investment Guarantee Agency (MIGA), and the International Centre for Settlement of Investment Disputes (ICSID). Each member is legally and financially independent. Transactions with other World Bank Group members are disclosed in the notes that follow. IFC’s activities are closely coordinated with and complement the overall development objectives of the other World Bank Group institutions. IFC, together with private investors, assists in financing the establishment, improvement and expansion of private sector enterprises by making loans, equity investments and investments in debt securities where sufficient private capital is not otherwise available on reasonable terms. IFC’s share capital is provided by its member countries. It raises most of the funds for its investment activities through the issuance of notes, bonds and other debt securities in the international capital markets. IFC also plays a catalytic role in mobilizing additional funding from other investors and lenders through parallel loans, loan participations, partial credit guarantees, securitizations, loan sales, risk sharing facilities, fund investments and other IFC crisis initiatives. In addition to project finance and mobilization, IFC offers an array of financial and technical advisory services to private businesses in the developing world to increase their chances of success. It also advises governments on how to create an environment hospitable to the growth of private enterprise and foreign investment.
NOTE A – SUMMARY OF SIGNIFICANT ACCOUNTING POLICIES
The consolidated financial statements include the financial statements of IFC and its consolidated entities. The accounting and reporting policies of IFC conform with accounting principles generally accepted in the United States of America (U.S. GAAP). In the opinion of management, the consolidated financial statements reflect all adjustments necessary for the fair presentation of IFC’s financial position and results of operations in accordance with U.S. GAAP.
Consolidated Financial Statements presentation – Certain amounts in prior years have been changed to conform with the current year’s presentation.
Functional currency – IFC’s functional currency is the United States dollar (U.S. dollars, US$ or $).
Use of estimates – The preparation of the consolidated financial statements requires management to make estimates and assumptions that affect the reported amounts of assets and liabilities and disclosure of contingent assets and liabilities at the date of the consolidated financial statements and the reported amounts of income and expense during the reporting periods. Actual results could differ from these estimates. A significant degree of judgment has been used in the determination of: the estimated fair value of financial instruments accounted for at fair value (including equity investments, debt securities, loans, trading securities, borrowings and derivative instruments): reserve against losses on loans and off-balance sheet credit exposures; impairment of debt securities; projected pension benefit obligations, fair value of pension and other postretirement benefit plan assets, and net periodic pension income or expense. There are inherent risks and uncertainties related to IFC’s operations. The possibility exists that changing economic conditions could have an adverse effect on the financial position of IFC.
IFC uses internal models to determine the fair values of derivative and other financial instruments and the aggregate level of the reserve against credit losses on loans, off-balance sheet credit exposures, and available-for-sale debt securities. IFC undertakes continuous review and analysis of these models with the objective of refining its estimates, consistent with evolving best practices appropriate to its operations. Changes in estimates resulting from refinements in the assumptions and methodologies incorporated in the models are reflected in net income in the period in which the enhanced models are first applied.
Consolidation, non-controlling interests and variable interest entities – IFC consolidates:
i.entities where IFC holds the majority voting rights, unless noncontrolling shareholders/limited partners have substantive participating rights or other rights that would overcome the presumption of control by the majority owner;
ii.limited partnerships in which it is the General Partner (GP), unless the presumption of control is overcome by certain management participation or other rights held by noncontrolling shareholders/limited partners; and
iii.Variable Interest Entities (VIEs) for which IFC is deemed to be the VIE's primary beneficiary.
Such entities are collectively referred to as IFC’s consolidated entities. Significant intercompany accounts and transactions are eliminated in consolidation.
An entity is a VIE if:
i.its equity is not sufficient to permit the entity to finance its activities without additional subordinated financial support from other parties;
ii.its equity investors do not have decision-making rights about the entity's operations; or
iii.its equity investors do not absorb the expected losses or receive the expected returns of the entity proportionally to their voting rights.
| | | | | | | | |
| INTERNATIONAL FINANCE CORPORATION | Page 71 |
| | | | | | | | |
NOTES TO CONSOLIDATED FINANCIAL STATEMENTS |
NOTE A – SUMMARY OF SIGNIFICANT ACCOUNTING POLICIES (continued)
A variable interest is a contractual, ownership or other interest whose value changes as the fair value of the VIE's net assets change. IFC's variable interests in VIEs arise from financial instruments, service contracts, guarantees, leases or other monetary interests in those entities.
IFC is considered to be the primary beneficiary of a VIE if it has the power to direct the VIE's activities that most significantly impact its economic performance and the obligation to absorb losses of or the right to receive benefits from the VIE that could potentially be significant to the VIE.
Fair Value Option – IFC has elected the Fair Value Option under the subsections of ASC Topic 825, Financial Instruments (ASC 825 or the Fair Value Option) for several of its financial assets and financial liabilities. ASC 825 permits, on an instrument-by-instrument basis, the measurement of eligible financial assets, financial liabilities and firm commitments at fair value that are not otherwise permitted to be accounted for at fair value under other accounting standards. The election to use the Fair Value Option is available when an entity first recognizes a financial asset or liability or upon entering into a firm commitment.
IFC has elected the Fair Value Option (FVO) for the following financial assets and financial liabilities:
i.direct equity investments which give IFC significant influence, which in the absence of the Fair Value Option, would have to be accounted for under equity method and all other financial interests in the same investee (e.g., guarantees, loans)
ii.all market borrowings that are economically hedged with financial instruments that are accounted for at fair value with changes therein reported in income;
iii.borrowings from IDA;
effective July 1, 2018:
iv.substantially all investments in debt securities; and
v.substantially all hybrid instruments in the loan investment portfolio.
All borrowings for which the Fair Value Option has been elected are economically hedged with derivative or other financial instruments accounted for at fair value with changes in fair value reported in earnings as such changes occur. Measuring these instruments at fair value mitigates some of the earnings volatility that would otherwise occur, due to measuring the borrowings and related economic hedges differently, without having to apply ASC Topic 815, Derivatives and Hedging (ASC 815)'s complex hedge accounting requirements.
Measuring at fair value those equity investments that would otherwise require equity method accounting simplifies the accounting and renders a carrying amount on the consolidated balance sheets based on a measure (fair value) that IFC considers preferable to equity method accounting. For the investments that otherwise would require equity method accounting for which the Fair Value Option is elected, ASC 825 requires the Fair Value Option to also be applied to all eligible financial interests in the same entity. IFC has disbursed loans and issued guarantees to some of those investees; therefore, the Fair Value Option is also applied to those loans and issued guarantees.
The Fair Value Option has been elected for substantially all investments in debt securities and hybrid loan instruments recognized after June 30, 2018. Among other things, measuring all these instruments at fair value eliminates the requirement to bifurcate the host and embedded derivative that may have otherwise applied in certain instances, and results in more accounting consistency across IFC’s investment portfolio and a measurement method that is consistent with the manner in which the portfolio is managed.
Fair Value Measurements
ASC Topic 820, Fair Value Measurements and Disclosures (ASC 820) defines fair value; establishes a framework for measuring fair value and a fair value hierarchy that prioritizes the inputs to valuation techniques used to measure fair value into three broad levels; and applies to all items measured at fair value, including items for which impairment measures are based on fair value.
ASC 820 defines fair value as the price that would be received to sell an asset or transfer a liability (i.e., an exit price) in an orderly transaction between independent, knowledgeable and willing market participants at the measurement date assuming the transaction occurs in the entity’s principal (or most advantageous) market. Fair value must be based on assumptions market participants would use (inputs) in determining the price and measured assuming that market participants act in their economic best interest and, therefore, their fair values are determined based on a transaction to sell or transfer the asset or liability on a standalone basis. Under ASC 820, fair value measurements are not adjusted for transaction costs.
ASC 820 establishes a fair value hierarchy which gives the highest priority to unadjusted quoted prices in active markets for identical unrestricted assets and liabilities (Level 1), the next highest priority to observable market-based inputs or unobservable inputs that are corroborated by market data from independent sources (Level 2) and the lowest priority to unobservable inputs that are not corroborated by market data (Level 3). Fair value measurements are required to maximize the use of available observable inputs.
Level 1: Unadjusted quoted prices in active markets for identical assets or liabilities accessible to the reporting entity at the measurement date.
| | | | | | | | |
| INTERNATIONAL FINANCE CORPORATION | Page 72 |
| | | | | | | | |
NOTES TO CONSOLIDATED FINANCIAL STATEMENTS |
NOTE A – SUMMARY OF SIGNIFICANT ACCOUNTING POLICIES (continued)
Level 2: Other than quoted prices included in Level 1, inputs that are observable for the asset or liability, either directly or indirectly for substantially the full term of the asset or liability. It includes quoted prices for similar assets or liabilities in active markets, quoted prices for identical or similar assets or liabilities in markets that are not active, and financial instruments that are valued using models and other valuation methodologies. These models consider various assumptions and inputs, including time value, yield curves, volatility factors, prepayment speeds, default rates, loss severity and current market and contractual pricing for the underlying asset, as well as other relevant economic measures. Substantially all of these inputs are observable in the marketplace, can be derived from observable data or are supported by observable levels at which market transactions are executed.
Level 3: Unobservable inputs for the asset or liability used to measure fair value to the extent that observable inputs are not available, thereby allowing for situations in which there is little, if any, market activity for the asset or liability at the measurement date. It consists of financial instruments whose fair value is estimated based on internally developed models or methodologies utilizing significant inputs that are unobservable. It also includes financial instruments whose fair value is estimated based on price information from independent sources that cannot be corroborated by observable market data.
IFC’s policy is to recognize transfers in and transfers out of levels as of the beginning of the reporting period in which they occur.
IFC estimates the fair value of its investments in private equity funds that do not have readily determinable fair value based on the funds’ net asset values (NAVs) per share as a practical expedient to the extent that a fund reports its investment assets at fair value and has all the attributes of an investment company, pursuant to ASC Topic 946, Financial Services – Investment Companies (ASC 946). If the NAV is not as of IFC’s measurement date, IFC adjusts the most recent NAV, as necessary, to estimate an NAV for the investment that is calculated in a manner consistent with the fair value measurement principles established by ASC 820.
Remeasurement of foreign currency transactions – IFC’s reporting and functional currency is the U.S. dollar. Monetary assets and liabilities not denominated in U.S. dollars, are remeasured to U.S. dollars at the exchange rates prevailing at end of each reporting period. Income and expenses are recorded based on the rates of exchange prevailing at the time of the transaction. Transaction gains and losses are credited or charged to income.
Loans – IFC originates loans to facilitate project finance, restructuring, refinancing, corporate finance, and/or other developmental objectives. Loans are recorded as assets when disbursed. Loans are generally carried at the principal amounts outstanding, adjusted for net unamortized loan origination costs and fees. It is IFC’s practice to obtain collateral security such as, but not limited to, mortgages and third-party guarantees.
For a restructured loan, IFC records the assets received at fair value (less cost to sell), with a corresponding decrease to the loan amortized cost basis. If other assets were received in partial satisfaction of the loan, IFC also determines whether the restructured loan should be accounted for as a new loan. If other assets were received in full satisfaction of the loan, IFC reports the excess of the loan’s amortized cost basis over the received asset’s fair value (less cost to sell) into net income, to the extent the difference is not offset against the loan’s allowance.
Certain loans are carried at fair value in accordance with the Fair Value Option as discussed above. Unrealized gains and losses on loans accounted for at fair value under the Fair Value Option are reported in Net unrealized gains and losses on loans, debt securities, borrowings and related derivatives on the consolidated statements of operations.
Certain loans originated by IFC contain income participation, prepayment and conversion features. These features are bifurcated and separately accounted for in accordance with ASC 815 if IFC has not elected the Fair Value Option for the loan host contracts and the features meet the definition of a derivative and are not considered to be clearly and closely related to their host loan contracts. Otherwise, these features are accounted for as part of their host loan contracts in accordance with IFC’s accounting policies for loans as indicated herein.
Revenue recognition on loans – Interest income and commitment fees on loans are recorded as income on an accrual basis. Loan origination fees and direct loan origination costs are deferred and amortized over the estimated life of the originated loan; such amortization is determined using the interest method unless the loan is a revolving credit facility in which case amortization is determined using the straight-line method. Prepayment fees are recorded as income when received. IFC has elected to present interest income separately from other changes in the fair value of loans measured at fair value through earnings under the Fair Value Option. IFC applies cost recovery or cash method for recognizing interest income from certain debt securities and beneficial interests accounted for as debt securities whose cash flows cannot be reliably estimated.
IFC does not recognize income on loans where collectability is in doubt, or payments of interest or principal are past due more than 60 days unless management anticipates that collection of past due amounts will occur in the near future. In all cases, loans that are 90 days or more past due will be placed in nonaccrual status. Any interest accrued on a loan placed in nonaccrual status is reversed out of income and is thereafter recognized as income only when the actual payment is received. Interest not previously recognized but capitalized as part of a debt restructuring is recorded as deferred income, included in the consolidated balance sheets in payables and other liabilities, and credited to income only when the related principal is received. Such capitalized interest is considered in the computation of the reserve against losses on loans in the consolidated balance sheets.
| | | | | | | | |
| INTERNATIONAL FINANCE CORPORATION | Page 73 |
| | | | | | | | |
NOTES TO CONSOLIDATED FINANCIAL STATEMENTS |
NOTE A – SUMMARY OF SIGNIFICANT ACCOUNTING POLICIES (continued)
Accrued interest balances are reported within receivables and other assets on the consolidated balance sheets. IFC elected not to measure expected credit losses for accrued interest receivables related to its loans and the available-for-sale securities portfolio as IFC’s policy is to write-off uncollectible accrued interest receivable balances in a timely manner. Accrued interest is written off by reversing interest income during the quarter the financial asset is moved from an accrual to a nonaccrual status.
Reserve against losses on loans and off-balance sheet credit arrangements
In accordance with ASC Topic 326, Financial Instruments – Credit Losses (ASC 326), IFC recognizes a reserve for credit losses that is deducted from the amortized cost basis of the financial asset to present the net amount expected to be collected on the financial asset on the balance sheets.
In accordance with ASC 326, IFC's credit loss methodology reflects an estimate of expected credit losses over the remaining contractual life of a financial asset, considering forward-looking information. IFC considers the relevant inputs and assumptions required to perform the estimate. These include, but are not limited to, historical and current loan portfolio data, data relevant to current economic conditions, and data relevant to reasonable and supportable forecasts of economic conditions. Inputs and assumptions are quantitative or qualitative in nature. In particular, the forecast of key economic variables relevant to the loan portfolio is one of the critical assumptions to IFC’s estimation of expected credit losses. The forecast of economic variables are credit loss drivers that produce a macro-economic response estimate of loss over the 3-year period that IFC deems to be reasonable and supportable. For periods beyond the reasonable and supportable forecast period, expected credit losses are estimated by reverting to historical loss information without adjustment for changes in economic conditions. This reversion is phased in over a one-year period on a straight-line basis. The segmentation process is based on a facility risk and credit risk rating, with certain assumptions segmented by industry. The facility risk rating applies to an individual investment product and provides information on the amount of loss that IFC is likely to incur on that product if the obligor defaults. IFC’s forecast of expected credit losses is based on the probability of a loan defaulting associated with each credit risk rating, the expected loss percentage given a default associated with each facility risk rating, and the expected balance at the estimated date of default. The estimate of the expected balance at the time of default considers a prepayment assumption and, for loans with available credit, a disbursement assumption that estimates expected utilization rates.
The reserve against losses on loans are established through a review process undertaken on a quarterly basis and has two main components: (a) a portfolio reserve for expected losses determined from the historical loss rates, adjusted for qualitative factors, and forecasted expected losses on the segments associated with the loan class with similar risk characteristics; and (b) an individual reserve which is a separate reserve representing the reserve assigned to individually evaluated loans that do not share similar risk characteristics with other loans. IFC considers its entire loan portfolio to comprise one portfolio segment and defines the one major category of loans to be the grouping of the loan receivable based on risk characteristics and the method for monitoring and assessing credit risk. The risks inherent in the portfolio that are considered in determining the portfolio reserve are those proven to exist by past experience and include: country systemic risk; the risk of correlation or contagion of losses between markets; uninsured and uninsurable risks; nonperformance under guarantees and support agreements; and opacity of, or misrepresentation in a borrower's financial statements.
For individual reserve, loans identified as not sharing similar risk characteristics with other assets are individually evaluated for the net amount expected to be collected, and the reserve is determined for them outside of the portfolio reserve computation. Information and events, with respect to the borrower and/or the economic and political environment in which it operates, that are considered in determining a loss reserve include, but are not limited to, the borrower’s financial difficulties, assessing the risk of breach of contract, bankruptcy/reorganization, Credit Rating (CR) downgrade as well as geopolitical conflict, financial/economic crisis, commodity price decline, adverse local government action and natural disaster.
Individually evaluated loans are measured based on the present value of expected future cash flows to be received, or for loans that are dependent on collateral for repayment, the estimated fair value of the collateral, less the cost to sell.
IFC recognizes a reserve on loans not carried at fair value in the consolidated balance sheets through the reserve against losses on loans, with corresponding provision or release of provision for losses on loans in net income, which increases or decreases the reserve against losses on loans. Loans are written-off along with its reserve against losses when IFC has exhausted all possible means of recovery. The reductions in the reserve are partially offset by recoveries which are considered in the reserving process, if any, associated with previously written-off loans.
IFC recognizes a reserve for credit losses on off-balance sheet credit exposures for guarantees that are not measured at fair value and other off-balance sheet arrangements, primarily loans committed but not disbursed, based on expected credit losses over the contractual period in which IFC is exposed to credit risk via a present contractual obligation to extend credit, unless that obligation is unconditionally cancellable by IFC. Reserve against losses on off-balance sheet credit exposures are included within Payables and other liabilities on the consolidated balance sheets, with changes recognized through provision for losses on loans in net income. Methodologies for estimating the reserve for credit losses on off-balance sheet credit exposures, including loans committed but not disbursed, are generally consistent with methodologies for estimating the reserve for credit losses for the disbursed loan portfolio, as discussed above as applicable, but is subject to an additional parameter reflecting the likelihood that funding will occur.
| | | | | | | | |
| INTERNATIONAL FINANCE CORPORATION | Page 74 |
| | | | | | | | |
NOTES TO CONSOLIDATED FINANCIAL STATEMENTS |
NOTE A – SUMMARY OF SIGNIFICANT ACCOUNTING POLICIES (continued)
IFC separately records benefits from non-derivative freestanding credit enhancements as recovery assets, which are reported in “Receivables and other assets” on the consolidated balance sheets. Changes in expected recoveries from such freestanding credit enhancements are reported in “Income from loans and guarantees, including realized gains and losses on loans and associated derivatives” on the consolidated statements of operations.
Equity investments – IFC invests primarily for developmental impact; IFC does not seek to take operational, controlling, or strategic equity positions within its investees. Equity investments are acquired through direct ownership of equity instruments of investees, as a limited partner in LLPs and LLCs, and/or as an investor in private equity funds.
Pursuant to ASC Topic 321, Investments – Equity Securities (ASC 321), all equity investments are measured at fair value, with unrealized gains and losses reported in net income.
IFC’s investments in certain private equity funds in which IFC is deemed to have a controlling financial interest, are consolidated by IFC, as the presumption of control by the fund manager or the GP has been overcome. Certain equity investments, for which recovery of invested capital is uncertain, are accounted for under the cost recovery method, such that receipts are first applied to recovery of invested capital and then to income from equity investments. The cost recovery method is applied to IFC's investments in its natural resources Unincorporated Joint Ventures (UJVs). IFC’s share of conditional asset retirement obligations related to investments in UJVs are recorded when the fair value of the obligations can be reasonably estimated. The obligations are capitalized and systematically amortized over the estimated economic useful lives.
Unrealized gains and losses on equity investments accounted for at fair value are reported in income from equity investments and associated derivatives on the consolidated statements of operations. Realized gains on the sale or redemption of equity investments are measured against the average cost of the investments sold.
Dividends on listed equity investments are recorded on the ex-dividend date, and dividends on unlisted equity investments are recorded upon receipt of notice of declaration. Realized gains on listed equity investments are recorded on trade date, and realized gains on unlisted equity investments are recorded upon incurring the obligation to deliver the applicable shares. Losses are recognized when incurred.
IFC enters into put options, call options and warrant agreements in connection with equity investments; these are accounted for as derivatives in accordance with ASC 815 to the extent they meet the definition of a derivative. Put options, call options and warrant agreements that do not meet the definition of a derivative are measured at fair value with unrealized gains and losses recognized in earnings in accordance with ASC 321 and included in “Equity investments” on the consolidated balance sheets.
Gains and losses on loan and debt security conversions and exchanges of equity interests – Loan and debt security conversions to equity interests are based on the fair value of the equity interests received. Transfers of equity interests in exchange for equity interests in other entities and other non-cash transactions are generally accounted for based on the fair value of the asset relinquished unless the fair value of the asset received is more clearly evident in which case the accounting is based on the fair value of the asset received. The difference between the fair value of the asset received and the recorded amount of the asset relinquished is recorded as a gain or loss in the consolidated statements of operations.
Debt securities – IFC invests in debt securities for various purposes. Debt securities in the liquid asset portfolio provide a source of income through yield or resale and are classified as trading.
Debt securities in the investment portfolio are used to further economic development in IFC’s member countries and consist of corporate debt, preferred shares and asset-back securities. Debt securities in the investment portfolio are primarily reported at fair value in accordance with the FVO as discussed above. Certain debt securities in the investment portfolio are classified as available-for-sale and are carried at fair value on the consolidated balance sheets with unrealized gains and losses included in Accumulated Other Comprehensive Income (AOCI) until realized.
IFC has elected to present interest income separately from other changes in the fair value of debt securities measured at fair value through earnings under the FVO. Unrealized gains and losses on debt securities accounted for at fair value under the FVO are reported in “Net unrealized gains and losses on loans, debt securities, borrowings and related derivatives” on the consolidated statements of operations.
IFC invests in certain debt securities with conversion features; if the hybrid instrument is not measured at fair value with unrealized gains and losses reported in net income, these features are accounted for in accordance with ASC 815 to the extent they meet the definition of a derivative.
| | | | | | | | |
| INTERNATIONAL FINANCE CORPORATION | Page 75 |
| | | | | | | | |
NOTES TO CONSOLIDATED FINANCIAL STATEMENTS |
NOTE A – SUMMARY OF SIGNIFICANT ACCOUNTING POLICIES (continued)
Impairment of debt securities
IFC adopted the guidance under ASC 326 for available-for-sale debt securities by amending the impairment model to determine whether all or a portion of the unrealized loss on such securities is a credit loss, and recognizing a reserve for credit losses, instead of recording a write-down as required by pre-ASC 326 guidance. In determining whether all or a portion of the unrealized loss on such securities is a credit loss, IFC considers all relevant information including the extent to which fair value has been less than amortized cost, whether IFC intends to sell the debt security or whether it is more likely than not that IFC will be required to sell the debt security, the payment structure of the obligation and the ability of the issuer to make scheduled interest or principal payments, any changes to the ratings of a security, and relevant adverse conditions specifically related to the security, an industry or geographic sector.
Debt securities in the investment portfolio classified as available-for-sale are assessed for impairment each quarter. When impairment is identified, the entire impairment is recognized in net income if (1) IFC intends to sell the security, or (2) it is more likely than not that IFC will be required to sell the security before recovery. However, if IFC does not intend to sell the security and it is not more likely than not that IFC will be required to sell the security but the security has a credit loss, the impairment charge is separated into two components: (1) the credit loss component, which is recognized as a reserve for credit losses (through net income), limited to the amount by which the security’s amortized cost basis exceeds the fair value, and reversal of impairment losses are allowed when the credit of the issuer improves, and (2) the noncredit related impairment losses, which are recorded in other comprehensive income.
Guarantees – IFC extends financial guarantee facilities to its clients to provide credit enhancement for their debt security issuances and loan obligations. As part of these financial guarantee facilities, IFC offers partial credit guarantees to clients covering, on a risk-sharing basis, client obligations on bonds or loans. Under the terms of IFC's guarantees, IFC agrees to assume responsibility for the client’s financial obligations in the event of default by the client (i.e., failure to pay when payment is due). Guarantees are regarded as issued when IFC commits to the guarantee. Guarantees are regarded as outstanding when the underlying financial obligation of the client is incurred, and this date is considered to be the “inception” of the guarantee. Guarantees are regarded as called when IFC’s obligation under the guarantee has been invoked. There are two liabilities associated with the guarantees: (i) the stand-ready obligation to perform and (ii) the contingent liability. The fair value of the stand-ready obligation to perform is recognized at the inception of the guarantee. For guarantees that are within scope of ASC 326, the expected credit losses (the contingent liability) associated with the financial guarantee is measured and accounted for in addition to and separately from IFC’s liability recognized for the stand-ready obligation to perform. Guarantee fees are recorded in income as the stand-ready obligation to perform is fulfilled. Commitment fees on guarantees are recorded as income on an accrual basis. All liabilities associated with guarantees are included in payables and other liabilities, and the receivables are included in other assets on the consolidated balance sheets.
Liquid asset portfolios – The liquid asset portfolios mainly consist of: time deposits and securities; related derivative instruments; securities purchased under resale agreements and receivable for cash collateral pledged, securities sold under repurchase agreements and payable for cash collateral received; receivables from sales of securities and payables for purchases of securities; and related accrued income and charges. IFC’s liquid funds are invested in government, agency and government-sponsored agency obligations, time deposits and asset-backed, including mortgage-backed, securities. Government and agency obligations include positions in high-quality fixed rate bonds, notes, bills, and other obligations issued or unconditionally guaranteed by governments of member countries or other official entities including government agencies and instrumentalities or by multilateral organizations. Asset-backed and mortgage-backed securities include agency and non-agency residential Mortgage-Backed Securities (MBS), commercial mortgage-backed securities, consumer, auto and student loan-backed securities, commercial real estate collateralized debt obligations and collateralized loan obligations.
Securities and related derivative instruments within IFC’s liquid asset portfolios are classified as trading and, with the exception of cash equivalent securities which are carried at amortized cost, are carried at fair value with any changes in fair value reported in income from liquid asset trading activities. Interest on securities and amortization of premiums and accretion of discounts are also reported in income from liquid asset trading activities. Gains and losses realized on the sale of trading securities are computed on a specific security basis.
Cash and cash equivalents – IFC classifies cash and due from banks as cash and cash equivalents in the consolidated statement of cash flows.
Repurchase, resale and securities lending agreements – Repurchase agreements are contracts under which a party sells securities and simultaneously agrees to repurchase the same securities at a specified future date at a fixed price. Resale agreements are contracts under which a party purchases securities and simultaneously agrees to resell the same securities at a specified future date at a fixed price. Securities lending agreements are similar to repurchase agreements except that the securities loaned are securities that IFC has received as collateral under unrelated agreements and allowed by contract to rehypothecate. Amounts due under securities lending agreements are included in securities sold under repurchase agreements and payable for cash collateral received on the consolidated balance sheets.
| | | | | | | | |
| INTERNATIONAL FINANCE CORPORATION | Page 76 |
| | | | | | | | |
NOTES TO CONSOLIDATED FINANCIAL STATEMENTS |
NOTE A – SUMMARY OF SIGNIFICANT ACCOUNTING POLICIES (continued)
It is IFC’s policy to take possession of securities purchased under resale agreements, which are primarily liquid government securities. The market value of these securities is monitored and, within parameters defined in the agreements, additional collateral is obtained when their value declines. IFC also monitors its exposure with respect to securities sold under repurchase agreements and, in accordance with the terms of the agreements, requests the return of excess securities held by the counterparty when their value increases.
Repurchase, resale and securities lending agreements are accounted for as collateralized financing transactions and recorded at the amount at which the securities were acquired or sold plus accrued interest.
Borrowings – To diversify its access to funding, and reduce its borrowing costs, IFC borrows in a variety of currencies and uses a number of borrowing structures, including foreign exchange rate-linked, inverse floating rate and zero coupon notes. In managing the currency exposure inherent in borrowing in a variety of currencies, generally, IFC either simultaneously converts such borrowings into variable rate U.S. dollar borrowings through the use of currency and interest rate swap transactions or utilizes liquid asset portfolio or debt investments denominated in the same currency to economically hedge changes in the fair value of certain borrowings. Under certain outstanding borrowing agreements, IFC is not permitted to mortgage or allow a lien to be placed on its assets (other than purchase money security interests) without extending equivalent security to the holders of such borrowings. Interest on borrowings and amortization of premiums and accretion of discounts are reported in charges on borrowings.
Substantially all borrowings are carried at fair value under the Fair Value Option. The change in the fair value of these borrowings resulting from changes in instrument-specific credit risk is reported in “other comprehensive income”, while the remaining change in fair value is reported in “Net unrealized gains and losses on loans, debt securities, borrowings and related derivatives” in the consolidated statements of operations.
Risk management and use of derivative instruments – IFC enters into transactions in various derivative instruments primarily for financial risk management purposes in connection with its principal business activities, including lending, investing in debt securities and equity investments, client risk management, borrowing, liquid asset portfolio management and asset and liability management. There are no derivatives designated as accounting hedges.
All derivative instruments are recorded on the consolidated balance sheets at fair value as derivative assets or derivative liabilities. Where they are not clearly and closely related to the host contract, certain derivative instruments embedded in loans and debt securities are bifurcated from the host contract and recorded at fair value as derivative assets or liabilities unless the hybrid instrument is accounted for at fair value with any changes in fair value reported in income. The fair value at inception of such bifurcated embedded derivatives is excluded from the carrying amount of the host contracts on the consolidated balance sheets.
Changes in fair values of derivative instruments used in the liquid asset portfolio are recorded in “income from liquid asset trading activities”. Changes in fair values of derivative instruments other than those in the liquid asset or equity portfolios are recorded in “net unrealized gains and losses on loans, debt securities, borrowings and related derivatives”.
Cash flows from derivatives associated with IFC’s lending, client risk management, liquid asset management, and asset and liability management activities are reported as operating activities on the consolidated statements of cash flows. Principal-related cash flows for derivatives associated with IFC’s borrowing activities are reported as financing activities, while the interest-related cash flows are reported as operating activities. Cash flows from equity-linked derivatives are reported as investing activities. Notwithstanding the above, all cash flows from derivatives that have other-than-insignificant financing elements are reported as financing activities when IFC is the recipient of financing and as investing activities when IFC is the provider of financing.
The risk management policy for each of IFC’s principal business activities and the accounting policies particular to them are described below.
Lending activities IFC’s policy is to closely match the currency, interest rate basis, and maturity of its loans and borrowings. Derivative instruments are used to convert the cash flows from fixed rate U.S. dollar or non-U.S. dollar loans into variable rate U.S. dollars. Changes in fair value of all derivatives associated with these activities are reported in net income in ”Net unrealized gains and losses on loans, debt securities, borrowings and related derivatives,” in the consolidated statements of operations. Realized gains and losses associated with these activities are reported in “Income from loans and guarantees, including realized gains and losses on loans and associated derivatives.
Client risk management activities IFC enters into derivatives transactions with its clients to help them hedge their own currency, interest rate, or commodity risk, which, in turn, improves the overall quality of IFC’s loan portfolio. To hedge the market risks that arise from these transactions with clients, IFC enters into offsetting derivative transactions with matching terms with authorized market counterparties. Changes in fair value of all derivatives associated with these activities are reported in "Net unrealized gains and losses on loans, debt securities, borrowings and related derivatives", in the consolidated statements of operations. Realized gains and losses associated with these activities are reported in “Other Income”, in the consolidated statements of operations.
| | | | | | | | |
| INTERNATIONAL FINANCE CORPORATION | Page 77 |
| | | | | | | | |
NOTES TO CONSOLIDATED FINANCIAL STATEMENTS |
NOTE A – SUMMARY OF SIGNIFICANT ACCOUNTING POLICIES (continued)
Borrowing activities IFC issues debt securities in various capital markets with the objectives of minimizing its borrowing costs, diversifying funding sources, and developing member countries’ capital markets, sometimes using complex structures. These structures include borrowings payable in multiple currencies, or borrowings with principal and/or interest determined by reference to a specified index such as a stock market index, a reference interest rate, a commodity index, or one or more foreign exchange rates. IFC generally uses derivative instruments with matching terms, primarily currency and interest rate swaps, to convert certain of such borrowings into variable rate U.S. dollar obligations, consistent with IFC’s matched funding policy. IFC elects to carry at fair value, under the FVO, all market borrowings for which a derivative instrument, liquid asset portfolio investment or debt investment is used to create an economic hedge. Changes in the fair value of such borrowings and the associated derivatives are reported in "Net unrealized gains and losses on loans, debt securities, borrowings and related derivatives” in the consolidated statements of operations. Realized gains and losses associated with these activities are reported in “Charges on borrowings”, in the consolidated statements of operations.
Liquid asset portfolio management activities IFC manages the interest rate, currency and other market risks associated with certain of the time deposits and securities in its liquid asset portfolio by entering into derivative transactions to convert the cash flows from those instruments into variable rate U.S. dollars or by utilizing market borrowings denominated in the same currency to economically hedge changes in the fair value of certain liquid asset portfolio investments. The derivative instruments used include short-term, over-the-counter foreign exchange forwards (covered forwards), interest rate and currency swaps, and exchange-traded interest rate futures and options. As the entire liquid asset portfolio is classified as a trading portfolio, all securities (including derivatives) are carried at fair value with changes in fair value reported in "Income from liquid asset trading activities" in the consolidated statements of operations.
Asset and liability management In addition to the risk managed in the context of its business activities detailed above, IFC faces residual market risk in its overall asset and liability management. Residual currency risk is managed by monitoring the aggregate position in each lending currency and reducing the net excess asset or liability position through sales or purchases of currency. Interest rate risk arising from mismatches due to write-downs, prepayments and reschedulings, and residual reset date mismatches is monitored by measuring the sensitivity of the present value of assets and liabilities in each currency to each basis point change in interest rates.
IFC monitors the credit risk associated with these activities by careful assessment and monitoring of prospective and actual clients and counterparties. In respect of liquid assets and derivatives transactions, credit risk is managed by establishing exposure limits based on the CR and size of the individual counterparty. In addition, IFC has entered into master agreements with its derivative market counterparties governing derivative transactions that contain close-out and netting provisions and collateral arrangements. Under these agreements, if the credit exposure to one of the parties to the agreement, on a mark-to-market basis, exceeds a specified level, that party must post collateral to cover the excess, generally in the form of liquid government securities or cash. IFC does not offset the fair value amounts of derivatives and obligations to return, or rights to receive, cash collateral associated with these master-netting agreements. Changes in fair value of all derivatives associated with these activities are reported in ”Net unrealized gains and losses on loans, debt securities, borrowings and related derivatives,” in the consolidated statements of operations. Realized gains and losses associated with these activities are reported in “Other income”, in the consolidated statements of operations.
Loan participations – IFC mobilizes funds from commercial banks and other financial institutions (Participants) by facilitating loan participations, without recourse. These loan participations are administered and serviced by IFC on behalf of the Participants. The disbursed and outstanding balances of loan participations that meet the applicable accounting criteria are accounted for as sales and are not included in IFC’s consolidated balance sheets. All other loan participations are accounted for as secured borrowings; the participated loans are included in loans on IFC’s consolidated balance sheets, with the related secured borrowings included in payables and other liabilities on IFC’s consolidated balance sheets.
Withdrawal of Membership – Under IFC’s Articles of Agreement, in the event a member withdraws from IFC, IFC and the member may negotiate on the repurchase of the member’s capital stock on such terms as may be appropriate under the circumstances. Such agreement may provide, among other things, for a final settlement of all obligations of the member to IFC. If such an agreement is not made within six months after the member withdraws or such other time as IFC and the member may agree, the repurchase price of the member’s capital stock shall be the value thereof shown by the books of IFC on the day when the member withdraws. The repurchase of capital stock is subject to certain conditions including payments in installments, at such times and in such available currency or currencies as IFC reasonably determines, taking into account the financial position of IFC. IFC’s Articles of Agreement also provide for the withdrawing member to repay losses on loans and equity investments in excess of the reserves provided on the date of withdrawal.
Retained Earnings – Retained Earnings consist of allocated amounts (General Reserve, Surplus, Creating Markets Advisory Window (CMAW) Reserve, Funding Mechanism for Technical Assistance and Advisory Services (FMTAAS) Reserve, Small and Medium Enterprises (SME) Ventures Reserve, Frontier Opportunities Fund (FOF) Reserve, and Cumulative Fair Value and Other Adjustments), and Unallocated Net Income (Loss).
The General Reserve consists of earnings from prior fiscal years which, in the judgment of the Board of Directors, should be retained in IFC’s operations.
Surplus consists of earnings from prior fiscal years which are retained by IFC until a further decision is made on their disposition.
| | | | | | | | |
| INTERNATIONAL FINANCE CORPORATION | Page 78 |
| | | | | | | | |
NOTES TO CONSOLIDATED FINANCIAL STATEMENTS |
NOTE A – SUMMARY OF SIGNIFICANT ACCOUNTING POLICIES (continued)
CMAW Reserve consists of earnings from prior fiscal years which are retained to support the delivery of Upstream and Advisory related activities in eligible IDA and FCS member countries.
FMTAAS Reserve consists of earnings from prior fiscal years which are retained to support the delivery of Upstream and Advisory related activities, primarily in non-IDA/Fragile and FCS member countries.
SME Ventures Reserve consists of earnings from prior fiscal years which are retained to cover program, administrative, legal, and consulting expenses in connection with IFC’s private equity program for financing of SMEs.
FOF Reserve consists of earnings from prior fiscal years which are retained to provide concessional finance to spur equity investment mostly targeted to middle-income member countries including for the cutting-edge climate initiatives.
Cumulative Fair Value and Other Adjustments consist of unrealized mark-to-market gains or losses on IFC’s non-trading portfolios as well as income relating to the Post Retirement Contribution Reserve Fund (PCRF).
Unallocated Net Income (Loss) consists of the current fiscal year’s net income (loss) adjusted for Board-approved allocations and expenditures against reserves made during the year.
Net Income Allocations – Management recommends allocations of net income to the Board at the end of each fiscal year, to support IFC's operations as well as other developmental activities. Amounts approved by the Board are transferred from Unallocated Net Income to the related reserves within retained earnings. Expenditures relating to these reserves are recorded as expenses in IFC’s consolidated statements of operations in the year in which they are incurred and reduce the respective reserve balances.
Advisory services – Funding received for IFC advisory services from governments and other donors are recognized as contribution revenue when the conditions on which they depend are substantially met. Advisory services expenses are recognized in the period incurred. Advisory client fees and administration fees are recognized as income when earned.
Pension and other post-retirement benefits – IBRD sponsors a Staff Retirement Plan and Trust (SRP), a Retired Staff Benefits Plan (RSBP) and a Post-Employment Benefits Plan (PEBP) that are defined benefit plans and cover substantially all of its staff members as well as the staff of IFC and of MIGA.
The SRP provides regular pension benefits and includes a cash balance plan. The RSBP provides certain health and life insurance benefits to eligible retirees. The PEBP provides pension benefits administered outside the SRP. All costs associated with these plans are allocated between IBRD, IFC, and MIGA based upon their employees’ respective participation in the Plans. In addition, IFC and MIGA reimburse IBRD for their share of any contributions made to these plans by IBRD.
In accordance with ASU 2017-07, the service cost component of the net periodic benefit costs allocated to IFC is included in “Administrative expenses” in the consolidated statements of operations. The remaining components of the net periodic benefit costs allocated to IFC are included in “Other” in the consolidated statements of operations. IFC includes a receivable from IBRD in receivables and other assets, representing prepaid pension and other post-retirement benefit costs.
Effective July 1, 2025, IFC updated its policy to treat all time deposits as trading investments instead of classifying qualifying time deposits as cash equivalents. Accordingly, time deposits are now presented together with trading securities under “Investments - Trading” on the consolidated balance sheets. This change allows more efficient and systematic management of the liquid assets portfolio and enhances accounting alignment and financial statements comparability across the World Bank Group entities, with no impact on the consolidated statements of operations, comprehensive income or changes in capital. All periods presented herein reflect this change.
To reflect the change in accounting principle, the consolidated balance sheets as of June 30, 2025 and the consolidated statement of cash flows for the years ended June 30, 2025 and June 30, 2024 were adjusted as follows:
| | | | | | | | | | | | | | | | | |
Table A1: Impact to Consolidated Balance Sheets |
| June 30, 2025 |
(US$ in millions) | As previously reported | | Adjustment for change in accounting principle | | As adjusted |
Assets | | | | | |
Time Deposits | $ | 14,263 | | | $ | (14,263) | | | $ | — | |
Trading Securities | 33,711 | | | (33,711) | | | — | |
Investments - Trading | — | | | 47,974 | | | 47,974 | |
| | | | | | | | |
| INTERNATIONAL FINANCE CORPORATION | Page 79 |
| | | | | | | | |
NOTES TO CONSOLIDATED FINANCIAL STATEMENTS |
NOTE A – SUMMARY OF SIGNIFICANT ACCOUNTING POLICIES (continued)
| | | | | | | | | | | | | | | | | |
Table A2: Impact to Consolidated Statement of Cash Flows |
| For the year ended June 30, 2025 |
(US$ in millions) | As previously reported | | Adjustment for change in accounting principle | | As adjusted |
Adjustments to reconcile net income to net cash provided by (used in) operating activities | | | | | |
Change in liquid asset trading portfolio | $ | (5,545) | | | $ | (1,490) | | | $ | (7,035) | |
Net cash used in operating activities | (3,645) | | | (1,490) | | | (5,135) | |
Change in cash and cash equivalents | 1,917 | | | (1,490) | | | 427 | |
Effect of exchange rate changes on cash and cash equivalents | 300 | | | (276) | | | 24 | |
Net change in cash and cash equivalents | 2,217 | | | (1,766) | | | 451 | |
Beginning cash and due from banks | 9,782 | | | (9,001) | | | 781 | |
Ending cash and due from banks | 11,999 | | | (10,767) | | | 1,232 | |
| | | | | | | | | | | | | | | | | |
Table A2.1: |
| For the year ended June 30, 2024 |
(US$ in millions) | As previously reported | | Adjustment for change in accounting principle | | As adjusted |
Adjustments to reconcile net income to net cash provided by (used in) operating activities | | | | | |
Change in liquid asset trading portfolio | $ | 3,733 | | | $ | (1,413) | | | $ | 2,320 | |
Net cash (used in) provided by operating activities | 5,304 | | | (1,413) | | | 3,891 | |
Change in cash and cash equivalents | 1,151 | | | (1,413) | | | (262) | |
Effect of exchange rate changes on cash and cash equivalents | (168) | | | 160 | | | (8) | |
Net change in cash and cash equivalents | 983 | | | (1,253) | | | (270) | |
Beginning cash and due from banks | 8,799 | | | (7,748) | | | 1,051 | |
Ending cash and due from banks | 9,782 | | | (9,001) | | | 781 | |
Recently adopted accounting standards
In September 2025, the FASB issued ASU 2025-07, Derivatives and Hedging (Topic 815) and Revenue from Contracts with Customers (Topic 606): Derivatives Scope Refinements and Scope Clarification for Share-Based Noncash Consideration from a Customer in a Revenue Contract. The ASU adds a scope exception that excludes from derivative accounting certain non-exchange-traded contracts with underlying settlement variables that are based on operations or activities specific to one of the parties to the contract. The guidance is effective for fiscal years beginning after December 15, 2026, with early adoption permitted. IFC early adopted the ASU prospectively on October 1, 2025, as of July 1, 2025. The adoption did not have a material impact on IFC’s consolidated financial statements.
In October 2023, the FASB issued ASU 2023-06, Disclosure Improvements: Codification Amendments in Response to the SEC’s Disclosure Update and Simplification Initiative. The new guidance is intended to align U.S. GAAP requirements with those of the SEC and to facilitate the application of U.S. GAAP. IFC early adopted the ASU prospectively on June 30, 2026. The adoption did not have a material impact on IFC's financial statements.
Accounting standards under evaluation
In December 2025, the FASB issued ASU 2025-11, Interim Reporting (Topic 270): Narrow-Scope Improvements, to improve the navigability of interim reporting requirements by clarifying what disclosures are required for interim periods and specifying the form and content of interim financial statements. For IFC, the ASU will be effective for the quarter ending September 30, 2028. Early adoption is permitted. IFC is currently evaluating the impact of the ASU on its consolidated financial statements.
In December 2025, the FASB issued ASU 2025-10, Government Grants (Topic 832): Accounting for Government Grants Received by Business Entities, to establish authoritative guidance on the recognition, measurement, and presentation of government grants received by business entities. For IFC, the ASU will be effective for the quarter ending September 30, 2029. Early adoption is permitted. IFC is currently evaluating the impact of the ASU on its consolidated financial statements.
| | | | | | | | |
| INTERNATIONAL FINANCE CORPORATION | Page 80 |
| | | | | | | | |
NOTES TO CONSOLIDATED FINANCIAL STATEMENTS |
NOTE A – SUMMARY OF SIGNIFICANT ACCOUNTING POLICIES (continued)
In November 2025, the FASB issued ASU 2025-08, Financial Instruments–Credit Losses (Topic 326): Purchased Loans, which expands the use of the gross-up approach to include loans that meet the definition of “purchased seasoned loans”. Under the gross-up approach, an allowance for expected credit losses is recorded at acquisition for the acquired loans by increasing the amortized cost basis rather than through the provision for losses expense. Previously, the gross-up approach was limited to purchased loans with credit deterioration. The ASU aligns the accounting treatment for purchased loans with insignificant credit deterioration and purchased loans with more than insignificant credit deterioration at acquisition. For IFC, the ASU will be effective for the quarter ending September 30, 2027. Early adoption is permitted. IFC is currently evaluating the impact of the ASU on its consolidated financial statements.
In September 2025, the FASB issued ASU 2025-06, Intangibles–Goodwill and Other–Internal-Use Software (Subtopic 350-40): Targeted Improvements to the Accounting for Internal-Use Software, which modernizes the accounting for internal-use software by eliminating consideration of software development stages. Instead, capitalization of software costs would begin when (i) management has authorized and committed to funding the software project and (ii) it is probable that the project will be completed and the software will be used to perform its intended function. For IFC, the ASU will be effective for the quarter ending September 30, 2028. Early adoption is permitted. IFC is currently evaluating the impact of the ASU on its consolidated financial statements.
In November 2024, the FASB issued ASU 2024-03, Income Statement–Reporting Comprehensive Income–Expense Disaggregation Disclosures (Subtopic 220-40): Disaggregation of Income Statement Expenses, which requires public business entities to disclose disaggregated information about certain applicable specified natural expense categories (i.e., employee compensation, depreciation, intangible asset amortization). For IFC, the ASU will be effective for the annual period ending June 30, 2028 and for interim periods thereafter. Early adoption is permitted. IFC is currently evaluating the impact of the ASU on its consolidated financial statements.
| | | | | | | | |
| INTERNATIONAL FINANCE CORPORATION | Page 81 |
| | | | | | | | |
NOTES TO CONSOLIDATED FINANCIAL STATEMENTS |
NOTE B – RELATED PARTY TRANSACTIONS
IFC transacts with related parties including by receiving loans, investment intermediation services, participating in shared service arrangements, as well as through cost sharing of IBRD’s sponsored pension and other post-retirement plans.
IFC's receivables from (payables to) its related parties are presented in the following table:
| | | | | | | | | | | | | | | | | | | | | | | | | | | | | | | | | | | | | | | | | | | | | | | |
Table B1: IFC’s receivables from (payables to) related parties |
| June 30, 2026 | | June 30, 2025 |
(US$ in millions) | IBRD | | IDA | | MIGA | | Total | | IBRD | | IDA | | MIGA | | Total |
Services and Support Receivables | $ | 19 | | | $ | — | | | $ | 4 | | | $ | 23 | | | $ | 64 | | | $ | — | | | $ | 1 | | | $ | 65 | |
IDA PSW – Local Currency Facility a | — | | | 69 | | | — | | | 69 | | | — | | | 70 | | | — | | | 70 | |
IDA PSW – Blended Finance Facility | — | | | (154) | | | — | | | (154) | | | — | | | (128) | | | — | | | (128) | |
Borrowings | — | | | (82) | | | — | | | (82) | | | — | | | (114) | | | — | | | (114) | |
Pension and Other Post-retirement Benefits | 984 | | | — | | | — | | | 984 | | | 859 | | | — | | | — | | | 859 | |
Post-retirement Contribution Reserve Fund (PCRF) | 474 | | | — | | | — | | | 474 | | | 502 | | | — | | | — | | | 502 | |
| $ | 1,477 | | | $ | (167) | | | $ | 4 | | | $ | 1,314 | | | $ | 1,425 | | | $ | (172) | | | $ | 1 | | | $ | 1,254 | |
_________ |
a Includes other payable of $10 million related to unsettled Local Currency Facility trades that is included in Payables and other liabilities on the consolidated balance sheets as of June 30, 2026. |
Services and Support Payments
IFC obtains certain administrative and overhead services from IBRD in those areas where common services can be efficiently provided by IBRD. This includes shared costs of the Boards of Governors and Directors, corporate and security services, and other services such as IT support services, and human resource shared services. IFC makes payments for these services to IBRD based on negotiated fees and chargebacks, and allocated charges. Expenses allocated to IFC for the year ended June 30, 2026 were $231 million ($216 million – year ended June 30, 2025; $205 million – year ended June 30, 2024). These expenses are included in Administrative expenses on the consolidated statements of operations. The associated net receivables or payables are included in the Receivables and other assets or Payables and other liabilities respectively on the consolidated balance sheets.
Fee Income from MIGA
Transactions with MIGA include marketing fees received for referral and due diligence services on jointly-developed guarantee projects. Fee income received from MIGA for the year ended June 30, 2026 was $3 million ($4 million – year ended June 30, 2025; $4 million – year ended June 30, 2024) and is included in Other Income on the consolidated statements of operations. The associated receivables are included in Receivables and other assets on the consolidated balance sheets.
IDA Private Sector Window (IDA-PSW)
The IDA-IFC-MIGA Private Sector Window (PSW) was created under IDA's Eighteenth Replenishment of Resources (IDA18) to mobilize private sector investment in IDA-eligible countries and IDA-eligible Fragile and Conflict-affected Situations (FCS). Under IDA's Twenty First Replenishment of Resources (IDA21), $3.2 billion has been allocated to the PSW, including $500 million capital set aside by IFC. During FY26, $564 million was approved under the IDA21 PSW envelope, including $92 million under IFC’s capital set-aside.
The PSW is deployed through facilities designed to target critical challenges faced by the private sector, leveraging IFC's business platform and instruments. Under the fee arrangement for the IDA-PSW, IDA receives fee income for transactions executed under this window and reimburses IFC for the related costs incurred in administering these transactions. Under the Blended Finance Facility, IDA offers synthetic equity investments, reported in Payables and other liabilities on IFC's consolidated balance sheets, and guarantees to help mitigate risks associated with IFC's Guarantee Programs in IDA-PSW eligible countries, reported as Other assets on IFC's consolidated balance sheets. As of June 30, 2026 and June 30, 2025, IFC committed $1.3 billion of guarantees. Under the Local Currency Facility, IDA offers currency swaps, reported in derivative assets and liabilities, and payables and other liabilities on IFC's consolidated balance sheets, to support IFC's local currency denominated loans.
Borrowings
In September 2014, IFC issued an amortizing, non-interest bearing promissory note, maturing September 15, 2039, to IDA in exchange for $1.2 billion with an effective interest rate of 1.84%. IFC has elected the Fair Value Option for the promissory note, which is included in the Borrowings at fair value on the consolidated balance sheets. IFC recognized interest expense of $2 million for the year ended June 30, 2026 ($3 million – year ended June 30, 2025, $4 million – year ended June 30, 2024).
IFC has a Local Currency Loan Facility Agreement with IBRD, which is capped at $300 million. As of June 30, 2026 and June 30, 2025, IFC had no borrowings outstanding under this uncommitted facility.
| | | | | | | | |
| INTERNATIONAL FINANCE CORPORATION | Page 82 |
| | | | | | | | |
NOTES TO CONSOLIDATED FINANCIAL STATEMENTS |
NOTE B – RELATED PARTY TRANSACTIONS (continued)
Pension and Other Post-retirement Benefits
IFC’s net share of prepaid costs for pension and other post-retirement benefit plans and investment income from PEBP assets is included in Receivables and other assets on the consolidated balance sheets. These will be realized over the lives of the plan participants.
Post-Retirement Contribution Reserve Fund (PCRF)
The PCRF was established to stabilize contributions made to the pension and post-retirement benefits plans. PCRF assets are recorded as Investments and included in Investments-Trading on IBRD's Balance Sheet. IFC's share of investments associated with the PCRF is reported in the Receivables and other assets on the consolidated balance sheets. IFC recognized an income of $16 million for the year ended June 30, 2026 (an income of $25 million – year ended June 30, 2025; $30 million – year ended June 30, 2024). IFC contributed $148 million to the PCRF during the year ended June 30, 2026 ($133 million – year ended June 30, 2025; $119 million – year ended June 30, 2024). In addition, in February 2026, IFC’s Board of Directors (the Board) approved the release of $192 million from the PCRF, which was returned by IBRD to IFC.
IFC-managed AMC Funds
IFC Equity Mobilization Department (AMC), invests third-party capital and IFC capital, enabling outside investors to invest alongside IFC in developing markets. As of June 30, 2026, AMC managed multiple funds (collectively referred to as the AMC Funds), in its capacity as GP /Manager of these funds, none of which require consolidation by IFC. A management fee is charged for the management services provided to the AMC funds. IFC’s commitment ownership interests in these AMC Funds are shown in the following table:
| | | | | |
Table B2: IFC’s commitment ownership interests in AMC Funds | |
AMC Funds | IFC’s commitment ownership interest % |
| |
IFC African, Latin American and Caribbean Fund, LP | 20% |
IFC Catalyst Funds a | 18% |
IFC Global Infrastructure Fund, LP | 17% |
IFC Financial Institutions Growth Fund, LP | 30% |
IFC Global Emerging Markets Fund of Funds b | 19% |
IFC Middle East and North Africa Fund, LP | 37% |
IFC Emerging Asia Fund, LP | 22% |
IFC GEMFOF 2 SMA, LP | —% |
IFC Emerging Markets Sustainability Fund of Funds, LP | —% |
TfL IFC Growth and Sustainability, LP | —% |
_________ | |
|
a The commitment ownership interest of 18% reflects IFC’s ownership interest taking into consideration the overall commitments for the IFC Catalyst Funds, which comprises IFC Catalyst Fund, LP, IFC Catalyst Fund (UK), LP and IFC Catalyst Fund (Japan), LP (collectively, IFC Catalyst Funds). IFC does not have a commitment ownership interest in either the IFC Catalyst Fund (UK), LP or the IFC Catalyst Fund (Japan), LP. |
b The commitment ownership interest of 19% reflects IFC’s ownership interest taking into consideration the current committed amounts for the IFC Global Emerging Markets Fund of Funds, which comprises IFC Global Emerging Markets Fund of Funds, LP and IFC Global Emerging Markets Fund of Funds (Japan Parallel), LP. IFC does not have a commitment ownership interest in the IFC Global Emerging Markets Fund of Funds (Japan Parallel), LP. |
As of June 30, 2026, IFC's investments as a limited partner in funds managed by AMC were $374 million ($434 million – June 30, 2025). These investments are classified within Equity investments on the consolidated balance sheets. $29 million of management fee income was recognized for the year ended June 30, 2026 ($29 million and $22 million – years ended June 30, 2025 and June 30, 2024 respectively) which is included in other income on the consolidated statements of operations.
The IFC Emerging Markets Sustainability Fund of Funds, LP (EMSF FoF) participates in IFC’s investment in private equity funds, secondaries, and co-investments in emerging markets. As of June 30, 2026, EMSF FoF's participation in IFC’s investment was measured at fair value of $51 million ($15 million – June 30, 2025). The corresponding liability to EMSF FoF for its share of investment was reported within Payables and other liabilities and the associated receivable from EMSF FoF was reported within Receivables and other assets on IFC's consolidated balance sheets.
| | | | | | | | |
| INTERNATIONAL FINANCE CORPORATION | Page 83 |
| | | | | | | | |
NOTES TO CONSOLIDATED FINANCIAL STATEMENTS |
NOTE C – LIQUID ASSET PORTFOLIO
Composition of Liquid Asset Portfolio
The composition of IFC’s net liquid asset portfolio included in the consolidated balance sheets is as follows:
| | | | | | | | | | | |
Table C1: Composition of net liquid asset portfolio | | | |
(US$ in millions) | June 30, 2026 | | June 30, 2025 |
Assets | | | |
Cash and due from banks a | 92 | | | 42 | |
Investments - Trading | 47,674 | | | 47,974 | |
Securities purchased under resale agreements and receivable for cash collateral pledged | 1,203 | | | 2,213 | |
Derivative assets | 423 | | | 89 | |
Receivables and other assets | | | |
Receivables from unsettled security trades | 1,161 | | | 711 | |
Accrued interest income on time deposits and securities | 287 | | | 301 | |
Accrued income on derivative instruments | 259 | | | 234 | |
Total assets | 51,099 | | | 51,564 | |
Liabilities | | | |
Securities sold under repurchase agreements and payable for cash collateral received b | 5,100 | | | 4,893 | |
Derivative liabilities | 176 | | | 885 | |
Payables and other liabilities | | | |
Payables for purchase of securities | 1,165 | | | 780 | |
| | | |
| | | |
| | | |
Accrued charges on derivative instruments | 257 | | | 222 | |
Total liabilities | 6,698 | | | 6,780 | |
Total net liquid asset portfolio | 44,401 | | | 44,784 | |
_________ |
a Represents cash and due from banks from the liquid asset portfolio and does not include cash and due from banks from other cash accounts of $351 million and $1,190 million as of June 30, 2026 and June 30, 2025, respectively. |
b The weighted average interest rate on IFC's securities sold under repurchase agreements was 3.9% and 4.8% as of June 30, 2026 and June 30, 2025, respectively. |
The liquid asset portfolio is primarily denominated in U.S. dollars. Investments in other currencies, net of the effect of associated derivative instruments that convert non-U.S. dollar securities into U.S. dollar securities, represent 1.1% of the portfolio as of June 30, 2026 (0.9% – June 30, 2025).
Income from liquid asset trading activities
Income from liquid asset trading activities, before allocated borrowing costs for the years ended June 30, 2026, June 30, 2025 and June 30, 2024 comprises:
| | | | | | | | | | | | | | | | | | | | | | | | | | | | | | | | | | |
Table C2: Income from liquid asset trading activities | | | | | | | | | | | | | | | | | | | | | | |
| | | | | | | | For the year ended June 30, |
(US$ in millions) | | | | | | | | | | | | | | | | | | 2026 | | 2025 | | 2024 |
Interest income | | | | | | | | | | | | | | | | | | $ | 1,649 | | | $ | 1,670 | | | $ | 1,753 | |
Net (losses) gains on asset-backed and mortgage-backed securities | | | | | | | | | | | | | | | | | | (33) | | | 10 | | | 25 | |
Net gains on other trading securities | | | | | | | | | | | | | | | | | | 349 | | | 618 | | | 613 | |
Net gains from trading activities (realized and unrealized) | | | | | | | | | | | | | | | | | | 316 | | | 628 | | | 638 | |
Total income from liquid asset trading activities | | | | | | | | | | | | | | | | | | $ | 1,965 | | | $ | 2,298 | | | $ | 2,391 | |
| | | | | | | | |
| INTERNATIONAL FINANCE CORPORATION | Page 84 |
| | | | | | | | |
NOTES TO CONSOLIDATED FINANCIAL STATEMENTS |
NOTE C – LIQUID ASSET PORTFOLIO (continued)
Effective July 1, 2025, IFC updated its policy to treat all time deposits as trading investments instead of classifying qualifying time deposits as cash equivalents. Accordingly, time deposits are now presented together with trading securities under “Investments – Trading” on the consolidated balance sheets. The annualized rate of return on the liquid asset portfolio, calculated as total income from the liquid asset activities divided by average balance (fair value) of total investments – trading, during the year ended June 30, 2026, was 4.0% (5.0% – year ended June 30, 2025; 5.9% – year ended June 30, 2024). The annualized rate of return, excluding time deposits, would be 5.4% during the year ended June 30, 2026 (6.7% during the year end June 30, 2025 and 8.0% during the year end June 30, 2024). After factoring in the impact of associated derivative instruments, the liquid asset portfolio generally reprices within one year.
IFC’s investments – trading comprises of the following:
| | | | | | | | | | | | | | | | | | | | | | | | | | | | | | | | | | | |
Table C3: Investments – Trading composition | | | | | | | |
| As of June 30, 2026 | | As of June 30, 2025 |
(US$ in millions) | Average balance (fair value)a | | Fair value | | Weighted average remaining maturity (years) | | Average balance (fair value)a | | Fair value | | Weighted average remaining maturity (years) |
Government obligations | $ | 23,341 | | | $ | 23,214 | | | 1.9 | | | $ | 22,939 | | | $ | 23,271 | | | 1.9 | |
Asset-backed securities | 8,650 | | | 6,710 | | | 9.9 | | | 6,875 | | 5,468 | | 12.6 | |
Corporate securities | 4,251 | | | 4,254 | | | 1.0 | | | 4,698 | | 4,972 | | 1.0 |
Time deposits | 13,458 | | | 13,496 | | | 0.1 | | 11,053 | | 14,263 | | 0.4 |
Total Investments – Trading | $ | 49,700 | | | $ | 47,674 | | | 2.4 | | | $ | 45,565 | | | $ | 47,974 | | | 2.6 | |
_________ |
a The average balance of time deposits is calculated based on monthly averages, while other investments are based on daily averages. |
The expected maturity of the asset-backed securities may be significantly shorter than the contractual maturity, as reported above, due to prepayment features.
| | | | | | | | |
| INTERNATIONAL FINANCE CORPORATION | Page 85 |
| | | | | | | | |
NOTES TO CONSOLIDATED FINANCIAL STATEMENTS |
NOTE D – INVESTMENTS
The carrying value of investments as of June 30, 2026 and June 30, 2025 comprises: | | | | | | | | | | | |
Table D1: Carrying value of investments | | | |
(US$ in millions) | June 30, 2026 | | June 30, 2025 |
Loans | | | |
Loans at amortized cost | $ | 47,621 | | | $ | 41,555 | |
Less: Reserve against losses on loans | (1,448) | | | (1,273) | |
Loans at amortized cost less reserve against lossesa | 46,173 | | | 40,282 | |
Loans accounted for at fair value under the Fair Value Optionb | | | |
(amortized cost $2,103 as of June 30, 2026, $1,985 as of June 30, 2025) | 2,061 | | | 1,947 | |
Total loans | 48,234 | | | 42,229 | |
Equity investments | | | |
| | | |
| | | |
| | | |
Equity investments accounted for at fair valuec | | | |
(cost $12,633 as of June 30, 2026, $11,419 as of June 30, 2025) | 13,485 | | | 11,777 | |
Total equity investments | 13,485 | | | 11,777 | |
Debt securities | | | |
Debt securities accounted for at fair value as available-for-sale | | | |
(amortized cost $347 as of June 30, 2026, $609 as of June 30, 2025) | 320 | | | 560 | |
Less: Reserve against losses on available-for sale debt securities | (7) | | | (16) | |
Debt securities, available-for-sale less reserve against losses | 313 | | | 544 | |
Debt securities accounted for at fair value under the Fair Value Option | | | |
(amortized cost $13,746 as of June 30, 2026, $12,856 as of June 30, 2025) | 13,783 | | | 12,970 | |
Total debt securities | 14,096 | | | 13,514 | |
Total carrying value of investments | $ | 75,815 | | | $ | 67,520 | |
_________ |
a Includes $886 million as of June 30, 2026 of loans at amortized cost, net of reserve for losses, that were transferred to consolidated securitization VIEs.
b Includes $7 million as of June 30, 2026 of loans accounted for under the Fair Value Option that were transferred to consolidated securitization VIEs.
c Includes $4 million and $5 million, respectively, as of June 30, 2026 and June 30, 2025 of equity investments primarily accounted for under the cost recovery method. As the recovery of invested capital is uncertain, the fair value measurement is not applicable to these investments.
| | | | | | | | |
| INTERNATIONAL FINANCE CORPORATION | Page 86 |
| | | | | | | | |
| NOTES TO CONSOLIDATED FINANCIAL STATEMENTS |
NOTE D – INVESTMENTS (continued)
The distribution of the investment portfolio by geographical region and by industry sector and a reconciliation of total disbursed portfolio to carrying value of investments is as follows:
| | | | | | | | | | | | | | | | | | | | | | | | | | | | | | | | | | | | | | | | | | | | | | | |
Table D2: Reconciliation of total disbursed portfolio to carrying value | | | | | | | | |
(US$ in millions) | June 30, 2026 | | June 30, 2025 |
| Loans | | Equity investments | | Debt securities | | Total | | Loans | | Equity investments | | Debt securities | | Total |
Africa | | | | | | | | | | | | | | | |
Manufacturing, agribusiness and services | $ | 3,662 | | | $ | 799 | | | $ | 342 | | | $ | 4,803 | | | $ | 3,683 | | | $ | 766 | | | $ | 263 | | | $ | 4,712 | |
Financial markets | 4,131 | | | 400 | | | 1,228 | | | 5,759 | | | 3,700 | | | 387 | | | 857 | | | 4,944 | |
Infrastructure and natural resources | 3,302 | | | 590 | | | 229 | | | 4,121 | | | 2,592 | | | 682 | | | 348 | | | 3,622 | |
Disruptive technologies and funds | 5 | | | 1,169 | | | 72 | | | 1,246 | | | 5 | | | 1,077 | | | 61 | | | 1,143 | |
Total Africa | 11,100 | | | 2,958 | | | 1,871 | | | 15,929 | | | 9,980 | | | 2,912 | | | 1,529 | | | 14,421 | |
Asia and the Pacific | | | | | | | | | | | | | | | |
Manufacturing, agribusiness and services | 4,075 | | | 1,263 | | | 1,349 | | | 6,687 | | | 3,803 | | | 1,088 | | | 1,521 | | | 6,412 | |
Financial markets | 7,029 | | | 974 | | | 2,587 | | | 10,590 | | | 6,606 | | | 795 | | | 2,516 | | | 9,917 | |
Infrastructure and natural resources | 1,464 | | | 473 | | | 1,194 | | | 3,131 | | | 1,527 | | | 343 | | | 1,273 | | | 3,143 | |
Disruptive technologies and funds | 17 | | | 1,975 | | | 27 | | | 2,019 | | | 8 | | | 1,697 | | | 26 | | | 1,731 | |
Total Asia and the Pacific | 12,585 | | | 4,685 | | | 5,157 | | | 22,427 | | | 11,944 | | | 3,923 | | | 5,336 | | | 21,203 | |
Europe, Latin America & the Caribbean | | | | | | | | | | | | | | | |
Manufacturing, agribusiness and services | 6,185 | | | 315 | | | 554 | | | 7,054 | | | 5,560 | | | 256 | | | 378 | | | 6,194 | |
Financial markets | 7,667 | | | 700 | | | 3,568 | | | 11,935 | | | 5,760 | | | 557 | | | 3,653 | | | 9,970 | |
Infrastructure and natural resources | 3,686 | | | 566 | | | 839 | | | 5,091 | | | 2,932 | | | 643 | | | 714 | | | 4,289 | |
Disruptive technologies and funds | 6 | | | 1,238 | | | 44 | | | 1,288 | | | 28 | | | 1,056 | | | 42 | | | 1,126 | |
Total Europe, Latin America & the Caribbean | 17,544 | | | 2,819 | | | 5,005 | | | 25,368 | | | 14,280 | | | 2,512 | | | 4,787 | | | 21,579 | |
Middle East and Central Asia | | | | | | | | | | | | | | | |
Manufacturing, agribusiness and services | 2,429 | | | 177 | | | 318 | | | 2,924 | | | 2,023 | | | 149 | | | 313 | | | 2,485 | |
Financial markets | 1,687 | | | 383 | | | 1,145 | | | 3,215 | | | 1,531 | | | 427 | | | 843 | | | 2,801 | |
Infrastructure and natural resources | 1,894 | | | 142 | | | — | | | 2,036 | | | 1,414 | | | 138 | | | — | | | 1,552 | |
Disruptive technologies and funds | 11 | | | 261 | | | — | | | 272 | | | 5 | | | 211 | | | — | | | 216 | |
Total Middle East and Central Asia | 6,021 | | | 963 | | | 1,463 | | | 8,447 | | | 4,973 | | | 925 | | | 1,156 | | | 7,054 | |
Other | | | | | | | | | | | | | | | |
Manufacturing, agribusiness and services | 615 | | | 26 | | | 225 | | | 866 | | | 573 | | | 26 | | | 266 | | | 865 | |
Financial markets | 1,622 | | | 575 | | | 337 | | | 2,534 | | | 1,395 | | | 523 | | | 340 | | | 2,258 | |
Infrastructure and natural resources | 412 | | | 65 | | | 3 | | | 480 | | | 549 | | | 17 | | | — | | | 566 | |
Disruptive technologies and funds | — | | | 564 | | | — | | | 564 | | | — | | | 603 | | | — | | | 603 | |
Total Other | 2,649 | | | 1,230 | | | 565 | | | 4,444 | | | 2,517 | | | 1,169 | | | 606 | | | 4,292 | |
Total disbursed investment portfolio | $ | 49,899 | | | $ | 12,655 | | | $ | 14,061 | | | $ | 76,615 | | | $ | 43,694 | | | $ | 11,441 | | | $ | 13,414 | | | $ | 68,549 | |
Reserve against losses on loans and debt securities | (1,448) | | | — | | | (7) | | | (1,455) | | | (1,273) | | | — | | | (16) | | | (1,289) | |
Unamortized deferred loan origination fees, net and other | (175) | | | — | | | — | | | (175) | | | (155) | | | — | | | — | | | (155) | |
Disbursed amounts allocated to equity related options reported separately in derivative assets | — | | | (18) | | | — | | | (18) | | | — | | | (18) | | | — | | | (18) | |
| | | | | | | | | | | | | | | |
Unrealized (losses) on equity investments held by consolidated VIEs | — | | | (4) | | | — | | | (4) | | | — | | | (4) | | | — | | | (4) | |
Unrealized gains on investments accounted for at fair value as available-for-sale | — | | | — | | | 5 | | | 5 | | | — | | | — | | | 1 | | | 1 | |
Unrealized (losses) gains on investments accounted for under the Fair Value Option | (42) | | | 852 | | | 37 | | | 847 | | | (37) | | | 358 | | | 115 | | | 436 | |
Carrying value of investments | $ | 48,234 | | | $ | 13,485 | | | $ | 14,096 | | | $ | 75,815 | | | $ | 42,229 | | | $ | 11,777 | | | $ | 13,514 | | | $ | 67,520 | |
| | | | | | | | |
| INTERNATIONAL FINANCE CORPORATION | Page 87 |
| | | | | | | | |
| NOTES TO CONSOLIDATED FINANCIAL STATEMENTS |
NOTE E – LOANS AND GUARANTEES
Loans
Income from loans and guarantees, including realized gains and losses on loans and associated derivatives, for the years ended June 30, 2026, June 30, 2025 and June 30, 2024 comprise the following:
| | | | | | | | | | | | | | | | | |
Table E1: Income from loans and guarantees | | | | | |
| For the year ended June 30, |
(US$ in millions) | 2026 | | 2025 | | 2024 |
Interest income | $ | 2,966 | | | $ | 3,071 | | | $ | 3,080 | |
Commitment fees | 52 | | | 52 | | | 44 | |
Guarantee fees | 137 | | | 135 | | | 119 | |
Recovery asset income, net | 109 | | | 112 | | | 4 | |
Other financial fees | 14 | | | 11 | | | 4 | |
Realized losses on loans, guarantees and associated derivatives, net | (9) | | | (8) | | | (47) | |
Income from loans and guarantees, including realized gains (losses) on loans and associated derivatives | $ | 3,269 | | | $ | 3,373 | | | $ | 3,204 | |
| | | | | |
|
The currency composition and weighted average contractual rate of the disbursed loan portfolio are summarized below:
| | | | | | | | | | | | | | | | | | | | | | | |
Table E2: Currency composition and weighted average contractual rate of the disbursed loan portfolio |
| As of and for the year ended |
| June 30, 2026 | | June 30, 2025 |
(US$ in millions, except for rates) | Amount | | Weighted average contractual rate (%) | | Amount | | Weighted average contractual rate (%) |
U.S. dollar | $ | 32,666 | | | 6.0 | % | | $ | 27,771 | | | 6.7 | % |
Euro | 8,362 | | | 4.8 | | | 7,790 | | | 4.2 | |
Brazilian real | 1,896 | | | 15.2 | | | 1,749 | | | 16.3 | |
Chinese renminbi | 1,653 | | | 3.2 | | | 1,760 | | | 3.5 | |
Colombian peso | 1,106 | | | 12.9 | | | 817 | | | 11.6 | |
| | | | | | | |
Other currencies | 4,216 | | | 10.2 | | | 3,807 | | | 8.5 | |
Total disbursed loan portfolio | $ | 49,899 | | | 6.5 | % | | $ | 43,694 | | | 6.7 | % |
After the effect of interest rate and currency swaps, IFC’s loans are principally denominated in variable rate U.S. dollars. IFC’s disbursed variable rate loans generally reprice within one year.
The principal amounts repayable on loans outstanding in all currencies for the next 5 years and thereafter are summarized below:
| | | | | | | | | | | | | | | | | | | | | | | | | | | | | | | | | | | | | | | | | |
Table E3: Loans maturity and interest rate structure as of June 30, 2026 |
(US$ in millions) | 2027 | | 2028 | | 2029 | | 2030 | | 2031 | | Thereafter | | Total |
Fixed rate loans | $ | 2,214 | | | $ | 1,523 | | | $ | 1,801 | | | $ | 1,067 | | | $ | 929 | | | $ | 2,092 | | | $ | 9,626 | |
Variable rate loans | 7,362 | | | 7,075 | | | 8,700 | | | 5,703 | | | 3,633 | | | 7,800 | | | 40,273 | |
Total disbursed loan portfolio | $ | 9,576 | | | $ | 8,598 | | | $ | 10,501 | | | $ | 6,770 | | | $ | 4,562 | | | $ | 9,892 | | | $ | 49,899 | |
| | | | | | | | | | | | | | | | | | | | | | | | | | | | | | | | | | | | | | | | | |
Table E3.1: Loans maturity and interest rate structure as of June 30, 2025 |
(US$ in millions) | 2026 | | 2027 | | 2028 | | 2029 | | 2030 | | Thereafter | | Total |
Fixed rate loans | $ | 2,422 | | | $ | 1,330 | | | $ | 1,207 | | | $ | 1,340 | | | $ | 796 | | | $ | 1,746 | | | $ | 8,841 | |
Variable rate loans | 5,596 | | | 6,384 | | | 5,973 | | | 5,802 | | | 4,047 | | | 7,051 | | | 34,853 | |
Total disbursed loan portfolio | $ | 8,018 | | | $ | 7,714 | | | $ | 7,180 | | | $ | 7,142 | | | $ | 4,843 | | | $ | 8,797 | | | $ | 43,694 | |
As of June 30, 2026, 19% of the disbursed loan portfolio are fixed rate loans (20% – June 30, 2025), while the remainder are at variable rates. As of June 30, 2026, the disbursed loan portfolio includes $106 million of loans serving as collateral under secured borrowing arrangements ($70 million – June 30, 2025).
| | | | | | | | |
| INTERNATIONAL FINANCE CORPORATION | Page 88 |
| | | | | | | | |
| NOTES TO CONSOLIDATED FINANCIAL STATEMENTS |
NOTE E – LOANS AND GUARANTEES (continued)
Reserve against losses on loans and provision for losses on loans
Reserve against losses on loans as of June 30, 2026 reflected credit risk assessments as of that date. The assessment of the level of reserve against losses carries a high degree of judgment.
Changes in the reserve against losses on loans disbursed and loans committed but not disbursed for the years ended June 30, 2026, June 30, 2025 and June 30, 2024, as well as the related loans at amortized cost evaluated for impairment individually (individual reserve) and on a pool basis (portfolio reserve) are summarized below:
| | | | | | | | | | | | | | | | | | | | | | | | | | | | | | | | | | | |
Table E4: Changes in the reserve against losses on loans disbursed and loans committed but not disbursed |
| For the year ended June 30, 2026 |
| Loans Disbursed | | Loans Committed but not Disbursed |
(US$ in millions) | Individual reserve | | Portfolio reserve | | Total reserve | | Individual reserve | | Portfolio reserve | | Total reserve |
Beginning balance | $ | 320 | | | $ | 953 | | | $ | 1,273 | | | $ | 2 | | | $ | 134 | | | $ | 136 | |
Provision for losses | 5 | | | 178 | | | 183 | | | 3 | | | 55 | | | 58 | |
Write-offs | (23) | | | — | | | (23) | | | — | | | — | | | — | |
Recoveries of previously written-off loans | 3 | | | — | | | 3 | | | — | | | — | | | — | |
Foreign currency transaction adjustments | 3 | | | 2 | | | 5 | | | — | | | (1) | | | (1) | |
Other adjustments a | 8 | | | (1) | | | 7 | | | — | | | — | | | — | |
Ending balance | $ | 316 | | | $ | 1,132 | | | $ | 1,448 | | | $ | 5 | | | $ | 188 | | | $ | 193 | |
Total disbursed loans as of June 30, 2026 | $ | 1,135 | | | $ | 46,661 | | | $ | 47,796 | | | | | | | |
Loans committed but not disbursed as of June 30, 2026 | | | | | | | $ | 47 | | | $ | 8,237 | | | $ | 8,284 | |
Unamortized deferred loan origination fees, net and other | | | | | (175) | | | | | | | |
Loans at amortized cost | | | | | $ | 47,621 | | | | | | | |
___________ | | | | | | | | | | | |
a Other adjustments comprise reserve against interest capitalized. |
| | | | | | | | | | | | | | | | | | | | | | | | | | | | | | | | | | | |
Table E4.1: | | | | | | | | | | | |
| For the year ended June 30, 2025 |
| Loans Disbursed | | Loans Committed but not Disbursed |
(US$ in millions) | Individual reserve | | Portfolio reserve | | Total reserve | | Individual reserve | | Portfolio reserve | | Total reserve |
Beginning balance | $ | 280 | | | $ | 801 | | | $ | 1,081 | | | $ | — | | | $ | 188 | | | $ | 188 | |
Provision (release of provision) for losses | 17 | | | 74 | | | 91 | | | 2 | | | (85) | | | (83) | |
Write-offs | (40) | | | — | | | (40) | | | — | | | — | | | — | |
Recoveries of previously written-off loans | 40 | | | — | | | 40 | | | — | | | — | | | — | |
Foreign currency transaction adjustments | 6 | | | 17 | | | 23 | | | — | | | 3 | | | 3 | |
Other adjustments a | 17 | | | 61 | | | 78 | | | — | | | 28 | | | 28 | |
Ending balance | $ | 320 | | | $ | 953 | | | $ | 1,273 | | | $ | 2 | | | $ | 134 | | | $ | 136 | |
Total disbursed loans as of June 30, 2025 | $ | 1,465 | | | $ | 40,245 | | | $ | 41,710 | | | | | | | |
Loans committed but not disbursed as of June 30, 2025 | | | | | | | $ | 35 | | | $ | 7,854 | | | $ | 7,889 | |
Unamortized deferred loan origination fees, net and other | | | | | $ | (155) | | | | | | | |
Loans at amortized cost | | | | | $ | 41,555 | | | | | | | |
___________ | | | | | | | | | | | |
a Other adjustments include items such as a reserve against interest capitalized and a one-time cumulative adjustment due to the separate accounting of freestanding credit enhancements as recovery assets, which includes adjustments to individual and portfolio reserve for loans disbursed amounting to $1 million and $62 million, respectively, and $29 million to portfolio reserve for loans committed but not disbursed. |
| | | | | | | | |
| INTERNATIONAL FINANCE CORPORATION | Page 89 |
| | | | | | | | |
| NOTES TO CONSOLIDATED FINANCIAL STATEMENTS |
NOTE E – LOANS AND GUARANTEES (continued)
| | | | | | | | | | | | | | | | | | | | | | | | | | | | | | | | | | | |
Table E4.2: | | | | | | | | | | | |
| For the year ended June 30, 2024 |
| Loans Disbursed | | Loans Committed but not Disbursed |
(US$ in millions) | Individual reserve | | Portfolio reserve | | Total reserve | | Individual reserve | | Portfolio reserve | | Total reserve |
Beginning balance | $ | 366 | | | $ | 843 | | | $ | 1,209 | | | $ | 1 | | | $ | 169 | | | $ | 170 | |
Provision (release of provision) for losses | 5 | | | (26) | | | (21) | | | (1) | | | 20 | | | 19 | |
Write-offs | (95) | | | — | | | (95) | | | — | | | — | | | — | |
Recoveries of previously written-off loans | 4 | | | — | | | 4 | | | — | | | — | | | — | |
Foreign currency transaction adjustments | (1) | | | (10) | | | (11) | | | — | | | (1) | | | (1) | |
Other adjustments a | 1 | | | (6) | | | (5) | | | — | | | — | | | — | |
Ending balance | $ | 280 | | | $ | 801 | | | $ | 1,081 | | | $ | — | | | $ | 188 | | | $ | 188 | |
Total disbursed loans as of June 30, 2024 | $ | 1,106 | | | $ | 34,769 | | | $ | 35,875 | | | | | | | |
Loans committed but not disbursed as of June 30, 2024 | | | | | | | $ | 49 | | | $ | 8,678 | | | $ | 8,727 | |
Unamortized deferred loan origination fees, net and other | | | | | $ | (146) | | | | | | | |
Loans at amortized cost | | | | | $ | 35,729 | | | | | | | |
___________ | | | | | | | | | | | |
a Other adjustments comprise reserve against interest capitalized. | | | | | | | | | | | |
Reserve for losses and provision for losses on off-balance sheet guarantee exposures and other receivables
Changes in the reserve against losses (liability) on off-balance sheet guarantee exposures for the years ended June 30, 2026, June 30, 2025 and June 30, 2024 are summarized below:
| | | | | | | | | | | | | | | | | | | | | | | | | | | | | | | | | | | |
Table E5: Changes in the reserve against losses on off-balance sheet guarantees exposures and other receivables |
| For the year ended June 30, |
| 2026 | | 2025 | | 2024 |
(US$ in millions) | Outstanding Guarantees a | | Issued Guarantees a | | Outstanding Guarantees a | | Issued Guarantees a | | Outstanding Guarantees a | | Issued Guarantees a |
Beginning balance | $ | 35 | | | $ | 62 | | | $ | 19 | | | $ | 17 | | | $ | 15 | | | $ | 13 | |
Provision for losses on off-balance sheet credit exposure | 16 | | | 51 | | | 8 | | | 39 | | | 6 | | | 5 | |
Guarantee claims paid | (2) | | | — | | | — | | | — | | | — | | | — | |
Foreign currency transaction adjustments | — | | | 1 | | | 1 | | | 1 | | | (2) | | | (1) | |
Other adjustments b | — | | | — | | | 7 | | | 5 | | | — | | | — | |
Ending balance | $ | 49 | | | $ | 114 | | | $ | 35 | | | $ | 62 | | | $ | 19 | | | $ | 17 | |
___________ | | | | | | | | | | | |
a Guarantees are considered issued when IFC commits to the guarantee obligation. Guarantees are considered outstanding when the underlying financial obligation of the client is incurred. |
b. Other adjustments for the year ended June 30, 2025 include a one-time cumulative adjustment due to the separate accounting of freestanding credit enhancements as recovery assets of $6 million for outstanding guarantees and $5 million for issued guarantees. |
Reserve against losses on other receivables was $1 million as of June 30, 2026 ($1 million as of June 30, 2025). The outstanding balance of other receivables was $12 million and $14 million as of June 30, 2026 and June 30, 2025, respectively.
Accrued Interest
The accrued interest balances were $759 million and $686 million, as of June 30, 2026 and June 30, 2025 respectively, and are reported within receivables and other assets on the consolidated balance sheets. Accrued interest receivable is excluded from the amortized cost basis for disclosure purposes.
Accrued interest is written off by reversing interest income during the year the financial asset is moved from an accrual to a nonaccrual status. The amount of accrued interest receivables written off is $15 million and $7 million for the years ended June 30, 2026 and June 30, 2025, respectively.
| | | | | | | | |
| INTERNATIONAL FINANCE CORPORATION | Page 90 |
| | | | | | | | |
| NOTES TO CONSOLIDATED FINANCIAL STATEMENTS |
NOTE E – LOANS AND GUARANTEES (continued)
Nonaccruing loans
Loans on which the accrual of interest has been discontinued amounted to $789 million as of June 30, 2026 ($729 million – June 30, 2025). The interest income on such loans for the years ended June 30, 2026, June 30, 2025 and June 30, 2024 is summarized as follows:
| | | | | | | | | | | | | | | | | |
Table E6: Interest income on Nonaccruing loans |
| For the year ended June 30, |
(US$ in millions) | 2026 | | 2025 | | 2024 |
Interest income not recognized on nonaccruing loans | $ | 133 | | | $ | 201 | | | $ | 103 | |
Interest income recognized on loans in nonaccrual status related to current and prior years, on cash basis | 56 | | | 36 | | | 44 | |
There were no loans in nonaccrual status without an individual reserve against losses as of June 30, 2026 and June 30, 2025.
The amortized cost of nonaccruing loans as of June 30, 2026 and June 30, 2025 is summarized by geographic region and industry sector as follows:
| | | | | | | | | | | | | | | | | | | | | | | | | | | | | |
Table E7: Nonaccruing loans |
| June 30, 2026 |
(US$ in millions) | Manufacturing, agribusiness and services | | Financial markets | | Infrastructure and natural resources | | Disruptive technologies and funds | | Total non-accruing loans at amortized cost a |
Africa | $ | 190 | | | $ | 1 | | | $ | 241 | | | $ | 16 | | | $ | 448 | |
Asia and the Pacific | 61 | | | 51 | | | 74 | | | 1 | | | 187 | |
Europe, Latin America and the Caribbean | 152 | | | 43 | | | 56 | | | 5 | | | 256 | |
Middle East and Central Asia | 12 | | | — | | | 4 | | | — | | | 16 | |
| | | | | | | | | |
Total nonaccruing loans b | $ | 415 | | | $ | 95 | | | $ | 375 | | | $ | 22 | | | $ | 907 | |
a Includes all components of amortized cost except unamortized fees. The related unamortized fees are considered insignificant. |
b Includes $118 million reported as debt securities and $74 million reported as loans under Fair Value Option on the Balance Sheets as of June 30, 2026 |
| | | | | | | | | | | | | | | | | | | | | | | | | | | | | |
Table E7.1: | | | | | | | | | |
| June 30, 2025 |
(US$ in millions) | Manufacturing, agribusiness and services | | Financial markets | | Infrastructure and natural resources | | Disruptive technologies and funds | | Total non-accruing loans at amortized cost a |
Africa | $ | 158 | | | $ | 1 | | | $ | 197 | | | $ | 14 | | | $ | 370 | |
Asia and the Pacific | 51 | | | 4 | | | 75 | | | 1 | | | 131 | |
Europe, Latin America and the Caribbean | 152 | | | 41 | | | 44 | | | 6 | | | 243 | |
Middle East and Central Asia | 90 | | | 8 | | | 29 | | | — | | | 127 | |
Total nonaccruing loans b | $ | 451 | | | $ | 54 | | | $ | 345 | | | $ | 21 | | | $ | 871 | |
_________ | | | | | | | | | |
a Includes all components of amortized cost except unamortized fees. The related unamortized fees are considered insignificant. |
b Includes $142 million reported as debt securities and $97 million reported as loans under the Fair Value Option on the Balance Sheets as of June 30, 2025. |
| | | | | | | | |
| INTERNATIONAL FINANCE CORPORATION | Page 91 |
| | | | | | | | |
| NOTES TO CONSOLIDATED FINANCIAL STATEMENTS |
NOTE E – LOANS AND GUARANTEES (continued)
Past due loans
IFC considers a loan past due when payments have not been made according to its contractual terms. An aging analysis, based on contractual terms, of IFC’s loans at amortized cost by geographic region and industry sector follows:
| | | | | | | | | | | | | | | | | | | | | | | | | | | | | | | | | | | |
Table E8: Aging analysis |
| June 30, 2026 |
(US$ in millions) | Current | | 1-30 Days past due | | 31-60 days past due | | 61-90 days past due | | Greater than 90 days past due | | Total loans |
Africa | | | | | | | | | | | |
Manufacturing, agribusiness and services | $ | 3,164 | | | $ | 172 | | | $ | 49 | | | $ | 35 | | | $ | 142 | | | $ | 3,562 | |
Financial markets | 3,724 | | | 139 | | | — | | | — | | | — | | | 3,863 | |
Infrastructure and natural resources | 2,669 | | | 321 | | | — | | | — | | | 89 | | | 3,079 | |
Disruptive technologies and funds | — | | | — | | | — | | | — | | | 4 | | | 4 | |
Total Africa | 9,557 | | | 632 | | | 49 | | | 35 | | | 235 | | | 10,508 | |
Asia and the Pacific | | | | | | | | | | | |
Manufacturing, agribusiness and services | 3,926 | | | 97 | | | — | | | — | | | 18 | | | 4,041 | |
Financial markets | 6,785 | | | 100 | | | — | | | — | | | 48 | | | 6,933 | |
Infrastructure and natural resources | 1,268 | | | 130 | | | — | | | — | | | 32 | | | 1,430 | |
| | | | | | | | | | | |
Total Asia and the Pacific | 11,979 | | | 327 | | | — | | | — | | | 98 | | | 12,404 | |
Europe, Latin America and the Caribbean | | | | | | | | | | | |
Manufacturing, agribusiness and services | 5,716 | | | 205 | | | 10 | | | 85 | | | 134 | | | 6,150 | |
Financial markets | 6,695 | | | — | | | 3 | | | — | | | 3 | | | 6,701 | |
Infrastructure and natural resources | 3,544 | | | — | | | — | | | — | | | 18 | | | 3,562 | |
| | | | | | | | | | | |
Total Europe, Latin America and the Caribbean | 15,955 | | | 205 | | | 13 | | | 85 | | | 155 | | | 16,413 | |
Middle East and Central Asia | | | | | | | | | | | |
Manufacturing, agribusiness and services | 2,239 | | | 124 | | | — | | | 47 | | | 12 | | | 2,422 | |
Financial markets | 1,601 | | | 5 | | | — | | | — | | | — | | | 1,606 | |
Infrastructure and natural resources | 1,660 | | | 130 | | | — | | | — | | | 4 | | | 1,794 | |
| | | | | | | | | | | |
Total Middle East and Central Asia | 5,500 | | | 259 | | | — | | | 47 | | | 16 | | | 5,822 | |
Other | | | | | | | | | | | |
Manufacturing, agribusiness and services | 614 | | | 2 | | | — | | | — | | | — | | | 616 | |
Financial markets | 1,621 | | | — | | | — | | | — | | | — | | | 1,621 | |
Infrastructure and natural resources | 412 | | | — | | | — | | | — | | | — | | | 412 | |
| | | | | | | | | | | |
Total Other | 2,647 | | | 2 | | | — | | | — | | | — | | | 2,649 | |
Total disbursed loans | $ | 45,638 | | | $ | 1,425 | | | $ | 62 | | | $ | 167 | | | $ | 504 | | | $ | 47,796 | |
Unamortized deferred loan origination fees, net and other | | | | | | | | | | (175) | |
| | | | | | | | | | | |
Loans at amortized cost | | | | | | | | | | | $ | 47,621 | |
| | | | | | | | |
| INTERNATIONAL FINANCE CORPORATION | Page 92 |
| | | | | | | | |
| NOTES TO CONSOLIDATED FINANCIAL STATEMENTS |
NOTE E – LOANS AND GUARANTEES (continued)
| | | | | | | | | | | | | | | | | | | | | | | | | | | | | | | | | | | |
Table E8.1: | | | | | | | | | | | |
| June 30, 2025 |
(US$ in millions) | Current | | 1-30 Days past due | | 31-60 days past due | | 61-90 days past due | | Greater than 90 days past due | | Total loans |
Africa | | | | | | | | | | | |
Manufacturing, agribusiness and services | $ | 3,329 | | | $ | 127 | | | $ | 1 | | | $ | 1 | | | $ | 106 | | | $ | 3,564 | |
Financial markets | 3,254 | | | 184 | | | — | | | — | | | — | | | 3,438 | |
Infrastructure and natural resources | 2,030 | | | 147 | | | 75 | | | — | | | 92 | | | 2,344 | |
Disruptive technologies and funds | — | | | — | | | — | | | — | | | 4 | | | 4 | |
Total Africa | 8,613 | | | 458 | | | 76 | | | 1 | | | 202 | | | 9,350 | |
Asia and the Pacific | | | | | | | | | | | |
Manufacturing, agribusiness and services | 3,712 | | | 23 | | | — | | | — | | | 23 | | | 3,758 | |
Financial markets | 6,458 | | | 15 | | | — | | | — | | | — | | | 6,473 | |
Infrastructure and natural resources | 1,456 | | | — | | | 30 | | | — | | | — | | | 1,486 | |
Disruptive technologies and funds | 1 | | | — | | | — | | | — | | | — | | | 1 | |
Total Asia and the Pacific | 11,627 | | | 38 | | | 30 | | | — | | | 23 | | | 11,718 | |
Europe, Latin America and the Caribbean | | | | | | | | | | | |
Manufacturing, agribusiness and services | 5,337 | | | 25 | | | 47 | | | 10 | | | 129 | | | 5,548 | |
Financial markets | 4,932 | | | 129 | | | — | | | — | | | 2 | | | 5,063 | |
Infrastructure and natural resources | 2,760 | | | — | | | — | | | — | | | 19 | | | 2,779 | |
Disruptive technologies and funds | 17 | | | — | | | — | | | — | | | — | | | 17 | |
Total Europe Latin America and the Caribbean | 13,046 | | | 154 | | | 47 | | | 10 | | | 150 | | | 13,407 | |
Middle East and Central Asia | | | | | | | | | | | |
Manufacturing, agribusiness and services | 1,887 | | | 115 | | | — | | | — | | | 12 | | | 2,014 | |
Financial markets | 1,344 | | | 67 | | | — | | | — | | | 2 | | | 1,413 | |
Infrastructure and natural resources | 1,213 | | | 50 | | | — | | | — | | | 30 | | | 1,293 | |
| | | | | | | | | | | |
Total Middle East and Central Asia | 4,444 | | | 232 | | | — | | | — | | | 44 | | | 4,720 | |
Other | | | | | | | | | | | |
Manufacturing, agribusiness and services | 571 | | | — | | | — | | | — | | | — | | | 571 | |
Financial markets | 1,395 | | | — | | | — | | | — | | | — | | | 1,395 | |
Infrastructure and natural resources | 549 | | | — | | | — | | | — | | | — | | | 549 | |
| | | | | | | | | | | |
Total Other | 2,515 | | | — | | | — | | | — | | | — | | | 2,515 | |
Total disbursed loans | $ | 40,245 | | | $ | 882 | | | $ | 153 | | | $ | 11 | | | $ | 419 | | | $ | 41,710 | |
Unamortized deferred loan origination fees, net and other | | | | | | | | | | (155) | |
| | | | | | | | | | | |
Loans at amortized cost | | | | | | | | | | | $ | 41,555 | |
There were no loans as of June 30, 2026 and June 30, 2025 that are 90 days or more past due and continue to accrue interest since management anticipates the collection of interest will occur in the near future.
| | | | | | | | |
| INTERNATIONAL FINANCE CORPORATION | Page 93 |
| | | | | | | | |
| NOTES TO CONSOLIDATED FINANCIAL STATEMENTS |
NOTE E – LOANS AND GUARANTEES (continued)
Loan Credit Quality Indicators
IFC utilizes a rating system to classify loans according to credit worthiness and risk. A description of each Credit Rating (CR) and categorization in terms of the attributes of the borrower, the business environment in which the borrower operates or the loan itself under the rating system follows:
| | | | | | | | | | | |
Table E9: Loan Credit Quality Indicators |
Credit Risk Rating | Indicative External Rating | Category | Description |
CR-1 | AAA, AA+, AA, AA- | Very Strong | An obligor rated CR-1 is the highest rating assigned by IFC. The obligor's ability to meet its financial obligations is very strong. |
CR-2 | A+, A, A- | Strong | An obligor rated CR-2 is slightly more susceptible to the negative effects of changes in circumstances and economic conditions than obligors rated CR-1. The obligor's ability to meet its financial obligations remains strong. |
CR-3 | BBB+ | Adequate | An obligor rated CR-3 exhibits an adequate financial profile, even though at a weaker level than "CR-1" and "CR-2". |
CR-4 | BBB | An obligor rated CR-4 exhibits an adequate financial profile. However, adverse economic conditions or changing circumstances are more likely to lead to a deterioration of the obligor’s ability to meet its financial obligations. |
CR-5 | BBB- | An obligor rated CR-5, as the lowest of the investment grade ratings, exhibits an adequate financial profile. However, adverse economic conditions and/or changing circumstances are more likely to lead to a weaker financial profile and a deterioration of the obligor’s ability to meet its financial obligations. |
CR-6 | BB+ | Moderate | An obligor rated CR-6, as the first non-investment grade rating, is less vulnerable to default than other non-investment obligors. |
CR-7 | BB | An obligor rated CR-7 can face major uncertainties. Exposure to negative business, financial, or economic conditions could lead to the obligor's insufficient financial profile and a deterioration of the obligor’s ability to meet its financial obligations. |
CR-8 | BB- | An obligor rated CR-8 faces major ongoing uncertainties. Exposure to negative business, financial, or economic conditions could lead to the obligor's insufficient financial profile and a deterioration of the obligor’s ability to meet its financial obligations. |
CR-9 | B+ | Weak | An obligor rated CR-9 is less vulnerable to default than obligors rated 'CR-10’ or ‘CR-11'. Significantly negative business, financial, or economic conditions will likely weaken the obligor's financial profile and ability to meet its financial obligations. |
CR-10 | B | An obligor rated CR-10 is more vulnerable to default than obligors rated 'CR-9’ but the obligor still has the capacity to meet its financial obligations. Negative business, financial, or economic conditions will likely weaken the obligor's financial profile and ability to meet its financial obligations. |
CR-11 | B- | An obligor rated CR-11 is more vulnerable to default than obligors rated 'CR-9’ or ‘CR-10’. The obligor still has the capacity to meet its obligations but slightly negative business, financial, or economic conditions are more likely to weaken the obligor's financial profile and ability to meet its financial obligations than a company rated CR-10. |
CR-12 | CCC+ | Very Weak/ Special Attention | An obligor rated CR-12 faces significant challenges. While such obligors will likely have some positive characteristics, these may be outweighed by large uncertainties or major exposures to adverse conditions. The obligor is dependent upon favorable business, financial, and economic conditions to meet its financial obligations. |
CR-13 | CCC | Very Weak/Substandard | An obligor rated CR-13 is currently vulnerable to default, and is dependent upon significantly favorable business, financial, and economic conditions to meet its financial obligations. In the event of negative business, financial, or economic conditions, the obligor is not likely to meet its financial obligations and rescheduling and/or restructuring is likely to be required. |
CR-14 | CCC- | Extremely Weak/Doubtful | An obligor rated CR-14 is highly vulnerable to default. It is highly likely that a rescheduling and/or restructuring are required without which a default under IFC’s accounting definition would ensue. In some cases, even though default has not occurred yet, cash flow may be insufficient to service debt in full. |
CR-15 | Worse than CCC- and D | Imminent Default /Default | An obligor rated CR-15 is currently extremely vulnerable to nonpayment and there are indications that the next payment will not be made before meeting IFC’s accounting definition of default. |
D | An obligor rated D is in payment default according to IFC’s definition of default. |
| | | | | | | | |
| INTERNATIONAL FINANCE CORPORATION | Page 94 |
| | | | | | | | |
| NOTES TO CONSOLIDATED FINANCIAL STATEMENTS |
NOTE E – LOANS AND GUARANTEES (continued)
The following tables present the loans disbursed by credit quality indicator based on risk rating and origination year as of June 30, 2026 and June 30, 2025, and gross write-offs for the years ended June 30, 2025 and June 30, 2026. The origination year is based on the commitment date that represents the date that the decision was made to extend credit and IFC entered into a legally binding agreement with the borrower. All subsequent loan disbursements, as well as loan modifications, extensions, and renewals for an associated loan commitment are reported based on the original commitment date:
| | | | | | | | | | | | | | | | | | | | | | | | | | | | | | | | | | | | | | | | | | | | | | | | | | | | | | | | | | | | | | | | | |
Table E10: Loans at amortized cost by credit quality indicator based on risk rating and origination year and gross write-offs |
(US$ in millions) | June 30, 2026 |
Loans at Amortized cost basis by Risk class | | Gross write-offs |
Originated during the year ended June 30, | Very Strong | | Strong | | Adequate | | Moderate | | Weak | | Very Weak/ Special Attention | | Very Weak/ Sub-standard | | Extremely Weak/ Doubtful | | Imminent Default/ Default | | Total Contracts | |
2026 | $ | — | | | $ | 187 | | | $ | 2,335 | | | $ | 3,711 | | | $ | 3,290 | | | $ | 127 | | | $ | 79 | | | $ | 10 | | | $ | — | | | $ | 9,739 | | | $ | — | |
2025 | — | | | 504 | | | 3,331 | | | 5,327 | | | 1,659 | | | 177 | | | 51 | | | 11 | | | 1 | | | 11,061 | | | — | |
2024 | — | | | 516 | | | 4,023 | | | 4,351 | | | 1,565 | | | 160 | | | 25 | | | 18 | | | 6 | | | 10,664 | | | 1 | |
2023 | — | | | 400 | | | 1,578 | | | 2,345 | | | 1,477 | | | 82 | | | 304 | | | 2 | | | 18 | | | 6,206 | | | — | |
2022 | — | | | — | | | 631 | | | 1,053 | | | 682 | | | 31 | | | 74 | | | 74 | | | 163 | | | 2,708 | | | 10 | |
Prior | 94 | | | 184 | | | 1,156 | | | 2,428 | | | 1,507 | | | 342 | | | 36 | | | 40 | | | 221 | | | 6,008 | | | 12 | |
Total | $ | 94 | | | $ | 1,791 | | | $ | 13,054 | | | $ | 19,215 | | | $ | 10,180 | | | $ | 919 | | | $ | 569 | | | $ | 155 | | | $ | 409 | | | $ | 46,386 | | | $ | 23 | |
Revolving Loans | — | | | — | | | — | | | 1,328 | | | 32 | | | — | | | — | | | — | | | 4 | | | 1,364 | | | — | |
Revolving contracts converted to Term contracts | — | | | — | | | — | | | 12 | | | — | | | — | | | — | | | — | | | 34 | | | 46 | | | — | |
Total disbursed loans | $ | 94 | | | $ | 1,791 | | | $ | 13,054 | | | $ | 20,555 | | | $ | 10,212 | | | $ | 919 | | | $ | 569 | | | $ | 155 | | | $ | 447 | | | $ | 47,796 | | | $ | 23 | |
Unamortized deferred loan origination fees, net and other | | | | | | | | | | | | (175) | | | |
Loans at amortized cost | | | | | | | | | | | | $ | 47,621 | | | |
| | | | | | | | | | | | | | | | | | | | | | | | | | | | | | | | | | | | | | | | | | | | | | | | | | | | | | | | | | | | | | | | | |
Table E10.1: | | | | | | | | | | | | | | | | | | | | | |
| June 30, 2025 |
(US$ in millions) | Loans at Amortized cost basis by Risk class | | Gross write-offs |
Originated during the year ended June 30, | Very Strong | | Strong | | Adequate | | Moderate | | Weak | | Very Weak/ Special Attention | | Very Weak/ Sub-standard | | Extremely Weak/ Doubtful | | Imminent Default/ Default | | Total Contracts | |
2025 | $ | — | | | $ | 391 | | | $ | 3,042 | | | $ | 3,721 | | | $ | 1,866 | | | $ | 221 | | | $ | 113 | | | $ | — | | | $ | — | | | $ | 9,354 | | | $ | — | |
2024 | — | | | 332 | | | 4,196 | | | 4,481 | | | 1,740 | | | 118 | | | 17 | | | 23 | | | 3 | | | 10,910 | | | — | |
2023 | — | | | 26 | | | 2,040 | | | 2,773 | | | 2,207 | | | 126 | | | 207 | | | 128 | | | 9 | | | 7,516 | | | — | |
2022 | — | | | 220 | | | 1,048 | | | 1,357 | | | 785 | | | 39 | | | 16 | | | 194 | | | 142 | | | 3,801 | | | — | |
2021 | — | | | — | | | 741 | | | 1,467 | | | 513 | | | 74 | | | 9 | | | 2 | | | 8 | | | 2,814 | | | — | |
Prior | 85 | | | 147 | | | 1,108 | | | 1,677 | | | 1,179 | | | 503 | | | 236 | | | 233 | | | 334 | | | 5,502 | | | 35 | |
Total | $ | 85 | | | $ | 1,116 | | | $ | 12,175 | | | $ | 15,476 | | | $ | 8,290 | | | $ | 1,081 | | | $ | 598 | | | $ | 580 | | | $ | 496 | | | $ | 39,897 | | | $ | 35 | |
Revolving Loans | — | | | — | | | — | | | 1,686 | | | 72 | | | — | | | — | | | — | | | 4 | | | 1,762 | | | 5 | |
Revolving contracts converted to Term contracts | — | | | — | | | 17 | | | — | | | 34 | | | — | | | — | | | — | | | — | | | 51 | | | — | |
Total disbursed loans | $ | 85 | | | $ | 1,116 | | | $ | 12,192 | | | $ | 17,162 | | | $ | 8,396 | | | $ | 1,081 | | | $ | 598 | | | $ | 580 | | | $ | 500 | | | $ | 41,710 | | | $ | 40 | |
Unamortized deferred loan origination fees, net and other | | | | | | | | | | | | (155) | | | |
Loans at amortized cost | | | | | | | | | | | | | | $ | 41,555 | | | |
| | | | | | | | |
| INTERNATIONAL FINANCE CORPORATION | Page 95 |
| | | | | | | | |
| NOTES TO CONSOLIDATED FINANCIAL STATEMENTS |
NOTE E – LOANS AND GUARANTEES (continued)
Following is a summary of IFC’s loans at amortized cost by credit quality indicator, geographic region, and industry sector, as of June 30, 2026 and June 30, 2025 :
| | | | | | | | | | | | | | | | | | | | | | | | | | | | | | | | | | | | | | | | | | | | | | | | | | | | | | | | | | | |
Table E11: Loans at amortized cost by credit quality indicator by geographic region |
| June 30, 2026 |
(US$ in millions) | Very Strong | | Strong | | Adequate | | Moderate | | Weak | | Very Weak/ Special Attention | | Very Weak/ Sub-standard | | Extremely Weak/ Doubtful | | Imminent Default/ Default | | Total |
Geographic Region | | | | | | | | | | | | | | | | | | | |
Africa | $ | — | | | $ | 171 | | | $ | 1,472 | | | $ | 3,836 | | | $ | 3,879 | | | $ | 569 | | | $ | 305 | | | $ | 40 | | | $ | 236 | | | $ | 10,508 | |
Asia and the Pacific | — | | | 477 | | | 5,570 | | | 3,968 | | | 2,162 | | | 105 | | | 10 | | | 14 | | | 98 | | | 12,404 | |
Europe, Latin America and the Caribbean | — | | | 576 | | | 4,782 | | | 8,213 | | | 2,216 | | | 211 | | | 228 | | | 90 | | | 97 | | | 16,413 | |
Middle East and Central Asia | — | | | 14 | | | 727 | | | 3,130 | | | 1,864 | | | 34 | | | 26 | | | 11 | | | 16 | | | 5,822 | |
Other | 94 | | | 553 | | | 503 | | | 1,408 | | | 91 | | | — | | | — | | | — | | | — | | | 2,649 | |
Total disbursed loans | $ | 94 | | | $ | 1,791 | | | $ | 13,054 | | | $ | 20,555 | | | $ | 10,212 | | | $ | 919 | | | $ | 569 | | | $ | 155 | | | $ | 447 | | | $ | 47,796 | |
Unamortized deferred loan origination fees, net and other | | | | | | | | | | | | (175) | |
Loans at amortized cost | | | | | | | | | | | | | | | | | | $ | 47,621 | |
| | | | | | | | | | | | | | | | | | | | | | | | | | | | | | | | | | | | | | | | | | | | | | | | | | | | | | | | | | | |
Table E11.1: | | | | | | | | | | | | | | | | | | | |
| June 30, 2025 |
(US$ in millions) | Very Strong | | Strong | | Adequate | | Moderate | | Weak | | Very Weak/ Special Attention | | Very Weak/ Sub-standard | | Extremely Weak/ Doubtful | | Imminent Default/ Default | | Total |
Geographic Region | | | | | | | | | | | | | | | | | | | |
Africa | $ | — | | | $ | 162 | | | $ | 898 | | | $ | 3,542 | | | $ | 3,428 | | | $ | 675 | | | $ | 185 | | | $ | 279 | | | $ | 181 | | | $ | 9,350 | |
Asia and the Pacific | — | | | 676 | | | 4,851 | | | 3,991 | | | 2,127 | | | 9 | | | 4 | | | 6 | | | 54 | | | 11,718 | |
Europe, Latin America and the Caribbean | — | | | 156 | | | 4,956 | | | 6,024 | | | 1,383 | | | 175 | | | 367 | | | 202 | | | 144 | | | 13,407 | |
Middle East and Central Asia | — | | | 18 | | | 331 | | | 2,436 | | | 1,457 | | | 222 | | | 42 | | | 93 | | | 121 | | | 4,720 | |
Other | 85 | | | 104 | | | 1,156 | | | 1,169 | | | 1 | | | — | | | — | | | — | | | — | | | 2,515 | |
Total disbursed loans | $ | 85 | | | $ | 1,116 | | | $ | 12,192 | | | $ | 17,162 | | | $ | 8,396 | | | $ | 1,081 | | | $ | 598 | | | $ | 580 | | | $ | 500 | | | $ | 41,710 | |
Unamortized deferred loan origination fees, net and other | | | | | | | | | | | | (155) | |
Loans at amortized cost | | | | | | | | | | | | | | | | | | $ | 41,555 | |
| | | | | | | | |
| INTERNATIONAL FINANCE CORPORATION | Page 96 |
| | | | | | | | |
| NOTES TO CONSOLIDATED FINANCIAL STATEMENTS |
NOTE E – LOANS AND GUARANTEES (continued)
| | | | | | | | | | | | | | | | | | | | | | | | | | | | | | | | | | | | | | | | | | | | | | | | | | | | | | | | | | | |
Table E12: Loans at amortized cost by credit quality indicator by Industry sector |
| June 30, 2026 |
(US$ in millions) | Very Strong | | Strong | | Adequate | | Moderate | | Weak | | Very Weak/ Special Attention | | Very Weak/ Substandard | | Extremely Weak/ Doubtful | | Imminent Default/ Default | | Total |
Industry Sector | | | | | | | | | | | | | | | | | | | |
Manufacturing, agribusiness and services | $ | 94 | | | $ | 701 | | | $ | 5,295 | | | $ | 6,628 | | | $ | 3,145 | | | $ | 304 | | | $ | 285 | | | $ | 107 | | | $ | 232 | | | $ | 16,791 | |
Financial markets | — | | | 1,000 | | | 5,443 | | | 10,228 | | | 3,742 | | | 205 | | | 41 | | | 11 | | | 54 | | | 20,724 | |
Infrastructure and natural resources | — | | | 90 | | | 2,316 | | | 3,699 | | | 3,325 | | | 410 | | | 243 | | | 37 | | | 157 | | | 10,277 | |
Disruptive technologies and funds | — | | | — | | | — | | | — | | | — | | | — | | | — | | | — | | | 4 | | | 4 | |
Total disbursed loans | $ | 94 | | | $ | 1,791 | | | $ | 13,054 | | | $ | 20,555 | | | $ | 10,212 | | | $ | 919 | | | $ | 569 | | | $ | 155 | | | $ | 447 | | | $ | 47,796 | |
Unamortized deferred loan origination fees, net and other | | | | | | | | | | | | (175) | |
Loans at amortized cost | | | | | | | | | | | | | | | | | | $ | 47,621 | |
| | | | | | | | | | | | | | | | | | | | | | | | | | | | | | | | | | | | | | | | | | | | | | | | | | | | | | | | | | | |
Table E12.1: | | | | | | | | | | | | | | | | | | | |
| June 30, 2025 |
(US$ in millions) | Very Strong | | Strong | | Adequate | | Moderate | | Weak | | Very Weak/ Special Attention | | Very Weak/ Substandard | | Extremely Weak/ Doubtful | | Imminent Default/ Default | | Total |
Industry Sector | | | | | | | | | | | | | | | | | | | |
Manufacturing, agribusiness and services | $ | 85 | | | $ | 622 | | | $ | 4,691 | | | $ | 6,427 | | | $ | 2,472 | | | $ | 315 | | | $ | 352 | | | $ | 186 | | | $ | 305 | | | $ | 15,455 | |
Financial markets | — | | | 451 | | | 5,245 | | | 7,875 | | | 4,027 | | | 130 | | | 23 | | | 24 | | | 7 | | | 17,782 | |
Infrastructure and natural resources | — | | | 43 | | | 2,256 | | | 2,860 | | | 1,896 | | | 636 | | | 206 | | | 370 | | | 184 | | | 8,451 | |
Disruptive technologies and funds | — | | | — | | | — | | | — | | | 1 | | | — | | | 17 | | | — | | | 4 | | | 22 | |
Total disbursed loans | $ | 85 | | | $ | 1,116 | | | $ | 12,192 | | | $ | 17,162 | | | $ | 8,396 | | | $ | 1,081 | | | $ | 598 | | | $ | 580 | | | $ | 500 | | | $ | 41,710 | |
Unamortized deferred loan origination fees, net and other | | | | | | | | | | | | (155) | |
Loans at amortized cost | | | | | | | | | | | | | | | | | | $ | 41,555 | |
Modifications for Borrowers Experiencing Financial Difficulty
Loans are modified through changes in interest rates, repayment schedules, and maturity dates, in addition to reductions of loan principal and waiver of accrued interest.
Modifications for borrowers experiencing financial difficulty disclosures do not include loan modifications and the effects related to suspension and standstill agreements where principal and interest payments are temporarily suspended. During the year ended June 30, 2026, the amortized cost of these loans amounted to $8 million ($9 million – year ended June 30, 2025 and $71 million - June 30, 2024).
| | | | | | | | |
| INTERNATIONAL FINANCE CORPORATION | Page 97 |
| | | | | | | | |
| NOTES TO CONSOLIDATED FINANCIAL STATEMENTS |
NOTE E – LOANS AND GUARANTEES (continued)
For loans at amortized cost, the following tables present information related to modifications for borrowers experiencing financial difficulty, per major modification types (including interest rate reduction, other-than-insignificant payment delay, principal forgiveness, and term extension or a combination of these modifications), by geographic region and industry sector during the years ended June 30, 2026, June 30, 2025 and June 30, 2024.
| | | | | | | | | | | | | | | | | | | | | | | | | | | | | | | | | | | | | | | | | |
Table E13: Modifications for borrowers experiencing financial difficulty |
| For the year ended June 30, 2026 |
(US$ in millions) | Interest Rate Reduction, Term Extension and Payment Delay | | Payment Delay | | Principal Forgiveness | | Term Extension and Payment Delay | | Total Loan Modification a | | % of total loans | | Total loans by region and industry |
Africa | | | | | | | | | | | | | |
Manufacturing, agribusiness and services | $ | — | | | $ | 20 | | | $ | — | | | $ | 93 | | | $ | 113 | | | 3.2 | % | | $ | 3,562 | |
| | | | | | | | | | | | | |
Infrastructure and natural resources | 87 | | | — | | | — | | | — | | | 87 | | | 2.8 | | | 3,079 | |
| | | | | | | | | | | | | |
Other Industry Sectors | | | | | | | | | | | | | 3,867 | |
Total Africa | 87 | | | 20 | | | — | | | 93 | | | 200 | | | 1.9 | | | 10,508 | |
Asia and the Pacific | | | | | | | | | | | | | |
Manufacturing, agribusiness and services | — | | | — | | | 1 | | | — | | | 1 | | | — | | | 4,041 | |
| | | | | | | | | | | | | |
| | | | | | | | | | | | | |
| | | | | | | | | | | | | |
Other Industry Sectors | | | | | | | | | | | | | 8,363 | |
Total Asia and the Pacific | — | | | — | | | 1 | | | — | | | 1 | | | — | | | 12,404 | |
| | | | | | | | | | | | | |
| | | | | | | | | | | | | |
| | | | | | | | | | | | | |
| | | | | | | | | | | | | |
| | | | | | | | | | | | | |
| | | | | | | | | | | | | |
| | | | | | | | | | | | | |
| | | | | | | | | | | | | |
| | | | | | | | | | | | | |
| | | | | | | | | | | | | |
| | | | | | | | | | | | | |
| | | | | | | | | | | | | |
| | | | | | | | | | | | | |
| | | | | | | | | | | | | |
| | | | | | | | | | | | | |
| | | | | | | | | | | | | |
| | | | | | | | | | | | | |
| | | | | | | | | | | | | |
| | | | | | | | | | | | | |
| | | | | | | | | | | | | |
| | | | | | | | | | | | | |
Other Regions | | | | | | | | | | | | | 24,884 | |
Total | $ | 87 | | | $ | 20 | | | $ | 1 | | | $ | 93 | | | $ | 201 | | | 0.4 | % | | $ | 47,796 | |
___________ | | | | | | | | | | | | | |
a Includes all components of amortized cost except unamortized fees which are considered insignificant. |
| | | | | | | | | | | | | | | | | | | | | | | | | | | | | | | | | | | | | | | | | |
Table E13.1: | | | | | | | | | | | | | |
| For the year ended June 30, 2025 |
(US$ in millions) | Interest Rate Reduction, Principal Forgiveness and Payment Delay | | Payment Delay | | Term Extension | | Term Extension and Payment Delay | | Total Loan Modifications a | | % of total loans | | Total loans by region and industry |
Africa | | | | | | | | | | | | | |
Manufacturing, agribusiness and services | $ | — | | | $ | — | | | $ | 15 | | | $ | 12 | | | $ | 27 | | | 0.8 | % | | $ | 3,564 | |
| | | | | | | | | | | | | |
Infrastructure and natural resources | — | | | 9 | | | — | | | — | | | 9 | | | 0.4 | | | 2,344 | |
| | | | | | | | | | | | | |
Other Industry Sectors | | | | | | | | | | | | | 3,442 | |
Total Africa | — | | | 9 | | | 15 | | | 12 | | | 36 | | | 0.4 | | | 9,350 | |
| | | | | | | | | | | | | |
| | | | | | | | | | | | | |
| | | | | | | | | | | | | |
| | | | | | | | | | | | | |
| | | | | | | | | | | | | |
| | | | | | | | | | | | | |
Europe, Latin America and the Caribbean | | | | | | | | | | | | | |
Manufacturing, agribusiness and services | 17 | | | 11 | | | — | | | — | | | 28 | | | 0.5 | | | 5,548 | |
| | | | | | | | | | | | | |
Infrastructure and natural resources | — | | | 77 | | | — | | | — | | | 77 | | | 2.8 | | | 2,779 | |
| | | | | | | | | | | | | |
Other Industry Sectors | | | | | | | | | | | | | 5,080 | |
Total Europe, Latin America and the Caribbean | 17 | | | 88 | | | — | | | — | | | 105 | | | 0.8 | | | 13,407 | |
| | | | | | | | | | | | | |
| | | | | | | | | | | | | |
| | | | | | | | | | | | | |
| | | | | | | | | | | | | |
| | | | | | | | | | | | | |
| | | | | | | | | | | | | |
| | | | | | | | | | | | | |
| | | | | | | | | | | | | |
| | | | | | | | | | | | | |
| | | | | | | | | | | | | |
| | | | | | | | | | | | | |
| | | | | | | | | | | | | |
Other Regions | | | | | | | | | | | | | 18,953 | |
Total | $ | 17 | | | $ | 97 | | | $ | 15 | | | $ | 12 | | | $ | 141 | | | 0.3 | % | | $ | 41,710 | |
___________ | | | | | | | | | | | | | |
a Includes all components of amortized cost except unamortized fees which are considered insignificant. |
| | | | | | | | |
| INTERNATIONAL FINANCE CORPORATION | Page 98 |
| | | | | | | | |
| NOTES TO CONSOLIDATED FINANCIAL STATEMENTS |
NOTE E – LOANS AND GUARANTEES (continued)
| | | | | | | | | | | | | | | | | | | | | | | | | | | | | | | | | | | |
Table E13.2: | | | | | | | | | | | |
| For the year ended June 30, 2024 |
(US$ in millions) | Interest Rate Reduction, Term Extension and Payment Delay | | Payment Delay | | Term Extension and Payment Delay | | Total Loan Modifications a | | % of total loans | | Total loans by region and industry |
Africa | | | | | | | | | | | |
Manufacturing, agribusiness and services | $ | 3 | | | $ | 1 | | | $ | 13 | | | $ | 17 | | | 0.8 | % | | $ | 2,197 | |
| | | | | | | | | | | |
Infrastructure and natural resources | — | | | — | | | 29 | | | 29 | | | 1.5 | | | 1,994 | |
| | | | | | | | | | | |
Other Industry Sectors | | | | | | | | | | | 3,583 | |
Total Africa | 3 | | | 1 | | | 42 | | | 46 | | | 0.6 | | | 7,774 | |
Asia and the Pacific | | | | | | | | | | | |
Manufacturing, agribusiness and services | — | | | 11 | | | — | | | 11 | | | 0.4 | | | 2,942 | |
| | | | | | | | | | | |
Infrastructure and natural resources | — | | | — | | | 6 | | | 6 | | | 0.4 | | | 1,591 | |
| | | | | | | | | | | |
Other Industry Sectors | | | | | | | | | | | 5,400 | |
Total Asia and the Pacific | — | | | 11 | | | 6 | | | 17 | | | 0.2 | | | 9,933 | |
Europe, Latin America and the Caribbean | | | | | | | | | | | |
Manufacturing, agribusiness and services | 73 | | | 24 | | | — | | | 97 | | | 2.0 | | | 4,939 | |
Financial markets | — | | | — | | | 4 | | | 4 | | | 0.1 | | | 4,639 | |
Infrastructure and natural resources | 15 | | | 72 | | | 6 | | | 93 | | | 4.0 | | | 2,302 | |
| | | | | | | | | | | |
Other Industry Sectors | | | | | | | | | | | 17 | |
Total Europe, Latin America and the Caribbean | 88 | | | 96 | | | 10 | | | 194 | | | 1.6 | | | 11,897 | |
Middle East and Central Asia | | | | | | | | | | | |
| | | | | | | | | | | |
| | | | | | | | | | | |
Infrastructure and natural resources | — | | | 25 | | | 60 | | | 85 | | | 6.7 | | | 1,265 | |
| | | | | | | | | | | |
Other Industry Sectors | | | | | | | | | | | 3,132 | |
Total Middle East and Central Asia | — | | | 25 | | | 60 | | | 85 | | | 1.9 | | | 4,397 | |
| | | | | | | | | | | |
| | | | | | | | | | | |
| | | | | | | | | | | |
| | | | | | | | | | | |
| | | | | | | | | | | |
| | | | | | | | | | | |
Other Regions | | | | | | | | | | | 1,874 | |
Total | $ | 91 | | | $ | 133 | | | $ | 118 | | | $ | 342 | | | 1.0 | % | | $ | 35,875 | |
___________ | | | | | | | | | | | |
a Includes all components of amortized cost except unamortized fees which are considered insignificant. |
| | | | | | | | |
| INTERNATIONAL FINANCE CORPORATION | Page 99 |
| | | | | | | | |
| NOTES TO CONSOLIDATED FINANCIAL STATEMENTS |
NOTE E – LOANS AND GUARANTEES (continued)
The following tables summarize the financial effect of loan modifications for borrowers experiencing financial difficulty by geographic region and industry sector for the years ended June 30, 2026, June 30, 2025 and June 30, 2024.
| | | | | | | | | | | | | | | | | | | | | | | | | | | | | |
Table E14: Financial effect of loan modifications for borrowers experiencing financial difficulty |
| For the Year ended June 30, 2026 |
| Interest Rate Reduction | | Term Extension | | Principal Forgiveness | | Other than Insignificant Payment Delay |
(US$ in millions) | Weighted Average Interest Rate Reduction % | | Weighted Average Months Extended | | Sum of Principal Forgiven | | Amount Delayed | | Weighted Average Months Delayed |
Africa | | | | | | | | | |
Manufacturing, agribusiness and services | — | % | | 31 | | | $ | 4 | | | $ | 45 | | | 12 | |
| | | | | | | | | |
Infrastructure and natural resources | 1.2 | | 67 | | | — | | | 43 | | | 62 | |
| | | | | | | | | |
| | | | | | | | | |
Asia and the Pacific | | | | | | | | | |
Manufacturing, agribusiness and services | — | | | — | | | 17 | | | — | | | — | |
| | | | | | | | | |
| | | | | | | | | |
| | | | | | | | | |
| | | | | | | | | |
| | | | | | | | | |
| | | | | | | | | |
| | | | | | | | | |
| | | | | | | | | |
| | | | | | | | | |
| | | | | | | | | |
Middle East and Central Asia | | | | | | | | | |
| | | | | | | | | |
Financial markets | — | | | — | | | 10 | | | — | | | — | |
| | | | | | | | | |
| | | | | | | | | |
| | | | | | | | | |
| | | | | | | | | |
| | | | | | | | | |
| | | | | | | | | |
| | | | | | | | | |
| | | | | | | | | |
| | | | | | | | | |
| | | | | | | | | |
| | | | | | | | | | | | | | | | | | | | | | | | | | | | | |
Table E14.1: | | | | | | | | | |
| For the year ended June 30, 2025 |
| Interest Rate Reduction | | Term Extension | | Principal Forgiveness | | Other than Insignificant Payment Delay |
(US$ in millions) | Weighted Average Interest Rate Reduction % | | Weighted Average Months Extended | | Sum of Principal Forgiven | | Amount Delayed | | Weighted Average Months Delayed |
Africa | | | | | | | | | |
Manufacturing, agribusiness and services | — | % | | 26 | | | $ | 2 | | | $ | 4 | | | 15 | |
| | | | | | | | | |
Infrastructure and natural resources | — | | | — | | | — | | | 1 | | | 180 | |
| | | | | | | | | |
| | | | | | | | | |
Asia and the Pacific | | | | | | | | | |
Manufacturing, agribusiness and services | — | | | — | | | 2 | | | — | | | — | |
| | | | | | | | | |
| | | | | | | | | |
| | | | | | | | | |
| | | | | | | | | |
Europe, Latin America and the Caribbean | | | | | | | | | |
Manufacturing, agribusiness and services | 4.5 | | | 70 | | | — | | | 27 | | | 51 | |
Financial markets | — | | | — | | | 13 | | | — | | | — | |
Infrastructure and natural resources | — | | | — | | | — | | | 1 | | | 150 | |
| | | | | | | | | |
| | | | | | | | | |
Middle East and Central Asia | | | | | | | | | |
| | | | | | | | | |
Financial markets | — | | | — | | | 105 | | | — | | | — | |
| | | | | | | | | |
| | | | | | | | | |
| | | | | | | | | |
| | | | | | | | | |
| | | | | | | | | |
| | | | | | | | | |
| | | | | | | | | |
| | | | | | | | | |
| | | | | | | | | |
| | | | | | | | | |
| | | | | | | | |
| INTERNATIONAL FINANCE CORPORATION | Page 100 |
| | | | | | | | |
| NOTES TO CONSOLIDATED FINANCIAL STATEMENTS |
NOTE E – LOANS AND GUARANTEES (continued)
| | | | | | | | | | | | | | | | | | | | | | | | | | | | | |
Table E14.2: | | | | | | | | | |
| For the year ended June 30, 2024 |
| Interest Rate Reduction | | Term Extension | | Principal Forgiveness | | Other than Insignificant Payment Delay |
| Weighted Average Interest Rate Reduction % | | Weighted Average Months Extended | | Sum of Principal Forgiven | | Amount Delayed | | Weighted Average Months Delayed |
Africa | | | | | | | | | |
Manufacturing, agribusiness and services | 1.7 | % | | 64 | | | $ | 5 | | | $ | 39 | | | 44 | |
| | | | | | | | | |
Infrastructure and natural resources | — | | | 42 | | | 3 | | | 8 | | | 12 | |
| | | | | | | | | |
| | | | | | | | | |
Asia and the Pacific | | | | | | | | | |
Manufacturing, agribusiness and services | — | | | — | | | — | | | 8 | | | 6 | |
| | | | | | | | | |
Infrastructure and natural resources | — | | | 36 | | | — | | | 33 | | | 36 | |
| | | | | | | | | |
| | | | | | | | | |
Europe, Latin America and the Caribbean | | | | | | | | | |
Manufacturing, agribusiness and services | 8.4 | | | 91 | | | — | | | 106 | | | 26 | |
Financial markets | — | | | 12 | | | — | | | 4 | | | 12 | |
Infrastructure and natural resources | 2.4 | | | 152 | | | 15 | | | 16 | | | 177 | |
| | | | | | | | | |
| | | | | | | | | |
Middle East and Central Asia | | | | | | | | | |
| | | | | | | | | |
| | | | | | | | | |
Infrastructure and natural resources | — | | | 36 | | | — | | | 67 | | | 34 | |
| | | | | | | | | |
| | | | | | | | | |
| | | | | | | | | |
| | | | | | | | | |
| | | | | | | | | |
| | | | | | | | | |
| | | | | | | | | |
| | | | | | | | | |
| | | | | | | | | |
For loans at amortized cost, the following tables present an aging analysis of loan modifications made for borrowers experiencing financial difficulty made during the twelve months preceding June 30, 2026, June 30, 2025 and June 30, 2024 presented by geographic region and industry sector.
| | | | | | | | | | | | | | | | | | | | | | | | |
Table E15: Aging analysis of loan modifications for borrowers experiencing financial difficulty | |
| June 30, 2026 | |
(US$ in millions) | Current | | Up to 30 days past due | | | | | | | | Total Loans a | |
Africa | | | | | | | | | | | | |
Manufacturing, agribusiness and services | $ | 107 | | | $ | 6 | | | | | | | | | $ | 113 | | |
| | | | | | | | | | | | |
Infrastructure and natural resources | 87 | | | — | | | | | | | | | 87 | | |
| | | | | | | | | | | | |
Total Africa | 194 | | | 6 | | | | | | | | | 200 | | |
Asia and the Pacific | | | | | | | | | | | | |
Manufacturing, agribusiness and services | 1 | | | — | | | | | | | | | 1 | | |
| | | | | | | | | | | | |
| | | | | | | | | | | | |
| | | | | | | | | | | | |
Total Asia and the Pacific | 1 | | | — | | | | | | | | | 1 | | |
| | | | | | | | | | | | |
| | | | | | | | | | | | |
| | | | | | | | | | | | |
| | | | | | | | | | | | |
| | | | | | | | | | | | |
| | | | | | | | | | | | |
| | | | | | | | | | | | |
| | | | | | | | | | | | |
| | | | | | | | | | | | |
| | | | | | | | | | | | |
| | | | | | | | | | | | |
| | | | | | | | | | | | |
| | | | | | | | | | | | |
| | | | | | | | | | | | |
| | | | | | | | | | | | |
| | | | | | | | | | | | |
| | | | | | | | | | | | |
| | | | | | | | | | | | |
Total | $ | 195 | | | $ | 6 | | | | | | | | | $ | 201 | | |
___________ | | | | | | | | | | | | |
a Includes all components of amortized cost except unamortized fees which are considered insignificant. | | | |
| | | | | | | | |
| INTERNATIONAL FINANCE CORPORATION | Page 101 |
| | | | | | | | |
| NOTES TO CONSOLIDATED FINANCIAL STATEMENTS |
NOTE E – LOANS AND GUARANTEES (continued)
| | | | | | | | | | | | | | | | | | | |
Table E15.1: | | | | | | | | | | | |
| June 30, 2025 |
(US$ in millions) | Current | | | | | | | | | | Total Loans a |
Africa | | | | | | | | | | | |
Manufacturing, agribusiness and services | $ | 27 | | | | | | | | | | | $ | 27 | |
| | | | | | | | | | | |
Infrastructure and natural resources | 9 | | | | | | | | | | | 9 | |
| | | | | | | | | | | |
Total Africa | 36 | | | | | | | | | | | 36 | |
| | | | | | | | | | | |
| | | | | | | | | | | |
| | | | | | | | | | | |
| | | | | | | | | | | |
| | | | | | | | | | | |
| | | | | | | | | | | |
Europe, Latin America and the Caribbean | | | | | | | | | | | |
Manufacturing, agribusiness and services | 28 | | | | | | | | | | | 28 | |
Financial markets | — | | | | | | | | | | | — | |
Infrastructure and natural resources | 77 | | | | | | | | | | | 77 | |
| | | | | | | | | | | |
Total Europe, Latin America and the Caribbean | 105 | | | | | | | | | | | 105 | |
| | | | | | | | | | | |
| | | | | | | | | | | |
| | | | | | | | | | | |
| | | | | | | | | | | |
| | | | | | | | | | | |
| | | | | | | | | | | |
| | | | | | | | | | | |
| | | | | | | | | | | |
| | | | | | | | | | | |
| | | | | | | | | | | |
| | | | | | | | | | | |
| | | | | | | | | | | |
Total | $ | 141 | | | | | | | | | | | $ | 141 | |
_________ | | | | | | | | | | | |
a Includes all components of amortized cost except unamortized fees which are considered insignificant. |
| | | | | | | | | | | | | | | | | | | | | | | | | | | |
Table E15.2: | | | | | | | | | | | |
| June 30, 2024 |
(US$ in millions) | Current | | Up to 30 days past due | | | | | | Greater than 90 days past due | | Total Loans a |
Africa | | | | | | | | | | | |
Manufacturing, agribusiness and services | $ | 11 | | | $ | 3 | | | | | | | $ | 3 | | | $ | 17 | |
| | | | | | | | | | | |
Infrastructure and natural resources | 29 | | | — | | | | | | | — | | | 29 | |
| | | | | | | | | | | |
Total Africa | 40 | | | 3 | | | | | | | 3 | | | 46 | |
Asia and the Pacific | | | | | | | | | | | |
Manufacturing, agribusiness and services | — | | | 11 | | | | | | | — | | | 11 | |
| | | | | | | | | | | |
Infrastructure and natural resources | 6 | | | — | | | | | | | — | | | 6 | |
| | | | | | | | | | | |
Total Asia and the Pacific | 6 | | | 11 | | | | | | | — | | | 17 | |
Europe, Latin America and the Caribbean | | | | | | | | | | | |
Manufacturing, agribusiness and services | 73 | | | — | | | | | | | 24 | | | 97 | |
Financial markets | 4 | | | — | | | | | | | — | | | 4 | |
Infrastructure and natural resources | 93 | | | — | | | | | | | — | | | 93 | |
| | | | | | | | | | | |
Total Europe, Latin America and the Caribbean | 170 | | | — | | | | | | | 24 | | | 194 | |
Middle East and Central Asia | | | | | | | | | | | |
| | | | | | | | | | | |
| | | | | | | | | | | |
Infrastructure and natural resources | 61 | | | — | | | | | | | 24 | | | 85 | |
| | | | | | | | | | | |
Total Middle East and Central Asia | 61 | | | — | | | | | | | 24 | | | 85 | |
| | | | | | | | | | | |
| | | | | | | | | | | |
| | | | | | | | | | | |
| | | | | | | | | | | |
| | | | | | | | | | | |
| | | | | | | | | | | |
Total | $ | 277 | | | $ | 14 | | | | | | | $ | 51 | | | $ | 342 | |
_________ | | | | | | | | | | | |
a Includes all components of amortized cost except unamortized fees which are considered insignificant. |
| | | | | | | | |
| INTERNATIONAL FINANCE CORPORATION | Page 102 |
| | | | | | | | |
| NOTES TO CONSOLIDATED FINANCIAL STATEMENTS |
NOTE E – LOANS AND GUARANTEES (continued)
The following tables present loans that had a payment default during the years ended June 30, 2026, June 30, 2025 and June 30, 2024 after they had been modified to borrowers experiencing financial difficulty within the twelve months preceding the payment default date, by geographic region and industry sector. Payment default is defined as loans that are 60 or more days past due as of the respective balance sheet date.
Table E16: Loan modifications for borrowers experiencing financial difficulty that had payment default
| | | | | | | | | | | | | | | | | | | | | | | |
| For the year ended June 30, 2026 |
(US$ in millions) | Payment Delay | | Term Extension and Payment Delay | | | | | | Total Loan Modifications a | | |
Africa | | | | | | | | | | | |
Manufacturing, agribusiness and services | $ | 6 | | | $ | 4 | | | | | | | $ | 10 | | | |
| | | | | | | | | | | |
| | | | | | | | | | | |
| | | | | | | | | | | |
Total Africa | 6 | | | 4 | | | | | | | 10 | | | |
| | | | | | | | | | | |
| | | | | | | | | | | |
| | | | | | | | | | | |
| | | | | | | | | | | |
| | | | | | | | | | | |
| | | | | | | | | | | |
| | | | | | | | | | | |
| | | | | | | | | | | |
| | | | | | | | | | | |
| | | | | | | | | | | |
| | | | | | | | | | | |
| | | | | | | | | | | |
| | | | | | | | | | | |
| | | | | | | | | | | |
| | | | | | | | | | | |
| | | | | | | | | | | |
| | | | | | | | | | | |
| | | | | | | | | | | |
| | | | | | | | | | | |
| | | | | | | | | | | |
| | | | | | | | | | | |
| | | | | | | | | | | |
| | | | | | | | | | | |
| | | | | | | | | | | |
Total | $ | 6 | | | $ | 4 | | | | | | | $ | 10 | | | |
___________ | | | | | | | | | | | |
a Includes all components of amortized cost except unamortized fees which are considered insignificant | | |
| | | | | | | | | | | | | | | | | | | |
Table E16.1: | | | | | | | | | | | |
| | | | | For the year ended June 30, 2025 |
(US$ in millions) | | | | | Payment Delay | | Total Loan Modifications a | | | | |
| | | | | | | | | | | |
| | | | | | | | | | | |
| | | | | | | | | | | |
| | | | | | | | | | | |
| | | | | | | | | | | |
| | | | | | | | | | | |
Asia and the Pacific | | | | | | | | | | | |
Manufacturing, agribusiness and services | | | | | $ | 11 | | | $ | 11 | | | | | |
| | | | | | | | | | | |
| | | | | | | | | | | |
| | | | | | | | | | | |
Total Asia and the Pacific | | | | | 11 | | | 11 | | | | | |
| | | | | | | | | | | |
| | | | | | | | | | | |
| | | | | | | | | | | |
| | | | | | | | | | | |
| | | | | | | | | | | |
| | | | | | | | | | | |
| | | | | | | | | | | |
| | | | | | | | | | | |
| | | | | | | | | | | |
| | | | | | | | | | | |
| | | | | | | | | | | |
| | | | | | | | | | | |
| | | | | | | | | | | |
| | | | | | | | | | | |
| | | | | | | | | | | |
| | | | | | | | | | | |
| | | | | | | | | | | |
| | | | | | | | | | | |
Total | | | | | $ | 11 | | | $ | 11 | | | | | |
___________ | | | | | | | | | | | |
a Includes all components of amortized cost except unamortized fees which are considered insignificant. | | | | |
| | | | | | | | | | | | | | | | | | | | | |
Table E16.2: | | | | | | | | | |
| For the year ended June 30, 2024 |
(US$ in millions) | Interest Rate Reduction, Term Extension and Payment Delay | | Payment Delay | | Total Loan Modifications a | | | | |
Africa | | | | | | | | | |
Manufacturing, agribusiness and services | $ | 3 | | | $ | — | | | $ | 3 | | | | | |
| | | | | | | | | |
| | | | | | | | | |
| | | | | | | | | |
Total Africa | 3 | | | — | | | 3 | | | | | |
| | | | | | | | | |
| | | | | | | | | |
| | | | | | | | | |
| | | | | | | | | |
| | | | | | | | | |
| | | | | | | | | |
Europe, Latin America and the Caribbean | | | | | | | | | |
Manufacturing, agribusiness and services | — | | | 24 | | | 24 | | | | | |
| | | | | | | | | |
| | | | | | | | | |
| | | | | | | | | |
Total Europe, Latin America and the Caribbean | — | | | 24 | | | 24 | | | | | |
Middle East and Central Asia | | | | | | | | | |
| | | | | | | | | |
| | | | | | | | | |
Infrastructure and natural resources | — | | | 25 | | | 25 | | | | | |
| | | | | | | | | |
Total Middle East and Central Asia | — | | | 25 | | | 25 | | | | | |
| | | | | | | | | |
| | | | | | | | | |
| | | | | | | | | |
| | | | | | | | | |
| | | | | | | | | |
| | | | | | | | | |
Total | $ | 3 | | | $ | 49 | | | $ | 52 | | | | | |
___________ | | | | | | | | | |
a Includes all components of amortized cost except unamortized fees which are considered insignificant. | | | | |
| | | | | | | | |
| INTERNATIONAL FINANCE CORPORATION | Page 103 |
| | | | | | | | |
| NOTES TO CONSOLIDATED FINANCIAL STATEMENTS |
NOTE E – LOANS AND GUARANTEES (continued)
Collateral-Dependent Loans
A loan is considered collateral-dependent when the borrower is experiencing financial difficulty and repayment is expected to be provided substantially through the operation or sale of the collateral. The following tables summarize the amortized cost of collateral dependent loans by collateral type, geographic region and industry sector as of June 30, 2026 and June 30, 2025:
| | | | | | | | | | | | | | | | | | | | | | | | | | | | | | | | | | | |
Table E17: Collateral dependent loans a by Geographic region |
| June 30, 2026 | | June 30, 2025 |
(US$ in millions) | Property, Land and Equipment | | Others | | Total | | Property, Land and Equipment | | Others | | Total |
Geographic Region | | | | | | | | | | | |
Africa | $ | — | | | $ | 9 | | | $ | 9 | | | $ | 5 | | | — | | | $ | 5 | |
| | | | | | | | | | | |
Middle East and Central Asia | — | | | — | | | — | | | 10 | | | 15 | | | 25 | |
Europe, Latin America and the Caribbean | 3 | | | — | | | 3 | | | 16 | | | — | | | 16 | |
| | | | | | | | | | | |
Total | $ | 3 | | | $ | 9 | | | $ | 12 | | | $ | 31 | | | $ | 15 | | | $ | 46 | |
| | | | | | | | | | | | | | | | | | | | | | | | | | | | | | | | | | | |
Table E18: Collateral dependent loans a by Industry sector |
| June 30, 2026 | | June 30, 2025 |
(US$ in millions) | Property, Land and Equipment | | Others | | Total | | Property, Land and Equipment | | Others | | Total |
Industry Sector | | | | | | | | | | | |
Manufacturing, agribusiness and services | $ | 3 | | | $ | 9 | | | $ | 12 | | | $ | 21 | | | — | | | $ | 21 | |
| | | | | | | | | | | |
Infrastructure and natural resources | — | | | — | | | — | | | 10 | | | 15 | | | 25 | |
| | | | | | | | | | | |
Total | $ | 3 | | | $ | 9 | | | $ | 12 | | | $ | 31 | | | $ | 15 | | | $ | 46 | |
___________ | | | | | | | | | | | |
a Includes all components of amortized cost except unamortized fees which are considered insignificant. | | | | | | |
Guarantees
IFC extends financial guarantee facilities to its clients to provide full or partial credit enhancement for their debt securities and trade obligations. Under the terms of IFC’s guarantees, IFC agrees to assume responsibility for the client’s financial obligations in the event of default by the client, where default is defined as failure to pay when payment is due. Guarantees entered into by IFC generally have maturities consistent with those of the loan portfolio. Guarantees signed as of June 30, 2026 totaled $11.3 billion ($8.7 billion – June 30, 2025). Guarantees of $8.1 billion were outstanding (i.e., not called) as of June 30, 2026 ($6.6 billion – June 30, 2025). These amounts represent the maximum amount of undiscounted future payments that IFC could be required to make under these guarantees and are not included in IFC’s consolidated balance sheets.
Loan Participations
Loan participations signed as commitments for which disbursement has not yet been made and loan participations disbursed and outstanding which are serviced by IFC for participants are as follows:
| | | | | | | | | | | |
Table E19: Loan Participations | | | |
(US$ in millions) | June 30, 2026 | | June 30, 2025 |
Loan participations signed as commitments but not disbursed | $ | 1,030 | | | $ | 896 | |
Loan participations disbursed and outstanding which are serviced by IFC | 10,910 | | | 8,884 | |
| | | | | | | | |
| INTERNATIONAL FINANCE CORPORATION | Page 104 |
| | | | | | | | |
NOTES TO CONSOLIDATED FINANCIAL STATEMENTS |
NOTE F – DEBT SECURITIES
Income from debt securities, including net realized gains (losses) on debt securities and associated derivatives for the years ended June 30, 2026, June 30, 2025 and June 30, 2024 comprises the following:
| | | | | | | | | | | | | | | | | | | | | | | | | | |
Table F1: Income from Debt securities | | | | | | | | | | | | | | |
| | | | | For the year ended June 30, | |
(US$ in millions) | | | | | | | | | 2026 | | 2025 | | 2024 | |
Interest income | | | | | | | | | $ | 820 | | | $ | 834 | | | $ | 790 | | |
Dividends | | | | | | | | | 5 | | | 1 | | | 1 | | |
Net realized (losses) gains on debt securities and associated derivatives a | | | | | | | | | (6) | | | (16) | | | 20 | | |
| | | | | | | | | | | | | | |
Total income from debt securities, including realized gains on debt securities and associated derivatives | | | | | | | | | $ | 819 | | | $ | 819 | | | $ | 811 | | |
_________ | | | | | | | | | | | | | | |
a Includes realized gains/(losses) on debt securities under the Fair Value Option. $2 million, $(15) million and $1 million for the years ended June 30, 2026, June 30, 2025, and June 30, 2024 respectively. | |
Debt securities accounted for as available-for-sale as of June 30, 2026 and June 30, 2025 comprise:
| | | | | | | | | | | | | | | | | | | | | | | | | | | | | | | |
Table F2: Debt securities – Available-for-sale | | | | | | | | | | | |
| June 30, 2026 |
(US$ in millions) | Amortized cost | | Unrealized gains a | | Unrealized losses a | | | | Reserve for credit losses | | Fair value |
Corporate debt securities | $ | 315 | | | $ | 4 | | | $ | (27) | | | | | $ | (4) | | | $ | 288 | |
Preferred shares | 16 | | | — | | | (4) | | | | | (3) | | | 9 | |
Asset-backed securities | 16 | | | — | | | — | | | | | — | | | 16 | |
Total | $ | 347 | | | $ | 4 | | | $ | (31) | | | | | $ | (7) | | | $ | 313 | |
_________ | | | | | | | | | | | |
a Includes net foreign exchange losses of $31 million as of June 30, 2026. |
| | | | | | | | | | | | | | | | | | | | | | | | | | | | | |
Table F2.1: | | | | | | | | | |
| June 30, 2025 |
(US$ in millions) | Amortized cost | | Unrealized gains a | | Unrealized losses a | | Reserve for credit losses | | Fair value |
Corporate debt securities | $ | 545 | | | $ | 13 | | | $ | (60) | | | $ | (5) | | | $ | 493 | |
Preferred shares | 28 | | | — | | | (3) | | | (11) | | | 14 | |
Asset-backed securities | 36 | | | 1 | | | — | | | — | | | 37 | |
Total | $ | 609 | | | $ | 14 | | | $ | (63) | | | $ | (16) | | | $ | 544 | |
_________ | | | | | | | | | |
a Includes net foreign exchange losses of $49 million as of June 30, 2025. |
The table below presents the amortized cost, unrealized losses, and fair value of available-for-sale debt securities that are in an unrealized loss position without credit losses, aggregated by major security type as of June 30, 2026 and June 30, 2025. The reserve for credit losses is not included herein and is presented separately in the reserve for credit losses on debt securities roll-forward table (Table F5).
| | | | | | | | | | | | | | | | | | | | | | | | | | | | | | | | | | | |
Table F3: Available-for-sale debt securities – in an unrealized loss position without credit losses |
| June 30, 2026 | | June 30, 2025 |
(US$ in millions) | Amortized Costs | | Unrealized Losses a | | Fair value | | Amortized Costs | | Unrealized Losses a | | Fair value |
Corporate debt securities | $ | 153 | | | $ | (23) | | | $ | 130 | | | $ | 203 | | | $ | (55) | | | $ | 148 | |
Preferred shares | 12 | | | (4) | | | 8 | | | 9 | | | (3) | | | 6 | |
Asset-backed securities | — | | | — | | | — | | | 1 | | | — | | | 1 | |
Total | $ | 165 | | | $ | (27) | | | $ | 138 | | | $ | 213 | | | $ | (58) | | | $ | 155 | |
___________ | | | | | | | | | | | |
a Includes net foreign exchange losses of $28 million as of June 30, 2026 and $62 million as of June 30, 2025. |
| | | | | | | | |
| INTERNATIONAL FINANCE CORPORATION | Page 105 |
| | | | | | | | |
NOTES TO CONSOLIDATED FINANCIAL STATEMENTS |
NOTE F – DEBT SECURITIES (continued)
The following tables show the unrealized losses and fair value of available-for-sale debt securities as of June 30, 2026 and June 30, 2025 by length of time that individual securities had been in a continuous loss position where the fair value of securities declined below their cost basis:
| | | | | | | | | | | | | | | | | | | | | | | | | | | | | | | | | | | |
Table F4: Unrealized losses and fair value of available-for-sale debt securities – by length of time |
| June 30, 2026 |
| Less than 12 months | | 12 months or greater | | Total |
(US$ in millions) | Fair value | | Unrealized losses | | Fair value | | Unrealized losses | | Fair value | | Unrealized losses |
Corporate debt securities | $ | — | | | $ | — | | | $ | 130 | | | $ | (23) | | | $ | 130 | | | $ | (23) | |
Preferred shares | 2 | | | (1) | | | 6 | | | (3) | | | 8 | | | (4) | |
Asset-backed securities | — | | | — | | | — | | | — | | | — | | | — | |
Total | $ | 2 | | | $ | (1) | | | $ | 136 | | | $ | (26) | | | $ | 138 | | | $ | (27) | |
| | | | | | | | | | | | | | | | | | | | | | | | | | | | | | | | | | | |
Table F4.1: | | | | | | | | | | | |
| June 30, 2025 |
| Less than 12 months | | 12 months or greater | | Total |
(US$ in millions) | Fair value | | Unrealized losses | | Fair value | | Unrealized losses | | Fair value | | Unrealized losses |
Corporate debt securities | $ | — | | | $ | — | | | $ | 148 | | | $ | (55) | | | $ | 148 | | | $ | (55) | |
Preferred shares | — | | | — | | | 6 | | | (3) | | | 6 | | | (3) | |
Asset-backed securities | — | | | — | | | 1 | | | — | | | 1 | | | — | |
Total | $ | — | | | $ | — | | | $ | 155 | | | $ | (58) | | | $ | 155 | | | $ | (58) | |
Corporate debt securities comprise investments in bonds and notes. Fair value associated with corporate debt securities is primarily attributable to movements in the credit default swap spread curve applicable to the issuer, and also impacted by movements in the risk-free rates and foreign exchange rates. Based upon IFC's assessment of expected credit losses, a reserve for credit losses is made for securities where the issuer is not expected to make all contractual principal and interest payments.
Preferred shares comprise investments in preferred equity investments that are redeemable at the option of IFC or mandatorily redeemable by the issuer. Unrealized losses associated with preferred shares are primarily driven by changes in discount rates associated with changes in credit spreads or interest rates, minor changes in exchange rates and comparable market valuations in the applicable sector. Based upon IFC's assessment of expected credit losses, a reserve for credit losses is made for securities where IFC does not expect to recover the cost basis of these securities.
Asset-backed securities comprise investments in bonds and notes that are collateralized by self-liquidating financial assets that allow IFC to receive payments that depend primarily on cash flow from those assets.
The table below presents a roll-forward by major security type for the years ended June 30, 2026, June 30, 2025 and June 30, 2024 of the reserve for credit losses on debt securities accounted for as available-for-sale held at the period end:
Table F5: Roll-forward of the reserve for credit losses – by security type
| | | | | | | | | | | | | | | | | | | | | | | | | | | | | | | | | | | | | | | | | | | | | | | | | | | | | | | | | | | | | | | | | | |
| | | For the year ended June 30, |
| | | 2026 | | 2025 | | | | | 2024 |
(US$ in millions) | | | | | | | Corporate Debt Securities | | Preferred shares | | Total | | Corporate Debt Securities | | Preferred shares | | Total | | | | | | | | | Corporate Debt Securities | | Preferred shares | | Total |
Beginning balance | | | | | | | $ | 5 | | | $ | 11 | | | $ | 16 | | | $ | 24 | | | $ | 10 | | | $ | 34 | | | | | | | | | | $ | 13 | | | $ | 8 | | | $ | 21 | |
(Release of provision) Provision for losses | | | | | | | (2) | | | (8) | | | (10) | | | (7) | | | 1 | | | (6) | | | | | | | | | | 11 | | | 2 | | | 13 | |
| | | | | | | | | | | | | | | | | | | | | | | | | | | | | | |
Write-offs | | | | | | | — | | | — | | | — | | | (12) | | | — | | | (12) | | | | | | | | | | — | | | — | | | — | |
Recoveries of previously written-off debt securities | | | | | | | 1 | | | — | | | 1 | | | — | | | — | | | — | | | | | | | | | | — | | | — | | | — | |
| | | | | | | | | | | | | | | | | | | | | | | | | | | | | | |
Ending balance | | | | | | | $ | 4 | | | $ | 3 | | | $ | 7 | | | $ | 5 | | | $ | 11 | | | $ | 16 | | | | | | | | | | $ | 24 | | | $ | 10 | | | $ | 34 | |
| | | | | | | | |
| INTERNATIONAL FINANCE CORPORATION | Page 106 |
| | | | | | | | |
NOTES TO CONSOLIDATED FINANCIAL STATEMENTS |
NOTE F – DEBT SECURITIES (continued)
The tables below present the maturity structure of debt securities that are accounted for as available-for-sale:
| | | | | | | | | | | | | | | | | | | | | | | | | | | | | | | | | |
Table F6: Contractual maturities for available-for-sale debt securities as of June 30, 2026 |
| June 30, 2026 |
(US$ in millions) | Due in 1 year or less | | Due after 1 year through 5 years | | Due after 5 years through 10 years | | Due after 10 years | | | | | | Total |
Corporate debt securities | $ | 129 | | | $ | 149 | | | $ | 4 | | | $ | — | | | | | | | $ | 282 | |
Asset-backed securities | 15 | | | 1 | | | — | | | — | | | | | | | 16 | |
Total disbursed portfolio of debt securities with contractual maturities | $ | 144 | | | $ | 150 | | | $ | 4 | | | $ | — | | | | | | | $ | 298 | |
| | | | | | | | | | | | | | | | | | | | | | | | | | | | | | | | | |
Table F6.1: Contractual maturities for available-for-sale debt securities as of June 30, 2025 |
| June 30, 2025 |
(US$ in millions) | Due in 1 year or less | | Due after 1 year through 5 years | | Due after 5 years through 10 years | | Due after 10 years | | | | | | Total |
Corporate debt securities | $ | 69 | | | $ | 420 | | | $ | 6 | | | $ | — | | | | | | | $ | 495 | |
Asset-backed securities | 21 | | | 15 | | | — | | | — | | | | | | | 36 | |
Total disbursed portfolio of debt securities with contractual maturities | $ | 90 | | | $ | 435 | | | $ | 6 | | | $ | — | | | | | | | $ | 531 | |
The expected maturity of asset-backed securities may differ from the contractual maturity, as reported above, due to prepayment features. In addition, IFC has $16 million of redeemable preferred shares and other debt securities with undefined maturities ($28 million – June 30, 2025).
The currency composition and weighted average contractual rate of debt securities with contractual maturities that are accounted for as available-for-sale are summarized below:
| | | | | | | | | | | | | | | | | | | | | | | |
Table F7: Currency composition of available-for-sale debt securities |
| June 30, 2026 | | June 30, 2025 |
(US$ in millions, except for ratios) | Amount | | Weighted average contractual rate (%) | | Amount | | Weighted average contractual rate (%) |
Euro | $ | 137 | | | 6.3 | % | | $ | 326 | | | 5.6 | % |
Colombian peso | 126 | | | 12.4 | | | 106 | | | 10.9 | |
South African rand | 17 | | | 11.3 | | | 18 | | | 11.3 | |
U.S. dollar | 15 | | | 7.0 | | | 41 | | | 7.5 | |
West African CFA franc | 3 | | | 6.0 | | | 3 | | | 6.0 | |
Indian rupee | — | | | — | | | 37 | | | 9.0 | |
| | | | | | | |
| | | | | | | |
| | | | | | | |
| | | | | | | |
| | | | | | | |
Total disbursed portfolio of debt securities with contractual maturities | $ | 298 | | | 9.2 | % | | $ | 531 | | | 7.2 | % |
After the effect of interest rate swaps and currency swaps, IFC’s debt securities that are accounted for as available-for-sale are primarily denominated in variable rate U.S. dollars.
Nonaccruing debt securities
The disbursed and outstanding balances of debt securities on which the accrual of interest has been discontinued amounted to $118 million at June 30, 2026 ($142 million – June 30, 2025). The interest income on such debt securities for the years ended June 30, 2026, June 30, 2025 and June 30, 2024 is summarized as follows:
| | | | | | | | | | | | | | | | | |
Table F8: Interest income on Nonaccruing debt securities | | | | | |
| For the year ended June 30, |
(US$ in millions) | 2026 | | 2025 | | 2024 |
Interest income not recognized on nonaccruing debt securities | $ | 10 | | | $ | 11 | | | $ | 9 | |
Interest income recognized on debt securities in nonaccrual status related to current and prior years, on a cash basis | — | | | 5 | | | 1 | |
| | | | | | | | |
| INTERNATIONAL FINANCE CORPORATION | Page 107 |
| | | | | | | | |
NOTES TO CONSOLIDATED FINANCIAL STATEMENTS |
NOTE G – EQUITY INVESTMENTS AND ASSOCIATED DERIVATIVES
Income from equity investments, including realized and unrealized gains and losses on equity and associated derivatives for the years ended June 30, 2026, June 30, 2025 and June 30, 2024 comprises the following:
| | | | | | | | | | | | | | | | | | | | | | | | | | | | | | | | | | | | | | | |
Table G1: Income from equity investments and associated derivatives |
| | | | | | | | | | | For the year ended June 30, |
(US$ in millions) | | | | | | | | | | | | | | | | | | | | | 2026 | | 2025 | | 2024 |
Unrealized gains (losses) on equity investments and associated derivatives a | | | | | | | | | | | | | | | | | | | | | $ | 474 | | | $ | 157 | | | $ | (231) | |
Realized gains on equity investments and associated derivatives, net | | | | | | | | | | | | | | | | | | | | | 522 | | | 219 | | | 245 | |
Gains on equity investments and associated derivatives, net | | | | | | | | | | | | | | | | | | | | | 996 | | | 376 | | | 14 | |
Dividends | | | | | | | | | | | | | | | | | | | | | 142 | | | 126 | | | 115 | |
| | | | | | | | | | | | | | | | | | | | | | | | | |
| | | | | | | | | | | | | | | | | | | | | | | | | |
| | | | | | | | | | | | | | | | | | | | | | | | | |
| | | | | | | | | | | | | | | | | | | | | | | | | |
Custody, fees and other | | | | | | | | | | | | | | | | | | | | | 18 | | | 15 | | | 13 | |
Total income from equity investments, including realized and unrealized gains and losses on equity and associated derivatives | | | | | | | | | | | | | | | | | | | | | $ | 1,156 | | | $ | 517 | | | $ | 142 | |
_________ | | | | | | | | | | | | | | | | | | | | | | | | | |
a Includes unrealized gains and losses related to equity securities still held as of June 30, 2026, net gains of $849 million for the year ended June 30, 2026 (net gains of $489 million – June 30, 2025 and net gains of $156 million – June 30, 2024). |
The fair value of equity investments as of June 30, 2026 and June 30, 2025 comprises:
| | | | | | | | | | | |
Table G2: Fair value of equity investments |
(US$ in millions) | June 30, 2026 | | June 30, 2025 |
Investments in common or preferred shares | $ | 6,425 | | | $ | 5,641 | |
Equity interests in private equity funds | 7,069 | | | 6,140 | |
Equity-related options and other financial instruments | (9) | | | (4) | |
Total | $ | 13,485 | | | $ | 11,777 | |
Equity investments include several private equity funds that invest primarily in emerging markets across a range of sectors and that are accounted for at fair value under the Fair Value Option. The fair values of these funds have been determined using the NAV of IFC’s ownership interest in partners’ capital as a practical expedient as presented in the table above. These investments cannot be redeemed. Distributions will be received from these funds as the underlying assets are liquidated or distributed, the timing of which is uncertain. As of June 30, 2026, the maximum amount of undisbursed commitments subject to capital calls for these funds were $2.7 billion ($2.4 billion – June 30, 2025). As of June 30, 2026, IFC's investments as a limited partner in funds managed by AMC were $374 million ($434 million – June 30, 2025). Amounts previously distributed by AMC may be callable through the life of the respective fund. The sale of IFC’s limited partner interests in these funds needs prior consent from the other limited partners.
| | | | | | | | |
| INTERNATIONAL FINANCE CORPORATION | Page 108 |
| | | | | | | | |
NOTES TO CONSOLIDATED FINANCIAL STATEMENTS |
NOTE H – RETAINED EARNINGS, NET INCOME ALLOCATIONS, AND ACCUMULATED OTHER COMPREHENSIVE INCOME
Retained Earnings consist of Allocated Amounts and Unallocated Net Income (Loss).
Allocated Amounts:
Management recommends allocations of net income to the Board at the end of each fiscal year, to support IFC's operations as well as other developmental activities. These recommendations are based on IFC's allocable income. Effective March 2026, to better measure income generated by current year activities, the calculation of allocable income has been refined by adding back expenses funded by prior-years' approved allocations totaling $365 million – $194 million for year ended June 30, 2026 and a one-time adjustment of $171 million relating to the year ended June 30, 2025. Amounts allocated to other developmental activities are determined based on a Board-approved income-based (sliding scale) formula and on a principles-based Board approved financial distribution policy and are approved by the Board.
IFC allocates its net income to support the following programs:
Funding Mechanism for Technical Assistance and Advisory Services (FMTAAS) supports the delivery of Upstream and Advisory related activities, primarily in non-IDA/Fragile and FCS member countries.
Creating Markets Advisory Window (CMAW) supports the delivery of Upstream and Advisory related activities in IDA-eligible countries and FCS with the aim of addressing the complex challenge of building a pipeline of bankable private sector projects in these markets.
Small and Medium Enterprises (SME) Ventures covers program, administrative, legal, and consulting expenses in connection with IFC’s private equity program for financing of SMEs.
Frontier Opportunities Fund (FOF): This is a fund of concessional finance to spur equity investment mostly targeted to middle-income member countries.
On August 5, 2026, the Board of Directors approved the allocation of $173 million to the CMAW reserve, $125 million to the FMTAAS reserve and $1,385 million to the General Reserve from IFC's FY26 net income. This designation is expected to be noted with approval by the Board of Governors in the fiscal year ended June 30, 2027 (FY27). In addition, the Board of Directors approved the transfer of $100 million from the Surplus account to the FOF and recommended to IFC's Board of Governors a transfer of $60 million to the Surplus account from IFC’s FY26 net income.
On September 30, 2025, the Board of Directors approved the allocation of $178 million to the CMAW reserve, $70 million to the FMTAAS reserve, and $1,362 million to the General Reserve from IFC's FY25 net income. This approval was noted by the Board of Governors on October 17, 2025. On the same day, the Board of Governors also approved the allocation of $100 million from IFC’s FY25 net income to the Surplus account and delegated to the Board of Directors the authority to approve the transfer of $100 million from the Surplus account to the FOF reserve.
| | | | | | | | |
| INTERNATIONAL FINANCE CORPORATION | Page 109 |
| | | | | | | | |
NOTES TO CONSOLIDATED FINANCIAL STATEMENTS |
NOTE H – RETAINED EARNINGS, NET INCOME ALLOCATIONS, AND ACCUMULATED OTHER COMPREHENSIVE INCOME (continued)
The components of retained earnings and related expenditures are summarized below:
| | | | | | | | | | | | | | | | | | | | | | | | | | | | | | | | | | | | | | | | | | | | | | | | | | | | | | | | | |
| | | | | | | | | | | | | | | | | | | | | |
Table H1: Components of retained earnings and related expenditures |
(US$ in millions) | | | FMTAAS Reserve | | CMAW Reserve | | | | SME Ventures Reserve | | Frontier Opportunities Fund Reserve | | Surplus | | Cumulative Fair value and other adjustments a | | General Reserve | | Unallocated Net Income | | Total Retained Earnings |
As of June 30, 2023 | | | $ | 48 | | | $ | 161 | | | | | $ | 12 | | | $ | — | | | $ | — | | | $ | (66) | | | $ | 10,891 | | | $ | 764 | | | $ | 11,810 | |
Year ended June 30, 2024 | | | | | | | | | | | | | | | | | | | | | |
Net income | | | — | | | — | | | | | — | | | — | | | — | | | — | | | — | | | 1,485 | | | 1,485 | |
Net income allocations | | | 60 | | | — | | | | | — | | | — | | | — | | | — | | | 704 | | | (764) | | | — | |
Expenditures against reserves | | | (50) | | | (68) | | | | | (1) | | | — | | | — | | | — | | | — | | | 119 | | | — | |
Fair value and other adjustments | | | — | | | — | | | | | — | | | — | | | — | | | (73) | | | — | | | 73 | | | — | |
As of June 30, 2024 | | | $ | 58 | | | $ | 93 | | | | | $ | 11 | | | $ | — | | | $ | — | | | $ | (139) | | | $ | 11,595 | | | $ | 1,677 | | | $ | 13,295 | |
| | | | | | | | | | | | | | | | | | | | | |
As of June 30, 2024 | | | $ | 58 | | | $ | 93 | | | | | $ | 11 | | | $ | — | | | $ | — | | | $ | (139) | | | $ | 11,595 | | | $ | 1,677 | | | $ | 13,295 | |
Year ended June 30, 2025 | | | | | | | | | | | | | | | | | | | | | |
Net income | | | — | | | — | | | | | — | | | — | | | — | | | — | | | — | | | 2,007 | | | 2,007 | |
Net income allocations | | | 152 | | | 107 | | | | | — | | | — | | | 100 | | | — | | | 1,318 | | | (1,677) | | | — | |
Transfers from surplus | | | — | | | — | | | | | — | | | 100 | | | (100) | | | — | | | — | | | — | | | — | |
Expenditures against reserves | | | (70) | | | (99) | | | | | (2) | | | — | | | — | | | — | | | — | | | 171 | | | — | |
Fair value and other adjustments | | | — | | | — | | | | | — | | | — | | | — | | | 297 | | | — | | | (297) | | | — | |
As of June 30, 2025 | | | $ | 140 | | | $ | 101 | | | | | $ | 9 | | | $ | 100 | | | $ | — | | | $ | 158 | | | $ | 12,913 | | | $ | 1,881 | | | $ | 15,302 | |
| | | | | | | | | | | | | | | | | | | | | |
As of June 30, 2025 | | | $ | 140 | | | $ | 101 | | | | | $ | 9 | | | $ | 100 | | | $ | — | | | $ | 158 | | | $ | 12,913 | | | $ | 1,881 | | | $ | 15,302 | |
Year ended June 30, 2026 | | | | | | | | | | | | | | | | | | | | | |
Net income | | | — | | | — | | | | | — | | | — | | | — | | | — | | | — | | | 2,038 | | | 2,038 | |
Net income allocations | | | 70 | | | 178 | | | | | — | | | — | | | 100 | | | — | | | 1,362 | | | (1,710) | | | — | |
| | | | | | | | | | | | | | | | | | | | | |
Expenditures against reserves | | | (83) | | | (111) | | | | | — | | | — | | | — | | | — | | | — | | | 194 | | | — | |
Fair value and other adjustments | | | — | | | — | | | | | — | | | — | | | — | | | 660 | | | — | | | (660) | | | — | |
As of June 30, 2026 | | | $ | 127 | | | $ | 168 | | | | | $ | 9 | | | $ | 100 | | | $ | 100 | | | $ | 818 | | | $ | 14,275 | | | $ | 1,743 | | | $ | 17,340 | |
_________ | | | | | | | | | | | | | | | | | | | | | |
a Other adjustments include income associated with PCRF. |
| | | | | | | | |
| INTERNATIONAL FINANCE CORPORATION | Page 110 |
| | | | | | | | |
NOTES TO CONSOLIDATED FINANCIAL STATEMENTS |
NOTE H – RETAINED EARNINGS, NET INCOME ALLOCATIONS, AND ACCUMULATED OTHER COMPREHENSIVE INCOME (continued)
Accumulated other comprehensive income (AOCI)
The components of accumulated other comprehensive income as of June 30, 2026 and June 30, 2025 are summarized as follows:
| | | | | | | | | | | | | | | | | | | | | | | |
Table H2 : AOCI Components and changes |
(US$ in millions) | Net unrealized gains (losses) on available-for-sale debt securities | | Net unrealized gains (losses) on borrowings | | Net unrecognized actuarial gains and unrecognized prior service costs on benefit plans | | Total accumulated other comprehensive income |
As of June 30, 2024 | $ | (117) | | | $ | 414 | | | $ | 660 | | | $ | 957 | |
Year ended June 30, 2025 | | | | | | | |
Other comprehensive income before reclassifications | 118 | | | (280) | | | — | | | (162) | |
Amounts reclassified from AOCI into net income | (50) | | | 12 | | 860 | | a | 822 | |
Other comprehensive income (loss) | 68 | | | (268) | | | 860 | | | 660 | |
As of June 30, 2025 | $ | (49) | | | $ | 146 | | | $ | 1,520 | | | $ | 1,617 | |
| | | | | | | |
As of June 30, 2025 | $ | (49) | | | $ | 146 | | | $ | 1,520 | | | $ | 1,617 | |
Year ended June 30, 2026 | | | | | | | |
Other comprehensive income before reclassifications | 28 | | | (484) | | | — | | | (456) | |
Amounts reclassified from AOCI into net income | (6) | | | 112 | | | 405 | | a | $ | 511 |
Other comprehensive income (loss) | 22 | | | (372) | | | 405 | | | 55 | |
As of June 30, 2026 | $ | (27) | | | $ | (226) | | | $ | 1,925 | | | $ | 1,672 | |
_________ |
a See Note O – Pension and Other Post-retirement Benefits. |
| | | | | | | | |
| INTERNATIONAL FINANCE CORPORATION | Page 111 |
| | | | | | | | |
NOTES TO CONSOLIDATED FINANCIAL STATEMENTS |
NOTE I – NET UNREALIZED GAINS AND LOSSES ON LOANS, DEBT SECURITIES, BORROWINGS AND RELATED DERIVATIVES
IFC accounts for certain financial instruments at fair value with unrealized gains and losses on such financial instruments being reported in net income, namely: (i) certain loans, debt securities and associated derivatives; and (ii) borrowings with associated currency or interest rate swaps. Net unrealized gains and losses on loans, debt securities, borrowings and related derivatives for the years ended June 30, 2026, June 30, 2025 and June 30, 2024 comprise:
| | | | | | | | | | | | | | | | | | | | | | | | | | | | | | | | | | |
Table I1: Net unrealized gains on loans, debt securities, borrowings and related derivatives |
| | | | | | | | For the year ended |
| | | | | | | | | | | | |
(US$ in millions) | | | | | | | | | | | | | | | | | | 2026 | | 2025 | | 2024 |
Unrealized gains and losses on loans, debt securities and associated derivatives | | | | | | | | | | | | | | | | | | | | | | |
Unrealized (losses) gains on loans under the Fair Value Option | | | | | | | | | | | | | | | | | | $ | (4) | | | $ | 24 | | | $ | 74 | |
Unrealized gains (losses) on derivatives associated with loans | | | | | | | | | | | | | | | | | | 89 | | | (399) | | | (102) | |
Unrealized (losses) gains on debt securities under the Fair Value Option | | | | | | | | | | | | | | | | | | (77) | | | 116 | | | 206 | |
Unrealized gains (losses) on derivatives associated with debt securities | | | | | | | | | | | | | | | | | | 30 | | | (125) | | | 4 | |
Total net unrealized gains (losses) on loans, debt securities and associated derivatives | | | | | | | | | | | | | | | | | | 38 | | | (384) | | | 182 | |
Unrealized gains and losses on borrowings and associated derivatives | | | | | | | | | | | | | | | | | | | | | | |
Unrealized gains (losses) on borrowings accounted for at fair value | | | | | | | | | | | | | | | | | | 1,030 | | | (1,260) | | | (627) | |
Unrealized (losses) gains on derivatives associated with borrowings | | | | | | | | | | | | | | | | | | (898) | | | 1,759 | | | 573 | |
Total net unrealized gains (losses) on borrowings and associated derivatives | | | | | | | | | | | | | | | | | | 132 | | | 499 | | | (54) | |
Net unrealized gains on loans, debt securities, borrowings and related derivatives | | | | | | | | | | | | | | | | | | $ | 170 | | | $ | 115 | | | $ | 128 | |
| | | | | | | | |
| INTERNATIONAL FINANCE CORPORATION | Page 112 |
| | | | | | | | |
NOTES TO CONSOLIDATED FINANCIAL STATEMENTS |
NOTE J – DERIVATIVES
IFC enters into transactions in various derivative instruments for financial risk management purposes in connection with its principal business activities, including lending, investing in debt securities, equity investments, client risk management, borrowing, liquid asset management and asset and liability management. None of these derivative instruments are designated as accounting hedges under ASC Topic 815. The following table summarizes IFC's use of derivatives in its various financial portfolios:
| | | | | | | | | | | |
Table J1: Risk Classification of derivative used across various financial portfolios |
Portfolio | Derivative instruments used | | Purpose / Risk being managed |
Risk Management purposes | | | |
Liquid assets | Currency swaps, currency forward contracts, interest rate swaps, options, and futures contracts | | Manage currency risk and interest rate risk of liquid assets |
Loans and debt securities | Currency swaps and interest rate swaps | | Manage currency risk and interest rate risk of loans and debt securities |
Borrowings | Currency swaps and interest rate swaps | | Manage currency risk and interest rate risk of borrowings |
Other asset/liability management | Currency swaps, interest rate swaps, put options, call options, and warrant agreements | | Manage currency risk and duration of IFC's equity |
Other purposes | | | |
Client operations | Currency swaps, currency forward contracts, and interest rate swaps | | Assist clients in managing their risks |
The fair value of derivative instrument assets and liabilities by risk type as of June 30, 2026 and June 30, 2025 is summarized as follows:
| | | | | | | | | | | | | | | | | | | | | | | | | | | | | | | | | | | |
Table J2: Derivative fair values and outstanding notional classified by risk type and portfolio at fair value |
| June 30, 2026 | | June 30, 2025 |
(US$ in millions) | Outstanding Notional | | Assets | | Liabilities | | Outstanding Notional | | Assets | | Liabilities |
Interest rate | $ | 94,820 | | | $ | 478 | | | $ | 1,735 | | | $ | 86,949 | | | $ | 548 | | | $ | 1,710 | |
Foreign exchange | 15,626 | | | 368 | | | 69 | | | 18,649 | | | 85 | | | 615 | |
Interest rate and currency | 71,758 | | | 2,022 | | | 3,960 | | | 66,950 | | | 2,200 | | | 4,266 | |
Equity a | — | | | 119 | | | 19 | | | — | | | 140 | | | 21 | |
Credit and other a | — | | | 19 | | | 32 | | | — | | | 32 | | | 8 | |
Total | $ | 182,204 | | | $ | 3,006 | | | $ | 5,815 | | | $ | 172,548 | | | $ | 3,005 | | | $ | 6,620 | |
| | | | | | | | | | | |
Funding | $ | 75,801 | | | $ | 1,194 | | | $ | 4,198 | | | $ | 72,022 | | | $ | 1,557 | | | $ | 4,245 | |
Investments | 62,627 | | | 1,085 | | | 1,121 | | | 54,747 | | | 1,063 | | | 1,171 | |
Client Risk Management | 14,213 | | | 303 | | | 321 | | | 14,683 | | | 295 | | | 319 | |
Liquid asset Management | 29,563 | | | 424 | | | 175 | | | 31,096 | | | 90 | | | 885 | |
| | | | | | | | | | | |
Total | $ | 182,204 | | | $ | 3,006 | | | $ | 5,815 | | | $ | 172,548 | | | $ | 3,005 | | | $ | 6,620 | |
_________ |
a As of June 30, 2026, there were 100 derivative instrument contracts related to IFC’s equity investment portfolio and 175 other derivative contracts recognized as derivative assets or liabilities under ASC Topic 815 (101 equity related and 33 other derivative contracts – June 30, 2025). |
| | | | | | | | |
| INTERNATIONAL FINANCE CORPORATION | Page 113 |
| | | | | | | | |
NOTES TO CONSOLIDATED FINANCIAL STATEMENTS |
NOTE J – DERIVATIVES (continued)
The effect of derivative instrument contracts on the consolidated statements of operations for the years ended June 30, 2026, June 30, 2025 and June 30, 2024 is summarized as follows:
| | | | | | | | | | | | | | | | | | | | | | | | | | | | | | | | | | | | | |
Table J3: Impact of derivative instrument contracts on the consolidated statements of operations |
(US$ in millions) | | | | | | | | For the year ended |
Derivative risk category | Consolidated Statements of Operations location | | | | | | | | | | | | | | | | | | June 30, 2026 | | June 30, 2025 | | June 30, 2024 |
Interest rate | Income from loans and guarantees, including realized gains and losses on loans and associated derivatives | | | | | | | | | | | | | | | | | | $ | 31 | | | $ | 63 | | | $ | 104 | |
| Income from debt securities, including realized gains and losses on debt securities and associated derivatives | | | | | | | | | | | | | | | | | | 13 | | | 26 | | | 41 | |
| Loss from liquid asset trading activities | | | | | | | | | | | | | | | | | | (4) | | | (114) | | | (26) | |
| Charges on borrowings | | | | | | | | | | | | | | | | | | (182) | | | (484) | | | (691) | |
| Other income | | | | | | | | | | | | | | | | | | 14 | | | 11 | | | 23 | |
| Net unrealized (losses) gains on loans, debt securities, borrowings and related derivatives | | | | | | | | | | | | | | | | | | (178) | | | 323 | | | 46 | |
| | | | | | | | | | | | | | | | | | | | | | | |
Foreign exchange | Income (loss) from liquid asset trading activities | | | | | | | | | | | | | | | | | | 802 | | | (623) | | | 737 | |
| Foreign currency transaction (losses) gains on non-trading activities | | | | | | | | | | | | | | | | | | (6) | | | (18) | | | 3 | |
| Net unrealized (losses) gains on loans, debt securities, borrowings and related derivatives | | | | | | | | | | | | | | | | | | (2) | | | 2 | | | (6) | |
Interest rate and currency | (Loss) income from loans and guarantees, including realized gains and losses on loans and associated derivatives | | | | | | | | | | | | | | | | | | (159) | | | 11 | | | (6) | |
| Loss from debt securities, including realized gains and losses on debt securities and associated derivatives | | | | | | | | | | | | | | | | | | (108) | | | (58) | | | (43) | |
| Income (loss) from liquid asset trading activities | | | | | | | | | | | | | | | | | | 281 | | | (170) | | | 125 | |
| Charges on borrowings | | | | | | | | | | | | | | | | | | (44) | | | (562) | | | (878) | |
| Foreign currency transaction gains on non-trading activities | | | | | | | | | | | | | | | | | | 390 | | | 159 | | | 244 | |
| Other Income | | | | | | | | | | | | | | | | | | — | | | 3 | | | 3 | |
| Net unrealized (losses) gains on loans, debt securities, borrowings and related derivatives | | | | | | | | | | | | | | | | | | (562) | | | 926 | | | 444 | |
Equity related contracts | (Losses) gains from equity investments and associated derivatives | | | | | | | | | | | | | | | | | | (19) | | | 32 | | | (27) | |
| | | | | | | | | | | | | | | | | | | | | | | |
| | | | | | | | | | | | | | | | | | | | | | | |
Credit and other | Net unrealized losses on loans, debt securities, borrowings and related derivatives | | | | | | | | | | | | | | | | | | (37) | | | (16) | | | (8) | |
| Total | | | | | | | | | | | | | | | | | | $ | 230 | | | $ | (489) | | | $ | 85 | |
The income related to each derivative risk category includes realized and unrealized gains and losses.
| | | | | | | | |
| INTERNATIONAL FINANCE CORPORATION | Page 114 |
| | | | | | | | |
NOTES TO CONSOLIDATED FINANCIAL STATEMENTS |
NOTE K – BORROWINGS
IFC’s borrowings include general market borrowings and securitized borrowings.
General Market Borrowings
The majority of IFC’s borrowings are raised through issuances in the international capital markets. In accordance with IFC’s asset-liability management policies, market borrowings are generally swapped into floating‑rate U.S. dollar obligations. IFC also maintains short-term discount note programs as a tool to provide additional funding and liquidity management. Additionally, in September 2014, IFC issued a promissory note to IDA, see Note B for further details.
The interest rate composition of IFC's general market borrowings, before the effect of derivatives, is summarized below:
| | | | | | | | | | | | | | | | | | | | | | | |
Table K1: Interest rate composition of general market borrowings (before derivatives) |
| June 30, 2026 | | June 30, 2025 |
(US$ in millions, except for %) | Amount | | WAC a (%) | | Amount | | WAC a (%) |
Short-term borrowings – Fixed rate | $ | 2,537 | | | 4.1 | % | | $ | 2,337 | | | 4.9 | % |
Medium and long-term (MLT) borrowings | | | | | | | |
Fixed rate | 70,040 | | | 4.1 | | | 67,096 | | | 3.7 | |
Variable rate | 10,715 | | | 5.1 | | | 7,415 | | | 5.0 | |
Total MLT borrowings | 80,755 | | | | | 74,511 | | | |
IDA borrowings | 90 | | | 1.8 | | | 124 | | | 1.8 | |
Total Face Value | 83,382 | | | | | 76,972 | | | |
Fair value adjustments and unamortized discounts, net | (7,681) | | | | | (5,522) | | | |
Carrying amount of general market borrowings | $ | 75,701 | | | | | $ | 71,450 | | | |
___________ | | | | | | | |
a WAC refers to weighted average borrowings cost for the reporting period. |
As of June 30, 2026, Medium and long-term (MLT) borrowings include $380 million carried at amortized cost ($320 million – June 30, 2025). The weighted average effective interest rate on MLT borrowings carried at amortized cost was 9.5% as of June 30, 2026 (8.8% – June 30, 2025). All short-term borrowings are carried at amortized cost.
IFC had an undrawn committed Kenyan shilling-denominated credit facility (equivalent to approximately $100 million) as of June 30, 2026, available for drawdown through June 24, 2027.
IFC diversifies its borrowings by currency, country, source, and maturity to provide flexibility and cost-effectiveness. For the year ended June 30, 2026, IFC borrowed in 31 currencies (20 currencies – year ended June 30, 2025). The currency composition of general market borrowings based on face value, before derivatives, is summarized below:
| | | | | | | | | | | |
Table K2: Currency composition of general market borrowings based on face value (before derivatives) |
(%) | June 30, 2026 | | June 30, 2025 |
U.S. dollar | 40.8 | % | | 45.2 | % |
Australian dollar | 16.1 | | | 15.9 | |
Pound sterling | 15.6 | | | 15.5 | |
Others | 27.5 | | | 23.4 | |
Total | 100 | % | | 100 | % |
IFC uses derivatives, reported at fair value, to manage the currency risk and the interest rate risk on its borrowings. After the effect of interest rate and currency swaps, IFC’s borrowings generally reprice within one year.
The following table summarizes IFC’s general market borrowing portfolio after derivatives:
| | | | | | | | | | | |
Table K3: General market borrowings and borrowing-related derivatives |
(US$ in millions) | June 30, 2026 | | June 30, 2025 |
Borrowings | $ | 75,701 | | | $ | 71,450 | |
Currency swaps, net | 1,580 | | | 1,508 | |
Interest rate swaps, net | 1,423 | | | 1,180 | |
Total | $ | 78,704 | | | $ | 74,138 | |
| | | | | | | | |
| INTERNATIONAL FINANCE CORPORATION | Page 115 |
| | | | | | | | |
NOTES TO CONSOLIDATED FINANCIAL STATEMENTS |
NOTE K – BORROWINGS (continued)
IFC’s short-term Discount Note Program has maturities ranging from overnight to one year. The weighted average remaining maturity of IFC’s MLT borrowings was 4.9 years as of June 30, 2026 (4.6 years – June 30, 2025). The weighted average remaining maturity of IDA borrowings was 4.6 years as of June 30, 2026 (4.2 years – June 30, 2025). Actual maturities may differ from contractual maturities due to the existence of call features in certain IFC’s borrowings.
The principal amounts repayable on borrowings outstanding in all currencies for next 5 years and thereafter are summarized below:
| | | | | | | | | | | | | | | | | | | | | | | | | | | | | | | | | | | | | | | | | |
Table K4: Maturity of general market borrowings as of June 30, 2026 |
(US$ in millions) | 2027 | | 2028 | | 2029 | | 2030 | | 2031 | | Thereafter | | Total |
Short-term borrowings | $ | 2,537 | | | $ | — | | | $ | — | | | $ | — | | | $ | — | | | $ | — | | | $ | 2,537 | |
Medium and long-term (MLT) borrowings | 14,063 | | | 14,394 | | | 14,114 | | | 12,400 | | | 9,075 | | | 16,709 | | | 80,755 | |
IDA borrowings | 12 | | | 11 | | | 11 | | | 10 | | | 9 | | | 37 | | | 90 | |
Total borrowings, gross | $ | 16,612 | | | $ | 14,405 | | | $ | 14,125 | | | $ | 12,410 | | | $ | 9,084 | | | $ | 16,746 | | | $ | 83,382 | |
Unamortized discounts, net | | | | | | | | | | | | | (4,547) | |
Fair value adjustments | | | | | | | | | | | | | (3,134) | |
Carrying amount of borrowings | | | | | | | | | | | | | $ | 75,701 | |
| | | | | | | | | | | | | | | | | | | | | | | | | | | | | | | | | | | | | | | | | |
Table K4.1: Maturity of general market borrowings as of June 30, 2025 |
(US$ in millions) | 2026 | | 2027 | | 2028 | | 2029 | | 2030 | | Thereafter | | Total |
Short-term borrowings | $ | 2,337 | | | $ | — | | | $ | — | | | $ | — | | | $ | — | | | $ | — | | | $ | 2,337 | |
Medium and long-term (MLT) borrowings | 13,194 | | | 13,827 | | | 12,583 | | | 8,767 | | | 9,421 | | | 16,718 | | | 74,510 | |
IDA borrowings | 34 | | | 12 | | | 11 | | | 11 | | | 10 | | | 46 | | | 124 | |
Total borrowings, gross | $ | 15,565 | | | $ | 13,839 | | | $ | 12,594 | | | $ | 8,778 | | | $ | 9,431 | | | $ | 16,764 | | | $ | 76,971 | |
Unamortized discounts, net | | | | | | | | | | | | | (3,041) | |
Fair value adjustments | | | | | | | | | | | | | (2,480) | |
Carrying amount of borrowings | | | | | | | | | | | | | $ | 71,450 | |
Securitized Borrowings
Starting in fiscal year 2026, IFC issues securitized borrowings through Special Purpose Vehicles (SPVs) to transfer portions of the economic risk associated with certain loan portfolios to third-party investors. Securitized borrowings reflect the credit quality of the underlying loan pools, their distinct structure and recourse profile rather than IFC’s general cost of funds. Please refer to Note N Variable Interest Entities for further details.
The interest rate composition of IFC's securitized borrowings is summarized below:
| | | | | | | | | | | | | | | |
Table K5: Interest rate composition of securitized borrowings |
| June 30, 2026 | | |
(US$ in millions, except for %) | Amount | | WAC a (%) | | | | |
Securitized borrowings | $ | 686 | | | 4.8 | % | | | | |
Fair value adjustments and unamortized discounts, net | (4) | | | | | | | |
Carrying amount of securitized borrowings | $ | 682 | | | | | | | |
___________ | | | | | | | |
a WAC refers to weighted average borrowings cost for the reporting period. |
| | | | | | | | |
| INTERNATIONAL FINANCE CORPORATION | Page 116 |
| | | | | | | | |
NOTES TO CONSOLIDATED FINANCIAL STATEMENTS |
NOTE K – BORROWINGS (continued)
The weighted average remaining maturity of securitized borrowings was 2 years as of June 30, 2026. The principal amounts repayable on borrowings outstanding in all currencies for the next 5 years and thereafter are summarized below:
| | | | | | | | | | | | | | | | | | | | | | | | | | | | | | | | | | | | | | | | | |
Table K6: Maturity of securitized borrowings as of June 30, 2026 |
(US$ in millions) | 2027 | | 2028 | | 2029 | | 2030 | | 2031 | | Thereafter | | Total |
Securitized borrowings | $ | 171 | | | $ | 196 | | | $ | 183 | | | $ | 84 | | | $ | 2 | | | $ | 50 | | | $ | 686 | |
| | | | | | | | | | | | | |
Total securitized borrowings, gross | $ | 171 | | | $ | 196 | | | $ | 183 | | | $ | 84 | | | $ | 2 | | | $ | 50 | | | $ | 686 | |
Fair value adjustments | | | | | | | | | | | | | (4) | |
Carrying amount of borrowings | | | | | | | | | | | | | $ | 682 | |
| | | | | | | | |
| INTERNATIONAL FINANCE CORPORATION | Page 117 |
| | | | | | | | |
NOTES TO CONSOLIDATED FINANCIAL STATEMENTS |
NOTE L – FAIR VALUE MEASUREMENTS
ASC 820 defines fair value as the price that would be received to sell an asset or transfer a liability (i.e., an exit price) in an orderly transaction between independent, knowledgeable and willing market participants at the measurement date assuming the transaction occurs in the entity’s principal (or most advantageous) market. IFC categorizes its financial instruments into three levels based on the established fair value hierarchy. For more information regarding the fair value hierarchy and how IFC measures fair value, see Note A – Summary of Significant Accounting Policies in the June 30, 2026 audited financial statements. Readers are cautioned in using these data for purposes of evaluating the financial condition of IFC as the fair values of the individual financial instruments do not represent the fair value of IFC taken as a whole.
IFC utilized, where available, comparator, sector and country information, in addition to discounted cash flow models, in valuing its equity investment portfolio as of June 30, 2026. Debt securities and loans accounted for at fair value that do not have available market prices were primarily valued using discounted cash flow approaches and reflected spreads as of June 30, 2026.
For the following instruments, the significant unobservable inputs and their relationship to the fair valuation movement are listed below:
| | | | | | | | |
Table L1: Significant unobservable inputs and its relationship to the fair valuation movement |
Instrument | Significant Unobservable Input | Increase in Unobservable Input Results In |
IFC Local Currency Borrowings | IFC Yield Curve | Decrease in Fair Value |
Interest Rate Swaps (hedging loans and liquid assets) | Yield Curve Points | Increase in Fair Value |
Interest Rate Swaps (hedging borrowings) | Yield Curve Points | Decrease in Fair Value |
Currency Swaps (hedging loans and liquid assets) | Yield Curve and Exchange Rates | Increase in Fair Value |
Currency Swaps (hedging borrowings) | Yield Curve and Exchange Rates | Decrease in Fair Value |
Debt Securities and Loans | Discount Rates, Credit Default Spreads | Decrease in Fair Value |
Valuation Multiple, Recovery Rates | Increase in Fair Value |
Equity Securities and Equity Related Derivatives | Cost of equity, discounts for lack of marketability, weighted average cost of capital | Decrease in Fair Value |
Growth rates, return on assets, perpetual growth rates, EV/EBITDA, price to book value and other valuation multiples and volatilities | Increase in Fair Value |
The methodologies used and key assumptions made to estimate fair values as of June 30, 2026 and June 30, 2025, are summarized below.
Liquid assets – The primary pricing source for the liquid assets is valuations obtained from external pricing services (vendor prices). The most liquid securities in the liquid asset portfolio are U.S. Treasuries. U.S. Treasuries and sovereign bonds issued by G7 countries are generally classified as Level 1 subject to quarterly leveling validation. The remaining liquid assets valued using vendor prices are classified as Level 2 or Level 3 based on the results of IFC’s evaluation of the vendor’s pricing methodologies and individual security facts and circumstances. Most vendor prices use some form of matrix pricing methodology to derive the inputs for projecting cash flows or to derive prices. When vendor prices are not available, liquid assets are valued internally by IFC using executable or indicative dealer quotes from the market and these are classified as Level 2 or Level 3 depending on the degree that the inputs are observable in the market.
The critical factors in valuing liquid assets in both Level 2 and Level 3 are the estimation of cash flows and yield. Other significant inputs for valuing corporate securities, quasi-government securities and sovereign or sovereign-guaranteed securities include reported trades, broker/dealer quotes, benchmark securities, option adjusted spread curve, volatilities, and other reference data. In addition to these inputs, valuation models for securitized or collateralized securities use collateral performance inputs, such as weighted average coupon rate, weighted average maturity, conditional prepayment rate, constant default rate, vintage, and credit enhancements.
There were no Level 3 liquid assets as of June 30, 2026 or June 30, 2025.
| | | | | | | | |
| INTERNATIONAL FINANCE CORPORATION | Page 118 |
| | |
NOTES TO CONSOLIDATED FINANCIAL STATEMENTS |
NOTE L – FAIR VALUE MEASUREMENTS (continued)
Loans and debt securities – Loans and debt securities in IFC’s investment portfolio that do not have available market prices are primarily valued using discounted cash flow approaches. The majority of loans measured at fair value are classified as Level 3. Certain loans contain embedded conversion and/or income participation features. These features are considered in determining the loans’ fair value based on the quoted market prices or other calculated values of the equity investments into which the loans are convertible and the discounted cash flows of the income participation features. The significant unobservable inputs used in the fair value measurement of loans and debt securities are discount rates, credit default swap spreads, and expected recovery rates. The valuation techniques and significant unobservable inputs for loans and debt securities classified as Level 3 as of June 30, 2026 and as of June 30, 2025 are presented below.
| | | | | | | | | | | | | | | | | |
Table L2: Valuation techniques and significant unobservable inputs for loans and debt securities classified as Level 3 |
June 30, 2026 |
(US$ in millions) | Valuation technique | Fair value | Significant inputs | Range (%) | Weighted average (%) |
Debt securities - preferred shares | Discounted cash flows | $ | 69 | | Discount rate | 11.5 - 18.3 | 15.5 |
| Market comparables | 44 | | Valuation multiples a | | |
| | | | | |
| Recent transactions | 5 | | | | |
| Other techniques | 53 | | | | |
Total preferred shares | | 171 | | | | |
Other loans and debt securities | Discounted cash flows | 8,982 | | Credit default swap spreads | 0.0 - 8.5 | 2.0 | |
| | | Expected recovery rates | 0.0 - 95.0 | 46.0 |
| Recent transactions | 976 | | | | |
| Other techniques | 241 | | | | |
Total other loans and debt securities | | 10,199 | | | | |
Total | | $ | 10,370 | | | | |
________ |
a Includes valuation techniques with multiple significant inputs, therefore the range and weighted average are not provided. |
| | | | | | | | | | | | | | | | | |
Table L2.1: |
June 30, 2025 |
(US$ in millions) | Valuation technique | Fair value | Significant inputs | Range (%) | Weighted average (%) |
Debt securities – preferred shares | Discounted cash flows | $ | 115 | | Discount rate | 11.5 - 22.1 | 18.6 |
| Market comparables | 72 | | Valuation multiples a | | |
| | | | | |
| Recent transactions | 40 | | | | |
| Other techniques | 17 | | | | |
Total preferred shares | | 244 | | | | |
Other loans and debt securities | Discounted cash flows | 8,849 | | Credit default swap spreads | 0.0 - 8.6 | 2.3 |
| | | Expected recovery rates | 0.0 - 97.5 | 45.3 |
| Recent transactions | 804 | | | | |
| Other techniques | 413 | | | | |
Total other loans and debt securities | | 10,066 | | | | |
Total | | $ | 10,310 | | | | |
________ |
a Includes valuation techniques with multiple significant inputs, therefore the range and weighted average are not provided. |
Borrowings – Fair values derived by determining the present value of estimated future cash flows using appropriate discount rates and option specific models where appropriate are classified as Level 2. Fair values derived from market source pricing are also classified as Level 2. The significant inputs used in valuing borrowings classified as Level 2 are presented below:
| | | | | | | | |
| INTERNATIONAL FINANCE CORPORATION | Page 119 |
| | |
NOTES TO CONSOLIDATED FINANCIAL STATEMENTS |
NOTE L – FAIR VALUE MEASUREMENTS (continued)
| | | | | |
Table L3: Significant inputs used in valuing borrowings classified as Level 2 |
Classes | Significant Inputs |
Structured bonds | Foreign exchange rate and inter-bank yield curves, issuer’s credit curve and swaption volatility matrix, foreign exchange rate volatility, equity spot price, volatility and dividend yield, and Collateralized Loan Obligations (CLO) performance informed by market research and analysis. |
Unstructured bonds | Inter-bank yield curve and issuer’s credit curve. |
As of June 30, 2026, IFC had bond issuances with a total fair value of $224 million (including $45 million related to securitized borrowings) classified as level 3 ($216 million – June 30, 2025) in Azerbaijani manat, Bangladeshi taka, Jamaican dollar, Mongolian tugrik, U.S. dollar, and Uzbekistan sum where the significant unobservable inputs were yield curve data and discount rate consistent with market return expectations.
Derivative instruments – The various classes of derivative instruments include interest rate contracts, foreign exchange contracts, interest rate and currency contracts, equity contracts and other derivative contracts. Certain over the counter derivatives in the liquid asset portfolio priced in-house are classified as Level 2, while certain over the counter derivatives priced using external manager prices are classified as Level 3. Fair values for derivative instruments are derived by determining the present value of estimated future cash flows using appropriate discount rates and option specific models where appropriate.
The significant inputs used in valuing the various classes of derivative instruments classified as Level 2 and significant unobservable inputs for derivative instruments classified as Level 3 as of June 30, 2026 and June 30, 2025 are presented below:
| | | | | |
Table L4: Significant inputs used in valuing the various classes of derivative instruments classified as Level 2 |
Level 2 derivatives | Significant Inputs |
Interest rate | Inter-bank yield curves, foreign exchange basis curve and yield curves specified to index floating rates. |
Foreign exchange | Foreign exchange rate, inter-bank yield curves and foreign exchange basis curve. |
Interest rate and currency | Foreign exchange rate, inter-bank yield curves, foreign exchange basis curve and yield curves specified to index floating rates. |
| | | | | | | | | | | | | | | | | |
Table L5: Significant inputs used in valuing the various classes of derivative instruments classified as Level 3 |
(US$ in millions) | June 30, 2026 |
Level 3 derivatives | Type | Fair value | Significant inputs | Range (%) | Weighted average (%) |
Equity related derivatives | Fixed strike price options | 1 | | Volatilities a | | |
| Variable strike price options | 99 | | Contractual strike price b | | |
| | | | | |
Interest rate and currency swap assets | Vanilla swaps | 99 | | Yield curve points, exchange rates b | | |
Interest rate and currency swap liabilities | Vanilla swaps | (37) | | Yield curve points, exchange rates b | | |
Total | | $ | 162 | | | | |
_________ | | | | | |
a No range has been provided, as this valuation technique is applied to only one project. |
b In case of valuation techniques with multiple significant inputs, the range and weighted average are not provided. |
| | | | | | | | | | | | | | | | | |
Table L5.1: |
(US$ in millions) | June 30, 2025 |
Level 3 derivatives | Type | Fair value | Significant inputs | Range (%) | Weighted average (%) |
Equity related derivatives | Fixed strike price options | $ | 1 | | | | |
| Variable strike price options | 118 | | Contractual strike price a | | |
| | | | | |
Interest rate and currency swap assets | Vanilla swaps | 88 | | Yield curve points, exchange rates b | | |
| | | | | |
Interest rate and currency swap liabilities | Vanilla swaps | (30) | | Yield curve points, exchange rates a | | |
Total | | $ | 177 | | | | |
_________ |
a In case of valuation techniques with multiple significant inputs, the range and weighted average are not provided. |
| | | | | | | | |
| INTERNATIONAL FINANCE CORPORATION | Page 120 |
| | |
NOTES TO CONSOLIDATED FINANCIAL STATEMENTS |
NOTE L – FAIR VALUE MEASUREMENTS (continued)
Equity investments – Equity investments valued using quoted prices in active markets are classified as Level 1. Equity investments classified as Level 2 are valued using quoted prices in inactive markets. Equity investments classified as Level 3 are primarily valued using discounted cash flow and market comparable approaches. The significant unobservable inputs include cost of equity, weighted average cost of capital, asset growth rate, return on assets, perpetual growth rate, price to book and market multiples. The valuation techniques and significant unobservable inputs used in fair value measurements categorized within Level 3 of the fair value hierarchy for equity investments that were measured at fair value through net income as of June 30, 2026 and June 30, 2025 are presented below.
| | | | | | | | | | | | | | | | | |
Table L6: Valuation techniques and significant unobservable inputs for equity securities classified as Level 3 |
(US$ in millions) | | June 30, 2026 |
Sector | Valuation technique | Fair value | Significant inputs | Range | Weighted average (%) |
Banking and other financial | Discounted cash flows | $ | 539 | | Cost of equity (%) | 10.9 - 32.8 | 15.7 | |
Institutions | | | Asset growth rate (%) | (0.8) - 34.0 | 16.4 | |
| | | Return on assets (%) | 0.3 - 6.2 | 2.6 | |
| | | Perpetual growth rate (%) | 3.0 - 14.2 | 6.8 | |
| Market comparables | 462 | | Price to book value | 0.3 - 3.4 | 2.3 | |
| | | EV/Sales | 0.7 - 21.9 | 5.7 | |
| | | | | |
| | | | | |
| | | Other valuation multiples a | | |
| Listed price (adjusted) | 162 | | Discount for lack of marketability (%) | 20.0 - 30.0 | 29.8 | |
| Recent transactions | 407 | | | | |
| Other techniques | 273 | | | | |
| Associated options b | 61 | | | | |
Total banking and other financial institutions | | 1,904 | | | | |
Funds | Recent transactions | 159 | | | | |
| Other techniques | 73 | | | | |
| | | | | |
Total funds | | 232 | | | | |
Others | Discounted cash flows | 1,051 | | Weighted average cost of capital (%) | 6.6 - 30.5 | 11.9 | |
| | | Cost of equity (%) | 10.9 - 26.8 | 16.2 | |
| Market comparables | 337 | | EV/Sales | 0.5 - 9.1 | 3.5 | |
| | | EV/EBITDA | 7.3 - 17.8 | 10.6 | |
| | | Price to book value | 1.2 - 1.2 | 1.2 | |
| | | | | |
| | | Other valuation multiples a | | |
| | | | | |
| Recent transactions | 380 | | | | |
| Other techniques | 230 | | | | |
| Associated options b | 101 | | | | |
Total others | | 2,099 | | | | |
Total | | $ | 4,235 | | | | |
_________ | | | | | |
a Includes price/earnings ratio and price/sales ratio, the range and weighted average are not provided due to the immaterial amounts. |
b Fair values for associated options are derived by determining the present value of estimated future cash flows using appropriate discount rates and option specific models where appropriate. |
| | | | | | | | |
| INTERNATIONAL FINANCE CORPORATION | Page 121 |
| | |
NOTES TO CONSOLIDATED FINANCIAL STATEMENTS |
NOTE L – FAIR VALUE MEASUREMENTS (continued)
| | | | | | | | | | | | | | | | | |
Table L6.1: |
(US$ in millions) | | June 30, 2025 |
Sector | Valuation technique | Fair value | Significant inputs | Range | Weighted average (%) |
Banking and other financial | Discounted cash flows | $ | 292 | | Cost of equity (%) | 12.9 - 34.2 | 15.7 |
Institutions | | | Asset growth rate (%) | (11.3) - 56.6 | 5.9 |
| | | Return on assets (%) | 0.5 - 5.3 | 2.2 |
| | | Perpetual growth rate (%) | 3.0 - 15.0 | 5.7 |
| Market comparables | 349 | | Price to book value | 0.3 - 3.7 | 2.1 |
| | | EV/Sales | 1.0 - 14.7 | 6.5 |
| | | Other valuation multiples a | | |
| Listed price (adjusted) | 174 | | Discount for lack of marketability (%) | 20.0 - 30.0 | 29.6 |
| Recent transactions | 828 | | | | |
| Other techniques | 263 | | | | |
| Associated options b | 2 | | | | |
Total banking and other financial institutions | | 1,908 | | | | |
Funds | Recent transactions | 91 | | | | |
| | | | | |
| Other techniques | 89 | | | | |
Total funds | | 180 | | | | |
Others | Discounted cash flows | 1,150 | | Weighted average cost of capital (%) | 7.7 - 21.4 | 11.3 |
| | | Cost of equity (%) | 10.6 - 32.0 | 17.4 |
| Market comparables | 440 | | EV/Sales | 0.6- 13.9 | 5.6 |
| | | EV/EBITDA | 9.8 - 20.2 | 13.2 |
| | | Price to book value | 1.0 - 1.7 | 1.6 |
| | | Other valuation multiples a | | |
| | | | | |
| Recent transactions | 334 | | | | |
| Other techniques | 136 | | | | |
| Associated options b | 66 | | | | |
Total others | | 2,126 | | | | |
Total | | $ | 4,214 | | | | |
_________ | | | | | |
a Includes price/earnings ratio and price/sales ratio, the range and weighted average are not provided due to the immaterial amounts. |
b Fair values for associated options are derived by determining the present value of estimated future cash flows using appropriate discount rates and option specific models where appropriate. |
| | | | | | | | |
| INTERNATIONAL FINANCE CORPORATION | Page 122 |
| | |
NOTES TO CONSOLIDATED FINANCIAL STATEMENTS |
NOTE L – FAIR VALUE MEASUREMENTS (continued)
Fair value of assets and liabilities
Estimated fair values of IFC’s financial assets and liabilities and off-balance-sheet financial instruments as of June 30, 2026 and June 30, 2025 are summarized below:
| | | | | | | | | | | | | | | | | | | | | | | |
Table L7: Estimated fair values of financial assets, financial liabilities, and off-balance-sheet instruments |
| June 30, 2026 | | June 30, 2025 |
(US$ in millions) | Carrying value | | Fair value | | Carrying value | | Fair value |
Financial assets | | | | | | | |
Cash and due from banks, time deposits, trading securities and securities purchased under resale agreements and receivable for cash collateral pledged | $ | 49,320 | | | $ | 49,320 | | | $ | 51,419 | | | $ | 51,419 | |
Investments | | | | | | | |
Loans at amortized cost, net of reserve against losses | 46,173 | | | 48,178 | | | 40,282 | | | 41,924 | |
Loans accounted for at fair value under the Fair Value Option | 2,061 | | | 2,061 | | | 1,947 | | | 1,947 | |
Total loans | 48,234 | | | 50,239 | | | 42,229 | | | 43,871 | |
| | | | | | | |
| | | | | | | |
Equity investments accounted for at fair value | 13,485 | | a | 13,481 | | | 11,777 | | a | 11,772 | |
| | | | | | | |
Debt securities accounted for at fair value as available-for-sale | 313 | | | 313 | | | 544 | | | 544 | |
Debt securities accounted for at fair value under the Fair Value Option | 13,783 | | | 13,783 | | | 12,970 | | | 12,970 | |
Total debt securities | 14,096 | | | 14,096 | | | 13,514 | | | 13,514 | |
Total investments | $ | 75,815 | | | $ | 77,816 | | | $ | 67,520 | | | $ | 69,157 | |
| | | | | | | |
| | | | | | | |
| | | | | | | |
| | | | | | | |
| | | | | | | |
Total derivative assets | 3,006 | | | 3,006 | | | 3,005 | | | 3,005 | |
Other investment-related financial assets | — | | | 1 | | | — | | | 2 | |
Financial liabilities | | | | | | | |
Securities sold under repurchase agreements and payable for cash collateral received | $ | 5,100 | | | $ | 5,100 | | | $ | 4,893 | | | $ | 4,893 | |
Market, IBRD, IDA and other borrowings outstanding | 76,383 | | | 76,386 | | | 71,450 | | | 71,453 | |
| | | | | | | |
| | | | | | | |
| | | | | | | |
| | | | | | | |
| | | | | | | |
| | | | | | | |
Total derivative liabilities | 5,815 | | | 5,815 | | | 6,620 | | | 6,620 | |
_________ | | | | | | | |
a For $4 million as of June 30, 2026 ($5 million - June 30, 2025) of equity investments primarily accounted for under the cost recovery method, no fair value measurement is provided since the recovery of invested capital is uncertain. |
The fair value of loan commitments amounted to $28 million as of June 30, 2026 ($30 million – June 30, 2025). Fair values of loan commitments are based on present value of loan commitment fees.
Fair value hierarchy
As required by ASC 820, financial assets and financial liabilities are classified in their entirety based on the lowest level input that is significant to the fair value measurement: The following tables provide information as of June 30, 2026 and June 30, 2025, about IFC’s financial assets and financial liabilities measured at fair value on a recurring basis.
| | | | | | | | |
| INTERNATIONAL FINANCE CORPORATION | Page 123 |
| | |
NOTES TO CONSOLIDATED FINANCIAL STATEMENTS |
NOTE L – FAIR VALUE MEASUREMENTS (continued)
| | | | | | | | | | | | | | | | | | | | | | | |
Table L8: Fair value hierarchy – Financial assets and liabilities |
| June 30, 2026 |
(US$ in millions) | Level 1 | | Level 2 | | Level 3 | | Total |
Investments - Trading | | | | | | | |
Time deposits | $ | 250 | | | $ | 13,246 | | | $ | — | | | $ | 13,496 | |
Asset-backed securities | — | | | 6,710 | | | — | | | 6,710 | |
Corporate debt securities a | — | | | 4,254 | | | — | | | 4,254 | |
Government obligations | 18,310 | | | 4,904 | | | — | | | 23,214 | |
| | | | | | | |
Total Investments - Trading | 18,560 | | | 29,114 | | | — | | | 47,674 | |
Securities purchased under resale agreements | — | | | — | | | — | | | — | |
Loans | | | | | | | |
Loans | — | | | 75 | | | 1,981 | | | 2,056 | |
Loans measured at net asset value b | | | | | | | 5 | |
Total Loans (outstanding principal balance $2,103) | — | | | 75 | | | 1,981 | | | 2,061 | |
Equity investments | | | | | | | |
Banking and other financial institutions | 990 | | | 100 | | | 1,904 | | | 2,994 | |
Funds | — | | | — | | | 232 | | | 232 | |
Others | 1,034 | | | 53 | | | 2,099 | | | 3,186 | |
Equity investments measured at net asset value b | | | | | | | 7,069 | |
Total equity investments | 2,024 | | | 153 | | | 4,235 | | | 13,481 | |
Debt securities | | | | | | | |
Corporate debt securities | — | | | 4,954 | | | 7,493 | | | 12,447 | |
Preferred shares | — | | | — | | | 171 | | | 171 | |
Asset-backed securities | — | | | 205 | | | 725 | | | 930 | |
| | | | | | | |
Debt securities measured at net asset value b | | | | | | | 548 | |
Total debt securities | — | | | 5,159 | | | 8,389 | | | 14,096 | |
Derivative assets | | | | | | | |
Interest rate | — | | | 478 | | | — | | | 478 | |
Foreign exchange | — | | | 368 | | | — | | | 368 | |
Interest rate and currency | — | | | 1,923 | | | 99 | | | 2,022 | |
Equity and other | — | | | — | | | 119 | | | 119 | |
Credit and Other derivative contracts | — | | | 19 | | | — | | | 19 | |
Total derivative assets | — | | | 2,788 | | | 218 | | | 3,006 | |
Total assets at fair value | $ | 20,584 | | | $ | 37,289 | | | $ | 14,823 | | | $ | 80,318 | |
Borrowings | | | | | | | |
Structured bonds (including securitized borrowings) | $ | — | | | $ | 7,392 | | | $ | 45 | | | $ | 7,437 | |
Unstructured bonds | — | | | 65,850 | | | 179 | | | 66,029 | |
Total borrowings (outstanding principal balance $81,151) c | — | | | 73,242 | | | 224 | | | 73,466 | |
| | | | | | | |
Securities sold under repurchase agreements | — | | 4,558 | | — | | 4,558 |
Derivative liabilities | | | | | | | |
Interest rate | — | | | 1,735 | | | — | | | 1,735 | |
Foreign exchange | — | | | 69 | | | — | | | 69 | |
Interest rate and currency | — | | | 3,923 | | | 37 | | | 3,960 | |
Equity and other | — | | | — | | | 19 | | | 19 | |
Credit and Other derivative contracts | — | | | 32 | | | — | | | 32 | |
Total derivative liabilities | — | | | 5,759 | | | 56 | | | 5,815 | |
Total liabilities at fair value | $ | — | | | $ | 83,559 | | | $ | 280 | | | $ | 83,839 | |
_______ | | | | | | | |
a Includes securities priced at par plus accrued interest, which approximates fair value. |
b In accordance with ASC 820, investments that are measured at fair value using net asset value per share have not been classified in the fair value hierarchy. The fair value amounts presented in this table are intended to permit reconciliation of the fair value hierarchy to the amounts presented in consolidated balance sheets. |
c Includes discount notes (not under the short-term Discount Note Program), with original maturities greater than one year, with principal due at maturity of $7.9 billion, with a fair value of $2.5 billion as of June 30, 2026. |
| | | | | | | | |
| INTERNATIONAL FINANCE CORPORATION | Page 124 |
| | |
NOTES TO CONSOLIDATED FINANCIAL STATEMENTS |
NOTE L – FAIR VALUE MEASUREMENTS (continued)
| | | | | | | | | | | | | | | | | | | | | | | |
Table L8.1: |
| June 30, 2025 |
(US$ in millions) | Level 1 | | Level 2 | | Level 3 | | Total |
Investments - Trading | | | | | | | |
Time deposits | $ | — | | | $ | 14,263 | | | $ | — | | | $ | 14,263 | |
Asset-backed securities | — | | | 5,468 | | | — | | | 5,468 | |
Corporate debt securities a | — | | | 4,972 | | | — | | | 4,972 | |
Government obligations | 18,122 | | | 5,149 | | | — | | | 23,271 | |
| | | | | | | |
Total Investments - Trading | 18,122 | | | 29,852 | | | — | | | 47,974 | |
Securities purchased under resale agreements | — | | | 946 | | | — | | | 946 | |
Loans | | | | | | | |
Loans | — | | | 128 | | | 1,814 | | | 1,942 | |
Loans measured at net asset value b | | | | | | | 5 | |
Total Loans (outstanding principal balance $1,985) | — | | | 128 | | | 1,814 | | | 1,947 | |
Equity investments | | | | | | | |
Banking and other financial institutions | 700 | | | 3 | | | 1,908 | | | 2,611 | |
Funds | — | | | 11 | | | 180 | | | 191 | |
Others | 699 | | | 5 | | | 2,126 | | | 2,830 | |
Equity investments measured at net asset value b | | | | | | | 6,140 | |
Total equity investments | 1,399 | | | 19 | | | 4,214 | | | 11,772 | |
Debt securities | | | | | | | |
Corporate debt securities | — | | | 4,376 | | | 7,667 | | | 12,043 | |
Preferred shares | — | | | — | | | 244 | | | 244 | |
Asset-backed securities | — | | | 89 | | | 585 | | | 674 | |
| | | | | | | |
Debt securities measured at net asset value b | | | | | | | 553 | |
Total debt securities | — | | | 4,465 | | | 8,496 | | | 13,514 | |
Derivative assets | | | | | | | |
Interest rate | — | | | 547 | | | 1 | | | 548 | |
Foreign exchange | — | | | 85 | | | — | | | 85 | |
Interest rate and currency | — | | | 2,113 | | | 87 | | | 2,200 | |
Equity and other | — | | | — | | | 140 | | | 140 | |
Credit and Other derivative contracts | — | | | 32 | | | — | | | 32 | |
Total derivative assets | — | | | 2,777 | | | 228 | | | 3,005 | |
Total assets at fair value | $ | 19,521 | | | $ | 38,187 | | | $ | 14,752 | | | $ | 79,158 | |
Borrowings | | | | | | | |
Structured bonds | $ | — | | | $ | 5,425 | | | $ | — | | | $ | 5,425 | |
Unstructured bonds | — | | | 63,152 | | | 216 | | | 63,368 | |
Total borrowings (outstanding principal balance $74,313) c | — | | | 68,577 | | | 216 | | | 68,793 | |
| | | | | | | |
Securities sold under repurchase agreements | — | | | 4,547 | | | — | | | 4,547 | |
Derivative liabilities | | | | | | | |
Interest rate | — | | | 1,710 | | | — | | | 1,710 | |
Foreign exchange | — | | | 615 | | | — | | | 615 | |
Interest rate and currency | — | | | 4,236 | | | 30 | | | 4,266 | |
Equity and other | — | | | — | | | 21 | | | 21 | |
Credit and Other derivative contracts | — | | | 8 | | | — | | | 8 | |
Total derivative liabilities | — | | | 6,569 | | | 51 | | | 6,620 | |
Total liabilities at fair value | $ | — | | | $ | 79,693 | | | $ | 267 | | | $ | 79,960 | |
_________ | | | | | | | |
a Includes securities priced at par plus accrued interest, which approximates fair value. |
b In accordance with ASC 820, investments that are measured at fair value using NAV per share have not been classified in the fair value hierarchy. The fair value amounts presented in this table are intended to permit reconciliation of the fair value hierarchy to the amounts presented in consolidated balance sheets. |
c Includes discount notes (not under the short-term Discount Note Program), with original maturities greater than one year, with principal due at maturity of $5.3 billion, with a fair value of $1.8 billion as of June 30, 2025. |
| | | | | | | | |
| INTERNATIONAL FINANCE CORPORATION | Page 125 |
| | |
NOTES TO CONSOLIDATED FINANCIAL STATEMENTS |
NOTE L – FAIR VALUE MEASUREMENTS (continued)
The following tables present the changes in the carrying value of IFC’s Level 3 financial assets and financial liabilities for the three years ended June 30, 2026, June 30, 2025 and June 30, 2024
| | | | | | | | | | | | | | | | | | | | | | | | | | | | | |
Table L9: Carrying value of Level 3 financial assets and financial liabilities |
| For the year ended June 30, 2026 |
(US$ in millions) | Balance as of July 1, 2025 | Net gains (losses) (realized and unrealized) included in | Purchases, issuances, sales, settlements and others | Transfers into Level 3 a | Transfers out of Level 3 b | Balance as of June 30, 2026 | Net unrealized gains (losses) included in net income (loss) related to assets / liabilities held at year end | Net unrealized gains (losses) included in OCI related to assets / liabilities held at year end |
Net income | Other comprehensive income |
Investments - Trading | | | | | | | | | |
| | | | | | | | | |
| | | | | | | | | |
Government obligations | $ | — | | $ | 4 | | $ | — | | $ | 50 | | $ | — | | $ | (54) | | $ | — | | $ | — | | $ | — | |
Total Investments - Trading | — | | 4 | | — | | 50 | | — | | (54) | | — | | — | | — | |
Loans | 1,814 | | (9) | | — | | 125 | | 51 | | — | | 1,981 | | 13 | | — | |
Equity investments | | | | | | | | | |
Banking and other financial institutions | 1,908 | | 281 | | — | | (29) | | 15 | | (271) | | 1,904 | | 104 | | — | |
Funds | 180 | | (30) | | — | | 82 | | — | | — | | 232 | | (26) | | — | |
Others | 2,126 | | (33) | | — | | 108 | | — | | (102) | | 2,099 | | (109) | | — | |
Total equity investments | 4,214 | | 218 | | — | | 161 | | 15 | | (373) | | 4,235 | | (31) | | — | |
Debt securities | | | | | | | | | |
Corporate debt securities | 7,667 | | (164) | | 26 | | 300 | | 2,344 | | (2,680) | | 7,493 | | (95) | | 25 | |
Preferred shares | 244 | | (99) | | (1) | | 27 | | — | | — | | 171 | | (67) | | (2) | |
Asset-backed securities | 585 | | 11 | | — | | 265 | | 86 | | (222) | | 725 | | 11 | | (1) | |
| | | | | | | | | |
Total debt securities | 8,496 | | (252) | | 25 | | 592 | | 2,430 | | (2,902) | | 8,389 | | (151) | | 22 | |
Derivative assets | | | | | | | | | |
Interest rate and currency | 87 | | (15) | | — | | 42 | | — | | (15) | | 99 | | 29 | | — | |
Interest rate | 1 | | (1) | | — | | — | | — | | — | | — | | — | | — | |
Equity and other | 140 | | (21) | | — | | — | | — | | — | | 119 | | 8 | | — | |
Total derivative assets | 228 | | (37) | | — | | 42 | | — | | (15) | | 218 | | 37 | | — | |
Total assets at fair value | $ | 14,752 | | $ | (76) | | $ | 25 | | $ | 970 | | $ | 2,496 | | $ | (3,344) | | $ | 14,823 | | $ | (132) | | $ | 22 | |
Borrowings | | | | | | | | | |
Structured bonds | $ | — | | $ | 5 | | $ | — | | $ | (50) | | $ | — | | $ | — | | $ | (45) | | $ | 5 | | $ | — | |
Unstructured bonds | (216) | | — | | (1) | | (106) | | — | | 144 | | (179) | | — | | (1) | |
Total borrowings | (216) | | 5 | | (1) | | (156) | | — | | 144 | | (224) | | 5 | | (1) | |
Derivative liabilities | | | | | | | | | |
| | | | | | | | | |
Interest rate and currency | (30) | | — | | — | | (17) | | — | | 10 | | (37) | | (18) | | — | |
Equity and other | (21) | | 2 | | — | | — | | — | | — | | (19) | | 2 | | — | |
Total derivative liabilities | (51) | | 2 | | — | | (17) | | — | | 10 | | (56) | | (16) | | — | |
Total liabilities at fair value | $ | (267) | | $ | 7 | | $ | (1) | | $ | (173) | | $ | — | | $ | 154 | | $ | (280) | | $ | (11) | | $ | (1) | |
_________ |
a Transfers into Level 3 are due to lack of observable market data resulting from a decrease in market activity for these securities as of June 30, 2026. |
b Transfers out of Level 3 are due to availability of observable market data resulting from an increase in market activity for these securities that were part of July 1, 2025 beginning balance as of June 30, 2026. |
| | | | | | | | |
| INTERNATIONAL FINANCE CORPORATION | Page 126 |
| | |
NOTES TO CONSOLIDATED FINANCIAL STATEMENTS |
NOTE L – FAIR VALUE MEASUREMENTS (continued)
| | | | | | | | | | | | | | | | | | | | | | | | | | | | | |
Table L9.1: | | | | | | | | | |
| For the year ended June 30, 2025 | |
(US$ in millions) | Balance as of July 1, 2024 | Net gains (losses) (realized and unrealized) included in | Purchases, issuances, sales, settlements and others | Transfers into Level 3 a | Transfers out of Level 3 b | Balance as of June 30, 2025 | Net unrealized gains (losses) included in net income (loss) related to assets / liabilities held at year end | Net unrealized gains (losses) included in OCI related to assets / liabilities held at year end |
Net income (loss) | Other comprehensive income |
Investments - Trading | | | | | | | | | |
Asset-backed securities | $ | — | | $ | — | | $ | — | | $ | 64 | | $ | — | | $ | (64) | | $ | — | | $ | — | | $ | — | |
| | | | | | | | | |
Government obligations | — | | 1 | | — | | 132 | | — | | (133) | | — | | — | | — | |
Total Investments - Trading | — | | 1 | | — | | 196 | | — | | (197) | | — | | — | | $ | — | |
Loans | 1,671 | | 61 | | — | | 82 | | — | | — | | 1,814 | | 79 | | $ | — | |
Equity investments | | | | | | | | | |
Banking and other financial institutions | 1,875 | | 126 | | — | | (53) | | — | | (40) | | 1,908 | | 59 | | — | |
Funds | 210 | | (2) | | — | | (28) | | — | | — | | 180 | | (2) | | — | |
Others | 2,266 | | (127) | | — | | (36) | | 26 | | (3) | | 2,126 | | (236) | | — | |
Total equity investments | 4,351 | | (3) | | — | | (117) | | 26 | | (43) | | 4,214 | | (179) | | — | |
Debt securities | | | | | | | | | |
Corporate debt securities | 7,170 | | 172 | | 69 | | 1,737 | | 1,503 | | (2,984) | | 7,667 | | 189 | | 27 | |
Preferred shares | 238 | | (31) | | (1) | | 38 | | — | | — | | 244 | | (31) | | (1) | |
Asset-backed securities | 802 | | 30 | | — | | (135) | | 92 | | (204) | | 585 | | 28 | | (1) | |
| | | | | | | | | |
Total debt securities | 8,210 | | 171 | | 68 | | 1,640 | | 1,595 | | (3,188) | | 8,496 | | 186 | | 25 | |
Derivative assets | | | | | | | | | |
Interest rate and currency | 120 | | (47) | | — | | 21 | | — | | (7) | | 87 | | (7) | | — | |
Interest rate | — | | 1 | | — | | — | | — | | — | | 1 | | — | | — | |
Equity and other | 96 | | 37 | | — | | 7 | | — | | — | | 140 | | 26 | | — | |
Total derivative assets | 216 | | (9) | | — | | 28 | | — | | (7) | | 228 | | 19 | | — | |
Total assets at fair value | $ | 14,448 | | $ | 221 | | $ | 68 | | $ | 1,829 | | $ | 1,621 | | $ | (3,435) | | $ | 14,752 | | $ | 105 | | $ | 25 | |
Borrowings: | | | | | | | | | |
| | | | | | | | | |
Unstructured bonds | $ | (83) | | $ | 9 | | $ | — | | $ | (161) | | $ | — | | $ | 19 | | $ | (216) | | $ | 9 | | $ | — | |
Total borrowings | (83) | | 9 | | — | | (161) | | — | | 19 | | (216) | | 9 | | — | |
Derivative liabilities | | | | | | | | | |
| | | | | | | | | |
Interest rate and currency | (7) | | (8) | | — | | (18) | | — | | 3 | | (30) | | (41) | | — | |
Equity and other | (10) | | (4) | | — | | (7) | | — | | — | | (21) | | (4) | | — | |
Total derivative liabilities | (17) | | (12) | | — | | (25) | | — | | 3 | | (51) | | (45) | | — | |
Total liabilities at fair value | $ | (100) | | $ | (3) | | $ | — | | $ | (186) | | $ | — | | $ | 22 | | $ | (267) | | $ | (36) | | $ | — | |
_________ |
a Transfers into Level 3 are due to lack of observable market data resulting from a decrease in market activity for these securities as of June 30, 2025. |
b Transfers out of Level 3 are due to availability of observable market data resulting from an increase in market activity for these securities that were part of July 1, 2024 beginning balance as of June 30, 2025. |
| | | | | | | | |
| INTERNATIONAL FINANCE CORPORATION | Page 127 |
| | |
NOTES TO CONSOLIDATED FINANCIAL STATEMENTS |
NOTE L – FAIR VALUE MEASUREMENTS (continued)
| | | | | | | | | | | | | | | | | | | | | | | | | | | | | |
Table L9.2: | | | | | | | | | |
| For the year ended June 30, 2024 |
(US$ in millions) | Balance as of July 1, 2023 | Net gains (losses) (realized and unrealized) included in | Purchases, issuances, sales, settlements and others | Transfers into Level 3 a | Transfers out of Level 3 b | Balance as of June 30, 2024 | Net unrealized gains (losses) included in net income (loss) related to assets / liabilities held at year end | Net unrealized gains (losses) included in OCI related to assets / liabilities held at year end |
Net income (loss) | Other comprehensive income |
| | | | | | | | | |
| | | | | | | | | |
| | | | | | | | | |
| | | | | | | | | |
| | | | | | | | | |
Loans | $ | 1,488 | | $ | 74 | | $ | — | | $ | 227 | | $ | — | | $ | (118) | | $ | 1,671 | | $ | 55 | | $ | — | |
Equity investments | | | | | | | | | |
Banking and other financial institutions | 1,707 | | 85 | | — | | 83 | | 12 | | (12) | | 1,875 | | 106 | | — | |
Funds | 159 | | 20 | | — | | 31 | | — | | — | | 210 | | 7 | | — | |
Others | 2,335 | | (154) | | — | | 112 | | 5 | | (32) | | 2,266 | | (228) | | — | |
Total equity investments | 4,201 | | (49) | | — | | 226 | | 17 | | (44) | | 4,351 | | (115) | | — | |
Debt securities | | | | | | | | | |
Corporate debt securities | 5,911 | | (51) | | 49 | | 1,639 | | 1,157 | | (1,535) | | 7,170 | | (14) | | 15 | |
Preferred shares | 208 | | 33 | | (2) | | (1) | | — | | — | | 238 | | 7 | | — | |
Asset-backed securities | 723 | | (79) | | 61 | | 43 | | 54 | | — | | 802 | | (16) | | (1) | |
| | | | | | | | | |
Total debt securities | 6,842 | | (97) | | 108 | | 1,681 | | 1,211 | | (1,535) | | 8,210 | | (23) | | 14 | |
Derivative assets | | | | | | | | | |
Interest rate and currency | 74 | | 27 | — | | 39 | | — | | (20) | | 120 | | 63 | | — | |
| | | | | | | | | |
Equity and other | 124 | | (18) | | — | | (10) | | — | | — | | 96 | | 1 | | — | |
Total derivative assets | 198 | | 9 | | — | | 29 | | — | | (20) | | 216 | | 64 | | — | |
Total assets at fair value | $ | 12,729 | | $ | (63) | | $ | 108 | | $ | 2,163 | | $ | 1,228 | | $ | (1,717) | | $ | 14,448 | | $ | (19) | | $ | 14 | |
Borrowings: | | | | | | | | | |
| | | | | | | | | |
Unstructured bonds | $ | (228) | | $ | 14 | | $ | — | | $ | (48) | | $ | (4) | | $ | 183 | | $ | (83) | | $ | 14 | | $ | — | |
Total borrowings | (228) | | 14 | | — | | (48) | | (4) | | 183 | | (83) | | 14 | | — | |
Derivative liabilities | | | | | | | | | |
| | | | | | | | | |
Interest rate and currency | (10) | | (6) | | — | | (5) | | (1) | | 15 | | (7) | | (6) | | — | |
Equity and other | (10) | | — | | — | | — | | — | | — | | (10) | | — | | — | |
Total derivative liabilities | (20) | | (6) | | — | | (5) | | (1) | | 15 | | (17) | | (6) | | — | |
Total liabilities at fair value | $ | (248) | | $ | 8 | | $ | — | | $ | (53) | | $ | (5) | | $ | 198 | | $ | (100) | | $ | 8 | | $ | — | |
_________ |
a Transfers into Level 3 are due to lack of observable market data resulting from a decrease in market activity for these securities as of June 30, 2024. |
b Transfers out of Level 3 are due to availability of observable market data resulting from an increase in market activity for these securities that were part of July 1, 2023 beginning balance as of June 30, 2024. |
| | | | | | | | |
| INTERNATIONAL FINANCE CORPORATION | Page 128 |
| | |
NOTES TO CONSOLIDATED FINANCIAL STATEMENTS |
NOTE L – FAIR VALUE MEASUREMENTS (continued)
The following tables present gross purchases, sales, issuances and settlements related to the changes in the carrying value of IFC’s Level 3 financial assets and financial liabilities for the three years ended June 30, 2026, June 30, 2025 and June 30, 2024.
| | | | | | | | | | | | | | | | | | | | | | | | | | | | | |
Table L10: Gross purchases, sales, issuances and settlements - Level 3 financial assets and financial liabilities |
| For the year ended June 30, 2026 |
(US$ in millions) | Purchases | | Sales | | Issuances | | Settlements and others | | Net |
Investments - Trading | | | | | | | | | |
| | | | | | | | | |
| | | | | | | | | |
Government obligations | $ | 50 | | | $ | — | | | $ | — | | | $ | — | | | $ | 50 | |
Total Investments - Trading | 50 | | | — | | | — | | | — | | | 50 | |
Loans | — | | | — | | | 342 | | | (217) | | | 125 | |
Equity investments | | | | | | | | | |
Banking and other financial institutions | 344 | | | (364) | | | — | | | (9) | | | (29) | |
Funds | 478 | | | (7) | | | — | | | (389) | | | 82 | |
Others | 458 | | | (342) | | | — | | | (8) | | | 108 | |
Total equity investments | 1,280 | | | (713) | | | — | | | (406) | | | 161 | |
Debt securities | | | | | | | | | |
Corporate debt securities | 2,464 | | | (2) | | | — | | | (2,162) | | | 300 | |
Preferred shares | 29 | | | (4) | | | — | | | 2 | | | 27 | |
Asset-backed securities | 398 | | | — | | | — | | | (133) | | | 265 | |
Total debt securities | 2,891 | | | (6) | | | — | | | (2,293) | | | 592 | |
Derivative assets | | | | | | | | | |
Interest rate and currency | — | | | — | | | 46 | | | (4) | | | 42 | |
Equity and other | — | | | — | | | — | | | — | | | — | |
Total derivative assets | — | | | — | | | 46 | | | (4) | | | 42 | |
Total assets at fair value | $ | 4,221 | | | $ | (719) | | | $ | 388 | | | $ | (2,920) | | | $ | 970 | |
Borrowings: | | | | | | | | | |
Structured bonds | $ | — | | | $ | — | | | $ | (50) | | | $ | — | | | $ | (50) | |
Unstructured bonds | — | | | — | | | (106) | | | — | | | (106) | |
Total borrowings | — | | | — | | | (156) | | | — | | | (156) | |
Derivative liabilities | | | | | | | | | |
| | | | | | | | | |
Interest rate and currency | — | | | — | | | (13) | | | (4) | | | (17) | |
Equity and other | — | | | — | | | — | | | — | | | — | |
Total derivative liabilities | — | | | — | | | (13) | | | (4) | | | (17) | |
Total liabilities at fair value | $ | — | | | $ | — | | | $ | (169) | | | $ | (4) | | | $ | (173) | |
| | | | | | | | |
| INTERNATIONAL FINANCE CORPORATION | Page 129 |
| | |
NOTES TO CONSOLIDATED FINANCIAL STATEMENTS |
NOTE L – FAIR VALUE MEASUREMENTS (continued)
| | | | | | | | | | | | | | | | | | | | | | | | | | | | | |
Table L10.1 |
| For the year ended June 30, 2025 |
(US$ in millions) | Purchases | | Sales | | Issuances | | Settlements and others | | Net |
Investments - Trading | | | | | | | | | |
Asset-backed securities | $ | 64 | | | $ | — | | | $ | — | | | $ | — | | | $ | 64 | |
| | | | | | | | | |
Government obligations | 132 | | | — | | | — | | | — | | | 132 | |
Total Investments - Trading | 196 | | | — | | | — | | | — | | | 196 | |
Loans | — | | | (21) | | | 255 | | | (152) | | | 82 | |
Equity investments | | | | | | | | | |
Banking and other financial institutions | 320 | | | (296) | | | — | | | (77) | | | (53) | |
Funds | 227 | | | (2) | | | — | | | (253) | | | (28) | |
Others | 347 | | | (234) | | | — | | | (149) | | | (36) | |
Total equity investments | 894 | | | (532) | | | — | | | (479) | | | (117) | |
Debt securities | | | | | | | | | |
Corporate debt securities | 3,154 | | | (19) | | | — | | | (1,398) | | | 1,737 | |
Preferred shares | 40 | | | — | | | — | | | (2) | | | 38 | |
Asset-backed securities | 61 | | | — | | | — | | | (196) | | | (135) | |
Total debt securities | 3,255 | | | (19) | | | — | | | (1,596) | | | 1,640 | |
Derivative assets | | | | | | | | | |
Interest rate and currency | — | | | — | | | 27 | | | (6) | | | 21 | |
Equity and other | — | | | — | | | — | | | 7 | | | 7 | |
Total derivative assets | — | | | — | | | 27 | | | 1 | | | 28 | |
Total assets at fair value | $ | 4,345 | | | $ | (572) | | | $ | 282 | | | $ | (2,226) | | | $ | 1,829 | |
Borrowings: | | | | | | | | | |
| | | | | | | | | |
Unstructured bonds | $ | — | | | $ | — | | | $ | (161) | | | $ | — | | | $ | (161) | |
Total borrowings | — | | | — | | | (161) | | | — | | | (161) | |
Derivative liabilities | | | | | | | | | |
| | | | | | | | | |
Interest rate and currency | — | | | — | | | (12) | | | (6) | | | (18) | |
Equity and other | — | | | — | | | — | | | (7) | | | (7) | |
Total derivative liabilities | — | | | — | | | (12) | | | (13) | | | (25) | |
Total liabilities at fair value | $ | — | | | $ | — | | | $ | (173) | | | $ | (13) | | | $ | (186) | |
| | | | | | | | |
| INTERNATIONAL FINANCE CORPORATION | Page 130 |
| | |
NOTES TO CONSOLIDATED FINANCIAL STATEMENTS |
NOTE L – FAIR VALUE MEASUREMENTS (continued)
| | | | | | | | | | | | | | | | | | | | | | | | | | | | | |
Table L10.2: |
| For the year ended June 30, 2024 |
(US$ in millions) | Purchases | | Sales | | Issuances | | Settlements and others | | Net |
| | | | | | | | | |
| | | | | | | | | |
| | | | | | | | | |
| | | | | | | | | |
| | | | | | | | | |
Loans | $ | — | | | $ | — | | | $ | 454 | | | $ | (227) | | | $ | 227 | |
Equity investments: | | | | | | | | | |
Banking and other financial institutions | 176 | | | (84) | | | — | | | (9) | | | 83 | |
Funds | 234 | | | — | | | — | | | (203) | | | 31 | |
Others | 428 | | | (329) | | | — | | | 13 | | | 112 | |
Total equity investments | 838 | | | (413) | | | — | | | (199) | | | 226 | |
Debt securities | | | | | | | | | |
Corporate debt securities | 2,454 | | | — | | | — | | | (815) | | | 1,639 | |
Preferred shares | 33 | | | (20) | | | — | | | (14) | | | (1) | |
Asset-backed securities | 339 | | | — | | | — | | | (296) | | | 43 | |
Total debt securities | 2,826 | | | (20) | | | — | | | (1,125) | | | 1,681 | |
Derivative assets | | | | | | | | | |
Interest rate and currency | — | | | — | | | 39 | | | — | | | 39 | |
Equity and other | — | | | — | | | — | | | (10) | | | (10) | |
Total derivative assets | — | | | — | | | 39 | | | (10) | | | 29 | |
Total assets at fair value | $ | 3,664 | | | $ | (433) | | | $ | 493 | | | $ | (1,561) | | | $ | 2,163 | |
Borrowings | | | | | | | | | |
| | | | | | | | | |
Unstructured bonds | $ | — | | | $ | — | | | $ | (48) | | | $ | — | | | $ | (48) | |
Total borrowings | — | | | — | | | (48) | | | — | | | (48) | |
Derivative liabilities | | | | | | | | | |
| | | | | | | | | |
Interest rate and currency | — | | | — | | | (5) | | | — | | | (5) | |
| | | | | | | | | |
Total derivative liabilities | — | | | — | | | (5) | | | — | | | (5) | |
Total liabilities at fair value | $ | — | | | $ | — | | | $ | (53) | | | $ | — | | | $ | (53) | |
The following table summarizes the line items on the consolidated statements of operations where gains and losses are reported by major types of financial assets and financial liabilities:
| | | | | |
Table L11: Gains and losses reflected in the consolidated statements of operations |
Instruments | Line item on the consolidated statements of operations |
Trading securities | Income from liquid asset trading activities |
Loans | Income from Loans and guarantees including realized gains and losses on loans and associated derivatives |
Equity investments | Income from equity investments, including realized and unrealized gains and losses on equity and associated derivatives |
Debt securities | Income from debt securities and realized gains and losses on debt securities and associated derivatives |
Loans, debt securities, borrowings and related derivatives | Net unrealized gains and losses on loans, debt securities, borrowings and related derivatives |
| | | | | | | | |
| INTERNATIONAL FINANCE CORPORATION | Page 131 |
| | | | | | | | |
NOTES TO CONSOLIDATED FINANCIAL STATEMENTS |
NOTE M – SEGMENT REPORTING
The President is the Chief Operating Decision Maker, who regularly reviews operational performance and financial measures of IFC to assess performance and allocate resources.
IFC’s business comprises three segments: investment services, treasury services, and upstream and advisory services. The investment services segment consists primarily of lending and investing in debt (loans and debt securities) and equity securities. Operationally, the treasury services segment consists of the borrowing, liquid asset management, asset and liability management and client risk management activities. Upstream and advisory services include providing advisory services to government and private sector clients to create markets and mobilize private capital, and engages in early-stage project development activities to develop bankable investment projects. Consistent with internal reporting, net income or expense from asset and liability management and client risk management activities in support of investment services is allocated from the treasury segment to the investment services segment.
IFC’s management reporting system and policies are used to determine revenues and expenses attributable to each segment. Consistent with internal reporting, administrative expenses are allocated to each segment based largely upon personnel costs and segment headcounts. Transactions between segments are immaterial and, thus, are not a factor in reconciling to the consolidated data.
The assets of the investment and treasury segments are detailed in Notes D and C, respectively. An analysis of IFC’s major components of income and expense by business segment for the years ended June 30, 2026, June 30, 2025 and June 30, 2024, is provided below:
| | | | | | | | | | | | | | | | | | | | | | | |
Table M1: Income and expense by business segment | | | | | | | |
| For the year ended June 30, 2026 |
(US$ in millions) | Investment services | | Treasury services | | Upstream and Advisory services | | Total |
Income from loans and guarantees, including realized gains and losses on loans and associated derivatives | $ | 3,269 | | | $ | — | | | $ | — | | | $ | 3,269 | |
Provision for losses on loans, off-balance-sheet credit exposures and other receivables | (308) | | | — | | | — | | | (308) | |
Income from equity investments, including realized and unrealized gains and losses on equity and associated derivatives | 1,156 | | | — | | | — | | | 1,156 | |
Income from debt securities, including realized gains and losses on debt securities and associated derivatives | 819 | | | — | | | — | | | 819 | |
Release of provision for losses on available-for-sale debt securities | 10 | | | — | | | — | | | 10 | |
Income from liquid asset trading activities | — | | | 1,965 | | | — | | | 1,965 | |
Charges on borrowings | (2,248) | | | (1,331) | | | — | | | (3,579) | |
Upstream and Advisory services income | — | | | — | | | 251 | | | 251 | |
Service fees and other income | 365 | | | — | | | — | | | 365 | |
Administrative expenses | (1,527) | | | (43) | | | (121) | | | (1,691) | |
Upstream and Advisory services expenses | — | | | — | | | (378) | | | (378) | |
Other, net | 28 | | | 3 | | | 18 | | | 49 | |
Foreign currency transaction losses on non-trading activities | (60) | | | — | | | — | | | (60) | |
Income (loss) before net unrealized gains and losses on loans, debt securities, borrowings and related derivatives | 1,504 | | | 594 | | | (230) | | | 1,868 | |
Net unrealized gains on loans, debt securities, borrowings and related derivatives | 38 | | | 132 | | | — | | | 170 | |
Net income (loss) | $ | 1,542 | | | $ | 726 | | | $ | (230) | | | $ | 2,038 | |
| | | | | | | | |
| INTERNATIONAL FINANCE CORPORATION | Page 132 |
| | | | | | | | |
NOTES TO CONSOLIDATED FINANCIAL STATEMENTS |
NOTE M – SEGMENT REPORTING (continued)
| | | | | | | | | | | | | | | | | | | | | | | |
Table M1.1: | | | | | | | |
| For the year ended June 30, 2025 |
(US$ in millions) | Investment services | | Treasury services | | Upstream and Advisory services | | Total |
Income from loans and guarantees, including realized gains and losses on loans and associated derivatives | $ | 3,373 | | | $ | — | | | $ | — | | | $ | 3,373 | |
Provision for losses on loans, off-balance-sheet credit exposures and other receivables | (56) | | | — | | | — | | | (56) | |
Income from equity investments, including realized and unrealized gains and losses on equity and associated derivatives | 517 | | | — | | | — | | | 517 | |
Income from debt securities, including realized gains and losses on debt securities and associated derivatives | 819 | | | — | | | — | | | 819 | |
Release of provision for losses on available-for-sale debt securities | 6 | | | — | | | — | | | 6 | |
Income from liquid asset trading activities | — | | | 2,298 | | | — | | | 2,298 | |
Charges on borrowings | (2,327) | | | (1,269) | | | — | | | (3,596) | |
Upstream and Advisory services income | — | | | — | | | 259 | | | 259 | |
Service fees and other income | 343 | | | — | | | — | | | 343 | |
Administrative expenses | (1,489) | | | (48) | | | (142) | | | (1,679) | |
Upstream and Advisory services expenses | — | | | — | | | (373) | | | (373) | |
Other, net | 17 | | | 2 | | | 5 | | | 24 | |
Foreign currency transaction losses on non-trading activities | (43) | | | — | | | — | | | (43) | |
Income (loss) before net unrealized gains and losses on loans, debt securities, borrowings and related derivatives | 1,160 | | | 983 | | | (251) | | | 1,892 | |
Net unrealized (losses) gains on loans, debt securities, borrowings and related derivatives | (384) | | | 499 | | | — | | | 115 | |
Net income (loss) | $ | 776 | | | $ | 1,482 | | | $ | (251) | | | $ | 2,007 | |
| | | | | | | | |
| INTERNATIONAL FINANCE CORPORATION | Page 133 |
| | | | | | | | |
NOTES TO CONSOLIDATED FINANCIAL STATEMENTS |
NOTE M – SEGMENT REPORTING (continued)
| | | | | | | | | | | | | | | | | | | | | | | |
| | | | | | | |
Table M1.2: | | | | | | | |
| For the year ended June 30, 2024 |
(US$ in millions) | Investment services | | Treasury services | | Upstream and Advisory services | | Total |
Income from loans and guarantees, including realized gains and losses on loans and associated derivatives | $ | 3,204 | | | $ | — | | | $ | — | | | $ | 3,204 | |
Provision for losses on loans, off-balance-sheet credit exposures and other receivables | (9) | | | — | | | — | | | (9) | |
Income from equity investments, including realized and unrealized gains and losses on equity and associated derivatives | 142 | | | — | | | — | | | 142 | |
Income from debt securities, including realized gains and losses on debt securities and associated derivatives | 811 | | | — | | | — | | | 811 | |
Provision for losses on available-for-sale debt securities | (12) | | | — | | | — | | | (12) | |
Income from liquid asset trading activities | — | | | 2,391 | | | — | | | 2,391 | |
Charges on borrowings | (2,284) | | | (1,531) | | | — | | | (3,815) | |
Upstream and Advisory services income | — | | | — | | | 268 | | | 268 | |
Service fees and other income | 319 | | | — | | | — | | | 319 | |
Administrative expenses | (1,329) | | | (48) | | | (139) | | | (1,516) | |
Upstream and Advisory services expenses | — | | | — | | | (339) | | | (339) | |
Other, net | 17 | | | 2 | | | 9 | | | 28 | |
Foreign currency transaction losses on non-trading activities | (115) | | | — | | | — | | | (115) | |
Income (loss) before net unrealized gains and losses on loans, debt securities, borrowings and related derivatives | 744 | | | 814 | | | (201) | | | 1,357 | |
Net unrealized gains (losses) on loans, debt securities, borrowings and related derivatives | 182 | | | (54) | | | — | | | 128 | |
Net income (loss) | $ | 926 | | | $ | 760 | | | $ | (201) | | | $ | 1,485 | |
Upstream and advisory segment
IFC continues to address increasingly complex development challenges and is enhancing its creating markets strategy by undertaking both Upstream and Advisory activities. Specifically, IFC provides advisory services to government and private sector clients to create markets and mobilize private capital, and engages in early-stage project development activities to develop bankable investment projects. IFC also works in collaboration with the IBRD and IDA to provide policy advice and develop activities that help create markets and support future transactions in multiple industries, especially in IDA-eligible countries and FCS. IFC funds this business line by a combination of cash received from IFC shareholders’ development agencies and other development partners, IFC’s operations via retained earnings and operating budget allocations, as well as fees received from the recipients of the services.
As of June 30, 2026, undisbursed donor funds of $487 million ($519 million – June 30, 2025) were included in other assets. As the undisbursed donor funds are refundable, a corresponding liability is recorded in other liabilities. IFC’s advisory services funding of $316 million ($315 million – June 30, 2025) was included in other assets.
Upstream and advisory service expenses include $213 million sourced from government and other development partners, respectively for the year ended June 30, 2026 ($215 million and $220 million – for the years ended June 30, 2025 and June 30, 2024). The funds received from government and other development partners were also recognized as advisory services income in IFC’s consolidated statements of operations.
| | | | | | | | |
| INTERNATIONAL FINANCE CORPORATION | Page 134 |
| | | | | | | | |
NOTES TO CONSOLIDATED FINANCIAL STATEMENTS |
NOTE N – VARIABLE INTEREST ENTITIES
Non-Consolidated VIEs
IFC has identified investments in 261 VIEs which are not consolidated by IFC but in which it is deemed to hold significant variable interests as of June 30, 2026 (238 investments – June 30, 2025). The majority of these VIEs do not involve securitizations or other types of structured financing. IFC is usually the minority investor in these VIEs. These VIEs are mainly: (a) investment funds, where the GP or fund manager does not have substantive equity at risk, which IFC does not consolidate because it does not have the power to direct the activities of the VIEs that most significantly impact their economic performance and (b) entities whose total equity investment is considered insufficient to permit such entity to finance its activities without additional subordinated financial support or whose activities are so narrowly defined by contracts that equity investors are considered to lack decision making ability, which IFC does not consolidate because it does not have the power to control the activities that most significantly impact their economic performance. IFC’s involvement with these VIEs includes investments in equity interests and senior or subordinated interests, guarantees and risk management arrangements.
IFC’s maximum exposure to loss as a result of its investments in these VIEs was $6.7 billion as of June 30, 2026 ($6.9 billion – June 30, 2025). IFC’s maximum exposure to loss is based on the unlikely event that all of the assets in the VIEs become worthless and incorporates not only potential losses associated with assets recorded on IFC’s consolidated balance sheets (maximum funded exposure) but also potential losses associated with undisbursed commitments (maximum unfunded exposure). The maximum funded exposure represents the balance sheet carrying value of IFC’s investment in the VIE and reflects the initial amount of cash invested in the VIE, adjusted for principal payments received, increases or declines in fair value and any impairment in value recognized in earnings. The maximum exposure of unfunded positions represents the remaining committed but not disbursed amount.
The carrying values and the maximum exposure of IFC’s investment in these VIEs as of June 30, 2026 and June 30, 2025 are as follows:
| | | | | | | | | | | | | | | | | | | | | | | |
Table N1: Carrying values and the maximum exposure of IFC’s investment in nonconsolidated VIEs |
Nonconsolidated VIEs | June 30, 2026 | | June 30, 2025 |
(US$ in millions) | Carrying Value | | Maximum Exposure | | Carrying Value | | Maximum Exposure |
Assets | | | | | | | |
Investments | | | | | | | |
Loans a | $ | 1,030 | | | $ | 1,211 | | | $ | 1,015 | | | $ | 1,091 | |
Equity Investments | 2,617 | | | 3,951 | | | 2,829 | | | 3,964 | |
Debt Securities | 1,557 | | | 1,588 | | | 1,658 | | | 1,838 | |
Derivative Assets b | 1 | | | 1 | | | 1 | | | 1 | |
Total Assets | $ | 5,205 | | | $ | 6,751 | | | $ | 5,503 | | | $ | 6,894 | |
Liabilities | | | | | | | |
Derivative Liabilities b | $ | (50) | | | $ | (50) | | | $ | (51) | | | $ | (51) | |
Other Off-Balance-Sheet Arrangements | | | | | | | |
Guarantees | Not Applicable | | $ | 27 | | | Not Applicable | | $ | 38 | |
_________ | | | | | | | |
a The presented carrying value of the loans does not include the associated loan loss reserve of $66 million and $48 million as of June 30, 2026 and June 30, 2025, respectively.
b Represents Client Risk Management arrangements.
Consolidated VIEs
Starting fiscal year 2026, IFC securitizes originated loans from companies in emerging markets through the SPVs or VIEs to generate funding and transfers a portion of the associated economic risk to third-party investors. IFC’s continuing involvement in the securitization transaction includes servicing the underlying loans and retaining interests in the mezzanine and junior tranches. The principal risks associated with this ongoing involvement relate to the performance of the underlying loans, IFC’s position within the capital structure of the securitization vehicle, and prevailing market yields on the securities. Creditors of the VIEs have legal recourse only to the VIEs’ assets and not IFC’s general credit. The VIEs’ assets, primarily loans, are restricted from being sold or pledged as collateral, with their cash flows solely servicing the non-recourse liabilities. IFC has controlling financial interest in the VIEs due to (1) the power to direct the activities of the VIEs through servicing and the right to direct redemption of the securities under certain circumstances, and (2) the obligation to absorb losses or the right to receive benefits from the VIEs that could potentially be significant to the VIE. As the primary beneficiary, IFC consolidates the assets and liabilities of these VIEs.
| | | | | | | | |
| INTERNATIONAL FINANCE CORPORATION | Page 135 |
| | | | | | | | |
NOTES TO CONSOLIDATED FINANCIAL STATEMENTS |
NOTE N – VARIABLE INTEREST ENTITIES (continued)
The table summarizes consolidated VIE’s assets and liabilities on IFC’s consolidated balance sheets as of June 30, 2026, excluding intercompany balances which are eliminated during consolidation.
| | | | | | | |
Table N2: Carrying values of IFC’s investment in consolidated VIEs |
(US$ in millions) | | | June 30, 2026 |
Assets | | | |
Cash and due from banks | | | $ | 41 | |
Loans at amortized cost | | | 914 | |
Less: Reserve against losses on loans | | | (28) | |
Loans at amortized cost less reserve against losses | | | 886 | |
Loans accounted for at fair value under the Fair Value Option | | | 7 | |
Other receivables | | | 6 |
Total Assets | | | $ | 940 | |
Liabilities | | | |
Securitized borrowings | | | $ | 682 | |
Payables and Other Liabilities | | | 3 |
Total Liabilities | | | $ | 685 | |
| | | |
Separately, IFC is the primary beneficiary of a VIE for the building and the land at 2100 K Street. The building and land, with a combined value of $100 million as of June 30, 2026 ($104 million – June 30, 2025), are reported under “Receivables and other assets” on IFC's consolidated balance sheets.
NOTE O – PENSION AND OTHER POST- RETIREMENT BENEFITS
IBRD, IFC and MIGA participate in the defined benefit Staff Retirement Plan (SRP), a Retired Staff Benefits Plan (RSBP) and a Post-Employment Benefits Plan (PEBP) (collectively “the Pension Plans”) that cover all WBG employees, retirees and their beneficiaries. The SRP provides pension benefits and includes a cash balance plan. The RSBP provides certain health and life insurance benefits to eligible retirees. The PEBP provides certain pension benefits administered outside the SRP.
IFC uses a June 30th measurement date for its pension and other post-retirement benefit plans. All costs, assets, and liabilities associated with the Pension Plans are allocated among IBRD, IFC, and MIGA based upon their employees’ respective participation in the Pension Plans. IDA, IFC, and MIGA reimburse IBRD for their proportionate share of any contributions made to the Plans by IBRD. Contributions to the Pension Plans are calculated as a percentage of salary.
The following table summarizes the benefit costs associated with the SRP, RSBP, and PEBP allocated to IFC for the years ended June 30, 2026, June 30, 2025 and June 30, 2024. For the years ended June 30, 2026, June 30, 2025 and June 30, 2024, the service costs of $188 million, $207 million, and $204 million, are included in “Administrative expenses”, respectively. The components of net periodic pension cost, other than the service cost component, are included in “Other, net” in the consolidated statements of operations.
| | | | | | | | | | | | | | | | | | | | | | | | | | | | | | | | | | | | | | | | | | | | | | | | | | | | | |
Table O1: Net periodic pension Cost - SRP, RSBP & PEBP |
| For the year ended June 30, |
| SRP | | RSBP | | PEBP |
(US$ in millions) | 2026 | | 2025 | | 2024 | | 2026 | | 2025 | | 2024 | | 2026 | | 2025 | | 2024 |
Pension Plan Benefit costs | | | | | | | | | | | | | | | | | |
Service cost | $ | 138 | | | $ | 147 | | | $ | 141 | | | $ | 24 | | | $ | 33 | | | $ | 34 | | | $ | 26 | | | $ | 27 | | | $ | 29 | |
Other components | | | | | | | | | | | | | | | | | |
Interest cost | 296 | | | 290 | | | 254 | | | 35 | | | 42 | | | 37 | | | 40 | | | 38 | | | 34 | |
Expected return on plan assets | (323) | | | (319) | | | (292) | | | (65) | | | (63) | | | (58) | | | — | | | — | | | — | |
Amortization of unrecognized prior service cost a | — | | | 1 | | | 1 | | | 1 | | | — | | | — | | | — | | | 2 | | | 2 | |
Amortization of unrecognized net actuarial gains a | (30) | | | — | | | — | | | (31) | | | (15) | | | (15) | | | (2) | | | — | | | — | |
Sub total | (57) | | | (28) | | | (37) | | | (60) | | | (36) | | | (36) | | | 38 | | | 40 | | | 36 | |
Net periodic pension cost | $ | 81 | | | $ | 119 | | | $ | 104 | | | $ | (36) | | | $ | (3) | | | $ | (2) | | | $ | 64 | | | $ | 67 | | | $ | 65 | |
_________ |
a Included in Amounts reclassified from AOCI into net income in Note H. |
| | | | | | | | |
| INTERNATIONAL FINANCE CORPORATION | Page 136 |
| | | | | | | | |
NOTES TO CONSOLIDATED FINANCIAL STATEMENTS |
NOTE O – PENSION AND OTHER POST-RETIREMENT BENEFITS (continued)
The following table summarizes the Projected Benefit Obligations (PBO), fair value of plan assets, and funded status associated with the SRP, RSBP and PEBP for IFC for the years ended June 30, 2026 and June 30, 2025. Since the assets for the PEBP are not held in an irrevocable trust separate from the assets of IBRD, they do not qualify for off-balance sheet accounting and are therefore included in IBRD's investment portfolio. IFC has recognized a receivable (prepaid asset) from IBRD and a payable (liability) to IBRD equal to the amount required to support the PEBP. The assets of the PEBP are mostly invested in fixed income, equity instruments and other fund investments.
| | | | | | | | | | | | | | | | | | | | | | | | | | | | | | | | | | | |
Table O2: PBO, funded status and accumulated benefit obligations |
| For the year ended June 30, |
| SRP | | RSBP | | PEBP |
(US$ in millions) | 2026 | | 2025 | | 2026 | | 2025 | | 2026 | | 2025 |
Projected benefit obligations | | | | | | | | | | | |
Beginning of year | $ | 5,522 | | | $ | 5,538 | | | $ | 640 | | | $ | 787 | | | $ | 732 | | | $ | 734 | |
Service cost | 138 | | | 147 | | | 24 | | | 33 | | | 26 | | | 27 | |
Interest cost | 296 | | | 290 | | | 35 | | | 42 | | | 40 | | | 38 | |
Net entity transfers | (11) | | | 31 | | | (2) | | | 2 | | | — | | | — | |
Participant contributions | 75 | | | 69 | | | 5 | | | 5 | | | 3 | | | 3 | |
| | | | | | | | | | | |
| | | | | | | | | | | |
Benefits paid | (216) | | | (191) | | | (20) | | | (19) | | | (21) | | | (17) | |
Actuarial loss (gain) | 33 | | | (362) | | | 62 | | | (210) | | | — | | | (53) | |
End of year | 5,837 | | | 5,522 | | | 744 | | | 640 | | | 780 | | | 732 | |
Fair value of plan assets | | | | | | | | | | | |
Beginning of year | 5,927 | | | 5,445 | | | 1,186 | | | 1,080 | | | — | | | — | |
Net entity transfers | (11) | | | 31 | | | (2) | | | 2 | | | — | | | — | |
Participant contributions | 75 | | | 69 | | | 5 | | | 5 | | | — | | | — | |
Actual return on assets | 794 | | | 524 | | | 157 | | | 105 | | | — | | | — | |
Employer contributions | 54 | | | 49 | | | 10 | | | 13 | | | — | | | — | |
Benefits paid | (216) | | | (191) | | | (20) | | | (19) | | | — | | | — | |
End of year | 6,623 | | | 5,927 | | | 1,336 | | | 1,186 | | | — | | | — | |
Funded status a | 786 | | | 405 | | | 592 | | | 546 | | | (780) | | | (732) | |
Accumulated benefit obligations | $ | 5,427 | | | $ | 5,121 | | | $ | 744 | | | $ | 640 | | | $ | 719 | | | $ | 669 | |
_________ | | | | | | | | | | | |
a Positive funded status is included in “Receivables and other assets” and negative funded status is included in “Payables and other liabilities” on the Balance Sheets. |
As of June 30, 2026, the SRP and RSBP were overfunded by $786 million and $592 million, respectively. The PEBP, after reflecting IFC’s share of assets which are included in the Pension and Other Post-retirement Benefits receivable from IBRD ($984 million), was overfunded by $204 million.
During the fiscal years ended June 30, 2026 and June 30, 2025, there were no amendments made to the retirement benefit plans.
| | | | | | | | |
| INTERNATIONAL FINANCE CORPORATION | Page 137 |
| | | | | | | | |
NOTES TO CONSOLIDATED FINANCIAL STATEMENTS |
NOTE O – PENSION AND OTHER POST-RETIREMENT BENEFITS (continued)
The following tables present the amounts included in Accumulated Other Comprehensive Income relating to Pension and Other Post-retirement Benefits:
| | | | | | | | | | | | | | | | | | | | | | | |
Table O3: Amounts included in Accumulated other comprehensive income |
| As of June 30, 2026 |
(US$ in millions) | SRP | | RSBP | | PEBP | | Total |
Net actuarial gains | $ | (1,245) | | | $ | (573) | | | $ | (108) | | | $ | (1,926) | |
Prior service cost | — | | | 1 | | | — | | | 1 | |
Net amount recognized in accumulated other comprehensive income | $ | (1,245) | | | $ | (572) | | | $ | (108) | | | $ | (1,925) | |
| | | | | | | | | | | | | | | | | | | | | | | |
Table O3.1: | | | | | | | |
| As of June 30, 2025 |
(US$ in millions) | SRP | | RSBP | | PEBP | | Total |
Net actuarial gains | $ | (837) | | | $ | (575) | | | $ | (110) | | | $ | (1,522) | |
Prior service cost | — | | | 2 | | | — | | | 2 | |
Net amount recognized in accumulated other comprehensive income | $ | (837) | | | $ | (573) | | | $ | (110) | | | $ | (1,520) | |
Assumptions
The actuarial assumptions used are based on financial market interest rates, inflation expectations, past experience, and Management’s best estimate of future benefit changes and economic conditions. Changes in these assumptions will impact future benefit costs and obligations.
The expected long-term rate of return for the SRP assets is a weighted average of the expected long-term (10 years or more) returns for the various asset classes, weighted by the portfolio allocation. Asset class returns are developed using a forward-looking building block approach. Equity returns are generally developed as the sum of expected inflation, expected real earnings growth and expected long-term dividend yield. Bond returns are generally developed as the sum of expected inflation, real bond yield, duration-adjusted change in yields and risk premium/spread (as appropriate). Other asset class returns are derived from their relationship to equity and bond markets. The expected long-term rate of return for the RSBP is computed using procedures similar to those used for the SRP. The discount rate used in determining the benefit obligation is selected by reference to the year end yield of AA corporate bonds.
Actuarial gains and losses occur when actual results are different from expected results. Amortization of these unrecognized gains and losses will be included in income if, at the beginning of the fiscal year, they exceed 10% of the greater of the projected benefit obligation or the market-related value of plan assets. If required, the unrecognized gains and losses are amortized over the expected average remaining service lives of the employee group.
The following tables present the weighted-average assumptions used in determining the projected benefit obligations for the years ended June 30, 2026 and June 30, 2025 and the net periodic pension costs for the years ended June 30, 2026, June 30, 2025 and June 30, 2024:
| | | | | | | | | | | | | | | | | | | | | | | | | | | | | | | | | | | | | | | | | |
Table O4: Weighted average assumptions used to determine projected benefit obligations | | |
| SRP | | RSBP | | PEBP |
(In percent, except years) | 2026 | | 2025 | | | | 2026 | | 2025 | | | | 2026 | | 2025 | | |
Discount rate | 5.60 | | 5.50 | | | | 5.70 | | 5.60 | | | | 5.70 | | 5.50 | | |
Rate of compensation increase | 4.70 | | 4.80 | | | | | | | | | | 4.70 | | 4.80 | | |
Health care growth rates – at end of fiscal year | | | | | | | 8.00 | | 6.00 | | | | | | | | |
Ultimate health care growth rate | | | | | | | 4.00 | | 4.00 | | | | | | | | |
Year in which ultimate rate is reached | | | | | | | 2033 | | 2033 | | | | | | | | |
Interest crediting rate | 5.00 | | 5.00 | | | | n.a | | n.a | | | | 5.00 | | 5.00 | | |
| | | | | | | | |
| INTERNATIONAL FINANCE CORPORATION | Page 138 |
| | | | | | | | |
NOTES TO CONSOLIDATED FINANCIAL STATEMENTS |
NOTE O – PENSION AND OTHER POST-RETIREMENT BENEFITS (continued)
| | | | | | | | | | | | | | | | | | | | | | | | | | | | | | | | | | | | | | | | | | | | | | | | | | | | | |
Table O5: Weighted average assumptions used to determine net periodic pension cost |
| SRP | | RSBP | | PEBP |
(In percent, except years) | 2026 | | 2025 | | 2024 | | 2026 | | 2025 | | 2024 | | 2026 | | 2025 | | 2024 |
Discount rate | 5.50 | | 5.30 | | 4.90 | | 5.60 | | 5.40 | | 4.90 | | 5.50 | | 5.30 | | 4.90 |
Expected return on plan assets | 5.50 | | 5.90 | | 5.70 | | 5.50 | | 5.90 | | 5.70 | | | | | | |
Rate of compensation increase | 4.80 | | 5.20 | | 5.10 | | | | | | | | 4.80 | | 5.20 | | 5.10 |
Health care growth rates – at end of fiscal year | | | | | | | 6.00 | | 5.40 | | 5.40 | | | | | | |
Ultimate health care growth rate | | | | | | | 4.00 | | 4.40 | | 4.20 | | | | | | |
Year in which ultimate rate is reached | | | | | | | 2033 | | 2031 | | 2031 | | | | | | |
Interest crediting rate | 5.00 | | 5.40 | | 5.20 | | n.a | | n.a | | n.a | | 5.00 | | 5.40 | | 5.20 |
The medical cost trend rate can significantly affect the reported post-retirement benefit income or costs and benefit obligations for the RSBP. For the fiscal year ended June 30, 2026, the net actuarial gains were primarily driven by an increase in the value of the plan assets in excess of expected asset returns and by the increase in the discount rate, offset by changes in demographic experience for all plans and updated medical cost trend rates for the RSBP. For the fiscal year ended June 30, 2025, the net actuarial gains were primarily attributable to the decrease in the expected inflation assumption and an increase in the nominal discount rate, offset by changes in demographic experience. In addition, there was an increase in the value of the plan assets that exceeded the expected asset returns.
Investment Strategy
The investment policies establish the framework for investment of plan assets based on long-term investment objectives and the trade-offs inherent in seeking adequate investment returns within acceptable risk parameters. A key component of the investment policy is to establish a Strategic Asset Allocation (SAA) representing the policy portfolio (i.e., policy mix of assets) around which the SRP and RSBP (the Plans) are invested. The SAA is derived using a mix of quantitative analysis that incorporates expected returns and volatilities by asset class as well as correlations across asset classes, and qualitative considerations such as the liquidity needs of the Plans. The SAA for the Plans is reviewed in detail and reset about every three to five years, with more frequent reviews and changes if and as needed based on market conditions.
The key long-term objective is to generate asset performance that is reasonable in relation to the growth rate of the underlying liabilities and the assumed sponsor contribution rates, without taking undue risks. Given the relatively long investment horizons of the SRP and RSBP, and the relatively modest liquidity needs over the short-term to pay benefits and meet other cash requirements, the focus of the investment strategy is on generating sustainable long-term investment returns through a globally diversified set of strategies including fixed income, public and private equity and real assets. The most recent comprehensive review of the SAA was completed by the Pension Finance Committee (PFC) in April 2024, resulting in modest shifts across equity and alternative asset allocations, reflecting a disciplined and deliberate approach to portfolio positioning. The updated SAA became effective on July 1, 2024.
| | | | | | | | |
| INTERNATIONAL FINANCE CORPORATION | Page 139 |
| | | | | | | | |
NOTES TO CONSOLIDATED FINANCIAL STATEMENTS |
NOTE O – PENSION AND OTHER POST-RETIREMENT BENEFITS (continued)
The following table presents the policy asset allocation at June 30, 2026 and the actual asset allocations at June 30, 2026 and June 30, 2025 by asset category for the SRP and RSBP.
| | | | | | | | | | | | | | | | | | | | | | | | | | | | | | | | | | | |
Table O6: Policy and actual asset allocations |
| SRP | | RSBP |
| Policy Allocation 2026 (%) | | Actual Allocation % | | Policy Allocation 2026 (%) | | Actual Allocation % |
| | 2026 | | 2025 | | | 2026 | | 2025 |
Asset class | | | | | | | | | | | |
Public equity | 29 | % | | 27 | % | | 25 | % | | 29 | % | | 28 | % | | 25 | % |
Fixed income and cash | 20 | | | 21 | | | 19 | | | 20 | | | 21 | | | 20 | |
Private equity | 20 | | | 22 | | | 24 | | | 20 | | | 21 | | | 23 | |
Real assets a | 15 | | | 14 | | | 14 | | | 15 | | | 14 | | | 15 | |
Absolute return strategies | 9 | | | 9 | | | 9 | | | 9 | | | 9 | | | 9 | |
Credit strategies | 7 | | | 6 | | | 8 | | | 7 | | | 6 | | | 7 | |
Other b | — | | | 1 | | | 1 | | | — | | | 1 | | | 1 | |
Total | 100% | | 100% | | 100% | | 100% | | 100% | | 100% |
_________ | | | | | | | | | | | |
a Includes public and private real estate, infrastructure and timber. b Includes authorized investments that are outside the policy allocations primarily in hedge funds. |
Significant concentrations of risk in plan assets
The assets of the SRP and RSBP are diversified across a variety of asset classes. Investments in these asset classes are further diversified across funds, managers, strategies, geographies and sectors, to limit the impact of any individual investment. Despite such diversification, equity market risk remains the primary source of the overall return volatility of the Plans. As of June 30, 2026, the largest exposure to a single counterparty was 13% and 14% of the plan assets in SRP and RSBP, respectively (12% and 13%, respectively – June 30, 2025).
Risk management practices
Managing investment risk is an integral part of managing the assets of the Plans. Asset diversification is central to the overall investment strategy and risk management approach for the Plans. Absolute risk indicators such as the overall return volatility and drawdown of the Plans are the primary measures used to define the risk tolerance level and establish the overall level of investment risk. In addition, the level of active risk (defined as the annualized standard deviation of portfolio returns relative to those of the policy portfolio) is closely monitored and managed on an ongoing basis.
Market risk is regularly monitored at the absolute level, as well as at relative levels with respect to the investment policy, manager benchmarks, and liabilities of the Plans. Stress tests are performed periodically using relevant market scenarios to assess the impact of extreme market events. Multi-factor risk analysis is also used to assess total portfolio risk at the absolute level and enhance understanding of market and economic risk drivers.
Monitoring of performance (at both manager and asset class levels) against benchmarks, and compliance with investment guidelines, are carried out on a regular basis which provide helpful information for assessing the impact on the portfolios caused by market risk factors. Risk management for different asset classes is tailored to their specific characteristics and is an integral part of the external managers’ due diligence and monitoring processes.
Credit risk is monitored on a regular basis and assessed for possible credit event impacts. The liquidity position of the Plans is analyzed at regular intervals and periodically tested using various stress scenarios to ensure that the Plans have sufficient liquidity to meet all cash flow requirements. In addition, the long-term cash flow needs of the Plans are considered during the SAA exercise and are one of the main drivers in determining the maximum allocation to illiquid investment vehicles.
The Plans introduced additional measures to strengthen the oversight of key risks, including concentration risk, cross-holding risk, thematic exposures, and other relevant risks. These risks are now monitored regularly at the total plan level. Through this enhanced monitoring, the Plans seek to ensure that the portfolio remains well diversified and is not unduly exposed to any single factor.
| | | | | | | | |
| INTERNATIONAL FINANCE CORPORATION | Page 140 |
| | | | | | | | |
NOTES TO CONSOLIDATED FINANCIAL STATEMENTS |
NOTE O – PENSION AND OTHER POST-RETIREMENT BENEFITS (continued)
Fair value measurements and disclosures
All plan assets are measured at fair value on a recurring basis. The following tables present the fair value hierarchy of major categories of plan assets as of June 30, 2026 and June 30, 2025:
| | | | | | | | | | | | | | | | | | | | | | | | | | | | | | | | | | | | | | | |
Table O7: Plan assets fair value hierarchy | | | | | | | | | | | | | | | |
| June 30, 2026 |
| SRP | | RSBP |
(US$ in millions) | Level 1 | | Level 2 | | | | Total | | Level 1 | | Level 2 | | | | Total |
Debt securities | | | | | | | | | | | | | | | |
Time deposits | $ | 1 | | | $ | 5 | | | | | $ | 6 | | | $ | 1 | | | $ | 2 | | | | | $ | 3 | |
Securities purchased under resale agreements | 2 | | | — | | | | | 2 | | | — | | | — | | | | | — | |
Government and agency securities | 879 | | | 87 | | | | | 966 | | | 187 | | | 18 | | | | | 205 | |
Corporate and convertible bonds | — | | | 116 | | | | | 116 | | | — | | | 24 | | | | | 24 | |
Asset-backed securities | — | | | 57 | | | | | 57 | | | — | | | 12 | | | | | 12 | |
Mortgage-backed securities | — | | | 162 | | | | | 162 | | | — | | | 32 | | | | | 32 | |
Total debt securities | 882 | | | 427 | | | | | 1,309 | | | 188 | | | 88 | | | | | 276 | |
Equity securities | | | | | | | | | | | | | | | |
US common stocks | 102 | | | — | | | | | 102 | | | 30 | | | — | | | | | 30 | |
Non-US common stocks | 521 | | | — | | | | | 521 | | | 114 | | | — | | | | | 114 | |
Mutual funds | 25 | | | — | | | | | 25 | | | 5 | | | — | | | | | 5 | |
Real estate investment trusts (REITs) | 41 | | | — | | | | | 41 | | | 7 | | | — | | | | | 7 | |
Total equity securities | 689 | | | — | | | | | 689 | | | 156 | | | — | | | | | 156 | |
Other funds at NAV a | | | | | | | | | | | | | | | |
Commingled funds | — | | | — | | | | | 1,209 | | | — | | | — | | | | | 229 | |
Private equity funds | — | | | — | | | | | 1,492 | | | — | | | — | | | | | 284 | |
Private credit funds | — | | | — | | | | | 416 | | | — | | | — | | | | | 80 | |
Hedge funds | — | | | — | | | | | 626 | | | — | | | — | | | | | 124 | |
Real asset funds (including real estate, infrastructure and timber) | — | | | — | | | | | 855 | | | — | | | — | | | | | 183 | |
Total other funds | — | | | — | | | | | 4,598 | | | — | | | — | | | | | 900 | |
Derivative assets/ liabilities | — | | | — | | | | | — | | | — | | | — | | | | | — | |
Other assets/ liabilities b, net | — | | | — | | | | | 27 | | | — | | | — | | | | | 4 | |
Total Assets | $ | 1,571 | | | $ | 427 | | | | | $ | 6,623 | | | $ | 344 | | | $ | 88 | | | | | $ | 1,336 | |
_________ | | | | | | | | | | | | | | | |
a Investments measured at fair value using NAV as a practical expedient have not been included under the fair value hierarchy. b Includes receivables and payables carried at amounts that approximate fair value. |
| | | | | | | | |
| INTERNATIONAL FINANCE CORPORATION | Page 141 |
| | | | | | | | |
NOTES TO CONSOLIDATED FINANCIAL STATEMENTS |
NOTE O – PENSION AND OTHER POST-RETIREMENT BENEFITS (continued)
| | | | | | | | | | | | | | | | | | | | | | | | | | | | | | | | | | | | | | | |
Table O7.1: | | | | | | | | | | | | | | | |
| June 30, 2025 |
| SRP | | RSBP |
(US$ in millions) | Level 1 | | Level 2 | | | | Total | | Level 1 | | Level 2 | | | | Total |
Debt securities | | | | | | | | | | | | | | | |
Time deposits | $ | 2 | | | $ | 2 | | | | | $ | 4 | | | $ | 1 | | | $ | 1 | | | | | $ | 2 | |
Securities purchased under resale agreements | 32 | | | — | | | | | 32 | | | 9 | | | — | | | | | 9 | |
Government and agency securities | 743 | | | 100 | | | | | 843 | | | 160 | | | 23 | | | | | 183 | |
Corporate and convertible bonds | — | | | 83 | | | | | 83 | | | — | | | 18 | | | | | 18 | |
Asset-backed securities | — | | | 43 | | | | | 43 | | | — | | | 9 | | | | | 9 | |
Mortgage-backed securities | — | | | 133 | | | | | 133 | | | — | | | 25 | | | | | 25 | |
Total debt securities | 777 | | | 361 | | | | | 1,138 | | | 170 | | | 76 | | | | | 246 | |
Equity securities | | | | | | | | | | | | | | | |
US common stocks | 151 | | | — | | | | | 151 | | | 24 | | | — | | | | | 24 | |
Non-US common stocks | 413 | | | — | | | | | 413 | | | 93 | | | — | | | | | 93 | |
| | | | | | | | | | | | | | | |
Real estate investment trusts (REITs) | 40 | | | — | | | | | 40 | | | 7 | | | — | | | | | 7 | |
Total equity securities | 604 | | | — | | | | | 604 | | | 124 | | | — | | | | | 124 | |
Other funds at NAV a | | | | | | | | | | | | | | | |
Commingled funds | — | | | — | | | | | 944 | | | — | | | — | | | | | 180 | |
Private equity funds | — | | | — | | | | | 1,397 | | | — | | | — | | | | | 271 | |
Private credit funds | — | | | — | | | | | 448 | | | — | | | — | | | | | 85 | |
Hedge funds | — | | | — | | | | | 561 | | | — | | | — | | | | | 107 | |
Real asset funds (including real estate, infrastructure and timber) | — | | | — | | | | | 796 | | | — | | | — | | | | | 169 | |
Total other funds | — | | | — | | | | | 4,146 | | | — | | | — | | | | | 812 | |
Derivative assets/ liabilities | 2 | | | — | | | | | 2 | | | — | | | — | | | | | — | |
Other assets / liabilities b, net | — | | | — | | | | | 37 | | | — | | | — | | | | | 4 | |
Total Assets | $ | 1,383 | | | $ | 361 | | | | | $ | 5,927 | | | $ | 294 | | | $ | 76 | | | | | $ | 1,186 | |
_________ |
a Investments measured at fair value using NAV as a practical expedient have not been included under the fair value hierarchy. b Includes receivables and payables carried at amounts that approximate fair value. |
Valuation methods and assumptions
The following are general descriptions of asset categories, as well as the valuation methodologies and inputs used to determine the fair value of each major category of plan assets. Investment amounts in the asset categories shown in the table above may be different from the asset category allocation shown in the Investment Strategy section of the note. Asset classes in the table above are grouped by the characteristics of the investments held. The asset class break-down in the Investment Strategy section is based on Management’s view of the economic exposures after considering the impact of derivatives and certain trading strategies.
Debt securities
Debt securities include discount notes, securities purchased under resale agreements, U.S. Treasuries and agencies, debt obligations of foreign governments, sub-sovereigns and domestic and foreign corporations. Debt securities also include investments in ABS such as collateralized mortgage obligations and MBS. Debt securities are not listed on an exchange and are valued by independent pricing vendors either using direct quoted prices in active markets or valuation techniques incorporating observable market inputs such as comparable trades, dealer quotes, interest rates, prepayment speeds, spreads and other market data. Management believes its estimates of fair value are reasonable based on sourcing securities prices from multiple independent third-party vendors and periodic reviews over valuation. Money market instruments and securities purchased under resale agreements are reported at face value which approximates fair value.
Equity securities
Equity securities (including REITs) represent investments in entities in various industries and countries. Investments in public equity listed on securities exchanges are valued at the quoted closing price on the last business day of the reporting period.
| | | | | | | | |
| INTERNATIONAL FINANCE CORPORATION | Page 142 |
| | | | | | | | |
NOTES TO CONSOLIDATED FINANCIAL STATEMENTS |
NOTE O – PENSION AND OTHER POST-RETIREMENT BENEFITS (continued)
Commingled funds
Commingled funds are typically collective investment vehicles, such as trusts that are reported at NAV as provided by the investment manager or sponsor of the fund based on the valuation of underlying investments.
Private equity funds
Private equity funds include investments primarily in buyout, venture, growth capital, and secondary funds across North America, Europe and Asia in a variety of sectors. Many of these funds are in the investment phase of their life cycle. Private Equity investments do not have a readily determinable fair market value and are reported at NAV provided by the fund managers, taking into consideration the latest audited financial statements of the funds.
Private credit funds
Private credit funds include investments primarily in corporate and asset-based private lending funds. The funds with these strategies offer attractive yields with downside protection compared to public credit markets. Many of these funds are in the investment phase of their life-cycle. Private credit investments do not have a readily determinable fair value and are reported at NAV provided by the fund managers, taking into consideration the latest audited financial statements of the funds.
Real asset funds (including real estate, infrastructure and timber)
Real asset funds include several funds which invest in core real assets, non-core real assets and infrastructure investments such as debt, value add, and opportunistic equity investments. It also includes investments in timber funds. Real asset investments do not have a readily determinable fair market value and are reported at NAV provided by the fund managers, taking into consideration the latest audited financial statements of the funds.
Absolute Returns strategies
Absolute Return strategies represent a portfolio comprising hedge funds. These funds consist of investments in equity fundamental, equity quantitative, fixed income arbitrage, multi strategy, macro discretionary, macro quantitative, volatility arbitrage, and merger arbitrage strategies. These investments do not have a readily determinable fair market value and are reported at NAV provided by external managers or fund administrators (based on the valuations of underlying investments) monthly, taking into consideration the latest audited financial statements of the funds.
Investments in hedge funds and commingled funds can typically be redeemed at NAV within the near term while investments in private equity and most real estate are inherently long term and illiquid in nature with a quarter lag in reporting by the fund managers. Since the reporting of those asset classes is done with a lag, management estimates are based on the latest available information considering underlying market fundamentals and significant events through the Balance Sheet date.
Investment in derivatives
Investment in derivatives such as equity or bond futures, swaps, options and currency forwards are used to achieve a variety of objectives that include hedging interest rates and currency risks, gaining desired market exposure of a security, an index or currency exposure and rebalancing the portfolio. Over-the-counter derivatives are reported using valuations based on discounted cash flow methods incorporating observable market inputs.
Estimated future benefits payments
The following table shows the benefit payments expected to be paid in each of the next five years and subsequent five years. The expected benefit payments are based on the same assumptions used to measure the benefit obligation:
| | | | | | | | | | | | | | | | | |
Table O8: Expected benefit payments | | | | | |
(US$ in millions) | SRP | | RSBP | | PEBP |
July 1, 2026 – June 30, 2027 | $ | 252 | | | $ | 17 | | | $ | 30 | |
July 1, 2027 – June 30, 2028 | 270 | | | 19 | | | 32 | |
July 1, 2028 – June 30, 2029 | 286 | | | 21 | | | 34 | |
July 1, 2029 – June 30, 2030 | 303 | | | 23 | | | 37 | |
July 1, 2030 – June 30, 2031 | 323 | | | 25 | | | 40 | |
July 1, 2031 – June 30, 2036 | 1,909 | | | 167 | | | 244 | |
Expected contributions
IFC’s contribution to the SRP and RSBP varies from year to year, as determined by the PFC, which bases its judgment on the results of annual actuarial valuations of the assets and liabilities of the SRP and RSBP. The best estimate of the amount of contributions expected to be paid to the SRP and RSBP by IFC during the fiscal year beginning July 1, 2026 is $68 million and $12 million, respectively.
| | | | | | | | |
| INTERNATIONAL FINANCE CORPORATION | Page 143 |
| | | | | | | | |
NOTES TO CONSOLIDATED FINANCIAL STATEMENTS |
NOTE P – OFFSETTING ASSETS AND LIABILITIES
IFC does not present derivative assets and liabilities or amounts due or owed under resale, repurchase and securities lending transactions related to contracts entered into with the same counterparty under a legally enforceable netting agreement on a net basis on its consolidated balance sheets. The following tables provide the gross and net positions of IFC’s derivative contracts, resale, repurchase and securities lending agreements considering amounts and collateral held or pledged in accordance with enforceable counterparty credit support and netting agreements described below. The gross and net positions include derivative assets of $223 million and derivative liabilities of $379 million as of June 30, 2026, related to derivative contracts that are not subject to counterparty credit support or netting agreements. Collateral amounts are included only to the extent of the related net derivative fair values or net resale, repurchase and securities lending agreements amounts.
| | | | | | | | | | | | | | | | | | | | | | | |
Table P1: Gross a and net positions of derivative contracts |
| June 30, 2026 |
| Gross amount presented in the consolidated balance sheets | | Amounts subject to legally enforceable master netting
agreements | | Collateral received/pledged | | Net amount |
(US$ in millions) | | | |
Derivative assets | $ | 4,997 | | a | $ | 2,684 | | | $ | 519 | | b | $ | 1,794 | |
Resale agreements | — | | | — | | | — | | | — | |
Total assets | $ | 4,997 | | | $ | 2,684 | | | $ | 519 | | | $ | 1,794 | |
| | | | | | | |
Derivative liabilities | $ | 7,156 | | a | $ | 2,684 | | | $ | 2,587 | | | $ | 1,885 | |
Repurchase and securities lending agreements | 4,586 | | | — | | | 4,569 | | | 17 | |
Total liabilities | $ | 11,742 | | | $ | 2,684 | | | $ | 7,156 | | | $ | 1,902 | |
| | | | | | | | | | | | | | | | | | | | | | | |
Table P1.1: | | | | | | | |
| June 30, 2025 |
| Gross amount presented in the consolidated balance sheets | | Amounts subject to legally enforceable master netting
agreements | | Collateral received/pledged | | Net amount |
(US$ in millions) | | | |
Derivative assets | $ | 4,702 | | a | $ | 2,828 | | | $ | 310 | | b | $ | 1,564 | |
Resale agreements | 946 | | | 204 | | | 742 | | | — | |
Total assets | $ | 5,648 | | | $ | 3,032 | | | $ | 1,052 | | | $ | 1,564 | |
| | | | | | | |
Derivative liabilities | $ | 7,901 | | a | $ | 2,828 | | | $ | 3,288 | | | $ | 1,785 | |
Repurchase and securities lending agreements | 4,586 | | | 204 | | | 4,382 | | | — | |
Total liabilities | $ | 12,487 | | | $ | 3,032 | | | $ | 7,670 | | | $ | 1,785 | |
_________ | | | | | | | |
a Gross amount presented herein comprises of derivatives and accrued interest income/expenses. Accrued income of $1,991 million ($1,697 million - June 30, 2025) is reported in “receivables and other assets” and accrued expenses of $1,341 million ($1,281 million - June 30, 2025) are reported “payables and other liabilities” in IFC’s consolidated balance sheets. |
b Includes cash collateral only as of June 30, 2026 and June 30, 2025. |
IFC’s derivative contracts with market counterparties are entered into under standardized master agreements published by the International Swaps and Derivatives Association (ISDA). ISDA Agreements provide for a single lump sum settlement amount upon the early termination of transactions following a default or termination event whereby amounts payable by the non-defaulting party to the other party may be applied to reduce any amounts that the other party owes the non-defaulting party. This setoff effectively reduces any amount payable by the non-defaulting party to the defaulting party.
IFC’s ISDA Agreements are appended by a Credit Support Annex (CSA) that provides for the receipt or posting of collateral in the form of cash, U.S. Treasury securities or U.K. gilts to reduce mark-to-market exposure among derivative market counterparties. Cash collateral received is recorded as an asset with a corresponding liability for the obligation to return it. For cash collateral posted, a corresponding receivable is recorded on IFC’s consolidated balance sheets. Securities received as collateral are not recognized on IFC’s consolidated balance sheets, while securities posted as collateral remain on the balance sheets and are disclosed as securities pledged.
| | | | | | | | |
| INTERNATIONAL FINANCE CORPORATION | Page 144 |
| | | | | | | | |
NOTES TO CONSOLIDATED FINANCIAL STATEMENTS |
NOTE P – OFFSETTING ASSETS AND LIABILITIES (continued)
In accordance with the CSAs, IFC may rehypothecate securities received as collateral, subject to the obligation to return such collateral and any related distributions received. In the event of a counterparty default, IFC may exercise certain rights and remedies, including the right to set off any amounts payable by the counterparty against any collateral held by IFC and the right to liquidate any collateral held. As of June 30, 2026 and June 30, 2025, no collateral received was rehypothecated under securities lending agreements.
The table below summarizes IFC's collateral pledged and received under CSAs as of June 30, 2026, and June 30, 2025:
| | | | | | | | |
Table P2: Collateral pledged and received under CSA |
(US$ in millions) | June 30, 2026 | June 30, 2025 |
Cash collateral received | $ | 540 | | $ | 346 | |
Securities collateral received (estimated fair value) | — | | — | |
| | |
Cash collateral pledged | 1,200 | | 1,263 | |
| | |
| | |
| | |
Trading securities pledged (fair value) | 1,475 | | 2,126 | |
| | |
| | |
Under certain CSA’s IFC is not required to pledge collateral unless its CR is downgraded from its current AAA/Aaa. The aggregate fair value of derivatives containing such a credit risk-linked contingent feature in a net liability position was $13 million as of June 30, 2026 ($93 million – June 30, 2025). As of June 30, 2026, IFC had no collateral posted under these agreements. If IFC’s CR were to be downgraded from its current AAA/Aaa to AA+/Aa1 or below, then collateral in the amount of $13 million would be required to be posted against net liability positions with counterparties as of June 30, 2026 ($48 million – June 30, 2025).
IFC’s resale, repurchase and securities lending transactions are entered into with counterparties under industry standard master netting agreements which generally provide the right to offset amounts owed one another with respect to multiple transactions under such master netting agreement and to liquidate the purchased or borrowed securities in the event of counterparty default. The estimated fair value of all securities received and held as collateral under these master netting agreements by IFC was $0 as of June 30, 2026 ($946 million – June 30, 2025).
The following tables present an analysis of IFC’s repurchase agreements by (1) class of collateral pledged and (2) their remaining contractual maturity as of June 30, 2026 and June 30, 2025:
| | | | | | | | | | | | | | | | | | | | | | | | | | | | | |
Table P3: Repurchase agreements - Categorized by remaining contractual maturity |
| Remaining Contractual Maturity of the Agreements – June 30, 2026 |
(US$ in millions) | Overnight and Continuous | | Up to 30 days | | 30-90 days | | Greater than 90 days | | Total |
Repurchase agreements | | | | | | | | | |
U.S. Treasury securities | $ | — | | | $ | 845 | | | $ | 2,942 | | | $ | 799 | | | $ | 4,586 | |
| | | | | | | | | |
| | | | | | | | | |
Total Repurchase agreements | $ | — | | | $ | 845 | | | $ | 2,942 | | | $ | 799 | | | $ | 4,586 | |
| Plus: cash collateral payable | | 540 | |
| Less: accrued interest on cash collateral and repos, net. | | (26) | |
Securities sold under repurchase agreements and payable for cash collateral received | | $ | 5,100 | |
| | | | | | | | | |
| | | | | | | | | |
| | | | | | | | | |
| | | | | | | | | |
| | | | | | | | | | | | | | | | | | | | | | | | | | | | | |
Table P3.1: |
| Remaining Contractual Maturity of the Agreements – June 30, 2025 |
(US$ in millions) | Overnight and Continuous | | Up to 30 days | | 30-90 days | | Greater than 90 days | | Total |
Repurchase agreements | | | | | | | | | |
U.S. Treasury securities | $ | — | | | $ | 995 | | | $ | 1,764 | | | $ | 1,827 | | | $ | 4,586 | |
| | | | | | | | | |
| | | | | | | | | |
Total Repurchase agreements | $ | — | | | $ | 995 | | | $ | 1,764 | | | $ | 1,827 | | | $ | 4,586 | |
| Plus: cash collateral payable | | 346 | |
| Less: accrued interest on cash collateral and repos, net. | | (39) | |
Securities sold under repurchase agreements and payable for cash collateral received | | $ | 4,893 | |
As of both June 30, 2026 and June 30, 2025, IFC has no repurchase-to-maturity transactions nor securities lending transactions outstanding.
| | | | | | | | |
| INTERNATIONAL FINANCE CORPORATION | Page 145 |
| | | | | | | | |
NOTES TO CONSOLIDATED FINANCIAL STATEMENTS |
NOTE Q – RECEIVABLES AND OTHER ASSETS
Receivables and other assets are summarized below:
| | | | | | | | | | | |
Table Q1: Total Receivables and other assets | | | |
(US$ in millions) | June 30, 2026 | | June 30, 2025 |
Accrued income on derivative instruments | $ | 1,992 | | | $ | 1,697 | |
Assets under retirement benefit plans | 1,378 | | | 951 | |
Receivables from sales of securities | 1,161 | | | 711 | |
PEBP receivable from IBRD | 984 | | | 859 | |
Accrued interest income on loans | 759 | | | 686 | |
Post-retirement contribution reserve fund | 474 | | | 502 | |
Accrued interest income on time deposits and securities | 287 | | | 301 | |
Fixed assets | 1,652 | | | 1,528 | |
Less: Accumulated depreciation | (985) | | | (925) | |
Fixed assets, net | 667 | | | 603 | |
Deferred charges and other assets | 1,675 | | | 1,486 | |
Total receivables and other assets | $ | 9,377 | | | $ | 7,796 | |
NOTE R – PAYABLES AND OTHER LIABILITIES
Payables and other liabilities are summarized below:
| | | | | | | | | | | |
Table R1: Total Payables and other liabilities | | | |
(US$ in millions) | June 30, 2026 | | June 30, 2025 |
Accounts payable, accrued expenses and other liabilities | $ | 1,774 | | | $ | 1,602 | |
Accrued charges on borrowings | 1,577 | | | 1,252 | |
Accrued charges on derivative instruments | 1,341 | | | 1,281 | |
Payables for unsettled security trades | 1,165 | | | 780 | |
Liabilities under PEBP | 780 | | | 732 | |
Deferred income | 169 | | | 132 | |
| | | |
Secured borrowings and short sold securities | 106 | | | 70 | |
Total payables and other liabilities | $ | 6,912 | | | $ | 5,849 | |
NOTE S – CAPITAL TRANSACTIONS
Following the Spring Meetings in April 2018, the Board of Governors endorsed a financing package. This package comprised: (i) a three-step capital raising process which involved the conversion of $17 billion of retained earnings into paid-in capital, alongside a General Capital Increase (GCI) and Selective Capital Increase (SCI) to raise up to $5.5 billion in additional paid-in capital; (ii) the suspension of grants to IDA after the IDA 18 replenishment; and (iii) internal measures for increased efficiency. The authorized capital stock was increased to 25,079,991 shares of $1,000 par value each by the creation of 16,999,998 additional shares after converting a portion of the retained earnings into paid-in capital.
As of April 16, 2026, the subscription and payment periods for the 2018 Selective Capital Increase (SCI) and General Capital Increase (GCI) were closed. As of June 30, 2026, payments of $4.7 billion (GCI – $3.9 billion and SCI – $807 million) were received from 141 member countries.
During the year ended June 30, 2026, payments of $287 million were received from 28 member countries. For the years ended June 30, 2025 and June 30, 2024, $789 million and $624 million of payments were received, respectively.
| | | | | | | | |
| INTERNATIONAL FINANCE CORPORATION | Page 146 |
| | | | | | | | |
NOTES TO CONSOLIDATED FINANCIAL STATEMENTS |
NOTE T – OTHER INCOME
Other income for the years ended June 30, 2026, June 30, 2025 and June 30, 2024 comprise the following:
| | | | | | | | | | | | | | | | | |
Table T1: Other Income | | | | | |
| For the year ended June 30, |
(US$ in millions) | 2026 | | 2025 | | 2024 |
Investment gains on PEBP assets | $ | 118 | | | $ | 77 | | | $ | 63 | |
Fees collected from clients | 23 | | | 18 | | | 18 | |
PCRF income | 16 | | | 25 | | | 30 | |
Other reimbursable arrangements | 11 | | | 15 | | | 11 | |
| | | | | |
Others | 54 | | | 58 | | | 66 | |
Total Other Income | $ | 222 | | | $ | 193 | | | $ | 188 | |
NOTE U – INVESTMENTS TRANSACTIONS COMMITTED BUT NOT DISBURSED OR UTILIZED
Loan, equity and debt security commitments signed but not yet disbursed, and guarantee and client risk management facilities signed but not yet utilized are summarized below:
| | | | | | | | | | | |
Table U1: Loan, Equity and Debt security commitments signed but not yet disbursed | | | |
(US$ in millions) | June 30, 2026 | | June 30, 2025 |
Investment transactions committed but not disbursed | | | |
Loans, equity investments and debt securities | $ | 13,735 | | | $ | 12,548 | |
Investment transactions committed but not utilized | | | |
Guarantees | 3,200 | | | 2,119 | |
Client risk management facilities | 176 | | | 167 | |
Total investment transactions committed but not disbursed or utilized | $ | 17,111 | | | $ | 14,834 | |
The disbursements of investment transactions committed but not disbursed or utilized are generally subject to fulfillment of conditions of disbursement.
NOTE V – CONTINGENCIES
From time to time, IFC may be named as a defendant or co-defendant in legal actions on different grounds in various jurisdictions. The outcome of any existing legal action, in which IFC has been named as a defendant or co-defendant, as of and for the year ended June 30, 2026, is not expected to have a material adverse effect on IFC's financial position, results of operations or cash flows.
| | | | | | | | |
| INTERNATIONAL FINANCE CORPORATION | Page 147 |
| | |
Reporting to SEC on New and Matured Borrowings |
| | | | | | | | | | | | | | | | | | | | |
Quarter Ending Date | | | | | |
September 30, 2025 | | | | | |
New Medium and Long-Term Market Borrowings |
| External Id | Currency Code | Currency Amount | USD Amount | Interest Rate | Settle Date |
| 26_10XXXXX | AUD | 300,000,000 | 195,690,000 | 4.50 | | 18-Jul-25 |
| 26_14XXXXX | AUD | 200,000,000 | 130,210,000 | 4.90 | | 22-Jul-25 |
| 26_18XXXXX | AUD | 125,000,000 | 81,381,250 | 4.90 | | 22-Jul-25 |
| 26_25XXXXX | AUD | 100,000,000 | 65,105,000 | 4.90 | | 29-Jul-25 |
| 26_27XXXXX | AUD | 100,000,000 | 64,910,000 | 4.60 | | 30-Jul-25 |
| 26_43XXXXX | AUD | 30,000,000 | 19,969,500 | 5.05 | | 15-Sep-25 |
| 26_44XXXXX | AUD | 20,000,000 | 13,341,000 | 5.05 | | 17-Sep-25 |
| 26_55XXXXX | AUD | 100,000,000 | 65,630,000 | 4.50 | | 29-Sep-25 |
| | Sum Of Notional | 975,000,000 | 636,236,750 | | |
| 26_20XXXXX | AZN | 17,000,000 | 10,000,000 | 8.00 | | 23-Jul-25 |
| 26_39XXXXX | AZN | 10,000,000 | 5,882,353 | 7.80 | | 08-Sep-25 |
| | Sum Of Notional | 27,000,000 | 15,882,353 | | |
| 26_01XXXXX | BRL | 75,000,000 | 13,766,267 | 10.75 | | 09-Jul-25 |
| 26_06XXXXX | BRL | 150,000,000 | 26,840,354 | 11.50 | | 15-Jul-25 |
| 26_11XXXXX | BRL | 200,000,000 | 36,041,556 | 11.75 | | 18-Jul-25 |
| 26_17XXXXX | BRL | 100,000,000 | 17,919,541 | 11.50 | | 21-Jul-25 |
| 26_19XXXXX | BRL | 150,000,000 | 26,954,420 | 12.75 | | 23-Jul-25 |
| 26_32XXXXX | BRL | 50,000,000 | 9,149,382 | — | | 22-Aug-25 |
| 26_34XXXXX | BRL | 75,000,000 | 13,807,831 | 11.50 | | 27-Aug-25 |
| 26_45XXXXX | BRL | 150,000,000 | 28,327,809 | — | | 17-Sep-25 |
| 26_47XXXXX | BRL | 75,000,000 | 14,163,905 | 11.50 | | 17-Sep-25 |
| 26_51XXXXX | BRL | 250,000,000 | 47,326,525 | 11.50 | | 24-Sep-25 |
| | Sum Of Notional | 1,275,000,000 | 234,297,590 | | |
| 26_07XXXXX | CHF | 115,000,000 | 142,662,201 | 0.76 | | 07-Aug-25 |
| | Sum Of Notional | 115,000,000 | 142,662,201 | | |
| 26_29XXXXX | COP | 75,000,000,000 | 18,633,540 | 10.00 | | 12-Aug-25 |
| 26_46XXXXX | COP | 120,000,000,000 | 30,951,767 | 8.25 | | 18-Sep-25 |
| | Sum Of Notional | 195,000,000,000 | 49,585,307 | | |
| 26_05XXXXX | GBP | 650,000,000 | 874,640,000 | 4.00 | | 15-Jul-25 |
| 26_26XXXXX | GBP | 80,000,000 | 106,812,000 | 4.00 | | 29-Jul-25 |
| 26_40XXXXX | GBP | 50,000,000 | 67,887,500 | 4.00 | | 09-Sep-25 |
| 26_48XXXXX | GBP | 50,000,000 | 68,252,500 | 4.00 | | 18-Sep-25 |
| 26_53XXXXX | GBP | 25,000,000 | 33,363,750 | 4.00 | | 26-Sep-25 |
| | Sum Of Notional | 855,000,000 | 1,150,955,750 | | |
| 26_502XXXX | GEL | 40,000,000 | 14,713,997 | 8.16 | | 17-Sep-25 |
| | Sum Of Notional | 40,000,000 | 14,713,997 | | |
| 26_28XXXXX | HKD | 300,000,000 | 38,216,804 | 2.69 | | 01-Aug-25 |
| 26_52XXXXX | HKD | 200,000,000 | 25,707,932 | 2.86 | | 26-Sep-25 |
| | Sum Of Notional | 500,000,000 | | 63,924,736 | | | |
| 26_04XXXXX | KRW | 8,600,000,000 | | 6,257,367 | | 2.01 | | 11-Jul-25 |
| | Sum Of Notional | 8,600,000,000 | | 6,257,367 | | | |
| | | | | | | | |
| INTERNATIONAL FINANCE CORPORATION | Page 148 |
| | |
Reporting to SEC on New and Matured Borrowings |
| | | | | | | | | | | | | | | | | | | | |
| External Id | Currency Code | Currency Amount | USD Amount | Interest Rate | Settle Date |
| 26_35XXXXX | KZT | 12,500,000,000 | | 23,144,077 | | 15.00 | | 02-Sep-25 |
| | Sum Of Notional | 12,500,000,000 | | 23,144,077 | | | |
| 26_503YYYY | MNT | 105,000,000,000 | 29,190,992 | | 10.25 | | 29-Sep-25 |
| | Sum Of Notional | 105,000,000,000 | | 29,190,992 | | | |
| 26_41XXXXX | PEN | 50,000,000 | | 14,368,848 | | — | | 11-Sep-25 |
| | Sum Of Notional | 50,000,000 | | 14,368,848 | | | |
| 25_505XXXX | RON | 253,200,000 | | 59,019,603 | | 7.29 | | 03-Jul-25 |
| 26_15XXXXX | RON | 35,500,000 | | 8,193,222 | | 6.25 | | 22-Jul-25 |
| 26_30XXXXX | RON | 54,075,000 | | 12,484,704 | | 6.96 | | 18-Aug-25 |
| | Sum Of Notional | 342,775,000 | | 79,697,529 | | | |
| 26_501XXXX | RWF | 24,000,000,000 | | 16,608,997 | | 10.50 | | 15-Jul-25 |
| | Sum Of Notional | 24,000,000,000 | | 16,608,997 | | | |
| 26_02XXXXX | USD | 390,000,000 | | 390,000,000 | | 4.62 | | 10-Jul-25 |
| 26_03XXXXX | USD | 15,000,000 | 15,000,000 | | 5.32 | | 11-Jul-25 |
| 26_08XXXXX | USD | 45,000,000 | | 45,000,000 | | 3.90 | | 17-Jul-25 |
| 26_09XXXXX | USD | 250,000,000 | 250,000,000 | | 4.62 | | 17-Jul-25 |
| 26_12XXXXX | USD | 100,000,000 | | 100,000,000 | | 4.33 | | 21-Jul-25 |
| 26_13XXXXX | USD | 50,000,000 | | 50,000,000 | | 4.92 | | 23-Jul-25 |
| 26_16XXXXX | USD | 30,000,000 | | 30,000,000 | | 4.91 | | 23-Jul-25 |
| 26_21XXXXX | USD | 125,000,000 | | 125,000,000 | | 4.62 | | 24-Jul-25 |
| 26_22XXXXX | USD | 20,000,000 | | 20,000,000 | | 4.92 | | 25-Jul-25 |
| 26_23XXXXX | USD | 20,000,000 | | 20,000,000 | | 4.90 | | 28-Jul-25 |
| 26_24XXXXX | USD | 20,000,000 | | 20,000,000 | | 4.90 | | 30-Jul-25 |
| 26_31XXXXX | USD | 30,000,000 | | 30,000,000 | | 5.02 | | 22-Aug-25 |
| 26_36XXXXX | USD | 15,000,000 | | 15,000,000 | | 4.28 | | 28-Aug-25 |
| 26_37XXXXX | USD | 30,000,000 | | 30,000,000 | | 5.00 | | 02-Sep-25 |
| 26_38XXXXX | USD | 100,000,000 | | 100,000,000 | | 3.58 | | 05-Sep-25 |
| 26_42XXXXX | USD | 35,000,000 | | 35,000,000 | | 5.27 | | 15-Sep-25 |
| 26_49XXXXX | USD | 100,000,000 | | 100,000,000 | | 4.30 | | 26-Sep-25 |
| 26_50XXXXX | USD | 38,500,000 | | 38,500,000 | | 4.60 | | 24-Sep-25 |
| | Sum Of Notional | 1,413,500,000 | | 1,413,500,000 | | | |
| 26_33XXXXX | UZS | 125,000,000,000 | | 10,157,812 | | 10.90 | | 26-Aug-25 |
| | Sum Of Notional | 125,000,000,000 | | 10,157,812 | | | |
| | | | | | |
| TOTAL NEW MARKET BORROWINGS | 3,901,184,306 | | | |
| | | | | | |
NEW SECURITIZED BORROWINGS |
| External Id | Currency Code | Currency Amount | USD Amount | Interest Rate | Settle Date |
| — | USD | 320,000,000 | | 320,000,000 | | 5.45 | | 10-Sep-25 |
| — | USD | 25,000,000 | | 25,000,000 | | — | | 10-Sep-25 |
| | Sum Of Notional | 345,000,000 | | 345,000,000 | | | |
| | | | | | |
| TOTAL NEW SECURITIZED BORROWINGS | 345,000,000 | | | |
| | | | | | | | |
| INTERNATIONAL FINANCE CORPORATION | Page 149 |
| | |
Reporting to SEC on New and Matured Borrowings |
| | | | | | | | | | | | | | | | | | | | |
Medium and Long-Term Matured Market Borrowings | | |
| External Id | Currency Code | Currency Amount | USD Amount | Interest Rate | Maturity Date |
| 23_600_1XX | AZN | 4,372,740 | | 2,572,200 | | 6.00 | | 15-Jul-25 |
| 23_600_2XX | AZN | 4,129,810 | | 2,429,300 | | 6.00 | | 15-Jul-25 |
| | Sum Of Notional | 8,502,550 | | 5,001,500 | | | |
| External Id | Currency Code | Currency Amount | USD Amount | Interest Rate | Maturity Date |
| 24_656XXXX | BDT | 82,500,000 | | 677,897 | | 10.50 | | 08-Sep-25 |
| | Sum Of Notional | 82,500,000 | | 677,897 | | | |
| 21_04XXXXX | BRL | 30,000,000 | | 5,396,703 | | 4.25 | | 16-Jul-25 |
| 21_61XXXXX | BRL | 170,000,000 | | 30,581,315 | | 4.25 | | 16-Jul-25 |
| 21_115XXXX | BRL | 40,000,000 | | 7,572,244 | | — | | 24-Sep-25 |
| 21_32XXXXX | BRL | 30,000,000 | | 5,679,183 | | — | | 24-Sep-25 |
| 21_59XXXXX | BRL | 10,100,000 | | 1,911,992 | | — | | 24-Sep-25 |
| 21_90XXXXX | BRL | 40,000,000 | | 7,572,244 | | — | | 24-Sep-25 |
| | Sum Of Notional | 320,100,000 | | 58,713,681 | | | |
| 21_31XXXXX | CAD | 500,000,000 | | 363,279,689 | | 0.63 | | 16-Sep-25 |
| | Sum Of Notional | 500,000,000 | | 363,279,689 | | | |
| 22_120XXXX | CLP | 20,000,000,000 | | 20,631,318 | | 5.25 | | 04-Aug-25 |
| | Sum Of Notional | 20,000,000,000 | | 20,631,318 | | | |
| 23_22XXXXX | CNY | 300,000,000 | | 42,124,774 | | 2.75 | | 15-Sep-25 |
| | Sum Of Notional | 300,000,000 | | 42,124,774 | | | |
| 22_27XXXXX | HKD | 300,000,000 | | 38,514,619 | | 0.54 | | 10-Sep-25 |
| | Sum Of Notional | 300,000,000 | | 38,514,619 | | | |
| 16_28XXXXX | JPY | 350,000,000 | | 2,371,515 | | 5.60 | | 26-Aug-25 |
| | Sum Of Notional | 350,000,000 | | 2,371,515 | | | |
| 22_156XXXX | KRW | 10,600,000,000 | | 7,736,802 | | 2.35 | | 08-Jul-25 |
| 24_11XXXXX | KRW | 8,300,000,000 | | 6,007,745 | | 2.90 | | 07-Aug-25 |
| 24_16XXXXX | KRW | 49,700,000,000 | | 35,974,087 | | 2.90 | | 07-Aug-25 |
| 24_23XXXXX | KRW | 49,000,000,000 | | 35,467,410 | | 2.90 | | 07-Aug-25 |
| | Sum Of Notional | 117,600,000,000 | | 85,186,044 | | | |
| 19_519XXXX | KZT | 659,769,257 | | 1,237,551 | | 8.30 | | 18-Jul-25 |
| | Sum Of Notional | 659,769,257 | | 1,237,551 | | | |
| 18_174_B1X | MXN | 3,920,000,000 | | 209,495,154 | | — | | 06-Aug-25 |
| | Sum Of Notional | 3,920,000,000 | | 209,495,154 | | | |
| 21_30XXXXX | NZD | 400,000,000 | | 237,580,000 | | 0.38 | 10-Sep-25 |
| | | | | | | | |
| INTERNATIONAL FINANCE CORPORATION | Page 150 |
| | |
Reporting to SEC on New and Matured Borrowings |
| | | | | | | | | | | | | | | | | | | | |
| 21_41XXXXX | NZD | 425,000,000 | | 252,428,750 | | 0.38 | | 10-Sep-25 |
| | Sum Of Notional | 825,000,000 | | 490,008,750 | | | |
| 18_718_1XX | PHP | 165,641,920 | | 2,902,943 | | 6.34 | | 18-Sep-25 |
| | Sum Of Notional | 165,641,920 | 2,902,943 | | | |
| 23_536XXXX | RON | 89,000,000 | | 20,548,103 | | 7.94 | | 18-Aug-25 |
| 23_537XXXX | RON | 50,400,000 | | 11,636,229 | | 7.92 | | 18-Aug-25 |
| | Sum Of Notional | 139,400,000 | 32,184,332 | | | |
| External Id | Currency Code | Currency Amount | USD Amount | Interest Rate | Maturity Date |
| 24_49XXXXX | USD | 150,000,000 | | 150,000,000 | | 5.33 | | 1-Jul-25 |
| 21_01XXXXX | USD | 4,700,000 | 4,700,000 | 0.25 | 14-Jul-25 |
| 21_03XXXXX | USD | 29,950,000 | 29,950,000 | 0.38 | | 15-Jul-25 |
| 21_06XXXXX | USD | 2,000,000,000 | 2,000,000,000 | 0.38 | | 16-Jul-25 |
| 21_21XXXXX | USD | 18,940,000 | | 18,940,000 | | 0.25 | | 15-Aug-25 |
| 23_17XXXXX | USD | 25,000,000 | | 25,000,000 | | 3.33 | | 25-Aug-25 |
| 25_26XXXXX | USD | 12,000,000 | | 12,000,000 | | 3.92 | | 29-Aug-25 |
| 21_28XXXXX | USD | 15,000,000 | | 15,000,000 | | 0.35 | | 08-Sep-25 |
| 21_29XXXXX | USD | 20,000,000 | | 20,000,000 | | 0.20 | | 15-Sep-25 |
| 23_35XXXXX | USD | 2,000,000,000 | | 2,000,000,000 | | 3.63 | | 15-Sep-25 |
| | Sum Of Notional | 4,275,590,000 | | 4,275,590,000 | | | |
| | | | | | |
| TOTAL MATURED MARKET BORROWINGS | 5,627,919,767 | | | |
| | | | | | |
Matured IBRD and IDA Borrowings | | |
| External Id | Currency Code | Currency Amount | USD Amount | Interest Rate | Maturity Date |
| 15_30XXXXX | USD | 27,459,150 | | 27,459,150 | | 1.84 | | 15-Sep-25 |
| | Sum Of Notional | 27,459,150 | | 27,459,150 | | | |
| | | | | | |
| TOTAL MATURED IBRD AND IDA BORROWINGS | 27,459,150 | | | |
| | | | | | |
Net increase in Short-term Borrowings for the quarter ended September 30, 2025 | 205,024,250 | | | |
| | | | | | |
* Bonds where the stated interest rate is zero includes zero coupon bond issues where the contractual interest rate is zero, and structured notes where the contractual interest rate is initially zero. |
|
| | | | | | | | |
| INTERNATIONAL FINANCE CORPORATION | Page 151 |
| | |
Reporting to SEC on New and Matured Borrowings |
| | | | | | | | | | | | | | | | | | | | |
Quarter Ending Date | | | | | |
December 31, 2025 | | | | | |
New Medium and Long-Term Market Borrowings |
| External Id | Currency Code | Currency Amount | USD Amount | Interest Rate | Settle Date |
| 26_61XXXXX | AUD | 100,000,000 | | 65,935,000 | 4.50 | | 07-Oct-25 |
| 26_66XXXXX | AUD | 100,000,000 | | 65,510,000 | 3.64 | | 10-Oct-25 |
| 26_67XXXXX | AUD | 100,000,000 | | 65,510,000 | 3.15 | | 10-Oct-25 |
| 26_69XXXXX | AUD | 100,000,000 | | 64,450,000 | 4.45 | | 14-Oct-25 |
| 26_76XXXXX | AUD | 100,000,000 | | 64,900,000 | 3.64 | | 20-Oct-25 |
| 26_78XXXXX | AUD | 50,000,000 | | 32,450,000 | 3.64 | | 20-Oct-25 |
| 26_86XXXXX | AUD | 40,000,000 | | 26,020,000 | 5.00 | | 23-Oct-25 |
| 26_89XXXXX | AUD | 20,000,000 | | 13,111,000 | 4.98 | | 27-Oct-25 |
| 26_91XXXXX | AUD | 30,000,000 | | 19,696,500 | 4.98 | | 30-Oct-25 |
| 26_99XXXXX | AUD | 100,000,000 | | 64,790,000 | 4.45 | | 05-Nov-25 |
| 26_120XXXX | AUD | 25,000,000 | | 16,317,500 | 4.93 | | 28-Nov-25 |
| 26_123XXXX | AUD | 30,000,000 | | 19,767,000 | 5.35 | | 03-Dec-25 |
| 26_117XXXX | AUD | 20,000,000 | | 13,229,000 | 4.92 | | 04-Dec-25 |
| 26_122XXXX | AUD | 20,000,000 | | 13,229,000 | 5.03 | | 04-Dec-25 |
| | Sum Of Notional | 835,000,000 | | 544,915,000 | | |
| 26_87XXXXX | BRL | 50,000,000 | | 9,257,888 | — | | 23-Oct-25 |
| 26_88XXXXX | BRL | 75,000,000 | | 13,886,832 | 11.50 | | 23-Oct-25 |
| 26_98XXXXX | BRL | 250,000,000 | | 46,431,722 | 11.50 | | 31-Oct-25 |
| 26_114XXXX | BRL | 75,000,000 | | 14,079,748 | 11.50 | | 18-Nov-25 |
| 26_115XXXX | BRL | 100,000,000 | | 18,770,178 | — | | 19-Nov-25 |
| 26_119XXXX | BRL | 75,000,000 | | 13,934,563 | 11.50 | | 26-Nov-25 |
| 26_126XXXX | BRL | 75,000,000 | | 13,806,307 | 10.75 | | 09-Dec-25 |
| 26_129XXXX | BRL | 125,000,000 | | 23,083,600 | — | | 16-Dec-25 |
| 26_134XXXX | BRL | 75,000,000 | | 13,530,579 | 10.75 | | 22-Dec-25 |
| 26_135XXXX | BRL | 200,000,000 | | 35,768,577 | — | | 23-Dec-25 |
| | Sum Of Notional | 1,100,000,000 | | 202,549,993 | | |
| 26_94XXXXX | CAD | 600,000,000 | | 428,219,677 | 2.55 | | 31-Oct-25 |
| | Sum Of Notional | 600,000,000 | | 428,219,677 | | |
| 26_125XXXX | CNY | 200,000,000 | | 28,336,439 | 1.70 | | 11-Dec-25 |
| | Sum Of Notional | 200,000,000 | | 28,336,439 | | |
| 26_60XXXXX | COP | 100,000,000,000 | | 25,841,129 | 9.00 | | 06-Oct-25 |
| 26_63XXXXX | COP | 300,000,000,000 | | 77,523,386 | — | | 06-Oct-25 |
| | Sum Of Notional | 400,000,000,000 | | 103,364,515 | | |
| 26_105XXXX | DKK | 1,250,000,000 | | 193,899,157 | 2.25 | | 18-Nov-25 |
| | Sum Of Notional | 1,250,000,000 | | 193,899,157 | | |
| 26_77XXXXX | DOP | 640,000,000 | | 10,093,045 | 8.90 | | 20-Oct-25 |
| 26_133XXXX | DOP | 960,000,000 | | 15,325,670 | 8.85 | | 19-Dec-25 |
| | Sum Of Notional | 1,600,000,000 | | 25,418,716 | | |
| 26_59XXXXX | GBP | 45,000,000 | | 60,538,500 | | 4.00 | | 03-Oct-25 |
| 26_65XXXXX | GBP | 750,000,000 | | 1,005,900,000 | | 4.25 | | 08-Oct-25 |
| 26_70XXXXX | GBP | 100,000,000 | | 132,625,000 | | 4.00 | | 10-Oct-25 |
| | | | | | | | |
| INTERNATIONAL FINANCE CORPORATION | Page 152 |
| | |
Reporting to SEC on New and Matured Borrowings |
| | | | | | | | | | | | | | | | | | | | |
| External Id | Currency Code | Currency Amount | USD Amount | Interest Rate | Settle Date |
| 26_81XXXXX | GBP | 25,000,000 | | 33,285,000 | 3.88 | | 22-Oct-25 |
| 26_84XXXXX | GBP | 125,000,000 | | 166,712,500 | 4.25 | | 23-Oct-25 |
| 26_93XXXXX | GBP | 100,000,000 | | 132,180,000 | 3.88 | | 29-Oct-25 |
| 26_96XXXXX | GBP | 75,000,000 | | 98,820,000 | 4.25 | | 30-Oct-25 |
| 26_100XXXX | GBP | 100,000,000 | | 130,350,000 | 3.88 | | 05-Nov-25 |
| 26_106XXXX | GBP | 75,000,000 | | 98,610,000 | 3.88 | | 13-Nov-25 |
| 26_113XXXX | GBP | 25,000,000 | | 32,852,500 | 3.88 | | 18-Nov-25 |
| | Sum Of Notional | 1,420,000,000 | | 1,891,873,500 | | |
| 26_504XXXX | GEL | 220,000,000 | | 81,300,813 | 8.63 | | 17-Nov-25 |
| | Sum Of Notional | 220,000,000 | | 81,300,813 | | |
| 26_54XXXXX | HKD | 700,000,000 | | 89,966,777 | 2.90 | | 02-Oct-25 |
| | Sum Of Notional | 700,000,000 | | 89,966,777 | | |
| 26_79XXXXX | KZT | 8,250,000,000 | | 15,325,457 | 15.50 | | 23-Oct-25 |
| | Sum Of Notional | 8,250,000,000 | | 15,325,457 | | |
| 26_128XXXX | MNT | 35,000,000,000 | | 9,864,713 | 9.95 | | 15-Dec-25 |
| 26_131XXXX | MNT | 35,000,000,000 | | 9,861,933 | 9.95 | | 18-Dec-25 |
| | Sum Of Notional | 70,000,000,000 | | 19,726,645 | | |
| 26_137XXXX | MXN | 500,000,000 | | 27,857,481 | — | | 23-Dec-25 |
| | Sum Of Notional | 500,000,000 | | 27,857,481 | | |
| 26_112XXXX | NGN | 15,000,000,000 | | 10,308,216 | 12.50 | | 20-Nov-25 |
| 26_136XXXX | NGN | 15,000,000,000 | | 10,342,402 | — | | 24-Dec-25 |
| | Sum Of Notional | 30,000,000,000 | | 20,650,618 | | |
| 26_110XXXX | RON | 40,000,000 | | 9,126,482 | 5.80 | | 17-Nov-25 |
| 26_505XXXX | RON | 124,800,000 | | 28,718,374 | 6.65 | | 19-Dec-25 |
| | Sum Of Notional | 164,800,000 | | 37,844,855 | | |
| 26_85XXXXX | SEK | 1,000,000,000 | | 106,133,452 | 2.19 | | 23-Oct-25 |
| | Sum Of Notional | 1,000,000,000 | | 106,133,452 | | |
| 26_56XXXXX | USD | 20,000,000 | | 20,000,000 | 4.53 | | 2-Oct-25 |
| 26_57XXXXX | USD | 20,000,000 | | 20,000,000 | 4.53 | | 2-Oct-25 |
| 26_58XXXXX | USD | 30,000,000 | | 30,000,000 | 4.56 | | 3-Oct-25 |
| 26_62XXXXX | USD | 20,000,000 | | 20,000,000 | 4.56 | | 6-Oct-25 |
| 26_64XXXXX | USD | 150,000,000 | | 150,000,000 | 3.63 | | 7-Oct-25 |
| 26_68XXXXX | USD | 800,000,000 | | 800,000,000 | 4.36 | | 9-Oct-25 |
| 26_71XXXXX | USD | 50,000,000 | | 50,000,000 | 4.36 | | 15-Oct-25 |
| 26_73XXXXX | USD | 30,000,000 | | 30,000,000 | 4.50 | | 16-Oct-25 |
| 26_74XXXXX | USD | 30,000,000 | | 30,000,000 | 4.50 | | 17-Oct-25 |
| 26_80XXXXX | USD | 50,000,000 | | 50,000,000 | 4.26 | | 22-Oct-25 |
| 26_82XXXXX | USD | 20,000,000 | | 20,000,000 | | 4.42 | | 22-Oct-25 |
| 26_83XXXXX | USD | 20,000,000 | | 20,000,000 | | 4.40 | | 22-Oct-25 |
| 26_95XXXXX | USD | 30,000,000 | | 30,000,000 | | 3.44 | | 29-Oct-25 |
| 26_92XXXXX | USD | 15,000,000 | | 15,000,000 | 5.13 | | 30-Oct-25 |
| 26_90XXXXX | USD | 90,000,000 | | 90,000,000 | 3.70 | | 03-Nov-25 |
| 26_97XXXXX | USD | 100,000,000 | | 100,000,000 | 3.70 | | 03-Nov-25 |
| 26_101XXXX | USD | 50,000,000 | | 50,000,000 | 3.51 | | 05-Nov-25 |
| | | | | | | | |
| INTERNATIONAL FINANCE CORPORATION | Page 153 |
| | |
Reporting to SEC on New and Matured Borrowings |
| | | | | | | | | | | | | | | | | | | | |
| External Id | Currency Code | Currency Amount | USD Amount | Interest Rate | Settle Date |
| 26_103XXXX | USD | 20,000,000 | | 20,000,000 | 3.76 | | 06-Nov-25 |
| 26_107XXXX | USD | 50,000,000 | | 50,000,000 | 4.59 | | 14-Nov-25 |
| 26_102XXXX | USD | 20,000,000 | | 20,000,000 | 4.44 | | 14-Nov-25 |
| 26_104XXXX | USD | 20,000,000 | | 20,000,000 | 4.80 | | 17-Nov-25 |
| 26_109XXXX | USD | 30,000,000 | | 30,000,000 | 4.47 | | 17-Nov-25 |
| 26_111XXXX | USD | 30,000,000 | | 30,000,000 | 5.23 | | 24-Nov-25 |
| 26_116XXXX | USD | 120,000,000 | | 120,000,000 | 4.50 | | 26-Nov-25 |
| 26_121XXXX | USD | 30,000,000 | | 30,000,000 | 5.19 | | 03-Dec-25 |
| 26_124XXXX | USD | 25,000,000 | | 25,000,000 | 4.46 | | 09-Dec-25 |
| 26_127XXXX | USD | 50,000,000 | | 50,000,000 | 3.50 | | 11-Dec-25 |
| 26_130XXXX | USD | 50,000,000 | | 50,000,000 | 4.55 | | 17-Dec-25 |
| 26_132XXXX | USD | 25,000,000 | | 25,000,000 | 4.53 | | 19-Dec-25 |
| | Sum Of Notional | 1,995,000,000 | | 1,995,000,000 | | |
| 26_75XXXXX | UZS | 200,000,000,000 | | 16,348,324 | 10.00 | | 16-Oct-25 |
| 26_108XXXX | UZS | 130,000,000,000 | | 10,857,446 | 11.00 | | 13-Nov-25 |
| 26_118XXXX | UZS | 180,000,000,000 | | 15,079,304.58 | 11.00 | | 26-Nov-25 |
| | Sum Of Notional | 510,000,000,000 | | 42,285,074 | | |
| 26_72XXXXX | ZAR | 2,750,000,000 | | 157,190,463 | — | | 14-Oct-25 |
| | Sum Of Notional | 2,750,000,000 | | 157,190,463 | | |
| TOTAL NEW MARKET BORROWINGS | 6,011,858,632 | | |
| | | | | | |
Medium and Long-Term Matured Market Borrowings | | |
| External Id | Currency Code | Currency Amt | USD Amt | Interest Rate | Maturity Date |
| 23_58XXXXX | CNY | 300,000,000 | | 42,422,314 | | 2.44 | | 01-Dec-25 |
| 23_542XXXX | CNY | 340,000,000 | | 48,267,002 | | 2.80 | | 17-Dec-25 |
| | Sum Of Notional | 640,000,000 | | 90,689,316 | | | |
| 96_19XXXXX | EUR | 75,126,513 | | 87,360,866 | | 9.83 | | 01-Dec-25 |
| | Sum Of Notional | 75,126,513 | | 87,360,866 | | | |
| 23_62XXXXX | GBP | 600,000,000 | | 792,990,000 | | 4.13 | | 28-Nov-25 |
| 21_46XXXXX | GBP | 1,000,000,000 | | 1,338,400,000 | | 0.25 | | 15-Dec-25 |
| | Sum Of Notional | 1,600,000,000 | | 2,131,390,000 | | | |
| 96_11XXXXX | JPY | 20,000,000,000 | | 126,972,034 | | 4.70 | | 20-Nov-25 |
| | Sum Of Notional | 20,000,000,000 | | 126,972,034 | | | |
| 24_653XXXX | KZT | 1,304,706,480 | | 2,529,114 | | 13.65 | | 15-Dec-25 |
| 24_654XXXX | KZT | 822,294,000 | | 1,593,979 | | 13.90 | | 15-Dec-25 |
| | Sum Of Notional | 2,127,000,480 | | 4,123,093 | | | |
| 21_45XXXXX | NOK | 1,500,000,000 | | 150,198,262 | | 0.50 | | 08-Oct-25 |
| 23_46XXXXX | NOK | 500,000,000 | | 50,066,087 | | 0.50 | | 08-Oct-25 |
| | Sum Of Notional | 2,000,000,000 | | 200,264,349 | | | |
| 23_540XXXX | RON | 53,500,000 | | 12,206,808 | | 7.57 | | 02-Dec-25 |
| | Sum Of Notional | 53,500,000 | | 12,206,808 | | | |
| 16_151XXXX | TRY | 25,000,000 | | 586,598 | | — | | 11-Dec-25 |
| 16_190XXXX | TRY | 25,000,000 | | 586,598 | | — | | 11-Dec-25 |
| 16_82XXXXX | TRY | 18,000,000 | | 422,351 | | — | | 11-Dec-25 |
| | | | | | | | |
| INTERNATIONAL FINANCE CORPORATION | Page 154 |
| | |
Reporting to SEC on New and Matured Borrowings |
| | | | | | | | | | | | | | | | | | | | |
| External Id | Currency Code | Currency Amount | USD Amount | Interest Rate | Maturity Date |
| 17_10XXXXX | TRY | 30,000,000 | | 703,918 | | — | | 11-Dec-25 |
| 17_179XXXX | TRY | 20,000,000 | | 469,279 | | — | | 11-Dec-25 |
| 17_189XXXX | TRY | 32,000,000 | | 750,846 | | — | | 11-Dec-25 |
| 17_198XXXX | TRY | 50,000,000 | | 1,173,197 | | — | | 11-Dec-25 |
| 17_206XXXX | TRY | 50,000,000 | | 1,173,197 | | — | | 11-Dec-25 |
| 17_227XXXX | TRY | 25,000,000 | | 586,598 | | — | | 11-Dec-25 |
| 17_242XXXX | TRY | 25,000,000 | | 586,598 | | — | | 11-Dec-25 |
| 17_257XXXX | TRY | 25,000,000 | | 586,598 | | — | | 11-Dec-25 |
| 18_02XXXXX | TRY | 25,000,000 | | 586,598 | | — | | 11-Dec-25 |
| | Sum Of Notional | 350,000,000 | | 8,212,377 | | | |
| 23_143XXXX | USD | 150,000,000 | | 150,000,000 | | 4.17 | | 01-Oct-25 |
| 21_58XXXXX | USD | 27,000,000 | | 27,000,000 | | 0.25 | | 15-Oct-25 |
| 21_47XXXXX | USD | 25,000,000 | | 25,000,000 | | 0.25 | | 15-Oct-25 |
| 23_70XXXXX | USD | 25,000,000 | | 25,000,000 | | 4.25 | | 17-Oct-25 |
| 21_51XXXXX | USD | 100,000,000 | | 100,000,000 | | 0.50 | | 20-Oct-25 |
| 21_81XXXXX | USD | 15,000,000 | | 15,000,000 | | 0.25 | | 17-Nov-25 |
| 23_76XXXXX | USD | 100,000,000 | | 100,000,000 | | 4.25 | | 17-Nov-25 |
| 23_74XXXXX | USD | 25,000,000 | | 25,000,000 | | 4.05 | | 22-Dec-25 |
| | Sum Of Notional | 467,000,000 | | 467,000,000 | | | |
| 23_59XXXXX | UZS | 200,000,000,000 | | 16,717,893 | | 16.00 | | 05-Dec-25 |
| 25_501XXXX | UZS | 22,801,890,000 | | 1,871,351 | | 16.95 | | 15-Oct-25 |
| | Sum Of Notional | 222,801,890,000 | | 18,589,244 | | | |
| 24_652XXXX | ZMW | 32,200,000 | | 1,423,204 | | 11.50 | | 20-Dec-25 |
| 24_655XXXX | ZMW | 39,000,000 | | 1,723,757 | | 18.00 | | 20-Dec-25 |
| | Sum Of Notional | 71,200,000 | | 3,146,961 | | | |
| 22_549XXXX | LKR | 90,918,180 | | 294,043 | | 8.00 | | 15-Dec-25 |
| | Sum Of Notional | 90,918,180 | | 294,043 | | | |
| 25_503XXXX | AZN | 4,857,000 | | 2,857,059 | | 7.55 | | 15-Dec-25 |
| | Sum Of Notional | 4,857,000 | | 2,857,059 | | | |
| | | | | | |
| TOTAL MATURED MARKET BORROWINGS | 3,153,106,150 | | | |
| | | | | | |
Net increase in Short-term Borrowings for the quarter ended December 31, 2025 | 46,264,086 | | | |
| | | | | | |
* Bonds where the stated interest rate is zero includes zero coupon bond issues where the contractual interest rate is zero, and structured notes where the contractual interest rate is initially zero. |
|
| | | | | | | | |
| INTERNATIONAL FINANCE CORPORATION | Page 155 |
| | |
Reporting to SEC on New and Matured Borrowings |
| | | | | | | | | | | | | | | | | | | | |
Quarter Ending Date | | | | | |
March 31, 2026 | | | | | |
New Medium and Long-Term Market Borrowings |
| External Id | Currency Code | Currency Amount | USD Amount | Interest Rate | Settle Date |
| 26_183XXXX | AUD | 200,000,000 | 142,580,000 | 4.60 | | 12-Feb-26 |
| 26_201XXXX | AUD | 50,000,000 | 35,425,000 | 5.45 | | 17-Mar-26 |
| 26_202XXXX | AUD | 50,000,000 | 35,425,000 | 5.45 | | 17-Mar-26 |
| 26_204XXXX | AUD | 50,000,000 | 35,517,500 | 5.45 | | 18-Mar-26 |
| | Sum Of Notional | 350,000,000 | 248,947,500 | | |
| 26_139XXXX | BRL | 200,000,000 | 37,238,747 | 11.25 | | 13-Jan-26 |
| 26_140XXXX | BRL | 200,000,000 | 37,238,747 | — | | 13-Jan-26 |
| 26_143XXXX | BRL | 75,000,000 | 13,950,893 | 10.75 | | 14-Jan-26 |
| 26_145YYYY | BRL | 175,000,000 | 32,552,083 | 11.50 | | 14-Jan-26 |
| 26_141XXXX | BRL | 200,000,000 | 37,256,089 | 11.50 | | 16-Jan-26 |
| 26_160XXXX | BRL | 100,000,000 | 18,903,949 | 11.50 | | 26-Jan-26 |
| 26_164XXXX | BRL | 75,000,000 | 14,422,661 | 10.75 | | 29-Jan-26 |
| 26_165XXXX | BRL | 100,000,000 | 19,230,215 | 11.50 | | 29-Jan-26 |
| 26_171XXXX | BRL | 200,000,000 | 38,009,807 | — | | 2-Feb-26 |
| 26_174YYYY | BRL | 55,000,000 | 10,450,413 | 11.25 | | 3-Feb-26 |
| 26_175XXXX | BRL | 200,000,000 | 38,001,501 | 11.75 | | 3-Feb-26 |
| 26_185XXXX | BRL | 150,000,000 | 28,800,737 | 12.75 | | 13-Feb-26 |
| 26_186XXXX | BRL | 75,000,000 | 14,359,426 | 11.50 | | 18-Feb-26 |
| 26_194XXXX | BRL | 125,000,000 | 23,892,807 | — | | 5-Mar-26 |
| 26_195XXXX | BRL | 150,000,000 | 28,671,369 | 11.50 | | 5-Mar-26 |
| 26_206XXXX | BRL | 75,000,000 | 14,449,893 | 10.75 | | 18-Mar-26 |
| 26_220XXXX | BRL | 135,000,000 | 25,765,080 | 11.50 | | 30-Mar-26 |
| | Sum Of Notional | 2,290,000,000 | 433,194,417 | | |
| 26_151XXXX | CHF | 110,000,000 | 141,306,442 | 0.79 | | 3-Feb-26 |
| | Sum Of Notional | 110,000,000 | 141,306,442 | | |
| 26_144XXXX | CNY | 100,000,000 | 14,348,437 | 1.70 | | 16-Jan-26 |
| 26_177YYYY | CNY | 200,000,000 | 28,886,706 | 1.70 | | 9-Feb-26 |
| | Sum Of Notional | 300,000,000 | 43,235,143 | | |
| 26_150XXXX | COP | 180,000,000,000 | 48,837,266 | 8.25 | | 16-Jan-26 |
| 26_154XXXX | COP | 400,000,000,000 | 108,932,462 | — | | 21-Jan-26 |
| 26_155XXXX | COP | 375,000,000,000 | 102,040,816 | — | | 22-Jan-26 |
| 26_172XXXX | COP | 100,000,000,000 | 27,170,886 | 10.00 | | 2-Feb-26 |
| 26_178XXXX | COP | 200,000,000,000 | 54,914,882 | — | | 5-Feb-26 |
| | Sum Of Notional | 1,255,000,000,000 | 341,896,312 | | |
| 26_149XXXX | CZK | 200,000,000 | 9,572,584 | 3.15 | | 16-Jan-26 |
| | Sum Of Notional | 200,000,000 | 9,572,584 | | |
| 26_153XXXX | EUR | 30,000,000 | 35,143,500 | 2.11 | | 21-Jan-26 |
| 26_184XXXX | EUR | 150,000,000 | 178,267,500 | 2.33 | | 12-Feb-26 |
| 26_192XXXX | EUR | 10,000,000 | | 11,800,000 | | 2.86 | | 27-Feb-26 |
| 26_205XXXX | EUR | 100,000,000 | | 115,400,000 | | 2.50 | | 18-Mar-26 |
| | Sum Of Notional | 290,000,000 | | 340,611,000 | | | |
| | | | | | | | |
| INTERNATIONAL FINANCE CORPORATION | Page 156 |
| | |
Reporting to SEC on New and Matured Borrowings |
| | | | | | | | | | | | | | | | | | | | |
| External Id | Currency Code | Currency Amount | USD Amount | Interest Rate | Settle Date |
| 26_162XXXX | GBP | 50,000,000 | | 68,850,000 | | 4.25 | 28-Jan-26 |
| 26_163XXXX | GBP | 50,000,000 | | 68,850,000 | | 3.88 | 28-Jan-26 |
| 26_180XXXX | GBP | 150,000,000 | | 204,562,500 | | 3.88 | 09-Feb-26 |
| 26_189YYYY | GBP | 50,000,000 | | 67,527,500 | | 3.88 | 25-Feb-26 |
| 26_193XXXX | GBP | 50,000,000 | | 66,797,500 | | 3.88 | 05-Mar-26 |
| 26_203XXXX | GBP | 75,000,000 | | 99,543,750 | | 3.88 | 16-Mar-26 |
| | Sum Of Notional | 425,000,000 | | 576,131,250 | | | |
| 26_506XXXX | GEL | 53,360,000 | | 19,810,655 | | 8.19 | 26-Jan-26 |
| | Sum Of Notional | 53,360,000 | | 19,810,655 | | | |
| 26_147XXXX | HKD | 250,000,000 | | 32,051,077 | | 2.70 | 16-Jan-26 |
| 26_148XXXX | HKD | 250,000,000 | | 32,060,530 | | 2.70 | 20-Jan-26 |
| 26_198XXXX | HKD | 775,000,000 | | 99,013,063 | | 2.48 | 12-Mar-26 |
| 26_212XXXX | HKD | 250,000,000 | | 31,912,585 | | 2.60 | 27-Mar-26 |
| 26_213XXXX | HKD | 250,000,000 | | 31,912,585 | | 2.62 | 27-Mar-26 |
| 26_214XXXX | HKD | 200,000,000 | | 25,530,068 | | 2.62 | 27-Mar-26 |
| | Sum Of Notional | 1,975,000,000 | | 252,479,908 | | | |
| 26_170XXXX | KRW | 20,000,000,000 | | 13,724,199 | | 2.75 | 04-Feb-26 |
| 26_216XXXX | KRW | 15,000,000,000 | | 9,892,991 | | 2.75 | 30-Mar-26 |
| | Sum Of Notional | 35,000,000,000 | | 23,617,190 | | | |
| 26_138XXXX | MXN | 10,000,000,000 | | 562,782,622 | | 0.00 | 15-Jan-26 |
| 26_176XXXX | MXN | 7,500,000,000 | | 432,494,774 | | 0.00 | 03-Feb-26 |
| 26_182XXXX | MXN | 250,000,000 | | 14,539,322 | | 7.75 | 11-Feb-26 |
| 26_188XXXX | MXN | 5,000,000,000 | | 292,326,716 | | 0.00 | 18-Feb-26 |
| 26_196XXXX | MXN | 750,000,000 | | 42,036,000 | | 0.00 | 06-Mar-26 |
| | Sum Of Notional | 23,500,000,000 | | 1,344,179,434 | | | |
| 26_152XXXX | NGN | 15,000,000,000 | | 10,572,128 | | 12.50 | 20-Jan-26 |
| 26_200XXXX | NGN | 30,000,000,000 | | 21,768,707 | | 15.00 | 16-Mar-26 |
| 26_208XXXX | NGN | 30,000,000,000 | | 21,735,901 | | 15.00 | 25-Mar-26 |
| | Sum Of Notional | 75,000,000,000 | | 54,076,736 | | | |
| 26_159XXXX | SEK | 550,000,000 | | 61,496,833 | | 2.31 | 26-Jan-26 |
| | Sum Of Notional | 550,000,000 | | 61,496,833 | | | |
| 26_507XXXX | TRY | 4,366,016,000 | | 100,037,600 | | 27.50 | 11-Feb-26 |
| | Sum Of Notional | 4,366,016,000 | | 100,037,600 | | | |
| 26_142XXXX | USD | 150,000,000 | | 150,000,000 | | 3.71 | 14-Jan-26 |
| 26_146XXXX | USD | 75,000,000 | | 75,000,000 | | 4.35 | 15-Jan-26 |
| 26_156XXXX | USD | 2,000,000,000 | | 2,000,000,000 | | 3.50 | 22-Jan-26 |
| 26_157XXXX | USD | 50,000,000 | | 50,000,000 | | 4.05 | 22-Jan-26 |
| 26_158XXXX | USD | 100,000,000 | | 100,000,000 | | 3.55 | 26-Jan-26 |
| 26_161XXXX | USD | 20,000,000 | | 20,000,000 | | 4.47 | 27-Jan-26 |
| 26_166XXXX | USD | 150,000,000 | | 150,000,000 | | 3.72 | 29-Jan-26 |
| | | | | | | | |
| INTERNATIONAL FINANCE CORPORATION | Page 157 |
| | |
Reporting to SEC on New and Matured Borrowings |
| | | | | | | | | | | | | | | | | | | | |
| External Id | Currency Code | Currency Amount | USD Amount | Interest Rate | Settle Date |
| 26_167XXXX | USD | 90,000,000 | | 90,000,000 | | 4.05 | 29-Jan-26 |
| 26_168XXXX | USD | 50,000,000 | | 50,000,000 | | 3.64 | 29-Jan-26 |
| 26_169XXXX | USD | 50,000,000 | | 50,000,000 | | 3.70 | 29-Jan-26 |
| 26_173XXXX | USD | 100,000,000 | | 100,000,000 | | 4.12 | 02-Feb-26 |
| 26_179XXXX | USD | 85,000,000 | | 85,000,000 | | 4.05 | 05-Feb-26 |
| 26_181XXXX | USD | 100,000,000 | | 100,000,000 | | 3.94 | 10-Feb-26 |
| 26_187XXXX | USD | 25,000,000 | | 25,000,000 | | 3.47 | 23-Feb-26 |
| 26_190XXXX | USD | 25,000,000 | | 25,000,000 | | 3.72 | 25-Feb-26 |
| 26_191XXXX | USD | 50,000,000 | | 50,000,000 | | 4.12 | 26-Feb-26 |
| 26_197XXXX | USD | 100,000,000 | | 100,000,000 | | 3.46 | 10-Mar-26 |
| 26_199XXXX | USD | 100,000,000 | | 100,000,000 | | 4.10 | 12-Mar-26 |
| 26_207XXXX | USD | 16,000,000 | | 16,000,000 | | 4.50 | 20-Mar-26 |
| 26_209XXXX | USD | 50,000,000 | | 50,000,000 | | 4.01 | 25-Mar-26 |
| 26_210XXXX | USD | 50,000,000 | | 50,000,000 | | 4.53 | 26-Mar-26 |
| 26_211XXXX | USD | 50,000,000 | | 50,000,000 | | 4.13 | 26-Mar-26 |
| 26_218XXXX | USD | 10,000,000 | | 10,000,000 | | 3.84 | 30-Mar-26 |
| 26_219XXXX | USD | 50,000,000 | | 50,000,000 | | 4.65 | 31-Mar-26 |
| | Sum Of Notional | 3,546,000,000 | | 3,546,000,000 | | | |
| 26_508XXXX | ZAR | 1,599,344,000 | | 93,252,132 | | 7.15 | 31-Mar-26 |
| | Sum Of Notional | 1,599,344,000 | | 93,252,132 | | | |
| | | | | | |
| TOTAL NEW MARKET BORROWINGS | 7,629,845,136 | | | |
| | | | | | |
Medium and Long-Term Matured Market Borrowings | | | |
| External Id | Currency Code | Currency Amount | USD Amount | Interest Rate | Maturity Date |
| 23_600_1XX | AZN | 4,369,680 | | 2,570,400 | | 6.00 | 15-Jan-26 |
| 23_600_2XX | AZN | 4,126,920 | | 2,427,600 | | 6.00 | 15-Jan-26 |
| | Sum Of Notional | 8,496,600 | | 4,998,000 | | | |
| 23_12XXXXX | AUD | 500,000,000 | | 352,350,000 | | 3.60 | 24-Feb-26 |
| 23_21XXXXX | AUD | 50,000,000 | | 35,235,000 | | 3.60 | 24-Feb-26 |
| 23_33XXXXX | AUD | 50,000,000 | | 35,235,000 | | 3.60 | 24-Feb-26 |
| 23_50YYYYY | AUD | 150,000,000 | | 105,705,000 | | 3.60 | 24-Feb-26 |
| 23_56XXXXX | AUD | 250,000,000 | | 176,175,000 | | 3.60 | 24-Feb-26 |
| 23_67XXXXX | AUD | 50,000,000 | | 35,235,000 | | 3.60 | 24-Feb-26 |
| 23_96XXXXX | AUD | 400,000,000 | | 281,880,000 | | 3.60 | 24-Feb-26 |
| | Sum Of Notional | 1,450,000,000 | | 1,021,815,000 | | | |
| 24_656XXXX | BDT | 82,500,000 | | 674,570 | | 10.50 | 09-Mar-26 |
| | Sum Of Notional | 82,500,000 | | 674,570 | | | |
| 19_222XXXX | BRL | 100,000,000 | | 19,093,079 | | 6.50 | 27-Mar-26 |
| 21_129XXXX | BRL | 50,000,000 | | 9,546,539 | | 6.50 | 27-Mar-26 |
| | | | | | | | |
| INTERNATIONAL FINANCE CORPORATION | Page 158 |
| | |
Reporting to SEC on New and Matured Borrowings |
| | | | | | | | | | | | | | | | | | | | |
| External Id | Currency Code | Currency Amount | USD Amount | Interest Rate | Maturity Date |
| 21_210XXXX | BRL | 50,000,000 | | 9,546,539 | | 6.50 | 27-Mar-26 |
| 22_77XXXXX | BRL | 150,000,000 | | 28,639,618 | | 6.50 | 27-Mar-26 |
| | Sum Of Notional | 350,000,000 | | 66,825,776 | | | |
| 18_217XXXX | CNY | 18,600,000 | | 2,686,464 | | 3.78 | 09-Feb-26 |
| | Sum Of Notional | 18,600,000 | | 2,686,464 | | | |
| 21_162XXXX | COP | 180,000,000,000 | | 48,640,892 | | 3.59 | 26-Feb-26 |
| | Sum Of Notional | 180,000,000,000 | | 48,640,892 | | | |
| 25_96XXXXX | DOP | 250,000,000 | | 4,132,231 | | 7.50 | 26-Feb-26 |
| | Sum Of Notional | 250,000,000 | | 4,132,231 | | | |
| 24_89_B1XX | EUR | 75,000,000 | | 86,700,000 | | 3.36 | 09-Mar-26 |
| | Sum Of Notional | 75,000,000 | | 86,700,000 | | | |
| 23_116XXXX | HKD | 200,000,000 | | 25,587,063 | | 4.04 | 09-Mar-26 |
| 23_117XXXX | HKD | 200,000,000 | | 25,587,063 | | 4.04 | 09-Mar-26 |
| 25_97XXXXX | HKD | 100,000,000 | | 12,781,023 | | 3.67 | 27-Feb-26 |
| | Sum Of Notional | 500,000,000 | | 63,955,149 | | | |
| 23_119XXXX | KRW | 13,000,000,000 | | 8,727,468 | | 3.05 | 09-Mar-26 |
| | Sum Of Notional | 13,000,000,000 | | 8,727,468 | | | |
| 19_519XXXX | KZT | 659,768,914 | | 1,298,566 | | 8.30 | 20-Jan-26 |
| | Sum Of Notional | 659,768,914 | | 1,298,566 | | | |
| 18_174_B2X | MXN | 1,230,000,000 | | 71,912,372 | | 0.00 | 18-Feb-26 |
| 18_174_B3X | MXN | 420,000,000 | | 24,431,389 | | 0.00 | 26-Feb-26 |
| | Sum Of Notional | 1,650,000,000 | | 96,343,761 | | | |
| 18_718_1XX | PHP | 165,641,920 | | 2,778,039 | | 6.34 | 18-Mar-26 |
| 18_718_BXX | PHP | 2,319,371,200 | | 38,898,986 | | 6.34 | 18-Mar-26 |
| | Sum Of Notional | 2,485,013,120 | | 41,677,025 | | | |
| 21_111XXXX | RSD | 480,000,000 | | 4,788,985 | | 0.65 | 21-Jan-26 |
| | Sum Of Notional | 480,000,000 | | 4,788,985 | | | |
| 19_170XXXX | RUB | 2,500,000,000 | | 32,569,046 | | 6.50 | 04-Feb-26 |
| 21_141XXXX | RUB | 700,000,000 | | 9,119,333 | | 6.50 | 04-Feb-26 |
| 21_147XXXX | RUB | 1,850,000,000 | | 24,148,284 | | 4.50 | 24-Feb-26 |
| | Sum Of Notional | 5,050,000,000 | | 65,836,663 | | | |
| 21_109XXXX | USD | 50,000,000 | | 50,000,000 | | 0.58 | 15-Jan-26 |
| 21_116XXXX | USD | 25,000,000 | | 25,000,000 | | 0.45 | 05-Feb-26 |
| 21_119XXXX | USD | 25,000,000 | | 25,000,000 | | 0.45 | 05-Feb-26 |
| 21_158XXXX | USD | 25,000,000 | | 25,000,000 | | 0.50 | 26-Feb-26 |
| 21_164XXXX | USD | 15,000,000 | | 15,000,000 | | 0.50 | 16-Mar-26 |
| 21_165XXXX | USD | 25,000,000 | | 25,000,000 | | 0.75 | 23-Mar-26 |
| 23_106XXXX | USD | 150,000,000 | | 150,000,000 | | 4.25 | 02-Mar-26 |
| 23_107XXXX | USD | 150,000,000 | | 150,000,000 | | 3.98 | 16-Mar-26 |
| 23_109XXXX | USD | 50,000,000 | | 50,000,000 | | 4.46 | 02-Feb-26 |
| | | | | | | | |
| INTERNATIONAL FINANCE CORPORATION | Page 159 |
| | |
Reporting to SEC on New and Matured Borrowings |
| | | | | | | | | | | | | | | | | | | | |
| External Id | Currency Code | Currency Amount | USD Amount | Interest Rate | Maturity Date |
| 23_126XXXX | USD | 50,000,000 | | 50,000,000 | | 4.64 | 09-Mar-26 |
| 23_130XXXX | USD | 20,000,000 | | 20,000,000 | | 4.75 | 16-Mar-26 |
| 23_166XXXX | USD | 50,000,000 | | 50,000,000 | | 4.55 | 07-Jan-26 |
| 23_75XXXXX | USD | 25,000,000 | | 25,000,000 | | 4.03 | 20-Mar-26 |
| 23_78XXXXX | USD | 50,000,000 | | 50,000,000 | | 4.14 | 20-Jan-26 |
| 23_85XXXXX | USD | 150,000,000 | | 150,000,000 | | 3.90 | 26-Jan-26 |
| 23_88XXXXX | USD | 100,000,000 | | 100,000,000 | | 4.02 | 26-Jan-26 |
| 23_91XXXXX | USD | 600,000,000 | | 600,000,000 | | 3.98 | 16-Mar-26 |
| 24_108XXXX | USD | 150,000,000 | | 150,000,000 | | 3.98 | 16-Mar-26 |
| 24_22XXXXX | USD | 100,000,000 | | 100,000,000 | | 3.98 | 16-Mar-26 |
| 24_67_B1XX | USD | 25,000,000 | | 25,000,000 | | 4.50 | 12-Jan-26 |
| 24_71_B1XX | USD | 5,000,000 | | 5,000,000 | | 4.60 | 29-Jan-26 |
| 24_84XXXXX | USD | 25,000,000 | | 25,000,000 | | 4.65 | 26-Feb-26 |
| 25_115XXXX | USD | 9,000,000 | | 9,000,000 | | 3.92 | 24-Mar-26 |
| | Sum Of Notional | 1,874,000,000 | | 1,874,000,000 | | | |
| | | | | | |
TOTAL MATURED MARKET BORROWINGS | 3,393,100,550 | | | |
| | | | | | |
Matured IBRD and IDA Borrowings | | | |
| External Id | Currency Code | Currency Amount | USD Amount | Interest Rate | Maturity Date |
| 15_30XXXXX | USD | 6,338,497 | | 6,338,497 | | 1.84 | 16-Mar-26 |
| | Sum Of Notional | | 6,338,497 | | | |
| | | | | | |
TOTAL MATURED IBRD AND IDA BORROWINGS | 6,338,497 | | | |
| | | | | | |
Matured Securitized Borrowings | | | |
| External Id | Currency Code | Currency Amount | USD Amount | Interest Rate | Maturity Date |
| — | USD | 38,843,151 | | 38,843,151 | | 5.14 | 29-Jan-26 |
| | Sum Of Notional | 38,843,151 | | 38,843,151 | | | |
| | | | | | |
TOTAL Matured SECURITIZED BORROWINGS | 38,843,151 | | | |
| | | | | | |
| | | | | | |
Net increase in Short-term Borrowings for the quarter ended March 31, 2026 | 149,747,001 | | | |
| | | | | | |
* Bonds where the stated interest rate is zero includes zero coupon bond issues where the contractual interest rate is zero, and structured notes where the contractual interest rate is initially zero. |
|
| | | | | | |
| | | | | | |
| | | | | | | | |
| INTERNATIONAL FINANCE CORPORATION | Page 160 |
| | |
Reporting to SEC on New and Matured Borrowings |
| | | | | | | | | | | | | | | | | | | | |
Quarter Ending Date | | | | | |
June 30, 2026 | | | | | |
New Medium and Long-Term Market Borrowings |
| External Id | Currency Code | Currency Amount | USD Amount | Interest Rate | Settle Date |
| 26_510XXXX | AZN | 16,992,000 | | 9,995,294 | | 6.25 | 19-May-26 |
| | Sum Of Notional | 16,992,000 | | 9,995,294 | | | |
| 26_221XXXX | BRL | 250,000,000 | | 48,275,596 | | 0.00 | 01-Apr-26 |
| 26_223XXXX | BRL | 120,000,000 | | 23,277,919 | | 11.25 | 02-Apr-26 |
| 26_227YYYY | BRL | 100,000,000 | | 20,091,618 | | 0.00 | 20-Apr-26 |
| 26_234XXXX | BRL | 125,000,000 | | 25,023,773 | | 11.50 | 30-Apr-26 |
| 26_238XXXX | BRL | 150,000,000 | | 30,643,201 | | 0.00 | 13-May-26 |
| | Sum Of Notional | 745,000,000 | | 147,312,107 | | | |
| 26_249XXXX | CLP | 7,350,000,000 | | 8,252,215 | | 3.55 | 18-Jun-26 |
| | Sum Of Notional | 7,350,000,000 | | 8,252,215 | | | |
| 26_241XXXX | COP | 225,000,000,000 | | 59,504,368 | | 0.00 | 14-May-26 |
| 26_248XXXX | COP | 75,000,000,000 | | 20,648,103 | | 0.00 | 28-May-26 |
| | Sum Of Notional | 300,000,000,000 | | 80,152,471 | | | |
| 26_229XXXX | HKD | 300,000,000 | | 38,282,641 | | 2.58 | 28-Apr-26 |
| 26_230XXXX | HKD | 200,000,000 | | 25,517,690 | | 2.58 | 27-Apr-26 |
| 26_231XXXX | HKD | 200,000,000 | | 25,517,690 | | 2.55 | 27-Apr-26 |
| 26_232XXXX | HKD | 200,000,000 | | 25,534,631 | | 2.57 | 04-May-26 |
| 26_236XXXX | HKD | 400,000,000 | | 51,090,788 | | 2.87 | 12-May-26 |
| 26_239XXXX | HKD | 6,000,000,000 | | 766,263,952 | | 2.92 | 15-May-26 |
| 26_245XXXX | HKD | 300,000,000 | | 38,296,813 | | 3.00 | 20-May-26 |
| | Sum Of Notional | 7,600,000,000 | | 970,504,205 | | | |
| 26_250XXXX | JMD | 1,750,000,000 | | 11,106,880 | | 7.00 | 30-Jun-26 |
| | Sum Of Notional | 1,750,000,000 | | 11,106,880 | | | |
| 26_226XXXX | KZT | 15,000,000,000 | | 31,561,339 | | 15.00 | 14-Apr-26 |
| 26_228XXXX | KZT | 10,000,000,000 | | 21,523,197 | | 14.75 | 23-Apr-26 |
| 26_233XXXX | KZT | 15,000,000,000 | | 32,298,003 | | 15.00 | 05-May-26 |
| 26_243XXXX | KZT | 47,000,000,000 | | 99,799,340 | | 14.75 | 19-May-26 |
| | Sum Of Notional | 87,000,000,000 | | 185,181,879 | | | |
| 26_509XXXX | MNT | 35,732,600,000 | | 9,983,962 | | 10.00 | 28-Apr-26 |
| 26_235XXXX | MNT | 43,000,000,000 | | 12,014,529 | | 9.75 | 07-May-26 |
| | Sum Of Notional | 78,732,600,000 | | 21,998,491 | | | |
| 26_244XXXX | MXN | 1,500,000,000 | | 86,575,839 | | 0.00 | 18-May-26 |
| | Sum Of Notional | 1,500,000,000 | | 86,575,839 | | | |
| 26_511XXXX | TZS | 262,500,000,000 | | 100,095,329 | | 7.60 | 25-Jun-26 |
| | Sum Of Notional | 262,500,000,000 | | 100,095,329 | | | |
| 26_215XXXX | USD | 50,000,000 | | 50,000,000 | | 4.52 | 01-Apr-26 |
| 26_222XXXX | USD | 50,000,000 | | 50,000,000 | | 4.57 | 02-Apr-26 |
| | | | | | | | |
| INTERNATIONAL FINANCE CORPORATION | Page 161 |
| | |
Reporting to SEC on New and Matured Borrowings |
| | | | | | | | | | | | | | | | | | | | |
| External Id | Currency Code | Currency Amount | USD Amount | Interest Rate | Settle Date |
| 26_217XXXX | USD | 25,000,000 | | 25,000,000 | | 4.66 | 07-Apr-26 |
| 26_224XXXX | USD | 50,000,000 | | 50,000,000 | | 4.65 | 08-Apr-26 |
| 26_237XXXX | USD | 40,000,000 | | 40,000,000 | | 3.93 | 12-May-26 |
| 26_242XXXX | USD | 50,000,000 | | 50,000,000 | | 4.03 | 14-May-26 |
| 26_246XXXX | USD | 24,000,000 | | 24,000,000 | | 4.00 | 20-May-26 |
| 26_247XXXX | USD | 40,000,000 | | 40,000,000 | | 4.24 | 27-May-26 |
| | Sum Of Notional | 329,000,000 | | 329,000,000 | | | |
| 26_225XXXX | UZS | 125,000,000,000 | | 10,305,029 | | 10.00 | 13-Apr-26 |
| 26_240XXXX | UZS | 125,000,000,000 | | 10,425,354 | | 10.00 | 14-May-26 |
| | Sum Of Notional | 250,000,000,000 | | 20,730,383 | | | |
| | | | | | |
| TOTAL NEW MARKET BORROWINGS | 1,970,905,093 | | | |
| | | | | | |
NEW SECURITIZED BORROWINGS |
| External Id | Currency Code | Currency Amount | USD Amount | Interest Rate | Settle Date |
| — | USD | 320,000,000 | | 320,000,000 | | 4.83 | 11-Jun-26 |
| — | USD | 50,000,000 | | 50,000,000 | | 5.21 | 11-Jun-26 |
| — | USD | 25,000,000 | | 25,000,000 | | — | | 11-Jun-26 |
| | Sum Of Notional | 395,000,000 | | 395,000,000 | | | |
| | | | | | |
| TOTAL NEW SECURITIZED BORROWINGS | 395,000,000 | | | |
| | | | | | |
Medium and Long-Term Matured Market Borrowings | | | |
| External Id | Currency Code | Currency Amount | USD Amount | Interest Rate | Maturity Date |
| 25_503XXXX | AZN | 4,857,000 | | 2,857,059 | | 7.60 | 16-Jun-26 |
| 26_510XXXX | AZN | 1,888,000 | | 1,110,588 | | 6.30 | 16-Jun-26 |
| | Sum Of Notional | 6,745,000 | | 3,967,647 | | | |
| 15_500BXXX | INR | 120,000,000 | | 1,272,197 | | 8.88 | 19-Jun-26 |
| 15_501BXXX | INR | 360,000,000 | | 3,816,591 | | 8.88 | 19-Jun-26 |
| 15_502BXXX | INR | 360,000,000 | | 3,816,591 | | 8.88 | 19-Jun-26 |
| 15_503BXXX | INR | 360,000,000 | | 3,816,592 | | 8.88 | 19-Jun-26 |
| 15_504BXXX | INR | 420,000,000 | | 4,452,690 | | 8.88 | 19-Jun-26 |
| 15_505BXXX | INR | 105,000,000 | | 1,113,173 | | 8.88 | 19-Jun-26 |
| 15_506BXXX | INR | 432,000,000 | | 4,579,910 | | 9.00 | 19-Jun-26 |
| 15_507BXXX | INR | 432,000,000 | | 4,579,910 | | 9.00 | 19-Jun-26 |
| | Sum Of Notional | 2,589,000,000 | | 27,447,654 | | | |
| 17_79_B1XX | JPY | 200,000,000 | | 1,251,682 | | 7.10 | 07-Apr-26 |
| | Sum Of Notional | 200,000,000 | | 1,251,682 | | | |
| 24_653XXXX | KZT | 1,304,706,480 | | 2,662,367 | | 13.65 | 15-Jun-26 |
| 24_654XXXX | KZT | 822,294,000 | | 1,677,963 | | 13.90 | 15-Jun-26 |
| | | | | | | | |
| INTERNATIONAL FINANCE CORPORATION | Page 162 |
| | |
Reporting to SEC on New and Matured Borrowings |
| | | | | | | | | | | | | | | | | | | | |
| | Sum Of Notional | 2,127,000,480 | | 4,340,330 | | | |
| 22_549XXXX | LKR | 90,918,180 | | 273,438 | | 8.00 | 15-Jun-26 |
| | Sum Of Notional | 90,918,180 | | 273,438 | | | |
| 26_244_B1X | MXN | 1,500,000,000 | | 86,505,939 | | 0.00 | 22-May-26 |
| | Sum Of Notional | 1,500,000,000 | | 86,505,939 | | | |
| 25_504XXXX | RON | 80,325,000 | | 17,851,785 | | 8.20 | 19-May-26 |
| 21_707XXXX | RON | 293,475,000 | | 64,580,904 | | 2.44 | 11-Jun-26 |
| | Sum Of Notional | 373,800,000 | | 82,432,689 | | | |
| 19_241XXXX | TRY | 50,000,000 | | 1,114,461 | | 0.00 | 17-Apr-26 |
| | Sum Of Notional | 50,000,000 | | 1,114,461 | | | |
| 23_113XXXX | USD | 150,000,000 | | 150,000,000 | | 4.43 | 01-Apr-26 |
| 16_154XXXX | USD | 700,000,000 | | 700,000,000 | | 2.13 | 07-Apr-26 |
| 17_04XXXXX | USD | 500,000,000 | | 500,000,000 | | 2.13 | 07-Apr-26 |
| 18_296XXXX | USD | 10,000,000 | | 10,000,000 | | 3.60 | | 07-Apr-26 |
| 21_179XXXX | USD | 25,000,000 | | 25,000,000 | | 0.97 | 14-Apr-26 |
| 24_110_B1X | USD | 100,000,000 | | 100,000,000 | | 5.67 | 04-May-26 |
| 24_111_B1X | USD | 50,000,000 | | 50,000,000 | | 5.74 | 04-May-26 |
| 21_191XXXX | USD | 50,000,000 | | 50,000,000 | | 0.86 | 14-May-26 |
| 21_198XXXX | USD | 20,000,000 | | 20,000,000 | | 0.50 | | 15-May-26 |
| 25_151_B1X | USD | 30,000,000 | | 30,000,000 | | 4.58 | 17-Jun-26 |
| | Sum Of Notional | 1,635,000,000 | | 1,635,000,000 | | | |
| 25_501XXXX | UZS | 22,801,890,000 | | 1,870,439 | | 16.95 | 15-Apr-26 |
| | Sum Of Notional | 22,801,890,000 | | 1,870,439 | | | |
| 24_652XXXX | ZMW | 32,200,000 | | 1,796,374 | | 12.50 | | 20-Jun-26 |
| 24_655XXXX | ZMW | 39,000,000 | | 2,175,732 | | 18.00 | | 20-Jun-26 |
| | Sum Of Notional | 71,200,000 | | 3,972,106 | | | |
| | | | | | |
| TOTAL MATURED MARKET BORROWINGS | 1,848,176,385 | | | |
| | | | | | |
Matured Securitized Borrowings | | | |
| External Id | Currency Code | Currency Amount | USD Amount | Interest Rate | Maturity Date |
| — | USD | 14,792,283 | | 14,792,283 | | 4.97 | 29-Apr-26 |
| | Sum Of Notional | 14,792,283 | | 14,792,283 | | | |
| | | | | | |
| TOTAL MATURED SECURITIZED BORROWINGS | 14,792,283 | | | |
| | | | | | |
Net decrease in Short-term Borrowings for the quarter ended June 30, 2026 | 303,443,779 | | | |
* Bonds where the stated interest rate is zero includes zero coupon bond issues where the contractual interest rate is zero, and structured notes where the contractual interest rate is initially zero. |
|