| © 2026 iRhythm Technologies, Inc. 1 iRhythm at the J.P. Morgan 44th Annual Healthcare Conference Quentin Blackford, President & Chief Executive Officer January 12, 2026 |
| 2 © 2026 iRhythm Technologies, Inc. 2 Cautionary statement re forward-looking statements, non-GAAP measures and other matters Certain data in this presentation was obtained from various external sources, and neither “iRhythm Technologies, Inc. (“iRhythm” or the “Company”) nor its affiliates, advisers or representatives has verified such data with independent sources. Accordingly, neither the Company nor any of its affiliates, advisers or representatives makes any representations as to the accuracy of that third-party data or undertakes to update such data after the date of this presentation. Such data involves risks and uncertainties and is subject to change based on various factors. The trademarks included herein are the property of the owners and are used for reference purposes only. Such use should not be construed as an endorsement of the products or services of the Company. This presentation and the accompanying oral presentation include forward-looking statements within the meaning of Section 27A of the Securities Act of 1933, as amended, and Section 21E of the Securities Exchange Act of 1934, as amended, and the Private Securities Litigation Reform Act of 1995. Forward-looking statements give the Company’s current expectations or forecasts of future events. An investor can identify these statements by the fact that they do not relate strictly to historical or current facts. They use words such as ‘anticipate’, ‘estimate’, ‘expect’, ‘intend’, ‘will’, ‘project’, ‘plan’, ‘believe’, ‘target’ and other words and terms of similar meaning in connection with any discussion of future operating or financial performance. In particular, these include statements relating to future actions, prospective products or product approvals, future performance or results of current and anticipated products, sales efforts, expenses, strategy and plans, market size and opportunity, competitive position, industry environment, potential growth opportunities, business model, reimbursement rates and coverage, the outcome of contingencies such as legal proceedings and our expectations for future operations and results. These forward-looking statements are subject to a number of risks, uncertainties and assumptions, including, but not limited to, those described herein and in “Risk Factors” in our most recent 10-K and 10-Q filed with the SEC. Moreover, we operate in a very competitive and rapidly changing environment. New risks emerge from time to time. It is not possible for our management to predict all risks, nor can we assess the impact of all factors on our business or the extent to which any factor, or combination of factors, may cause actual results to differ materially from those contained in any forward-looking statements we may make. In light of these risks, uncertainties and assumptions, the forward-looking events and circumstances discussed in this presentation may not occur and actual results could differ materially and adversely from those anticipated or implied in the forward-looking statements. You should not rely upon forward-looking statements as predictions of future events. Although we believe that the expectations reflected in the forward-looking statements are reasonable, we cannot guarantee that the future results, levels of activity, performance or events and circumstances reflected in the forward-looking statements will be achieved or occur. Moreover, except as required by law, neither we nor any other person assumes responsibility for the accuracy and completeness of the forward-looking statements. We undertake no obligation to update publicly any forward-looking statements for any reason after the date of this presentation to conform these statements to actual results or to changes in our expectations. This presentation regarding the Company and the accompanying oral presentation shall not constitute an offer to sell or the solicitation of an offer to buy any securities, nor shall there be any sale of these securities in any state or jurisdiction in which such offer, solicitation or sale would be unlawful prior to registration or qualification under the securities laws of any such state or jurisdiction. Sales and offers to sell iRhythm securities will only be made in accordance with the Securities Act of 1933, as amended, and applicable SEC regulations, including prospectus requirements. This presentation and the accompanying oral presentation contain non-GAAP financial measures. The appendix to this presentation reconciles the non-GAAP financial measures to the most directly comparable financial measure prepared in accordance with Generally Accepted Accounting Principles (GAAP). These non-GAAP financial measures include adjusted operating expenses, adjusted net income (loss), adjusted net income (loss) per share, adjusted EBITDA, adjusted EBITDA margin, and free cash flow. iRhythm reports non-GAAP financial measures in addition to, and not as a substitute for, or superior to, measures of financial performance prepared in accordance with GAAP. We believe that non-GAAP financial measures should only be used to evaluate our results of operations in conjunction with the corresponding GAAP financial measures. Other companies, including other companies in our industry, may not use this measure or may calculate this measures differently than as presented. We encourage investors to carefully consider our results under GAAP as well as our supplemental non-GAAP information and reconciliations between these presentations to more fully understand our business. |
| When a signal changes everything. |

| Normal EKG in the ER. Life-threatening arrhythmia in real life. Picture of health. Clinically actionable arrhythmia discovered by chance. Symptoms were real. Arrhythmia ruled out. Predictive AI identified elevated risk. Significant arrhythmia burden confirmed. |

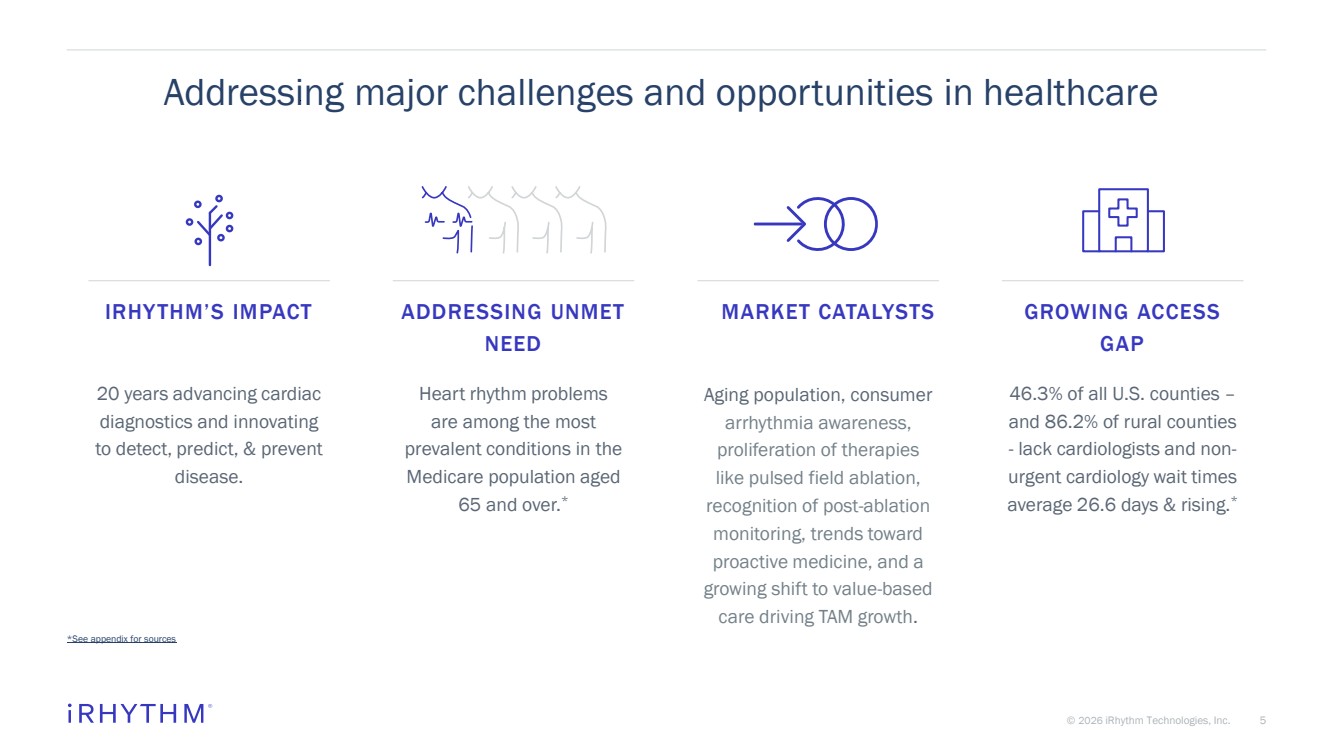
| 5 © 2026 iRhythm Technologies, Inc. 5 Addressing major challenges and opportunities in healthcare 46.3% of all U.S. counties – and 86.2% of rural counties - lack cardiologists and non-urgent cardiology wait times average 26.6 days & rising.* GROWING ACCESS GAP Aging population, consumer arrhythmia awareness, proliferation of therapies like pulsed field ablation, recognition of post-ablation monitoring, trends toward proactive medicine, and a growing shift to value-based care driving TAM growth. MARKET CATALYSTS 20 years advancing cardiac diagnostics and innovating to detect, predict, & prevent disease. IRHYTHM’S IMPACT Heart rhythm problems are among the most prevalent conditions in the Medicare population aged 65 and over.* ADDRESSING UNMET NEED *See appendix for sources |
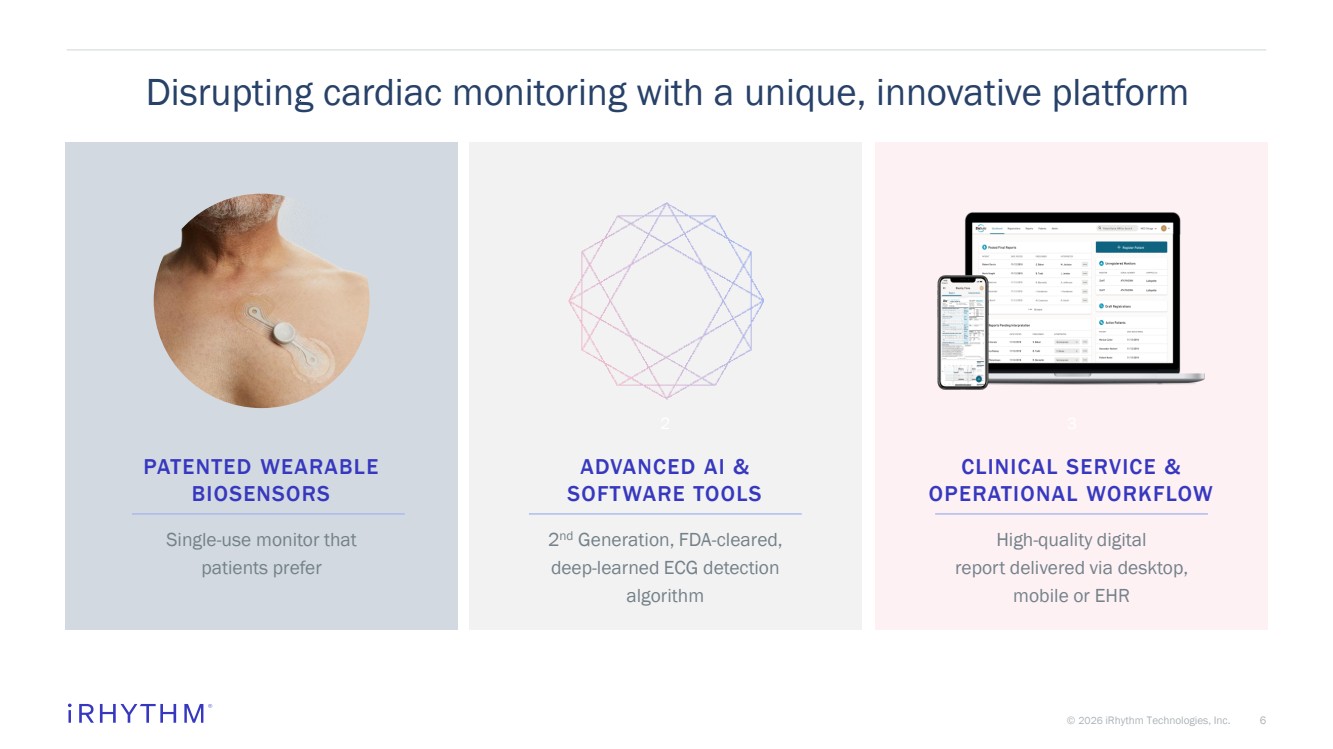
| 6 © 2026 iRhythm Technologies, Inc. 6 Disrupting cardiac monitoring with a unique, innovative platform ADVANCED AI & SOFTWARE TOOLS 2 nd Generation, FDA-cleared, deep-learned ECG detection algorithm PATENTED WEARABLE BIOSENSORS Single-use monitor that patients prefer 2 CLINICAL SERVICE & OPERATIONAL WORKFLOW High-quality digital report delivered via desktop, mobile or EHR 3 |
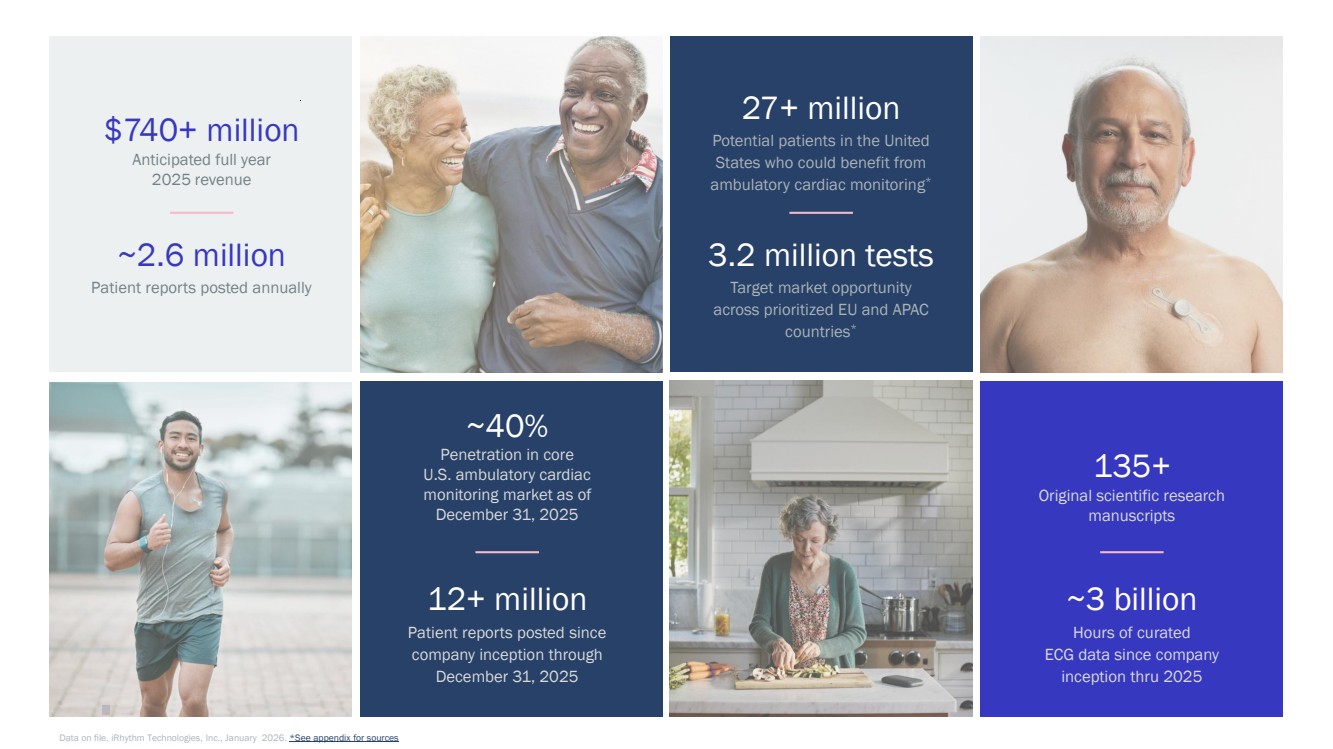
| Data on file. iRhythm Technologies, Inc., January 2026. *See appendix for sources $740+ million Anticipated full year 2025 revenue 3.2 million tests Target market opportunity across prioritized EU and APAC countries* 27+ million Potential patients in the United States who could benefit from ambulatory cardiac monitoring* ~3 billion Hours of curated ECG data since company inception thru 2025 135+ Original scientific research manuscripts ~40% Penetration in core U.S. ambulatory cardiac monitoring market as of December 31, 2025 12+ million Patient reports posted since company inception through December 31, 2025 ~2.6 million Patient reports posted annually |
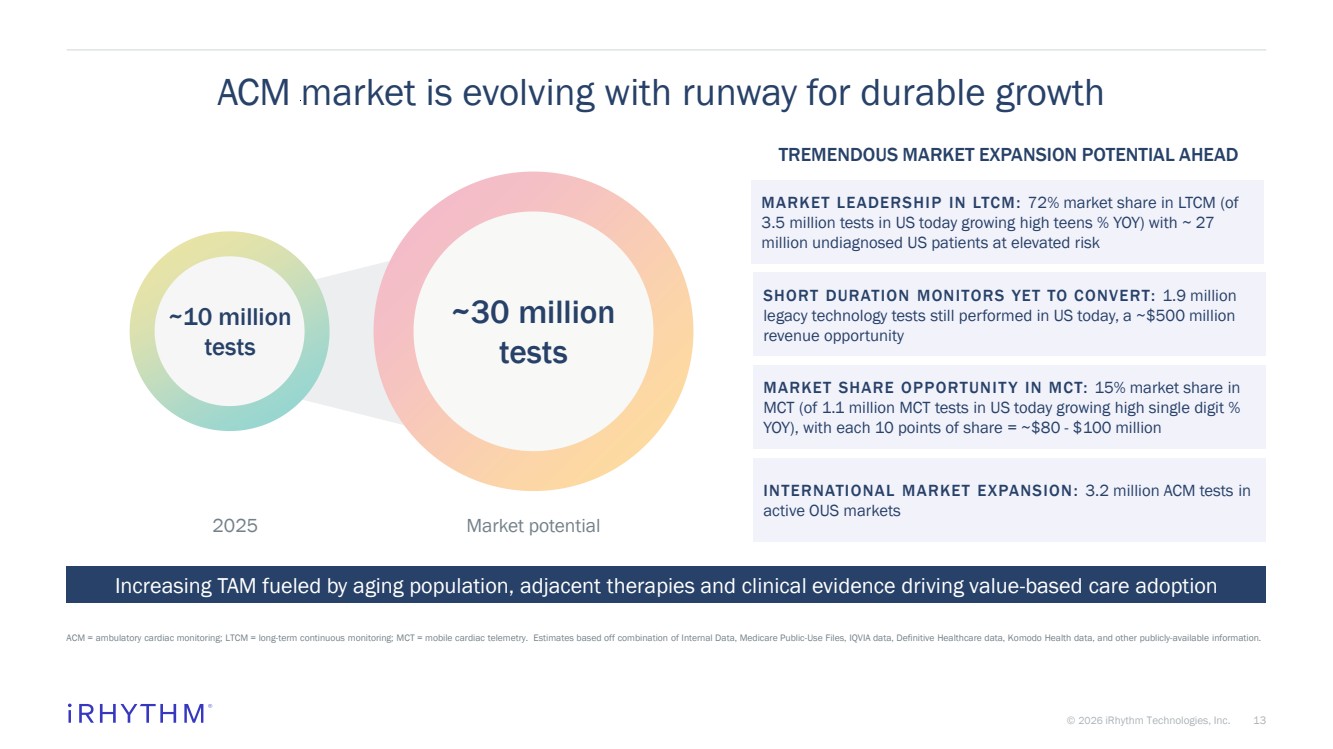
| 13 © 2026 iRhythm Technologies, Inc. 13 ACM market is evolving with runway for durable growth ACM = ambulatory cardiac monitoring; LTCM = long-term continuous monitoring; MCT = mobile cardiac telemetry. Estimates based off combination of Internal Data, Medicare Public-Use Files, IQVIA data, Definitive Healthcare data, Komodo Health data, and other publicly-available information. 2025 Market potential Increasing TAM fueled by aging population, adjacent therapies and clinical evidence driving value-based care adoption TREMENDOUS MARKET EXPANSION POTENTIAL AHEAD ~10 million tests ~30 million tests MARKET LEADERSHIP IN LTCM: 72% market share in LTCM (of 3.5 million tests in US today growing high teens % YOY) with ~ 27 million undiagnosed US patients at elevated risk SHORT DURATION MONITORS YET TO CONVERT: 1.9 million legacy technology tests still performed in US today, a ~$500 million revenue opportunity MARKET SHARE OPPORTUNIT Y IN MCT: 15% market share in MCT (of 1.1 million MCT tests in US today growing high single digit % YOY), with each 10 points of share = ~$80 - $100 million INTERNATIONAL MARKET EXPANSION: 3.2 million ACM tests in active OUS markets |
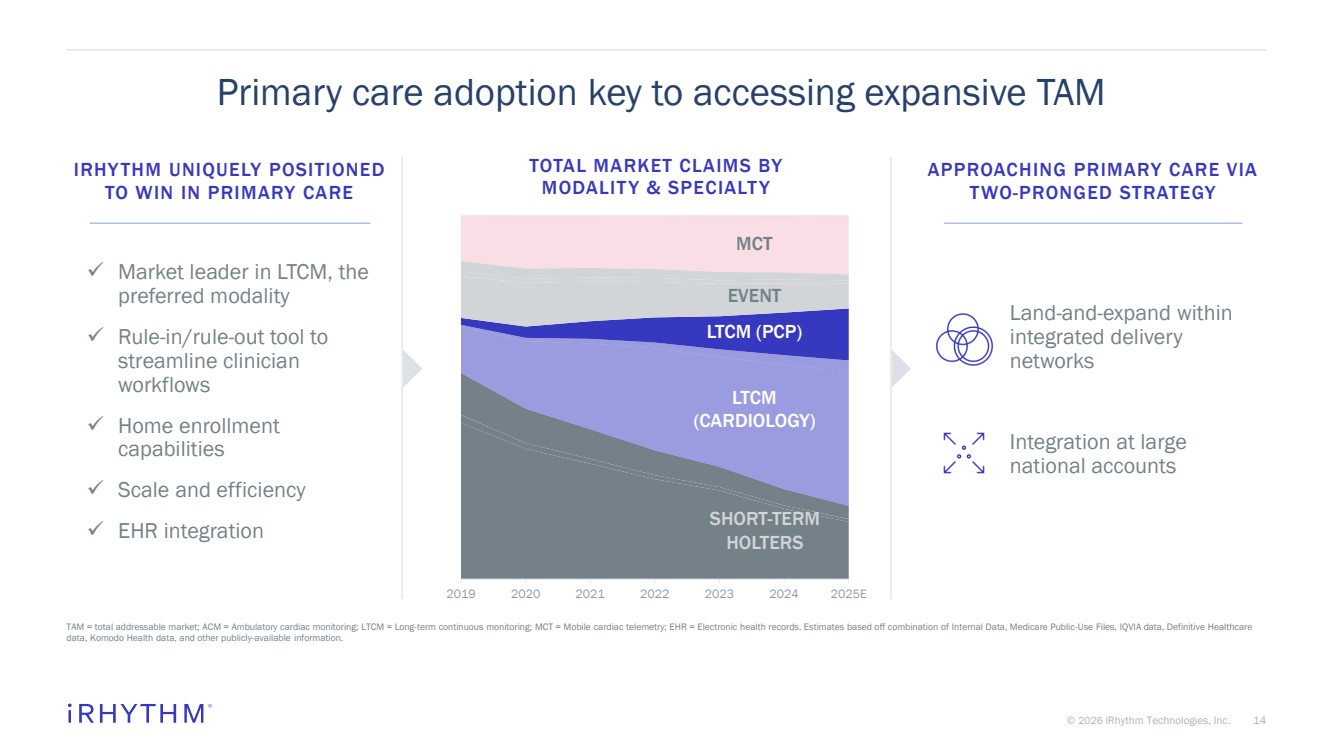
| 14 © 2026 iRhythm Technologies, Inc. 14 Primary care adoption key to accessing expansive TAM TAM = total addressable market; ACM = Ambulatory cardiac monitoring; LTCM = Long-term continuous monitoring; MCT = Mobile cardiac telemetry; EHR = Electronic health records. Estimates based off combination of Internal Data, Medicare Public-Use Files, IQVIA data, Definitive Healthcare data, Komodo Health data, and other publicly-available information. IRHYTHM UNIQUELY POSITIONED TO WIN IN PRIMARY CARE ✓ Market leader in LTCM, the preferred modality ✓ Rule-in/rule-out tool to streamline clinician workflows ✓ Home enrollment capabilities ✓ Scale and efficiency ✓ EHR integration 2019 2020 2021 2022 2023 2024 2025E TOTAL MARKET CLAIMS BY MODALITY & SPECIALTY SHORT-TERM HOLTERS MCT EVENT LTCM (CARDIOLOGY) LTCM (PCP) APPROACHING PRIMARY CARE VIA TWO-PRONGED STRATEGY Land-and-expand within integrated delivery networks Integration at large national accounts |
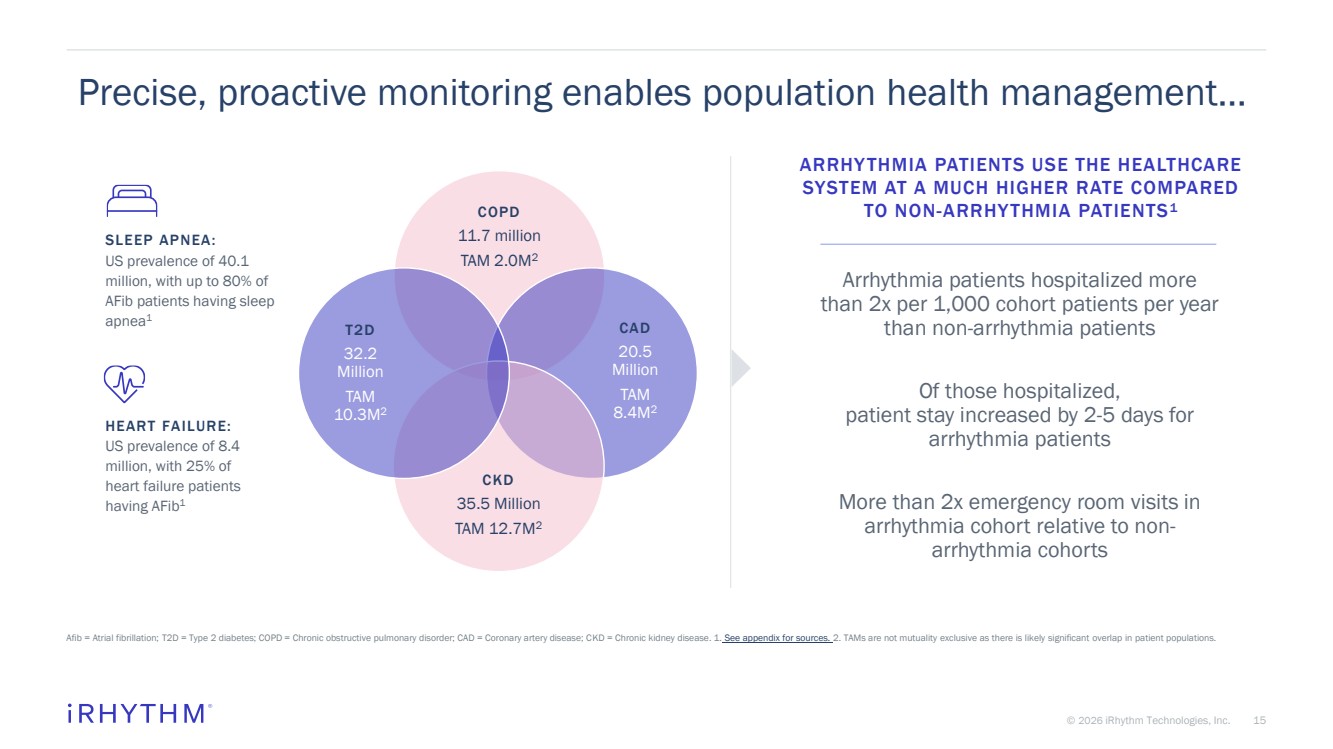
| 15 © 2026 iRhythm Technologies, Inc. 15 Precise, proactive monitoring enables population health management… Afib = Atrial fibrillation; T2D = Type 2 diabetes; COPD = Chronic obstructive pulmonary disorder; CAD = Coronary artery disease; CKD = Chronic kidney disease. 1. See appendix for sources. 2. TAMs are not mutuality exclusive as there is likely significant overlap in patient populations. COPD 11.7 million TAM 2.0M2 CAD 20.5 Million TAM 8.4M2 CKD 35.5 Million TAM 12.7M2 T2D 32.2 Million TAM 10.3M2 ARRHYTHMIA PATIENTS USE THE HEALTHCARE SYSTEM AT A MUCH HIGHER RATE COMPARED TO NON-ARRHYTHMIA PATIENTS1 Arrhythmia patients hospitalized more than 2x per 1,000 cohort patients per year than non-arrhythmia patients Of those hospitalized, patient stay increased by 2-5 days for arrhythmia patients More than 2x emergency room visits in arrhythmia cohort relative to non-arrhythmia cohorts SLEEP APNEA: US prevalence of 40.1 million, with up to 80% of AFib patients having sleep apnea1 HEART FAILURE: US prevalence of 8.4 million, with 25% of heart failure patients having AFib1 |
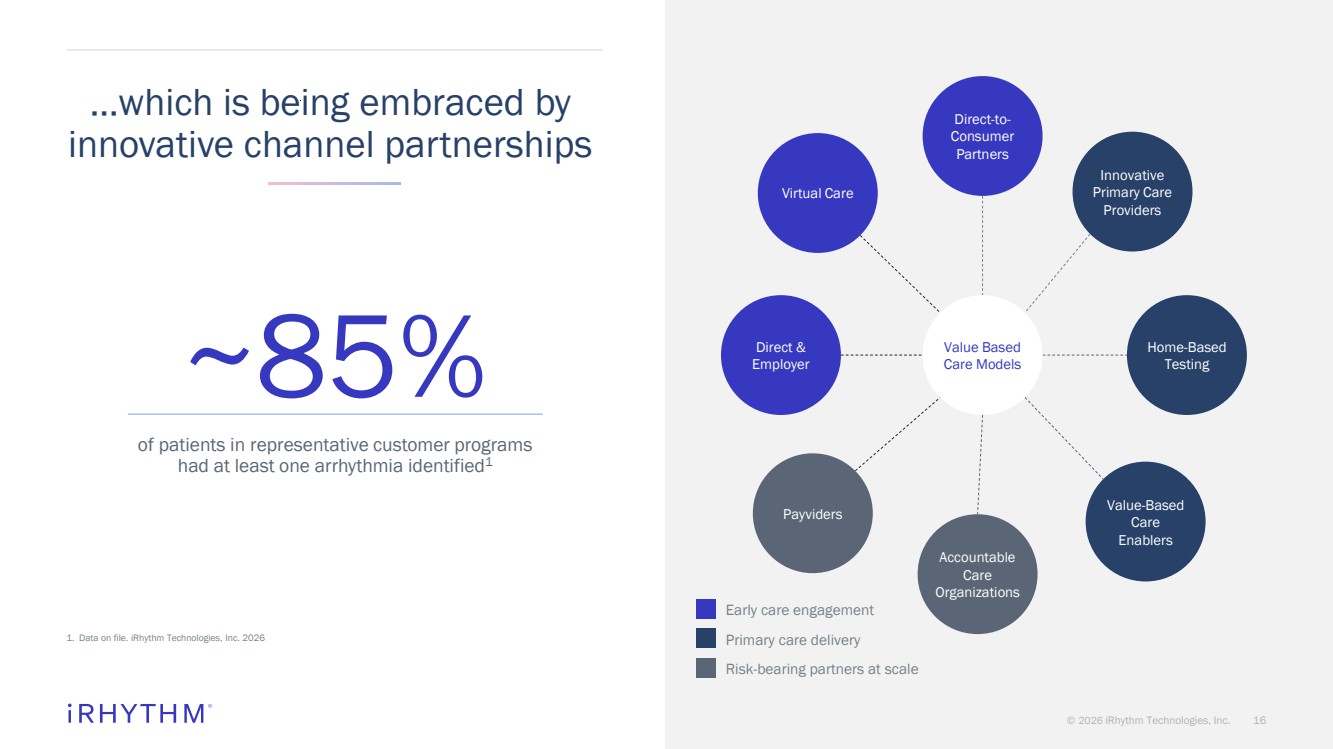
| © 2026 iRhythm Technologies, Inc. 16 …which is being embraced by innovative channel partnerships ~85% of patients in representative customer programs had at least one arrhythmia identified1 Direct-to-Consumer Partners Innovative Primary Care Providers Home-Based Testing Accountable Care Organizations Value Based Care Models Virtual Care Direct & Employer Value-Based Care Enablers Payviders Early care engagement Primary care delivery Risk-bearing partners at scale 1. Data on file. iRhythm Technologies, Inc. 2026 |
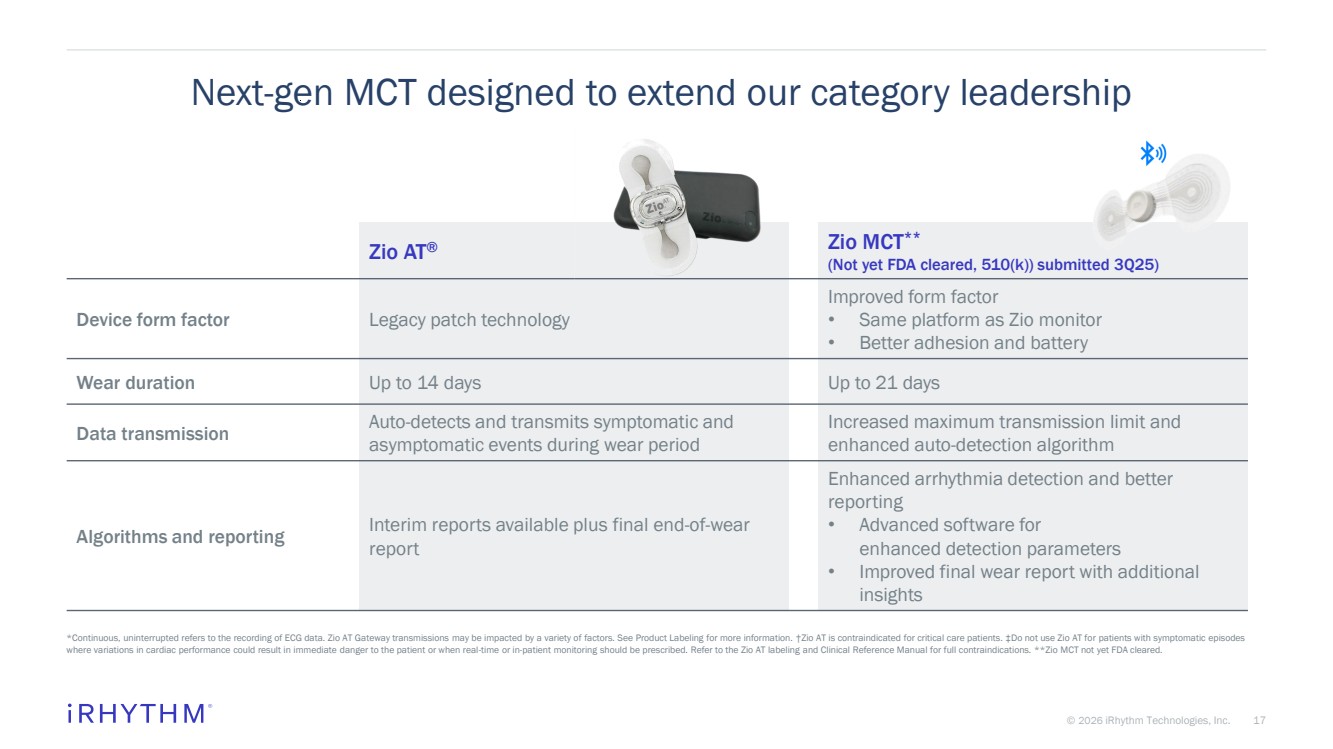
| 17 © 2026 iRhythm Technologies, Inc. 17 Next-gen MCT designed to extend our category leadership Zio AT® Zio MCT** (Not yet FDA cleared, 510(k)) submitted 3Q25) Device form factor Legacy patch technology Improved form factor • Same platform as Zio monitor • Better adhesion and battery Wear duration Up to 14 days Up to 21 days Data transmission Auto-detects and transmits symptomatic and asymptomatic events during wear period Increased maximum transmission limit and enhanced auto-detection algorithm Algorithms and reporting Interim reports available plus final end-of-wear report Enhanced arrhythmia detection and better reporting • Advanced software for enhanced detection parameters • Improved final wear report with additional insights *Continuous, uninterrupted refers to the recording of ECG data. Zio AT Gateway transmissions may be impacted by a variety of factors. See Product Labeling for more information. †Zio AT is contraindicated for critical care patients. ‡Do not use Zio AT for patients with symptomatic episodes where variations in cardiac performance could result in immediate danger to the patient or when real-time or in-patient monitoring should be prescribed. Refer to the Zio AT labeling and Clinical Reference Manual for full contraindications. **Zio MCT not yet FDA cleared. |
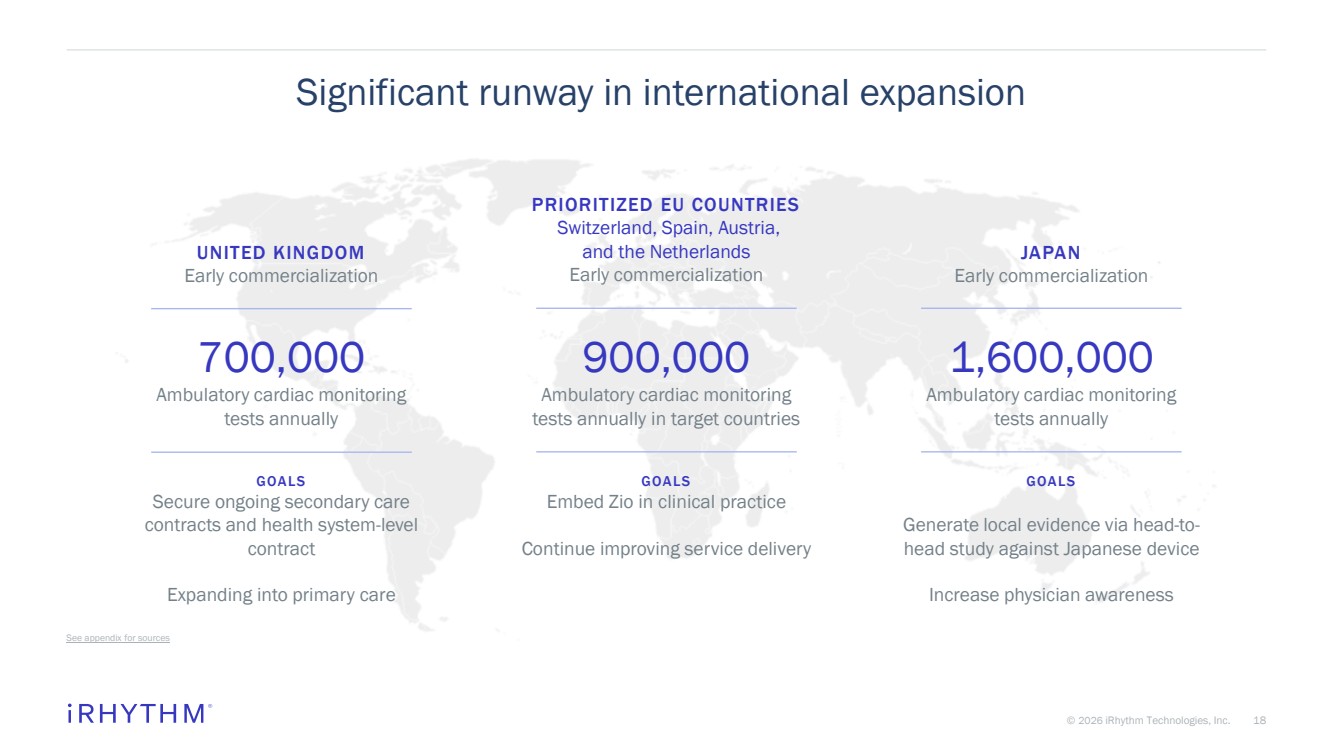
| 18 © 2026 iRhythm Technologies, Inc. 18 Significant runway in international expansion See appendix for sources 1,600,000 Ambulatory cardiac monitoring tests annually JAPAN Early commercialization GOALS Generate local evidence via head-to-head study against Japanese device Increase physician awareness 700,000 Ambulatory cardiac monitoring tests annually UNITED KINGDOM Early commercialization GOALS Secure ongoing secondary care contracts and health system-level contract Expanding into primary care 900,000 Ambulatory cardiac monitoring tests annually in target countries PRIORITIZED EU COUNTRIES Switzerland, Spain, Austria, and the Netherlands Early commercialization GOALS Embed Zio in clinical practice Continue improving service delivery |
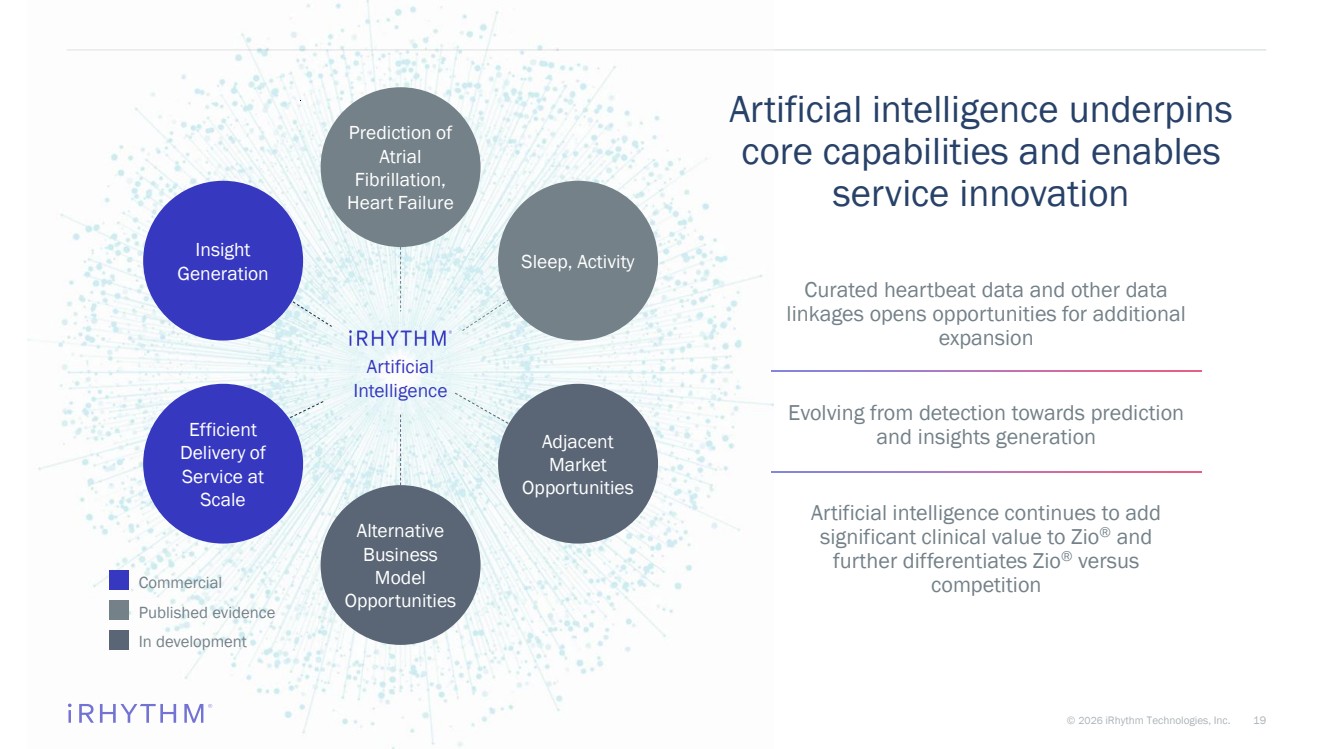
| 19 © 2026 iRhythm Technologies, Inc. 19 Artificial intelligence underpins core capabilities and enables service innovation Curated heartbeat data and other data linkages opens opportunities for additional expansion Evolving from detection towards prediction and insights generation Artificial intelligence continues to add significant clinical value to Zio ® and further differentiates Zio ® versus competition Prediction of Atrial Fibrillation, Heart Failure Sleep, Activity Adjacent Market Opportunities Alternative Business Model Opportunities Commercial Published evidence In development Artificial Intelligence Efficient Delivery of Service at Scale Insight Generation |
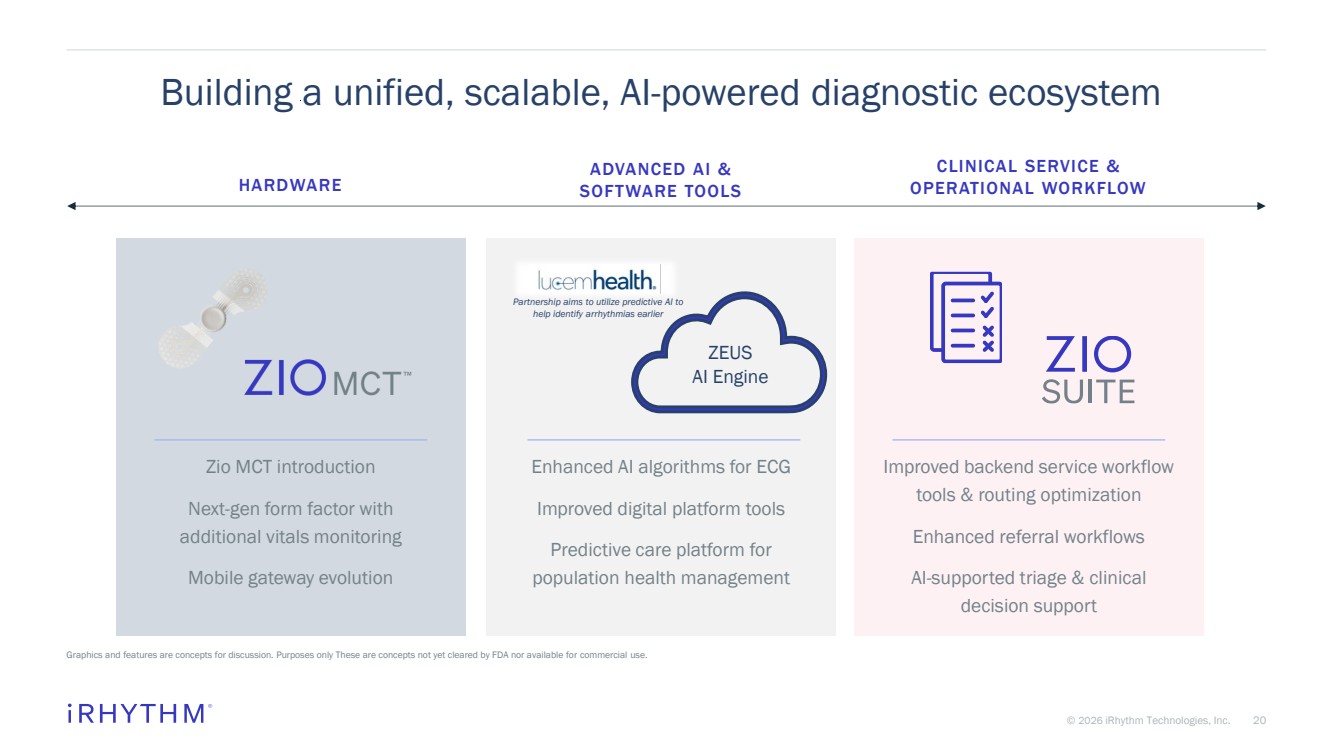
| 20 © 2026 iRhythm Technologies, Inc. 20 Building a unified, scalable, AI-powered diagnostic ecosystem Graphics and features are concepts for discussion. Purposes only These are concepts not yet cleared by FDA nor available for commercial use. ADVANCED AI & SOFTWARE TOOLS Enhanced AI algorithms for ECG Improved digital platform tools Predictive care platform for population health management HARDWARE Zio MCT introduction Next-gen form factor with additional vitals monitoring Mobile gateway evolution CLINICAL SERVICE & OPERATIONAL WORKFLOW Improved backend service workflow tools & routing optimization Enhanced referral workflows AI-supported triage & clinical decision support ZEUS AI Engine Partnership aims to utilize predictive AI to help identify arrhythmias earlier |
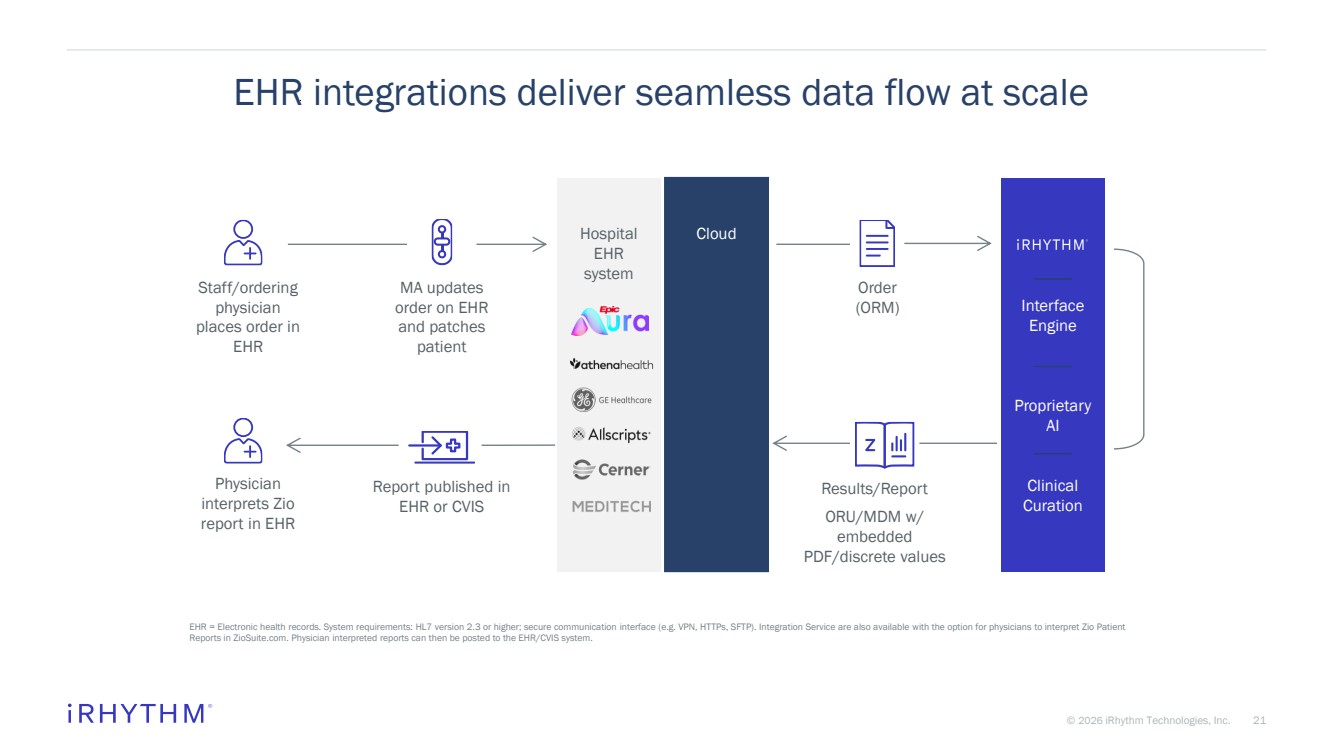
| 21 © 2026 iRhythm Technologies, Inc. 21 EHR integrations deliver seamless data flow at scale EHR = Electronic health records. System requirements: HL7 version 2.3 or higher; secure communication interface (e.g. VPN, HTTPs, SFTP). Integration Service are also available with the option for physicians to interpret Zio Patient Reports in ZioSuite.com. Physician interpreted reports can then be posted to the EHR/CVIS system. Hospital EHR system Cloud Interface Engine Proprietary AI Clinical Curation Staff/ordering physician places order in EHR MA updates order on EHR and patches patient Order (ORM) Results/Report ORU/MDM w/ embedded PDF/discrete values Report published in EHR or CVIS Physician interprets Zio report in EHR |
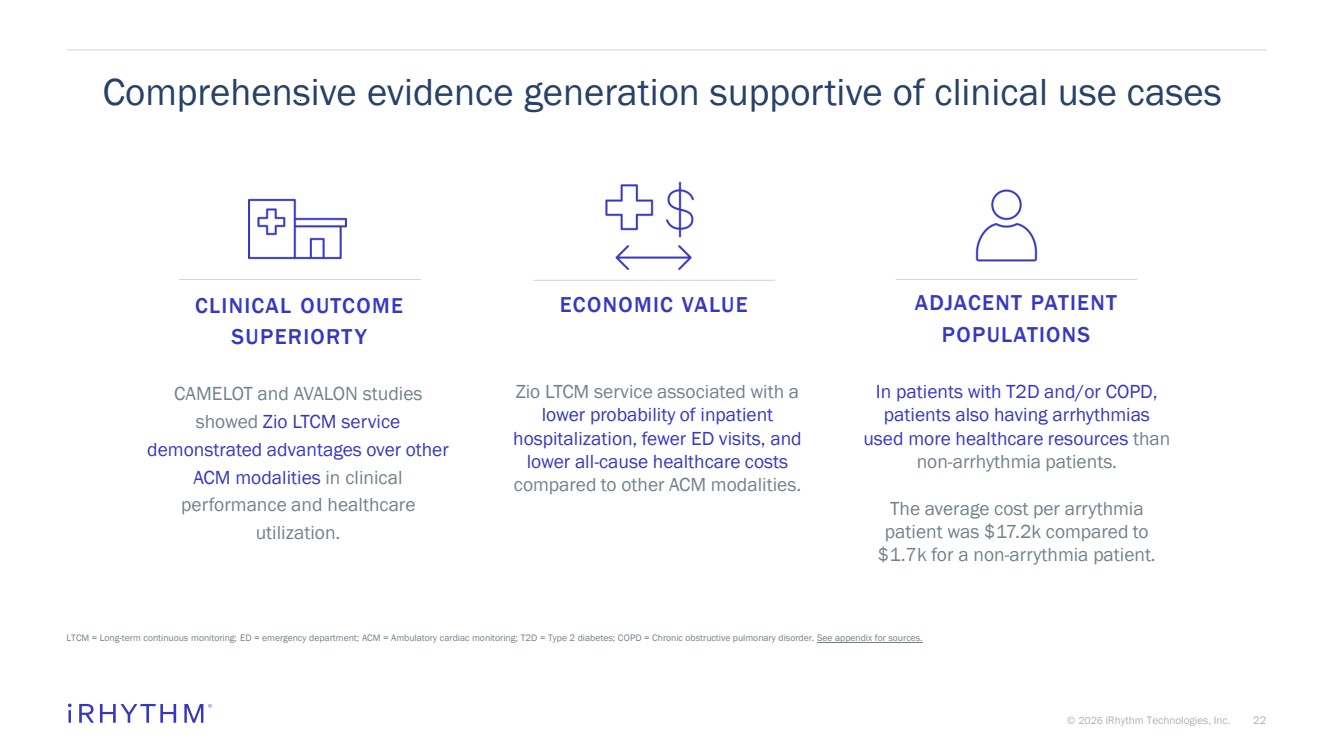
| 22 © 2026 iRhythm Technologies, Inc. 22 Comprehensive evidence generation supportive of clinical use cases LTCM = Long-term continuous monitoring; ED = emergency department; ACM = Ambulatory cardiac monitoring; T2D = Type 2 diabetes; COPD = Chronic obstructive pulmonary disorder. See appendix for sources. In patients with T2D and/or COPD, patients also having arrhythmias used more healthcare resources than non-arrhythmia patients. The average cost per arrythmia patient was $17.2k compared to $1.7k for a non-arrythmia patient. Zio LTCM service associated with a lower probability of inpatient hospitalization, fewer ED visits, and lower all-cause healthcare costs compared to other ACM modalities. CAMELOT and AVALON studies showed Zio LTCM service demonstrated advantages over other ACM modalities in clinical performance and healthcare utilization. ADJACENT PATIENT POPULATIONS CLINICAL OUTCOME SUPERIORTY ECONOMIC VALUE |
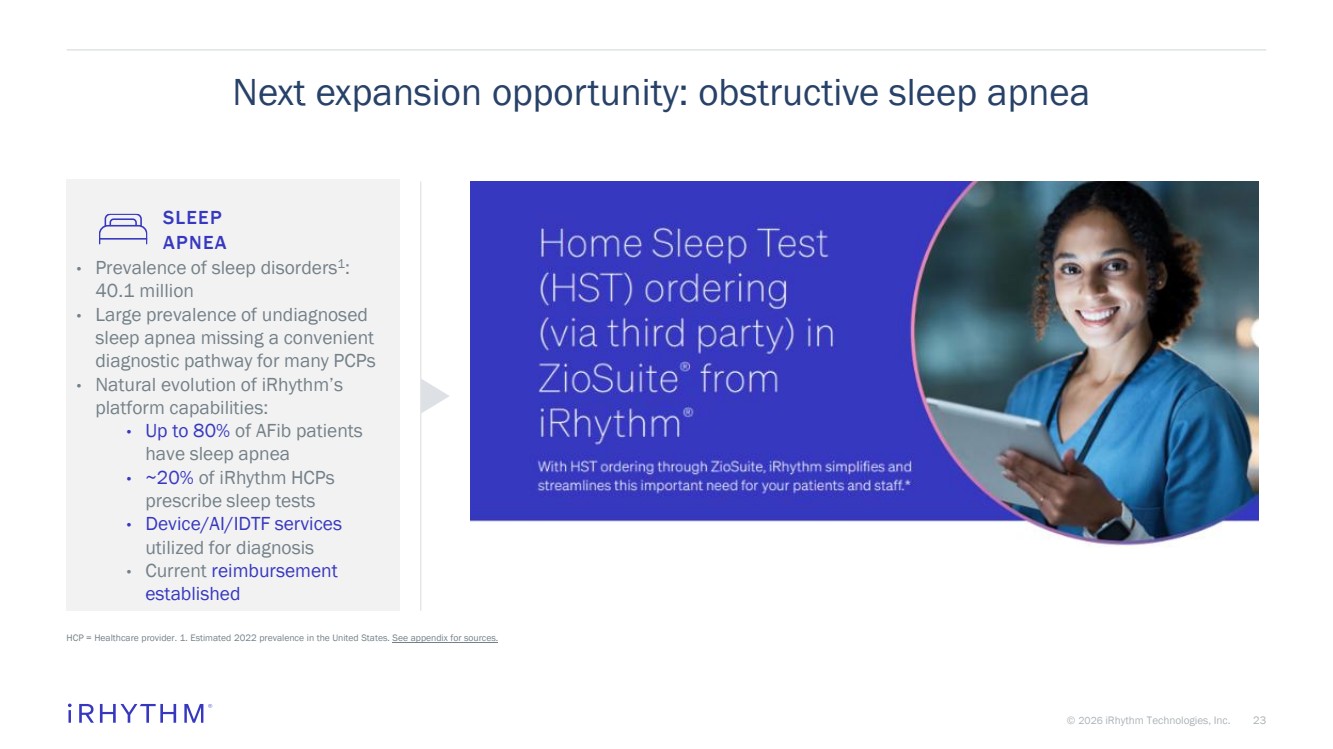
| 23 © 2026 iRhythm Technologies, Inc. 23 Next expansion opportunity: obstructive sleep apnea HCP = Healthcare provider. 1. Estimated 2022 prevalence in the United States. See appendix for sources. • Prevalence of sleep disorders1 : 40.1 million • Large prevalence of undiagnosed sleep apnea missing a convenient diagnostic pathway for many PCPs • Natural evolution of iRhythm’s platform capabilities: • Up to 80% of AFib patients have sleep apnea • ~20% of iRhythm HCPs prescribe sleep tests • Device/AI/IDTF services utilized for diagnosis • Current reimbursement established SLEEP APNEA |
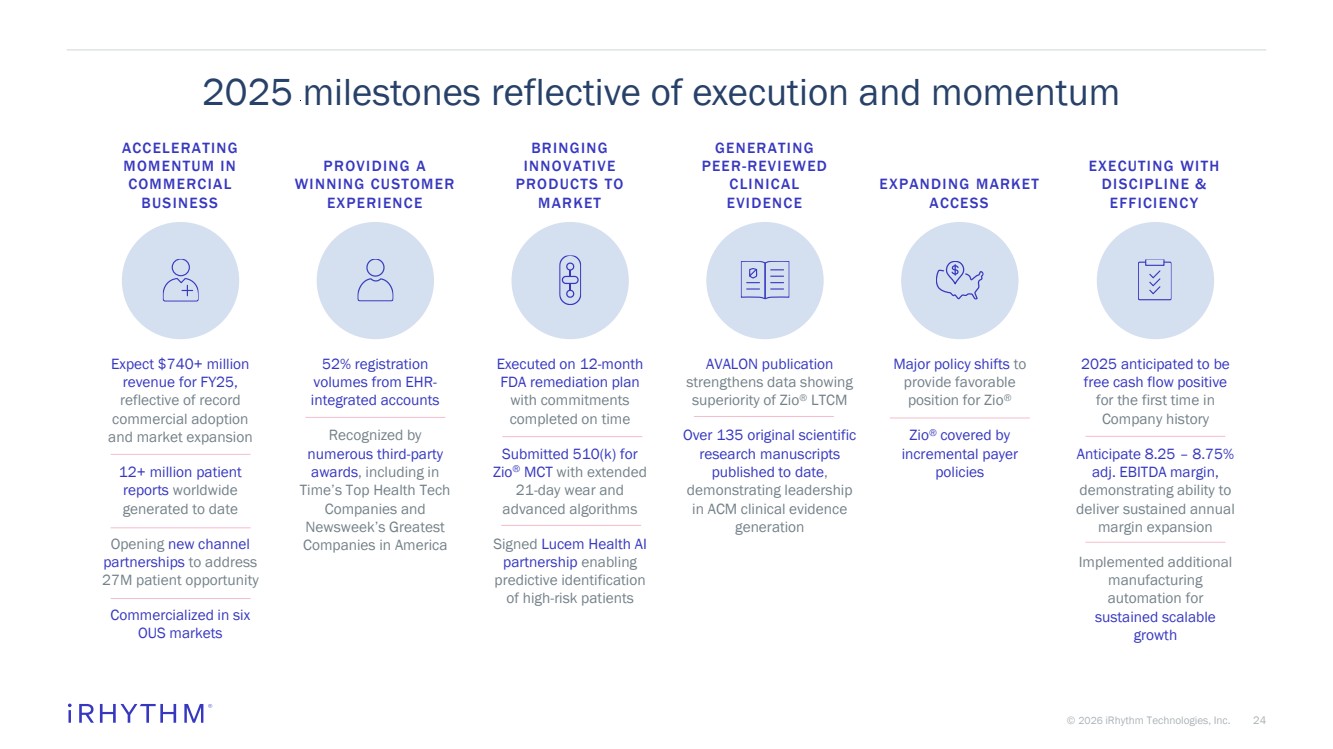
| 24 © 2026 iRhythm Technologies, Inc. 24 52% registration volumes from EHR-integrated accounts Recognized by numerous third-party awards, including in Time’s Top Health Tech Companies and Newsweek’s Greatest Companies in America 2025 milestones reflective of execution and momentum Executed on 12-month FDA remediation plan with commitments completed on time Submitted 510(k) for Zio® MCT with extended 21-day wear and advanced algorithms Signed Lucem Health AI partnership enabling predictive identification of high-risk patients BRINGING INNOVATIVE PRODUCTS TO MARKET Expect $740+ million revenue for FY25, reflective of record commercial adoption and market expansion 12+ million patient reports worldwide generated to date Opening new channel partnerships to address 27M patient opportunity Commercialized in six OUS markets ACCELERATING MOMENTUM IN COMMERCIAL BUSINESS AVALON publication strengthens data showing superiority of Zio® LTCM Over 135 original scientific research manuscripts published to date, demonstrating leadership in ACM clinical evidence generation GENERATING PEER-REVIEWED CLINICAL EVIDENCE Major policy shifts to provide favorable position for Zio® Zio® covered by incremental payer policies EXPANDING MARKET ACCESS EXECUTING WITH DISCIPLINE & EFFICIENCY 2025 anticipated to be free cash flow positive for the first time in Company history Anticipate 8.25 – 8.75% adj. EBITDA margin, demonstrating ability to deliver sustained annual margin expansion Implemented additional manufacturing automation for sustained scalable growth PROVIDING A WINNING CUSTOMER EXPERIENCE |
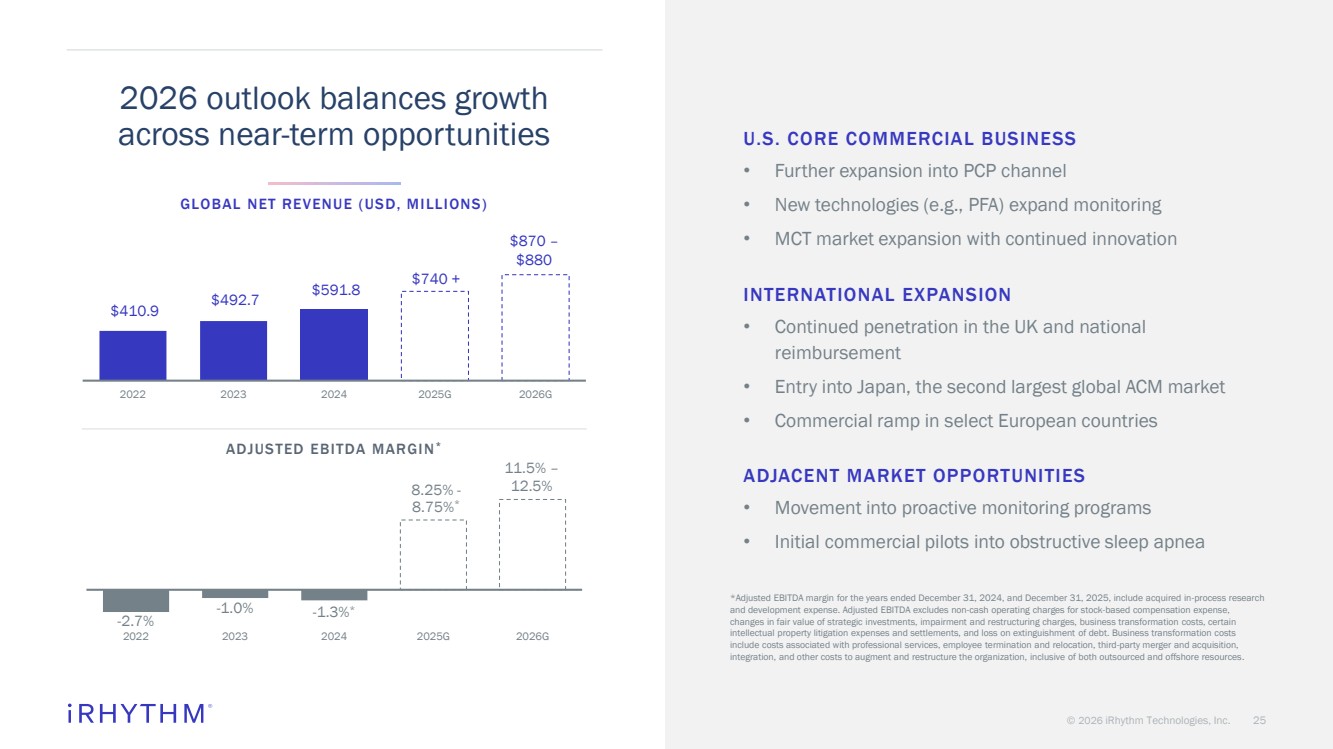
| © 2026 iRhythm Technologies, Inc. 25 -2.7% -1.0% -1.3%* 8.25% - 8.75%* 2022 2023 2024 2025G 2026G $410.9 $492.7 $591.8 $740 + 2022 2023 2024 2025G 2026G GLOBAL NET REVENUE (USD, MILLIONS) ADJUSTED EBITDA MARGIN* U.S. CORE COMMERCIAL BUSINESS • Further expansion into PCP channel • New technologies (e.g., PFA) expand monitoring • MCT market expansion with continued innovation INTERNATIONAL EXPANSION • Continued penetration in the UK and national reimbursement • Entry into Japan, the second largest global ACM market • Commercial ramp in select European countries ADJACENT MARKET OPPORTUNITIES • Movement into proactive monitoring programs • Initial commercial pilots into obstructive sleep apnea 2026 outlook balances growth across near-term opportunities *Adjusted EBITDA margin for the years ended December 31, 2024, and December 31, 2025, include acquired in-process research and development expense. Adjusted EBITDA excludes non-cash operating charges for stock-based compensation expense, changes in fair value of strategic investments, impairment and restructuring charges, business transformation costs, certain intellectual property litigation expenses and settlements, and loss on extinguishment of debt. Business transformation costs include costs associated with professional services, employee termination and relocation, third-party merger and acquisition, integration, and other costs to augment and restructure the organization, inclusive of both outsourced and offshore resources. $870 – $880 11.5% – 12.5% |
| Growing revenue through global market expansion Driving meaningful improvements in financial profile Addressing the future focus of healthcare Expanding core & unlocking adjacent markets |

| Appendix |

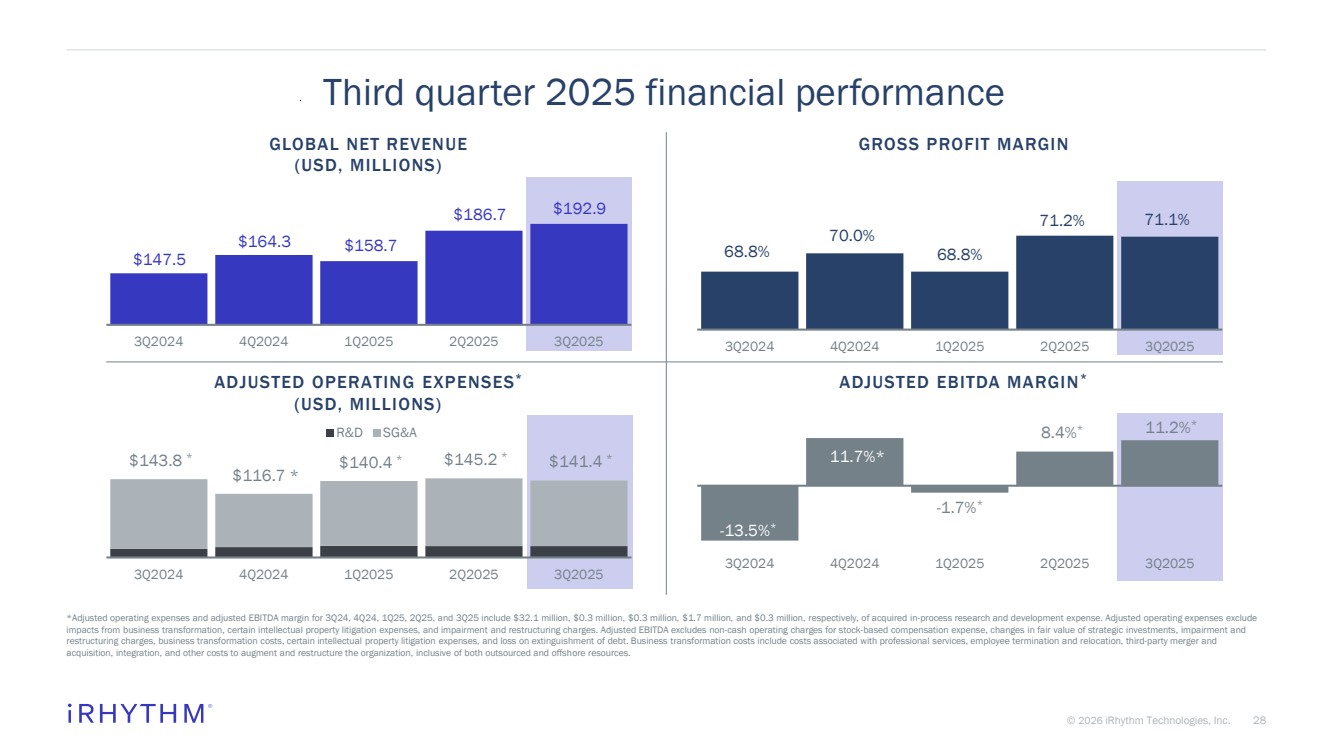
| 28 © 2026 iRhythm Technologies, Inc. 28 Third quarter 2025 financial performance *Adjusted operating expenses and adjusted EBITDA margin for 3Q24, 4Q24, 1Q25, 2Q25, and 3Q25 include $32.1 million, $0.3 million, $0.3 million, $1.7 million, and $0.3 million, respectively, of acquired in-process research and development expense. Adjusted operating expenses exclude impacts from business transformation, certain intellectual property litigation expenses, and impairment and restructuring charges. Adjusted EBITDA excludes non-cash operating charges for stock-based compensation expense, changes in fair value of strategic investments, impairment and restructuring charges, business transformation costs, certain intellectual property litigation expenses, and loss on extinguishment of debt. Business transformation costs include costs associated with professional services, employee termination and relocation, third-party merger and acquisition, integration, and other costs to augment and restructure the organization, inclusive of both outsourced and offshore resources. $147.5 $164.3 $158.7 $186.7 $192.9 3Q2024 4Q2024 1Q2025 2Q2025 3Q2025 -13.5%* 11.7%* -1.7%* 8.4%* 11.2%* 3Q2024 4Q2024 1Q2025 2Q2025 3Q2025 $143.8 * $116.7 * $140.4 * $145.2 * $141.4 * $- $20.0 $40.0 $60.0 $80.0 $100.0 $120.0 $140.0 $160.0 3Q2024 4Q2024 1Q2025 2Q2025 3Q2025 R&D SG&A 68.8% 70.0% 68.8% 71.2% 71.1% 3Q2024 4Q2024 1Q2025 2Q2025 3Q2025 GLOBAL NET REVENUE (USD, MILLIONS) GROSS PROFIT MARGIN ADJUSTED OPERATING EXPENSES* (USD, MILLIONS) ADJUSTED EBITDA MARGIN* |
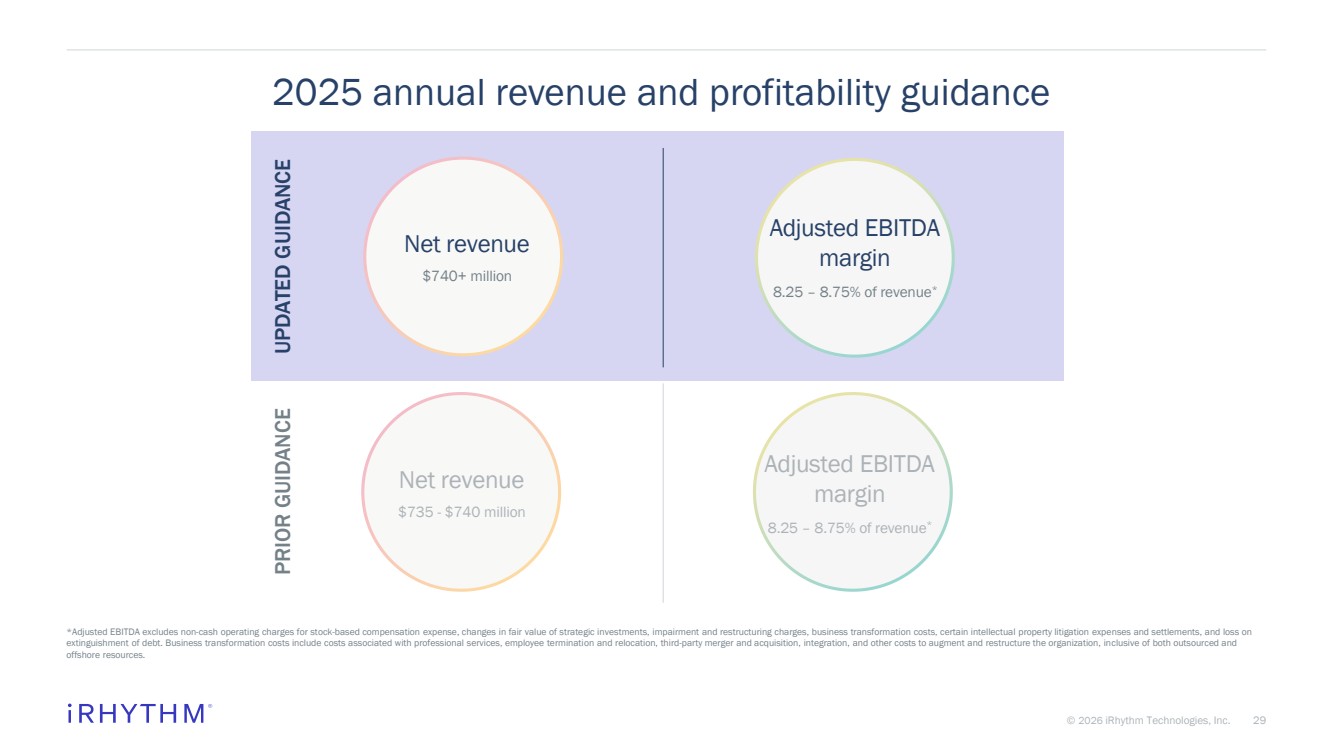
| 29 © 2026 iRhythm Technologies, Inc. 29 2025 annual revenue and profitability guidance *Adjusted EBITDA excludes non-cash operating charges for stock-based compensation expense, changes in fair value of strategic investments, impairment and restructuring charges, business transformation costs, certain intellectual property litigation expenses and settlements, and loss on extinguishment of debt. Business transformation costs include costs associated with professional services, employee termination and relocation, third-party merger and acquisition, integration, and other costs to augment and restructure the organization, inclusive of both outsourced and offshore resources. PRIOR GUIDANCE Net revenue $735 - $740 million Adjusted EBITDA margin 8.25 – 8.75% of revenue* Net revenue $740+ million Adjusted EBITDA margin 8.25 – 8.75% of revenue* UPDATED GUIDANCE |
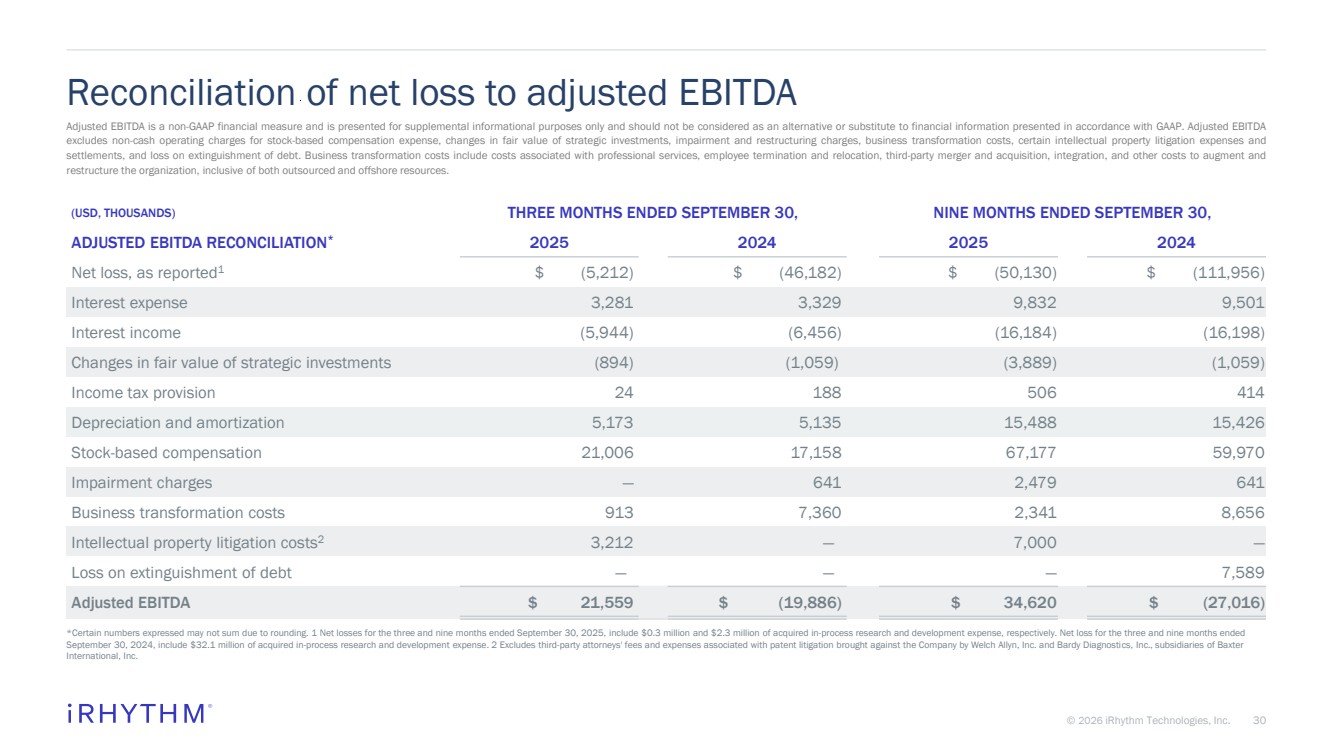
| 30 © 2026 iRhythm Technologies, Inc. 30 Reconciliation of net loss to adjusted EBITDA *Certain numbers expressed may not sum due to rounding. 1 Net losses for the three and nine months ended September 30, 2025, include $0.3 million and $2.3 million of acquired in-process research and development expense, respectively. Net loss for the three and nine months ended September 30, 2024, include $32.1 million of acquired in-process research and development expense. 2 Excludes third-party attorneys' fees and expenses associated with patent litigation brought against the Company by Welch Allyn, Inc. and Bardy Diagnostics, Inc., subsidiaries of Baxter International, Inc. (USD, THOUSANDS) THREE MONTHS ENDED SEPTEMBER 30, NINE MONTHS ENDED SEPTEMBER 30, ADJUSTED EBITDA RECONCILIATION* 2025 2024 2025 2024 Net loss, as reported1 $ (5,212) $ (46,182) $ (50,130) $ (111,956) Interest expense 3,281 3,329 9,832 9,501 Interest income (5,944) (6,456) (16,184) (16,198) Changes in fair value of strategic investments (894) (1,059) (3,889) (1,059) Income tax provision 24 188 506 414 Depreciation and amortization 5,173 5,135 15,488 15,426 Stock-based compensation 21,006 17,158 67,177 59,970 Impairment charges — 641 2,479 641 Business transformation costs 913 7,360 2,341 8,656 Intellectual property litigation costs2 3,212 — 7,000 — Loss on extinguishment of debt — — — 7,589 Adjusted EBITDA $ 21,559 $ (19,886) $ 34,620 $ (27,016) Adjusted EBITDA is a non-GAAP financial measure and is presented for supplemental informational purposes only and should not be considered as an alternative or substitute to financial information presented in accordance with GAAP. Adjusted EBITDA excludes non-cash operating charges for stock-based compensation expense, changes in fair value of strategic investments, impairment and restructuring charges, business transformation costs, certain intellectual property litigation expenses and settlements, and loss on extinguishment of debt. Business transformation costs include costs associated with professional services, employee termination and relocation, third-party merger and acquisition, integration, and other costs to augment and restructure the organization, inclusive of both outsourced and offshore resources. |
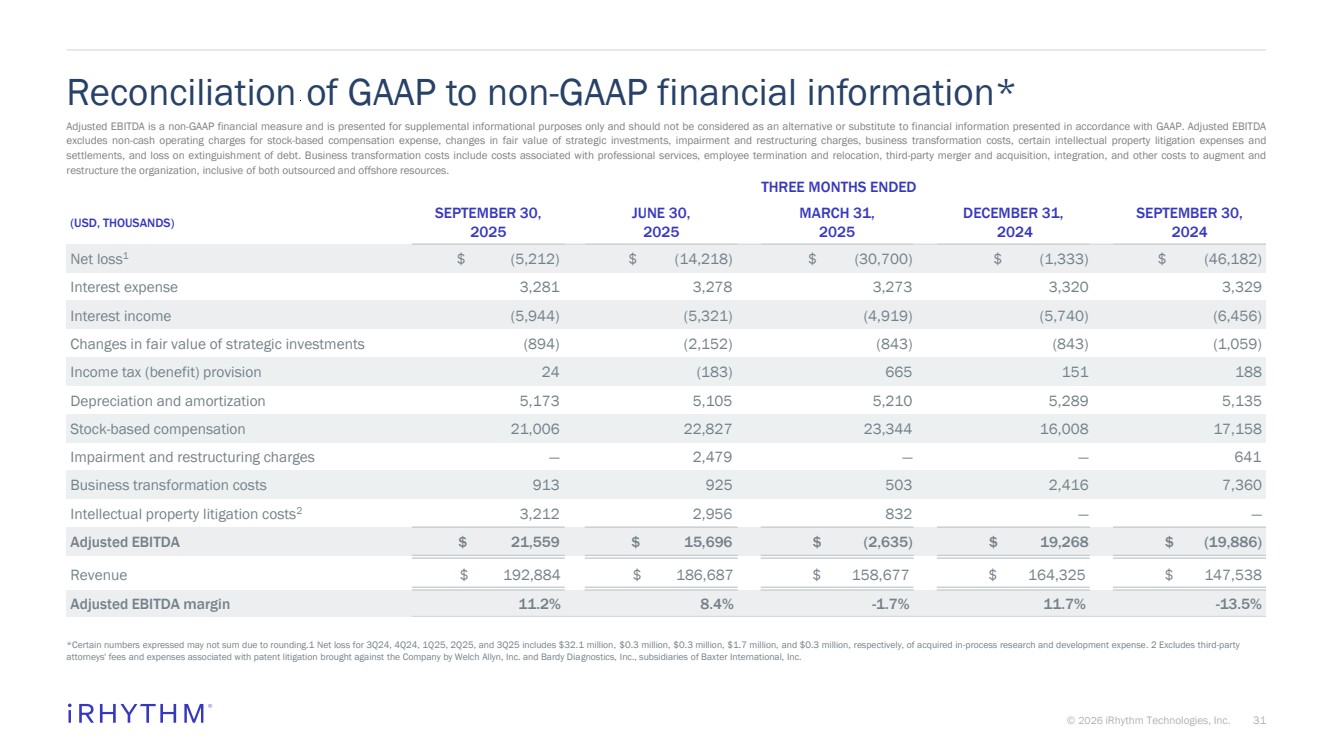
| 31 © 2026 iRhythm Technologies, Inc. 31 THREE MONTHS ENDED (USD, THOUSANDS) SEPTEMBER 30, 2025 JUNE 30, 2025 MARCH 31, 2025 DECEMBER 31, 2024 SEPTEMBER 30, 2024 Net loss1 $ (5,212) $ (14,218) $ (30,700) $ (1,333) $ (46,182) Interest expense 3,281 3,278 3,273 3,320 3,329 Interest income (5,944) (5,321) (4,919) (5,740) (6,456) Changes in fair value of strategic investments (894) (2,152) (843) (843) (1,059) Income tax (benefit) provision 24 (183) 665 151 188 Depreciation and amortization 5,173 5,105 5,210 5,289 5,135 Stock-based compensation 21,006 22,827 23,344 16,008 17,158 Impairment and restructuring charges — 2,479 — — 641 Business transformation costs 913 925 503 2,416 7,360 Intellectual property litigation costs2 3,212 2,956 832 — — Adjusted EBITDA $ 21,559 $ 15,696 $ (2,635) $ 19,268 $ (19,886) Revenue $ 192,884 $ 186,687 $ 158,677 $ 164,325 $ 147,538 Adjusted EBITDA margin 11.2% 8.4% -1.7% 11.7% -13.5% Reconciliation of GAAP to non-GAAP financial information* *Certain numbers expressed may not sum due to rounding.1 Net loss for 3Q24, 4Q24, 1Q25, 2Q25, and 3Q25 includes $32.1 million, $0.3 million, $0.3 million, $1.7 million, and $0.3 million, respectively, of acquired in-process research and development expense. 2 Excludes third-party attorneys' fees and expenses associated with patent litigation brought against the Company by Welch Allyn, Inc. and Bardy Diagnostics, Inc., subsidiaries of Baxter International, Inc. Adjusted EBITDA is a non-GAAP financial measure and is presented for supplemental informational purposes only and should not be considered as an alternative or substitute to financial information presented in accordance with GAAP. Adjusted EBITDA excludes non-cash operating charges for stock-based compensation expense, changes in fair value of strategic investments, impairment and restructuring charges, business transformation costs, certain intellectual property litigation expenses and settlements, and loss on extinguishment of debt. Business transformation costs include costs associated with professional services, employee termination and relocation, third-party merger and acquisition, integration, and other costs to augment and restructure the organization, inclusive of both outsourced and offshore resources. |
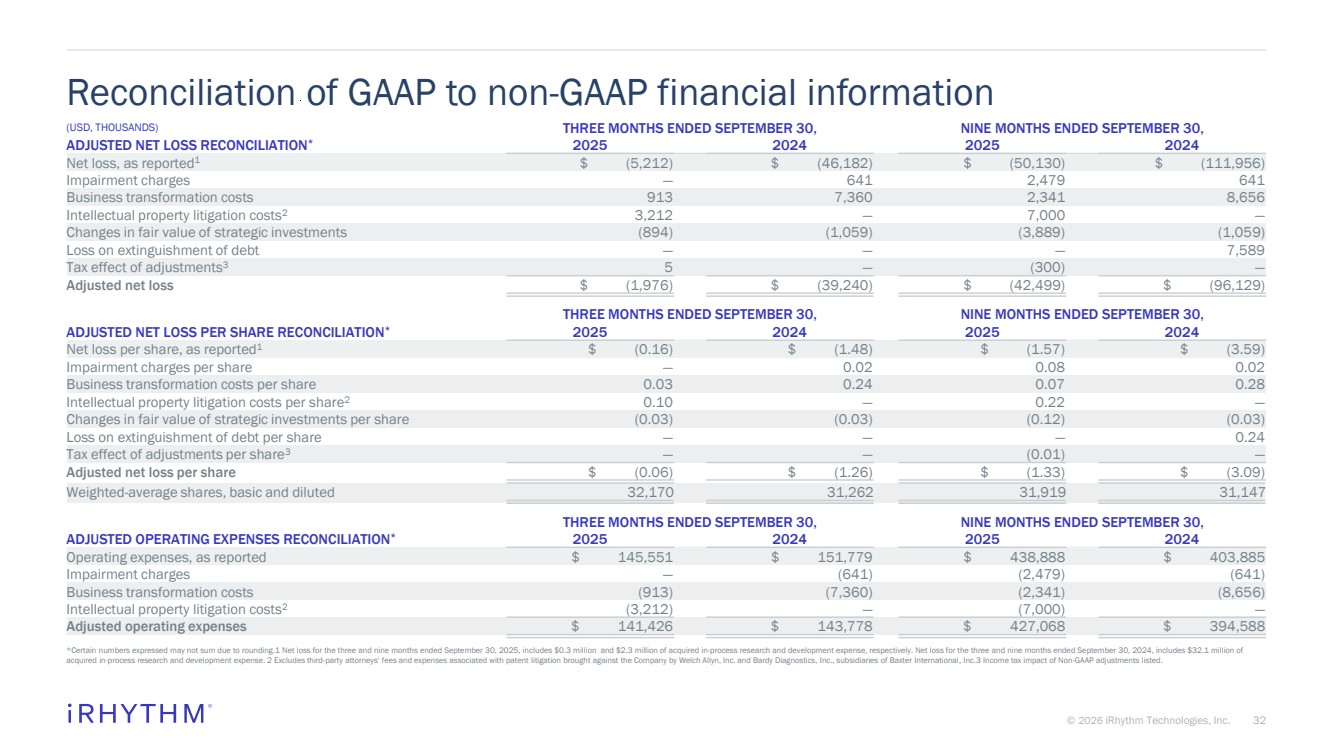
| 32 © 2026 iRhythm Technologies, Inc. 32 (USD, THOUSANDS) THREE MONTHS ENDED SEPTEMBER 30, NINE MONTHS ENDED SEPTEMBER 30, ADJUSTED NET LOSS RECONCILIATION* 2025 2024 2025 2024 Net loss, as reported1 $ (5,212) $ (46,182) $ (50,130) $ (111,956) Impairment charges — 641 2,479 641 Business transformation costs 913 7,360 2,341 8,656 Intellectual property litigation costs2 3,212 — 7,000 — Changes in fair value of strategic investments (894) (1,059) (3,889) (1,059) Loss on extinguishment of debt — — — 7,589 Tax effect of adjustments3 5 — (300) — Adjusted net loss $ (1,976) $ (39,240) $ (42,499) $ (96,129) THREE MONTHS ENDED SEPTEMBER 30, NINE MONTHS ENDED SEPTEMBER 30, ADJUSTED NET LOSS PER SHARE RECONCILIATION* 2025 2024 2025 2024 Net loss per share, as reported1 $ (0.16) $ (1.48) $ (1.57) $ (3.59) Impairment charges per share — 0.02 0.08 0.02 Business transformation costs per share 0.03 0.24 0.07 0.28 Intellectual property litigation costs per share2 0.10 — 0.22 — Changes in fair value of strategic investments per share (0.03) (0.03) (0.12) (0.03) Loss on extinguishment of debt per share — — — 0.24 Tax effect of adjustments per share3 — — (0.01) — Adjusted net loss per share $ (0.06) $ (1.26) $ (1.33) $ (3.09) Weighted-average shares, basic and diluted 32,170 31,262 31,919 31,147 THREE MONTHS ENDED SEPTEMBER 30, NINE MONTHS ENDED SEPTEMBER 30, ADJUSTED OPERATING EXPENSES RECONCILIATION* 2025 2024 2025 2024 Operating expenses, as reported $ 145,551 $ 151,779 $ 438,888 $ 403,885 Impairment charges — (641) (2,479) (641) Business transformation costs (913) (7,360) (2,341) (8,656) Intellectual property litigation costs2 (3,212) — (7,000) — Adjusted operating expenses $ 141,426 $ 143,778 $ 427,068 $ 394,588 Reconciliation of GAAP to non-GAAP financial information *Certain numbers expressed may not sum due to rounding.1 Net loss for the three and nine months ended September 30, 2025, includes $0.3 million and $2.3 million of acquired in-process research and development expense, respectively. Net loss for the three and nine months ended September 30, 2024, includes $32.1 million of acquired in-process research and development expense. 2 Excludes third-party attorneys' fees and expenses associated with patent litigation brought against the Company by Welch Allyn, Inc. and Bardy Diagnostics, Inc., subsidiaries of Baxter International, Inc.3 Income tax impact of Non-GAAP adjustments listed. |
| 33 © 2026 iRhythm Technologies, Inc. 33 SLIDE(S) SOURCES ‘Addressing major challenges and opportunities in healthcare’ • Ward et al. Prevalence and health care expenditures among Medicare beneficiaries aged 65 years and over with heart conditions. Medicare Current Beneficiary Survey, 2017. (Prevalence of self-reported heart conditions.) American College of Cardiology. (2024, July 8). • Almost Half of US Counties Have No Cardiologists Despite Higher Prevalence of CV Risk Factors, Mortality [Press Release]. https://www.acc.org/About-ACC/Press-Releases/2024/07/08/18/25/Almost-Half-of-US-Counties-Have-No-Cardiologists-Despite-Higher-Prevalence-of-CV-Risk-Factors-Mortality. Pallikadavath SP, et. al. • High number of unnecessary referrals to cardiology clinics for benign palpitations due to poor adherence to local referral guidelines. European Journal of Arrhythmia & Electrophysiology. 2024;10(1):1-2 iRhythm overview and ‘Significant runway in international expansion’ UK: iRhythm estimate. • UK Office for National Statistics; Hospital Episode Statistics, NHS Digital, 2019-2020 • UK Healthcare Market Review 33ed, LaingBuisson, 2021. Accessed 5 January 2022. • The UK private health market, Kings Fund, 2014. Accessed 5 January 2022. • NHS England and the Health and Social Care Information Centre, NHS Hospital Data and Datasets: A Consultation. Published July 22, 2013. • The Health and Social Care Information Centre, Hospital Episode Statistics (HES): Improving the quality and value of hospital data. Published 2011. Prioritized EU countries: iRhythm estimate. • Ohlrogge etc. Burden of Atrial Fibrillation and Flutter by National Income: Results From the Global Burden of Disease 2019 Database. J Am Heart Assoc. 2023;12:e030438; supplemental data tables https://www.ahajournals.org/doi/suppl/10.1161/JAHA.123.030438. • Global population and healthcare spend per capita, World Bank, 2019 and 2020. https://data.worldbank.org • The Burden of Cardiovascular Disease and Diabetes, OECD, 2011. • Federal Statistical Office of Germany and Gesundheitsberichterstattung; Dutch Healthcare Authority; Swedish ICD & Pacemaker Registry and Swedish Society for Clinical Physiology. Japan: • Irie, Shoichi and Hiroshi Tada. The Relationship between Holter Electrocardiography and Atrial Fibrillation Diagnosis Using Real-World Data in Japan: A Claims-Based Retrospective Study. Int Heart J, 2023; 64: 178-187. • Japan Ministry of Health Labor and Welfare. |
| 34 © 2026 iRhythm Technologies, Inc. 34 SLIDE(S) SOURCES iRhythm overview and ‘ACM market is evolving with runway for durable growth’ US Core ACM Market Sizing • iRhythm estimates based off combination of Internal Data, Medicare Public-Use Files, IQVIA data, Definitive Healthcare data, Komodo Health data, and other publicly-available information. Expansion opportunity in symptomatic market • U.S. Census Bureau. “U.S. Census Bureau Profile.” https://data.census.gov/profile/United_States?g=010XX00US.. • CDC ambulatory care use and physician office visits. CDC, published October 26, 2024. https://www.cdc.gov/nchs/fastats/physician-visits.htm. • Wexler RK, Pleister A, Raman SV. Palpitations: Evaluation in the Primary Care Setting. Am Fam Physician. 2017 Dec 15;96(12):784-789. • Weber BE, Kapoor WN. Evaluation and outcomes of patients with palpitations. The American Journal of Medicine. 1996;14(6):138-148. Expansion opportunity in at-risk population • Steinhubl at al. Effect of a Home-Based Wearable Continuous ECG Monitoring Patch on Detection of Undiagnosed Atrial Fibrillation: The mSToPS Randomized Clinical Trial. JAMA. 2018 Jul 10;320(2):146-155. • U.S. Census Bureau. "Age and Sex." American Community Survey, ACS 1-Year Estimates Subject Tables, Table S0101, 2022, https://data.census.gov/table/ACSST1Y2022.S0101?q=Age and Sex. • 4 out of 5 Medicare Advantage survey respondents indicated they would be more satisfied and likely to stay with their current plan if an early AFib detection program were offered to them at no cost. Market survey of 200 respondents currently enrolled in a Medicare Advantage plan. Data on file. iRhythm Technologies, Inc., 2022. • Nancy Ochieng, Jeannie Fuglesten Biniek, Meredith Freed, Anthony Damico, and Tricia Neuman. 2023. “Medicare Advantage in 2023: Enrollment Update and Key Trends.” Published August 09, 2023. https://www.kff.org/medicare/issue-brief/medicare-advantage-in-2023-enrollment-update-and-key-trends/# • American College of Cardiology. (2024, July 8). Almost Half of US Counties Have No Cardiologists Despite Higher Prevalence of CV Risk Factors, Mortality [Press Release]. https://www.acc.org/About-ACC/Press-Releases/2024/07/08/18/25/Almost-Half-of-US-Counties-Have-No-Cardiologists-Despite-Higher-Prevalence-of-CV-Risk-Factors-Mortality • Pallikadavath SP, et. al. High number of unnecessary referrals to cardiology clinics for benign palpitations due to poor adherence to local referral guidelines. European Journal of Arrhythmia & Electrophysiology. 2024;10(1):1-2 • Pallikadavath S, et. al. Palpitation referrals from primary care to a secondary care cardiology outpatient clinic: assessing adherence to guidelines, Family Practice, 2021;38(2):127–131. • Abbott AV. Diagnostic Approach to Palpitations. Am Fam Physician. 2005;71(4):743-750 • Weber BE, Kapoor WN. Evaluation and outcomes of patients with palpitations. Am J Med. 1996;100:138-48. • American College of Cardiology. (February 23, 2023). Five Things Physicians and Patients Should Question. https://www.acc.org/-/media/Non-Clinical/Files-PDFs-Excel-MS-Word-etc/2023/04/ACC-5-Things-List-2023.pdf • 2022 Survey of Physician Appointment Wait Times. Merritt Hawkins. https://www.merritthawkins.com/trends-and-insights/article/surveys/2022-physician-wait-times-survey/, |
| 35 © 2026 iRhythm Technologies, Inc. 35 SLIDE(S) SOURCES ‘Precise, proactive monitoring enables population health management…’ and ‘Next expansion opportunity: obstructive sleep apnea’ • Real World Evidence on Health Care Resource Utilization and Economic Burden of Arrhythmias in Patients with Diabetes and COPD. Abstract presented at: 2024 AHA Scientific Sessions; November 16 to 18, 2024; Chicago, IL. Sleep Apnea Market Sizing • Franklin, K. A., & Lindberg, E. (2015). Obstructive sleep apnea is a common disorder in the population—a review on the epidemiology of sleep apnea. Journal of thoracic disease, 7(8), 1311. doi: 10.3978/j.issn.2072-1439.2015.06.11 • Lyons, M. M., Bhatt, N. Y., Pack, A. I., & Magalang, U. J. (2020). Global burden of sleep‐disordered breathing and its implications. Respirology, 25(7), 690- 702. https://doi.org/10.1111/resp.13838 • Marshall, N. S., Wong, K. K., Liu, P. Y., Cullen, S. R., Knuiman, M. W., & Grunstein, R. R. (2008). Sleep apnea as an independent risk factor for all-cause mortality: the Busselton Health Study. Sleep, 31(8), 1079-1085. https://doi.org/10.5665/sleep/31.8.1079 • Sleep apnea information for clinicians. (2022, May 10). www.sleepapnea.org. https://www.sleepapnea.org/learn/sleep-apnea-information-clinicians Heart Failure Market Sizing • Atrial Fibrillation Fact Sheet. CDC, published May 15, 2024. https://www.cdc.gov/heart-disease/about/atrial-fibrillation.html • Dumitru, I. (2021, October 17). What is the mortality rate for heart failure? Latest Medical News, Clinical Trials, Guidelines - Today on Medscape. https://www.medscape.com/answers/163062-86190/what-is-the-mortality-rate-for-heart-failure • Gidding, S. S., Lloyd-Jones, D., Lima, J., Ambale-Venkatesh, B., Shah, S. J., Shah, R., Lewis, C. E., Jacobs, D. R., & Allen, N. B. Prevalence of American Heart Association heart failure stages in black and white young and middle-aged adults. Circulation: Heart Failure, 2019; 12(9). • Heart failure Fact Sheet. CDC, published May 15, 2024. Accessed January 12, 2025. https://www.cdc.gov/heart-disease/about/heart-failure.html • Ritchey, M. D., Wall, H. K., George, M. G., & Wright, J. S. US trends in premature heart disease mortality over the past 50 years: Where do we go from here? Trends in Cardiovascular Medicine. 2020; 30(6), 364-374. • Gianluigi Savarese, Lars H Lund, Global Public Health Burden of Heart Failure, Cardiac Failure Review 2017;3(1):7–11. Additional Disease State Market Sizing • Hilas O. COPD Prevalence, Risks, and Mortality. US Pharm. 2024;49(7):14. • Cardiovascular Disease Fact Sheet. CDC, published June 3, 2024. https://www.cdc.gov/cdi/indicator-definitions/cardiovascular-disease.html • Chronic Kidney Disease in the United States, 2023. CDC, published May 15, 2024. https://www.cdc.gov/kidney-disease/php/data-research/index.html • National Diabetes Statistics Report. CDC, published May 15, 2024. Accessed January 12, 2025. https://www.cdc.gov/diabetes/php/data-research/index.html • Real World Evidence on Health Care Resource Utilization and Economic Burden of Arrhythmias in Patients with Diabetes and COPD. Abstract presented at: 2024 AHA Scientific Sessions; November 16 to 18, 2024; Chicago, IL. ‘Comprehensive evidence generation supportive of clinical use cases’ • Reynolds et al. Comparative effectiveness and healthcare utilization for ambulatory cardiac monitoring strategies in Medicare beneficiaries. Am Heart J. 2024;269:25-34. • Russo et al. Assessment of variation in ambulatory cardiac monitoring among commercially insured patients. Am J Manag Care. August 13, 2025. • Real World Evidence on Health Care Resource Utilization and Economic Burden of Arrhythmias in Patients with Diabetes and COPD. Abstract presented at: 2024 AHA Scientific Sessions; November 16 to 18, 2024; Chicago, IL. |