Exhibit 99.(C)(11)
Preliminary Draft – Confidential Discussion Materials Regarding Project Thunder March 7, 2022
[***] = Certain information has been excluded from this exhibit because it is both not material and would likely
cause harm to the company if publicly disclosed.
Preliminary Draft – Confidential These materials have been prepared by Evercore Group L.L.C. (“Evercore”) for the Conflicts Committee (the “Conflicts Committee”) of the Board of Directors of Blueknight Energy Partners G.P., LLC, the general partner of Blueknight Energy Partners, L.P. (the “Partnership”), to whom such materials are directly addressed and delivered and may not be used or relied upon for any purpose other than as specifically contemplated by a written agreement with Evercore. These materials are based on information provided by or on behalf of the Conflicts Committee, from public sources or otherwise reviewed by Evercore. Evercore assumes no responsibility for independent investigation or verification of such information and has relied on such information being complete and accurate in all material respects. To the extent such information includes estimates and forecasts of future financial performance prepared by or reviewed with the management of the Partnership and/or other potential transaction participants or obtained from public sources, Evercore has assumed that such estimates and forecasts have been reasonably prepared on bases reflecting the best currently available estimates and judgments of such management (or, with respect to estimates and forecasts obtained from public sources, represent reasonable estimates). No representation or warranty, express or implied, is made as to the accuracy or completeness of such information and nothing contained herein is, or shall be relied upon as, a representation, whether as to the past, the present or the future. These materials were designed for use by specific persons familiar with the business and affairs of the Partnership. These materials are not intended to provide the sole basis for evaluating, and should not be considered a recommendation with respect to, any transaction or other matter. These materials have been developed by and are proprietary to Evercore and were prepared exclusively for the benefit and internal use of the Conflicts Committee. These materials were compiled on a confidential basis for use by the Conflicts Committee and not with a view to public disclosure or filing thereof under state or federal securities laws, and may not be reproduced, disseminated, quoted or referred to, in whole or in part, without the prior written consent of Evercore. These materials do not constitute an offer or solicitation to sell or purchase any securities and are not a commitment by Evercore or any of its affiliates to provide or arrange any financing for any transaction or to purchase any security in connection therewith. Evercore assumes no obligation to update or otherwise revise these materials. These materials may not reflect information known to other professionals in other business areas of Evercore and its affiliates. Evercore and its affiliates do not provide legal, accounting or tax advice. Accordingly, any statements contained herein as to tax matters were neither written nor intended by Evercore or its affiliates to be used and cannot be used by any taxpayer for the purpose of avoiding tax penalties that may be imposed on such taxpayer. Each person should seek legal, accounting and tax advice based on his, her or its particular circumstances from independent advisors regarding the impact of the transactions or matters described herein.
[***] = Certain information has been excluded from this exhibit because it is both not material and would likely
cause harm to the company if publicly disclosed.
Preliminary Draft – Confidential Project Thunder Discussion Materials Overview Ergon / Jefferies Assertion Commentary ï® Management has indicated it believes future recontracting rate increases are achievable due to stronger customer demand given likely infrastructure spending, a shifting customer mix focused on refiners 1 (who are 1 Asphalt Marketers are Facing Material generally less price sensitive) and increased inflation in the near/medium-term Headwinds ï® Multi-year contracts have CPI escalators and recontracting negotiations focus on the most recently contracted —2.5% perpetuity is aggressive rate ï® See page 2 for historical CPI/PPI and averages over time and current outlook on Asphalt market Conflicts Committee is Not Using ï® We are currently utilizing revised projections as provided by management provided on March 5, 2022 Management Projects as Approved by ï® When utilizing a discounted distribution method, with a 4.5%—6.5% terminal yield and a 9.0% – 11.0% equity the Board cost of capital, we arrived at a range of $3.78 to $5.47 per unit assuming management projections excluding —Projections are optimistic growth projects and 1.3x total coverage—Ergon is expected to pay for debt ï® Adding incremental debt to finance accretive growth should benefit all unitholders assuming leverage levels capacity are appropriate and 3.5x is a reasonable long-term leverage target ï® Evercore’s perpetuity growth methodology is appropriate to determine an intrinsic value of the partnership (vs. Conflicts Committee Model has Several a sale of the business) Omissions and Calculation Errors that ï® We acknowledge all the differences in valuation methodologies noted by Jefferies. See pages 4 – 5 Overstate Value ïµ After speaking with management, we will add back 2026E growth capital expenditures in Evercore’s DCF —Lack of growth capex in 2026E analysis—Perpetuity growth methodology ï® Additional sensitivities with respect to the Discounted Cash Flow Analysis are provided on page 5 Strong Market Precedent Highlights ï® See pages 6 – 8 for support in higher premiums. All-cash transactions should be the focus when looking at Attractive Premium Offered by Ergon historical premiums and certain precedents do support the higher premium requested by the BKEP Conflicts —Premium proposed by Conflicts Committee Committee is unrealisticï® The midstream and energy sectors have traded up since Ergon’s initial offer (7.5% for Alerian MLP Index1) Conflicts Committee Value Expectation Does Not Align with Historical ï® To discuss Conversations of Unit Value Transferring Value from Preferred to ï® To discuss Common Does Not Make Sense No Rationale for Keeping ï® To discuss an Inefficient Micro-Cap Public 1. Historical data from Alerian website as of 2/28/22 1
[***] = Certain information has been excluded from this exhibit because it is both not material and would likely
cause harm to the company if publicly disclosed.
Preliminary Draft – Confidential Project Thunder Discussion Materials Perspectives on Recontracting ï® Ergon / Jefferies assertion: “The Conflicts Committee’s model forecasts growth from the infrastructure bill (a bill that still hasn’t been funded) and then assumes continued lease and throughput hikes at a 2.5% clip in perpetuity, which is not close to market.” ï® Response: 1 1 ï,„ Inflation has averaged 2.4% (CPI) / 4.7% (PPI) over the last five years. BKEP’s contracts include a CPI escalator that is based on a trailing 12-month average of CPI less energy; many contracts this past year have increased more than 2.4%ï,„ Management has indicated it believes future recontracting rate increases are achievable due to stronger customer demand given likely infrastructure spending, a shifting customer mix focused on refiners (who are generally less price sensitive) and increased inflation in the near/medium-termï,„ Multi-year contracts have CPI escalators and recontracting negotiations focus on the most recently contracted rate Rolling 12 Month Inflation1 (CPI2 and PPI) Historical Averages1 CPI² PPI 25% 5-year Average 2.4% 4.7% 20% 19% 10-year Average 2.1% 1.6% 25-year Average 2.1% 2.6% 15% 50-year Average 3.9% 3.8% 10% “[The Bipartisan Infrastructure Law] is going to transform America and 5% 6% put us on the path to win the economic competition of the 21st Century that we face with the rest of —% the world… (5%) 4,000 projects have already been announced… And tonight I’m announcing that this year we will (10%) start fixing over 65,000 miles of 2/1/12 2/1/14 2/1/16 2/1/18 2/1/20 2/1/22 highway and 1,500 bridges in CPI PPI disrepair” Joe Biden, State of the Source: FRED website as of 2/15/22. US Bureau of Labor Statistics Union Speech 1. Calculated as the rolling 12-month inflation rate 2. Represents CPI less energy 2
[***] = Certain information has been excluded from this exhibit because it is both not material and would likely
cause harm to the company if publicly disclosed.
Preliminary Draft – Confidential Project Thunder Discussion Materials Comparison of Management’s Financial Projections Summary Results October 2021 Board Meeting February 2022 Board Meeting Variance 2022 2023 2024 2025 2026 2022 2023 2024 2025 2026 2022 2023 2024 2025 2026 EBITDA Base EBITDA $52.7 $54.3 $56.0 $57.8 $59.5 $52.7 $52.8 $54.1 $55.7 $58.3 $0.1 ($1.6) ($1.9) ($2.0) ($1.2) Updated Base EBITDA (Base + Reading + [***] ) 53.2 54.7 56.2 58.2 60.9 Stage 2 EBITDA¹ 4.8 11.8 12.2 12.7 13.1 1.9 10.0 12.4 12.9 13.3 (2.9) (1.8) 0.2 0.2 0.1 Stage 2+ EBITDA — 8.8 15.2 20.2 25.3 — 8.8 15.2 20.2 25.3 -————- Total $57.4 $75.0 $83.4 $90.6 $98.0 $54.6 $71.6 $81.7 $88.8 $96.9 ($2.8) ($3.3) ($1.7) ($1.8) ($1.1) Growth Capital Stage 2 Growth Capital¹ 84.7 -———- 74.1 12.6 -——- (10.6) 12.6 -——- Stage 2+ Growth Capital — 100.0 50.0 50.0 50.0 — 100.0 50.0 50.0 50.0 -————- Total $84.7 $100.0 $50.0 $50.0 $50.0 $74.1 $112.6 $50.0 $50.0 $50.0 ($10.6) $12.6 $— $— $— Source: BKEP management as of 3/5/22 1. Inclusive of Reading and [***] Stage 2 growth projects for comparability purposes 3
[***] = Certain information has been excluded from this exhibit because it is both not material and would likely
cause harm to the company if publicly disclosed.
Preliminary Draft – Confidential Project Thunder Discussion Materials ($ in millions, except per unit amounts) Discounted Cash Flow Analysis – BKEP Financial Projections (Stage 2+) Summary Results (February 2022 Board Meeting Projections) For Years Ending December 31, EBITDA Perpetuity 2022E 2023E 2024E 2025E 2026E Multiple Growth Adjusted EBITDA $55 $72 $82 $89 $97 $97 $97 Less: Tax Depreciation and Amortization¹ (655) (120) (59) (48) (39) (11) EBIT ($601) ($49) $23 $40 $58 $86 Less: Taxes² -—- (1) (2) (4) (32) EBIAT ($601) ($49) $21 $38 $54 $54 Plus: Tax Depreciation and Amortization 655 120 59 48 39 11 Less: Growth Capital Expenditures (74) (113) (50) (50) (50) —Less: Maintenance Capital Expenditures (6) (8) (9) (10) (11) (11) Plus: Asset Sales / (Acquisitions) 1 0 -———- Unlevered Free Cash Flow ($25) ($49) $21 $27 $32 $54 EBITDA Multiple / Perpetuity Growth Rate 9.5x 2.5% Implied Terminal Value $920 $837 PV of Terminal Value @ 9.0% Discount Rate $598 $568 Plus: PV of Unlevered Free Cash Flow @ 9.0% Discount Rate (8) Implied Enterprise Value $590 – $560 Less: Market Value Preferred Equity as of October 8, 2021³ (291) Less: Projected Net Debt as of December 31, 2021E (100) Implied Equity Value $200 – $170 BKEP LP Units Outstandingâ´ 44 Implied BKEP Unit Value $4.57 – $3.88 Midpoint: $4.23 Note: Projections provided by BKEP management as of 3/5/22 1. 2022E tax DD&A assumes 100.0% bonus depreciation calculated as the midpoint of the enterprise value range plus 2022E capital expenditures; 2023E and 2024E tax DD&A assumes 100.0% bonus depreciation on capital expenditures; bonus depreciation phase-down on growth capital expenditures in 2025E (80.0%) and 2026E (60.0%) 2. Assumes unitholder effective tax rate of 29.6% (80% of 37% tax rate) through 2025E and 37.0% thereafter for Partnerships 3. Includes 1.6% general partner interest 4. Includes 1.6% general partner interest and effect of dilutive securities including phantom units and RSUs 4
[***] = Certain information has been excluded from this exhibit because it is both not material and would likely
cause harm to the company if publicly disclosed.
Preliminary Draft – Confidential Project Thunder Discussion Materials Discounted Cash Flow Analysis Sensitivity – BKEP Financial Projections (Stage 2+) 9.0x Acquisition Multiple 9.0x Acquisition Multiple | $0.0 Million Perpetuity Growth Capex $0.0 Million Perpetuity Growth Capex1 WACC Vs. Exit Multiple WACC Vs. Perpetuity Growth Rate WACC Vs. Perpetuity Growth Rate WACC Terminal Exit Multiple WACC Perpetuity Growth Rate WACC Perpetuity Growth Rate 7.5x 8.5x 9.5x 10.5x 11.5x 0.50% 1.50% 2.50% 3.50% 4.50% 0.50% 1.50% 2.50% 3.50% 4.50% 8.0% $2.23 $3.74 $5.25 $6.75 $8.26 8.0% $2.65 $4.46 $6.92 $10.47 $16.05 8.0% $2.65 $4.46 $6.92 $10.47 $16.05 8.5% 1.96 3.43 4.91 6.38 7.85 8.5% 1.68 3.22 5.27 8.14 12.44 8.5% 1.68 3.22 5.27 8.14 12.44 9.0% 1.69 3.13 4.57 6.01 7.45 9.0% 0.82 2.15 3.88 6.24 9.65 9.0% 0.82 2.15 3.88 6.24 9.65 9.5% 1.44 2.84 4.25 5.66 7.06 9.5% 0.07 1.21 2.69 4.66 7.41 9.5% 0.07 1.21 2.69 4.66 7.41 10.0% 1.18 2.56 3.94 5.31 6.69 10.0% (0.61) 0.40 1.67 3.33 5.59 10.0% (0.61) 0.40 1.67 3.33 5.59 8.0x Acquisition Multiple | $0.0 Million Perpetuity Growth Capex $3.5 Million Perpetuity Growth Capex1 WACC Vs. Exit Multiple WACC Vs. Perpetuity Growth Rate WACC Vs. Perpetuity Growth Rate WACC Terminal Exit Multiple WACC Perpetuity Growth Rate WACC Perpetuity Growth Rate 7.5x 8.5x 9.5x 10.5x 11.5x 0.50% 1.50% 2.50% 3.50% 4.50% 0.50% 1.50% 2.50% 3.50% 4.50% 8.0% $2.73 $4.24 $5.75 $7.26 $8.76 8.0% $3.15 $4.96 $7.42 $10.97 $16.56 8.0% $1.90 $3.59 $5.89 $9.21 $14.44 8.5% 2.46 3.93 5.40 6.88 8.35 8.5% 2.18 3.71 5.76 8.64 12.94 8.5% 0.99 2.42 4.34 7.03 11.06 9.0% 2.19 3.62 5.06 6.50 7.94 9.0% 1.31 2.64 4.37 6.73 10.14 9.0% 0.18 1.42 3.04 5.25 8.44 9.5% 1.92 3.33 4.74 6.14 7.55 9.5% 0.55 1.70 3.18 5.14 7.90 9.5% (0.52) 0.55 1.93 3.77 6.35 10.0% 1.66 3.04 4.42 5.79 7.17 10.0% (0.13) 0.88 2.15 3.81 6.07 10.0% (1.16) (0.22) 0.97 2.53 4.64 7.0x Acquisition Multiple | $0.0 Million Perpetuity Growth Capex $7.0 Million Perpetuity Growth Capex1 WACC Vs. Exit Multiple WACC Vs. Perpetuity Growth Rate WACC Vs. Perpetuity Growth Rate WACC Terminal Exit Multiple WACC Perpetuity Growth Rate WACC Perpetuity Growth Rate 7.5x 8.5x 9.5x 10.5x 11.5x 0.50% 1.50% 2.50% 3.50% 4.50% 0.50% 1.50% 2.50% 3.50% 4.50% 8.0% $3.24 $4.75 $6.25 $7.76 $9.27 8.0% $3.66 $5.46 $7.92 $11.47 $17.06 8.0% $1.14 $2.71 $4.86 $7.95 $12.82 8.5% 2.95 4.43 5.90 7.37 8.85 8.5% 2.67 4.21 6.26 9.13 13.44 8.5% 0.29 1.63 3.42 5.92 9.67 9.0% 2.68 4.12 5.56 6.99 8.43 9.0% 1.81 3.13 4.86 7.22 10.63 9.0% (0.45) 0.70 2.21 4.26 7.23 9.5% 2.41 3.81 5.22 6.63 8.03 9.5% 1.04 2.19 3.66 5.63 8.38 9.5% (1.12) (0.12) 1.17 2.89 5.29 10.0% 2.14 3.52 4.89 6.27 7.65 10.0% 0.35 1.36 2.63 4.29 6.55 10.0% (1.70) (0.83) 0.28 1.72 3.70 1. Perpetuity Growth Capex is defined as capital expenditures included in calculation of terminal value 5
[***] = Certain information has been excluded from this exhibit because it is both not material and would likely
cause harm to the company if publicly disclosed.
Preliminary Draft – Confidential Project Thunder Discussion Materials Historical Take-Private Transactions – All Cash Consideration Premium1 Date 1-Day 30-Day 60-Day Announced Acquiror / Target Consideration Prior Spot VWAP Aug-21 Landmark Dividend / Landmark Infrastructure Partners LP Cash-for-Unit 38.4% 35.6% 32.6% Dec-19 Blackstone Infrastructure Partners / Tallgrass Energy LP Cash-for-Unit 56.4% 22.7% 13.7% Oct-19 Brookfield Business Partners L.P. / Teekay Offshore Partners L.P. Cash-for-Unit 28.1% 9.8% 20.6% May-19 IFM Investors / Buckeye Partners, L.P. Cash-for-Unit 27.5% 22.9% 23.9% Mar-19 ArcLight Energy Partners Fund V, L.P. / American Midstream, LP² Cash-for-Unit 66.7% 22.5% 5.0% Nov-18 ArcLight Energy Partners Fund VI, L.P. / TransMontaigne Partners L.P. Cash-for-Unit 12.6% 8.6% 8.2% Oct-18 Valero Energy Corporation / Valero Energy Partners LP Cash-for-Unit 6.0% 11.9% 10.9% Min 6.0% 8.6% 5.0% Median 28.1% 22.5% 13.7% Mean 33.7% 19.1% 16.4% Max 66.7% 35.6% 32.6% Implied Premiums for Take-Private of Blueknight Proposed Consideration per Common Unit $4.00 $4.25 $4.50 $4.75 $5.00 $5.15 Implied Premium to October 8, 2021 Closing Price 30.3% 38.4% 46.6% 54.7% 62.9% 67.8% Implied Premium to March 4, 2022 Closing Price 20.5% 28.0% 35.5% 43.1% 50.6% 55.1% Source: Bloomberg, FactSet, Public filings 1. VWAP premiums paid are calculated by dividing the value of the offer, defined as the exchange ratio multiplied by the closing price of the acquiror’s shares / units on the last trading day prior to announcement plus any cash received, by the 30-, 60- or 90-trading day VWAP of the target as calculated from the last undisturbed trading day prior to the announcement 2. Calculated as of the revised unaffected date of 1/3/19 6
[***] = Certain information has been excluded from this exhibit because it is both not material and would likely
cause harm to the company if publicly disclosed.
Preliminary Draft – Confidential Project Thunder Discussion Materials Case Study: American Midstream 
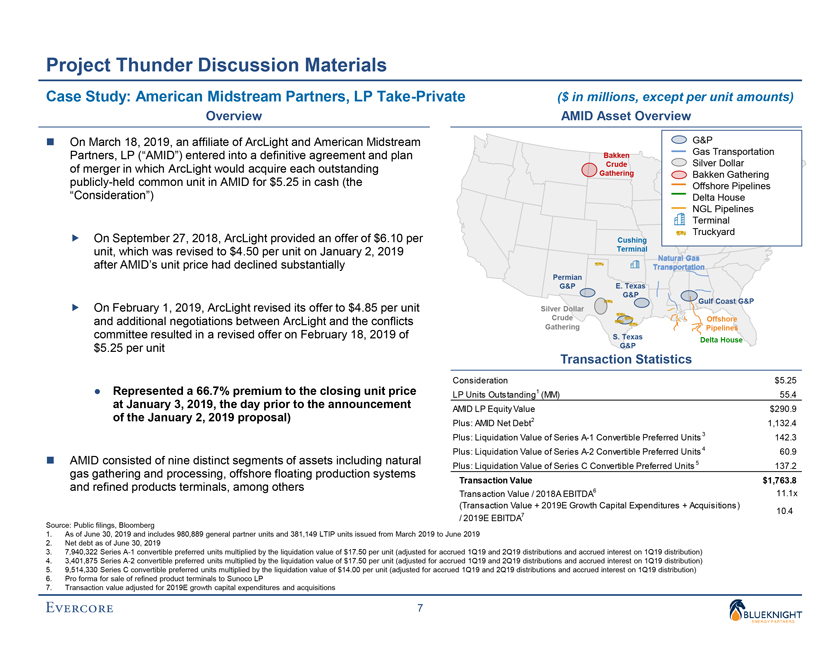
Partners, LP Take-Private ($ in millions, except per unit amounts) Overview AMID Asset Overview ï® On March 18, 2019, an affiliate of ArcLight and American Midstream G&P Partners, LP (“AMID”) entered into a definitive agreement and plan Bakken Gas Transportation Crude Silver Dollar of merger in which ArcLight would acquire each outstanding Gathering Bakken Gathering publicly-held common unit in AMID for $5.25 in cash (the Offshore Pipelines 
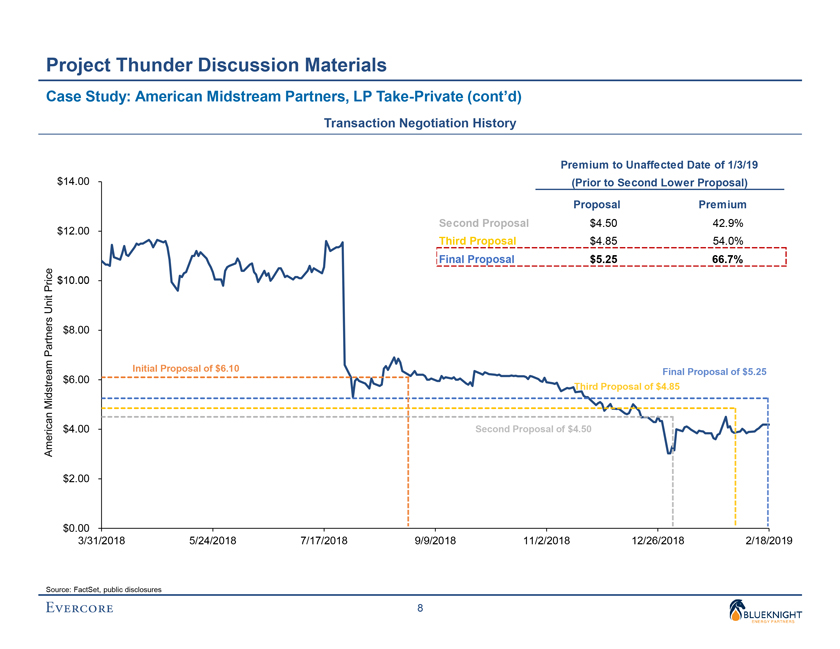
“Consideration”) Delta House NGL Pipelines Terminal Truckyard ï,„ On September 27, 2018, ArcLight provided an offer of $6.10 per Cushing unit, which was revised to $4.50 per unit on January 2, 2019 Terminal Natural Gas after AMID’s unit price had declined substantially Transportation io Permian G&P E. Texas G&P Gulf Coast G&P ï,„ On February 1, 2019, ArcLight revised its offer to $4.85 per unit Silver Dollar and additional negotiations between ArcLight and the conflicts Crude Offshore Gathering Pipelines committee resulted in a revised offer on February 18, 2019 of S. Texas Delta House $5.25 per unit G&P Transaction Statistics Consideration $5.25 • Represented a 66.7% premium to the closing unit price LP Units Outstanding1 (MM) 55.4 at January 3, 2019, the day prior to the announcement AMID LP Equity Value $290.9 of the January 2, 2019 proposal) 2 Plus: AMID Net Debt 1,132.4 Plus: Liquidation Value of Series A-1 Convertible Preferred Units 3 142.3 Plus: Liquidation Value of Series A-2 Convertible Preferred Units 4 60.9 ï® AMID consisted of nine distinct segments of assets including natural 5 Plus: Liquidation Value of Series C Convertible Preferred Units 137.2 gas gathering and processing, offshore floating production systems Transaction Value $1,763.8 and refined products terminals, among others 6 Transaction Value / 2018A EBITDA 11.1x (Transaction Value + 2019E Growth Capital Expenditures + Acquisitions) 10.4 / 2019E EBITDA7 Source: Public filings, Bloomberg 1. As of June 30, 2019 and includes 980,889 general partner units and 381,149 LTIP units issued from March 2019 to June 2019 2. Net debt as of June 30, 2019 3. 7,940,322 Series A-1 convertible preferred units multiplied by the liquidation value of $17.50 per unit (adjusted for accrued 1Q19 and 2Q19 distributions and accrued interest on 1Q19 distribution) 4. 3,401,875 Series A-2 convertible preferred units multiplied by the liquidation value of $17.50 per unit (adjusted for accrued 1Q19 and 2Q19 distributions and accrued interest on 1Q19 distribution) 5. 9,514,330 Series C convertible preferred units multiplied by the liquidation value of $14.00 per unit (adjusted for accrued 1Q19 and 2Q19 distributions and accrued interest on 1Q19 distribution) 6. Pro forma for sale of refined product terminals to Sunoco LP 7. Transaction value adjusted for 2019E growth capital expenditures and acquisitions 7
[***] = Certain information has been excluded from this exhibit because it is both not material and would likely
cause harm to the company if publicly disclosed.
Preliminary Draft – Confidential Project Thunder Discussion Materials Case Study: American Midstream Partners, LP Take-Private (cont’d) Transaction Negotiation History Premium to Unaffected Date of 1/3/19 $14.00 (Prior to Second Lower Proposal) Proposal Premium Second Proposal $4.50 42.9% $12.00 Third Proposal $4.85 54.0% Final Proposal $5.25 66.7% c e i r $10.00 P Unit artners $8.00 P m Initial Proposal of $6.10 ea Final Proposal of $5.25 $6.00 Midstr Third Proposal of $4.85 erican $4.00 Second Proposal of $4.50 A m $2.00 $0.00 3/31/2018 5/24/2018 7/17/2018 9/9/2018 11/2/2018 12/26/2018 2/18/2019 Source: FactSet, public disclosures 8
[***] = Certain information has been excluded from this exhibit because it is both not material and would likely
cause harm to the company if publicly disclosed.