Exhibit (c)(16) CONFIDENTIAL Ergon, Inc. Discussion Materials October 2021 / Confidential Jefferies LLC Member SIPC
Table of Contents MLP Market Overview 1 Merle Trading Performance Update 5 Merle Summary Financial Projections 10 Illustrative Take-Private Analysis 13 Select MLP Take-Private Transactions 18 Jefferies LLC / October 2021 i
MLP Market Overview Jefferies LLC / October 2021 1
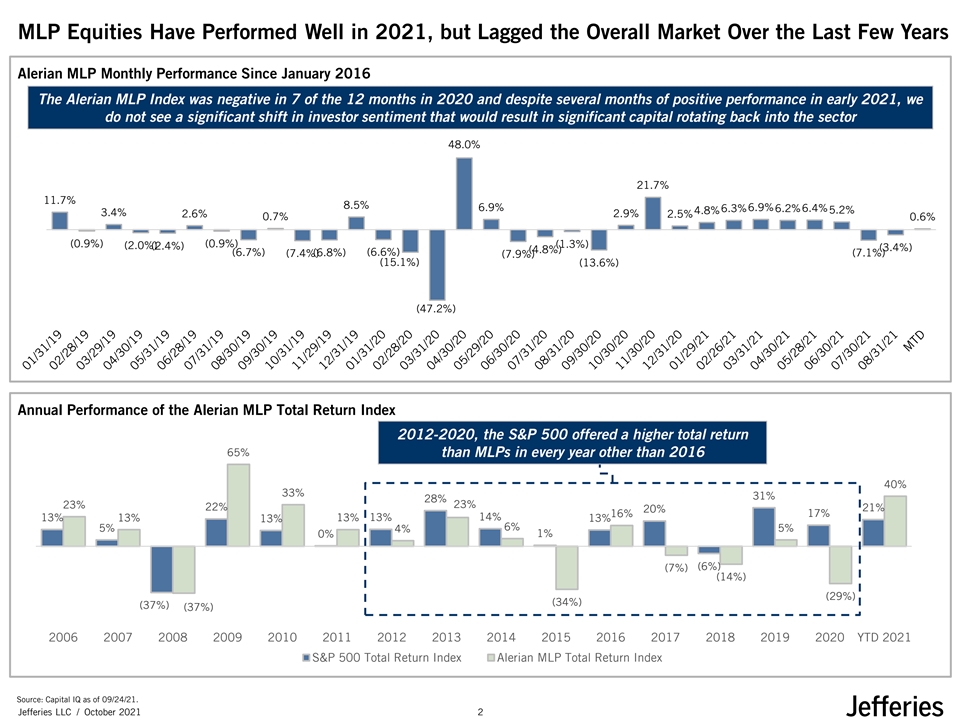
MLP Equities Have Performed Well in 2021, but Lagged the Overall Market Over the Last Few Years Alerian MLP Monthly Performance Since January 2016 The Alerian MLP Index was negative in 7 of the 12 months in 2020 and despite several months of positive performance in early 2021, we do not see a significant shift in investor sentiment that would result in significant capital rotating back into the sector 48.0% 21.7% 11.7% 8.5% 6.9% 6.3% 6.9% 6.2% 6.4% 5.2% 4.8% 3.4% 2.6% 2.9% 2.5% 0.7% 0.6% (0.9%) (0.9%) (1.3%) (2.0%()2.4%) (3.4%) (4.8%) (6.7%) (6.8%) (6.6%) (7.4%) (7.1%) (7.9%) (15.1%) (13.6%) (47.2%) Annual Performance of the Alerian MLP Total Return Index 2012-2020, the S&P 500 offered a higher total return 65% than MLPs in every year other than 2016 40% 33% 31% 28% 23% 23% 22% 21% 20% 16% 17% 14% 13% 13% 13% 13% 13% 13% 6% 5% 5% 4% 0% 1% (6%) (7%) (14%) (29%) (34%) (37%) (37%) 2006 2007 2008 2009 2010 2011 2012 2013 2014 2015 2016 2017 2018 2019 2020 YTD 2021 S&P 500 Total Return Index Alerian MLP Total Return Index Source: Capital IQ as of 09/24/21. Jefferies LLC / October 2021 2
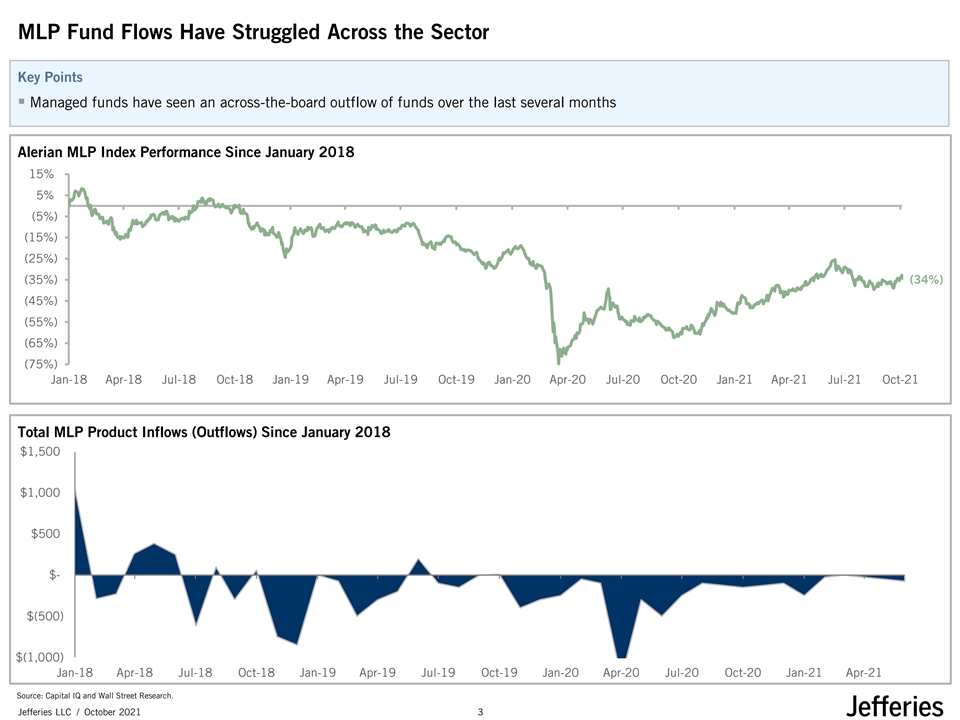
MLP Fund Flows Have Struggled Across the Sector Key Points ▪ Managed funds have seen an across-the-board outflow of funds over the last several months Alerian MLP Index Performance Since January 2018 15% 5% (5%) (15%) (25%) (35%) (34%) (45%) (55%) (65%) (75%) Jan-18 Apr-18 Jul-18 Oct-18 Jan-19 Apr-19 Jul-19 Oct-19 Jan-20 Apr-20 Jul-20 Oct-20 Jan-21 Apr-21 Jul-21 Oct-21 Total MLP Product Inflows (Outflows) Since January 2018 $1,500 $1,000 $500 $- $(500) $(1,000) Jan-18 Apr-18 Jul-18 Oct-18 Jan-19 Apr-19 Jul-19 Oct-19 Jan-20 Apr-20 Jul-20 Oct-20 Jan-21 Apr-21 Source: Capital IQ and Wall Street Research. Jefferies LLC / October 2021 3
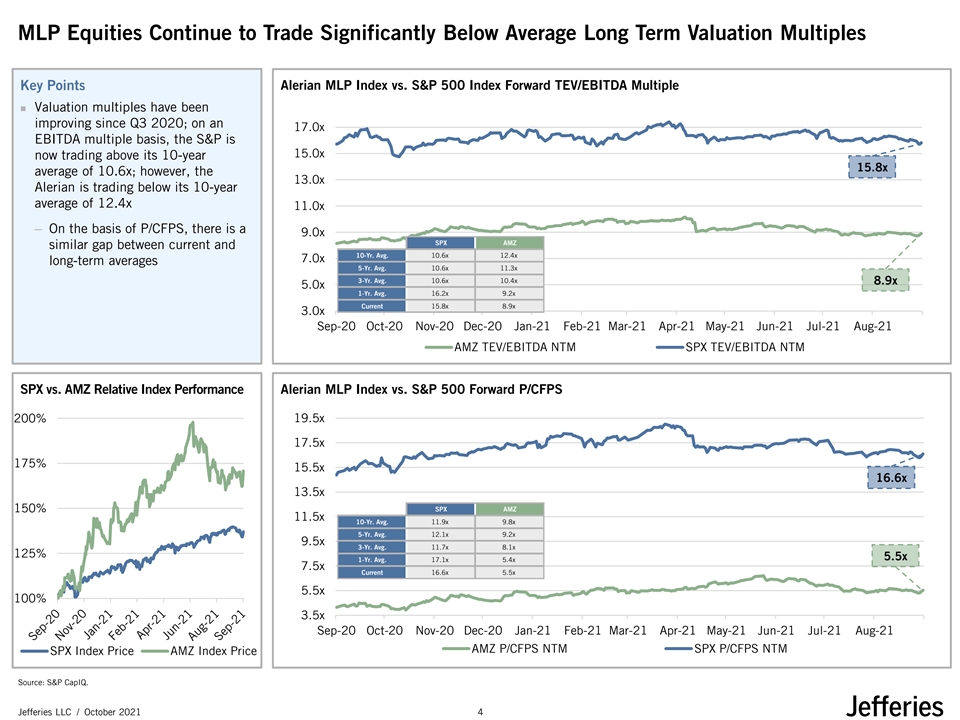
MLP Equities Continue to Trade Significantly Below Average Long Term Valuation Multiples Key Points Alerian MLP Index vs. S&P 500 Index Forward TEV/EBITDA Multiple ◼ Valuation multiples have been improving since Q3 2020; on an 17.0x EBITDA multiple basis, the S&P is 15.0x now trading above its 10-year 15.8x average of 10.6x; however, the 13.0x Alerian is trading below its 10-year average of 12.4x 11.0x ─ On the basis of P/CFPS, there is a 9.0x SPX AMZ similar gap between current and 10-Yr. Avg. 10.6x 12.4x 7.0x long-term averages 5-Yr. Avg. 10.6x 11.3x 3-Yr. Avg. 10.6x 10.4x 8.9x 5.0x 1-Yr. Avg. 16.2x 9.2x Current 15.8x 8.9x 3.0x Sep-20 Oct-20 Nov-20 Dec-20 Jan-21 Feb-21 Mar-21 Apr-21 May-21 Jun-21 Jul-21 Aug-21 AMZ TEV/EBITDA NTM SPX TEV/EBITDA NTM SPX vs. AMZ Relative Index Performance Alerian MLP Index vs. S&P 500 Forward P/CFPS 200% 19.5x 17.5x 175% 15.5x 16.6x 13.5x 150% SPX AMZ 11.5x 10-Yr. Avg. 11.9x 9.8x 5-Yr. Avg. 12.1x 9.2x 9.5x 3-Yr. Avg. 11.7x 8.1x 125% 5.5x 1-Yr. Avg. 17.1x 5.4x 7.5x Current 16.6x 5.5x 5.5x 100% 3.5x Sep-20 Oct-20 Nov-20 Dec-20 Jan-21 Feb-21 Mar-21 Apr-21 May-21 Jun-21 Jul-21 Aug-21 AMZ P/CFPS NTM SPX P/CFPS NTM SPX Index Price AMZ Index Price Source: S&P CapIQ. Jefferies LLC / October 2021 4
Merle Trading Performance Update Jefferies LLC / October 2021 5
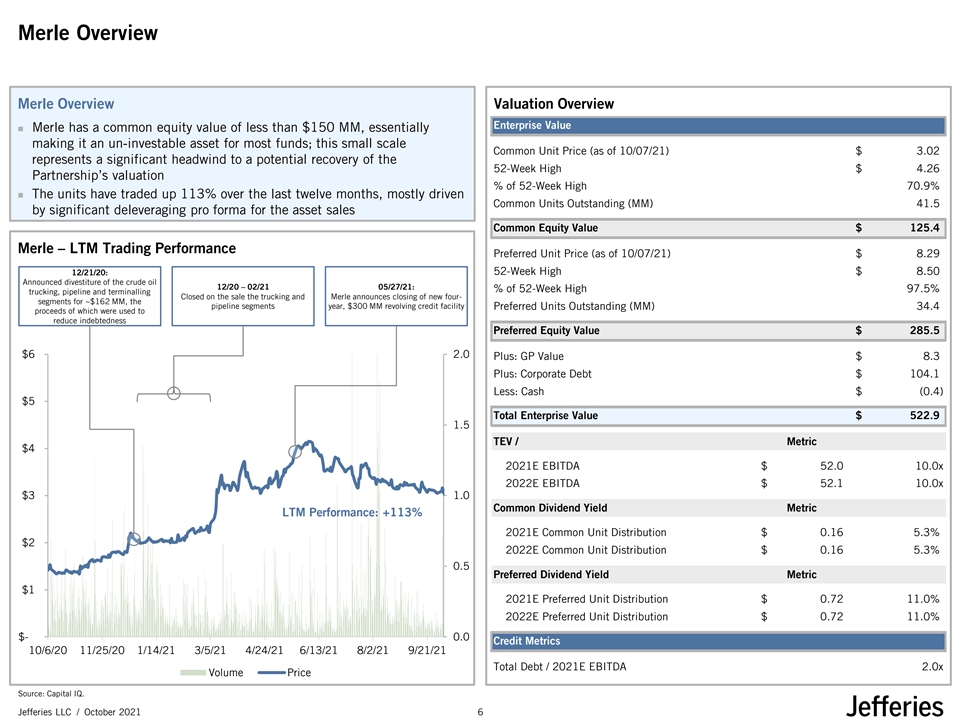
Merle Overview Merle Overview Valuation Overview Enterprise Value ◼ Merle has a common equity value of less than $150 MM, essentially making it an un-investable asset for most funds; this small scale Common Unit Price (as of 10/07/21) $ 3.02 represents a significant headwind to a potential recovery of the 52-Week High $ 4.26 Partnership’s valuation % of 52-Week High 70.9% ◼ The units have traded up 113% over the last twelve months, mostly driven Common Units Outstanding (MM) 41.5 by significant deleveraging pro forma for the asset sales Common Equity Value $ 125.4 Merle – LTM Trading Performance Preferred Unit Price (as of 10/07/21) $ 8.29 52-Week High $ 8.50 12/21/20: Announced divestiture of the crude oil 12/20 – 02/21 05/27/21: % of 52-Week High 97.5% trucking, pipeline and terminalling Closed on the sale the trucking and Merle announces closing of new four- segments for ~$162 MM, the pipeline segments year, $300 MM revolving credit facility Preferred Units Outstanding (MM) 34.4 proceeds of which were used to reduce indebtedness Preferred Equity Value $ 285.5 $6 2.0 Plus: GP Value $ 8.3 Plus: Corporate Debt $ 104.1 Less: Cash $ (0.4) $5 Total Enterprise Value $ 522.9 1.5 TEV / Metric $4 2021E EBITDA $ 52.0 10.0x 2022E EBITDA $ 52.1 10.0x $3 1.0 Common Dividend Yield Metric LTM Performance: +113% 2021E Common Unit Distribution $ 0.16 5.3% $2 2022E Common Unit Distribution $ 0.16 5.3% 0.5 Preferred Dividend Yield Metric $1 2021E Preferred Unit Distribution $ 0.72 11.0% 2022E Preferred Unit Distribution $ 0.72 11.0% $- 0.0 Credit Metrics 10/6/20 11/25/20 1/14/21 3/5/21 4/24/21 6/13/21 8/2/21 9/21/21 Total Debt / 2021E EBITDA 2.0x Volume Price Source: Capital IQ. Jefferies LLC / October 2021 6
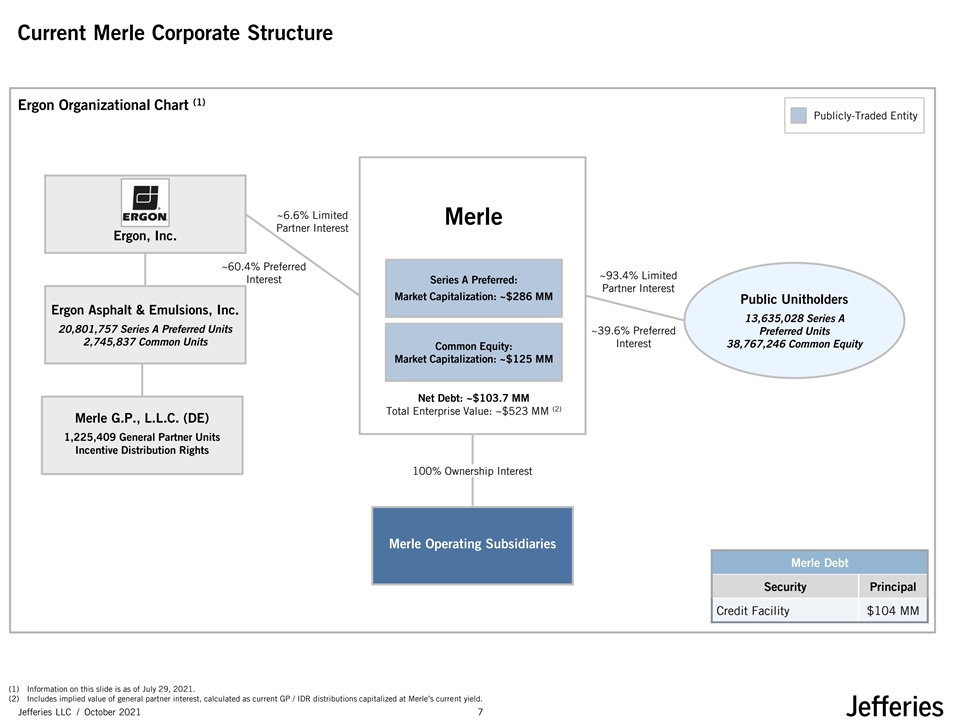
Current Merle Corporate Structure (1) Ergon Organizational Chart Publicly-Traded Entity ~6.6% Limited Merle Partner Interest Ergon, Inc. ~60.4% Preferred ~93.4% Limited Interest Series A Preferred: Partner Interest Market Capitalization: ~$286 MM Public Unitholders Ergon Asphalt & Emulsions, Inc. 13,635,028 Series A 20,801,757 Series A Preferred Units ~39.6% Preferred Preferred Units 2,745,837 Common Units Interest 38,767,246 Common Equity Common Equity: Market Capitalization: ~$125 MM Net Debt: ~$103.7 MM (2) Total Enterprise Value: ~$523 MM Merle G.P., L.L.C. (DE) 1,225,409 General Partner Units Incentive Distribution Rights 100% Ownership Interest Merle Operating Subsidiaries Merle Debt Security Principal Credit Facility $104 MM (1) Information on this slide is as of July 29, 2021. (2) Includes implied value of general partner interest, calculated as current GP / IDR distributions capitalized at Merle’s current yield. Jefferies LLC / October 2021 7
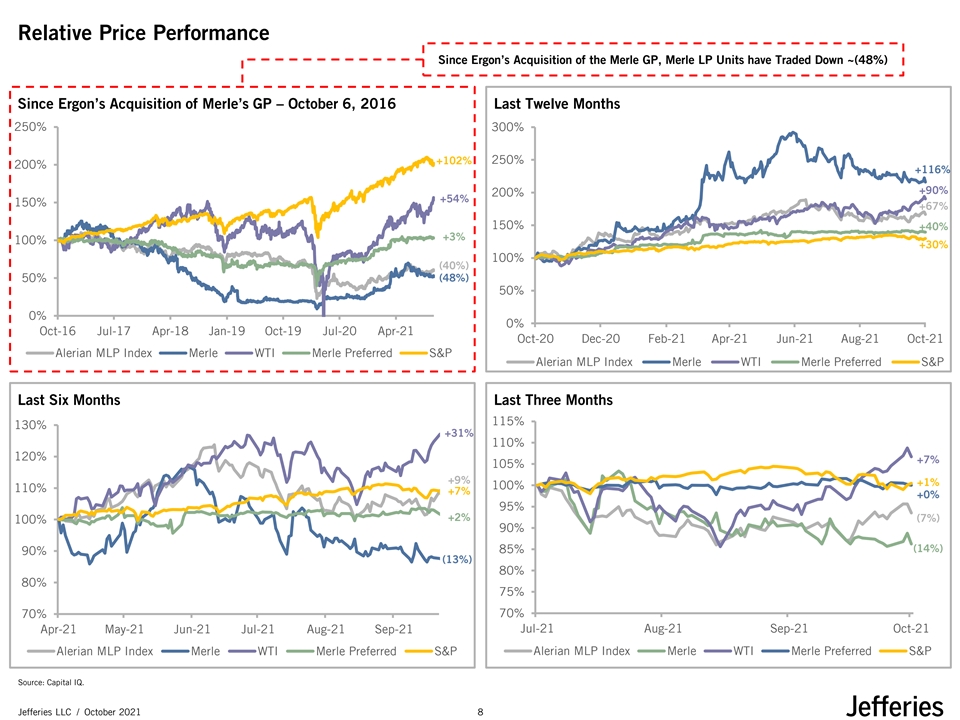
Relative Price Performance Since Ergon’s Acquisition of the Merle GP, Merle LP Units have Traded Down ~(48%) Since Ergon’s Acquisition of Merle’s GP – October 6, 2016 Last Twelve Months 250% 300% +102% 250% 200% +116% +90% 200% +54% 150% +67% 150% +40% +3% 100% +30% 100% (40%) (48%) 50% 50% 0% 0% Oct-16 Jul-17 Apr-18 Jan-19 Oct-19 Jul-20 Apr-21 Oct-20 Dec-20 Feb-21 Apr-21 Jun-21 Aug-21 Oct-21 Alerian MLP Index Merle WTI Merle Preferred S&P Alerian MLP Index Merle WTI Merle Preferred S&P Last Six Months Last Three Months 115% 130% +31% 110% 120% +7% 105% +9% +1% 100% 110% +7% +0% 95% +2% (7%) 100% 90% (14%) 85% 90% (13%) 80% 80% 75% 70% 70% Apr-21 May-21 Jun-21 Jul-21 Aug-21 Sep-21 Jul-21 Aug-21 Sep-21 Oct-21 Alerian MLP Index Merle WTI Merle Preferred S&P Alerian MLP Index Merle WTI Merle Preferred S&P Source: Capital IQ. Jefferies LLC / October 2021 8
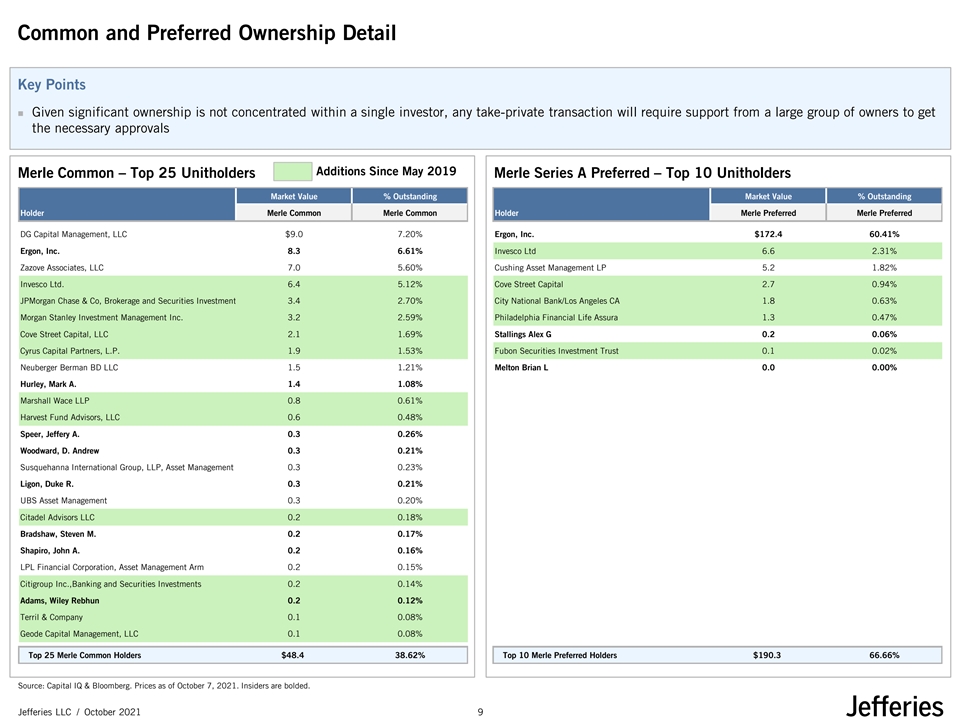
Common and Preferred Ownership Detail Key Points ◼ Given significant ownership is not concentrated within a single investor, any take-private transaction will require support from a large group of owners to get the necessary approvals Additions Since May 2019 Merle Common – Top 25 Unitholders Merle Series A Preferred – Top 10 Unitholders Market Value % Outstanding Market Value % Outstanding Holder Merle Common Merle Common Holder Merle Preferred Merle Preferred DG Capital Management, LLC $9.0 7.20% Ergon, Inc. $172.4 60.41% Ergon, Inc. 8.3 6.61% Invesco Ltd 6.6 2.31% Zazove Associates, LLC 7.0 5.60% Cushing Asset Management LP 5.2 1.82% Invesco Ltd. 6.4 5.12% Cove Street Capital 2.7 0.94% JPMorgan Chase & Co, Brokerage and Securities Investments 3.4 2.70% City National Bank/Los Angeles CA 1.8 0.63% Morgan Stanley Investment Management Inc. 3.2 2.59% Philadelphia Financial Life Assura 1.3 0.47% Cove Street Capital, LLC 2.1 1.69% Stallings Alex G 0.2 0.06% Cyrus Capital Partners, L.P. 1.9 1.53% Fubon Securities Investment Trust 0.1 0.02% Neuberger Berman BD LLC 1.5 1.21% Melton Brian L 0.0 0.00% Hurley, Mark A. 1.4 1.08% Marshall Wace LLP 0.8 0.61% Harvest Fund Advisors, LLC 0.6 0.48% Speer, Jeffery A. 0.3 0.26% Woodward, D. Andrew 0.3 0.21% Susquehanna International Group, LLP, Asset Management Arm 0.3 0.23% Ligon, Duke R. 0.3 0.21% UBS Asset Management 0.3 0.20% Citadel Advisors LLC 0.2 0.18% Bradshaw, Steven M. 0.2 0.17% Shapiro, John A. 0.2 0.16% LPL Financial Corporation, Asset Management Arm 0.2 0.15% Citigroup Inc.,Banking and Securities Investments 0.2 0.14% Adams, Wiley Rebhun 0.2 0.12% Terril & Company 0.1 0.08% Geode Capital Management, LLC 0.1 0.08% Top 25 Merle Common Holders $48.4 38.62% Top 10 Merle Preferred Holders $190.3 66.66% Source: Capital IQ & Bloomberg. Prices as of October 7, 2021. Insiders are bolded. Jefferies LLC / October 2021 9
Merle Summary Financial Projections Jefferies LLC / October 2021 10
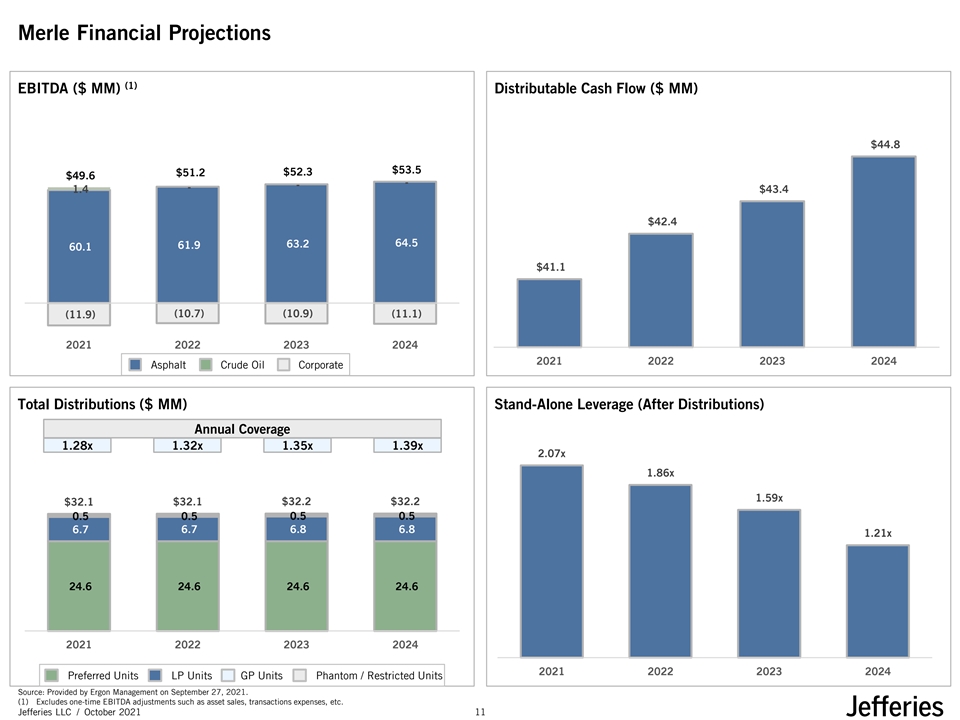
Merle Financial Projections (1) EBITDA ($ MM) Distributable Cash Flow ($ MM) $44.8 $53.5 $51.2 $52.3 $49.6 - - - 1.4 $43.4 $42.4 64.5 63.2 61.9 60.1 $41.1 (10.7) (10.9) (11.1) (11.9) 2021 2022 2023 2024 2021 2022 2023 2024 Asphalt Crude Oil Corporate Total Distributions ($ MM) Stand-Alone Leverage (After Distributions) Annual Coverage 1.28x 1.32x 1.35x 1.39x 2.07x 1.86x 1.59x $32.1 $32.1 $32.2 $32.2 0.5 0.5 0.5 0.5 6.7 6.7 6.8 6.8 1.21x 24.6 24.6 24.6 24.6 2021 2022 2023 2024 2021 2022 2023 2024 Preferred Units LP Units GP Units Phantom / Restricted Units Source: Provided by Ergon Management on September 27, 2021. (1) Excludes one-time EBITDA adjustments such as asset sales, transactions expenses, etc. Jefferies LLC / October 2021 11
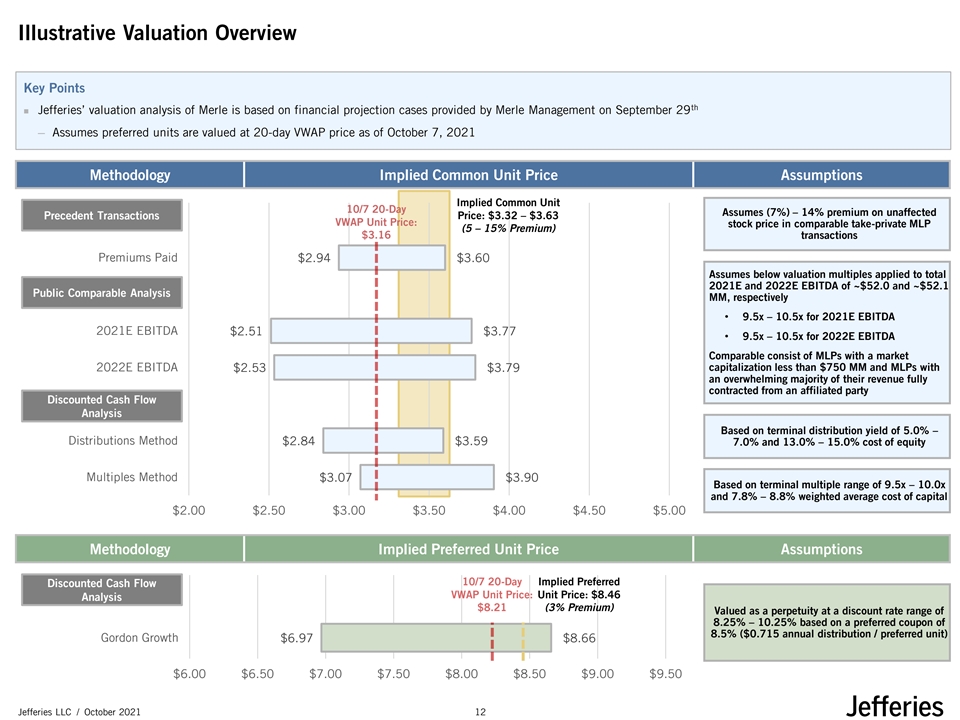
Illustrative Valuation Overview Key Points th ◼ Jefferies’ valuation analysis of Merle is based on financial projection cases provided by Merle Management on September 29 ─ Assumes preferred units are valued at 20-day VWAP price as of October 7, 2021 Methodology Implied Common Unit Price Assumptions Implied Common Unit 10/7 20-Day Assumes (7%) – 14% premium on unaffected Precedent Transactions Price: $3.32 – $3.63 Precedent Transactions VWAP Unit Price: stock price in comparable take-private MLP (5 – 15% Premium) $3.16 transactions Premiums Paid $2.94 $3.60 Assumes below valuation multiples applied to total 2021E and 2022E EBITDA of ~$52.0 and ~$52.1 Public Comparable Analysis Public Comparables Analysis MM, respectively • 9.5x – 10.5x for 2021E EBITDA 2021E EBITDA $2.51 $3.77 • 9.5x – 10.5x for 2022E EBITDA Comparable consist of MLPs with a market capitalization less than $750 MM and MLPs with 2022E EBITDA $2.53 $3.79 an overwhelming majority of their revenue fully contracted from an affiliated party Discounted Cash Flow DCF Analysis Based on terminal distribution yield of 5.0% – Distributions Method $2.84 $3.59 7.0% and 13.0% – 15.0% cost of equity Multiples Method $3.07 $3.90 Based on terminal multiple range of 9.5x – 10.0x and 7.8% – 8.8% weighted average cost of capital $2.00 $2.50 $3.00 $3.50 $4.00 $4.50 $5.00 Methodology Implied Preferred Unit Price Assumptions 10/7 20-Day Implied Preferred Discounted Cash Flow VWAP Unit Price: Unit Price: $8.46 Preferred Analysis $8.21 (3% Premium) Valued as a perpetuity at a discount rate range of 8.25% – 10.25% based on a preferred coupon of 8.5% ($0.715 annual distribution / preferred unit) Gordon Growth $6.97 $8.66 $6.00 $6.50 $7.00 $7.50 $8.00 $8.50 $9.00 $9.50 Jefferies LLC / October 2021 12
Illustrative Take-Private Analysis Jefferies LLC / October 2021 13
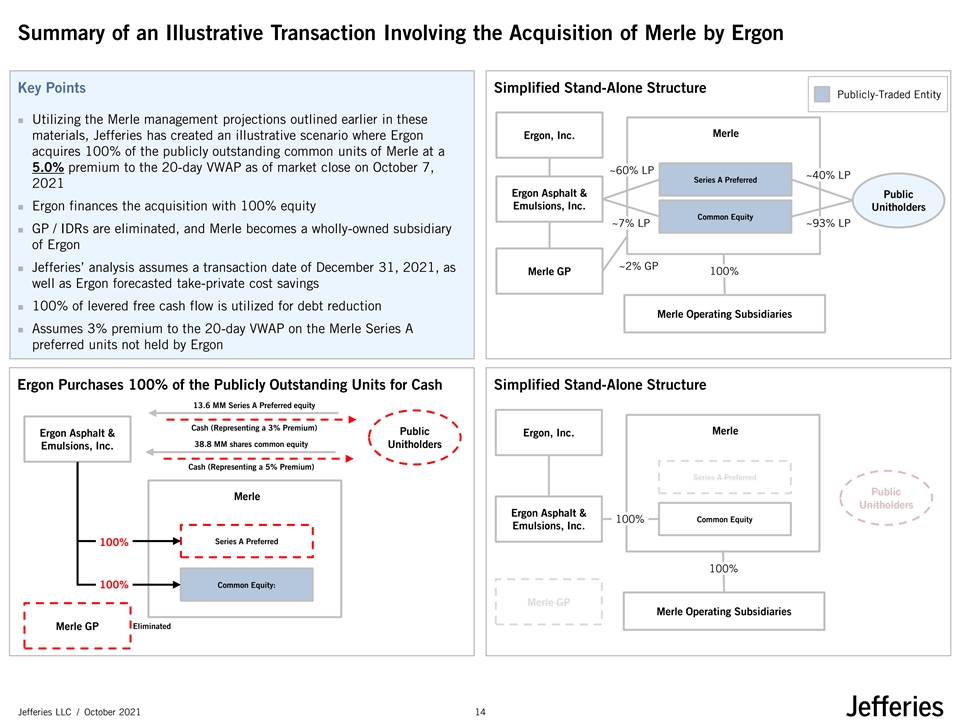
Summary of an Illustrative Transaction Involving the Acquisition of Merle by Ergon Key Points Simplified Stand-Alone Structure Publicly-Traded Entity ◼ Utilizing the Merle management projections outlined earlier in these Merle Ergon, Inc. materials, Jefferies has created an illustrative scenario where Ergon acquires 100% of the publicly outstanding common units of Merle at a 5.0% premium to the 20-day VWAP as of market close on October 7, ~60% LP ~40% LP Series A Preferred 2021 Ergon Asphalt & Public Emulsions, Inc. ◼ Ergon finances the acquisition with 100% equity Unitholders Common Equity ~7% LP ~93% LP ◼ GP / IDRs are eliminated, and Merle becomes a wholly-owned subsidiary of Ergon ~2% GP ◼ Jefferies’ analysis assumes a transaction date of December 31, 2021, as 100% Merle GP well as Ergon forecasted take-private cost savings ◼ 100% of levered free cash flow is utilized for debt reduction Merle Operating Subsidiaries ◼ Assumes 3% premium to the 20-day VWAP on the Merle Series A preferred units not held by Ergon Ergon Purchases 100% of the Publicly Outstanding Units for Cash Simplified Stand-Alone Structure 13.6 MM Series A Preferred equity Cash (Representing a 3% Premium) Public Merle Ergon Asphalt & Ergon, Inc. 38.8 MM shares common equity Unitholders Emulsions, Inc. Cash (Representing a 5% Premium) Series A Preferred Public Merle Unitholders Ergon Asphalt & 100% Common Equity Emulsions, Inc. Series A Preferred 100% 100% Common Equity: 100% Merle GP Merle Operating Subsidiaries Eliminated Merle GP Jefferies LLC / October 2021 14
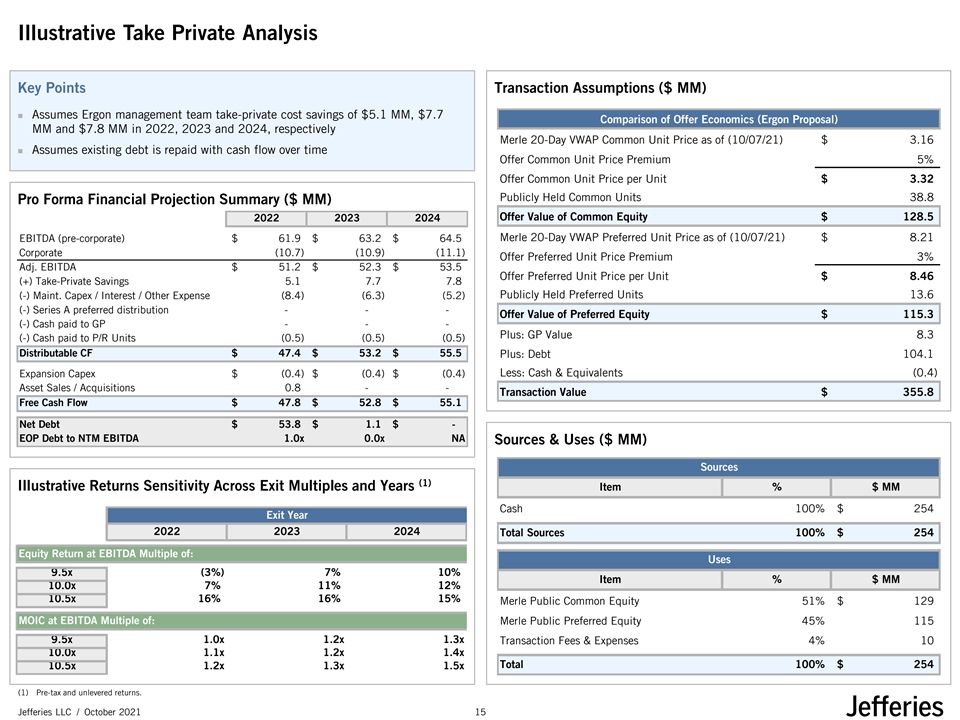
Illustrative Take Private Analysis Key Points Transaction Assumptions ($ MM) ◼ Assumes Ergon management team take-private cost savings of $5.1 MM, $7.7 Comparison of Offer Economics (Ergon Proposal) MM and $7.8 MM in 2022, 2023 and 2024, respectively Merle 20-Day VWAP Common Unit Price as of (10/07/21) $ 3.16 ◼ Assumes existing debt is repaid with cash flow over time Offer Common Unit Price Premium 5% Offer Common Unit Price per Unit $ 3.32 Publicly Held Common Units 38.8 Pro Forma Financial Projection Summary ($ MM) 2022 2023 2024 Offer Value of Common Equity $ 128.5 Merle 20-Day VWAP Preferred Unit Price as of (10/07/21) $ 8.21 EBITDA (pre-corporate) $ 61.9 $ 6 3.2 $ 6 4.5 Corporate ( 10.7) ( 10.9) ( 11.1) Offer Preferred Unit Price Premium 3% Adj. EBITDA $ 51.2 $ 52.3 $ 5 3.5 Offer Preferred Unit Price per Unit $ 8.46 (+) Take-Private Savings 5.1 7.7 7.8 Publicly Held Preferred Units 13.6 (-) Maint. Capex / Interest / Other Expense ( 8.4) ( 6.3) ( 5.2) (-) Series A preferred distribution - - - Offer Value of Preferred Equity $ 115.3 (-) Cash paid to GP - - - Plus: GP Value 8.3 (-) Cash paid to P/R Units ( 0.5) ( 0.5) ( 0.5) Distributable CF $ 4 7.4 $ 5 3.2 $ 5 5.5 Plus: Debt 104.1 Less: Cash & Equivalents (0.4) Expansion Capex $ ( 0.4) $ ( 0.4) $ ( 0.4) Asset Sales / Acquisitions 0.8 - - Transaction Value $ 355.8 Free Cash Flow $ 4 7.8 $ 52.8 $ 55.1 Net Debt $ 5 3.8 $ 1 .1 $ - EOP Debt to NTM EBITDA 1.0x 0.0x NA Sources & Uses ($ MM) Sources (1) Illustrative Returns Sensitivity Across Exit Multiples and Years Item % $ MM Cash 100% $ 254 Exit Year Exit Year 2022 2023 2024 Total Sources 100% $ 254 Equity Return at EBITDA Multiple of: Uses 9.5x (3%) 7% 10% Item % $ MM 10.0x 7% 11% 12% 10.5x 16% 16% 15% Merle Public Common Equity 51% $ 129 MOIC at EBITDA Multiple of: Merle Public Preferred Equity 45% 115 9.5x 1.0x 1.2x 1.3x Transaction Fees & Expenses 4% 10 10.0x 1.1x 1.2x 1.4x Total 100% $ 254 10.5x 1.2x 1.3x 1.5x (1) Pre-tax and unlevered returns. Jefferies LLC / October 2021 15
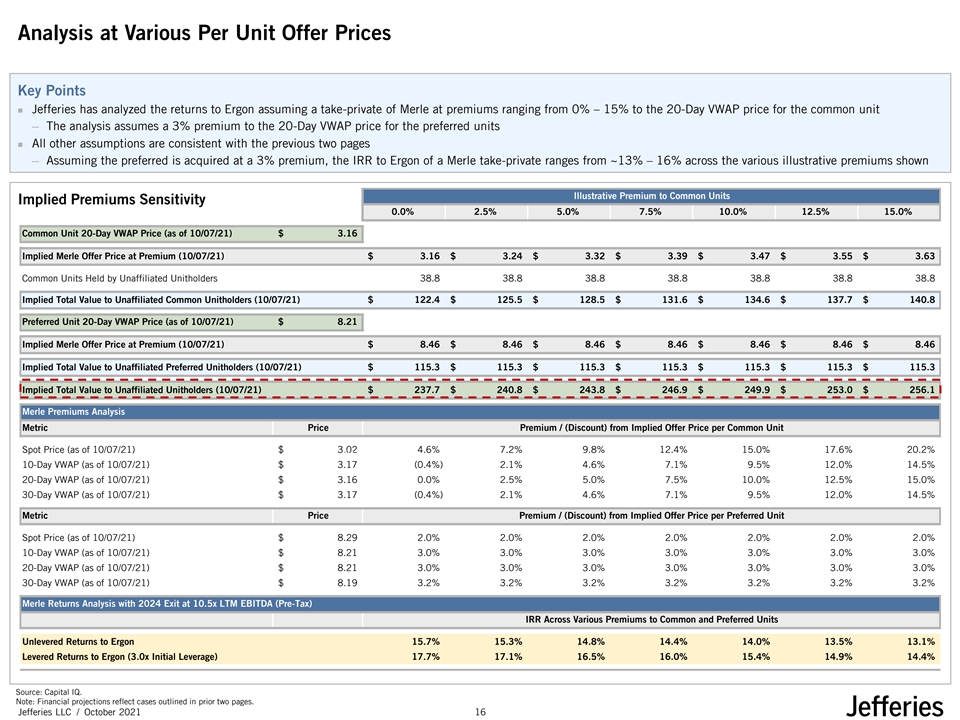
Analysis at Various Per Unit Offer Prices Key Points ◼ Jefferies has analyzed the returns to Ergon assuming a take-private of Merle at premiums ranging from 0% – 15% to the 20-Day VWAP price for the common unit ─ The analysis assumes a 3% premium to the 20-Day VWAP price for the preferred units ◼ All other assumptions are consistent with the previous two pages ─ Assuming the preferred is acquired at a 3% premium, the IRR to Ergon of a Merle take-private ranges from ~13% – 16% across the various illustrative premiums shown Illustrative Premium to Common Units Implied Premiums Sensitivity 0.0% 2.5% 5.0% 7.5% 10.0% 12.5% 15.0% Common Unit 20-Day VWAP Price (as of 10/07/21) $ 3.16 Implied Merle Offer Price at Premium (10/07/21) $ 3.16 $ 3.24 $ 3.32 $ 3.39 $ 3.47 $ 3.55 $ 3.63 Common Units Held by Unaffiliated Unitholders 38.8 38.8 38.8 38.8 38.8 38.8 38.8 Implied Total Value to Unaffiliated Common Unitholders (10/07/21) $ 122.4 $ 125.5 $ 128.5 $ 131.6 $ 134.6 $ 137.7 $ 140.8 Preferred Unit 20-Day VWAP Price (as of 10/07/21) $ 8.21 Implied Merle Offer Price at Premium (10/07/21) $ 8.46 $ 8.46 $ 8.46 $ 8.46 $ 8.46 $ 8.46 $ 8.46 Implied Total Value to Unaffiliated Preferred Unitholders (10/07/21) $ 115.3 $ 115.3 $ 115.3 $ 115.3 $ 115.3 $ 115.3 $ 115.3 Implied Total Value to Unaffiliated Unitholders (10/07/21) $ 237.7 $ 240.8 $ 243.8 $ 246.9 $ 249.9 $ 253.0 $ 256.1 Merle Premiums Analysis Metric Price Premium / (Discount) from Implied Offer Price per Common Unit Spot Price (as of 10/07/21) $ 3.02 4.6% 7.2% 9.8% 12.4% 15.0% 17.6% 20.2% (1) 10-Day VWAP (as of 10/07/21) $ 3.17 (0.4%) 2.1% 4.6% 7.1% 9.5% 12.0% 14.5% 20-Day VWAP (as of 10/07/21) $ 3.16 0.0% 2.5% 5.0% 7.5% 10.0% 12.5% 15.0% 30-Day VWAP (as of 10/07/21) $ 3.17 (0.4%) 2.1% 4.6% 7.1% 9.5% 12.0% 14.5% Metric Price Premium / (Discount) from Implied Offer Price per Preferred Unit Spot Price (as of 10/07/21) $ 8.29 2.0% 2.0% 2.0% 2.0% 2.0% 2.0% 2.0% 10-Day VWAP (as of 10/07/21) $ 8.21 3.0% 3.0% 3.0% 3.0% 3.0% 3.0% 3.0% 20-Day VWAP (as of 10/07/21) $ 8.21 3.0% 3.0% 3.0% 3.0% 3.0% 3.0% 3.0% 30-Day VWAP (as of 10/07/21) $ 8.19 3.2% 3.2% 3.2% 3.2% 3.2% 3.2% 3.2% Merle Returns Analysis with 2024 Exit at 10.5x LTM EBITDA (Pre-Tax) IRR Across Various Premiums to Common and Preferred Units Unlevered Returns to Ergon 15.7% 15.3% 14.8% 14.4% 14.0% 13.5% 13.1% Levered Returns to Ergon (3.0x Initial Leverage) 17.7% 17.1% 16.5% 16.0% 15.4% 14.9% 14.4% Source: Capital IQ. Note: Financial projections reflect cases outlined in prior two pages. Jefferies LLC / October 2021 16
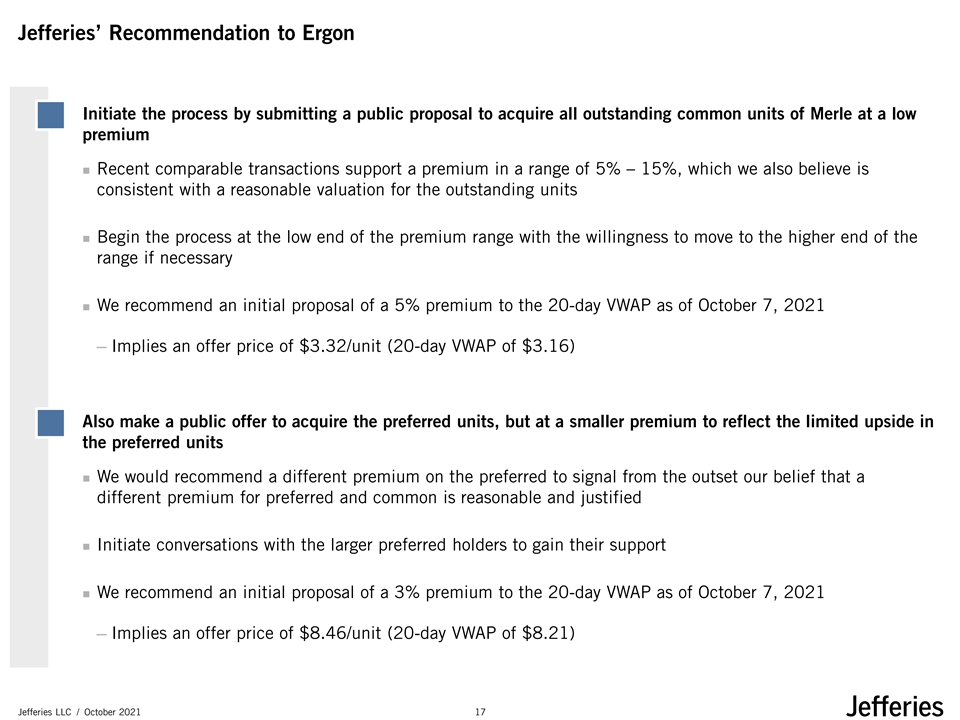
Jefferies’ Recommendation to Ergon Initiate the process by submitting a public proposal to acquire all outstanding common units of Merle at a low premium ◼ Recent comparable transactions support a premium in a range of 5% – 15%, which we also believe is consistent with a reasonable valuation for the outstanding units ◼ Begin the process at the low end of the premium range with the willingness to move to the higher end of the range if necessary ◼ We recommend an initial proposal of a 5% premium to the 20-day VWAP as of October 7, 2021 ─ Implies an offer price of $3.32/unit (20-day VWAP of $3.16) Also make a public offer to acquire the preferred units, but at a smaller premium to reflect the limited upside in the preferred units ◼ We would recommend a different premium on the preferred to signal from the outset our belief that a different premium for preferred and common is reasonable and justified ◼ Initiate conversations with the larger preferred holders to gain their support ◼ We recommend an initial proposal of a 3% premium to the 20-day VWAP as of October 7, 2021 ─ Implies an offer price of $8.46/unit (20-day VWAP of $8.21) Jefferies LLC / October 2021 17
Select MLP Take-Private Transactions Jefferies LLC / October 2021 18
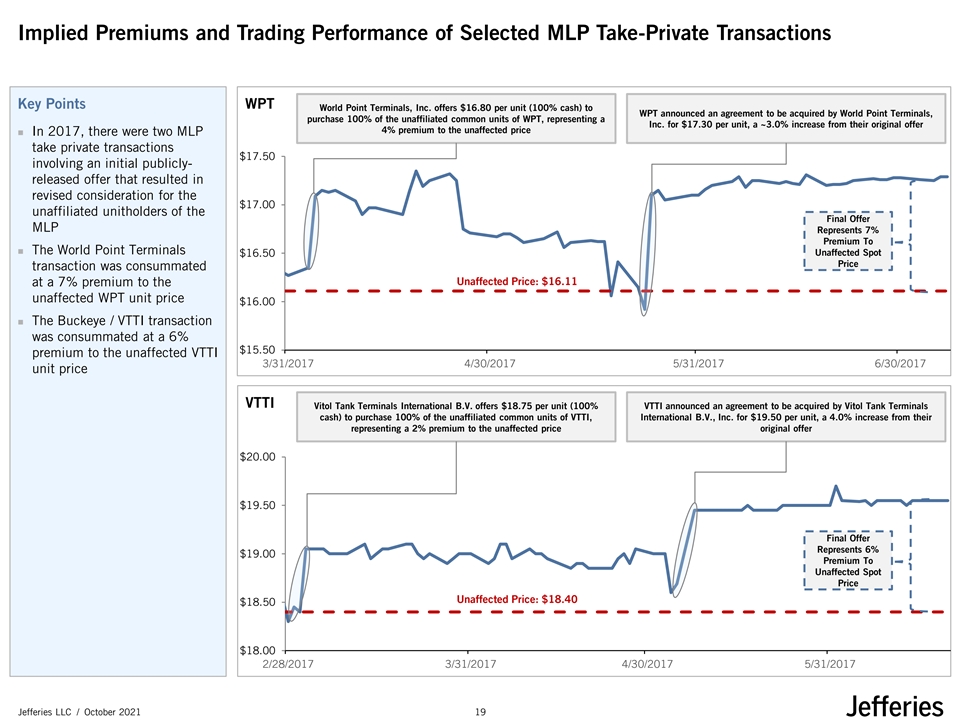
Implied Premiums and Trading Performance of Selected MLP Take-Private Transactions Key Points WPT World Point Terminals, Inc. offers $16.80 per unit (100% cash) to WPT announced an agreement to be acquired by World Point Terminals, purchase 100% of the unaffiliated common units of WPT, representing a Inc. for $17.30 per unit, a ~3.0% increase from their original offer 4% premium to the unaffected price ◼ In 2017, there were two MLP take private transactions $17.50 involving an initial publicly- released offer that resulted in revised consideration for the $17.00 unaffiliated unitholders of the Final Offer MLP Represents 7% Premium To ◼ The World Point Terminals Unaffected Spot $16.50 Price transaction was consummated Unaffected Price: $16.11 at a 7% premium to the unaffected WPT unit price $16.00 ◼ The Buckeye / VTTI transaction was consummated at a 6% $15.50 premium to the unaffected VTTI 3/31/2017 4/30/2017 5/31/2017 6/30/2017 unit price VTTI Vitol Tank Terminals International B.V. offers $18.75 per unit (100% VTTI announced an agreement to be acquired by Vitol Tank Terminals cash) to purchase 100% of the unaffiliated common units of VTTI, International B.V., Inc. for $19.50 per unit, a 4.0% increase from their representing a 2% premium to the unaffected price original offer $20.00 $19.50 Final Offer Represents 6% $19.00 Premium To Unaffected Spot Price Unaffected Price: $18.40 $18.50 $18.00 2/28/2017 3/31/2017 4/30/2017 5/31/2017 Jefferies LLC / October 2021 19
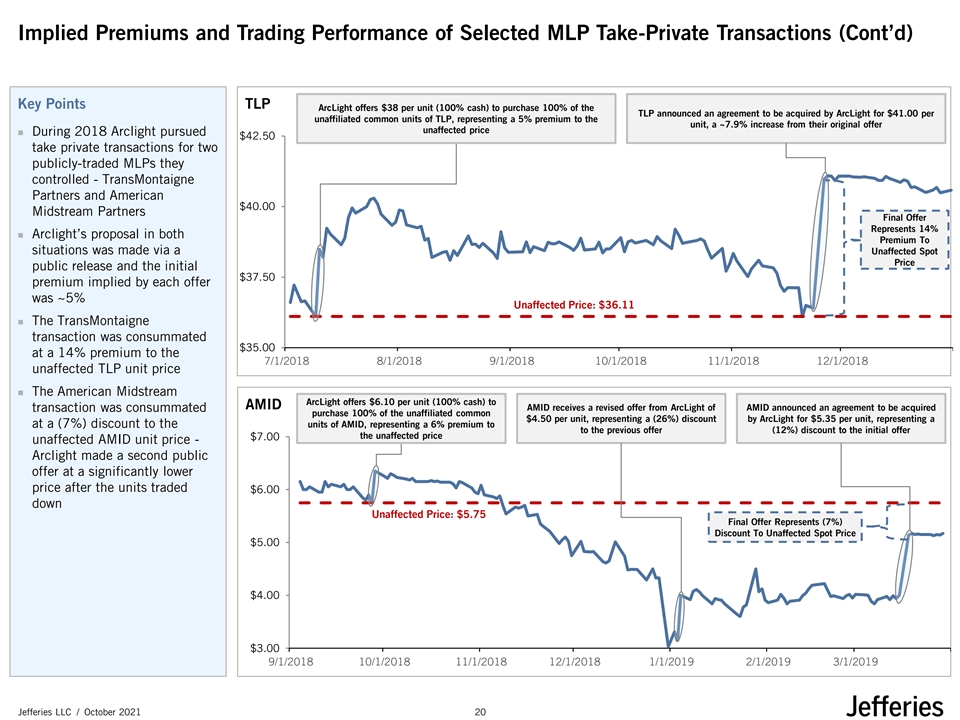
Implied Premiums and Trading Performance of Selected MLP Take-Private Transactions (Cont’d) Key Points TLP ArcLight offers $38 per unit (100% cash) to purchase 100% of the TLP announced an agreement to be acquired by ArcLight for $41.00 per unaffiliated common units of TLP, representing a 5% premium to the unit, a ~7.9% increase from their original offer unaffected price ◼ During 2018 Arclight pursued $42.50 take private transactions for two publicly-traded MLPs they controlled - TransMontaigne Partners and American $40.00 Midstream Partners Final Offer Represents 14% ◼ Arclight’s proposal in both Premium To situations was made via a Unaffected Spot Price public release and the initial $37.50 premium implied by each offer was ~5% Unaffected Price: $36.11 ◼ The TransMontaigne transaction was consummated $35.00 at a 14% premium to the 7/1/2018 8/1/2018 9/1/2018 10/1/2018 11/1/2018 12/1/2018 unaffected TLP unit price ◼ The American Midstream ArcLight offers $6.10 per unit (100% cash) to AMID AMID receives a revised offer from ArcLight of AMID announced an agreement to be acquired transaction was consummated purchase 100% of the unaffiliated common $4.50 per unit, representing a (26%) discount by ArcLight for $5.35 per unit, representing a at a (7%) discount to the units of AMID, representing a 6% premium to to the previous offer (12%) discount to the initial offer the unaffected price $7.00 unaffected AMID unit price - Arclight made a second public offer at a significantly lower price after the units traded $6.00 down Unaffected Price: $5.75 Final Offer Represents (7%) Discount To Unaffected Spot Price $5.00 $4.00 $3.00 9/1/2018 10/1/2018 11/1/2018 12/1/2018 1/1/2019 2/1/2019 3/1/2019 Jefferies LLC / October 2021 20