Please wait

Exhibit 99.(C)(3)


LOGO

Preliminary Draft – Confidential Discussion Materials Regarding Project Thunder November 9, 2021


[***] = Certain information has been excluded from this exhibit because it is both not material and would likely

cause harm to the company if publicly disclosed.


LOGO

Preliminary Draft – Confidential These materials have been prepared by Evercore Group L.L.C. (“Evercore”) for the Conflicts Committee (the “Conflicts Committee”) of the Board of Directors of Blueknight Energy Partners G.P., LLC, the general partner of Blueknight Energy Partners, L.P. (the “Partnership”), to whom such materials are directly addressed and delivered and may not be used or relied upon for any purpose other than as specifically contemplated by a written agreement with Evercore. These materials are based on information provided by or on behalf of the Conflicts Committee, from public sources or otherwise reviewed by Evercore. Evercore assumes no responsibility for independent investigation or verification of such information and has relied on such information being complete and accurate in all material respects. To the extent such information includes estimates and forecasts of future financial performance prepared by or reviewed with the management of the Partnership and/or other potential transaction participants or obtained from public sources, Evercore has assumed that such estimates and forecasts have been reasonably prepared on bases reflecting the best currently available estimates and judgments of such management (or, with respect to estimates and forecasts obtained from public sources, represent reasonable estimates). No representation or warranty, express or implied, is made as to the accuracy or completeness of such information and nothing contained herein is, or shall be relied upon as, a representation, whether as to the past, the present or the future. These materials were designed for use by specific persons familiar with the business and affairs of the Partnership. These materials are not intended to provide the sole basis for evaluating, and should not be considered a recommendation with respect to, any transaction or other matter. These materials have been developed by and are proprietary to Evercore and were prepared exclusively for the benefit and internal use of the Conflicts Committee. These materials were compiled on a confidential basis for use by the Conflicts Committee and not with a view to public disclosure or filing thereof under state or federal securities laws, and may not be reproduced, disseminated, quoted or referred to, in whole or in part, without the prior written consent of Evercore. These materials do not constitute an offer or solicitation to sell or purchase any securities and are not a commitment by Evercore or any of its affiliates to provide or arrange any financing for any transaction or to purchase any security in connection therewith. Evercore assumes no obligation to update or otherwise revise these materials. These materials may not reflect information known to other professionals in other business areas of Evercore and its affiliates. Evercore and its affiliates do not provide legal, accounting or tax advice. Accordingly, any statements contained herein as to tax matters were neither written nor intended by Evercore or its affiliates to be used and cannot be used by any taxpayer for the purpose of avoiding tax penalties that may be imposed on such taxpayer. Each person should seek legal, accounting and tax advice based on his, her or its particular circumstances from independent advisors regarding the impact of the transactions or matters described herein.


[***] = Certain information has been excluded from this exhibit because it is both not material and would likely

cause harm to the company if publicly disclosed.


LOGO

Preliminary Draft – Confidential Table of Contents Section Executive Summary I BKEP Situation Analysis II Preliminary Valuation of BKEP Common Units III BKEP Series A Preferred Units (BKEPP) Overview IV Appendix A. Weighted Average Cost of Capital Analysis


[***] = Certain information has been excluded from this exhibit because it is both not material and would likely

cause harm to the company if publicly disclosed.


LOGO

Preliminary Draft – Confidential I. Executive Summary


[***] = Certain information has been excluded from this exhibit because it is both not material and would likely

cause harm to the company if publicly disclosed.


LOGO

Preliminary Draft – Confidential Executive Summary Introduction ï® Evercore Group L.L.C. (“Evercore”) is pleased to provide the following materials to the Conflicts Committee (the “Conflicts Committee”) of the Board of Directors of Blueknight Energy Partners G.P., L.L.C. (the “General Partner”), the general partner of Blueknight Energy Partners, L.P. (“BKEP” or the “Partnership”), regarding Ergon, Inc.’s (“Ergon”) proposal to acquire all common units representing limited partner interests in BKEP (each, a “Common Unit”) from the holders of such units other than Common Units held by Ergon, the General Partner or their respective affiliates (the “Unaffiliated Unitholders”) (the “Proposed Transaction” or the “Merger”) ï,„ On October 8, 2021, Ergon offered to acquire each outstanding publicly-held Common Unit for $3.32 per Common Unit (the “Proposed Consideration”) • The Proposed Consideration represents an 8.1% premium to BKEP’s closing unit price as of October 8, 2021 ï,„ On October 8, 2021, Ergon also proposed to acquire all of BKEP’s Series A Preferred Units (each, a “Series A Preferred Unit” or “BKEPP”) from holders of such units other than the Series A Preferred Units held by Ergon, the General Partner or their respective affiliates for $8.46 per Series A Preferred Unit (the “ Series A Preferred Unit Offer”) • The Series A Preferred Unit Offer represents a 1.8% premium to BKEPP’s closing unit price as of October 8, 2021 ï,„ Ergon currently owns 6.6% of the current Common Units outstanding (and 31.0% of Common Units on an as-a-converted basis), and Ergon owns the 1.6% general partner interest and incentive distribution rights in BKEP through the General Partner, Ergon’s subsidiary ï® The materials include the following: ï,„ An overview of the Proposed Transaction ï,„ A current situation analysis for BKEP, including a review of the financial projections for BKEP as provided by BKEP management (the “BKEP Financial Projections”), a sensitivity case in which certain growth projects (“Stage 2 Growth Projects”) are executed (the “BKEP Financial Projections – Stage 2”) and a sensitivity case in which the Stage 2 growth projects are executed and other incremental growth projects are executed (the “BKEP Financial Projections – Stage 2+”) ï,„ A preliminary valuation of BKEP common units ï,„ An overview of BKEP Series A Preferred Units and an illustrative analysis of a conversion of the Series A Preferred Units into Common Units ï,„ An appendix, which includes analyses of BKEP’s cost of capital 1


[***] = Certain information has been excluded from this exhibit because it is both not material and would likely

cause harm to the company if publicly disclosed.


LOGO

Preliminary Draft – Confidential Executive Summary Summary Proposed Transaction Terms ï® Ergon Inc. and its subsidiary (Acquiror) Counterparties ï® Blueknight Energy Partners, L.P. ï® Ergon to acquire all publicly-owned Common Units from the Unaffiliated Unitholders for $3.32 per Common Unit ï® Ergon to acquire all publicly-owned Series A Preferred Units from the holders of such units other than Ergon, the General Partner, or their respective affiliates for $8.46 per Series A Preferred Unit Merger Summary and Proposed Consideration Public Own¹ Public % Ergon Own Ergon % Total Common Units 40,318,051 93.6% 2,745,837 6.4% 43,063,888 Series A Preferred Units 13,635,028 39.6% 20,801,757 60.4% 34,436,785 ï® BKEP will cease to be a publicly-traded partnership ï® Approval of the Conflicts Committee Approvalsï® Requires approval from 50.0% or greater of the Common Unitholders and 50.0% or greater of the Series A Preferred Unitholders (affiliates of Ergon currently owns 60.4% of Series A Preferred Units), or 50% or greater of the Common Units and Series A Preferred Units on an as-converted basis Timingï® Target closing in Q1 2022 ï® The Proposed Transaction is structured to be taxable to the Unaffiliated Unitholders Other ï® Approval of the Conflicts Committee Source: Public filings. Market data as of November 5, 2021 1. Includes effect of dilutive securities including phantom units and RSUs 2


[***] = Certain information has been excluded from this exhibit because it is both not material and would likely

cause harm to the company if publicly disclosed.


LOGO

Preliminary Draft – Confidential Executive Summary ($ and unit amounts in millions, except per unit amounts) Summary Organizational Structure and Transaction Economics Current Ownership Structure (As-Converted) Sources and Uses Other Sources $MM Ergon, Inc. (“Ergon”) Operating Cash $249 Subsidiaries Total Sources $249 100.0% Uses Units Price $MM Common Units (Public) 40.3 $3.32 $134 Series A Preferred Units (Public) 13.6 8.46 115 Ergon Asphalt & Emulsions, Inc. Total Uses 54.0 $249 20,801,757 Series A Preferred Units (60.4%) 2,745,837 Common Units (6.6%) Transaction Economics Proposed Consideration per Common Unit $3.32 100.0% Common Units Outstanding² 44 Blueknight Energy Partners G.P., Total Common Equity Value $145 L.L.C 31.0% LP Interest1 Series A Preferred Unit Offer $8.46 1,225,409 General Partner Units Series A Preferred Units Outstanding³ 35 Incentive Distributions Rights Total Series A Preferred Equity Value $296 1.6% GP Interest Total Equity Value $441 Blueknight Energy Partners, LP Plus: BKEP Current Net Debt 111 (NYSE: BKEP) Implied Enterprise Value $552 Common Market Capitalization2: $147 million Implied EV/EBITDA (BKEP Financial Projections) Metric Multiple Preferred Market Capitalization3: $288 million 2022E $53 10.5x Net Debt: $111 million 2023E 54 10.2 Enterprise Value: $545 million Implied EV/EBITDA (BKEP Financial Projections – Stage 2) 13,635,028 Series A 2022E $57 9.6x 38,767,246 Common Units 100.0% Preferred Units 2023E 66 8.3 93.4% Public Interest 39.6% Public Interest Implied EV/EBITDA (BKEP Financial Projections – Stage 2+) BKEP Operating Subsidiaries 2022E $57 9.6x Public Public Series A Common Preferred 2023E 75 7.4 Unitholders Unitholders Source: Public filings. Market data as of November 5, 2021 1. On an as-converted basis, without effect of dilutive securities 2. Includes 1.6% GP Interest and effect of dilutive securities including phantom units and RSUs Interests to be acquired in the Proposed Transaction 3. Includes 1.6% GP Interest 3


[***] = Certain information has been excluded from this exhibit because it is both not material and would likely

cause harm to the company if publicly disclosed.


LOGO

Preliminary Draft – Confidential Executive Summary Analysis at Various Prices – Illustrative Example ($ and unit counts in millions, except per unit amounts) Proposed Consideration per Common Unit $3.32 $3.50 $3.75 $4.00 $4.25 $4.50 $4.75 $5.00 Implied Premium to October 8, 2021 Closing Price 8.1% 14.0% 22.1% 30.3% 38.4% 46.6% 54.7% 62.9% Implied Premium to November 5, 2021 Closing Price (1.2%) 4.2% 11.6% 19.0% 26.5% 33.9% 41.4% 48.8% Common Units Outstanding¹ 44 44 44 44 44 44 44 44 Total Common Equity Value $145 $153 $164 $175 $186 $197 $208 $219 Series A Preferred Unit Offer $8.46 $8.46 $8.46 $8.46 $8.46 $8.46 $8.46 $8.46 Series A Preferred Units Outstanding² 35 35 35 35 35 35 35 35 Total Series A Preferred Equity Value $296 $296 $296 $296 $296 $296 $296 $296 Total Equity Value $441 $449 $460 $471 $482 $493 $504 $515 Plus: Current Net Debt 111 111 111 111 111 111 111 111 Total Enterprise Value $552 $560 $571 $582 $592 $603 $614 $625 Unaffiliated Common Units Outstanding³ 40 40 40 40 40 40 40 40 Unaffiliated Preferred Units Outstanding 14 14 14 14 14 14 14 14 Total Consideration for Common Units from Ergon $134 $141 $151 $161 $171 $181 $192 $202 Total Consideration for Preferred Units from Ergon 115 115 115 115 115 115 115 115 Total Consideration for Common and Preferred Units from Ergon $249 $256 $267 $277 $287 $297 $307 $317 Common Unit Premium as of October 8, 2021 Metric October 8, 2021 Closing Price $3.07 8.1% 14.0% 22.1% 30.3% 38.4% 46.6% 54.7% 62.9% 10-Day VWAP 3.17 4.9% 10.6% 18.5% 26.4% 34.2% 42.1% 50.0% 57.9% 30-Day VWAP 3.17 4.8% 10.5% 18.4% 26.3% 34.2% 42.0% 49.9% 57.8% 60-Day VWAP 3.25 2.2% 7.7% 15.4% 23.1% 30.8% 38.5% 46.2% 53.9% Preferred Unit Premium as of October 8, 2021 Metric October 8, 2021 Closing Price $8.31 1.8% 1.8% 1.8% 1.8% 1.8% 1.8% 1.8% 1.8% 10-Day VWAP 8.21 3.1% 3.1% 3.1% 3.1% 3.1% 3.1% 3.1% 3.1% 30-Day VWAP 8.20 3.2% 3.2% 3.2% 3.2% 3.2% 3.2% 3.2% 3.2% 60-Day VWAP 8.15 3.8% 3.8% 3.8% 3.8% 3.8% 3.8% 3.8% 3.8% EV / EBITDA (BKEP Financial Projections) 2022E $53 10.5x 10.6x 10.8x 11.0x 11.2x 11.5x 11.7x 11.9x 2023E 54 10.2 10.3 10.5 10.7 10.9 11.1 11.3 11.5 2024E 56 9.8 10.0 10.2 10.4 10.6 10.8 11.0 11.2 EV / EBITDA (BKEP Financial Projections—Stage 2) 2022E $57 9.6x 9.7x 9.9x 10.1x 10.3x 10.5x 10.7x 10.9x 2023E 66 8.3 8.5 8.6 8.8 9.0 9.1 9.3 9.5 2024E 68 8.1 8.2 8.4 8.5 8.7 8.8 9.0 9.2 EV / EBITDA (BKEP Financial Projections—Stage 2+) 2022E $57 9.6x 9.7x 9.9x 10.1x 10.3x 10.5x 10.7x 10.9x 2023E 75 7.4 7.5 7.6 7.8 7.9 8.0 8.2 8.3 2024E 83 6.6 6.7 6.8 7.0 7.1 7.2 7.4 7.5 Source: BKEP management, Partnership filings, FactSet 1. Includes 1.6% GP Interest and effect of dilutive securities including as phantom units and RSUs 2. Includes 1.6% GP interest 3. Includes effect of dilutive securities including phantom units and RSUs 4


[***] = Certain information has been excluded from this exhibit because it is both not material and would likely

cause harm to the company if publicly disclosed.


LOGO

Preliminary Draft – Confidential Executive Summary Indexed Price Performance 400% 350% 300% 297% 250% 200% 150% 153% 100% 89% 83% 50% —% 1/1/20 4/22/20 8/12/20 12/3/20 3/25/21 7/15/21 11/5/21 BKEP BKEPP BKEP Peer Group Average AMLP Source: FactSet 1. BKEP Peer Group Average calculated as the average indexed performance of publicly traded crude oil and refined products MLPs (DKL, GEL, GLP, HEP, MMLP, NS, PBFX, SRLP, SUN and USDP) 5


[***] = Certain information has been excluded from this exhibit because it is both not material and would likely

cause harm to the company if publicly disclosed.


LOGO

Preliminary Draft – Confidential Executive Summary Historical BKEP / BKEPP Price Historical BKEP Price Historical BKEPP Price Offer Premium / Offer Premium / BKEP Price (Discount) BKEPP Price (Discount) Ergon Current Proposal (BKEP) $3.32 Ergon Current Proposal (BKEPP) $8.46 YTD 2021 Average $3.11 6.9% YTD 2021 Average $7.82 8.2% Last 30 Days $3.15 5.5% Last 30 Days $8.19 3.3% Last 60 Days $3.25 2.2% Last 60 Days $8.16 3.7% Last 6 Months Average $3.43 (3.3%) Last 6 Months Average $8.10 4.4% Last 12 Months Average $2.81 18.3% Last 12 Months Average $7.48 13.1% $4.50 $9.00 Max Price on Proposal: $8.46 $8.31 6/14/21: $4.15 $8.19 $8.16 $8.00 $8.10 $7.82 $3.50 Proposal: $3.32 $3.43 $3.25 $7.48 $3.07 $ $3. 3.15 11 $7.00 $2.81 $2.50 $6.00 $5.00 $1.50 $4.00 $0.50 $3.00 1/1/20 4/17/20 8/3/20 11/19/20 3/6/21 6/22/21 10/8/21 1/1/20 4/17/20 8/3/20 11/19/20 3/6/21 6/22/21 10/8/21 Historical Price (BKEP) Ergon Current Proposal (BKEP) Historical Price (BKEPP) Ergon Current Proposal (BKEPP) YTD 2021 Average Last 30 Days YTD 2021 Average Last 30 Days Last 60 Days Last 6 Months Average Last 60 Days Last 6 Months Average Last 12 Months Average Last 12 Months Average Source: FactSet 6


[***] = Certain information has been excluded from this exhibit because it is both not material and would likely

cause harm to the company if publicly disclosed.


LOGO

Preliminary Draft – Confidential II. BKEP Situation Analysis


[***] = Certain information has been excluded from this exhibit because it is both not material and would likely

cause harm to the company if publicly disclosed.


LOGO

Preliminary Draft – Confidential BKEP Situation Analysis BKEP Asset Overview ï® 8.7 million barrels (“MMBbls”) of asphalt storage capacity Asset Overviewï® 53 terminals across 26 statesï® Largest independently-owned asphalt terminal network in the U.S. ï® 94% Fixed-fee take or pay contracts based on 2020A Revenueï® 6% Variable revenue based on 2020A Revenue Contract Profile ï® Primarily long-term contracts with high BKEP Terminal quality customersï® Weighted-average remaining contract term of approximately 6 years Terminal Overview1 State Facilities Capacity (MBbls) State Facilities Capacity (MBbls) OK 7 1,420 WA 3 468 KS 5 662 GA 2 192 CO 4 401 IL 2 232 TN 4 770 UT 2 300 TX 4 248 VA 2 635 MO 3 662 Source: Partnership investor presentation 1. Inclusive of only states with more than one terminal. Total terminals amount to 53 7


[***] = Certain information has been excluded from this exhibit because it is both not material and would likely

cause harm to the company if publicly disclosed.


LOGO

Preliminary Draft – Confidential Overview of Blueknight Energy Partners LP ($ in millions, except per unit amounts) Market Capitalization Balance Sheet and Credit Data As of November 5, 2021 As of June 30, 2021 Total Units Outstanding¹ 44 Cash and Marketable Securities $0 Common Unit Price $3.36 Long-Term Debt 111 Plus: Preferred Equity (Market Value)² 288 Total Debt $111 Total Equity Value $435 Net Debt $111 Plus: Net Debt 111 Plus: Preferred Equity (Book Value) 249 Enterprise Value $545 Plus: Partners’ Capital (247) BKEP Financial BKEP Financial BKEP Financial Projections Projections—Stage 2 Projections—Stage 2+ Net Book Capitalization $112 Metric Yield/Multiple Metric Yield/Multiple Metric Yield/Multiple EV/EBITDA Revolver Availability / Total Revolver Capacity $195.3 / $300.0 2022E $53 10.3x $57 9.5x $57 9.5x Net Debt / Net Book Cap 98.5% 2023E 54 10.0 66 8.2 75 7.3 Net Debt / 2022E EBITDA (BKEP Financial Projections) 2.1x Distribution Yield Net Debt / 2022E EBITDA (BKEP Financial Projections—Stage 2) 1.9 Current $0.16 4.8% $0.16 4.8% $0.16 4.8% Net Debt / 2022E EBITDA (BKEP Financial Projections—Stage 2+) 1.9 2022E 0.16 4.8% 0.25 7.4% 0.25 7.4% 2023E 0.16 4.8% 0.37 11.0% 0.47 14.0% Common Unit Price and Distribution Information General Partner Incentive Distribution Rights Quarterly Distribution per LP Unit $0.0400 $5.00 $0.30 Quarterly Total Total Total Total $4.00 Distr LP Quarterly Quarterly Distribution Total Quarterly Quarterly Annual Annual i Distribution Distribution to GP LP Units Distribution Distribution Distribution Distribution $0.20 Price $3.00 % to LP % to GP Range Within Range per LP Unit Outstanding to LPs to GP to LPs to GP bution 98.4% 1.6% $— $0.1100 $0.0400 $0.0007 41.5 $1.7 $0.0 $6.6 $0.1 $2.00 Unit $0.10 per 98.4% 1.6% 0.1100 0.1265 -—- 41.5 -———- $1.00 85.4% 14.6% 0.1265 0.1375 -—- 41.5 -———-Unit 75.4% 24.6% 0.1375 0.1825 -—- 41.5 -———- $— $— 50.4% 49.6% 0.1825 -—- 41.5 -———- $1.7 $0.0 $6.6 $0.1 11/5/19 3/5/20 7/5/20 11/4/20 3/6/21 7/6/21 11/5/21 Distribution per Unit Unit Price % of Total Distributions to the GP 1.6% % of Total Distributions to the IDRs —% Source: Public filings, FactSet 1. Includes General Partner 1.6% interest and effect of dilutive securities including phantom units and RSUs 2. Includes General Partner 1.6% interest 8


[***] = Certain information has been excluded from this exhibit because it is both not material and would likely

cause harm to the company if publicly disclosed.


LOGO

Preliminary Draft – Confidential BKEP Situation Analysis Equity Ownership Summary Summary Institutional Ownership Institution Units (000’s) Ownership % DG Capital Management LLC 3,194 7.7% Zazove Associates LLC 2,403 5.8% Invesco Advisers, Inc. 2,127 5.1% Institutional JPMorgan Securities LLC (Investment Management) 1,122 2.7% 29% Cove Street Capital LLC 700 1.7% Cyrus Capital Partners LP 637 1.5% Neuberger Berman Investment Advisers LLC 504 1.2% Marshall Wace LLP 251 0.6% Harvest Fund Advisors LLC 201 0.5% De Lisle Partners LLP 128 0.3% Susquehanna Financial Group LLLP 95 0.2% Retail Citadel Advisors LLC 75 0.2% 59% Andbank Wealth Management SGIIC SAU 70 0.2% Insiders LPL Financial LLC 62 0.2% 12% Citigroup Global Markets, Inc. (Investment Management) 57 0.1% UBS Securities LLC 45 0.1% UBS Financial Services, Inc. 38 0.1% Terril Brothers, Inc. 33 0.1% Geode Capital Management LLC 32 0.1% Group One Trading LP 26 0.1% Top 20 Institutional 11,799 28.4% Insider Ownership Summary Holder Units (000’s) Ownership % Holder Units (000’s) Ownership % Ergon, Inc. 2,746 6.6% Institutional 11,918 28.7% Morgan Stanley (Strategic Investments) 1,073 2.6% Insiders 5,123 12.3% Woodward D Andrew 362 0.9% Retail 24,472 59.0% Management and Other 942 2.3% Total Units Outstanding 41,513 100% Total Insider 5,123 12.3% Short Position 52 0.1% Source: FactSet as of November 5, 2021, Company filings 9


[***] = Certain information has been excluded from this exhibit because it is both not material and would likely

cause harm to the company if publicly disclosed.


LOGO

Preliminary Draft – Confidential BKEP Situation Analysis A BKEP Financial Projections – Assumptions ï® The BKEP Financial Projections as provided by BKEP management incorporate the following assumptions: ï,„ Revenue • Fixed Fee Revenue: Reflects current contract terms as of October 2021 • Variable Revenue: 2022+ excess throughput revenue excludes Western States sites per contract (~$0.7 million unfavorable impact); 2023+ volumes/revenue reflect increased infrastructure spend • CPI Adjustment (%): 2022 (2.5%); 2023+ (2.0% per year) ï,„ Expenses • Expenses and operating margins in-line with historical averages ï,„ Corporate G&A • Annual cash G&A of $10.5 million in 2022; escalated by approximately 2% annually thereafter ï,„ Maintenance Capital • Maintenance capital expenditures of $6.0 million per year (approximately 10% of Asphalt EBITDA and in-line with historical averages), escalated by 2% annually thereafter ï,„ Credit Facility Assumptions • $300 million existing revolving credit facility; increasing up to $450 million via accordion; pricing grid: L+2.00% to L+3.25% ï,„ Total Leverage / Distribution Coverage • Maintain long-term targets for leverage of 3.5x or less and distribution coverage ratio of 1.3x or greater on all distributions Source: BKEP management 10


[***] = Certain information has been excluded from this exhibit because it is both not material and would likely

cause harm to the company if publicly disclosed.


LOGO

Preliminary Draft – Confidential BKEP Situation Analysis B BKEP Financial Projections – Stage 2 – Assumptions ï® The BKEP Financial Projections – Stage 2 as provided by BKEP management assumes the BKEP Financial Projections and the following: ï,„ Reading, PA Expansion • $9.6 million of capital expenditures spread evenly from Q1 2022 to Q3 2022 • Incremental EBITDA of $1.2—$1.3 million throughout the projection period • Contract Term: 10 year extension • CPI Escalation: 2% annually ï,„ [***] Refined Gasoline and Blend Components • $44.7 million of capital expenditures between Q1 2022 – Q3 2022 ($19.6 million in Q1 and $12.6 million in Q2 and Q3) • Incremental EBITDA of $6.5—$7.1 million throughout the projection period • Incremental maintenance capital expenditures of $0.3 million annually • Contract Term: 10+ years • CPI Escalation: 2% annually ï,„ [***] • $4.3 million of capital expenditures in Q1 2022 • Incremental EBITDA of $0.5—$1.0 million throughout the projection period • Revenue reflects step-up in storage rate consistent with customer discussions per BKEP management • CPI Escalation: 2% annually ï,„ [***] Alphalt Terminals • $25 million in acquisition capex in 4Q 2021 with additional growth capital expenditures of $1.0 million in Q1 2022 • Incremental EBITDA of $2.7—$3.9 million throughout the projection period • CPI Escalation: 2% annually Source: BKEP management 11


[***] = Certain information has been excluded from this exhibit because it is both not material and would likely

cause harm to the company if publicly disclosed.


LOGO

Preliminary Draft – Confidential BKEP Situation Analysis C BKEP Financial Projections – Stage 2+ – Assumptions ï® The BKEP Financial Projections – Stage 2 as provided by BKEP management assumes the BKEP Financial Projections – Stage 2 and the following: ï,„ [***] Strategic JV Partnership—Asphalt • $75.0 million of capital expenditures in Q1 2023 • Incremental EBITDA of $8.3 million annually • Incremental maintenance capital expenditures of $1.0 million annually ï,„ [***] Strategic JV Partnership – Renewable Feedstocks • $25.0 million of capital expenditures in Q3 2023 • Incremental EBITDA of $2.8 million annually • Incremental maintenance capital expenditures of $0.3 million annually ï,„ Stage 2+ Project 1 • $50.0 million of capital expenditures in Q1 2024 • Incremental EBITDA of $5.6 million annually • Incremental maintenance capital expenditures of $0.7 million annually ï,„ Stage 2+ Project 2 • $50.0 million of capital expenditures in Q1 2025 • Incremental EBITDA of $5.6 million annually • Incremental maintenance capital expenditures of $0.7 million annually ï,„ Other Stage 2+ Projects include: [***], [***], and [***] Source: BKEP management 12


[***] = Certain information has been excluded from this exhibit because it is both not material and would likely

cause harm to the company if publicly disclosed.


LOGO

Preliminary Draft – Confidential BKEP Situation Analysis A BKEP Financial Projections ($ in millions, except per unit amounts) For the Years Ending 2021E 2022E 2023E 2024E 2025E 2026E Adjusted EBITDA $53 $53 $54 $56 $58 $60 Less: Cash Interest Expense (3) (3) (3) (3) (3) (2) Less: Taxes (0) (0) (0) (0) (0) (0) Less: Maintenance Capex (7) (6) (6) (6) (6) (6) Less: Distributions to Preferred¹ (25) (25) (25) (25) (25) (25) Distributable Cash Flow $18 $19 $20 $21 $24 $26 Distributed Cash Flow Common LP Units $7 $7 $7 $7 $7 $7 GP 0 0 0 0 0 0 Distributed Cash Flow $7 $7 $7 $7 $7 $8 % to GP 1.6% 1.6% 1.6% 1.6% 1.6% 1.6% Average Fully Diluted LP Units Outstanding 43 44 44 45 46 47 Distributable Cash Flow per LP Unit $0.41 $0.42 $0.44 $0.47 $0.50 $0.54 Distribution per LP Unit 0.16 0.16 0.16 0.16 0.16 0.16 LP Coverage Ratio 2.58x 2.65x 2.80x 2.95x 3.18x 3.45x Total Coverage Ratio—Common Only 2.55 2.62 2.77 2.92 3.15 3.41 Total Coverage Ratio—Common and Preferred 1.34 1.36 1.40 1.44 1.49 1.56 Distributable Cash Flow Surplus / (Shortfall) $11 $12 $13 $14 $16 $18 Source: BKEP management Note: Common LP distributions include amounts to phantom and restricted units 1. Includes distributions reflective of 1.6% GP interest 13


[***] = Certain information has been excluded from this exhibit because it is both not material and would likely

cause harm to the company if publicly disclosed.


LOGO

Preliminary Draft – Confidential BKEP Situation Analysis A BKEP Financial Projections – Sources and Uses ($ in millions) For the Years Ending 2021E 2022E 2023E 2024E 2025E 2026E Sources Distributable Cash Flow Surplus / (Shortfall) $11 $12 $13 $14 $16 $18 Asset Sales 155 1 -———- Total Sources $166 $12 $13 $14 $16 $18 Uses Capital Expenditures $1 $0 $0 $0 $0 $0 Revolver Repayment 153 12 14 14 26 29 Cash to Balance Sheet 0 0 (1) 1 0 (1) Other 12 (1) (1) (1) (10) (10) Total Uses $166 $12 $13 $14 $16 $18 Capital Structure BKEP Debt $100 $88 $74 $60 $34 $5 Less: Cash (1) (2) (1) (2) (2) (1) BKEP Net Debt $99 $86 $73 $58 $32 $4 BKEP Net Debt / Adjusted EBITDA 1.87x 1.64x 1.35x 1.04x 0.56x 0.07x Source: BKEP management 14


[***] = Certain information has been excluded from this exhibit because it is both not material and would likely

cause harm to the company if publicly disclosed.


LOGO

Preliminary Draft – Confidential BKEP Situation Analysis A BKEP Financial Projections – 1.3x Coverage Sensitivity ($ in millions, except per unit amounts) For the Years Ending 2021E 2022E 2023E 2024E 2025E 2026E Adjusted EBITDA $53 $53 $54 $56 $58 $60 Less: Cash Interest Expense (3) (3) (3) (3) (3) (2) Less: Taxes (0) (0) (0) (0) (0) (0) Less: Maintenance Capex (7) (6) (6) (6) (6) (6) Less: Distributions to Preferred¹ (25) (25) (25) (25) (25) (25) Distributable Cash Flow $18 $19 $20 $21 $24 $26 Distributed Cash Flow Common LP Units $7 $8 $9 $11 $12 $14 GP 0 0 0 0 0 0 Distributed Cash Flow $7 $8 $9 $11 $12 $14 % to GP 1.6% 1.6% 1.6% 1.6% 1.6% 1.6% Average Fully Diluted LP Units Outstanding 43 44 44 45 46 47 Distributable Cash Flow per LP Unit $0.41 $0.42 $0.44 $0.47 $0.50 $0.54 Distribution per LP Unit 0.16 0.19 0.21 0.24 0.27 0.30 LP Coverage Ratio 2.58x 2.23x 2.13x 2.01x 1.92x 1.83x Total Coverage Ratio—Common Only 2.55 2.21 2.11 1.99 1.90 1.82 Total Coverage Ratio—Common and Preferred 1.34 1.30 1.30 1.30 1.30 1.30 Distributable Cash Flow Surplus / (Shortfall) $11 $10 $10 $11 $11 $12 Source: BKEP management Note: Common LP distributions include amounts to phantom and restricted units 1. Includes distributions reflective of 1.6% GP interest 15


[***] = Certain information has been excluded from this exhibit because it is both not material and would likely

cause harm to the company if publicly disclosed.


LOGO

Preliminary Draft – Confidential BKEP Situation Analysis A BKEP Financial Projections – 1.3x Coverage Sensitivity – Sources and Uses ($ in millions) For the Years Ending 2021E 2022E 2023E 2024E 2025E 2026E Sources Distributable Cash Flow Surplus / (Shortfall) $11 $10 $10 $11 $11 $12 Asset Sales 155 1 -———- Total Sources $166 $11 $10 $11 $11 $12 Uses Capital Expenditures $1 $0 $0 $0 $0 $0 Revolver Repayment 153 11 12 11 21 22 Cash to Balance Sheet 0 0 (1) 1 0 (1) Other 12 (1) (1) (1) (10) (10) Total Uses $166 $11 $10 $11 $11 $12 Capital Structure BKEP Debt $100 $89 $78 $67 $46 $24 Less: Cash (1) (2) (1) (2) (2) (1) BKEP Net Debt $99 $88 $77 $65 $44 $23 BKEP Net Debt / Adjusted EBITDA 1.87x 1.67x 1.41x 1.17x 0.77x 0.38x Source: BKEP management 16


[***] = Certain information has been excluded from this exhibit because it is both not material and would likely

cause harm to the company if publicly disclosed.


LOGO

Preliminary Draft – Confidential BKEP Situation Analysis B BKEP Financial Projections – Stage 2 ($ in millions, except per unit amounts) For the Years Ending 2021E 2022E 2023E 2024E 2025E 2026E Adjusted EBITDA $53 $57 $66 $68 $70 $73 Less: Cash Interest Expense (3) (4) (5) (6) (6) (6) Less: Taxes (0) (0) (0) (0) (0) (0) Less: Maintenance Capex (7) (6) (7) (7) (7) (7) Less: Distributions to Preferred¹ (25) (25) (25) (25) (25) (25) Distributable Cash Flow $18 $22 $29 $30 $32 $35 Distributed Cash Flow Common LP Units $7 $11 $16 $17 $19 $21 GP 0 0 0 0 0 0 Distributed Cash Flow $7 $11 $17 $17 $19 $21 % to GP 1.6% 1.6% 1.6% 1.6% 1.6% 1.6% Average Fully Diluted LP Units Outstanding 43 44 44 45 46 47 Distributable Cash Flow per LP Unit $0.41 $0.50 $0.62 $0.62 $0.65 $0.68 Distribution per LP Unit 0.17 0.25 0.37 0.38 0.41 0.45 LP Coverage Ratio 2.42x 2.00x 1.76x 1.73x 1.70x 1.66x Total Coverage Ratio—Common Only 2.40 1.99 1.75 1.72 1.69 1.65 Total Coverage Ratio—Common and Preferred 1.32 1.30 1.30 1.30 1.30 1.30 Distributable Cash Flow Surplus / (Shortfall) $10 $11 $13 $13 $13 $14 Source: BKEP management Note: Common LP distributions include amounts to phantom and restricted units 1. Includes distributions reflective of 1.6% GP interest 17


[***] = Certain information has been excluded from this exhibit because it is both not material and would likely

cause harm to the company if publicly disclosed.


LOGO

Preliminary Draft – Confidential BKEP Situation Analysis B BKEP Financial Projections – Stage 2 – Sources and Uses ($ in millions) For the Years Ending 2021E 2022E 2023E 2024E 2025E 2026E Sources Distributable Cash Flow Surplus / (Shortfall) $10 $11 $13 $13 $13 $14 Asset Sales 155 1 -———- Total Sources $166 $12 $13 $13 $13 $14 Uses Capital Expenditures $1 $59 $0 $0 $0 $0 Revolver Repayment 153 (71) 13 14 24 23 Cash to Balance Sheet 0 0 0 (1) (0) 1 Asset Acquisitions — 26 -———-Other 11 (2) (1) (1) (11) (11) Total Uses $166 $12 $13 $13 $13 $14 Capital Structure BKEP Debt $100 $171 $158 $144 $120 $97 Less: Cash (1) (1) (2) (1) (1) (2) BKEP Net Debt $99 $170 $156 $143 $119 $95 BKEP Net Debt / Adjusted EBITDA 1.87x 2.96x 2.37x 2.10x 1.69x 1.31x Source: BKEP management 18


[***] = Certain information has been excluded from this exhibit because it is both not material and would likely

cause harm to the company if publicly disclosed.


LOGO

Preliminary Draft – Confidential BKEP Situation Analysis C BKEP Financial Projections – Stage 2+ ($ in millions, except per unit amounts) For the Years Ending 2021E 2022E 2023E 2024E 2025E 2026E Adjusted EBITDA $53 $57 $75 $83 $91 $98 Less: Cash Interest Expense (3) (4) (7) (11) (13) (15) Less: Taxes (0) (0) (0) (0) (0) (0) Less: Maintenance Capex (7) (6) (8) (9) (10) (11) Less: Distributions to Preferred¹ (25) (25) (25) (25) (25) (25) Distributable Cash Flow $18 $22 $35 $38 $43 $48 Distributed Cash Flow Common LP Units $7 $11 $21 $23 $26 $29 GP 0 0 0 1 1 2 Distributed Cash Flow $7 $11 $21 $24 $27 $31 % to GP 1.6% 1.6% 1.7% 2.1% 4.2% 6.5% Average Fully Diluted LP Units Outstanding 43 44 44 45 46 47 Distributable Cash Flow per LP Unit $0.41 $0.50 $0.70 $0.73 $0.77 $0.81 Distribution per LP Unit 0.17 0.25 0.47 0.52 0.57 0.63 LP Coverage Ratio 2.42x 2.00x 1.66x 1.63x 1.59x 1.56x Total Coverage Ratio—Common Only 2.40 1.99 1.65 1.61 1.57 1.52 Total Coverage Ratio—Common and Preferred 1.32 1.30 1.30 1.30 1.30 1.29 Distributable Cash Flow Surplus / (Shortfall) $10 $11 $14 $15 $16 $16 Source: BKEP management Note: Common LP distributions include amounts to phantom and restricted units 1. Includes distributions reflective of 1.6% GP interest 19


[***] = Certain information has been excluded from this exhibit because it is both not material and would likely

cause harm to the company if publicly disclosed.


LOGO

Preliminary Draft – Confidential BKEP Situation Analysis C BKEP Financial Projections – Stage 2+ – Sources and Uses ($ in millions) For the Years Ending 2021E 2022E 2023E 2024E 2025E 2026E Sources Distributable Cash Flow Surplus / (Shortfall) $10 $11 $14 $15 $16 $16 Asset Sales 155 1 -———- Total Sources $166 $12 $14 $15 $16 $16 Uses Capital Expenditures $1 $59 $100 $50 $50 $50 Revolver Repayment 153 (71) (84) (34) (24) (22) Cash to Balance Sheet 0 0 (0) (0) 1 (0) Asset Acquisitions — 26 -———-Other 11 (2) (2) (2) (11) (12) Total Uses $166 $12 $14 $15 $16 $16 Capital Structure BKEP Debt $100 $171 $255 $289 $313 $335 Less: Cash (1) (1) (1) (1) (2) (1) BKEP Net Debt $99 $170 $254 $288 $311 $334 BKEP Net Debt / Adjusted EBITDA 1.87x 2.96x 3.39x 3.45x 3.44x 3.41x Source: BKEP management 20


[***] = Certain information has been excluded from this exhibit because it is both not material and would likely

cause harm to the company if publicly disclosed.


LOGO

A C B 3x 1. Note: Source: $7 1. $53 3x BKEP 2021E $7 1. 2021E $53 Common $7 3x $53 BKEP LP 4x 1. Summary BKEP $7 $53 1. management $11 3x Total $57 distributions 2022E $11 1. 2022E $57 Financial 3x include 1. $7 4x Coverage $54 Situation 1. Distributed amounts $17 3x $66 Comparison Projections 2023E $21 1. Ratio 2023E $75 to 3x – Cash of 1. phantom $7 4x $56 EBITDA 1. the and $17 3x Common Flow $68 2024E $24 2024E $83 Analysis 1. and 3x (LP restricted 1. + BKEP units $7 5x $58 2025E $19 3x 1. Preferred GP) 2025E $70 $27 $91 3x 1. BKEP $8 6x 1. $60 Financial $21 $73 2026E 3x 1. 2026E Financial $31 $98 1. 3x 21 Projections—Projections Stage 1.87x $18 2 2021E 1.87x 2021E $18 1.87x $18 1.64x $19 2022E 2.96x 2022E $22 2.96x $22 BKEP 1.35x Net $20 2023E 2.37x 2023E $30 Financial 3.39x Debt $36 / Distributable 1.04x $22 2024E 2.10x $30 Cash Projections 3.45x 2024E $39 - EBITDA Flow Preliminary Stage 0.56x $24 2+ 1.69x $33 2025E ( Draft 3.44x 2025E $43 $ in – 0.07x $26 2026E 1.31x 2026E $35 3.41x $48 millions) Confidential


[***] = Certain information has been excluded from this exhibit because it is both not material and would likely

cause harm to the company if publicly disclosed.


LOGO

Preliminary Draft – Confidential III. Preliminary Valuation of BKEP Common Units


[***] = Certain information has been excluded from this exhibit because it is both not material and would likely

cause harm to the company if publicly disclosed.


LOGO

Preliminary Draft – Confidential Preliminary Valuation of BKEP Common Units Valuation Methodologies ï® Evercore utilized the following methodologies to analyze the value of BKEP’s Common Units Methodology Description Metrics / Assumptions ï® Values BKEP Common Units based on the concepts of the ï® Discounted the projected cash flows to January 1, 2022 time value of money, Evercore:ï® WACC based on the Capital Asset Pricing Model (“CAPM”) andï,„ Utilized varying weighted average cost of capital expected market return for certain relevant MLPs (“WACC”) discount rates and applied various perpetuity ï® Unitholder effective tax rate of 29.6% (80.0% at 37.0% top bracket) growth rates to derive after-tax valuation ranges for the from 2022E to 2025E and a tax rate of 37.0% for 2026E and Discounted Cash BKEP Common Units terminal value Flow Analysisï,„ Calculated terminal values based on a range of ï® For the terminal value, tax depreciation assumed to equal multiples of EBITDA as well as assumed perpetuity maintenance capital expenditures growth ratesï® EBITDA exit multiple of 8.0x to 10.x and a perpetuity growth rate of 0.00% to 2.00% ï® Values BKEP Common Units based on peer group’s currentï® Enterprise value / EBITDA multiples applied to 2022E and 2023E Peer Group market enterprise value multiples of relevant EBITDA Adjusted EBITDA ï® Peer group selected from MLPs with assets similar to those Trading Analysis owned by BKEP Precedent M&Aï® Values BKEP Common Units based on transactions ï® Enterprise value / EBITDA multiples applied to 2021E Adjusted Transaction involving assets and businesses similar to those owned by EBITDA BKEP Analysis ï® Values BKEP Common Units based on the present value of ï® Discounted projected distributions to January 1, 2022 Discounted the future cash distributions to BKEP Common Unitholdersï® Terminal yield range of 4.5% to 6.5% Distributions ï® Cost of equity of 9.5% to 11.5% based on CAPM and 8.0% to Analysis 10.0% based on total expected market return for MLPs with assets and businesses similar to those owned by BKEP ï® Implied value of BKEP Common Units based on historical ï® Median 1-Day and 20-Day premiums paid applied to relevant Premiums Paid For premiums paid in selected relevant cash midstream mergers equity prices Reference Only Analysis 22


[***] = Certain information has been excluded from this exhibit because it is both not material and would likely

cause harm to the company if publicly disclosed.


LOGO

Preliminary Draft – Confidential Preliminary Valuation of BKEP Common Units Valuation Summary – Unit Price For Reference Only Discounted Cash Flow Analysis Peer Group Trading Analysis Discounted Distributions Analysis Precedent M&A Premiums Analysis Paid EBITDA Exit Multiple Perpetuity Growth 2022E 2023E CAPM Expected Market Return Analysis $15.00 Stage 2 and Stage 2+ assume: a) growth projects BKEP Financial Projections Proposed Consideration: $3.32 per Unit achieved b) growth projects are funded with debt such that BKEP net debt / EBITDA does not exceed 3.5x in BKEP Financial Projections – Stage 2 any period and c) BKEP targets total coverage BKEP Financial Projections – Stage 2+ BKEP Unit Price as of October 8, 2021: $3.07 (including common and preferred distributions) of 1.3x $11.64 BKEP Financial Projections – 1.3x Coverage Sensitivity1 $10.92 Incremental Stage 2 Sensitivity2 Incremental Stage 2+ Sensitivity3 $10.00 Incremental Stage 2 DDM Sensitivity4 $8.47 Incremental Stage 2+ DDM Sensitivity4 $7.95 $7.12 $5.75 $6.71 $6.50 $5.35 $7.98 $5.87 $4.79 $5.67 $5.67 $7.51 $5.33 $6.81 $4.79 $4.68 $6.42 $5.00 $4.53 $4.21 $4.21 $5.84 $3.76 $3.76 $3.76 $5.50 $4.99 $3.71 $3.12 $2.90 $4.71 $3.08 $3.90 $3.32 $3.09 $3.46 $3.07 $3.67 $3.49 $3.07 $2.25 $2.51 $3.47 $2.05 $3.07 $2.16 $1.55 $1.58 $1.66 $2.51 $1.19 $1.30 $1.58 $1.34 $1.34 $1.34 $ — $0.71 $0.00 8.0%—9.0% WACC 4.5%—6.5% Terminal Yield Range: 2026E EBITDA Perpetuity Growth 2022E EBITDA 2023E EBITDA 2021E EBITDA Equity Cost Equity Cost 13.6% -Multiple of Rate of 8.0x—10.0x 7.0x—9.0x 8.5x—10.5x of Capital of of Capital of 17.7% 8.0x—10.0x 0.0%—2.0% 9.5%—11.5% 8.0%—10.0% Note: Implied unit prices less than $0.00 are shown as $0.00 1. Assumes 1.30x total coverage on distributions to Common Units and Series A Preferred Units 2. Assumes midpoint of 10.5%—12.5% WACC on the incremental projected cash flows from Stage 2 projects 3. Assumes midpoint 11.5%—13.5% WACC on the incremental projected cash flows from Stage 2+ projects 4. Assumes a terminal yield of 8.5% using the relevant midpoint for cost of equity 23


[***] = Certain information has been excluded from this exhibit because it is both not material and would likely

cause harm to the company if publicly disclosed.


LOGO

Preliminary Draft – Confidential Preliminary Valuation of BKEP Common Units ($ in millions, except per unit amounts) A Discounted Cash Flow Analysis – BKEP Financial Projections Summary Results For Years Ending December 31, EBITDA Perpetuity 2022E 2023E 2024E 2025E 2026E Multiple Growth Adjusted EBITDA $53 $54 $56 $58 $60 $60 $60 Less: Tax Depreciation and Amortization¹ (531) (7) (7) (5) (4) (6) EBIT ($479) $48 $49 $52 $55 $53 Less: Taxes² — (3) (3) (3) (4) (20) EBIAT ($479) $45 $46 $49 $51 $33 Plus: Tax Depreciation and Amortization 531 7 7 5 4 6 Less: Growth Capital Expenditures (0) (0) (0) (0) (0) —Less: Maintenance Capital Expenditures (6) (6) (6) (6) (6) (6) Plus: Asset Sales / (Acquisitions) 1 -————- Unlevered Free Cash Flow $47 $45 $46 $48 $49 $33 EBITDA Multiple / Perpetuity Growth Rate 9.0x 1.0% Implied Terminal Value $536 $446 PV of Terminal Value @ 8.5% Discount Rate $356 $309 Plus: PV of Unlevered Free Cash Flow @ 8.5% Discount Rate 192 Implied Enterprise Value $549 – $501 Less: Market Value Preferred Equity as of October 8, 2021³ (291) Less: Projected Net Debt as of December 31, 2021E (100) Implied Equity Value $159 – $111 BKEP LP Units Outstandingâ´ 44 Implied BKEP Unit Value $3.63 – $2.54 Sensitivity Analysis WACC Terminal Exit Multiple WACC Perpetuity Growth Rate 7.0x 8.0x 9.0x 10.0x 11.0x (1.00%) —% 1.00% 2.00% 3.00% 7.5% $2.21 $3.16 $4.11 $5.06 $6.01 7.5% $2.07 $2.93 $4.07 $5.61 $7.84 8.0% 2.01 2.94 3.86 4.79 5.72 8.0% 1.53 2.28 3.25 4.53 6.33 8.5% 1.81 2.72 3.63 4.53 5.44 8.5% 1.05 1.70 2.54 3.62 5.10 9.0% 1.62 2.51 3.39 4.28 5.16 9.0% 0.61 1.19 1.91 2.84 4.07 9.5% 1.44 2.30 3.17 4.03 4.90 9.5% 0.22 0.73 1.36 2.16 3.20 Source: BKEP management 1. 2022E tax DD&A assumes 100.0% bonus depreciation calculated as the midpoint of the enterprise value range plus 2022E capital expenditures; 2023E and 2024E tax DD&A assumes 100.0% bonus depreciation on capital expenditures; bonus depreciation phase-down on growth capital expenditures in 2025E (80.0%) and 2026E (60.0%) 2. Assumes unitholder effective tax rate of 29.6% (80% of 37% tax rate) through 2025E and 37.0% thereafter for Partnerships 3. Includes 1.6% general partner interest 4. Includes 1.6% general partner interest and effect of dilutive securities including phantom units and RSUs 24


[***] = Certain information has been excluded from this exhibit because it is both not material and would likely

cause harm to the company if publicly disclosed.


LOGO

Preliminary Draft – Confidential Preliminary Valuation of BKEP Common Units ($ in millions, except per unit amounts) B Discounted Cash Flow Analysis – BKEP Financial Projections – Stage 2 Summary Results For Years Ending December 31, EBITDA Perpetuity 2022E 2023E 2024E 2025E 2026E Multiple Growth Adjusted EBITDA $57 $66 $68 $70 $73 $73 $73 Less: Tax Depreciation and Amortization¹ (623) (7) (7) (6) (5) (7) EBIT ($566) $59 $61 $64 $68 $65 Less: Taxes² — (3) (4) (4) (5) (24) EBIAT ($566) $55 $57 $61 $63 $41 Plus: Tax Depreciation and Amortization 623 7 7 6 5 7 Less: Growth Capital Expenditures (59) (0) (0) (0) (0) —Less: Maintenance Capital Expenditures (6) (7) (7) (7) (7) (7) Plus: Asset Sales / (Acquisitions) (25) -————- Unlevered Free Cash Flow ($33) $55 $57 $59 $60 $41 EBITDA Multiple / Perpetuity Growth Rate 9.0x 1.0% Implied Terminal Value $654 $550 PV of Terminal Value @ 8.5% Discount Rate $435 $381 Plus: PV of Unlevered Free Cash Flow @ 8.5% Discount Rate 150 Implied Enterprise Value $585 – $531 Less: Market Value Preferred Equity as of October 8, 2021³ (291) Less: Projected Net Debt as of December 31, 2021E (100) Implied Equity Value $195 – $140 BKEP LP Units Outstanding 44 Implied BKEP Unit Value $4.45 – $3.21 Sensitivity Analysis WACC Terminal Exit Multiple WACC Perpetuity Growth Rate 7.0x 8.0x 9.0x 10.0x 11.0x (1.00%) —% 1.00% 2.00% 3.00% 7.5% $2.72 $3.88 $5.03 $6.19 $7.35 7.5% $2.62 $3.69 $5.08 $6.99 $9.74 8.0% 2.48 3.61 4.74 5.87 7.00 8.0% 1.96 2.89 4.08 5.67 7.89 8.5% 2.24 3.35 4.45 5.56 6.66 8.5% 1.37 2.18 3.21 4.55 6.37 9.0% 2.01 3.09 4.17 5.25 6.33 9.0% 0.84 1.55 2.44 3.58 5.11 9.5% 1.79 2.84 3.90 4.95 6.01 9.5% 0.36 0.99 1.76 2.75 4.03 Source: BKEP management 1. 2022E tax DD&A assumes 100.0% bonus depreciation calculated as the midpoint of the enterprise value range plus 2022E capital expenditures; 2023E and 2024E tax DD&A assumes 100.0% bonus depreciation on capital expenditures; bonus depreciation phase-down on growth capital expenditures in 2025E (80.0%) and 2026E (60.0%) 2. Assumes unitholder effective tax rate of 29.6% (80% of 37% tax rate) through 2025E and 37.0% thereafter for Partnerships 3. Includes 1.6% general partner interest 4. Includes 1.6% general partner interest and effect of dilutive securities including phantom units and RSUs 25


[***] = Certain information has been excluded from this exhibit because it is both not material and would likely

cause harm to the company if publicly disclosed.


LOGO

Preliminary Draft – Confidential Preliminary Valuation of BKEP Common Units B Overview of BKEP Growth Projects – Stage 2 Project Overview Summary Results For Years Ending December 31, EBITDA 2022E 2023E 2024E 2025E 2026E Multiple Incremental Adjusted EBITDA $5 $12 $12 $13 $13 $13 Less: Tax Depreciation and Amortization¹ (92) (1) (1) (1) (0) Incremental EBIT ($87) $11 $11 $12 $13 Less: Taxes² — (1) (1) (1) (1) Incremental EBIAT ($87) $10 $11 $11 $12 Plus: Tax Depreciation and Amortization 92 1 1 1 0 Less: Incremental Growth Capital Expenditures (59) -———-Less: Incremental Maintenance Capital Expenditures (0) (1) (1) (1) (1) Plus: Asset Sales / (Acquisitions) (26) -———- Incremental Unlevered Free Cash Flow ($80) $10 $11 $11 $11 EBITDA Multiple / Perpetuity Growth Rate 9.0x Implied Terminal Value $118 NPV of Unlevered Cash Flows³ $36 Unlevered IRR 20.0% NPV at Various Discount Rates $40 $32 $28 $30 $24 $21 $18 $20 $10 $— 9.50% 10.50% 11.50% 12.50% 13.50% Impact per $0.73 $0.64 $0.56 $0.48 $0.40 Unit Note: Assumes incremental impact of Stage 2 projects to each line item 1. 2022E tax DD&A assumes 100.0% bonus depreciation calculated as the midpoint of the enterprise value range plus 2022E capital expenditures; 2023E and 2024E tax DD&A assumes 100.0% bonus depreciation on capital expenditures; bonus depreciation phase-down on growth capital expenditures in 2025E (80.0%) and 2026E (60.0%) 2. Assumes unitholder effective tax rate of 29.6% (80% of 37% tax rate) through 2025E and 37.0% thereafter for Partnerships 3. Assumes same discount rate as WACC used in discounted cash flow analyses and midpoint of EBITDA multiple and perpetuity growth 26


[***] = Certain information has been excluded from this exhibit because it is both not material and would likely

cause harm to the company if publicly disclosed.


LOGO

Preliminary Draft – Confidential Preliminary Valuation of BKEP Common Units ($ in millions, except per unit amounts) C Discounted Cash Flow Analysis – BKEP Financial Projections – Stage 2+ Summary Results For Years Ending December 31, EBITDA Perpetuity 2022E 2023E 2024E 2025E 2026E Multiple Growth Adjusted EBITDA $57 $75 $83 $91 $98 $98 $98 Less: Tax Depreciation and Amortization¹ (646) (108) (59) (49) (8) (11) EBIT ($589) ($33) $24 $42 $90 $87 Less: Taxes² -—- (1) (2) (7) (32) EBIAT ($589) ($33) $23 $39 $83 $55 Plus: Tax Depreciation and Amortization 646 108 59 49 8 11 Less: Growth Capital Expenditures (59) (100) (50) (50) (0) —Less: Maintenance Capital Expenditures (6) (8) (9) (10) (11) (11) Plus: Asset Sales / (Acquisitions) (25) -————- Unlevered Free Cash Flow ($33) ($33) $23 $28 $80 $55 EBITDA Multiple / Perpetuity Growth Rate 9.0x 1.0% Implied Terminal Value $882 $734 PV of Terminal Value @ 8.5% Discount Rate $586 $508 Plus: PV of Unlevered Free Cash Flow @ 8.5% Discount Rate 34 Implied Enterprise Value $620 – $542 Less: Market Value Preferred Equity as of October 8, 2021³ (291) Less: Projected Net Debt as of December 31, 2021E (100) Implied Equity Value $230 – $152 BKEP LP Units Outstandingâ´ 44 Implied BKEP Unit Value $5.25 – $3.47 Sensitivity Analysis WACC Terminal Exit Multiple WACC Perpetuity Growth Rate 7.0x 8.0x 9.0x 10.0x 11.0x (1.00%) —% 1.00% 2.00% 3.00% 7.5% $2.84 $4.40 $5.96 $7.52 $9.08 7.5% $2.61 $4.03 $5.89 $8.44 $12.11 8.0% 2.55 4.08 5.60 7.12 8.65 8.0% 1.77 3.00 4.59 6.71 9.68 8.5% 2.27 3.76 5.25 6.74 8.23 8.5% 1.02 2.10 3.47 5.26 7.70 9.0% 2.00 3.46 4.92 6.37 7.83 9.0% 0.35 1.30 2.49 4.01 6.05 9.5% 1.74 3.17 4.59 6.01 7.43 9.5% (0.25) 0.59 1.62 2.94 4.65 Source: BKEP management. Excludes company provided last growth capital expenditure investment in 2026 1. 2022E tax DD&A assumes 100.0% bonus depreciation calculated as the midpoint of the enterprise value range plus 2022E capital expenditures; 2023E and 2024E tax DD&A assumes 100.0% bonus depreciation on capital expenditures; bonus depreciation phase-down on growth capital expenditures in 2025E (80.0%) and 2026E (60.0%) 2. Assumes unitholder effective tax rate of 29.6% (80% of 37% tax rate) through 2025E and 37.0% thereafter for Partnerships 3. Includes 1.6% general partner interest 4. Includes 1.6% general partner interest and effect of dilutive securities including phantom units and RSUs 27


[***] = Certain information has been excluded from this exhibit because it is both not material and would likely

cause harm to the company if publicly disclosed.


LOGO

Preliminary Draft – Confidential Preliminary Valuation of BKEP Common Units C Overview of BKEP Growth Projects – Stage 2+ Project Overview Further work necessary on modeling assumptions Summary Results For Years Ending December 31, EBITDA 2022E 2023E 2024E 2025E 2026E Multiple Incremental Adjusted EBITDA $— $9 $15 $20 $25 $25 Less: Tax Depreciation and Amortization¹ (23) (101) (52) (43) (3) Incremental EBIT ($23) ($92) ($37) ($22) $22 Less: Taxes² — 3 2 1 (2) Incremental EBIAT ($23) ($89) ($35) ($21) $21 Plus: Tax Depreciation and Amortization 23 101 52 43 3 Less: Incremental Growth Capital Expenditures — (100) (50) (50) —Less: Incremental Maintenance Capital Expenditures — (1) (2) (3) (3) Plus: Asset Sales / (Acquisitions) -————- Incremental Unlevered Free Cash Flow $— ($89) ($35) ($31) $20 EBITDA Multiple / Perpetuity Growth Rate 9.0x Implied Terminal Value $228 NPV of Unlevered Cash Flows³ $35 Unlevered IRR 17.8% NPV at Various Discount Rates $40 $30 $30 $26 $21 $17 $20 $14 $10 $— 9.50% 10.50% 11.50% 12.50% 13.50% Impact per $0.69 $0.59 $0.49 $0.40 $0.31 Unit Note: Assumes incremental impact of Stage 2 projects to each line item. Excludes company provided last growth capital expenditure investment in 2026 1. 2022E tax DD&A assumes 100.0% bonus depreciation calculated as the midpoint of the enterprise value range plus 2022E capital expenditures; 2023E and 2024E tax DD&A assumes 100.0% bonus depreciation on capital expenditures; bonus depreciation phase-down on growth capital expenditures in 2025E (80.0%) and 2026E (60.0%) 2. Assumes unitholder effective tax rate of 29.6% (80% of 37% tax rate) through 2025E and 37.0% thereafter for Partnerships 3. Assumes same discount rate as WACC used in discounted cash flow analyses and midpoint of EBITDA multiple and perpetuity growth 28


[***] = Certain information has been excluded from this exhibit because it is both not material and would likely

cause harm to the company if publicly disclosed.


LOGO

Preliminary Draft – Confidential Preliminary Valuation of BKEP Common Units Peer Group Trading Metrics ($ in millions, except per unit amounts) Price % of 52-Week Equity Enterprise Enterprise Value / EBITDA Current Net Debt / Partnership 11/5/21 High Value Value 2022E 2023E Dist. Yield 2022E EBITDA Delek Logistics Partners, LP $46.84 90.8% $2,036 $2,932 9.1x 7.7x 8.1% 2.8x Genesis Energy, L.P. 11.50 90.0% 1,410 5,549 8.9 7.9 5.2% 5.3 Global Partners LP 22.74 82.7% 778 1,938 7.8 7.4 10.1% 4.1 Holly Energy Partners, L.P. 17.65 74.5% 2,237 4,358 9.9 9.7 7.9% 4.5 Martin Midstream Partners L.P. 3.14 85.6% 125 672 6.5 6.6 0.6% 5.3 NuStar Energy L.P. 15.46 74.6% 1,730 6,490 9.1 9.0 10.3% 4.8 PBF Logistics LP 13.57 81.3% 848 1,467 6.7 6.6 8.8% 2.8 Sprague Resources LP 17.73 60.3% 465 1,018 8.8 NM 9.8% 4.8 Sunoco LP 39.70 93.3% 3,961 6,830 8.7 8.5 8.3% 3.7 USD Partners LP 5.86 70.9% 162 332 5.5 5.2 8.1% 2.8 Mean 8.1x 7.6x 7.7% 4.1x Median 8.8 7.7 8.2% 4.3 Blueknight Energy Partners, L.P. $3.36 78.9% $435¹ $545 10.3x 10.0x 4.8% 2.1x Source: Public filings and FactSet 1. Includes 1.6% GP Interest, effect of dilutive securities including phantom units and RSUs and market value of preferred equity 29


[***] = Certain information has been excluded from this exhibit because it is both not material and would likely

cause harm to the company if publicly disclosed.


LOGO

Preliminary Draft – Confidential Preliminary Valuation of BKEP Common Units ($ in millions, except per unit amounts) A Peer Group Trading Analysis – BKEP Financial Projections 2022E Adjusted EBITDA $53 Relevant EBITDA Multiple 8.0x—10.0x Implied Enterprise Value Based on 2022E Adjusted EBITDA $421 - $527 Less: Preferred Equity as of October 08, 2021¹ (291) Less: Projected Net Debt as of December 31, 2021E (100) Implied Equity Value $31—$136 BKEP LP Units Outstanding² 44 Implied BKEP Unit Price Range—2022E Adjusted EBITDA $0.71—$3.12 2023E Adjusted EBITDA $54 Relevant EBITDA Multiple 7.0x 9.0x Implied Enterprise Value Based on 2023E Adjusted EBITDA $380 - $489 Less: Preferred Equity as of October 08, 2021¹ (291) Less: Projected Net Debt as of December 31, 2021E (100) Implied Equity Value ($10) - $99 BKEP LP Units Outstanding² 44 Implied BKEP Unit Price Range—2023E Adjusted EBITDA ($0.23)—$2.25 Source: BKEP management 1. Includes 1.6% general partner interest 2. Includes 1.6% general partner interest and effect of dilutive securities including phantom units and RSUs 30


[***] = Certain information has been excluded from this exhibit because it is both not material and would likely

cause harm to the company if publicly disclosed.


LOGO

Preliminary Draft – Confidential Preliminary Valuation of BKEP Common Units ($ in millions, except per unit amounts) B Peer Group Trading Analysis – BKEP Financial Projections – Stage 2 2022E Adjusted EBITDA $57 Relevant EBITDA Multiple 8.0x—10.0x Implied Enterprise Value Based on 2022E Adjusted EBITDA $460 - $574 Less: Preferred Equity as of October 08, 2021¹ (291) Less: Projected Net Debt as of December 31, 2021E (100) Implied Equity Value $69—$184 BKEP LP Units Outstanding² 44 Implied BKEP Unit Price Range—2022E Adjusted EBITDA $1.58—$4.21 2023E Adjusted EBITDA $66 Relevant EBITDA Multiple 7.0x 9.0x Implied Enterprise Value Based on 2023E Adjusted EBITDA $463 - $595 Less: Preferred Equity as of October 08, 2021¹ (291) Less: Projected Net Debt as of December 31, 2021E (100) Implied Equity Value $73 - $205 BKEP LP Units Outstanding² 44 Implied BKEP Unit Price Range—2023E Adjusted EBITDA $1.66—$4.68 Source: BKEP management 1. Includes 1.6% general partner interest 2. Includes 1.6% general partner interest and effect of dilutive securities including phantom units and RSUs 31


[***] = Certain information has been excluded from this exhibit because it is both not material and would likely

cause harm to the company if publicly disclosed.


LOGO

Preliminary Draft – Confidential Preliminary Valuation of BKEP Common Units ($ in millions, except per unit amounts) C Peer Group Trading Analysis – BKEP Financial Projections – Stage 2+ 2022E Adjusted EBITDA $57 Relevant EBITDA Multiple 8.0x—10.0x Implied Enterprise Value Based on 2022E Adjusted EBITDA $460 - $574 Less: Preferred Equity as of October 08, 2021¹ (291) Less: Projected Net Debt as of December 31, 2021E (100) Implied Equity Value $69—$184 BKEP LP Units Outstanding² 44 Implied BKEP Unit Price Range—2022E Adjusted EBITDA $1.58—$4.21 2023E Adjusted EBITDA $75 Relevant EBITDA Multiple 7.0x 9.0x Implied Enterprise Value Based on 2023E Adjusted EBITDA $525 - $675 Less: Preferred Equity as of October 08, 2021¹ (291) Less: Projected Net Debt as of December 31, 2021E (100) Implied Equity Value $134 - $284 BKEP LP Units Outstanding² 44 Implied BKEP Unit Price Range—2023E Adjusted EBITDA $3.07—$6.50 Source: BKEP management 1. Includes 1.6% general partner interest 2. Includes 1.6% general partner interest and effect of dilutive securities including phantom units and RSUs 32


[***] = Certain information has been excluded from this exhibit because it is both not material and would likely

cause harm to the company if publicly disclosed.


LOGO

Preliminary Draft – Confidential Preliminary Valuation of BKEP Common Units Precedent M&A Transaction Analysis Precedent Transactions – Asphalt Terminals Transaction Transaction Date Value Value / Announced Asset ($MM) EBITDA 10/17 Blueknight Energy Partners, L.P. / Asphalt terminal in Muskogee, Oklahoma (Frontier Terminal, LLC / Cummins Investment Corporation) 22.0 NA 10/17 Blueknight Energy Partners, L.P. / Asphalt terminal in Bainbridge, Georgia (Ergon, Inc.) 10.5 8.6 02/17 Martin Midstream Partners LP / Asphalt terminal facility in Hondo, Texas (Martin Resource Management Corporation) 36.0 7.2 07/16 Blueknight Energy Partners, L.P. / Nine asphalt and emulsions terminals (Ergon, Inc.) 108.8 8.5 02/16 Blueknight Energy Partners, L.P. / Two asphalt terminalling facilities located in Wilmington, North Carolina and Dumfries, Virginia (Axeon Specialty Products LLC) 19.0 7.5 05/15 Blueknight Energy Partners, L.P. / Asphalt terminalling facility in Cheyenne, Wyoming (Simon Contractors) 13.9 NA 06/14 World Point Terminals LP / Two terminals with storage capability for asphalt, crude oil, distillates and residual fuels in Mobile, Alabama (NuStar Energy L.P.) 23.7 1 4.7 2 02/13 Arc Terminals LP / Asphalt and crude oil marine terminalling facility in Mobile, Alabama, and rail transloading facility in Saraland, Alabama (Gulf Coast Asphalt Company, L.L.C.) 85.0 NA 07/12 Lindsay Goldberg LLC / 50% stake in NuStar Energy’s asphalt operations (NuStar Energy L.P.) 175.0 NA 05/10 NuStar Energy L.P. / Three asphalt and crude oil storage terminals with 24 storage tanks located along the Mobile River in Alabama (Asphalt Holdings, Inc.) 53.3 NA 10/09 Holly Energy Partners, L.P. / Asphalt and light products storage, loading racks and associated delivery pipeline (Sinclair) 75.0 9.0 01/08 SemGroup Energy Partners, L.P. / 46 U.S. liquid asphalt cement and residual fuel oil terminalling and storage facilities (SemMaterials, L.P.) 378.8 8.1 Min 4.7x Median 8.1 Mean 7.7 Max 9.0 Source: Public filings, Wall Street research 1. Transaction value adjusted to include an additional $10.0 million for capital expenditures that were required to restore the terminals to operational status 2. Based on revenue guidance at time of transaction of $7.0 million—$9.0 million and World Point Terminals LP’s 2014A EBITDA margin of 63% 33


[***] = Certain information has been excluded from this exhibit because it is both not material and would likely

cause harm to the company if publicly disclosed.


LOGO

Preliminary Draft – Confidential Preliminary Valuation of BKEP Common Units Precedent M&A Transaction Analysis (cont’d) Precedent Transactions – Selected Buy-In / Merger / Take-Private Transactions Transaction Transaction Date Value Value / Announced Acquiror / Target (Seller) ($MM) EBITDA 10 / 2021 
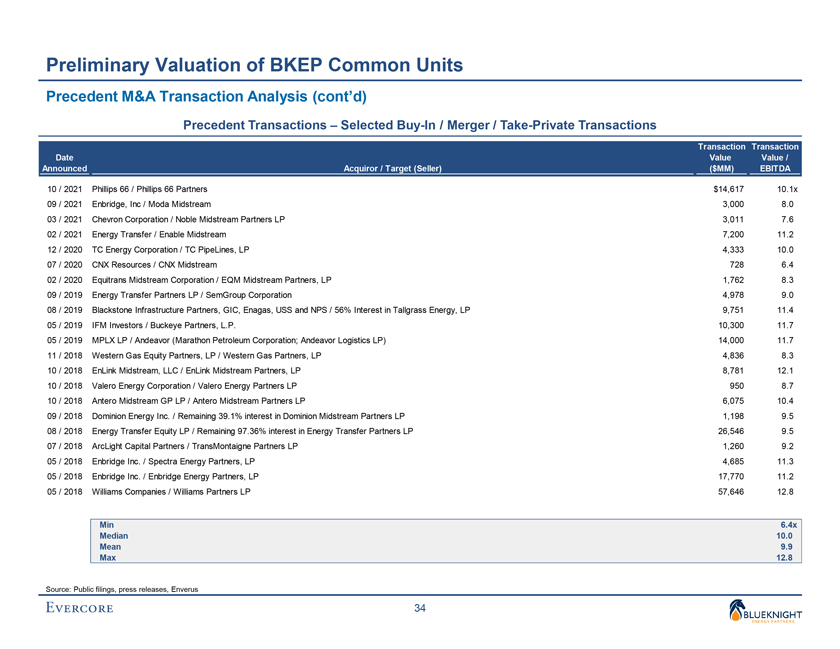
Phillips 66 / Phillips 66 Partners $14,617 10.1x 09 / 2021 Enbridge, Inc / Moda Midstream 3,000 8.0 03 / 2021 Chevron Corporation / Noble Midstream Partners LP 3,011 7.6 02 / 2021 Energy Transfer / Enable Midstream 7,200 11.2 12 / 2020 TC Energy Corporation / TC PipeLines, LP 4,333 10.0 07 / 2020 CNX Resources / CNX Midstream 728 6.4 02 / 2020 Equitrans Midstream Corporation / EQM Midstream Partners, LP 1,762 8.3 09 / 2019 Energy Transfer Partners LP / SemGroup Corporation 4,978 9.0 08 / 2019 Blackstone Infrastructure Partners, GIC, Enagas, USS and NPS / 56% Interest in Tallgrass Energy, LP 9,751 11.4 05 / 2019 IFM Investors / Buckeye Partners, L.P. 10,300 11.7 05 / 2019 MPLX LP / Andeavor (Marathon Petroleum Corporation; Andeavor Logistics LP) 14,000 11.7 11 / 2018 Western Gas Equity Partners, LP / Western Gas Partners, LP 4,836 8.3 10 / 2018 EnLink Midstream, LLC / EnLink Midstream Partners, LP 8,781 12.1 10 / 2018 Valero Energy Corporation / Valero Energy Partners LP 950 8.7 10 / 2018 Antero Midstream GP LP / Antero Midstream Partners LP 6,075 10.4 09 / 2018 Dominion Energy Inc. / Remaining 39.1% interest in Dominion Midstream Partners LP 1,198 9.5 08 / 2018 Energy Transfer Equity LP / Remaining 97.36% interest in Energy Transfer Partners LP 26,546 9.5 07 / 2018 ArcLight Capital Partners / TransMontaigne Partners LP 1,260 9.2 05 / 2018 Enbridge Inc. / Spectra Energy Partners, LP 4,685 11.3 05 / 2018 Enbridge Inc. / Enbridge Energy Partners, LP 17,770 11.2 05 / 2018 Williams Companies / Williams Partners LP 57,646 12.8 Min 6.4x Median 10.0 Mean 9.9 Max 12.8 Source: Public filings, press releases, Enverus 34


[***] = Certain information has been excluded from this exhibit because it is both not material and would likely

cause harm to the company if publicly disclosed.


LOGO

Preliminary Draft – Confidential Preliminary Valuation of BKEP Common Units ($ in millions, except per unit amounts) A Precedent M&A Transaction Analysis – BKEP Financial Projections 2021E Adjusted EBITDA $53 Relevant EBITDA Multiple 8.5x—10.5x Implied Enterprise Value Based on 2021E Adjusted EBITDA $449 - $555 Less: Preferred Equity as of October 08, 2021¹ (291) Less: Projected Net Debt as of December 31, 2021E (100) Implied Equity Value $59—$164 BKEP LP Units Outstanding² 44 Implied BKEP Unit Price Range—2021E Adjusted EBITDA $1.34—$3.76 Source: BKEP management 1. Includes 1.6% general partner interest 2. Includes 1.6% general partner interest and effect of dilutive securities including phantom units and RSUs 35


[***] = Certain information has been excluded from this exhibit because it is both not material and would likely

cause harm to the company if publicly disclosed.


LOGO

Preliminary Draft – Confidential Preliminary Valuation of BKEP Common Units ($ in millions, except per unit amounts) B Precedent M&A Transaction Analysis – BKEP Financial Projections – Stage 2 2021E Adjusted EBITDA $53 Relevant EBITDA Multiple 8.5x—10.5x Implied Enterprise Value Based on 2021E Adjusted EBITDA $449 - $555 Less: Preferred Equity as of October 08, 2021¹ (291) Less: Projected Net Debt as of December 31, 2021E (100) Implied Equity Value $59—$164 BKEP LP Units Outstanding² 44 Implied BKEP Unit Price Range—2021E Adjusted EBITDA $1.34—$3.76 Source: BKEP management 1. Includes 1.6% general partner interest 2. Includes 1.6% general partner interest and effect of dilutive securities including phantom units and RSUs 36


[***] = Certain information has been excluded from this exhibit because it is both not material and would likely

cause harm to the company if publicly disclosed.


LOGO

Preliminary Draft – Confidential Preliminary Valuation of BKEP Common Units ($ in millions, except per unit amounts) C Precedent M&A Transaction Analysis – BKEP Financial Projections – Stage 2+ 2021E Adjusted EBITDA $53 Relevant EBITDA Multiple 8.5x—10.5x Implied Enterprise Value Based on 2021E Adjusted EBITDA $449 - $555 Less: Preferred Equity as of October 08, 2021¹ (291) Less: Projected Net Debt as of December 31, 2021E (100) Implied Equity Value $59—$164 BKEP LP Units Outstanding² 44 Implied BKEP Unit Price Range—2021E Adjusted EBITDA $1.34—$3.76 Source: BKEP management 1. Includes 1.6% general partner interest 2. Includes 1.6% general partner interest and effect of dilutive securities including phantom units and RSUs 37


[***] = Certain information has been excluded from this exhibit because it is both not material and would likely

cause harm to the company if publicly disclosed.


LOGO

Preliminary Draft – Confidential Preliminary Valuation of BKEP Common Units A Discounted Distributions Analysis – BKEP Financial Projections For the Years Ending December 31, Terminal Value 2022E 2023E 2024E 2025E 2026E Low High BKEP Distribution per Unit (Cash, As Paid) $0.16 $0.16 $0.16 $0.16 $0.16 $0.16 – $0.16 Terminal Yield1 6.5% 4.5% Terminal Value $2.46 $3.56 Equity Cost of Capital Based on CAPM Present Value @ 8.5% Cost of Equity $2.29 – $3.18 Present Value @ 9.5% Cost of Equity 2.21 – 2.90 Present Value @ 10.5% Cost of Equity 2.12 – 2.79 Present Value @ 11.5% Cost of Equity 2.05 – 2.68 Present Value @ 12.5% Cost of Equity 1.97 – 2.58 Implied BKEP Unit Value – Based on CAPM $2.05 – $2.90 Equity Cost of Capital Based on Total Expected Market Return2 Present Value @ 7.0% Cost of Equity $2.43 – $3.21 Present Value @ 8.0% Cost of Equity 2.34 – $3.08 Present Value @ 9.0% Cost of Equity 2.25 – 2.96 Present Value @ 10.0% Cost of Equity 2.16 – 2.84 Present Value @ 11.0% Cost of Equity 2.08 – 2.73 Implied BKEP Unit Value – Based on Total Expected Market Return $2.16 – $3.08 Source: BKEP management 1. Based on BKEP’s 52-week yield range of 3.9% to 11.9% with a median of 5.1% and mean of 6.5%. Current yield is 5.2% as of October 8, 2021 2. Detail on Equity Cost of Capital calculations in Appendix 38


[***] = Certain information has been excluded from this exhibit because it is both not material and would likely

cause harm to the company if publicly disclosed.


LOGO

Preliminary Draft – Confidential Preliminary Valuation of BKEP Common Units A Discounted Distributions Analysis – BKEP Financial Projections – 1.3x Coverage Sensitivity1 For the Years Ending December 31, Terminal Value 2022E 2023E 2024E 2025E 2026E Low High BKEP Distribution per Unit (Cash, As Paid) $0.19 $0.21 $0.24 $0.27 $0.30 $0.31 – $0.31 Terminal Yield² 6.5% 4.5% Terminal Value $4.78 $6.90 Equity Cost of Capital Based on CAPM Present Value @ 8.5% Cost of Equity $4.14 – $5.56 Present Value @ 9.5% Cost of Equity 3.98 – 5.33 Present Value @ 10.5% Cost of Equity 3.82 – 5.11 Present Value @ 11.5% Cost of Equity 3.67 – 4.91 Present Value @ 12.5% Cost of Equity 3.53 – 4.71 Implied BKEP Unit Value – Based on CAPM $3.67 – $5.33 Equity Cost of Capital Based on Total Expected Market Return³ Present Value @ 7.0% Cost of Equity $4.41 – $5.92 Present Value @ 8.0% Cost of Equity 4.23 – 5.67 Present Value @ 9.0% Cost of Equity 4.06 – 5.44 Present Value @ 10.0% Cost of Equity 3.90 – 5.22 Present Value @ 11.0% Cost of Equity 3.75 – 5.01 Implied BKEP Unit Value – Based on Total Expected Market Return $3.90 – $5.67 Source: BKEP management 1. Assumes 1.30x total coverage on distributions to Common Units and Series A Preferred Units 2. Based on BKEP’s 52-week yield range of 3.9% to 11.9% with a median of 5.1% and mean of 6.5%. Current yield is 5.2% as of October 8, 2021 3. Detail on Equity Cost of Capital calculations in Appendix 39


[***] = Certain information has been excluded from this exhibit because it is both not material and would likely

cause harm to the company if publicly disclosed.


LOGO

Preliminary Draft – Confidential Preliminary Valuation of BKEP Common Units B Discounted Distributions Analysis – BKEP Financial Projections – Stage 2 For the Years Ending December 31, Terminal Value 2022E 2023E 2024E 2025E 2026E Low High BKEP Distribution per Unit (Cash, As Paid) $0.25 $0.37 $0.38 $0.41 $0.45 $0.46 – $0.46 Terminal Yield1 6.5% 4.5% Terminal Value $7.08 $10.22 Equity Cost of Capital Based on CAPM Present Value @ 8.5% Cost of Equity $6.20 – $8.29 Present Value @ 9.5% Cost of Equity 5.95 – 7.95 Present Value @ 10.5% Cost of Equity 5.72 – 7.63 Present Value @ 11.5% Cost of Equity 5.50 – 7.33 Present Value @ 12.5% Cost of Equity 5.29 – 7.04 Implied BKEP Unit Value – Based on CAPM $5.50 – $7.95 Equity Cost of Capital Based on Total Expected Market Return2 Present Value @ 7.0% Cost of Equity $6.59 – $8.84 Present Value @ 8.0% Cost of Equity 6.33 – 8.47 Present Value @ 9.0% Cost of Equity 6.08 – 8.12 Present Value @ 10.0% Cost of Equity 5.84 – 7.79 Present Value @ 11.0% Cost of Equity 5.61 – 7.48 Implied BKEP Unit Value – Based on Total Expected Market Return $5.84 – $8.47 Source: BKEP management 1. Based on BKEP’s 52-week yield range of 3.9% to 11.9% with a median of 5.1% and mean of 6.5%. Current yield is 5.2% as of October 8, 2021 2. Detail on Equity Cost of Capital calculations in Appendix 40


[***] = Certain information has been excluded from this exhibit because it is both not material and would likely

cause harm to the company if publicly disclosed.


LOGO

Preliminary Draft – Confidential Preliminary Valuation of BKEP Common Units C Discounted Distributions Analysis – BKEP Financial Projections – Stage 2+ For the Years Ending December 31, Terminal Value 2022E 2023E 2024E 2025E 2026E Low High BKEP Distribution per Unit (Cash, As Paid) $0.25 $0.47 $0.52 $0.57 $0.63 $0.64 – $0.64 Terminal Yield1 6.5% 4.5% Terminal Value $9.85 $14.22 Equity Cost of Capital Based on CAPM Present Value @ 8.5% Cost of Equity $8.49 – $11.40 Present Value @ 9.5% Cost of Equity 8.14 – 10.92 Present Value @ 10.5% Cost of Equity 7.82 – 10.48 Present Value @ 11.5% Cost of Equity 7.51 – 10.05 Present Value @ 12.5% Cost of Equity 7.22 – 9.65 Implied BKEP Unit Value – Based on CAPM $7.51 – $10.92 Equity Cost of Capital Based on Total Expected Market Return2 Present Value @ 7.0% Cost of Equity $9.03 – $12.15 Present Value @ 8.0% Cost of Equity 8.66 – 11.64 Present Value @ 9.0% Cost of Equity 8.31 – 11.16 Present Value @ 10.0% Cost of Equity 7.98 – 10.70 Present Value @ 11.0% Cost of Equity 7.67 – 10.26 Implied BKEP Unit Value – Based on Total Expected Market Return $7.98 – $11.64 Source: BKEP management 1. Based on BKEP’s 52-week yield range of 3.9% to 11.9% with a median of 5.1% and mean of 6.5%. Current yield is 5.2% as of October 8, 2021 2. Detail on Equity Cost of Capital calculations in Appendix 41


[***] = Certain information has been excluded from this exhibit because it is both not material and would likely

cause harm to the company if publicly disclosed.


LOGO

Preliminary Draft – Confidential Preliminary Valuation of BKEP Common Units Premiums Paid Analysis For Reference Only ($ in millions, except per unit amounts) Premium1 Date 1-Day 20-Day Announced Acquiror / Target Consideration Prior Spot VWAP 10/27/21 Phillips 66 / Phillips 66 Partners LP Stock-for-Unit 4.8% 6.7% 08/23/21 Landmark Dividend / Landmark Infrastructure Partners LP Cash-for-Unit 38.4% 35.0% 03/05/21 Chevron Corporation / Noble Midstream Partners LP Stock-for-Unit 16.7% 18.0% 12/15/20 TC Energy Corporation / TC PipeLines, LP Stock-for-Unit 19.5% 15.5% 07/27/20 CNX Resources Corporation / CNX Midstream Partners Stock-for-Unit 28.1% 3.9% 02/27/20 Equitrans Midstream Corporation / EQM Midstream Partners, LP Stock-for-Unit (1.5%) (5.6%) 12/17/19 Blackstone Infrastructure Partners / Tallgrass Energy LP Cash-for-Unit 56.4% 33.9% 10/01/19 Brookfield Business Partners L.P. / Teekay Offshore Partners L.P. Cash-for-Unit 28.1% 15.1% 09/16/19 Energy Transfer LP / SemGroup Corporation Cash/Unit-for-Share 65.4% 87.3% 08/21/19 Pembina Pipeline Corporation / Kinder Morgan Canada Limited Share-for-Share 37.7% 34.7% 05/10/19 IFM Investors / Buckeye Partners, L.P. Cash-for-Unit 27.5% 23.8% 05/08/19 MPLX LP / Andeavor (Marathon Petroleum Corporation; Andeavor Logistics LP) Unit-for-Unit 1.8% 1.3% 04/02/19 UGI Corporation / AmeriGas Partners, L.P. Cash/Stock-for-Unit 13.5% 22.2% 03/18/19 ArcLight Energy Partners Fund V, L.P. / American Midstream, LP Cash-for-Unit 31.3% 31.2% 02/05/19 SunCoke Energy, Inc. / SunCoke Energy Partners, L.P. Stock-for-Unit 9.3% 19.5% 11/26/18 Dominion Energy, Inc. / Dominion Energy Midstream Partners, LP Stock-for-Unit 3.9% 9.8% 11/26/18 ArcLight Energy Partners Fund VI, L.P. / TransMontaigne Partners L.P. Cash-for-Unit 12.6% 9.2% 11/08/18 Western Gas Equity Partners, LP / Western Gas Partners, LP Unit-for-Unit 7.6% 62.4% 10/22/18 EnLink Midstream, LLC / EnLink Midstream Partners, LP Unit-for-Unit 1.1% (0.5%) 10/18/18 Valero Energy Corporation / Valero Energy Partners LP Cash-for-Unit 6.0% 9.4% 10/09/18 Antero Midstream GP LP / Antero Midstream Partners LP Cash/Stock-for-Unit 63.7% 54.6% 08/01/18 Energy Transfer Equity, L.P. / Energy Transfer Partners, L.P. Unit-for-Unit 11.2% 17.3% 06/09/18 Cheniere Energy, Inc. / Cheniere Energy Partners LP Holdings, LLC Stock-for-Unit 6.6% NA 05/17/18 The Williams Companies, Inc. / Williams Partners L.P. Stock-for-Unit 13.6% 8.8% 05/17/18 Enbridge Inc. / Enbridge Energy Partners, L.P. Stock-for-Unit 13.9% 17.4% 05/17/18 Enbridge Inc. / Spectra Energy Partners, LP Stock-for-Unit 20.8% 19.0% 03/26/18 Tallgrass Energy GP, LP / Tallgrass Energy Partners, L.P. Stock-for-Unit 0.1% NA 02/08/18 Nustar Energy L.P. / Nustar GP Holdings, LLC Unit-for-Unit 1.7% NA 01/02/18 Archrock, Inc. / Archrock Partners, L.P. Stock-for-Unit 23.4% 26.8% Min (1.5%) (5.6%) All Median 13.6% 17.7% Transactions Mean 19.4% 22.2% Max 65.4% 87.3% Min 6.0% 9.2% Cash-for-Unit/Stock Median 28.1% 23.8% Only Mean 28.6% 22.5% Transactions Max 56.4% 35.0% Source: Bloomberg, FactSet, Public filings 1. VWAP premiums paid are calculated by dividing the value of the offer, defined as the exchange ratio multiplied by the closing price of the acquiror’s shares / units on the last trading day prior to announcement plus any cash received, by the 30-, 60- or 90-trading day VWAP of the target as calculated from the last undisturbed trading day prior to the announcement 42


[***] = Certain information has been excluded from this exhibit because it is both not material and would likely

cause harm to the company if publicly disclosed.


LOGO

Preliminary Draft – Confidential Preliminary Valuation of BKEP Common Units Premiums Paid Analysis (cont’d) ($ in millions, except per unit amounts) For Reference Only Summary Results – Cash-for-Unit Transactions 1-Day Prior Spot 20-Day VWAP Share Price as of 10/8/21 $3.07 $3.15 Historical Merger Premium Range 6.0% — 56.4% 9.2% — 35.0% Implied BKEP Unit Price Range $3.25 — $4.80 $3.44 — $4.26 Median Merger Premium 28.1% 23.8% Median-Implied BKEP Unit Value $3.93 $3.90 Summary Results – All Transactions 1-Day Prior Spot 20-Day VWAP Share Price as of 10/8/21 $3.07 $3.15 Historical Merger Premium Range (1.5%) — 65.4% (5.6%) — 87.3% Implied BKEP Unit Price Range $3.02 — $5.08 $2.98 — $5.90 Median Merger Premium 13.6% 17.7% Median-Implied BKEP Unit Value $3.49 $3.71 Source: FactSet 43


[***] = Certain information has been excluded from this exhibit because it is both not material and would likely

cause harm to the company if publicly disclosed.


LOGO

Preliminary Draft – Confidential IV. BKEP Series A Preferred Units (BKEPP) Overview


[***] = Certain information has been excluded from this exhibit because it is both not material and would likely

cause harm to the company if publicly disclosed.


LOGO

Preliminary Draft – Confidential BKEP Series A Preferred Units (BKEPP) Overview ï® In October 2010, BKEP issued 21.5 million Series A Preferred Units in a privately negotiated transaction at a cash purchase price of $6.50 per unitï,„ BKEP issued 50% of the Series A Units to Vitol and 50% of the Series A Units to Charlesbank ï® Series A Preferred Unitholders are entitled to total annual distributions equal to 2.125% per unit per quarter (or 8.5% per unit on an annual basis) ï® In October 2011, BKEP distributed, at no charge, to the common unitholders of record as of September 27, 2011 0.5412 freely-tradeable rights (individually a “Right”) for each common unit. Each whole Right entitled the holder to acquire a newly-issued Series A Preferred Unit at an exercise price of $6.50ï,„ On November 9, 2011, the Partnership issued 11.8 million Series A Preferred Units ï® In July 2016, a preferred unit repurchase agreement was placed into effect pursuant to which Ergon acquired 100% of the Series A Preferred Units owned by Vitol and Charlesbank (~18.3 million Series A Preferred Units at time of filing) ï® The Series A Preferred Units are convertible in whole, not in part, at the option of the Partnership when: ï,„ Number of Preferred Units equal to 50% or more of the number of Series A Preferred Units issued are converted into common units and there do not exist any accrued but unpaid distributions on such Preferred Units; orï,„ The distribution on a common unit is equal to or greater than the distribution on a Series A Preferred Unit for two consecutive quarters and there do not exist any arrearages on distributions on the Series A Preferred Units; orï,„ If (i) the daily volume-weighted average trading price of the common units is greater than $8.45 for twenty out of the trailing thirty trading days ending two trading days before BKEP furnishes notice of conversion and (ii) the average trading volume of common units has exceeded 20,000 common units for twenty out of the trailing thirty trading days ending two trading days before BKEP furnishes notice of conversion. Source: Public filings 44


[***] = Certain information has been excluded from this exhibit because it is both not material and would likely

cause harm to the company if publicly disclosed.


LOGO

Preliminary Draft – Confidential BKEP Series A Preferred Units (BKEPP) Overview Series A Preferred Units Summary Terms Units Outstandingï® 34,436,785 units outstanding as of August 4, 2021 Issue Priceï® $6.50 per unit Distributionsï® $0.17875 per quarter ($0.715 per year) Conversion at the Option of the ï® Preferred Unitholders can convert Series A Preferred Units into common units at an one-to-one ratio at anytime Unitholder ï® The Partnership can elect to convert Series A Preferred Units into common units at an one-to-one ratio if the daily volume-Conversion at the weighted average trading price of the common units is greater than $8.45 per common unit for twenty out of the trailing thirty Option of the trading days ending two trading days before the Partnership furnishes a notice of conversion Partnershipï® The Partnership can also elect to convert Series A Preferred Units if 50% of the Preferred Unitholders have already elected to convert into common unit ï® Preferred Unitholders are entitled to vote with common units on an as-converted basis and are entitled one vote per Series A Unitholder Vote Preferred Unit except with respect to modifications to the terms of the Series A Preferred Units ï® Any material modification to the terms of the Series A Preferred Units requires the approval of the majority of Preferred Unitholders 45


[***] = Certain information has been excluded from this exhibit because it is both not material and would likely

cause harm to the company if publicly disclosed.


LOGO

Preliminary Draft – Confidential BKEP Series A Preferred Units (BKEPP) Overview Discounted Distributions Analysis For Reference Only For the Years Ending December 31, Terminal Value 2022E 2023E 2024E 2025E 2026E Low High BKEPP Distribution per Unit (Cash, As Paid) $0.72 $0.72 $0.72 $0.72 $0.72 $0.72 – $0.72 Terminal Yield1 12.5% 8.5% Terminal Value $5.72 $8.41 Equity Cost of Capital Based on Total Expected Market Return2 Present Value @ 7.0% Cost of Equity $7.11 – $9.03 Present Value @ 8.0% Cost of Equity 6.86 – 8.69 Present Value @ 9.0% Cost of Equity 6.62 – 8.37 Present Value @ 10.0% Cost of Equity 6.39 – 8.07 Present Value @ 11.0% Cost of Equity 6.18 – 7.78 Implied BKEPP Unit Value – Based on Total Expected Market Return $6.39 – $8.69 Source: BKEP management 1. Based on BKEPP’s 52-week yield range of 8.6% to 12.3% with a median of 9.0% and mean of 9.8%. Current yield is 8.6% as of October 8, 2021 46


[***] = Certain information has been excluded from this exhibit because it is both not material and would likely

cause harm to the company if publicly disclosed.


LOGO

Preliminary Draft – Confidential BKEP Series A Preferred Units (BKEPP) Overview Valuation Summary – Unit Price Assumed Series A Preferred Units Convert at 2.7068x For Reference Only Discounted Cash Flow Analysis Peer Group Trading Analysis Discounted Distributions Analysis Precedent M&A Premiums Analysis Paid EBITDA Exit Multiple Perpetuity Growth 2022E 2023E CAPM Expected Market Return Analysis $15.00 BKEP Financial Projections Proposed Consideration: $3.32 per Unit BKEP Financial Projections – Stage 2 BKEP Financial Projections – Stage 2+ BKEP Unit Price as of October 8, 2021: $3.07 BKEP Financial Projections – 1.3x Coverage Sensitivity1 Stage 2 and Stage 2+ assume: a) growth projects achieved b) growth projects are funded with debt such Incremental Stage 2 Sensitivity2 that BKEP net debt / EBITDA does not exceed 3.5x in Incremental Stage 2+ Sensitivity3 any period and c) BKEP targets total coverage $10.00 (including common and preferred distributions) of 1.3x Incremental Stage 2 DDM Sensitivity4 Incremental Stage 2+ DDM Sensitivity4 $7.33 $6.88 $6.11 $5.74 $3.92 $4.91 $5.22 $5.00 $4.35 $3.79 $4.15 $4.22 $3.61 $3.95 $3.61 $3.89 $3.58 $3.71 $3.53 $3.09 $3.43 $3.43 $2.81 $5.08 $3.29 $3.29 $3.29 $2.90 $4.79 $3.08 $3.32 $3.08 $3.19 $3.64 $4.26 $4.36 $3.49 $3.07 $2.89 $3.20 $2.60 $2.62 $3.07 $3.44 $4.02 $4.12 $2.48 $2.59 $2.51 $2.60 $2.52 $2.52 $2.52 $3.67 $2.32 $3.47 $3.07 $2.03 $2.05 $2.16 $2.89 $ — 8.0%—9.0% WACC 4.5%—6.5% Terminal Yield Range: 2026E EBITDA Perpetuity Growth 2022E EBITDA 2023E EBITDA 2021E EBITDA Equity Cost Equity Cost 13.6% -Multiple of Rate of 8.0x—10.0x 7.0x—9.0x 8.5x—10.5x of Capital of of Capital of 17.7% 8.0x—10.0x 0.0%—2.0% 9.5%—11.5% 8.0%—10.0% Note: Assumes conversion ratio of 2.7068x, which is the equivalent market value for each common and preferred unit as of October 8, 2021 1. Assumes 1.30x total coverage on distributions to Common Units and Series A Preferred Units 2. Assumes midpoint of 10.5%—12.5% WACC on the incremental projected cash flows from Stage 2 projects 3. Assumes midpoint 11.5%—13.5% WACC on the incremental projected cash flows from Stage 2+ projects 4. Assumes a terminal yield of 8.5% using the relevant midpoint for cost of equity 47


[***] = Certain information has been excluded from this exhibit because it is both not material and would likely

cause harm to the company if publicly disclosed.


LOGO

Preliminary Draft – Confidential BKEP Series A Preferred Units (BKEPP) Overview Valuation Summary – Unit Price Assumed Series A Preferred Units Convert at 2.5000x For Reference Only Discounted Cash Flow Analysis Peer Group Trading Analysis Discounted Distributions Analysis Precedent M&A Premiums Analysis Paid EBITDA Exit Multiple Perpetuity Growth 2022E 2023E CAPM Expected Market Return Analysis $15.00 BKEP Financial Projections Proposed Consideration: $3.32 per Unit BKEP Financial Projections – Stage 2 BKEP Financial Projections – Stage 2+ BKEP Unit Price as of October 8, 2021: $3.07 BKEP Financial Projections – 1.3x Coverage Sensitivity1 Stage 2 and Stage 2+ assume: a) growth projects achieved b) growth projects are funded with debt such Incremental Stage 2 Sensitivity2 that BKEP net debt / EBITDA does not exceed 3.5x in Incremental Stage 2+ Sensitivity3 any period and c) BKEP targets total coverage $10.00 (including common and preferred distributions) of 1.3x Incremental Stage 2 DDM Sensitivity4 Incremental Stage 2+ DDM Sensitivity4 $7.74 $7.28 $6.44 $6.05 $5.17 $5.50 $5.00 $3.93 $4.38 $3.80 $4.45 $4.35 $3.78 $3.95 $3.61 $3.89 $3.26 $3.62 $3.62 $2.97 $3.71 $3.61 $3.53 $3.47 $3.47 $3.47 $5.37 $5.06 $3.08 $3.32 $2.90 $3.08 $3.19 $3.62 $4.24 $4.35 $3.84 $4.49 $4.61 $3.49 $3.07 $2.89 $3.21 $2.74 $2.77 $3.24 $2.66 $2.66 $2.66 $2.48 $2.59 $2.65 $2.74 $3.66 $3.87 $3.08 $2.45 $2.14 $2.89 $2.05 $2.16 $ — 8.0%—9.0% WACC 4.5%—6.5% Terminal Yield Range: 2026E EBITDA Perpetuity Growth 2022E EBITDA 2023E EBITDA 2021E EBITDA Equity Cost Equity Cost 13.6% -Multiple of Rate of 8.0x—10.0x 7.0x—9.0x 8.5x—10.5x of Capital of of Capital of 17.7% 8.0x—10.0x 0.0%—2.0% 9.5%—11.5% 8.0%—10.0% Note: Assumes conversion ratio of 2.5000x 1. Assumes 1.30x total coverage on distributions to Common Units and Series A Preferred Units 2. Assumes midpoint of 10.5%—12.5% WACC on the incremental projected cash flows from Stage 2 projects 3. Assumes midpoint 11.5%—13.5% WACC on the incremental projected cash flows from Stage 2+ projects 4. Assumes a terminal yield of 8.5% using the relevant midpoint for cost of equity 48


[***] = Certain information has been excluded from this exhibit because it is both not material and would likely

cause harm to the company if publicly disclosed.


LOGO

Preliminary Draft – Confidential BKEP Series A Preferred Units (BKEPP) Overview Valuation Summary – Unit Price Assumed Series A Preferred Units Convert at 2.3000x For Reference Only Discounted Cash Flow Analysis Peer Group Trading Analysis Discounted Distributions Analysis Precedent M&A Premiums Analysis Paid EBITDA Exit Multiple Perpetuity Growth 2022E 2023E CAPM Expected Market Return Analysis $15.00 BKEP Financial Projections Proposed Consideration: $3.32 per Unit BKEP Financial Projections – Stage 2 BKEP Financial Projections – Stage 2+ BKEP Unit Price as of October 8, 2021: $3.07 BKEP Financial Projections – 1.3x Coverage Sensitivity1 Stage 2 and Stage 2+ assume: a) growth projects achieved b) growth projects are funded with debt such Incremental Stage 2 Sensitivity2 that BKEP net debt / EBITDA does not exceed 3.5x in Incremental Stage 2+ Sensitivity3 any period and c) BKEP targets total coverage $10.00 (including common and preferred distributions) of 1.3x Incremental Stage 2 DDM Sensitivity4 Incremental Stage 2+ DDM Sensitivity4 $8.16 $7.67 $6.41 $6.82 $5.79 $4.37 $5.44 $5.00 $4.85 $4.23 $4.34 $4.70 $4.63 $4.41 $3.99 $4.03 $4.03 $3.94 $3.44 $3.82 $3.82 $3.13 $5.66 $3.66 $3.66 $3.66 $5.33 $3.71 $2.90 $4.58 $3.08 $4.75 $4.86 $3.32 $4.48 $3.43 $3.56 $3.56 $3.81 $4.04 $4.09 $3.49 $3.07 $3.22 $2.90 $2.92 $3.42 $3.87 $2.76 $2.89 $2.80 $2.90 $2.81 $2.81 $2.81 $3.42 $2.59 $2.26 $2.05 $2.16 $3.22    $ — 8.0%—9.0% WACC 4.5%—6.5% Terminal Yield Range: 2026E EBITDA Perpetuity Growth 2022E EBITDA 2023E EBITDA 2021E EBITDA Equity Cost Equity Cost 13.6% -Multiple of Rate of 8.0x—10.0x 7.0x—9.0x 8.5x—10.5x of Capital of of Capital of 17.7% 8.0x—10.0x 0.0%—2.0% 9.5%—11.5% 8.0%—10.0% Note: Assumes conversion ratio of 2.3000x 1. Assumes 1.30x total coverage on distributions to Common Units and Series A Preferred Units 2. Assumes midpoint of 10.5%—12.5% WACC on the incremental projected cash flows from Stage 2 projects 3. Assumes midpoint 11.5%—13.5% WACC on the incremental projected cash flows from Stage 2+ projects 4. Assumes a terminal yield of 8.5% using the relevant midpoint for cost of equity 49


[***] = Certain information has been excluded from this exhibit because it is both not material and would likely

cause harm to the company if publicly disclosed.


LOGO

Preliminary Draft – Confidential BKEP Series A Preferred Units (BKEPP) Overview A BKEP Preferred Conversion—Accretion / Dilution ($ in millions, except per unit amounts) ï® Assumes Series A Preferred Units Convert at 2.7068x based on October 8, 2021 Closing Prices 2022E 2023E 2024E 2025E 2026E Adjusted EBITDA $53 $54 $56 $58 $60 Less: Cash Interest Expense (3) (3) (3) (3) (2) Less: Taxes (0) (0) (0) (0) (0) Less: Maintenance Capex (6) (6) (6) (6) (6) Less: Distributions to Preferred (25) (25) (25) (25) (25) Plus: Distributions to Preferred 25 25 25 25 25 Distributable Cash Flow $44 $45 $46 $49 $51 Distributed Cash Flow Common LP Units $22 $22 $22 $22 $22 GP 0 0 0 0 0 Distributed Cash Flow $22 $22 $23 $23 $23 Weighted Average LP Units Outstanding Average LP Units Outstanding 44 44 45 46 47 Incremental LP Units Issued 93 93 93 93 93 Pro Forma LP Units Outstanding 137 138 138 139 140 Standalone DCF / LP Unit $0.42 $0.44 $0.47 $0.50 $0.54 Pro Forma DCF / LP Unit 0.31 0.32 0.33 0.34 0.36 DCF Accretion / (Dilution)—$ ($0.11) ($0.12) ($0.14) ($0.16) ($0.18) DCF Accretion / (Dilution)—% (25.3%) (27.3%) (29.3%) (31.9%) (33.7%) Standalone Distribution / LP Unit $0.16 $0.16 $0.16 $0.16 $0.16 Pro Forma Distribution / LP Unit 0.16 0.16 0.16 0.16 0.16 Distribution Accretion / (Dilution)—$ $— $— $— $— $—Distribution Accretion / (Dilution)—% —% —% —% —% —% Standalone LP Coverage 2.65x 2.80x 2.95x 3.18x 3.45x Pro Forma LP Coverage 1.98 2.03 2.08 2.16 2.26 Standalone Distributions / Preferred Unit $0.72 $0.72 $0.72 $0.72 $0.72 Pro Forma Distribution / Converted Preferred Unit 0.43 0.43 0.43 0.43 0.43 Preferred Distribution Accretion / (Dilution)—$ ($0.28) ($0.28) ($0.28) ($0.28) ($0.28) Preferred Distribution Accretion / (Dilution)—% (39.4%) (39.4%) (39.4%) (39.4%) (39.4%) Standalone Distributions to Ergon $15.8 $15.8 $15.9 $15.9 $15.9 Pro Forma Distributions to Ergon 10.0 10.0 10.1 10.1 10.2 Ergon Distribution Accretion / (Dilution)—$ ($5.9) ($5.8) ($5.8) ($5.7) ($5.7) Ergon Distribution Accretion / (Dilution)—% (37.2%) (36.8%) (36.5%) (36.2%) (35.9%) Standalone Total Coverage—Common Only 2.62x 2.77x 2.92x 3.15x 3.41x Standalone Total Coverage—Common and Preferred 1.36 1.40 1.44 1.49 1.56 Pro Forma Total Coverage—Common Only 1.96 2.01 2.07 2.15 2.24 Source: BKEP management Note: Common LP distributions include amounts to phantom and restricted units 50


[***] = Certain information has been excluded from this exhibit because it is both not material and would likely

cause harm to the company if publicly disclosed.


LOGO

Preliminary Draft – Confidential BKEP Series A Preferred Units (BKEPP) Overview A BKEP Preferred Conversion – Sources and Uses ($ in millions, except per unit amounts) ï® Assumes Series A Preferred Units Convert at 2.7068x based on October 8, 2021 Closing Prices 2022E 2023E 2024E 2025E 2026E Sources Distributable Cash Flow Surplus / (Shortfall) $21 $23 $24 $26 $28 Asset Sales 1 -———- Total Sources $22 $23 $24 $26 $28 Uses Capital Expenditures $0 $0 $0 $0 $0 Revolver Repayment 22 24 24 36 39 Cash to Balance Sheet 0 (1) 1 0 (1) Other (1) (1) (1) (10) (10) Total Uses $22 $23 $24 $26 $28 Capital Structure BKEP Debt $78 $64 $50 $24 ($5) Less: Cash (2) (1) (2) (2) (1) BKEP Net Debt $77 $63 $48 $22 ($6) BKEP Net Debt / Adjusted EBITDA 1.45x 1.16x 0.87x 0.39x -0.10x Source: BKEP management 51


[***] = Certain information has been excluded from this exhibit because it is both not material and would likely

cause harm to the company if publicly disclosed.


LOGO

Preliminary Draft – Confidential BKEP Series A Preferred Units (BKEPP) Overview B BKEP Preferred Conversion—Accretion / Dilution ($ in millions, except per unit amounts) ï® Assumes Series A Preferred Units Convert at 2.7068x based on October 8, 2021 Closing Prices 2022E 2023E 2024E 2025E 2026E Adjusted EBITDA $57 $66 $68 $70 $73 Less: Cash Interest Expense (4) (5) (6) (6) (6) Less: Taxes (0) (0) (0) (0) (0) Less: Maintenance Capex (6) (7) (7) (7) (7) Less: Distributions to Preferred (25) (25) (25) (25) (25) Plus: Distributions to Preferred 25 25 25 25 25 Distributable Cash Flow $47 $54 $55 $57 $60 Distributed Cash Flow Common LP Units $36 $41 $42 $44 $45 GP 1 1 1 1 1 Distributed Cash Flow $36 $42 $42 $44 $46 Weighted Average LP Units Outstanding Average LP Units Outstanding 44 44 45 46 47 Incremental LP Units Issued 93 93 93 93 93 Pro Forma LP Units Outstanding 137 138 138 139 140 Standalone DCF / LP Unit $0.50 $0.62 $0.62 $0.65 $0.68 Pro Forma DCF / LP Unit 0.34 0.39 0.39 0.41 0.42 DCF Accretion / (Dilution)—$ ($0.16) ($0.23) ($0.23) ($0.25) ($0.26) DCF Accretion / (Dilution)—% (31.9%) (37.4%) (37.3%) (37.9%) (37.8%) Standalone Distribution / LP Unit $0.17 $0.25 $0.37 $0.38 $0.41 Pro Forma Distribution / LP Unit¹ 0.26 0.30 0.30 0.31 0.32 Distribution Accretion / (Dilution)—$ $0.09 $0.05 ($0.07) ($0.07) ($0.09) Distribution Accretion / (Dilution)—% 52.7% 18.8% (18.8%) (17.8%) (21.3%) Standalone LP Coverage 2.00x 1.76x 1.73x 1.70x 1.66x Pro Forma LP Coverage 1.31 1.31 1.31 1.30 1.31 Standalone Distributions / Preferred Unit $0.72 $0.72 $0.72 $0.72 $0.72 Pro Forma Distribution / Converted Preferred Unit 0.70 0.80 0.81 0.85 0.87 Preferred Distribution Accretion / (Dilution)—$ ($0.01) $0.09 $0.10 $0.13 $0.16 Preferred Distribution Accretion / (Dilution)—% (1.7%) 12.5% 13.7% 18.3% 22.1% Standalone Distributions to Ergon $16.2 $16.6 $16.7 $16.8 $17.0 Pro Forma Distributions to Ergon 16.1 18.6 18.9 19.8 20.5 Ergon Distribution Accretion / (Dilution)—$ ($0.0) $2.0 $2.2 $3.0 $3.5 Ergon Distribution Accretion / (Dilution)—% (0.1%) 11.9% 13.3% 17.6% 20.9% Standalone Total Coverage—Common Only 1.99x 1.75x 1.72x 1.69x 1.65x Standalone Total Coverage—Common and Preferred 1.30 1.30 1.30 1.30 1.30 Pro Forma Total Coverage—Common Only 1.30 1.30 1.30 1.30 1.30 Source: BKEP management Note: Common LP distributions include amounts to phantom and restricted units. 1. Distributions solved for to maintain 1.30x total coverage ratio 52


[***] = Certain information has been excluded from this exhibit because it is both not material and would likely

cause harm to the company if publicly disclosed.


LOGO

Preliminary Draft – Confidential BKEP Series A Preferred Units (BKEPP) Overview B BKEP Preferred Conversion – Sources and Uses ($ in millions, except per unit amounts) ï® Assumes Series A Preferred Units Convert at 2.7068x based on October 8, 2021 Closing Prices 2022E 2023E 2024E 2025E 2026E Sources Distributable Cash Flow Surplus / (Shortfall) $11 $13 $13 $13 $14 Asset Sales 1 -———- Total Sources $12 $13 $13 $13 $14 Uses Capital Expenditures $59 $0 $0 $0 $0 Revolver Repayment (71) 13 14 24 23 Cash to Balance Sheet 0 0 (1) (0) 1 Asset Acquisitions 26 -———-Other (2) (1) (1) (11) (11) Total Uses $12 $13 $13 $13 $14 Capital Structure BKEP Debt $171 $158 $144 $120 $97 Less: Cash (1) (2) (1) (1) (2) BKEP Net Debt $170 $156 $143 $119 $95 BKEP Net Debt / Adjusted EBITDA 2.96x 2.37x 2.10x 1.69x 1.31x Source: BKEP management 53


[***] = Certain information has been excluded from this exhibit because it is both not material and would likely

cause harm to the company if publicly disclosed.


LOGO

Preliminary Draft – Confidential BKEP Series A Preferred Units (BKEPP) Overview C BKEP Preferred Conversion—Accretion / Dilution ($ in millions, except per unit amounts) ï® Assumes Series A Preferred Units Convert at 2.7068x based on October 8, 2021 Closing Prices 2022E 2023E 2024E 2025E 2026E Adjusted EBITDA $57 $75 $83 $91 $98 Less: Cash Interest Expense (4) (7) (11) (13) (15) Less: Taxes (0) (0) (0) (0) (0) Less: Maintenance Capex (6) (8) (9) (10) (11) Less: Distributions to Preferred (25) (25) (25) (25) (25) Plus: Distributions to Preferred 25 25 25 25 25 Distributable Cash Flow $47 $60 $63 $68 $73 Distributed Cash Flow Common LP Units $36 $45 $48 $52 $55 GP 1 1 1 1 1 Distributed Cash Flow $36 $46 $49 $52 $56 Weighted Average LP Units Outstanding Average LP Units Outstanding 44 44 45 46 47 Incremental LP Units Issued 93 93 93 93 93 Pro Forma LP Units Outstanding 137 138 138 139 140 Standalone DCF / LP Unit $0.50 $0.70 $0.73 $0.77 $0.81 Pro Forma DCF / LP Unit 0.34 0.43 0.45 0.48 0.51 DCF Accretion / (Dilution)—$ ($0.16) ($0.27) ($0.28) ($0.29) ($0.30) DCF Accretion / (Dilution)—% (31.9%) (38.5%) (38.1%) (37.7%) (37.3%) Standalone Distribution / LP Unit $0.17 $0.25 $0.47 $0.52 $0.57 Pro Forma Distribution / LP Unit¹ 0.26 0.33 0.35 0.37 0.39 Distribution Accretion / (Dilution)—$ $0.09 $0.08 ($0.12) ($0.15) ($0.18) Distribution Accretion / (Dilution)—% 52.9% 32.0% (26.1%) (28.2%) (31.1%) Standalone LP Coverage 2.00x 1.66x 1.63x 1.59x 1.56x Pro Forma LP Coverage 1.31 1.31 1.30 1.30 1.31 Standalone Distributions / Preferred Unit $0.72 $0.72 $0.72 $0.72 $0.72 Pro Forma Distribution / Converted Preferred Unit 0.70 0.89 0.94 1.00 1.06 Preferred Distribution Accretion / (Dilution)—$ ($0.01) $0.18 $0.23 $0.29 $0.35 Preferred Distribution Accretion / (Dilution)—% (1.6%) 24.9% 31.6% 40.1% 48.6% Standalone Distributions to Ergon $16.2 $17.0 $17.3 $18.1 $19.2 Pro Forma Distributions to Ergon 16.2 20.6 21.9 23.4 25.0 Ergon Distribution Accretion / (Dilution)—$ $0.0 $3.6 $4.6 $5.3 $5.7 Ergon Distribution Accretion / (Dilution)—% 0.1% 21.4% 26.3% 29.1% 29.8% Standalone Total Coverage—Common Only 1.99x 1.65x 1.61x 1.57x 1.52x Standalone Total Coverage—Common and Preferred 1.30 1.30 1.30 1.30 1.29 Pro Forma Total Coverage—Common Only 1.30 1.30 1.30 1.30 1.30 Source: BKEP management Note: Common LP distributions include amounts to phantom and restricted units. 1. Distributions solved for to maintain 1.30x total coverage ratio 54


[***] = Certain information has been excluded from this exhibit because it is both not material and would likely

cause harm to the company if publicly disclosed.


LOGO

Preliminary Draft – Confidential BKEP Series A Preferred Units (BKEPP) Overview C BKEP Preferred Conversion – Sources and Uses ($ in millions, except per unit amounts) ï® Assumes Series A Preferred Units Convert at 2.7068x based on October 8, 2021 Closing Prices 2022E 2023E 2024E 2025E 2026E Sources Distributable Cash Flow Surplus / (Shortfall) $11 $14 $15 $16 $17 Asset Sales 1 -———- Total Sources $12 $14 $15 $16 $17 Uses Capital Expenditures $59 $100 $50 $50 $50 Revolver Repayment (71) (84) (34) (24) (22) Cash to Balance Sheet 0 (0) (0) 1 (0) Asset Acquisitions 26 -———-Other (2) (2) (2) (11) (12) Total Uses $12 $14 $15 $16 $16 Capital Structure BKEP Debt $171 $255 $289 $313 $335 Less: Cash (1) (1) (1) (2) (1) BKEP Net Debt $170 $254 $288 $311 $334 BKEP Net Debt / Adjusted EBITDA 2.96x 3.39x 3.45x 3.44x 3.41x Source: BKEP management 55


[***] = Certain information has been excluded from this exhibit because it is both not material and would likely

cause harm to the company if publicly disclosed.


LOGO

Preliminary Draft – Confidential BKEP Series A Preferred Units (BKEPP) Overview A B BKEP Preferred Conversion—Accretion / Dilution Scenario Analysis C 2022E 2023E 2024E 2025E 2026E BKEP Financial Projections 2.7068x Conversion Ratio DCF/LP Unit Accretion / (Dilution)—$ | % ($0.11) | (25.3%) ($0.12) | (27.3%) ($0.14) | (29.3%) ($0.16) | (31.9%) ($0.18) | (33.7%) Distribution/LP Unit Accretion / (Dilution)—$ | % $— | —% $— | —% $— | —% $— | —% $— | —% Preferred Unitholder Distribution Accretion / (Dilution)—$ | % ($0.28) | (39.4%) ($0.28) | (39.4%) ($0.28) | (39.4%) ($0.28) | (39.4%) ($0.28) | (39.4%) 2.5000x Conversion Ratio DCF/LP Unit Accretion / (Dilution)—$ | % ($0.09) | (21.2%) ($0.10) | (23.4%) ($0.12) | (25.5%) ($0.14) | (28.2%) ($0.16) | (30.2%) Distribution/LP Unit Accretion / (Dilution)—$ | % $— | —% $— | —% $— | —% $— | —% $— | —% Preferred Unitholder Distribution Accretion / (Dilution)—$ | % ($0.32) | (44.1%) ($0.32) | (44.1%) ($0.32) | (44.1%) ($0.32) | (44.1%) ($0.32) | (44.1%) 2.3000x Conversion Ratio DCF/LP Unit Accretion / (Dilution)—$ | % ($0.07) | (16.8%) ($0.08) | (19.1%) ($0.10) | (21.4%) ($0.12) | (24.3%) ($0.14) | (26.3%) Distribution/LP Unit Accretion / (Dilution)—$ | % $— | —% $— | —% $— | —% $— | —% $— | —% Preferred Unitholder Distribution Accretion / (Dilution)—$ | % ($0.35) | (48.5%) ($0.35) | (48.5%) ($0.35) | (48.5%) ($0.35) | (48.5%) ($0.35) | (48.5%) BKEP Financial Projections—Stage 2 2.7068x Conversion Ratio DCF/LP Unit Accretion / (Dilution)—$ | % ($0.16) | (31.9%) ($0.23) | (37.4%) ($0.23) | (37.3%) ($0.25) | (37.9%) ($0.26) | (37.8%) Distribution/LP Unit Accretion / (Dilution)—$ | % $0.09 | 52.7% $0.05 | 18.8% ($0.07) | (18.8%) ($0.07) | (17.8%) ($0.09) | (21.3%) Preferred Unitholder Distribution Accretion / (Dilution)—$ | % ($0.01) | (1.7%) $0.09 | 12.5% $0.10 | 13.7% $0.13 | 18.3% $0.16 | 22.1% 2.5000x Conversion Ratio DCF/LP Unit Accretion / (Dilution)—$ | % ($0.14) | (28.2%) ($0.21) | (34.0%) ($0.21) | (33.9%) ($0.23) | (34.6%) ($0.23) | (34.4%) Distribution/LP Unit Accretion / (Dilution)—$ | % $0.11 | 61.8% $0.07 | 26.0% ($0.05) | (14.2%) ($0.05) | (13.8%) ($0.07) | (17.1%) Preferred Unitholder Distribution Accretion / (Dilution)—$ | % ($0.03) | (3.8%) $0.07 | 10.1% $0.08 | 11.0% $0.10 | 14.5% $0.14 | 18.9% 2.3000x Conversion Ratio DCF/LP Unit Accretion / (Dilution)—$ | % ($0.12) | (24.2%) ($0.19) | (30.3%) ($0.19) | (30.3%) ($0.20) | (31.0%) ($0.21) | (30.8%) Distribution/LP Unit Accretion / (Dilution)—$ | % $0.12 | 70.6% $0.08 | 33.0% ($0.04) | (9.5%) ($0.03) | (8.6%) ($0.05) | (12.2%) Preferred Unitholder Distribution Accretion / (Dilution)—$ | % ($0.05) | (6.7%) $0.05 | 7.0% $0.06 | 7.8% $0.08 | 11.8% $0.11 | 15.8% BKEP Financial Projections—Stage 2+ 2.7068x Conversion Ratio DCF/LP Unit Accretion / (Dilution)—$ | % ($0.16) | (31.9%) ($0.27) | (38.5%) ($0.28) | (38.1%) ($0.29) | (37.7%) ($0.30) | (37.3%) Distribution/LP Unit Accretion / (Dilution)—$ | % $0.09 | 52.9% $0.08 | 32.0% ($0.12) | (26.1%) ($0.15) | (28.2%) ($0.18) | (31.1%) Preferred Unitholder Distribution Accretion / (Dilution)—$ | % ($0.01) | (1.6%) $0.18 | 24.9% $0.23 | 31.6% $0.29 | 40.1% $0.35 | 48.6% 2.5000x Conversion Ratio DCF/LP Unit Accretion / (Dilution)—$ | % ($0.14) | (28.1%) ($0.25) | (35.1%) ($0.25) | (34.8%) ($0.26) | (34.4%) ($0.28) | (34.4%) Distribution/LP Unit Accretion / (Dilution)—$ | % $0.11 | 61.8% $0.10 | 39.0% ($0.11) | (22.3%) ($0.13) | (24.3%) ($0.16) | (27.2%) Preferred Unitholder Distribution Accretion / (Dilution)—$ | % ($0.03) | (3.8%) $0.15 | 21.5% $0.20 | 27.6% $0.26 | 36.4% $0.32 | 45.1% 2.3000x Conversion Ratio DCF/LP Unit Accretion / (Dilution)—$ | % ($0.12) | (24.1%) ($0.22) | (31.5%) ($0.23) | (31.2%) ($0.24) | (31.2%) ($0.26) | (31.5%) Distribution/LP Unit Accretion / (Dilution)—$ | % $0.12 | 70.6% $0.12 | 47.0% ($0.09) | (18.1%) ($0.11) | (20.4%) ($0.13) | (23.2%) Preferred Unitholder Distribution Accretion / (Dilution)—$ | % ($0.05) | (6.7%) $0.13 | 18.2% $0.17 | 23.8% $0.23 | 31.9% $0.29 | 40.7% 56


[***] = Certain information has been excluded from this exhibit because it is both not material and would likely

cause harm to the company if publicly disclosed.


LOGO

Preliminary Draft – Confidential Appendix


[***] = Certain information has been excluded from this exhibit because it is both not material and would likely

cause harm to the company if publicly disclosed.


LOGO

Preliminary Draft – Confidential Weighted Average Cost of Capital Analysis


[***] = Certain information has been excluded from this exhibit because it is both not material and would likely

cause harm to the company if publicly disclosed.


LOGO

Preliminary Draft – Confidential Weighted Average Cost of Capital Analysis BKEP WACC Analysis – Theoretical Capital Asset Pricing Model ($ in millions, except per unit amounts) Unit/Share Price Market Equity Total Debt and Total Debt / Adjusted Unlevered 1 2 Partnership/Corporation 11/5/21 Value Preferred Equity Total Capitalization Beta Beta Delek Logistics Partners, LP $46.84 $2,035.6 $901.4 30.7% 1.15 0.88 Genesis Energy, L.P. 11.50 1,409.7 4,149.7 60.4% 1.50 0.49 Global Partners LP 22.74 778.3 1,174.7 53.0% 0.86 0.42 Holly Energy Partners, L.P. 17.65 2,236.8 1,665.5 42.7% 0.56 0.37 Martin Midstream Partners L.P. 3.14 124.7 554.5 81.6% 0.94 0.23 NuStar Energy L.P. 15.46 1,729.9 4,768.4 52.4% 1.00 0.34 CAPM PBF Logistics LP 13.57 848.4 647.1 43.3% 1.49 0.97 Sprague Resources LP 17.73 465.1 561.8 54.7% 0.43 0.23 Sunoco LP 39.70 3,960.6 2,957.0 42.7% 1.05 0.69 USD Partners LP 5.86 162.2 174.0 51.7% 0.82 0.47 Mean 51.3% 0.98 0.51 Median 52.1% 0.97 0.44 Blueknight Energy Partners, L.P.³ $3.36 $147.0 $398.6 20.3% 0.88 0.30 Risk-free Rate 4 1.9% Unlevered Beta 0.44 Supply-Side MRP WACC Sensitivity Debt / Total Capitalization 20.3% Preferred / Total Capitalization 52.7% Debt + Preferred / Debt and Preferred / Total Capitalization 73.1% Total Cap Unlevered Beta Adjusted Levered Equity Beta 0.52 WACC Supply-Side MRP Historical MRP 8.1% 0.34 0.39 0.44 0.49 0.54 63.1% 8.8% 8.9% 9.1% 9.2% 9.3% Market Risk Premium 5 6.0% 7.3% 68.1% 8.3% 8.5% 8.6% 8.7% 8.8% Small Company Risk Premium 6 5.0% 73.1% 7.9% 8.0% 8.1% 8.2% 8.3% Equity Cost of Capital 7 10.0% 10.7% 78.1% 7.4% 7.5% 7.6% 7.6% 7.7% Preferred Equity Cost of Capital 8 8.5% 83.1% 6.9% 7.0% 7.1% 7.1% 7.2% Pre-Tax Cost of Debt 6.2% Historical MRP WACC Sensitivity After-Tax Cost of Debt 9 4.3% Debt + Preferred / WACC 8.1% 8.2% Total Cap Unlevered Beta Note: Capital structure includes effect of dilutive securities and GP interest 8.2% 0.34 0.39 0.44 0.49 0.54 1. Source: Predicted raw betas from FactSet; Adjusted Equity Beta calculated as: (0.67) × Raw Beta + (0.33) × 1.0 2. Unlevered Beta calculated as: Adjusted Equity Beta × (E/(E + D × (1-T)); Assumes corporate tax rate of 29.6% 63.1% 9.0% 9.2% 9.3% 9.5% 9.6% 3. Preferred equity value determined using market price as of November 5, 2021 68.1% 8.5% 8.6% 8.8% 8.9% 9.0% 4. 20-year Treasury as of November 5, 2021 73.1% 8.0% 8.1% 8.2% 8.4% 8.5% 5. Source: Duff & Phelps 6. Decile: Micro Cap (10) with equity value range of $2.2 million to $189.8 million 78.1% 7.5% 7.6% 7.7% 7.8% 7.9% 7. Equity Cost of Capital calculated as: Risk-free rate + (Levered Equity Beta × Market Risk Premium) + Small Company Risk P 83.1% 7.0% 7.1% 7.2% 7.2% 7.3% 8. Based upon the preferred equity yield 9. Based on the cost of borrowing long-term debt for non-investment grade midstream partnerships (i.e.,yield-to-worsts on long-term senior unsecured notes for each partnership) with each selected senior notes’ yield-to-worst extended to 20-years by addition of a premium for U.S. Treasury maturing November 2041 versus U.S. Treasury maturing in the same month as the maturity of each senior notes 57


[***] = Certain information has been excluded from this exhibit because it is both not material and would likely

cause harm to the company if publicly disclosed.


LOGO

Preliminary Draft – Confidential Weighted Average Cost of Capital Analysis BKEP WACC Analysis – Expected Market Return ($ in millions, except per unit amounts) Unit/Share Price Market Equity Current Common Distribution/Dividend Total Partnership/Corporation 11/5/21 Value Unit Yield Growth Return Delek Logistics Partners, LP $46.84 $2,035.6 8.1% 5.1% 13.2% Genesis Energy, L.P. 11.50 1,409.7 5.2% —% 5.2% Global Partners LP 22.74 778.3 10.1% —% 10.1% Holly Energy Partners, L.P. 17.65 2,236.8 7.9% 12.8% 20.8% Total Martin Midstream Partners L.P. 3.14 124.7 0.6% —% 0.6% Expected NuStar Energy L.P. 15.46 1,729.9 10.3% —% 10.3% Market PBF Logistics LP 13.57 848.4 8.8% —% 8.8% Return Sprague Resources LP 17.73 465.1 9.8% (45.7%) (35.9%) Sunoco LP 39.70 3,960.6 8.3% (0.0%) 8.3% USD Partners LP 5.86 162.2 8.1% 52.7% 60.8% Mean 10.2% Median 9.5% Blueknight Energy Partners, L.P. $3.36 $147.0 4.8% —% 4.8% WACC Debt / Total Capitalization 20.3% Preferred / Total Capitalization 52.7% Debt and Preferred / Total Capitalization 73.1% Market Required Equity Return 9.5% Preferred Equity Cost of Capital 8.5% WACC Pre-Tax Cost of Debt¹ 6.2% After-Tax Cost of Debt 4.3% WACC 7.9% Note: Capital structure includes effect of dilutive securities and GP interest 1. Based on the cost of borrowing long-term debt for non-investment grade midstream partnerships (i.e.,yield-to-worsts on long-term senior unsecured notes for each partnership) with each selected senior notes’ yield-to-worst extended to 20-years by addition of a premium for U.S. Treasury maturing November 2041 versus U.S. Treasury maturing in the same month as the maturity of each senior notes 58    


[***] = Certain information has been excluded from this exhibit because it is both not material and would likely

cause harm to the company if publicly disclosed.