Exhibit 99.(C)(4)
Preliminary Draft – Confidential Tax Analysis Regarding Project Thunder November 15, 2021
Exhibit 99.(C)(4)
Preliminary Draft – Confidential Tax Analysis Regarding Project Thunder November 15, 2021
Preliminary Draft – Confidential These materials have been prepared by Evercore Group L.L.C. (“Evercore”) for the Conflicts Committee (the “Conflicts Committee”) of the Board of Directors of Blueknight Energy Partners G.P., LLC, the general partner of Blueknight Energy Partners, L.P. (the “Partnership”), to whom such materials are directly addressed and delivered and may not be used or relied upon for any purpose other than as specifically contemplated by a written agreement with Evercore. These materials are based on information provided by or on behalf of the Conflicts Committee, from public sources or otherwise reviewed by Evercore. Evercore assumes no responsibility for independent investigation or verification of such information and has relied on such information being complete and accurate in all material respects. To the extent such information includes estimates and forecasts of future financial performance prepared by or reviewed with the management of the Partnership and/or other potential transaction participants or obtained from public sources, Evercore has assumed that such estimates and forecasts have been reasonably prepared on bases reflecting the best currently available estimates and judgments of such management (or, with respect to estimates and forecasts obtained from public sources, represent reasonable estimates). No representation or warranty, express or implied, is made as to the accuracy or completeness of such information and nothing contained herein is, or shall be relied upon as, a representation, whether as to the past, the present or the future. These materials were designed for use by specific persons familiar with the business and affairs of the Partnership. These materials are not intended to provide the sole basis for evaluating, and should not be considered a recommendation with respect to, any transaction or other matter. These materials have been developed by and are proprietary to Evercore and were prepared exclusively for the benefit and internal use of the Conflicts Committee. These materials were compiled on a confidential basis for use by the Conflicts Committee and not with a view to public disclosure or filing thereof under state or federal securities laws, and may not be reproduced, disseminated, quoted or referred to, in whole or in part, without the prior written consent of Evercore. These materials do not constitute an offer or solicitation to sell or purchase any securities and are not a commitment by Evercore or any of its affiliates to provide or arrange any financing for any transaction or to purchase any security in connection therewith. Evercore assumes no obligation to update or otherwise revise these materials. These materials may not reflect information known to other professionals in other business areas of Evercore and its affiliates. Evercore and its affiliates do not provide legal, accounting or tax advice. Accordingly, any statements contained herein as to tax matters were neither written nor intended by Evercore or its affiliates to be used and cannot be used by any taxpayer for the purpose of avoiding tax penalties that may be imposed on such taxpayer. Each person should seek legal, accounting and tax advice based on his, her or its particular circumstances from independent advisors regarding the impact of the transactions or matters described herein.
Preliminary Draft – Confidential Table of Contents Section BKEP Common Unit Tax Analysis I BKEP Preferred Unit Tax Analysis II

Preliminary Draft – Confidential I. BKEP Common Unit Tax Analysis
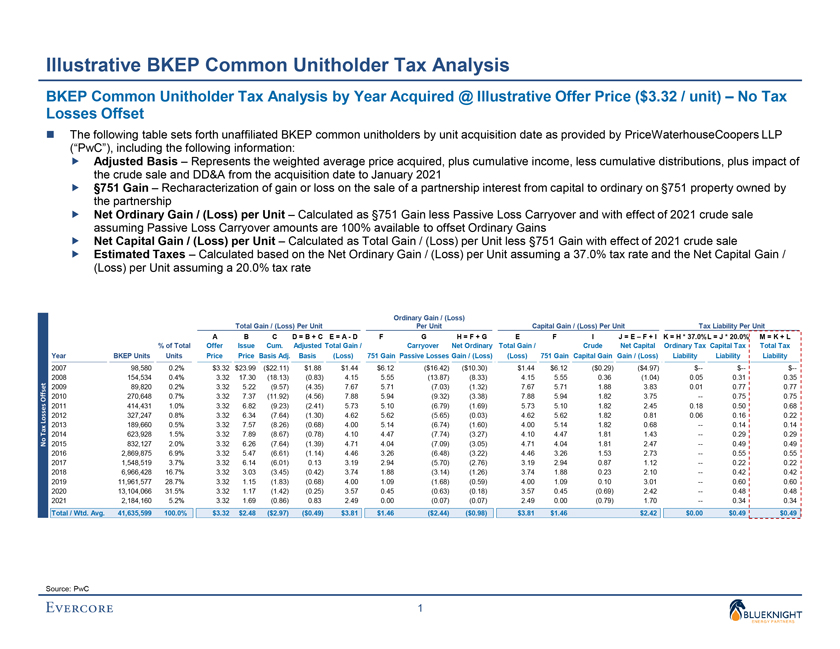
Preliminary Draft – Confidential Illustrative BKEP Common Unitholder Tax Analysis BKEP Common Unitholder Tax Analysis by Year Acquired @ Illustrative Offer Price ($3.32 / unit) – No Tax Losses Offset ∎ The following table sets forth unaffiliated BKEP common unitholders by unit acquisition date as provided by PriceWaterhouseCoopers LLP (“PwC”), including the following information: ï,„ Adjusted Basis – Represents the weighted average price acquired, plus cumulative income, less cumulative distributions, plus impact of the crude sale and DD&A from the acquisition date to January 2021ï,„ §751 Gain – Recharacterization of gain or loss on the sale of a partnership interest from capital to ordinary on §751 property owned by the partnershipï,„ Net Ordinary Gain / (Loss) per Unit – Calculated as §751 Gain less Passive Loss Carryover and with effect of 2021 crude sale assuming Passive Loss Carryover amounts are 100% available to offset Ordinary Gainsï,„ Net Capital Gain / (Loss) per Unit – Calculated as Total Gain / (Loss) per Unit less §751 Gain with effect of 2021 crude saleï,„ Estimated Taxes – Calculated based on the Net Ordinary Gain / (Loss) per Unit assuming a 37.0% tax rate and the Net Capital Gain / (Loss) per Unit assuming a 20.0% tax rate Ordinary Gain / (Loss) Total Gain / (Loss) Per Unit Per Unit Capital Gain / (Loss) Per Unit Tax Liability Per Unit A B C D = B + C E = A—D F G H = F + G E F I J = E – F + I K = H * 37.0%L = J * 20.0% M = K + L % of Total Offer Issue Cum. Adjusted Total Gain / Carryover Net Ordinary Total Gain / Crude Net Capital Ordinary Tax Capital Tax Total Tax Year BKEP Units Units Price Price Basis Adj. Basis (Loss) 751 Gain Passive Losses Gain / (Loss) (Loss) 751 Gain Capital Gain Gain / (Loss) Liability Liability Liability 2007 98,580 0.2% $3.32 $23.99 ($22.11) $1.88 $1.44 $6.12 ($16.42) ($10.30) $1.44 $6.12 ($0.29) ($4.97) $— $— $—2008 154,534 0.4% 3.32 17.30 (18.13) (0.83) 4.15 5.55 (13.87) (8.33) 4.15 5.55 0.36 (1.04) 0.05 0.31 0.35 2009 89,820 0.2% 3.32 5.22 (9.57) (4.35) 7.67 5.71 (7.03) (1.32) 7.67 5.71 1.88 3.83 0.01 0.77 0.77 2010 270,648 0.7% 3.32 7.37 (11.92) (4.56) 7.88 5.94 (9.32) (3.38) 7.88 5.94 1.82 3.75 — 0.75 0.75 2011 414,431 1.0% 3.32 6.82 (9.23) (2.41) 5.73 5.10 (6.79) (1.69) 5.73 5.10 1.82 2.45 0.18 0.50 0.68 2012 327,247 0.8% 3.32 6.34 (7.64) (1.30) 4.62 5.62 (5.65) (0.03) 4.62 5.62 1.82 0.81 0.06 0.16 0.22 2013 189,660 0.5% 3.32 7.57 (8.26) (0.68) 4.00 5.14 (6.74) (1.60) 4.00 5.14 1.82 0.68 — 0.14 0.14 2014 623,928 1.5% 3.32 7.89 (8.67) (0.78) 4.10 4.47 (7.74) (3.27) 4.10 4.47 1.81 1.43 — 0.29 0.29 2015 832,127 2.0% 3.32 6.26 (7.64) (1.39) 4.71 4.04 (7.09) (3.05) 4.71 4.04 1.81 2.47 — 0.49 0.49 2016 2,869,875 6.9% 3.32 5.47 (6.61) (1.14) 4.46 3.26 (6.48) (3.22) 4.46 3.26 1.53 2.73 — 0.55 0.55 2017 1,548,519 3.7% 3.32 6.14 (6.01) 0.13 3.19 2.94 (5.70) (2.76) 3.19 2.94 0.87 1.12 — 0.22 0.22 2018 6,966,428 16.7% 3.32 3.03 (3.45) (0.42) 3.74 1.88 (3.14) (1.26) 3.74 1.88 0.23 2.10 — 0.42 0.42 2019 11,961,577 28.7% 3.32 1.15 (1.83) (0.68) 4.00 1.09 (1.68) (0.59) 4.00 1.09 0.10 3.01 — 0.60 0.60 2020 13,104,066 31.5% 3.32 1.17 (1.42) (0.25) 3.57 0.45 (0.63) (0.18) 3.57 0.45 (0.69) 2.42 — 0.48 0.48 2021 2,184,160 5.2% 3.32 1.69 (0.86) 0.83 2.49 0.00 (0.07) (0.07) 2.49 0.00 (0.79) 1.70 — 0.34 0.34 Total / Wtd. Avg. 41,635,599 100.0% $3.32 $2.48 ($2.97) ($0.49) $3.81 $1.46 ($2.44) ($0.98) $3.81 $1.46 $2.42 $0.00 $0.49 $0.49 Source: PwC 1
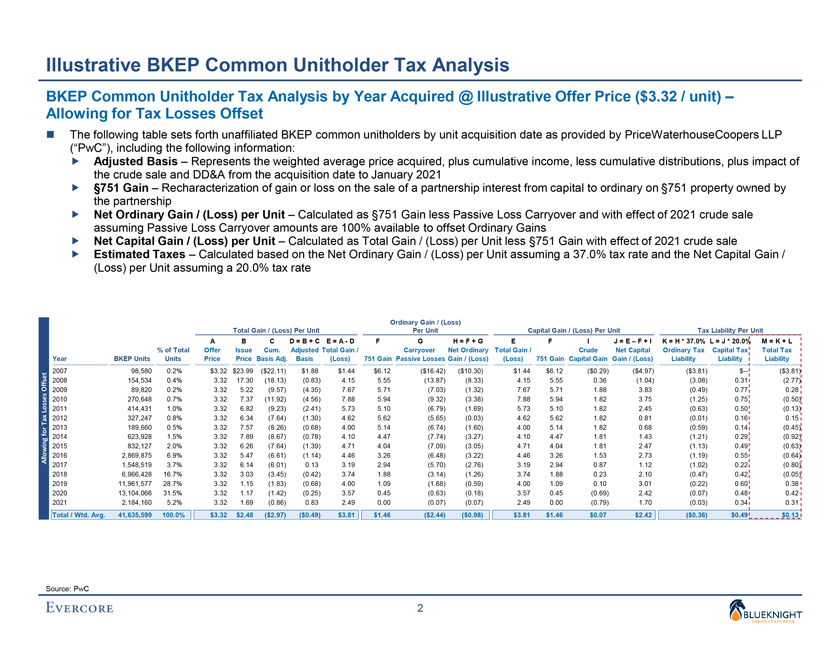
Preliminary Draft – Confidential Illustrative BKEP Common Unitholder Tax Analysis BKEP Common Unitholder Tax Analysis by Year Acquired @ Illustrative Offer Price ($3.32 / unit) –Allowing for Tax Losses Offset ∎ The following table sets forth unaffiliated BKEP common unitholders by unit acquisition date as provided by PriceWaterhouseCoopers LLP (“PwC”), including the following information: ï,„ Adjusted Basis – Represents the weighted average price acquired, plus cumulative income, less cumulative distributions, plus impact of the crude sale and DD&A from the acquisition date to January 2021ï,„ §751 Gain – Recharacterization of gain or loss on the sale of a partnership interest from capital to ordinary on §751 property owned by the partnershipï,„ Net Ordinary Gain / (Loss) per Unit – Calculated as §751 Gain less Passive Loss Carryover and with effect of 2021 crude sale assuming Passive Loss Carryover amounts are 100% available to offset Ordinary Gainsï,„ Net Capital Gain / (Loss) per Unit – Calculated as Total Gain / (Loss) per Unit less §751 Gain with effect of 2021 crude saleï,„ Estimated Taxes – Calculated based on the Net Ordinary Gain / (Loss) per Unit assuming a 37.0% tax rate and the Net Capital Gain / (Loss) per Unit assuming a 20.0% tax rate Ordinary Gain / (Loss) Total Gain / (Loss) Per Unit Per Unit Capital Gain / (Loss) Per Unit Tax Liability Per Unit A B C D = B + C E = A—D F G H = F + G E F I J = E – F + I K = H * 37.0% L = J * 20.0% M = K + L % of Total Offer Issue Cum. Adjusted Total Gain / Carryover Net Ordinary Total Gain / Crude Net Capital Ordinary Tax Capital Tax Total Tax Year BKEP Units Units Price Price Basis Adj. Basis (Loss) 751 Gain Passive Losses Gain / (Loss) (Loss) 751 Gain Capital Gain Gain / (Loss) Liability Liability Liability 2007 98,580 0.2% $3.32 $23.99 ($22.11) $1.88 $1.44 $6.12 ($16.42) ($10.30) $1.44 $6.12 ($0.29) ($4.97) ($3.81) $— ($3.81) 2008 154,534 0.4% 3.32 17.30 (18.13) (0.83) 4.15 5.55 (13.87) (8.33) 4.15 5.55 0.36 (1.04) (3.08) 0.31 (2.77) 2009 89,820 0.2% 3.32 5.22 (9.57) (4.35) 7.67 5.71 (7.03) (1.32) 7.67 5.71 1.88 3.83 (0.49) 0.77 0.28 2010 270,648 0.7% 3.32 7.37 (11.92) (4.56) 7.88 5.94 (9.32) (3.38) 7.88 5.94 1.82 3.75 (1.25) 0.75 (0.50) 2011 414,431 1.0% 3.32 6.82 (9.23) (2.41) 5.73 5.10 (6.79) (1.69) 5.73 5.10 1.82 2.45 (0.63) 0.50 (0.13) 2012 327,247 0.8% 3.32 6.34 (7.64) (1.30) 4.62 5.62 (5.65) (0.03) 4.62 5.62 1.82 0.81 (0.01) 0.16 0.15 2013 189,660 0.5% 3.32 7.57 (8.26) (0.68) 4.00 5.14 (6.74) (1.60) 4.00 5.14 1.82 0.68 (0.59) 0.14 (0.45) 2014 623,928 1.5% 3.32 7.89 (8.67) (0.78) 4.10 4.47 (7.74) (3.27) 4.10 4.47 1.81 1.43 (1.21) 0.29 (0.92) 2015 832,127 2.0% 3.32 6.26 (7.64) (1.39) 4.71 4.04 (7.09) (3.05) 4.71 4.04 1.81 2.47 (1.13) 0.49 (0.63) 2016 2,869,875 6.9% 3.32 5.47 (6.61) (1.14) 4.46 3.26 (6.48) (3.22) 4.46 3.26 1.53 2.73 (1.19) 0.55 (0.64) 2017 1,548,519 3.7% 3.32 6.14 (6.01) 0.13 3.19 2.94 (5.70) (2.76) 3.19 2.94 0.87 1.12 (1.02) 0.22 (0.80) 2018 6,966,428 16.7% 3.32 3.03 (3.45) (0.42) 3.74 1.88 (3.14) (1.26) 3.74 1.88 0.23 2.10 (0.47) 0.42 (0.05) 2019 11,961,577 28.7% 3.32 1.15 (1.83) (0.68) 4.00 1.09 (1.68) (0.59) 4.00 1.09 0.10 3.01 (0.22) 0.60 0.38 2020 13,104,066 31.5% 3.32 1.17 (1.42) (0.25) 3.57 0.45 (0.63) (0.18) 3.57 0.45 (0.69) 2.42 (0.07) 0.48 0.42 2021 2,184,160 5.2% 3.32 1.69 (0.86) 0.83 2.49 0.00 (0.07) (0.07) 2.49 0.00 (0.79) 1.70 (0.03) 0.34 0.31 Total / Wtd. Avg. 41,635,599 100.0% $3.32 $2.48 ($2.97) ($0.49) $3.81 $1.46 ($2.44) ($0.98) $3.81 $1.46 $0.07 $2.42 ($0.36) $0.49 $0.13 Source: PwC 2
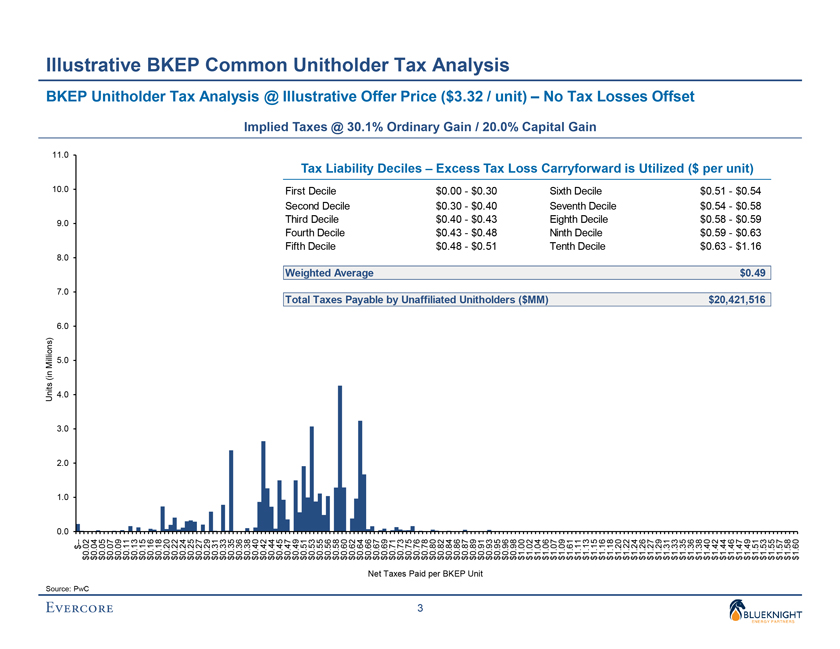
Preliminary Draft – Confidential Illustrative BKEP Common Unitholder Tax Analysis BKEP Unitholder Tax Analysis @ Illustrative Offer Price ($3.32 / unit) – No Tax Losses Offset Implied Taxes @ 30.1% Ordinary Gain / 20.0% Capital Gain 11.0 Tax Liability Deciles – Excess Tax Loss Carryforward is Utilized ($ per unit) 10.0 First Decile $0.00—$0.30 Sixth Decile $0.51—$0.54 Second Decile $0.30—$0.40 Seventh Decile $0.54—$0.58 9.0 Third Decile $0.40—$0.43 Eighth Decile $0.58—$0.59 Fourth Decile $0.43—$0.48 Ninth Decile $0.59—$0.63 Fifth Decile $0.48—$0.51 Tenth Decile $0.63—$1.16 8.0 Weighted Average $0.49 7.0 Total Taxes Payable by Unaffiliated Unitholders ($MM) $20,421,516 6.0 Millions) 5.0 in ( Units 4.0 3.0 2.0 1.0 0.0 $ — 20 27 0.020.040.050.070.090.110.130.150.160.18. 00.220.240.25. 00.290.310.330.350.360.380.400.420.440.450.470.490.510.530.550.560.580.600.620.640.660.670.690.710.730.750.760.780.800.820 ..840.860.870.890.910.930.950.960.981.001.021.041.061.071.091.611.111.131.151.161.181.201.221.241.261.271.291.311.331.351. 361.381.401.421.441.461.471.491.511.531.551.571.581.60 $$$$$$$$$$$$$$$$$$$$$$$$$$$$$$$$$$$$$$$$$$$$$$$$$$$$$$$$$$$$$$$$$$$$$$$$$$$$$$$$$$$$$$$$$ Net Taxes Paid per BKEP Unit Source: PwC 3
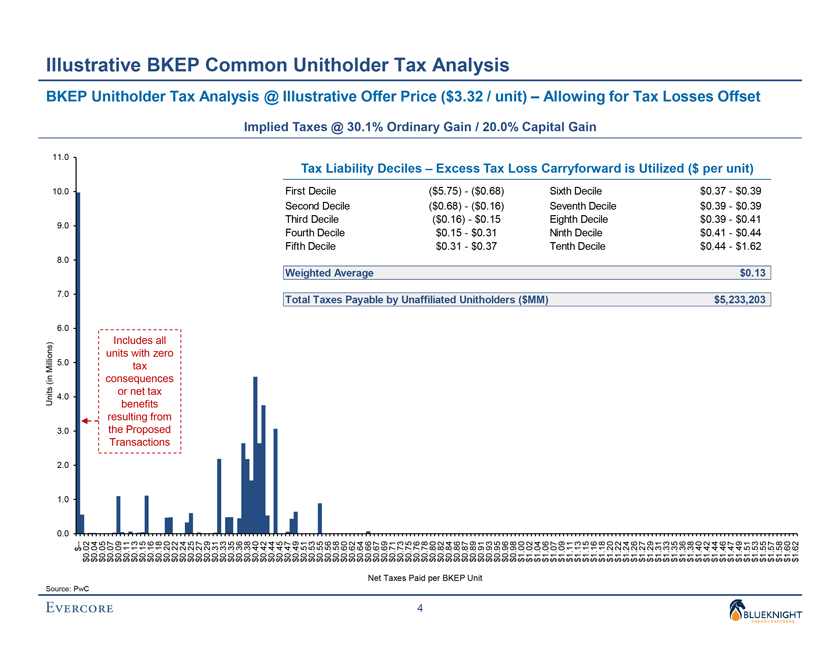
Preliminary Draft – Confidential Illustrative BKEP Common Unitholder Tax Analysis BKEP Unitholder Tax Analysis @ Illustrative Offer Price ($3.32 / unit) – Allowing for Tax Losses Offset Implied Taxes @ 30.1% Ordinary Gain / 20.0% Capital Gain 11.0 Tax Liability Deciles – Excess Tax Loss Carryforward is Utilized ($ per unit) 10.0 First Decile ($5.75)—($0.68) Sixth Decile $0.37—$0.39 Second Decile ($0.68)—($0.16) Seventh Decile $0.39—$0.39 Third Decile ($0.16)—$0.15 Eighth Decile $0.39—$0.41 9.0 Fourth Decile $0.15—$0.31 Ninth Decile $0.41—$0.44 Fifth Decile $0.31—$0.37 Tenth Decile $0.44—$1.62 8.0 Weighted Average $0.13 7.0 Total Taxes Payable by Unaffiliated Unitholders ($MM) $5,233,203 6.0 Includes all lions) units with zero 5.0 tax Mil ( in consequences or net tax Units 4.0 benefits resulting from 3.0 the Proposed Transactions 2.0 1.0 0.0 $ — 80 0.020.040.050.070.090.110.130.150.160.180.200.220.240.250.270.290.310.330.350.360.380.400.420.440.450.470.490.510.530.550.560.580.600.620.640.660.670.690.710.730.750.760.78. 00.820.840.860.870.890.910.930.950.960.981.001.021.041.061.071.091.111.131.151.161.181.201.221.241.261.271.291.311.331.351.361.381.401.421.441.461.471.491.511.531.551.571.581.601.62 $$$$$$$$$$$$$$$$$$$$$$$$$$$$$$$$$$$$$$$$$$$$$$$$$$$$$$$$$$$$$$$$$$$$$$$$$$$$$$$$$$$$$$$$$ Net Taxes Paid per BKEP Unit Source: PwC 4
Preliminary Draft – Confidential II. BKEP Preferred Unit Tax Analysis
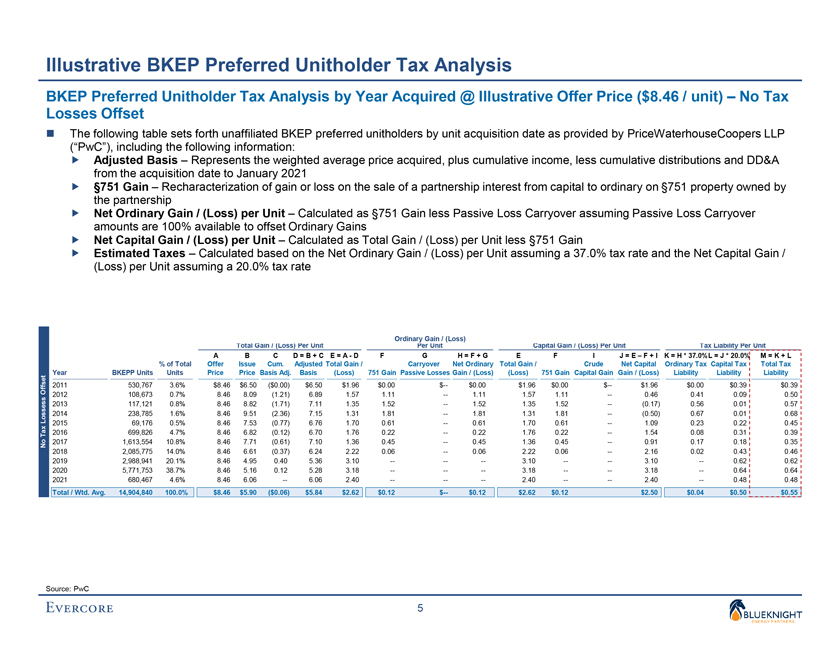
Preliminary Draft – Confidential Illustrative BKEP Preferred Unitholder Tax Analysis BKEP Preferred Unitholder Tax Analysis by Year Acquired @ Illustrative Offer Price ($8.46 / unit) – No Tax Losses Offset ∎ The following table sets forth unaffiliated BKEP preferred unitholders by unit acquisition date as provided by PriceWaterhouseCoopers LLP (“PwC”), including the following information: ï,„ Adjusted Basis – Represents the weighted average price acquired, plus cumulative income, less cumulative distributions and DD&A from the acquisition date to January 2021ï,„ §751 Gain – Recharacterization of gain or loss on the sale of a partnership interest from capital to ordinary on §751 property owned by the partnershipï,„ Net Ordinary Gain / (Loss) per Unit – Calculated as §751 Gain less Passive Loss Carryover assuming Passive Loss Carryover amounts are 100% available to offset Ordinary Gainsï,„ Net Capital Gain / (Loss) per Unit – Calculated as Total Gain / (Loss) per Unit less §751 Gain ï,„ Estimated Taxes – Calculated based on the Net Ordinary Gain / (Loss) per Unit assuming a 37.0% tax rate and the Net Capital Gain / (Loss) per Unit assuming a 20.0% tax rate Ordinary Gain / (Loss) Total Gain / (Loss) Per Unit Per Unit Capital Gain / (Loss) Per Unit Tax Liability Per Unit A B C D = B + C E = A—D F G H = F + G E F I J = E – F + I K = H * 37.0%L = J * 20.0% M = K + L % of Total Offer Issue Cum. Adjusted Total Gain / Carryover Net Ordinary Total Gain / Crude Net Capital Ordinary Tax Capital Tax Total Tax Year BKEPP Units Units Price Price Basis Adj. Basis (Loss) 751 Gain Passive Losses Gain / (Loss) (Loss) 751 Gain Capital Gain Gain / (Loss) Liability Liability Liability 2011 530,767 3.6% $8.46 $6.50 ($0.00) $6.50 $1.96 $0.00 $— $0.00 $1.96 $0.00 $— $1.96 $0.00 $0.39 $0.39 2012 108,673 0.7% 8.46 8.09 (1.21) 6.89 1.57 1.11 — 1.11 1.57 1.11 — 0.46 0.41 0.09 0.50 2013 117,121 0.8% 8.46 8.82 (1.71) 7.11 1.35 1.52 — 1.52 1.35 1.52 — (0.17) 0.56 0.01 0.57 2014 238,785 1.6% 8.46 9.51 (2.36) 7.15 1.31 1.81 — 1.81 1.31 1.81 — (0.50) 0.67 0.01 0.68 2015 69,176 0.5% 8.46 7.53 (0.77) 6.76 1.70 0.61 — 0.61 1.70 0.61 — 1.09 0.23 0.22 0.45 2016 699,826 4.7% 8.46 6.82 (0.12) 6.70 1.76 0.22 — 0.22 1.76 0.22 — 1.54 0.08 0.31 0.39 2017 1,613,554 10.8% 8.46 7.71 (0.61) 7.10 1.36 0.45 — 0.45 1.36 0.45 — 0.91 0.17 0.18 0.35 2018 2,085,775 14.0% 8.46 6.61 (0.37) 6.24 2.22 0.06 — 0.06 2.22 0.06 — 2.16 0.02 0.43 0.46 2019 2,988,941 20.1% 8.46 4.95 0.40 5.36 3.10 -——- 3.10 -—- 3.10 — 0.62 0.62 2020 5,771,753 38.7% 8.46 5.16 0.12 5.28 3.18 -——- 3.18 -—- 3.18 — 0.64 0.64 2021 680,467 4.6% 8.46 6.06 — 6.06 2.40 -——- 2.40 -—- 2.40 — 0.48 0.48 Total / Wtd. Avg. 14,904,840 100.0% $8.46 $5.90 ($0.06) $5.84 $2.62 $0.12 $— $0.12 $2.62 $0.12 $2.50 $0.04 $0.50 $0.55 Source: PwC 5

Preliminary Draft – Confidential Illustrative BKEP Preferred Unitholder Tax Analysis BKEP Preferred Unitholder Tax Analysis by Year Acquired @ Illustrative Offer Price ($8.46 / unit) –Allowing Tax Losses Offset ∎ The following table sets forth unaffiliated BKEP preferred unitholders by unit acquisition date as provided by PriceWaterhouseCoopers LLP (“PwC”), including the following information: ï,„ Adjusted Basis – Represents the weighted average price acquired, plus cumulative income, less cumulative distributions and DD&A from the acquisition date to January 2021ï,„ §751 Gain – Recharacterization of gain or loss on the sale of a partnership interest from capital to ordinary on §751 property owned by the partnershipï,„ Net Ordinary Gain / (Loss) per Unit – Calculated as §751 Gain less Passive Loss Carryover assuming Passive Loss Carryover amounts are 100% available to offset Ordinary Gainsï,„ Net Capital Gain / (Loss) per Unit – Calculated as Total Gain / (Loss) per Unit less §751 Gain ï,„ Estimated Taxes – Calculated based on the Net Ordinary Gain / (Loss) per Unit assuming a 37.0% tax rate and the Net Capital Gain / (Loss) per Unit assuming a 20.0% tax rate Ordinary Gain / (Loss) Total Gain / (Loss) Per Unit Per Unit Capital Gain / (Loss) Per Unit Tax Liability Per Unit A B C D = B + C E = A—D F G H = F + G E F I J = E – F + I K = H * 37.0% L = J * 20.0% M = K + L % of Total Offer Issue Cum. Adjusted Total Gain / Carryover Net Ordinary Total Gain / Crude Net Capital Ordinary Tax Capital Tax Total Tax Year BKEPP Units Units Price Price Basis Adj. Basis (Loss) 751 Gain Passive Losses Gain / (Loss) (Loss) 751 Gain Capital Gain Gain / (Loss) Liability Liability Liability 2011 530,767 3.6% $8.46 $6.50 ($0.00) $6.50 $1.96 $0.00 $— $0.00 $1.96 $0.00 $— $1.96 $0.00 $0.39 $0.39 2012 108,673 0.7% 8.46 8.09 (1.21) 6.89 1.57 1.11 — 1.11 1.57 1.11 — 0.46 0.41 0.09 0.50 2013 117,121 0.8% 8.46 8.82 (1.71) 7.11 1.35 1.52 — 1.52 1.35 1.52 — (0.17) 0.56 0.01 0.57 2014 238,785 1.6% 8.46 9.51 (2.36) 7.15 1.31 1.81 — 1.81 1.31 1.81 — (0.50) 0.67 0.01 0.68 2015 69,176 0.5% 8.46 7.53 (0.77) 6.76 1.70 0.61 — 0.61 1.70 0.61 — 1.09 0.23 0.22 0.45 2016 699,826 4.7% 8.46 6.82 (0.12) 6.70 1.76 0.22 — 0.22 1.76 0.22 — 1.54 0.08 0.31 0.39 2017 1,613,554 10.8% 8.46 7.71 (0.61) 7.10 1.36 0.45 — 0.45 1.36 0.45 — 0.91 0.17 0.18 0.35 2018 2,085,775 14.0% 8.46 6.61 (0.37) 6.24 2.22 0.06 — 0.06 2.22 0.06 — 2.16 0.02 0.43 0.46 2019 2,988,941 20.1% 8.46 4.95 0.40 5.36 3.10 -——- 3.10 -—- 3.10 — 0.62 0.62 2020 5,771,753 38.7% 8.46 5.16 0.12 5.28 3.18 -——- 3.18 -—- 3.18 — 0.64 0.64 2021 680,467 4.6% 8.46 6.06 — 6.06 2.40 -——- 2.40 -—- 2.40 — 0.48 0.48 Total / Wtd. Avg. 14,904,840 100.0% $8.46 $5.90 ($0.06) $5.84 $2.62 $0.12 $— $0.12 $2.62 $0.12 $2.50 $0.04 $0.50 $0.55 Source: PwC 6
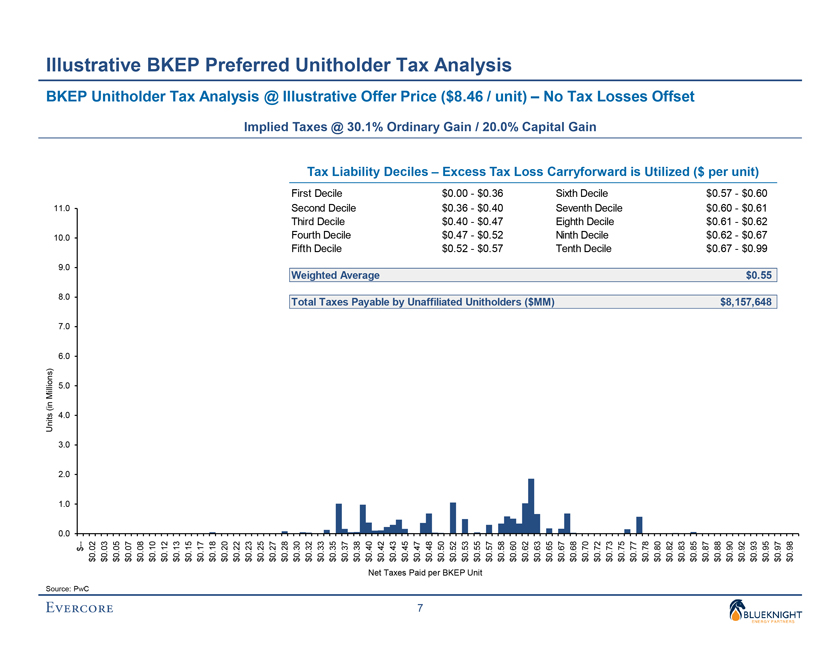
Preliminary Draft – Confidential Illustrative BKEP Preferred Unitholder Tax Analysis BKEP Unitholder Tax Analysis @ Illustrative Offer Price ($8.46 / unit) – No Tax Losses Offset Implied Taxes @ 30.1% Ordinary Gain / 20.0% Capital Gain Tax Liability Deciles – Excess Tax Loss Carryforward is Utilized ($ per unit) First Decile $0.00—$0.36 Sixth Decile $0.57—$0.60 11.0 Second Decile $0.36—$0.40 Seventh Decile $0.60—$0.61 Third Decile $0.40—$0.47 Eighth Decile $0.61—$0.62 10.0 Fourth Decile $0.47—$0.52 Ninth Decile $0.62—$0.67 Fifth Decile $0.52—$0.57 Tenth Decile $0.67—$0.99 9.0 Weighted Average $0.55 8.0 Total Taxes Payable by Unaffiliated Unitholders ($MM) $8,157,648 7.0 6.0 s ) on il li 5.0 M ( in Units 4.0 3.0 2.0 1.0 0.0 — 0 2 0 3 0 5 0 7 8 0 1 0 2 1 3 1 5 1 1 7 8 1 0 2 2 2 3 2 5 2 2 7 8 2 0 3 3 2 3 3 5 3 7 3 3 8 4 0 4 2 4 3 4 5 4 7 4 8 5 0 5 2 5 3 5 5 7 5 5 8 0 6 2 6 6 3 5 6 7 6 6 8 70 72 73 75 7 7 7 8 0 8 8 2 3 8 5 8 8 7 8 8 0 9 2 9 9 3 5 9 9 7 8 9 $ 0 . 0 . . 0 . 0 0 . . 0 . 0 0 . 0 . 0 . . 0 0 . 0 . 0 . 0 .. . 0 . 0 . 0 . 0 . 0 0 . . 0 0 . . 0 0 . . 0 . 0 . 0 0 . 0 . . 0 . 0 . 0 . 0 . 0 . 0 . 0 . 0 0 . 0 . . 0 . 0 0 . 0 . 0 . 0 . . 0 . 0 . 0 0 . . 0 0 . . 0 . 0 . 0 . 0 . 0 . 0 . 0 $ $ $ $ $ $ $ $ $ $ $ $ $ $ $ $ $ $ $ $ $ $ $ $ $ $ $ $ $ $ $ $ $ $ $ $ $ $ $ $ $ $ $ $ $ $ $ $ $ $ $ $ $ $ $ $ $ $ $ Net Taxes Paid per BKEP Unit Source: PwC 7
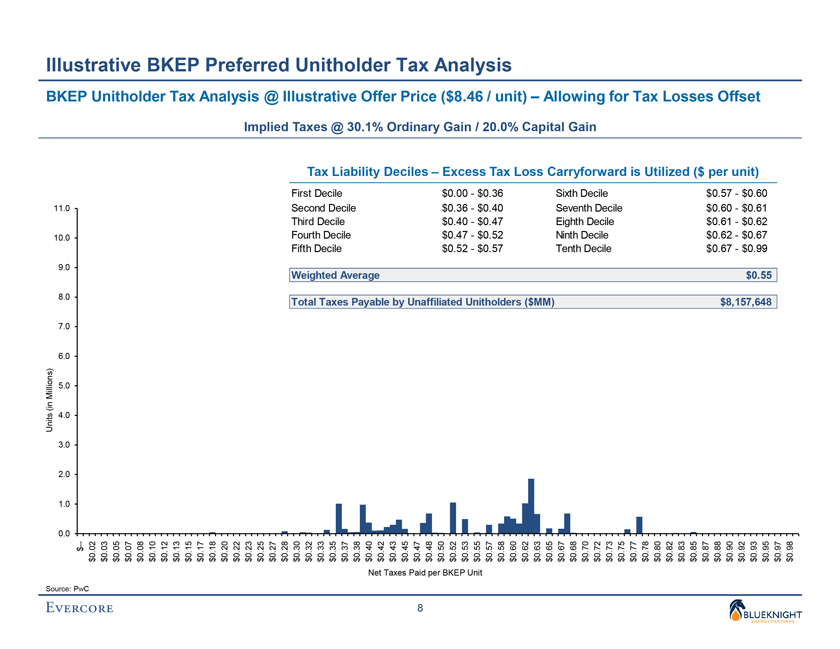
Units (in Millions) Source: 0 0. 1. 0 2. 0 3. 0 4. 0 5. 0 0 6. 0 7. 0 8. 9. 0 10. 0 11. 0 PwC $— BKEP $0.02 $0.03 $0.05 $0.07 Illustrative $0.08 $0.10 Unitholder $0.12 $0.13 $0.15 Tax $0.17 BKEP $0.18 $0.20 $0.22 $0.23 Analysis $0.25 $0.27 @ $0.28 Implied Preferred $0.30 $0.32 TotalFifth Third First Fourth $0.33 Second Taxes $0.35 Weighted Tax Decile Decile Decile @ $0.37 Taxes Decile Decile Illustrative $0.38 30. $0.40 Average Liability Net $0.42 Payable 1% Unitholder $0.43 Offer Taxes by $0.45 $0.47 8 Paid $0.48 Deciles Tax Price per – Ordinary $0.50 $ $ $ $ $ ( BKEP $0.52 Unaffiliated 0. 0. 0. 0. 0. $ $0.53 52 47 40 36 00 8. - — — — Gain Unit $0.55 / $ $ $ $ $ Excess 46 $0.57 0. 0. 0. 0. 0. / 57 52 47 40 36 20. $0.58 Tax Analysis $0.60 Unitholders 0% $0.62 ( unit) $ – $0.63 Loss $0.65 MM) $0.67Capital $0.68 Ninth Sixth Tenth $0.70 Eighth Seventh $0.72 Decile Decile Gain Allowing $0.73 Decile Decile Decile $0.75 Carryforward for $0.77 is $0.78 Tax $0.80 $0.82 $0.83 Utilized Preliminary $0.85 ( $ $0.87 $ $ $ $ $ Losses $0.88 0. 0. 0. 0. 0. Draft $ per – $0.9067 62 61 60 57 — — — $0.92 $ $ $ $ $ $ 0. 0. 0. 0. 0. $0.93 0. 99 67 62 61 60 unit) Offset $0.95 8,157,648 55 $0.97 Confidential $0.98