Exhibit 99.(C)(7)
Preliminary Draft – Confidential Discussion Materials Regarding Project Thunder January 10, 2022
Exhibit 99.(C)(7)
Preliminary Draft – Confidential Discussion Materials Regarding Project Thunder January 10, 2022
Preliminary Draft – Confidential These materials have been prepared by Evercore Group L.L.C. (“Evercore”) for the Conflicts Committee (the “Conflicts Committee”) of the Board of Directors of Blueknight Energy Partners G.P., LLC, the general partner of Blueknight Energy Partners, L.P. (the “Partnership”), to whom such materials are directly addressed and delivered and may not be used or relied upon for any purpose other than as specifically contemplated by a written agreement with Evercore. These materials are based on information provided by or on behalf of the Conflicts Committee, from public sources or otherwise reviewed by Evercore. Evercore assumes no responsibility for independent investigation or verification of such information and has relied on such information being complete and accurate in all material respects. To the extent such information includes estimates and forecasts of future financial performance prepared by or reviewed with the management of the Partnership and/or other potential transaction participants or obtained from public sources, Evercore has assumed that such estimates and forecasts have been reasonably prepared on bases reflecting the best currently available estimates and judgments of such management (or, with respect to estimates and forecasts obtained from public sources, represent reasonable estimates). No representation or warranty, express or implied, is made as to the accuracy or completeness of such information and nothing contained herein is, or shall be relied upon as, a representation, whether as to the past, the present or the future. These materials were designed for use by specific persons familiar with the business and affairs of the Partnership. These materials are not intended to provide the sole basis for evaluating, and should not be considered a recommendation with respect to, any transaction or other matter. These materials have been developed by and are proprietary to Evercore and were prepared exclusively for the benefit and internal use of the Conflicts Committee. These materials were compiled on a confidential basis for use by the Conflicts Committee and not with a view to public disclosure or filing thereof under state or federal securities laws, and may not be reproduced, disseminated, quoted or referred to, in whole or in part, without the prior written consent of Evercore. These materials do not constitute an offer or solicitation to sell or purchase any securities and are not a commitment by Evercore or any of its affiliates to provide or arrange any financing for any transaction or to purchase any security in connection therewith. Evercore assumes no obligation to update or otherwise revise these materials. These materials may not reflect information known to other professionals in other business areas of Evercore and its affiliates. Evercore and its affiliates do not provide legal, accounting or tax advice. Accordingly, any statements contained herein as to tax matters were neither written nor intended by Evercore or its affiliates to be used and cannot be used by any taxpayer for the purpose of avoiding tax penalties that may be imposed on such taxpayer. Each person should seek legal, accounting and tax advice based on his, her or its particular circumstances from independent advisors regarding the impact of the transactions or matters described herein.
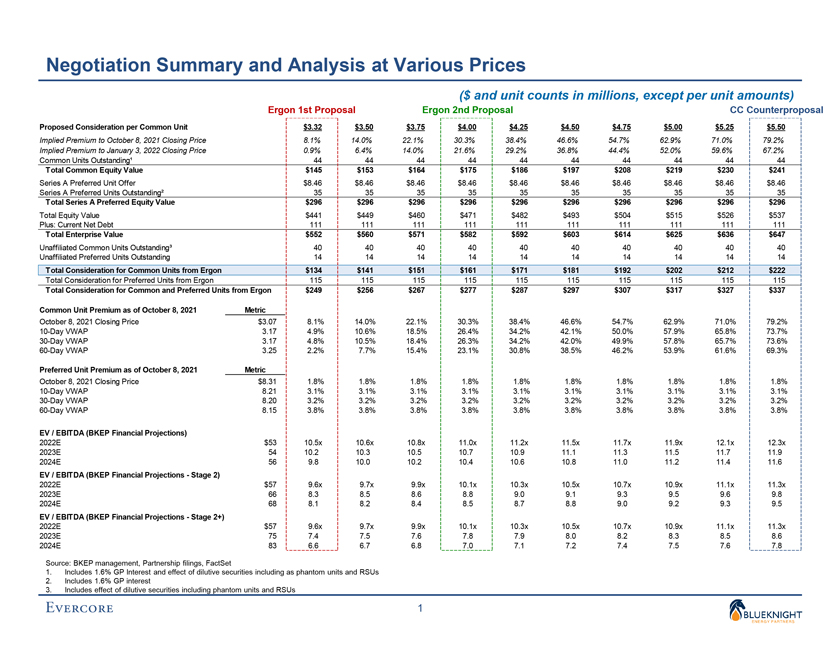
Preliminary Draft – Confidential Negotiation Summary and Analysis at Various Prices ($ and unit counts in millions, except per unit amounts) Ergon 1st Proposal Ergon 2nd Proposal CC Counterproposal Proposed Consideration per Common Unit $3.32 $3.50 $3.75 $4.00 $4.25 $4.50 $4.75 $5.00 $5.25 $5.50 Implied Premium to October 8, 2021 Closing Price 8.1% 14.0% 22.1% 30.3% 38.4% 46.6% 54.7% 62.9% 71.0% 79.2% Implied Premium to January 3, 2022 Closing Price 0.9% 6.4% 14.0% 21.6% 29.2% 36.8% 44.4% 52.0% 59.6% 67.2% Common Units Outstanding¹ 44 44 44 44 44 44 44 44 44 44 Total Common Equity Value $145 $153 $164 $175 $186 $197 $208 $219 $230 $241 Series A Preferred Unit Offer $8.46 $8.46 $8.46 $8.46 $8.46 $8.46 $8.46 $8.46 $8.46 $8.46 Series A Preferred Units Outstanding² 35 35 35 35 35 35 35 35 35 35 Total Series A Preferred Equity Value $296 $296 $296 $296 $296 $296 $296 $296 $296 $296 Total Equity Value $441 $449 $460 $471 $482 $493 $504 $515 $526 $537 Plus: Current Net Debt 111 111 111 111 111 111 111 111 111 111 Total Enterprise Value $552 $560 $571 $582 $592 $603 $614 $625 $636 $647 Unaffiliated Common Units Outstanding³ 40 40 40 40 40 40 40 40 40 40 Unaffiliated Preferred Units Outstanding 14 14 14 14 14 14 14 14 14 14 Total Consideration for Common Units from Ergon $134 $141 $151 $161 $171 $181 $192 $202 $212 $222 Total Consideration for Preferred Units from Ergon 115 115 115 115 115 115 115 115 115 115 Total Consideration for Common and Preferred Units from Ergon $249 $256 $267 $277 $287 $297 $307 $317 $327 $337 Common Unit Premium as of October 8, 2021 Metric October 8, 2021 Closing Price $3.07 8.1% 14.0% 22.1% 30.3% 38.4% 46.6% 54.7% 62.9% 71.0% 79.2% 10-Day VWAP 3.17 4.9% 10.6% 18.5% 26.4% 34.2% 42.1% 50.0% 57.9% 65.8% 73.7% 30-Day VWAP 3.17 4.8% 10.5% 18.4% 26.3% 34.2% 42.0% 49.9% 57.8% 65.7% 73.6% 60-Day VWAP 3.25 2.2% 7.7% 15.4% 23.1% 30.8% 38.5% 46.2% 53.9% 61.6% 69.3% Preferred Unit Premium as of October 8, 2021 Metric October 8, 2021 Closing Price $8.31 1.8% 1.8% 1.8% 1.8% 1.8% 1.8% 1.8% 1.8% 1.8% 1.8% 10-Day VWAP 8.21 3.1% 3.1% 3.1% 3.1% 3.1% 3.1% 3.1% 3.1% 3.1% 3.1% 30-Day VWAP 8.20 3.2% 3.2% 3.2% 3.2% 3.2% 3.2% 3.2% 3.2% 3.2% 3.2% 60-Day VWAP 8.15 3.8% 3.8% 3.8% 3.8% 3.8% 3.8% 3.8% 3.8% 3.8% 3.8% EV / EBITDA (BKEP Financial Projections) 2022E $53 10.5x 10.6x 10.8x 11.0x 11.2x 11.5x 11.7x 11.9x 12.1x 12.3x 2023E 54 10.2 10.3 10.5 10.7 10.9 11.1 11.3 11.5 11.7 11.9 2024E 56 9.8 10.0 10.2 10.4 10.6 10.8 11.0 11.2 11.4 11.6 EV / EBITDA (BKEP Financial Projections—Stage 2) 2022E $57 9.6x 9.7x 9.9x 10.1x 10.3x 10.5x 10.7x 10.9x 11.1x 11.3x 2023E 66 8.3 8.5 8.6 8.8 9.0 9.1 9.3 9.5 9.6 9.8 2024E 68 8.1 8.2 8.4 8.5 8.7 8.8 9.0 9.2 9.3 9.5 EV / EBITDA (BKEP Financial Projections—Stage 2+) 2022E $57 9.6x 9.7x 9.9x 10.1x 10.3x 10.5x 10.7x 10.9x 11.1x 11.3x 2023E 75 7.4 7.5 7.6 7.8 7.9 8.0 8.2 8.3 8.5 8.6 2024E 83 6.6 6.7 6.8 7.0 7.1 7.2 7.4 7.5 7.6 7.8 Source: BKEP management, Partnership filings, FactSet 1. Includes 1.6% GP Interest and effect of dilutive securities including as phantom units and RSUs 2. Includes 1.6% GP interest 3. Includes effect of dilutive securities including phantom units and RSUs 1
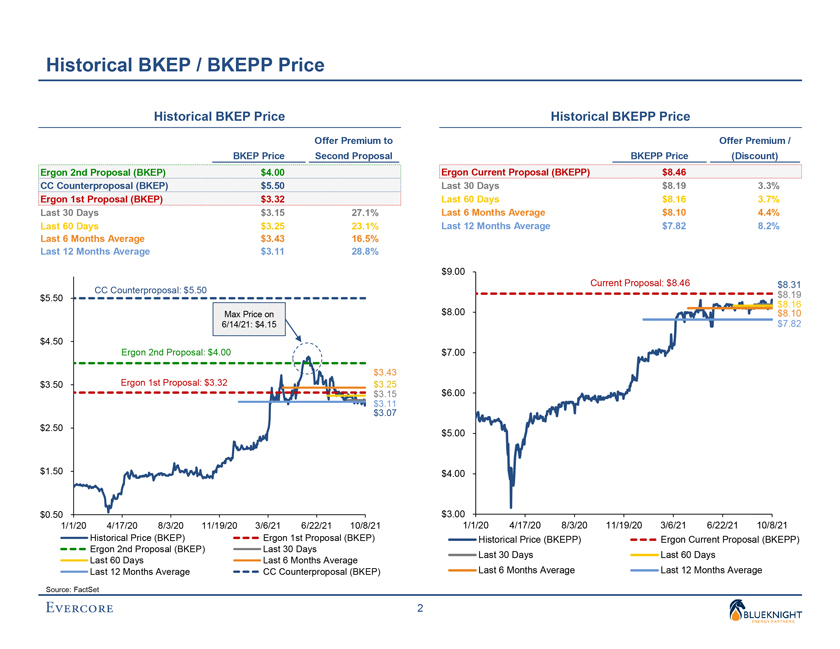
Preliminary Draft – Confidential Historical BKEP / BKEPP Price Historical BKEP Price Historical BKEPP Price Offer Premium to Offer Premium / BKEP Price Second Proposal BKEPP Price (Discount) Ergon 2nd Proposal (BKEP) $4.00 Ergon Current Proposal (BKEPP) $8.46 CC Counterproposal (BKEP) $5.50 Last 30 Days $8.19 3.3% Ergon 1st Proposal (BKEP) $3.32 Last 60 Days $8.16 3.7% Last 30 Days $3.15 27.1% Last 6 Months Average $8.10 4.4% Last 60 Days $3.25 23.1% Last 12 Months Average $7.82 8.2% Last 6 Months Average $3.43 16.5% Last 12 Months Average $3.11 28.8% $9.00 Current Proposal: $8.46 $8.31 CC Counterproposal: $5.50 $5.50 $8.19 $8.16 Max Price on $8.00 $8.10 6/14/21: $4.15 $7.82 $4.50 Ergon 2nd Proposal: $4.00 $7.00 $3.43 $3.50 Ergon 1st Proposal: $3.32 $3.25 $3.15 $6.00 $3.11 $3.07 $2.50 $5.00 $1.50 $4.00 $0.50 $3.00 1/1/20 4/17/20 8/3/20 11/19/20 3/6/21 6/22/21 10/8/21 1/1/20 4/17/20 8/3/20 11/19/20 3/6/21 6/22/21 10/8/21 Historical Price (BKEP) Ergon 1st Proposal (BKEP) Historical Price (BKEPP) Ergon Current Proposal (BKEPP) Ergon 2nd Proposal (BKEP) Last 30 Days Last 30 Days Last 60 Days Last 60 Days Last 6 Months Average Last 12 Months Average CC Counterproposal (BKEP) Last 6 Months Average Last 12 Months Average Source: FactSet 2
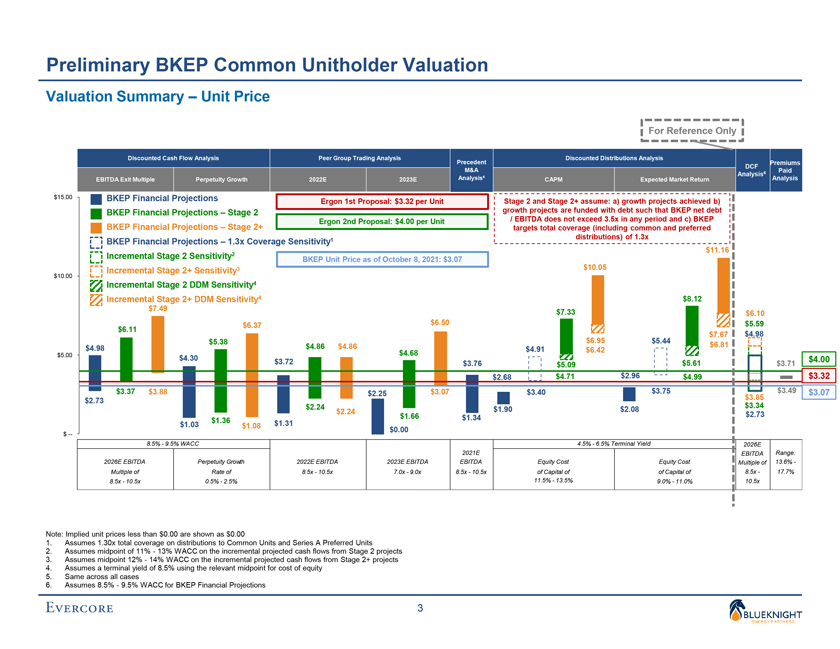
Preliminary Draft – Confidential Preliminary BKEP Common Unitholder Valuation Valuation Summary – Unit Price For Reference Only Discounted Cash Flow Analysis Peer Group Trading Analysis Discounted Distributions Analysis Precedent Premiums DCF M&A Paid Analysis6 EBITDA Exit Multiple Perpetuity Growth 2022E 2023E Analysisâµ CAPM Expected Market Return Analysis $15.00 BKEP Financial Projections Ergon 1st Proposal: $3.32 per Unit Stage 2 and Stage 2+ assume: a) growth projects achieved b) BKEP Financial Projections – Stage 2 growth projects are funded with debt such that BKEP net debt Ergon 2nd Proposal: $4.00 per Unit / EBITDA does not exceed 3.5x in any period and c) BKEP BKEP Financial Projections – Stage 2+ targets total coverage (including common and preferred distributions) of 1.3x BKEP Financial Projections – 1.3x Coverage Sensitivity1 $11.16 Incremental Stage 2 Sensitivity2 BKEP Unit Price as of October 8, 2021: $3.07 Incremental Stage 2+ Sensitivity3 $10.05 $10.00 Incremental Stage 2 DDM Sensitivity4 Incremental Stage 2+ DDM Sensitivity4 $8.12 $7.49 $7.33 $6.10 $6.11 $6.37 $6.50 $5.59 $6.95 $5.44 $7.67 $4.98 $5.38 $6.81 $4.98 $4.86 $4.86 $4.91 $4.68 $6.42 $5.00 $4.30 $3.72 $4.00 $3.76 $5.09 $5.61 $3.71 $2.68 $4.71 $2.96 $4.99 $3.32 $3.37 $3.88 $2.25 $3.07 $3.40 $3.75 $3.85 $3.49 $3.07 $2.73 $2.24 $3.34 $2.24 $1.90 $2.08 $1.66 $2.73 $1.36 $1.34 $1.03 $1.08 $1.31 $0.00 $ — 8.5% - 9.5% WACC 4.5%—6.5% Terminal Yield 2026E 2021E EBITDA Range: 2026E EBITDA Perpetuity Growth 2022E EBITDA 2023E EBITDA EBITDA Equity Cost Equity Cost Multiple of 13.6% -Multiple of Rate of 8.5x—10.5x 7.0x—9.0x 8.5x—10.5x of Capital of of Capital of 8.5x—17.7% 8.5x—10.5x 0.5%—2.5% 11.5%—13.5% 9.0%—11.0% 10.5x Note: Implied unit prices less than $0.00 are shown as $0.00 1. Assumes 1.30x total coverage on distributions to Common Units and Series A Preferred Units 2. Assumes midpoint of 11%—13% WACC on the incremental projected cash flows from Stage 2 projects 3. Assumes midpoint 12%—14% WACC on the incremental projected cash flows from Stage 2+ projects 4. Assumes a terminal yield of 8.5% using the relevant midpoint for cost of equity 5. Same across all cases 6. Assumes 8.5%—9.5% WACC for BKEP Financial Projections 3
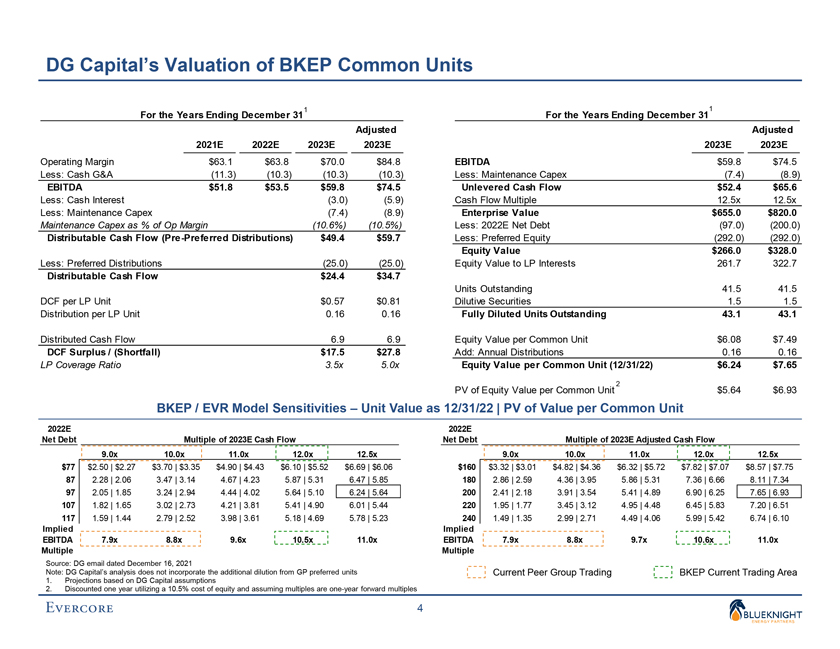
Preliminary Draft – Confidential DG Capital’s Valuation of BKEP Common Units 1 1 For the Years Ending December 31 For the Years Ending December 31 Adjusted Adjusted 2021E 2022E 2023E 2023E 2023E 2023E Operating Margin $63.1 $63.8 $70.0 $84.8 EBITDA $59.8 $74.5 Less: Cash G&A (11.3) (10.3) (10.3) (10.3) Less: Maintenance Capex (7.4) (8.9) EBITDA $51.8 $53.5 $59.8 $74.5 Unlevered Cash Flow $52.4 $65.6 Less: Cash Interest (3.0) (5.9) Cash Flow Multiple 12.5x 12.5x Less: Maintenance Capex (7.4) (8.9) Enterprise Value $655.0 $820.0 Maintenance Capex as % of Op Margin (10.6%) (10.5%) Less: 2022E Net Debt (97.0) (200.0) Distributable Cash Flow (Pre-Preferred Distributions) $49.4 $59.7 Less: Preferred Equity (292.0) (292.0) Equity Value $266.0 $328.0 Less: Preferred Distributions (25.0) (25.0) Equity Value to LP Interests 261.7 322.7 Distributable Cash Flow $24.4 $34.7 Units Outstanding 41.5 41.5 DCF per LP Unit $0.57 $0.81 Dilutive Securities 1.5 1.5 Distribution per LP Unit 0.16 0.16 Fully Diluted Units Outstanding 43.1 43.1 Distributed Cash Flow 6.9 6.9 Equity Value per Common Unit $6.08 $7.49 DCF Surplus / (Shortfall) $17.5 $27.8 Add: Annual Distributions 0.16 0.16 LP Coverage Ratio 3.5x 5.0x Equity Value per Common Unit (12/31/22) $6.24 $7.65 2 PV of Equity Value per Common Unit $5.64 $6.93 BKEP / EVR Model Sensitivities – Unit Value as 12/31/22 | PV of Value per Common Unit 2022E 2022E Net Debt Multiple of 2023E Cash Flow Net Debt Multiple of 2023E Adjusted Cash Flow 9.0x 10.0x 11.0x 12.0x 12.5x 9.0x 10.0x 11.0x 12.0x 12.5x $77 $2.50 | $2.27 $3.70 | $3.35 $4.90 | $4.43 $6.10 | $5.52 $6.69 | $6.06 $160 $3.32 | $3.01 $4.82 | $4.36 $6.32 | $5.72 $7.82 | $7.07 $8.57 | $7.75 87 2.28 | 2.06 3.47 | 3.14 4.67 | 4.23 5.87 | 5.31 6.47 | 5.85 180 2.86 | 2.59 4.36 | 3.95 5.86 | 5.31 7.36 | 6.66 8.11 | 7.34 97 2.05 | 1.85 3.24 | 2.94 4.44 | 4.02 5.64 | 5.10 6.24 | 5.64 200 2.41 | 2.18 3.91 | 3.54 5.41 | 4.89 6.90 | 6.25 7.65 | 6.93 107 1.82 | 1.65 3.02 | 2.73 4.21 | 3.81 5.41 | 4.90 6.01 | 5.44 220 1.95 | 1.77 3.45 | 3.12 4.95 | 4.48 6.45 | 5.83 7.20 | 6.51 117 1.59 | 1.44 2.79 | 2.52 3.98 | 3.61 5.18 | 4.69 5.78 | 5.23 240 1.49 | 1.35 2.99 | 2.71 4.49 | 4.06 5.99 | 5.42 6.74 | 6.10 Implied Implied EBITDA 7.9x 8.8x 9.6x 10.5x 11.0x EBITDA 7.9x 8.8x 9.7x 10.6x 11.0x Multiple Multiple Source: DG email dated December 16, 2021 Note: DG Capital’s analysis does not incorporate the additional dilution from GP preferred units Current Peer Group Trading BKEP Current Trading Area 1. Projections based on DG Capital assumptions 2. Discounted one year utilizing a 10.5% cost of equity and assuming multiples are one-year forward multiples 4
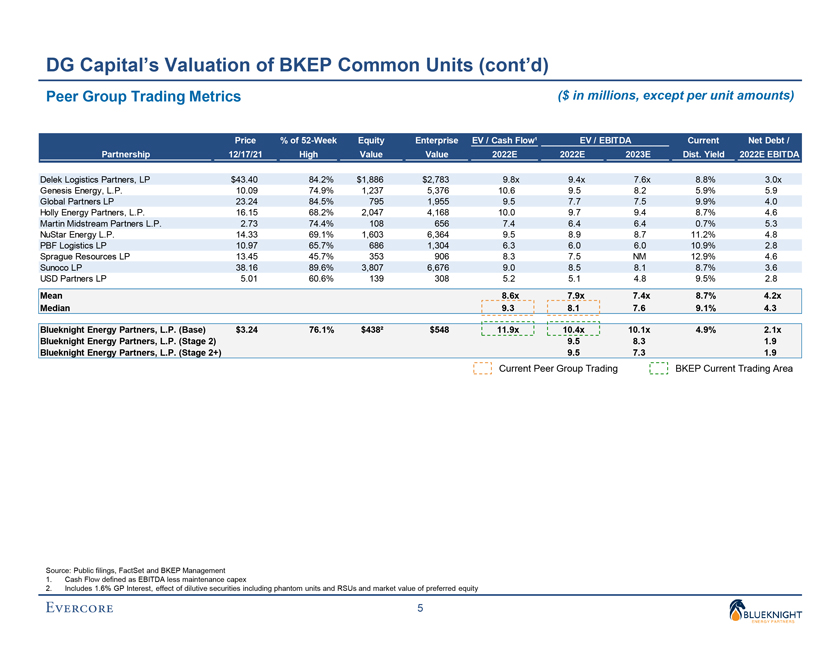
Preliminary Draft – Confidential DG Capital’s Valuation of BKEP Common Units (cont’d) Peer Group Trading Metrics ($ in millions, except per unit amounts) Price % of 52-Week Equity Enterprise EV / Cash Flow¹ EV / EBITDA Current Net Debt / Partnership 12/17/21 High Value Value 2022E 2022E 2023E Dist. Yield 2022E EBITDA Delek Logistics Partners, LP $43.40 84.2% $1,886 $2,783 9.8x 9.4x 7.6x 8.8% 3.0x Genesis Energy, L.P. 10.09 74.9% 1,237 5,376 10.6 9.5 8.2 5.9% 5.9 Global Partners LP 23.24 84.5% 795 1,955 9.5 7.7 7.5 9.9% 4.0 Holly Energy Partners, L.P. 16.15 68.2% 2,047 4,168 10.0 9.7 9.4 8.7% 4.6 Martin Midstream Partners L.P. 2.73 74.4% 108 656 7.4 6.4 6.4 0.7% 5.3 NuStar Energy L.P. 14.33 69.1% 1,603 6,364 9.5 8.9 8.7 11.2% 4.8 PBF Logistics LP 10.97 65.7% 686 1,304 6.3 6.0 6.0 10.9% 2.8 Sprague Resources LP 13.45 45.7% 353 906 8.3 7.5 NM 12.9% 4.6 Sunoco LP 38.16 89.6% 3,807 6,676 9.0 8.5 8.1 8.7% 3.6 USD Partners LP 5.01 60.6% 139 308 5.2 5.1 4.8 9.5% 2.8 Mean 8.6x 7.9x 7.4x 8.7% 4.2x Median 9.3 8.1 7.6 9.1% 4.3 Blueknight Energy Partners, L.P. (Base) $3.24 76.1% $438² $548 11.9x 10.4x 10.1x 4.9% 2.1x Blueknight Energy Partners, L.P. (Stage 2) 9.5 8.3 1.9 Blueknight Energy Partners, L.P. (Stage 2+) 9.5 7.3 1.9 Current Peer Group Trading BKEP Current Trading Area Source: Public filings, FactSet and BKEP Management 1. Cash Flow defined as EBITDA less maintenance capex 2. Includes 1.6% GP Interest, effect of dilutive securities including phantom units and RSUs and market value of preferred equity 5
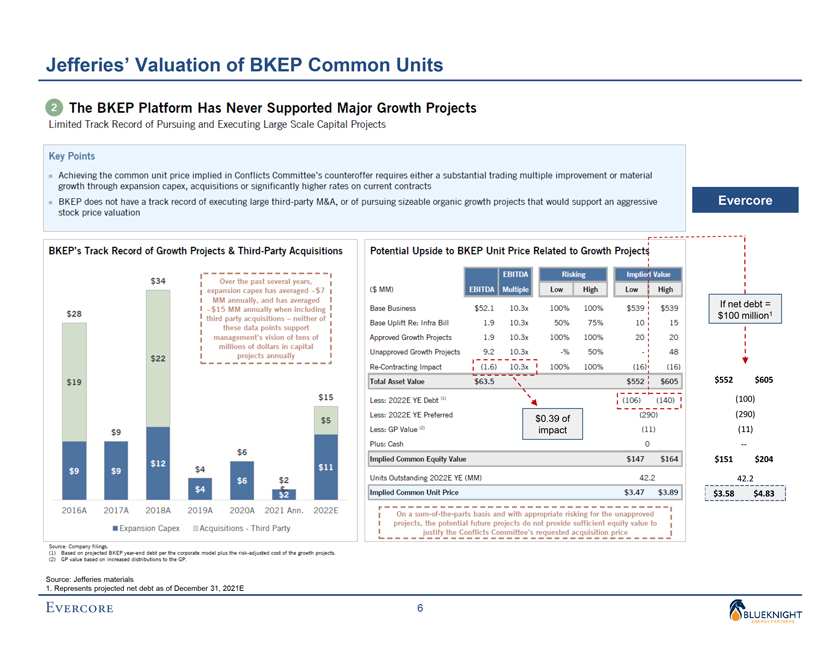
Preliminary Draft – Confidential Jefferies’ Valuation of BKEP Common Units Evercore If net debt = $100 million1 $552 $605 (100) $0.39 of (290) impact (11) —$151 $204 42.2 $3.58 $4.83 Source: Jefferies materials 1. Represents projected net debt as of December 31, 2021E 6