Exhibit 99.(C)(8)

Preliminary Draft – Confidential Discussion Materials Regarding Project Thunder January 17, 2022
Exhibit 99.(C)(8)
Preliminary Draft – Confidential Discussion Materials Regarding Project Thunder January 17, 2022
Preliminary Draft – Confidential These materials have been prepared by Evercore Group L.L.C. (“Evercore”) for the Conflicts Committee (the “Conflicts Committee”) of the Board of Directors of Blueknight Energy Partners G.P., LLC, the general partner of Blueknight Energy Partners, L.P. (the “Partnership”), to whom such materials are directly addressed and delivered and may not be used or relied upon for any purpose other than as specifically contemplated by a written agreement with Evercore. These materials are based on information provided by or on behalf of the Conflicts Committee, from public sources or otherwise reviewed by Evercore. Evercore assumes no responsibility for independent investigation or verification of such information and has relied on such information being complete and accurate in all material respects. To the extent such information includes estimates and forecasts of future financial performance prepared by or reviewed with the management of the Partnership and/or other potential transaction participants or obtained from public sources, Evercore has assumed that such estimates and forecasts have been reasonably prepared on bases reflecting the best currently available estimates and judgments of such management (or, with respect to estimates and forecasts obtained from public sources, represent reasonable estimates). No representation or warranty, express or implied, is made as to the accuracy or completeness of such information and nothing contained herein is, or shall be relied upon as, a representation, whether as to the past, the present or the future. These materials were designed for use by specific persons familiar with the business and affairs of the Partnership. These materials are not intended to provide the sole basis for evaluating, and should not be considered a recommendation with respect to, any transaction or other matter. These materials have been developed by and are proprietary to Evercore and were prepared exclusively for the benefit and internal use of the Conflicts Committee. These materials were compiled on a confidential basis for use by the Conflicts Committee and not with a view to public disclosure or filing thereof under state or federal securities laws, and may not be reproduced, disseminated, quoted or referred to, in whole or in part, without the prior written consent of Evercore. These materials do not constitute an offer or solicitation to sell or purchase any securities and are not a commitment by Evercore or any of its affiliates to provide or arrange any financing for any transaction or to purchase any security in connection therewith. Evercore assumes no obligation to update or otherwise revise these materials. These materials may not reflect information known to other professionals in other business areas of Evercore and its affiliates. Evercore and its affiliates do not provide legal, accounting or tax advice. Accordingly, any statements contained herein as to tax matters were neither written nor intended by Evercore or its affiliates to be used and cannot be used by any taxpayer for the purpose of avoiding tax penalties that may be imposed on such taxpayer. Each person should seek legal, accounting and tax advice based on his, her or its particular circumstances from independent advisors regarding the impact of the transactions or matters described herein.
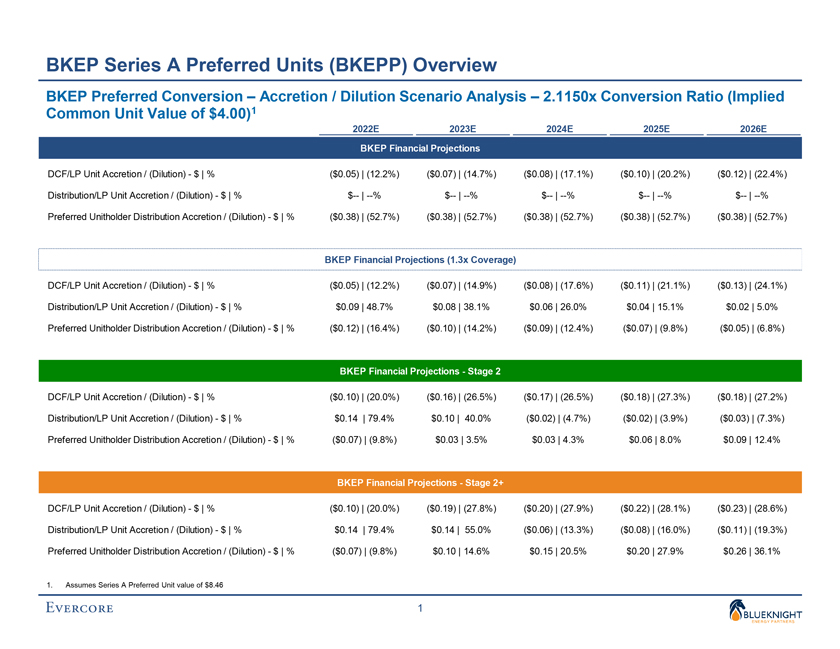
Preliminary Draft – Confidential BKEP Series A Preferred Units (BKEPP) Overview BKEP Preferred Conversion – Accretion / Dilution Scenario Analysis – 2.1150x Conversion Ratio (Implied Common Unit Value of $4.00)1 2022E 2023E 2024E 2025E 2026E BKEP Financial Projections DCF/LP Unit Accretion / (Dilution)—$ | % ($0.05) | (12.2%) ($0.07) | (14.7%) ($0.08) | (17.1%) ($0.10) | (20.2%) ($0.12) | (22.4%) Distribution/LP Unit Accretion / (Dilution)—$ | % $— | —% $— | —% $— | —% $— | —% $— | —% Preferred Unitholder Distribution Accretion / (Dilution)—$ | % ($0.38) | (52.7%) ($0.38) | (52.7%) ($0.38) | (52.7%) ($0.38) | (52.7%) ($0.38) | (52.7%) BKEP Financial Projections (1.3x Coverage) DCF/LP Unit Accretion / (Dilution)—$ | % ($0.05) | (12.2%) ($0.07) | (14.9%) ($0.08) | (17.6%) ($0.11) | (21.1%) ($0.13) | (24.1%) Distribution/LP Unit Accretion / (Dilution)—$ | % $0.09 | 48.7% $0.08 | 38.1% $0.06 | 26.0% $0.04 | 15.1% $0.02 | 5.0% Preferred Unitholder Distribution Accretion / (Dilution)—$ | % ($0.12) | (16.4%) ($0.10) | (14.2%) ($0.09) | (12.4%) ($0.07) | (9.8%) ($0.05) | (6.8%) BKEP Financial Projections—Stage 2 DCF/LP Unit Accretion / (Dilution)—$ | % ($0.10) | (20.0%) ($0.16) | (26.5%) ($0.17) | (26.5%) ($0.18) | (27.3%) ($0.18) | (27.2%) Distribution/LP Unit Accretion / (Dilution)—$ | % $0.14 | 79.4% $0.10 | 40.0% ($0.02) | (4.7%) ($0.02) | (3.9%) ($0.03) | (7.3%) Preferred Unitholder Distribution Accretion / (Dilution)—$ | % ($0.07) | (9.8%) $0.03 | 3.5% $0.03 | 4.3% $0.06 | 8.0% $0.09 | 12.4% BKEP Financial Projections—Stage 2+ DCF/LP Unit Accretion / (Dilution)—$ | % ($0.10) | (20.0%) ($0.19) | (27.8%) ($0.20) | (27.9%) ($0.22) | (28.1%) ($0.23) | (28.6%) Distribution/LP Unit Accretion / (Dilution)—$ | % $0.14 | 79.4% $0.14 | 55.0% ($0.06) | (13.3%) ($0.08) | (16.0%) ($0.11) | (19.3%) Preferred Unitholder Distribution Accretion / (Dilution)—$ | % ($0.07) | (9.8%) $0.10 | 14.6% $0.15 | 20.5% $0.20 | 27.9% $0.26 | 36.1% 1. Assumes Series A Preferred Unit value of $8.46 1

Preliminary Draft – Confidential BKEP Series A Preferred Units (BKEPP) Overview BKEP Preferred Conversion – Accretion / Dilution Scenario Analysis – 1.9500x Conversion Ratio (Implied Common Unit Value of $4.34)1 2022E 2023E 2024E 2025E 2026E BKEP Financial Projections DCF/LP Unit Accretion / (Dilution)—$ | % ($0.03) | (7.7%) ($0.05) | (10.4%) ($0.06) | (12.9%) ($0.08) | (16.2%) ($0.10) | (18.6%) Distribution/LP Unit Accretion / (Dilution)—$ | % $— | —% $— | —% $— | —% $— | —% $— | —% Preferred Unitholder Distribution Accretion / (Dilution)—$ | % ($0.40) | (56.4%) ($0.40) | (56.4%) ($0.40) | (56.4%) ($0.40) | (56.4%) ($0.40) | (56.4%) BKEP Financial Projections (1.3x Coverage) DCF/LP Unit Accretion / (Dilution)—$ | % ($0.03) | (7.8%) ($0.05) | (10.6%) ($0.06) | (13.5%) ($0.09) | (17.1%) ($0.11) | (20.4%) Distribution/LP Unit Accretion / (Dilution)—$ | % $0.11 | 56.6% $0.10 | 45.2% $0.08 | 31.9% $0.06 | 20.8% $0.03 | 10.0% Preferred Unitholder Distribution Accretion / (Dilution)—$ | % ($0.13) | (18.9%) ($0.12) | (16.8%) ($0.11) | (15.5%) ($0.09) | (12.7%) ($0.07) | (10.0%) BKEP Financial Projections—Stage 2 DCF/LP Unit Accretion / (Dilution)—$ | % ($0.08) | (15.9%) ($0.14) | (22.7%) ($0.14) | (22.8%) ($0.15) | (23.6%) ($0.16) | (23.8%) Distribution/LP Unit Accretion / (Dilution)—$ | % $0.15 | 89.7% $0.12 | 47.0% $0.00 | 0.0% $0.00 | 0.7% ($0.01) | (3.0%) Preferred Unitholder Distribution Accretion / (Dilution)—$ | % ($0.09) | (12.0%) $0.00 | 0.2% $0.01 | 0.9% $0.03 | 4.3% $0.06 | 8.4% BKEP Financial Projections—Stage 2+ DCF/LP Unit Accretion / (Dilution)—$ | % ($0.08) | (15.9%) ($0.17) | (24.6%) ($0.18) | (24.7%) ($0.20) | (25.3%) ($0.21) | (25.8%) Distribution/LP Unit Accretion / (Dilution)—$ | % $0.15 | 89.7% $0.16 | 63.0% ($0.04) | (9.0%) ($0.06) | (12.1%) ($0.09) | (15.4%) Preferred Unitholder Distribution Accretion / (Dilution)—$ | % ($0.09) | (12.0%) $0.08 | 11.1% $0.12 | 16.6% $0.17 | 23.4% $0.23 | 31.6% 1. Assumes Series A Preferred Unit value of $8.46 2
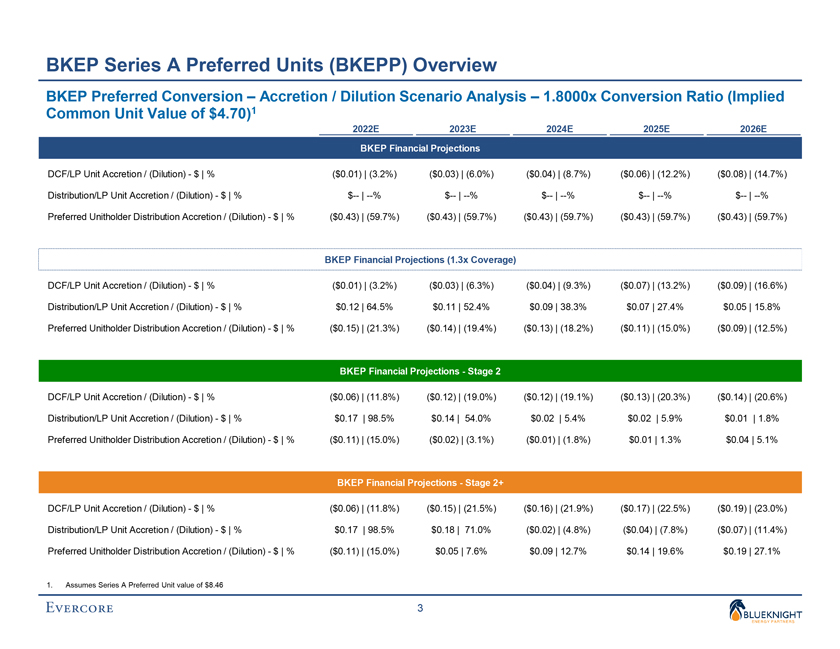
Preliminary Draft – Confidential BKEP Series A Preferred Units (BKEPP) Overview BKEP Preferred Conversion – Accretion / Dilution Scenario Analysis – 1.8000x Conversion Ratio (Implied Common Unit Value of $4.70)1 2022E 2023E 2024E 2025E 2026E BKEP Financial Projections DCF/LP Unit Accretion / (Dilution)—$ | % ($0.01) | (3.2%) ($0.03) | (6.0%) ($0.04) | (8.7%) ($0.06) | (12.2%) ($0.08) | (14.7%) Distribution/LP Unit Accretion / (Dilution)—$ | % $— | —% $— | —% $— | —% $— | —% $— | —% Preferred Unitholder Distribution Accretion / (Dilution)—$ | % ($0.43) | (59.7%) ($0.43) | (59.7%) ($0.43) | (59.7%) ($0.43) | (59.7%) ($0.43) | (59.7%) BKEP Financial Projections (1.3x Coverage) DCF/LP Unit Accretion / (Dilution)—$ | % ($0.01) | (3.2%) ($0.03) | (6.3%) ($0.04) | (9.3%) ($0.07) | (13.2%) ($0.09) | (16.6%) Distribution/LP Unit Accretion / (Dilution)—$ | % $0.12 | 64.5% $0.11 | 52.4% $0.09 | 38.3% $0.07 | 27.4% $0.05 | 15.8% Preferred Unitholder Distribution Accretion / (Dilution)—$ | % ($0.15) | (21.3%) ($0.14) | (19.4%) ($0.13) | (18.2%) ($0.11) | (15.0%) ($0.09) | (12.5%) BKEP Financial Projections—Stage 2 DCF/LP Unit Accretion / (Dilution)—$ | % ($0.06) | (11.8%) ($0.12) | (19.0%) ($0.12) | (19.1%) ($0.13) | (20.3%) ($0.14) | (20.6%) Distribution/LP Unit Accretion / (Dilution)—$ | % $0.17 | 98.5% $0.14 | 54.0% $0.02 | 5.4% $0.02 | 5.9% $0.01 | 1.8% Preferred Unitholder Distribution Accretion / (Dilution)—$ | % ($0.11) | (15.0%) ($0.02) | (3.1%) ($0.01) | (1.8%) $0.01 | 1.3% $0.04 | 5.1% BKEP Financial Projections—Stage 2+ DCF/LP Unit Accretion / (Dilution)—$ | % ($0.06) | (11.8%) ($0.15) | (21.5%) ($0.16) | (21.9%) ($0.17) | (22.5%) ($0.19) | (23.0%) Distribution/LP Unit Accretion / (Dilution)—$ | % $0.17 | 98.5% $0.18 | 71.0% ($0.02) | (4.8%) ($0.04) | (7.8%) ($0.07) | (11.4%) Preferred Unitholder Distribution Accretion / (Dilution)—$ | % ($0.11) | (15.0%) $0.05 | 7.6% $0.09 | 12.7% $0.14 | 19.6% $0.19 | 27.1% 1. Assumes Series A Preferred Unit value of $8.46 3
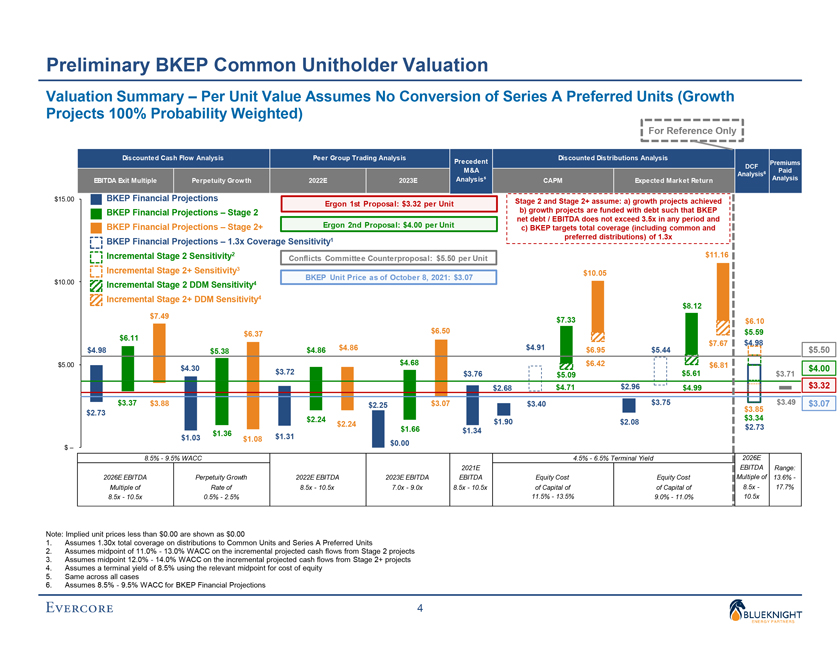
Preliminary Draft – Confidential Preliminary BKEP Common Unitholder Valuation Valuation Summary – Per Unit Value Assumes No Conversion of Series A Preferred Units (Growth Projects 100% Probability Weighted) For Reference Only Discounted Cash Flow Analysis Peer Group Trading Analysis Discounted Distributions Analysis Precedent Premiums DCF M&A 6 Paid Analysis EBITDA Exit Multiple Perpetuity Grow th 2022E 2023E Analysisâµ CAPM Expected Market Return Analysis $15.00 BKEP Financial Projections Stage 2 and Stage 2+ assume: a) growth projects achieved Ergon 1st Proposal: $3.32 per Unit b) growth projects are funded with debt such that BKEP BKEP Financial Projections – Stage 2 net debt / EBITDA does not exceed 3.5x in any period and BKEP Financial Projections – Stage 2+ Ergon 2nd Proposal: $4.00 per Unit c) BKEP targets total coverage (including common and preferred distributions) of 1.3x BKEP Financial Projections – 1.3x Coverage Sensitivity1 Incremental Stage 2 Sensitivity2 $11.16 Conflicts Committee Counterproposal: $5.50 per Unit Incremental Stage 2+ Sensitivity3 $10.05 BKEP Unit Price as of October 8, 2021: $3.07 $10.00 Incremental Stage 2 DDM Sensitivity4 Incremental Stage 2+ DDM Sensitivity4 $8.12 $7.49 $7.33 $6.10 $6.11 $6.37 $6.50 $5.59 $7.67 $4.98 $4.98 $4.86 $4.86 $4.91 $6.95 $5.44 $5.50 $5.38 $5.00 $4.68 $6.42 $6.81 $4.30 $4.00 $3.72 $3.76 $5.09 $5.61 $3.71 $2.68 $4.71 $2.96 $4.99 $3.32 $3.37 $3.88 $2.25 $3.07 $3.40 $3.75 $3.85 $3.49 $3.07 $2.73 $2.24 $3.34 $2.24 $1.90 $2.08 $1.66 $2.73 $1.36 $1.34 $1.03 $1.08 $1.31 $0.00 $ — 8.5%—9.5% WACC 4.5%—6.5% Terminal Yield 2026E 2021E EBITDA Range: 2026E EBITDA Perpetuity Growth 2022E EBITDA 2023E EBITDA EBITDA Equity Cost Equity Cost Multiple of 13.6% -Multiple of Rate of 8.5x—10.5x 7.0x—9.0x 8.5x—10.5x of Capital of of Capital of 8.5x—17.7% 8.5x—10.5x 0.5%—2.5% 11.5%—13.5% 9.0%—11.0% 10.5x Note: Implied unit prices less than $0.00 are shown as $0.00 1. Assumes 1.30x total coverage on distributions to Common Units and Series A Preferred Units 2. Assumes midpoint of 11.0%—13.0% WACC on the incremental projected cash flows from Stage 2 projects 3. Assumes midpoint 12.0%—14.0% WACC on the incremental projected cash flows from Stage 2+ projects 4. Assumes a terminal yield of 8.5% using the relevant midpoint for cost of equity 5. Same across all cases 6. Assumes 8.5%—9.5% WACC for BKEP Financial Projections 4
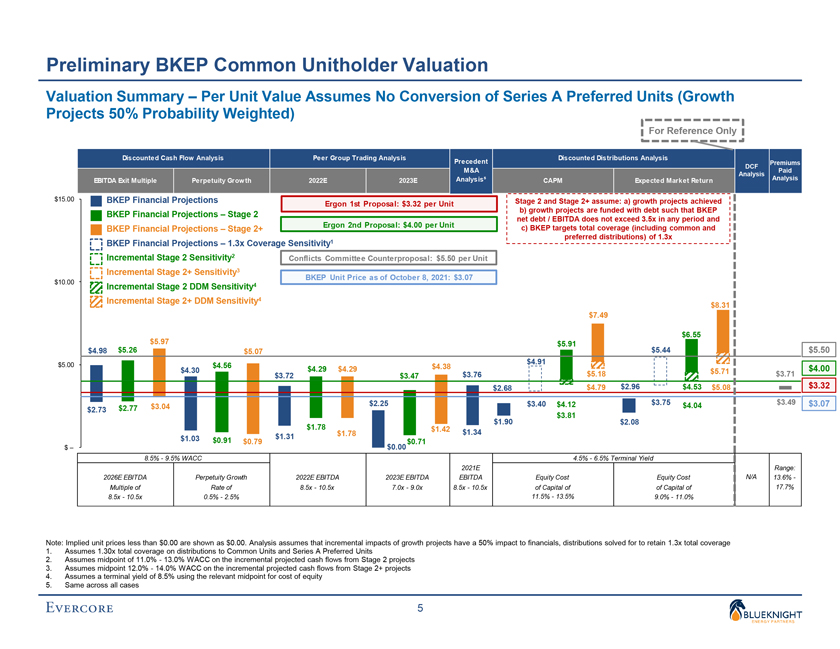
Preliminary Draft – Confidential Preliminary BKEP Common Unitholder Valuation Valuation Summary – Per Unit Value Assumes No Conversion of Series A Preferred Units (Growth Projects 50% Probability Weighted) For Reference Only Discounted Cash Flow Analysis Peer Group Trading Analysis Discounted Distributions Analysis Precedent Premiums DCF M&A Paid Analysis EBITDA Exit Multiple Perpetuity Grow th 2022E 2023E Analysisâµ CAPM Expected Market Return Analysis $15.00 BKEP Financial Projections Stage 2 and Stage 2+ assume: a) growth projects achieved Ergon 1st Proposal: $3.32 per Unit b) growth projects are funded with debt such that BKEP BKEP Financial Projections – Stage 2 net debt / EBITDA does not exceed 3.5x in any period and Ergon 2nd Proposal: $4.00 per Unit c) BKEP targets total coverage (including common and BKEP Financial Projections – Stage 2+ preferred distributions) of 1.3x BKEP Financial Projections – 1.3x Coverage Sensitivity1 Incremental Stage 2 Sensitivity2 Conflicts Committee Counterproposal: $5.50 per Unit Incremental Stage 2+ Sensitivity3 BKEP Unit Price as of October 8, 2021: $3.07 $10.00 Incremental Stage 2 DDM Sensitivity4 Incremental Stage 2+ DDM Sensitivity4 $8.31 $7.49 $5.97 $6.55 $5.91 $4.98 $5.26 $5.07 $5.44 $5.50 $5.00 $4.91 $4.56 $4.38 $4.00 $4.30 $4.29 $4.29 $5.71 $3.72 $3.47 $3.76 $5.18 $3.71 $2.68 $4.79 $2.96 $4.53 $5.08 $3.32 $2.25 $3.40 $4.12 $3.75 $4.04 $3.49 $3.07 $2.73 $2.77 $3.04 $1.90 $3.81 $2.08 $1.78 $1.42 $1.78 $1.34 $1.03 $1.31 $0.91 $0.79 $0.00 $0.71 $ — 8.5%—9.5% WACC 4.5%—6.5% Terminal Yield 2021E Range: 2026E EBITDA Perpetuity Growth 2022E EBITDA 2023E EBITDA EBITDA Equity Cost Equity Cost N/A 13.6% -Multiple of Rate of 8.5x—10.5x 7.0x—9.0x 8.5x—10.5x of Capital of of Capital of 17.7% 8.5x—10.5x 0.5%—2.5% 11.5%—13.5% 9.0%—11.0% Note: Implied unit prices less than $0.00 are shown as $0.00. Analysis assumes that incremental impacts of growth projects have a 50% impact to financials, distributions solved for to retain 1.3x total coverage 1. Assumes 1.30x total coverage on distributions to Common Units and Series A Preferred Units 2. Assumes midpoint of 11.0%—13.0% WACC on the incremental projected cash flows from Stage 2 projects 3. Assumes midpoint 12.0%—14.0% WACC on the incremental projected cash flows from Stage 2+ projects 4. Assumes a terminal yield of 8.5% using the relevant midpoint for cost of equity 5. Same across all cases 5
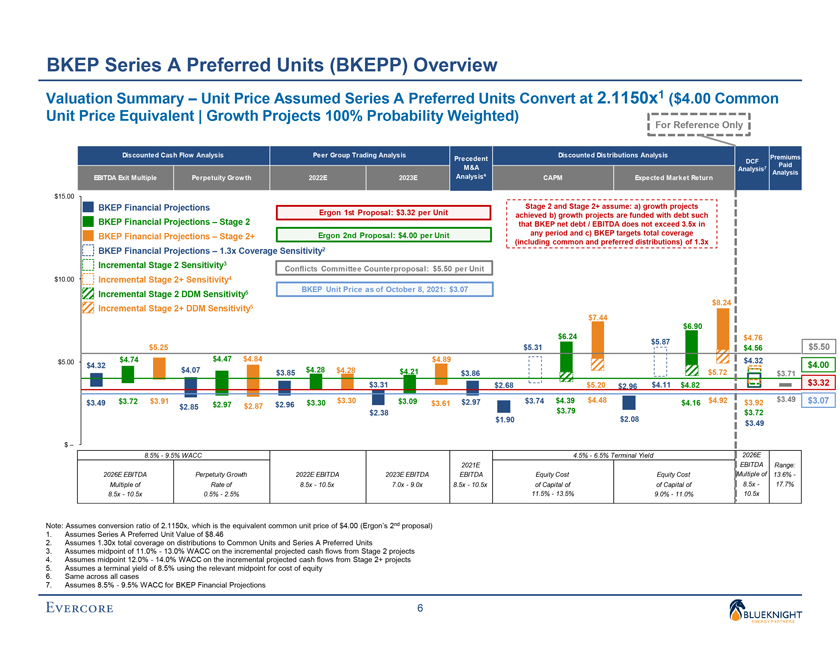
Preliminary Draft – Confidential BKEP Series A Preferred Units (BKEPP) Overview Valuation Summary – Unit Price Assumed Series A Preferred Units Convert at 2.1150x1 ($4.00 Common Unit Price Equivalent | Growth Projects 100% Probability Weighted) For Reference Only Discounted Cash Flow Analysis Peer Group Trading Analysis Discounted Distributions Analysis Premiums Precedent DCF Paid M&A Analysis7 Analysis EBITDA Exit Multiple Perpetuity Grow th 2022E 2023E AnalysisⶠCAPM Expected Market Return $15.00 BKEP Financial Projections Ergon 1st Proposal: $3.32 per Unit Stage 2 and Stage 2+ assume: a) growth projects BKEP Financial Projections – Stage 2 achieved b) growth projects are funded with debt such that BKEP net debt / EBITDA does not exceed 3.5x in BKEP Financial Projections – Stage 2+ Ergon 2nd Proposal: $4.00 per Unit any period and c) BKEP targets total coverage (including common and preferred distributions) of 1.3x BKEP Financial Projections – 1.3x Coverage Sensitivity2 Incremental Stage 2 Sensitivity3 Conflicts Committee Counterproposal: $5.50 per Unit $10.00 Incremental Stage 2+ Sensitivity4 BKEP Unit Price as of October 8, 2021: $3.07 Incremental Stage 2 DDM Sensitivity5 $8.24 Incremental Stage 2+ DDM Sensitivity5 $7.44 $6.90 $6.24 $4.76 $5.87 $5.25 $5.31 $4.56 $5.50 $5.00 $4.74 $4.47 $4.84 $4.89 $4.32 $4.32 $4.00 $4.07 $3.85 $4.28 $4.28 $4.21 $5.72 $3.86 $3.71 $3.31 $2.68 $5.20 $2.96 $4.11 $4.82 $3.32 $3.72 $3.91 $3.30 $3.09 $2.97 $3.74 $4.39 $4.48 $4.92 $3.49 $3.07 $3.49 $2.97 $2.96 $3.30 $3.61 $4.16 $3.92 $2.85 $2.87 $2.38 $3.79 $3.72 $1.90 $2.08 $3.49 $ — 8.5%—9.5% WACC 4.5%—6.5% Terminal Yield 2026E 2021E EBITDA Range: 2026E EBITDA Perpetuity Growth 2022E EBITDA 2023E EBITDA EBITDA Equity Cost Equity Cost Multiple of 13.6% -Multiple of Rate of 8.5x—10.5x 7.0x—9.0x 8.5x—10.5x of Capital of of Capital of 8.5x—17.7% 8.5x—10.5x 0.5%—2.5% 11.5%—13.5% 9.0%—11.0% 10.5x Note: Assumes conversion ratio of 2.1150x, which is the equivalent common unit price of $4.00 (Ergon’s 2nd proposal) 1. Assumes Series A Preferred Unit Value of $8.46 2. Assumes 1.30x total coverage on distributions to Common Units and Series A Preferred Units 3. Assumes midpoint of 11.0%—13.0% WACC on the incremental projected cash flows from Stage 2 projects 4. Assumes midpoint 12.0%—14.0% WACC on the incremental projected cash flows from Stage 2+ projects 5. Assumes a terminal yield of 8.5% using the relevant midpoint for cost of equity 6. Same across all cases 7. Assumes 8.5%—9.5% WACC for BKEP Financial Projections 6
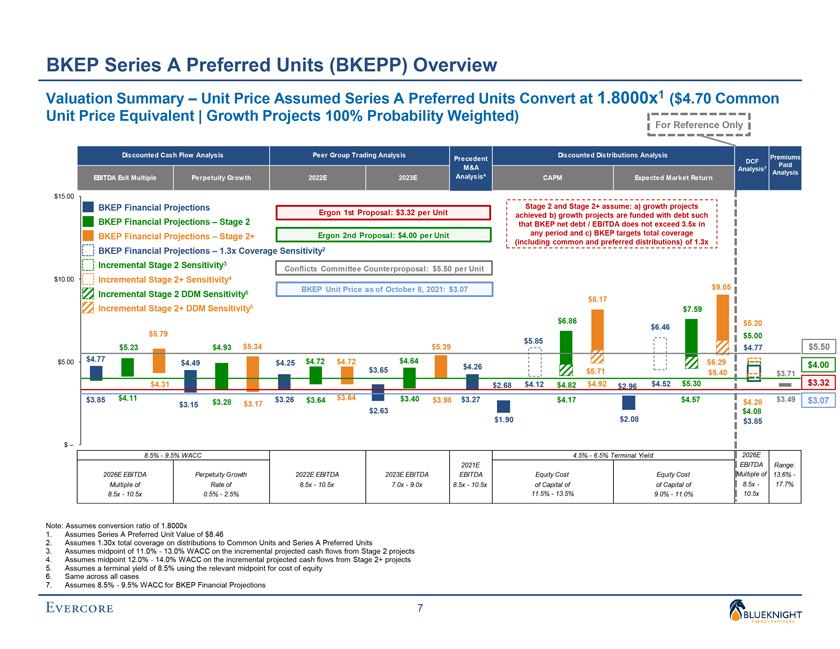
Preliminary Draft – Confidential BKEP Series A Preferred Units (BKEPP) Overview Valuation Summary – Unit Price Assumed Series A Preferred Units Convert at 1.8000x1 ($4.70 Common Unit Price Equivalent | Growth Projects 100% Probability Weighted) For Reference Only Discounted Cash Flow Analysis Peer Group Trading Analysis Discounted Distributions Analysis Premiums Precedent DCF Paid M&A Analysis7 Analysis EBITDA Exit Multiple Perpetuity Grow th 2022E 2023E AnalysisⶠCAPM Expected Market Return $15.00 BKEP Financial Projections Ergon 1st Proposal: $3.32 per Unit Stage 2 and Stage 2+ assume: a) growth projects BKEP Financial Projections – Stage 2 achieved b) growth projects are funded with debt such that BKEP net debt / EBITDA does not exceed 3.5x in BKEP Financial Projections – Stage 2+ Ergon 2nd Proposal: $4.00 per Unit any period and c) BKEP targets total coverage (including common and preferred distributions) of 1.3x BKEP Financial Projections – 1.3x Coverage Sensitivity2 Incremental Stage 2 Sensitivity3 Conflicts Committee Counterproposal: $5.50 per Unit $10.00 Incremental Stage 2+ Sensitivity4 Incremental Stage 2 DDM Sensitivity5 BKEP Unit Price as of October 8, 2021: $3.07 $9.05 $8.17 Incremental Stage 2+ DDM Sensitivity5 $7.59 $6.86 $5.20 $5.79 $6.46 $5.00 $5.85 $5.23 $4.93 $5.34 $5.39 $4.77 $5.50 $5.00 $4.77 $4.72 $4.72 $4.64 $6.29 $4.49 $4.25 $4.00 $4.26 $3.65 $5.71 $5.40 $3.71 $4.31 $2.68 $4.12 $4.82 $4.92 $2.96 $4.52 $5.30 $3.32 $3.85 $4.11 $3.26 $3.64 $3.64 $3.40 $3.98 $3.27 $4.17 $4.57 $3.49 $3.07 $3.15 $3.28 $3.17 $4.28 $2.63 $4.08 $1.90 $2.08 $3.85 $ — 8.5%—9.5% WACC 4.5%—6.5% Terminal Yield 2026E 2021E EBITDA Range: 2026E EBITDA Perpetuity Growth 2022E EBITDA 2023E EBITDA EBITDA Equity Cost Equity Cost Multiple of 13.6% -Multiple of Rate of 8.5x—10.5x 7.0x—9.0x 8.5x—10.5x of Capital of of Capital of 8.5x—17.7% 8.5x—10.5x 0.5%—2.5% 11.5%—13.5% 9.0%—11.0% 10.5x Note: Assumes conversion ratio of 1.8000x 1. Assumes Series A Preferred Unit Value of $8.46 2. Assumes 1.30x total coverage on distributions to Common Units and Series A Preferred Units 3. Assumes midpoint of 11.0%—13.0% WACC on the incremental projected cash flows from Stage 2 projects 4. Assumes midpoint 12.0%—14.0% WACC on the incremental projected cash flows from Stage 2+ projects 5. Assumes a terminal yield of 8.5% using the relevant midpoint for cost of equity 6. Same across all cases 7. Assumes 8.5%—9.5% WACC for BKEP Financial Projections 7

Preliminary Draft – Confidential Appendix
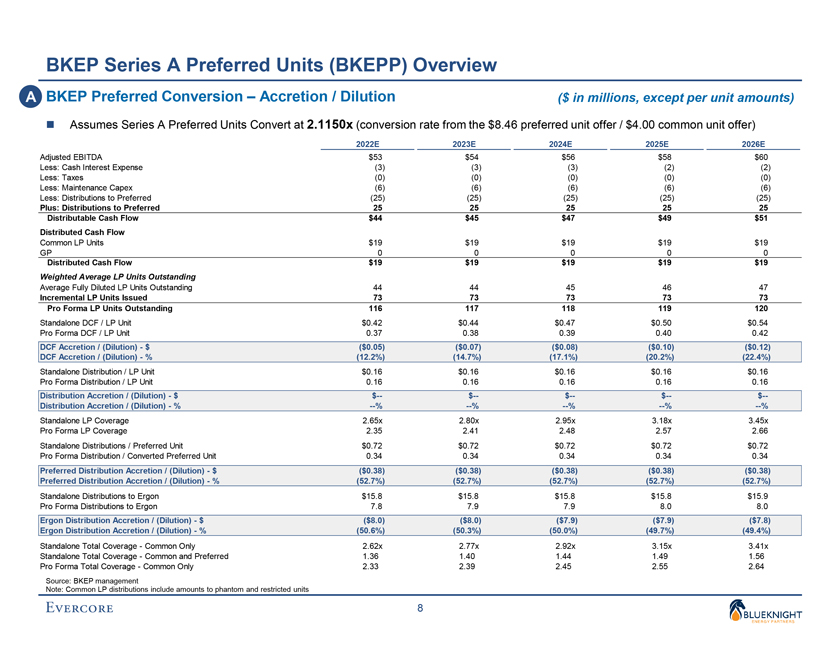
Preliminary Draft – Confidential BKEP Series A Preferred Units (BKEPP) Overview A BKEP Preferred Conversion – Accretion / Dilution ($ in millions, except per unit amounts) ï® Assumes Series A Preferred Units Convert at 2.1150x (conversion rate from the $8.46 preferred unit offer / $4.00 common unit offer) 2022E 2023E 2024E 2025E 2026E Adjusted EBITDA $53 $54 $56 $58 $60 Less: Cash Interest Expense (3) (3) (3) (2) (2) Less: Taxes (0) (0) (0) (0) (0) Less: Maintenance Capex (6) (6) (6) (6) (6) Less: Distributions to Preferred (25) (25) (25) (25) (25) Plus: Distributions to Preferred 25 25 25 25 25 Distributable Cash Flow $44 $45 $47 $49 $51 Distributed Cash Flow Common LP Units $19 $19 $19 $19 $19 GP 0 0 0 0 0 Distributed Cash Flow $19 $19 $19 $19 $19 Weighted Average LP Units Outstanding Average Fully Diluted LP Units Outstanding 44 44 45 46 47 Incremental LP Units Issued 73 73 73 73 73 Pro Forma LP Units Outstanding 116 117 118 119 120 Standalone DCF / LP Unit $0.42 $0.44 $0.47 $0.50 $0.54 Pro Forma DCF / LP Unit 0.37 0.38 0.39 0.40 0.42 DCF Accretion / (Dilution)—$ ($0.05) ($0.07) ($0.08) ($0.10) ($0.12) DCF Accretion / (Dilution)—% (12.2%) (14.7%) (17.1%) (20.2%) (22.4%) Standalone Distribution / LP Unit $0.16 $0.16 $0.16 $0.16 $0.16 Pro Forma Distribution / LP Unit 0.16 0.16 0.16 0.16 0.16 Distribution Accretion / (Dilution)—$ $— $— $— $— $—Distribution Accretion / (Dilution)—% —% —% —% —% —% Standalone LP Coverage 2.65x 2.80x 2.95x 3.18x 3.45x Pro Forma LP Coverage 2.35 2.41 2.48 2.57 2.66 Standalone Distributions / Preferred Unit $0.72 $0.72 $0.72 $0.72 $0.72 Pro Forma Distribution / Converted Preferred Unit 0.34 0.34 0.34 0.34 0.34 Preferred Distribution Accretion / (Dilution)—$ ($0.38) ($0.38) ($0.38) ($0.38) ($0.38) Preferred Distribution Accretion / (Dilution)—% (52.7%) (52.7%) (52.7%) (52.7%) (52.7%) Standalone Distributions to Ergon $15.8 $15.8 $15.8 $15.8 $15.9 Pro Forma Distributions to Ergon 7.8 7.9 7.9 8.0 8.0 Ergon Distribution Accretion / (Dilution)—$ ($8.0) ($8.0) ($7.9) ($7.9) ($7.8) Ergon Distribution Accretion / (Dilution)—% (50.6%) (50.3%) (50.0%) (49.7%) (49.4%) Standalone Total Coverage—Common Only 2.62x 2.77x 2.92x 3.15x 3.41x Standalone Total Coverage—Common and Preferred 1.36 1.40 1.44 1.49 1.56 Pro Forma Total Coverage—Common Only 2.33 2.39 2.45 2.55 2.64 Source: BKEP management Note: Common LP distributions include amounts to phantom and restricted units 8
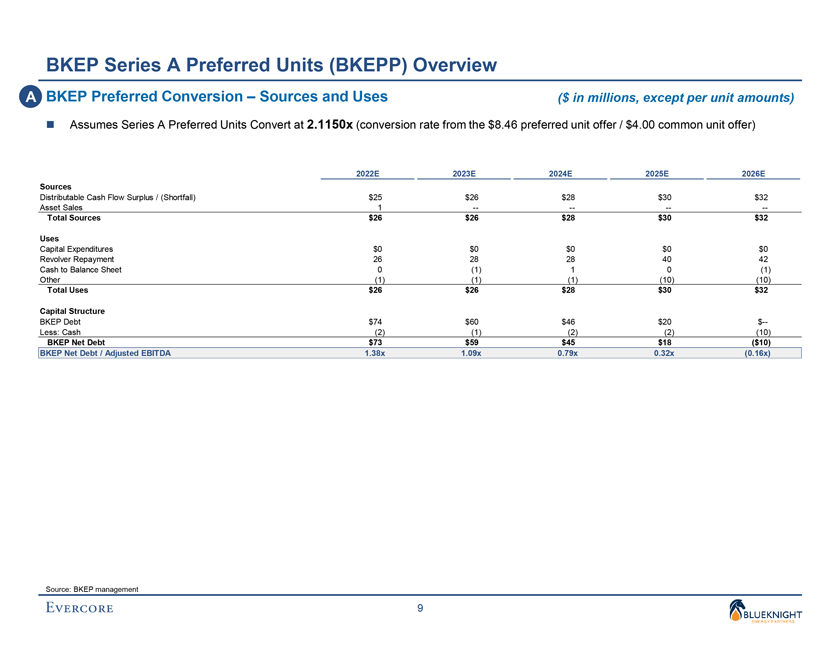
Preliminary Draft – Confidential BKEP Series A Preferred Units (BKEPP) Overview A BKEP Preferred Conversion – Sources and Uses ($ in millions, except per unit amounts) ï® Assumes Series A Preferred Units Convert at 2.1150x (conversion rate from the $8.46 preferred unit offer / $4.00 common unit offer) 2022E 2023E 2024E 2025E 2026E Sources Distributable Cash Flow Surplus / (Shortfall) $25 $26 $28 $30 $32 Asset Sales 1 -———- Total Sources $26 $26 $28 $30 $32 Uses Capital Expenditures $0 $0 $0 $0 $0 Revolver Repayment 26 28 28 40 42 Cash to Balance Sheet 0 (1) 1 0 (1) Other (1) (1) (1) (10) (10) Total Uses $26 $26 $28 $30 $32 Capital Structure BKEP Debt $74 $60 $46 $20 $—Less: Cash (2) (1) (2) (2) (10) BKEP Net Debt $73 $59 $45 $18 ($10) BKEP Net Debt / Adjusted EBITDA 1.38x 1.09x 0.79x 0.32x (0.16x) Source: BKEP management 9
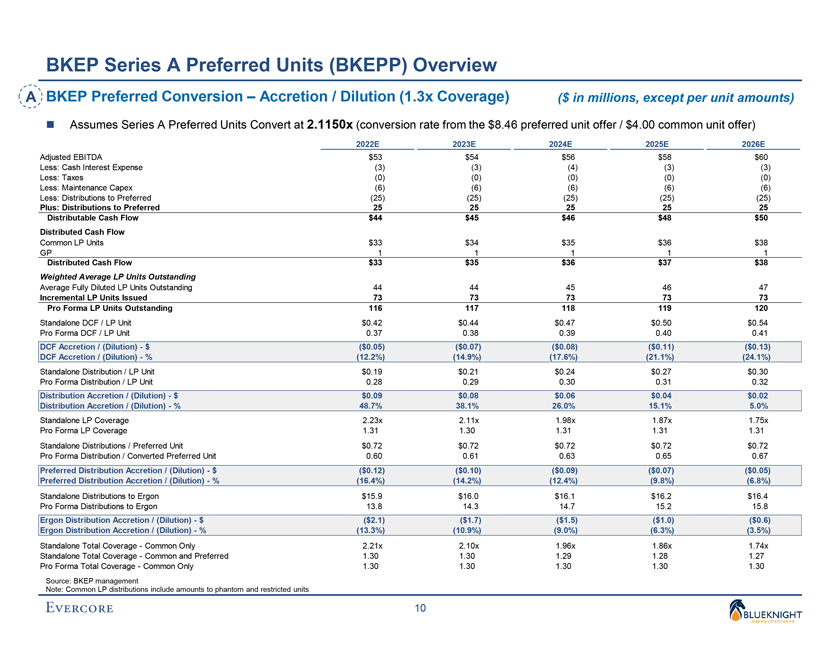
Preliminary Draft – Confidential BKEP Series A Preferred Units (BKEPP) Overview A BKEP Preferred Conversion – Accretion / Dilution (1.3x Coverage) ($ in millions, except per unit amounts) ï® Assumes Series A Preferred Units Convert at 2.1150x (conversion rate from the $8.46 preferred unit offer / $4.00 common unit offer) 2022E 2023E 2024E 2025E 2026E Adjusted EBITDA $53 $54 $56 $58 $60 Less: Cash Interest Expense (3) (3) (4) (3) (3) Less: Taxes (0) (0) (0) (0) (0) Less: Maintenance Capex (6) (6) (6) (6) (6) Less: Distributions to Preferred (25) (25) (25) (25) (25) Plus: Distributions to Preferred 25 25 25 25 25 Distributable Cash Flow $44 $45 $46 $48 $50 Distributed Cash Flow Common LP Units $33 $34 $35 $36 $38 GP 1 1 1 1 1 Distributed Cash Flow $33 $35 $36 $37 $38 Weighted Average LP Units Outstanding Average Fully Diluted LP Units Outstanding 44 44 45 46 47 Incremental LP Units Issued 73 73 73 73 73 Pro Forma LP Units Outstanding 116 117 118 119 120 Standalone DCF / LP Unit $0.42 $0.44 $0.47 $0.50 $0.54 Pro Forma DCF / LP Unit 0.37 0.38 0.39 0.40 0.41 DCF Accretion / (Dilution)—$ ($0.05) ($0.07) ($0.08) ($0.11) ($0.13) DCF Accretion / (Dilution)—% (12.2%) (14.9%) (17.6%) (21.1%) (24.1%) Standalone Distribution / LP Unit $0.19 $0.21 $0.24 $0.27 $0.30 Pro Forma Distribution / LP Unit 0.28 0.29 0.30 0.31 0.32 Distribution Accretion / (Dilution)—$ $0.09 $0.08 $0.06 $0.04 $0.02 Distribution Accretion / (Dilution)—% 48.7% 38.1% 26.0% 15.1% 5.0% Standalone LP Coverage 2.23x 2.11x 1.98x 1.87x 1.75x Pro Forma LP Coverage 1.31 1.30 1.31 1.31 1.31 Standalone Distributions / Preferred Unit $0.72 $0.72 $0.72 $0.72 $0.72 Pro Forma Distribution / Converted Preferred Unit 0.60 0.61 0.63 0.65 0.67 Preferred Distribution Accretion / (Dilution)—$ ($0.12) ($0.10) ($0.09) ($0.07) ($0.05) Preferred Distribution Accretion / (Dilution)—% (16.4%) (14.2%) (12.4%) (9.8%) (6.8%) Standalone Distributions to Ergon $15.9 $16.0 $16.1 $16.2 $16.4 Pro Forma Distributions to Ergon 13.8 14.3 14.7 15.2 15.8 Ergon Distribution Accretion / (Dilution)—$ ($2.1) ($1.7) ($1.5) ($1.0) ($0.6) Ergon Distribution Accretion / (Dilution)—% (13.3%) (10.9%) (9.0%) (6.3%) (3.5%) Standalone Total Coverage—Common Only 2.21x 2.10x 1.96x 1.86x 1.74x Standalone Total Coverage—Common and Preferred 1.30 1.30 1.29 1.28 1.27 Pro Forma Total Coverage—Common Only 1.30 1.30 1.30 1.30 1.30 Source: BKEP management Note: Common LP distributions include amounts to phantom and restricted units 10
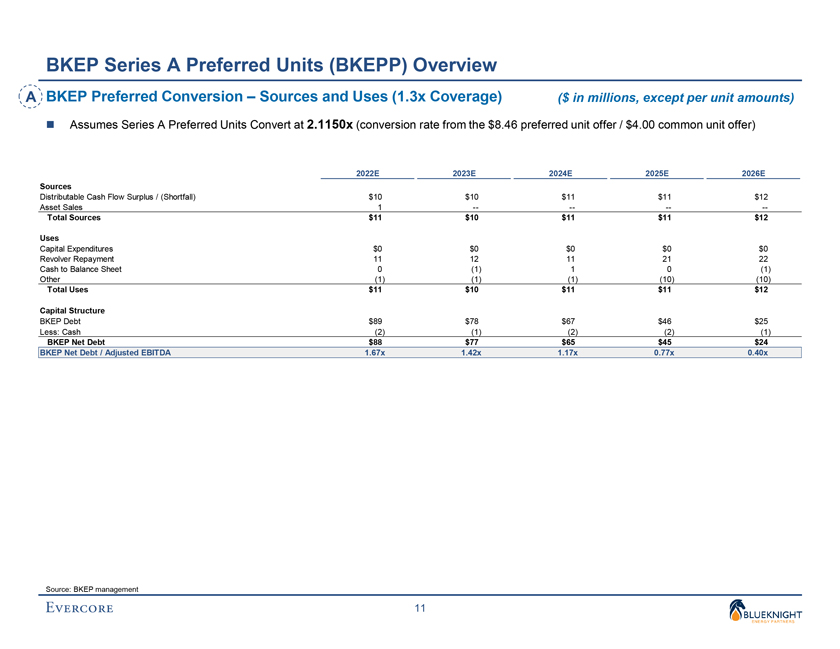
Preliminary Draft – Confidential BKEP Series A Preferred Units (BKEPP) Overview A BKEP Preferred Conversion – Sources and Uses (1.3x Coverage) ($ in millions, except per unit amounts) ï® Assumes Series A Preferred Units Convert at 2.1150x (conversion rate from the $8.46 preferred unit offer / $4.00 common unit offer) 2022E 2023E 2024E 2025E 2026E Sources Distributable Cash Flow Surplus / (Shortfall) $10 $10 $11 $11 $12 Asset Sales 1 -———- Total Sources $11 $10 $11 $11 $12 Uses Capital Expenditures $0 $0 $0 $0 $0 Revolver Repayment 11 12 11 21 22 Cash to Balance Sheet 0 (1) 1 0 (1) Other (1) (1) (1) (10) (10) Total Uses $11 $10 $11 $11 $12 Capital Structure BKEP Debt $89 $78 $67 $46 $25 Less: Cash (2) (1) (2) (2) (1) BKEP Net Debt $88 $77 $65 $45 $24 BKEP Net Debt / Adjusted EBITDA 1.67x 1.42x 1.17x 0.77x 0.40x Source: BKEP management 11
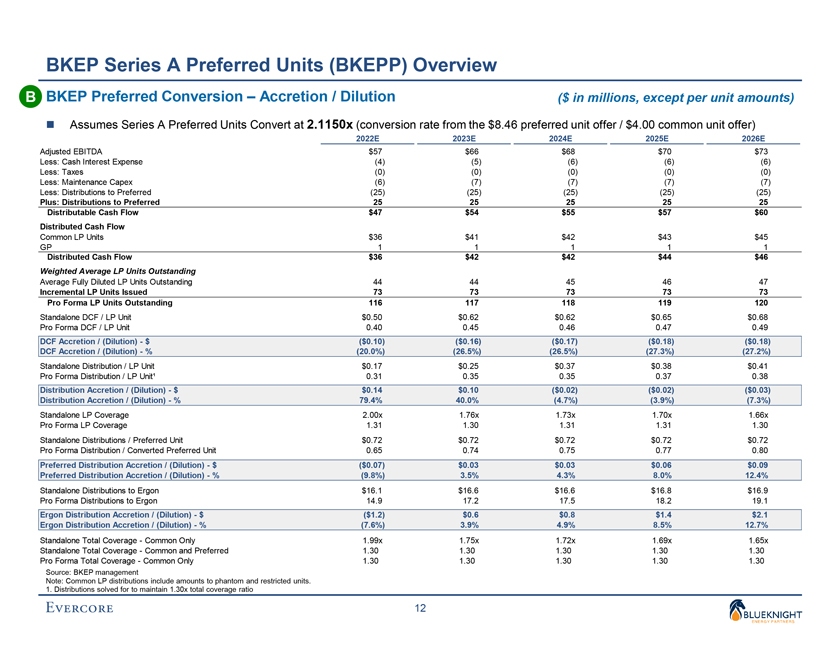
Preliminary Draft – Confidential BKEP Series A Preferred Units (BKEPP) Overview B BKEP Preferred Conversion – Accretion / Dilution ($ in millions, except per unit amounts) ï® Assumes Series A Preferred Units Convert at 2.1150x (conversion rate from the $8.46 preferred unit offer / $4.00 common unit offer) 2022E 2023E 2024E 2025E 2026E Adjusted EBITDA $57 $66 $68 $70 $73 Less: Cash Interest Expense (4) (5) (6) (6) (6) Less: Taxes (0) (0) (0) (0) (0) Less: Maintenance Capex (6) (7) (7) (7) (7) Less: Distributions to Preferred (25) (25) (25) (25) (25) Plus: Distributions to Preferred 25 25 25 25 25 Distributable Cash Flow $47 $54 $55 $57 $60 Distributed Cash Flow Common LP Units $36 $41 $42 $43 $45 GP 1 1 1 1 1 Distributed Cash Flow $36 $42 $42 $44 $46 Weighted Average LP Units Outstanding Average Fully Diluted LP Units Outstanding 44 44 45 46 47 Incremental LP Units Issued 73 73 73 73 73 Pro Forma LP Units Outstanding 116 117 118 119 120 Standalone DCF / LP Unit $0.50 $0.62 $0.62 $0.65 $0.68 Pro Forma DCF / LP Unit 0.40 0.45 0.46 0.47 0.49 DCF Accretion / (Dilution)—$ ($0.10) ($0.16) ($0.17) ($0.18) ($0.18) DCF Accretion / (Dilution)—% (20.0%) (26.5%) (26.5%) (27.3%) (27.2%) Standalone Distribution / LP Unit $0.17 $0.25 $0.37 $0.38 $0.41 Pro Forma Distribution / LP Unit¹ 0.31 0.35 0.35 0.37 0.38 Distribution Accretion / (Dilution)—$ $0.14 $0.10 ($0.02) ($0.02) ($0.03) Distribution Accretion / (Dilution)—% 79.4% 40.0% (4.7%) (3.9%) (7.3%) Standalone LP Coverage 2.00x 1.76x 1.73x 1.70x 1.66x Pro Forma LP Coverage 1.31 1.30 1.31 1.31 1.30 Standalone Distributions / Preferred Unit $0.72 $0.72 $0.72 $0.72 $0.72 Pro Forma Distribution / Converted Preferred Unit 0.65 0.74 0.75 0.77 0.80 Preferred Distribution Accretion / (Dilution)—$ ($0.07) $0.03 $0.03 $0.06 $0.09 Preferred Distribution Accretion / (Dilution)—% (9.8%) 3.5% 4.3% 8.0% 12.4% Standalone Distributions to Ergon $16.1 $16.6 $16.6 $16.8 $16.9 Pro Forma Distributions to Ergon 14.9 17.2 17.5 18.2 19.1 Ergon Distribution Accretion / (Dilution)—$ ($1.2) $0.6 $0.8 $1.4 $2.1 Ergon Distribution Accretion / (Dilution)—% (7.6%) 3.9% 4.9% 8.5% 12.7% Standalone Total Coverage—Common Only 1.99x 1.75x 1.72x 1.69x 1.65x Standalone Total Coverage—Common and Preferred 1.30 1.30 1.30 1.30 1.30 Pro Forma Total Coverage—Common Only 1.30 1.30 1.30 1.30 1.30 Source: BKEP management Note: Common LP distributions include amounts to phantom and restricted units. 1. Distributions solved for to maintain 1.30x total coverage ratio 12
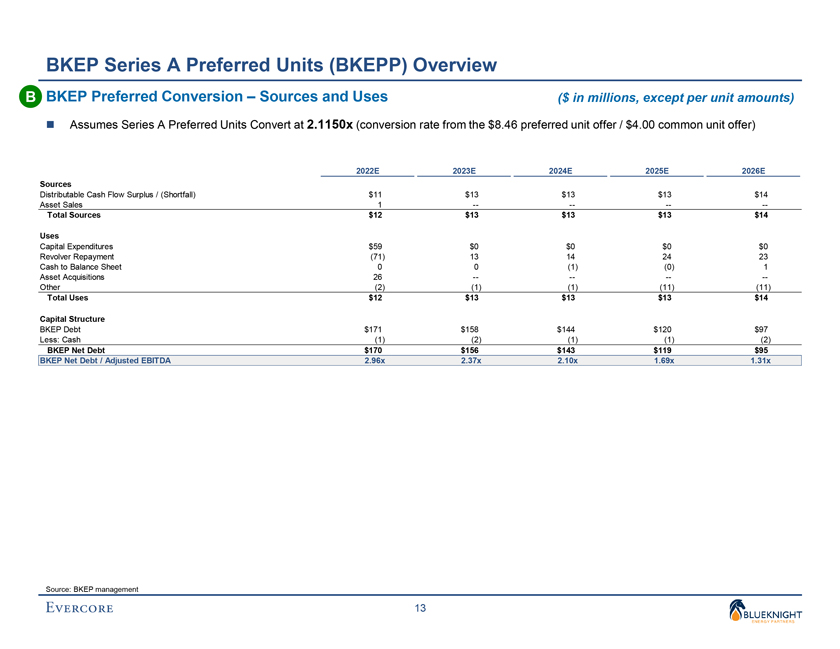
Preliminary Draft – Confidential BKEP Series A Preferred Units (BKEPP) Overview B BKEP Preferred Conversion – Sources and Uses ($ in millions, except per unit amounts) ï® Assumes Series A Preferred Units Convert at 2.1150x (conversion rate from the $8.46 preferred unit offer / $4.00 common unit offer) 2022E 2023E 2024E 2025E 2026E Sources Distributable Cash Flow Surplus / (Shortfall) $11 $13 $13 $13 $14 Asset Sales 1 -———- Total Sources $12 $13 $13 $13 $14 Uses Capital Expenditures $59 $0 $0 $0 $0 Revolver Repayment (71) 13 14 24 23 Cash to Balance Sheet 0 0 (1) (0) 1 Asset Acquisitions 26 -———-Other (2) (1) (1) (11) (11) Total Uses $12 $13 $13 $13 $14 Capital Structure BKEP Debt $171 $158 $144 $120 $97 Less: Cash (1) (2) (1) (1) (2) BKEP Net Debt $170 $156 $143 $119 $95 BKEP Net Debt / Adjusted EBITDA 2.96x 2.37x 2.10x 1.69x 1.31x Source: BKEP management 13
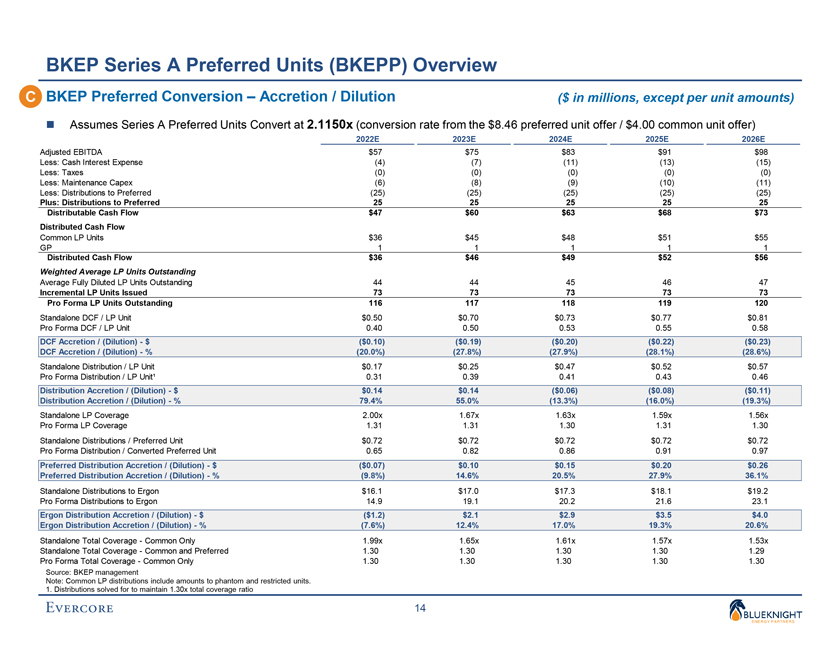
Preliminary Draft – Confidential BKEP Series A Preferred Units (BKEPP) Overview C BKEP Preferred Conversion – Accretion / Dilution ($ in millions, except per unit amounts) ï® Assumes Series A Preferred Units Convert at 2.1150x (conversion rate from the $8.46 preferred unit offer / $4.00 common unit offer) 2022E 2023E 2024E 2025E 2026E Adjusted EBITDA $57 $75 $83 $91 $98 Less: Cash Interest Expense (4) (7) (11) (13) (15) Less: Taxes (0) (0) (0) (0) (0) Less: Maintenance Capex (6) (8) (9) (10) (11) Less: Distributions to Preferred (25) (25) (25) (25) (25) Plus: Distributions to Preferred 25 25 25 25 25 Distributable Cash Flow $47 $60 $63 $68 $73 Distributed Cash Flow Common LP Units $36 $45 $48 $51 $55 GP 1 1 1 1 1 Distributed Cash Flow $36 $46 $49 $52 $56 Weighted Average LP Units Outstanding Average Fully Diluted LP Units Outstanding 44 44 45 46 47 Incremental LP Units Issued 73 73 73 73 73 Pro Forma LP Units Outstanding 116 117 118 119 120 Standalone DCF / LP Unit $0.50 $0.70 $0.73 $0.77 $0.81 Pro Forma DCF / LP Unit 0.40 0.50 0.53 0.55 0.58 DCF Accretion / (Dilution)—$ ($0.10) ($0.19) ($0.20) ($0.22) ($0.23) DCF Accretion / (Dilution)—% (20.0%) (27.8%) (27.9%) (28.1%) (28.6%) Standalone Distribution / LP Unit $0.17 $0.25 $0.47 $0.52 $0.57 Pro Forma Distribution / LP Unit¹ 0.31 0.39 0.41 0.43 0.46 Distribution Accretion / (Dilution)—$ $0.14 $0.14 ($0.06) ($0.08) ($0.11) Distribution Accretion / (Dilution)—% 79.4% 55.0% (13.3%) (16.0%) (19.3%) Standalone LP Coverage 2.00x 1.67x 1.63x 1.59x 1.56x Pro Forma LP Coverage 1.31 1.31 1.30 1.31 1.30 Standalone Distributions / Preferred Unit $0.72 $0.72 $0.72 $0.72 $0.72 Pro Forma Distribution / Converted Preferred Unit 0.65 0.82 0.86 0.91 0.97 Preferred Distribution Accretion / (Dilution)—$ ($0.07) $0.10 $0.15 $0.20 $0.26 Preferred Distribution Accretion / (Dilution)—% (9.8%) 14.6% 20.5% 27.9% 36.1% Standalone Distributions to Ergon $16.1 $17.0 $17.3 $18.1 $19.2 Pro Forma Distributions to Ergon 14.9 19.1 20.2 21.6 23.1 Ergon Distribution Accretion / (Dilution)—$ ($1.2) $2.1 $2.9 $3.5 $4.0 Ergon Distribution Accretion / (Dilution)—% (7.6%) 12.4% 17.0% 19.3% 20.6% Standalone Total Coverage—Common Only 1.99x 1.65x 1.61x 1.57x 1.53x Standalone Total Coverage—Common and Preferred 1.30 1.30 1.30 1.30 1.29 Pro Forma Total Coverage—Common Only 1.30 1.30 1.30 1.30 1.30 Source: BKEP management Note: Common LP distributions include amounts to phantom and restricted units. 1. Distributions solved for to maintain 1.30x total coverage ratio 14
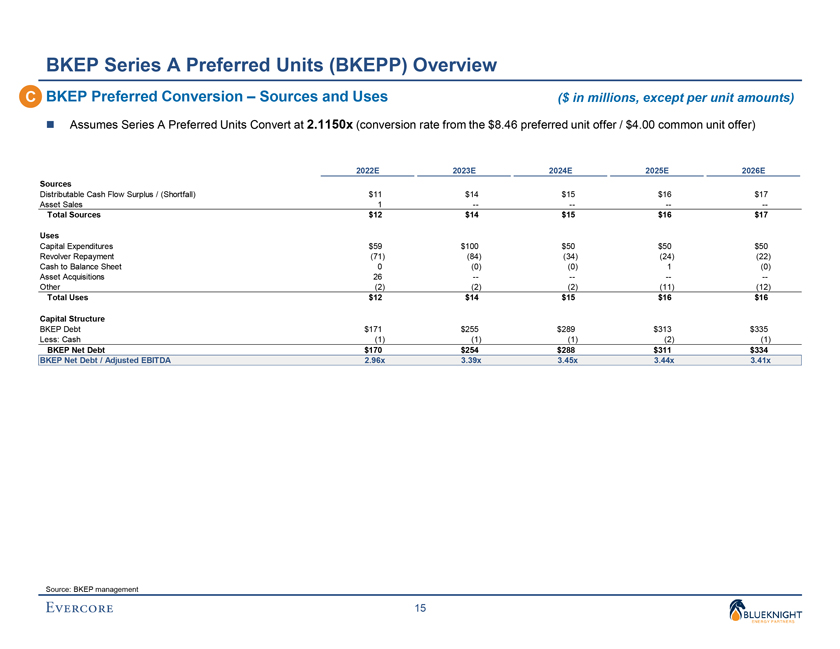
Preliminary Draft – Confidential BKEP Series A Preferred Units (BKEPP) Overview C BKEP Preferred Conversion – Sources and Uses ($ in millions, except per unit amounts) ï® Assumes Series A Preferred Units Convert at 2.1150x (conversion rate from the $8.46 preferred unit offer / $4.00 common unit offer) 2022E 2023E 2024E 2025E 2026E Sources Distributable Cash Flow Surplus / (Shortfall) $11 $14 $15 $16 $17 Asset Sales 1 -———- Total Sources $12 $14 $15 $16 $17 Uses Capital Expenditures $59 $100 $50 $50 $50 Revolver Repayment (71) (84) (34) (24) (22) Cash to Balance Sheet 0 (0) (0) 1 (0) Asset Acquisitions 26 -———-Other (2) (2) (2) (11) (12) Total Uses $12 $14 $15 $16 $16 Capital Structure BKEP Debt $171 $255 $289 $313 $335 Less: Cash (1) (1) (1) (2) (1) BKEP Net Debt $170 $254 $288 $311 $334 BKEP Net Debt / Adjusted EBITDA 2.96x 3.39x 3.45x 3.44x 3.41x Source: BKEP management 15