1 Better Health, Brighter Future TAKEDA'S EXECUTIVE COMPENSATION OVERVIEW Takeda's executive compensation strategy supports our position as a patient-focused, values-based, R&D-driven global biopharmaceutical company. We have an experienced and diverse Takeda Executive Team (the “TET”), representing seven nationalities and located in two countries, which includes three members of our Board of Directors (the “Internal Directors”)1. Our executive compensation program is designed to be globally competitive and performance-oriented, while also considering local market factors. Table of Contents Page Executive Summary 2 Compensation Philosophy and Objectives 3 Fiscal Year 2025 Business Performance Highlights 3 R&D Performance Highlights 4 Total Shareholder Return (TSR) Performance Relative to Peers Compensation Components 5 Base Salary 5 Short-term Incentive (STI) 5 Long-term Incentives (LTI) 5 Performance Share Unit (PSU) Awards 5 Restricted Stock Unit (RSU) Awards How We Link Pay and Performance 5 Pay and Performance Alignment: Pay Mix 6 Fiscal Year 2025 Incentive Compensation Program Highlights 6 Fiscal Year 2025 STI Performance Metrics and Rationale 7 Fiscal Year 2023-2025 PSU Awards Performance Metrics and Rationale 7 Fiscal Year 2025 STI: Performance and Payout 8 Fiscal Year 2023-2025 PSU Awards: Performance and Payout 9 Fiscal Year 2023–2025 PSU R&D KPI Achievement 11 Fiscal Year 2023-2025 TSR Performance Relative to Peers 12 Looking Forward Fiscal Year 2026 Incentive Compensation Program 13 KPIs for Fiscal Year 2026 STI and 2026-2028 PSU Awards Compensation Determination and Oversight 13 Roles and Activities of the Compensation Committee 14 Role of Independent Compensation Consultant 14 Comparative Framework and Peer Group 15 Compensation Determination 15 How We Set Target Pay 16 Compensation Determination for Internal Directors 16 Compensation Determination for Other TET members 16 Key Performance Indicator (KPI) Determination 17 Compensation Risk Assessment Other Matters 17 2026 Chief Executive Officer Succession 18 Retirement of the Current CEO 18 Shareholding Requirement 19 Recoupment (Clawback) Policy 19 Shareholder Engagement 1For details related to Takeda leadership, please refer to the Business Report in the Notice of Convocation of the 150th Annual General Meeting of Shareholders
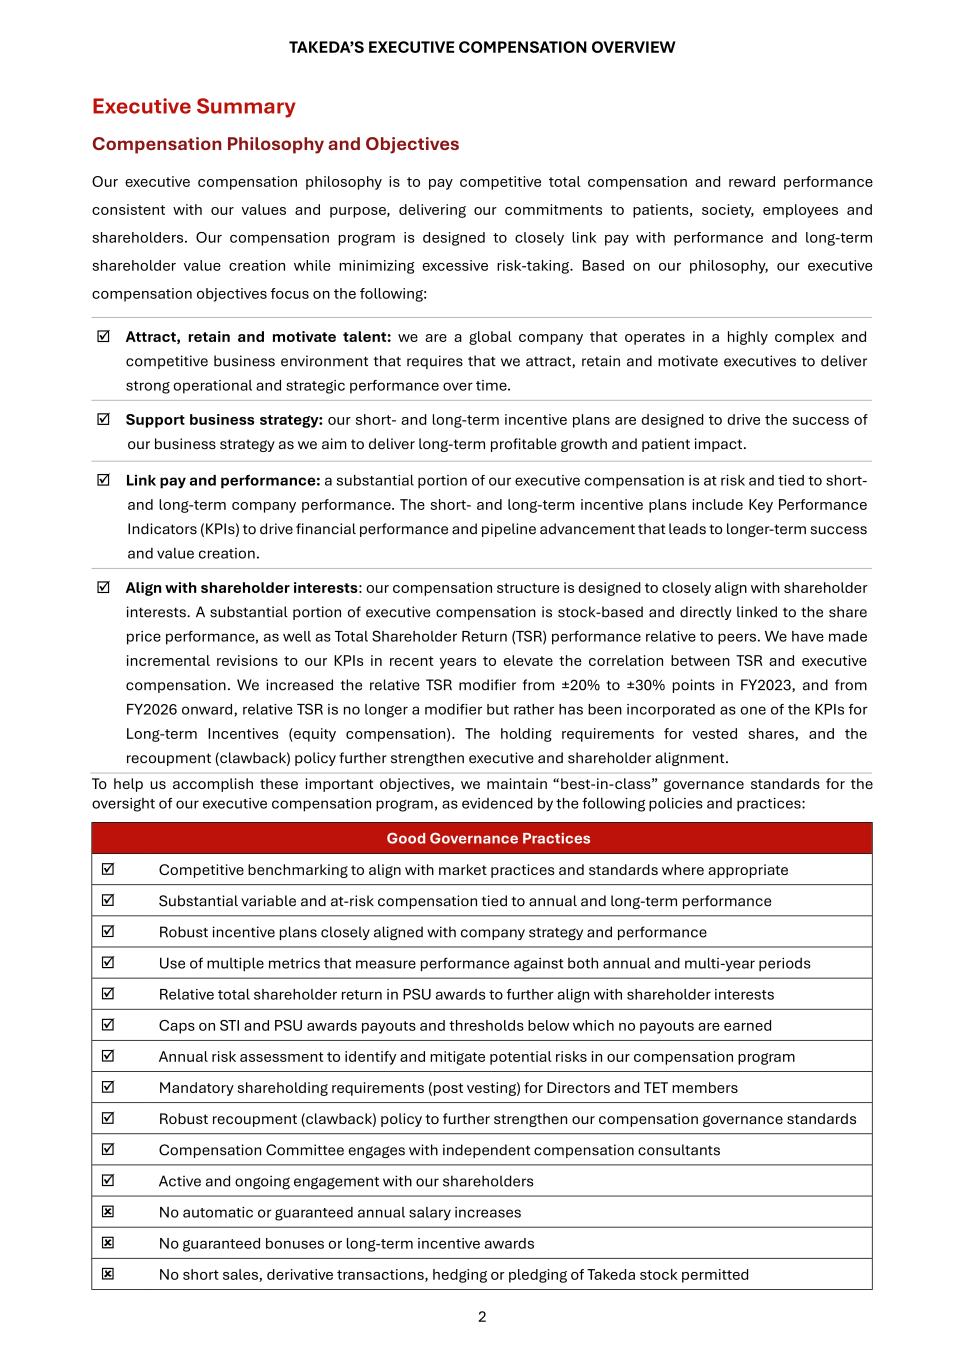
TAKEDA’S EXECUTIVE COMPENSATION OVERVIEW 2 Executive Summary Compensation Philosophy and Objectives Our executive compensation philosophy is to pay competitive total compensation and reward performance consistent with our values and purpose, delivering our commitments to patients, society, employees and shareholders. Our compensation program is designed to closely link pay with performance and long-term shareholder value creation while minimizing excessive risk-taking. Based on our philosophy, our executive compensation objectives focus on the following: Attract, retain and motivate talent: we are a global company that operates in a highly complex and competitive business environment that requires that we attract, retain and motivate executives to deliver strong operational and strategic performance over time. Support business strategy: our short- and long-term incentive plans are designed to drive the success of our business strategy as we aim to deliver long-term profitable growth and patient impact. Link pay and performance: a substantial portion of our executive compensation is at risk and tied to short- and long-term company performance. The short- and long-term incentive plans include Key Performance Indicators (KPIs) to drive financial performance and pipeline advancement that leads to longer-term success and value creation. Align with shareholder interests: our compensation structure is designed to closely align with shareholder interests. A substantial portion of executive compensation is stock-based and directly linked to the share price performance, as well as Total Shareholder Return (TSR) performance relative to peers. We have made incremental revisions to our KPIs in recent years to elevate the correlation between TSR and executive compensation. We increased the relative TSR modifier from ±20% to ±30% points in FY2023, and from FY2026 onward, relative TSR is no longer a modifier but rather has been incorporated as one of the KPIs for Long-term Incentives (equity compensation). The holding requirements for vested shares, and the recoupment (clawback) policy further strengthen executive and shareholder alignment. To help us accomplish these important objectives, we maintain “best-in-class” governance standards for the oversight of our executive compensation program, as evidenced by the following policies and practices: Good Governance Practices Competitive benchmarking to align with market practices and standards where appropriate Substantial variable and at-risk compensation tied to annual and long-term performance Robust incentive plans closely aligned with company strategy and performance Use of multiple metrics that measure performance against both annual and multi-year periods Relative total shareholder return in PSU awards to further align with shareholder interests Caps on STI and PSU awards payouts and thresholds below which no payouts are earned Annual risk assessment to identify and mitigate potential risks in our compensation program Mandatory shareholding requirements (post vesting) for Directors and TET members Robust recoupment (clawback) policy to further strengthen our compensation governance standards Compensation Committee engages with independent compensation consultants Active and ongoing engagement with our shareholders No automatic or guaranteed annual salary increases No guaranteed bonuses or long-term incentive awards No short sales, derivative transactions, hedging or pledging of Takeda stock permitted
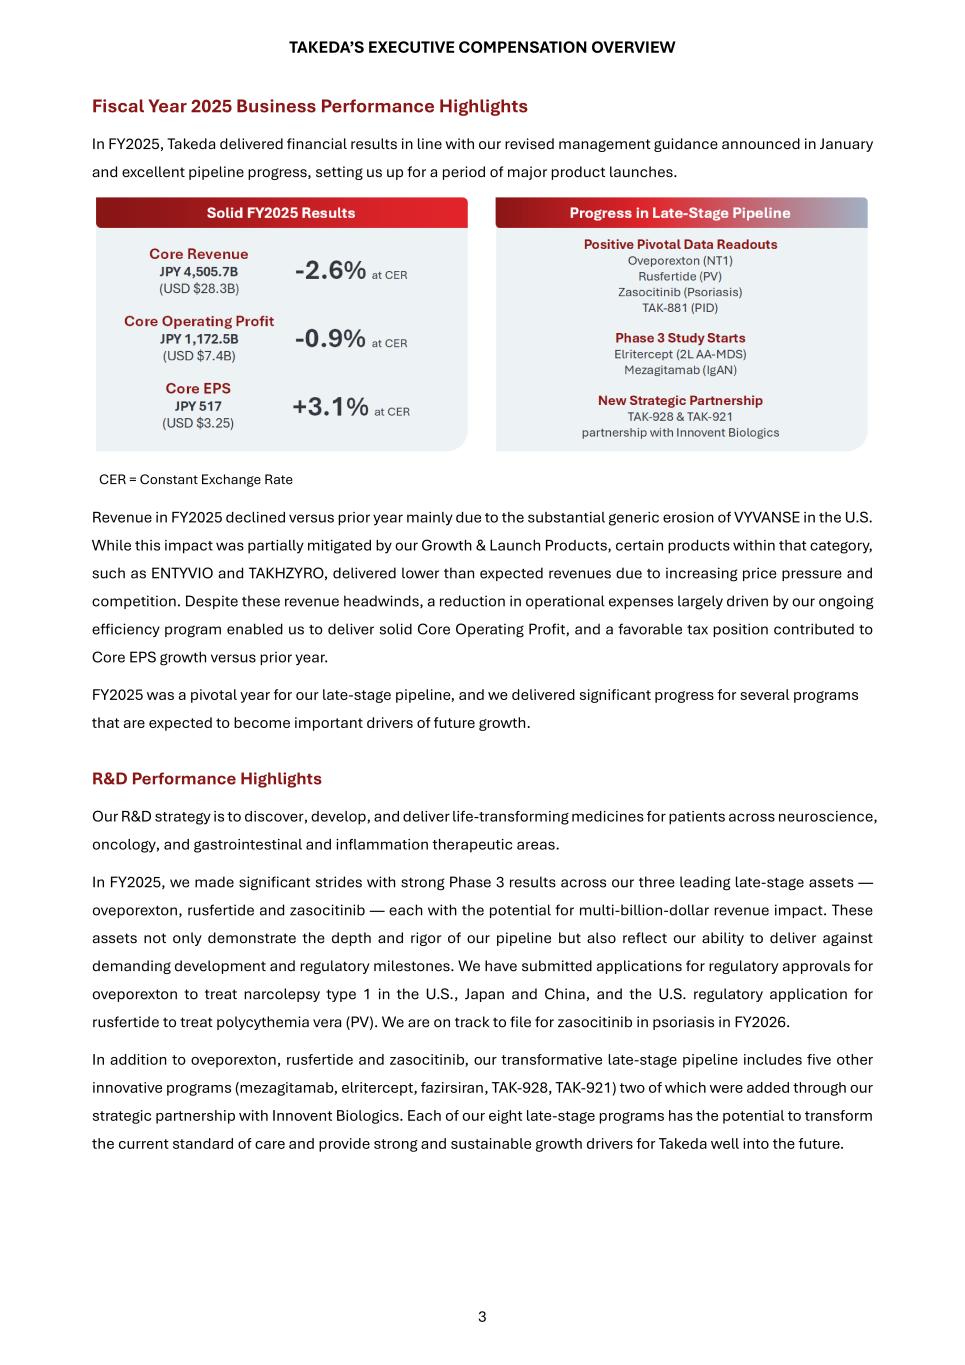
TAKEDA’S EXECUTIVE COMPENSATION OVERVIEW 3 Fiscal Year 2025 Business Performance Highlights In FY2025, Takeda delivered financial results in line with our revised management guidance announced in January and excellent pipeline progress, setting us up for a period of major product launches. CER = Constant Exchange Rate Revenue in FY2025 declined versus prior year mainly due to the substantial generic erosion of VYVANSE in the U.S. While this impact was partially mitigated by our Growth & Launch Products, certain products within that category, such as ENTYVIO and TAKHZYRO, delivered lower than expected revenues due to increasing price pressure and competition. Despite these revenue headwinds, a reduction in operational expenses largely driven by our ongoing efficiency program enabled us to deliver solid Core Operating Profit, and a favorable tax position contributed to Core EPS growth versus prior year. FY2025 was a pivotal year for our late-stage pipeline, and we delivered significant progress for several programs that are expected to become important drivers of future growth. R&D Performance Highlights Our R&D strategy is to discover, develop, and deliver life-transforming medicines for patients across neuroscience, oncology, and gastrointestinal and inflammation therapeutic areas. In FY2025, we made significant strides with strong Phase 3 results across our three leading late-stage assets — oveporexton, rusfertide and zasocitinib — each with the potential for multi-billion-dollar revenue impact. These assets not only demonstrate the depth and rigor of our pipeline but also reflect our ability to deliver against demanding development and regulatory milestones. We have submitted applications for regulatory approvals for oveporexton to treat narcolepsy type 1 in the U.S., Japan and China, and the U.S. regulatory application for rusfertide to treat polycythemia vera (PV). We are on track to file for zasocitinib in psoriasis in FY2026. In addition to oveporexton, rusfertide and zasocitinib, our transformative late-stage pipeline includes five other innovative programs (mezagitamab, elritercept, fazirsiran, TAK-928, TAK-921) two of which were added through our strategic partnership with Innovent Biologics. Each of our eight late-stage programs has the potential to transform the current standard of care and provide strong and sustainable growth drivers for Takeda well into the future.
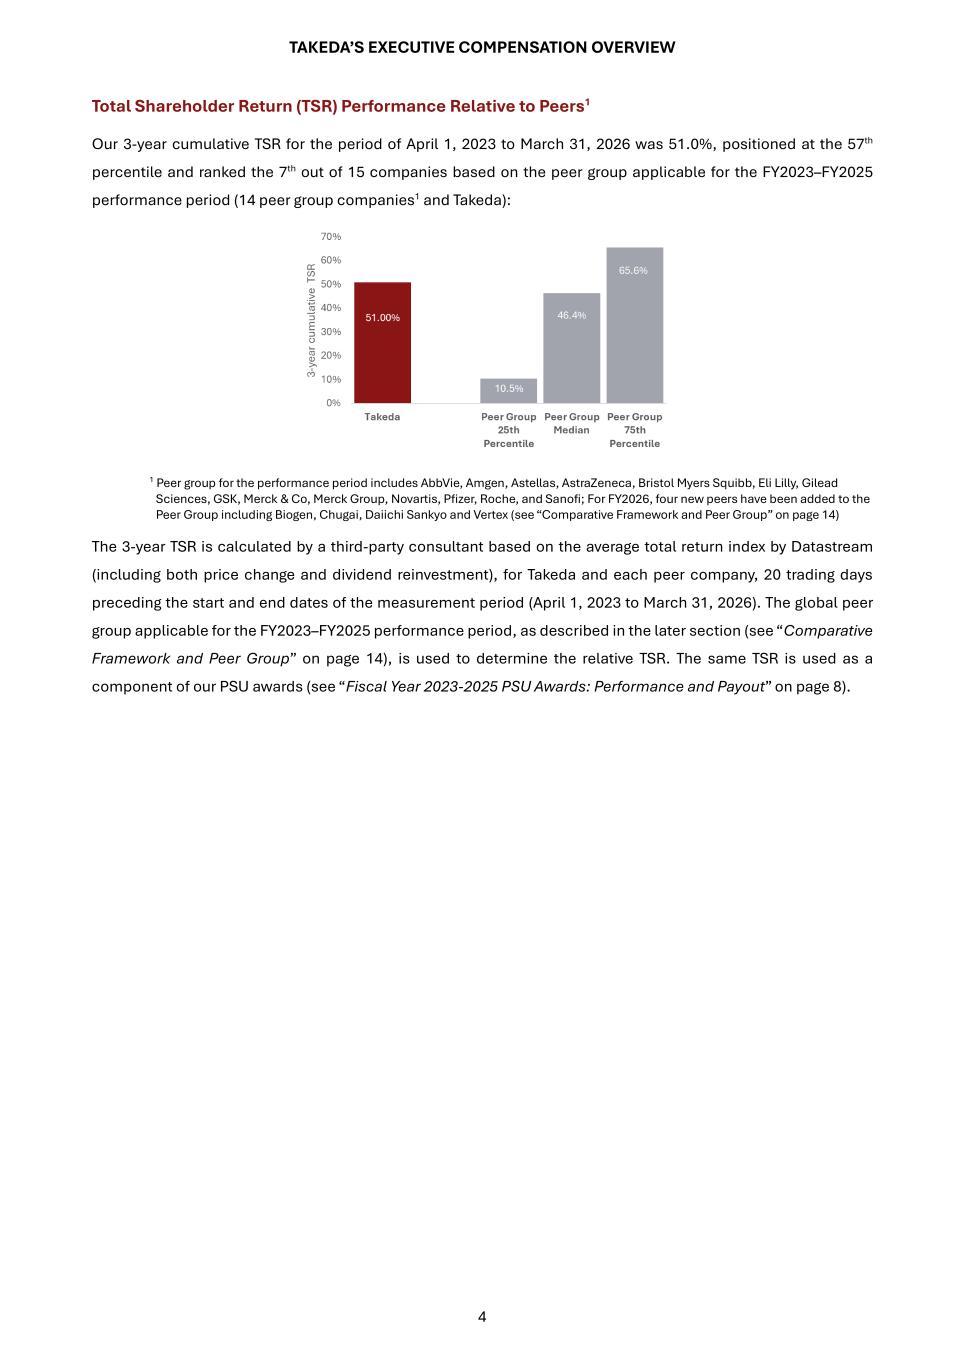
TAKEDA’S EXECUTIVE COMPENSATION OVERVIEW 4 Total Shareholder Return (TSR) Performance Relative to Peers1 Our 3-year cumulative TSR for the period of April 1, 2023 to March 31, 2026 was 51.0%, positioned at the 57th percentile and ranked the 7th out of 15 companies based on the peer group applicable for the FY2023–FY2025 performance period (14 peer group companies1 and Takeda): 1 Peer group for the performance period includes AbbVie, Amgen, Astellas, AstraZeneca, Bristol Myers Squibb, Eli Lilly, Gilead Sciences, GSK, Merck & Co, Merck Group, Novartis, Pfizer, Roche, and Sanofi; For FY2026, four new peers have been added to the Peer Group including Biogen, Chugai, Daiichi Sankyo and Vertex (see “Comparative Framework and Peer Group” on page 14) The 3-year TSR is calculated by a third-party consultant based on the average total return index by Datastream (including both price change and dividend reinvestment), for Takeda and each peer company, 20 trading days preceding the start and end dates of the measurement period (April 1, 2023 to March 31, 2026). The global peer group applicable for the FY2023–FY2025 performance period, as described in the later section (see “Comparative Framework and Peer Group” on page 14), is used to determine the relative TSR. The same TSR is used as a component of our PSU awards (see “Fiscal Year 2023-2025 PSU Awards: Performance and Payout” on page 8).
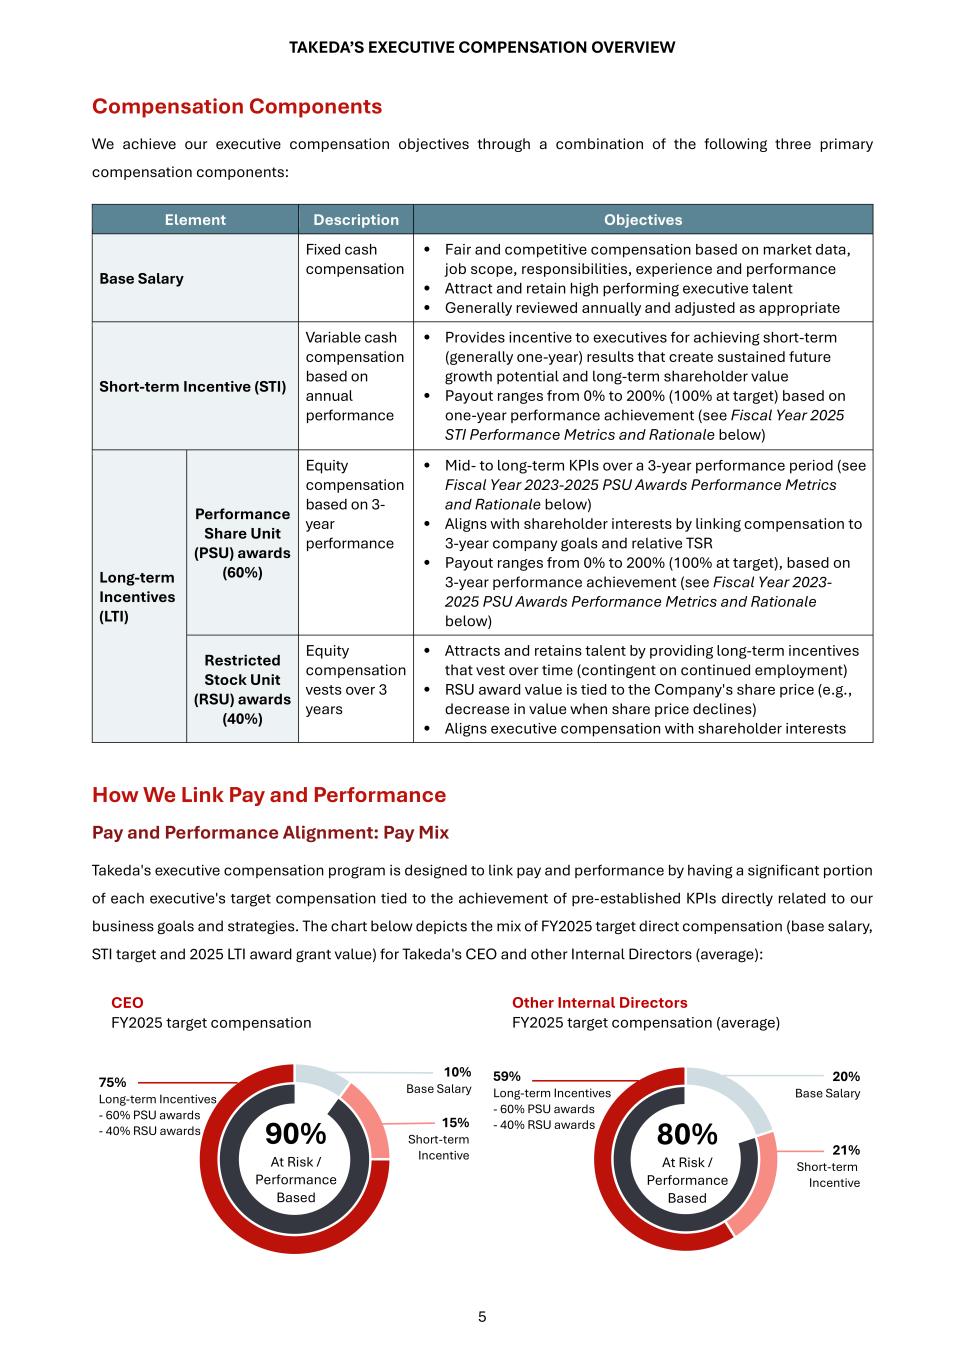
TAKEDA’S EXECUTIVE COMPENSATION OVERVIEW 5 Compensation Components We achieve our executive compensation objectives through a combination of the following three primary compensation components: How We Link Pay and Performance Pay and Performance Alignment: Pay Mix Takeda's executive compensation program is designed to link pay and performance by having a significant portion of each executive's target compensation tied to the achievement of pre-established KPIs directly related to our business goals and strategies. The chart below depicts the mix of FY2025 target direct compensation (base salary, STI target and 2025 LTI award grant value) for Takeda's CEO and other Internal Directors (average): CEO FY2025 target compensation 90% At Risk / Performance Based 10% Base Salary 15% Short-term Incentive 75% Long-term Incentives - 60% PSU awards - 40% RSU awards Other Internal Directors FY2025 target compensation (average) 80% At Risk / Performance Based 20% Base Salary 21% Short-term Incentive 59% Long-term Incentives - 60% PSU awards - 40% RSU awards Element Description Objectives Base Salary Fixed cash compensation • Fair and competitive compensation based on market data, job scope, responsibilities, experience and performance • Attract and retain high performing executive talent • Generally reviewed annually and adjusted as appropriate Short-term Incentive (STI) Variable cash compensation based on annual performance • Provides incentive to executives for achieving short-term (generally one-year) results that create sustained future growth potential and long-term shareholder value • Payout ranges from 0% to 200% (100% at target) based on one-year performance achievement (see Fiscal Year 2025 STI Performance Metrics and Rationale below) Long-term Incentives (LTI) Performance Share Unit (PSU) awards (60%) Equity compensation based on 3- year performance • Mid- to long-term KPIs over a 3-year performance period (see Fiscal Year 2023-2025 PSU Awards Performance Metrics and Rationale below) • Aligns with shareholder interests by linking compensation to 3-year company goals and relative TSR • Payout ranges from 0% to 200% (100% at target), based on 3-year performance achievement (see Fiscal Year 2023- 2025 PSU Awards Performance Metrics and Rationale below) Restricted Stock Unit (RSU) awards (40%) Equity compensation vests over 3 years • Attracts and retains talent by providing long-term incentives that vest over time (contingent on continued employment) • RSU award value is tied to the Company's share price (e.g., decrease in value when share price declines) • Aligns executive compensation with shareholder interests
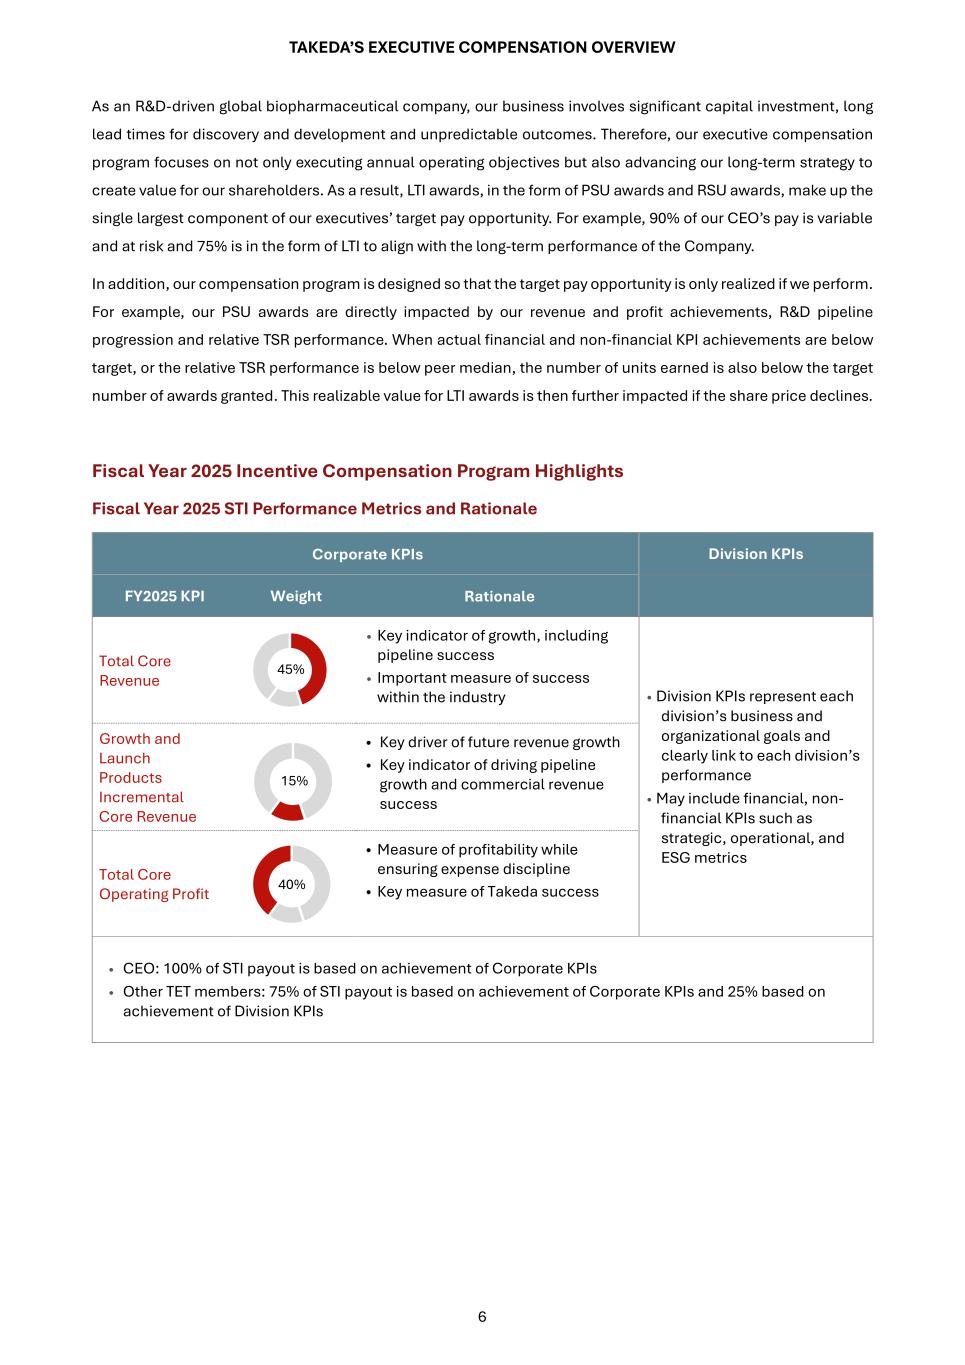
TAKEDA’S EXECUTIVE COMPENSATION OVERVIEW 6 As an R&D-driven global biopharmaceutical company, our business involves significant capital investment, long lead times for discovery and development and unpredictable outcomes. Therefore, our executive compensation program focuses on not only executing annual operating objectives but also advancing our long-term strategy to create value for our shareholders. As a result, LTI awards, in the form of PSU awards and RSU awards, make up the single largest component of our executives’ target pay opportunity. For example, 90% of our CEO’s pay is variable and at risk and 75% is in the form of LTI to align with the long-term performance of the Company. In addition, our compensation program is designed so that the target pay opportunity is only realized if we perform. For example, our PSU awards are directly impacted by our revenue and profit achievements, R&D pipeline progression and relative TSR performance. When actual financial and non-financial KPI achievements are below target, or the relative TSR performance is below peer median, the number of units earned is also below the target number of awards granted. This realizable value for LTI awards is then further impacted if the share price declines. Fiscal Year 2025 Incentive Compensation Program Highlights Fiscal Year 2025 STI Performance Metrics and Rationale Corporate KPIs Division KPIs FY2025 KPI Weight Rationale Total Core Revenue • Key indicator of growth, including pipeline success • Important measure of success within the industry • Division KPIs represent each division’s business and organizational goals and clearly link to each division’s performance • May include financial, non- financial KPIs such as strategic, operational, and ESG metrics Growth and Launch Products Incremental Core Revenue • Key driver of future revenue growth • Key indicator of driving pipeline growth and commercial revenue success Total Core Operating Profit • Measure of profitability while ensuring expense discipline • Key measure of Takeda success • CEO: 100% of STI payout is based on achievement of Corporate KPIs • Other TET members: 75% of STI payout is based on achievement of Corporate KPIs and 25% based on achievement of Division KPIs 45% 15% 40%
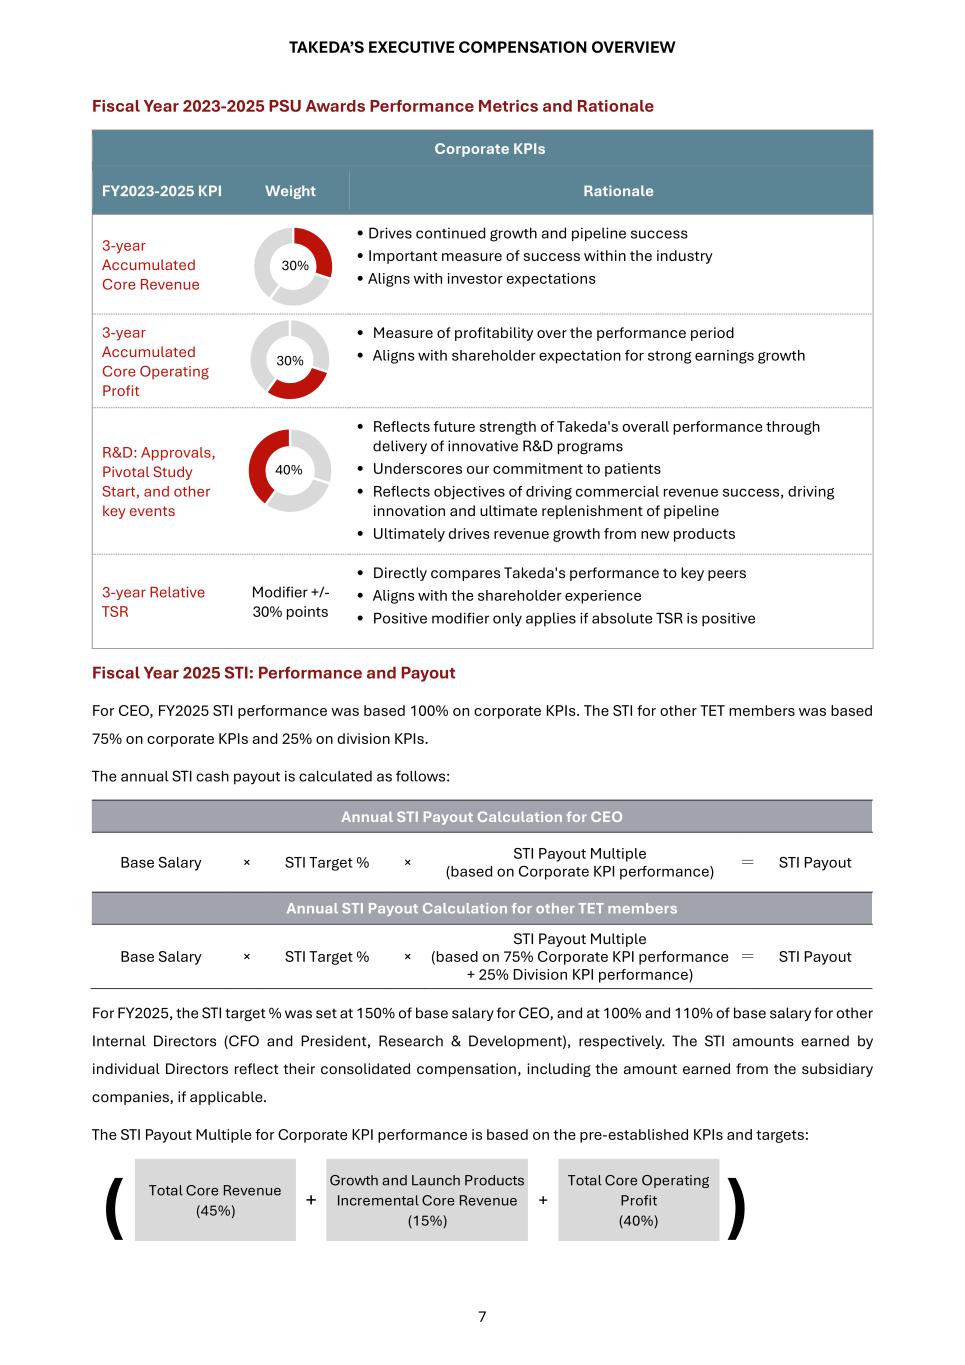
TAKEDA’S EXECUTIVE COMPENSATION OVERVIEW 7 Fiscal Year 2023-2025 PSU Awards Performance Metrics and Rationale Corporate KPIs FY2023-2025 KPI Weight Rationale 3-year Accumulated Core Revenue • Drives continued growth and pipeline success • Important measure of success within the industry • Aligns with investor expectations 3-year Accumulated Core Operating Profit • Measure of profitability over the performance period • Aligns with shareholder expectation for strong earnings growth R&D: Approvals, Pivotal Study Start, and other key events • Reflects future strength of Takeda's overall performance through delivery of innovative R&D programs • Underscores our commitment to patients • Reflects objectives of driving commercial revenue success, driving innovation and ultimate replenishment of pipeline • Ultimately drives revenue growth from new products 3-year Relative TSR Modifier +/- 30% points • Directly compares Takeda's performance to key peers • Aligns with the shareholder experience • Positive modifier only applies if absolute TSR is positive Fiscal Year 2025 STI: Performance and Payout For CEO, FY2025 STI performance was based 100% on corporate KPIs. The STI for other TET members was based 75% on corporate KPIs and 25% on division KPIs. The annual STI cash payout is calculated as follows: Annual STI Payout Calculation for CEO Base Salary × STI Target % × STI Payout Multiple (based on Corporate KPI performance) = STI Payout Annual STI Payout Calculation for other TET members Base Salary × STI Target % × STI Payout Multiple (based on 75% Corporate KPI performance + 25% Division KPI performance) = STI Payout For FY2025, the STI target % was set at 150% of base salary for CEO, and at 100% and 110% of base salary for other Internal Directors (CFO and President, Research & Development), respectively. The STI amounts earned by individual Directors reflect their consolidated compensation, including the amount earned from the subsidiary companies, if applicable. The STI Payout Multiple for Corporate KPI performance is based on the pre-established KPIs and targets: ( Total Core Revenue (45%) + Growth and Launch Products Incremental Core Revenue (15%) + Total Core Operating Profit (40%) ) 30% 30% 40%
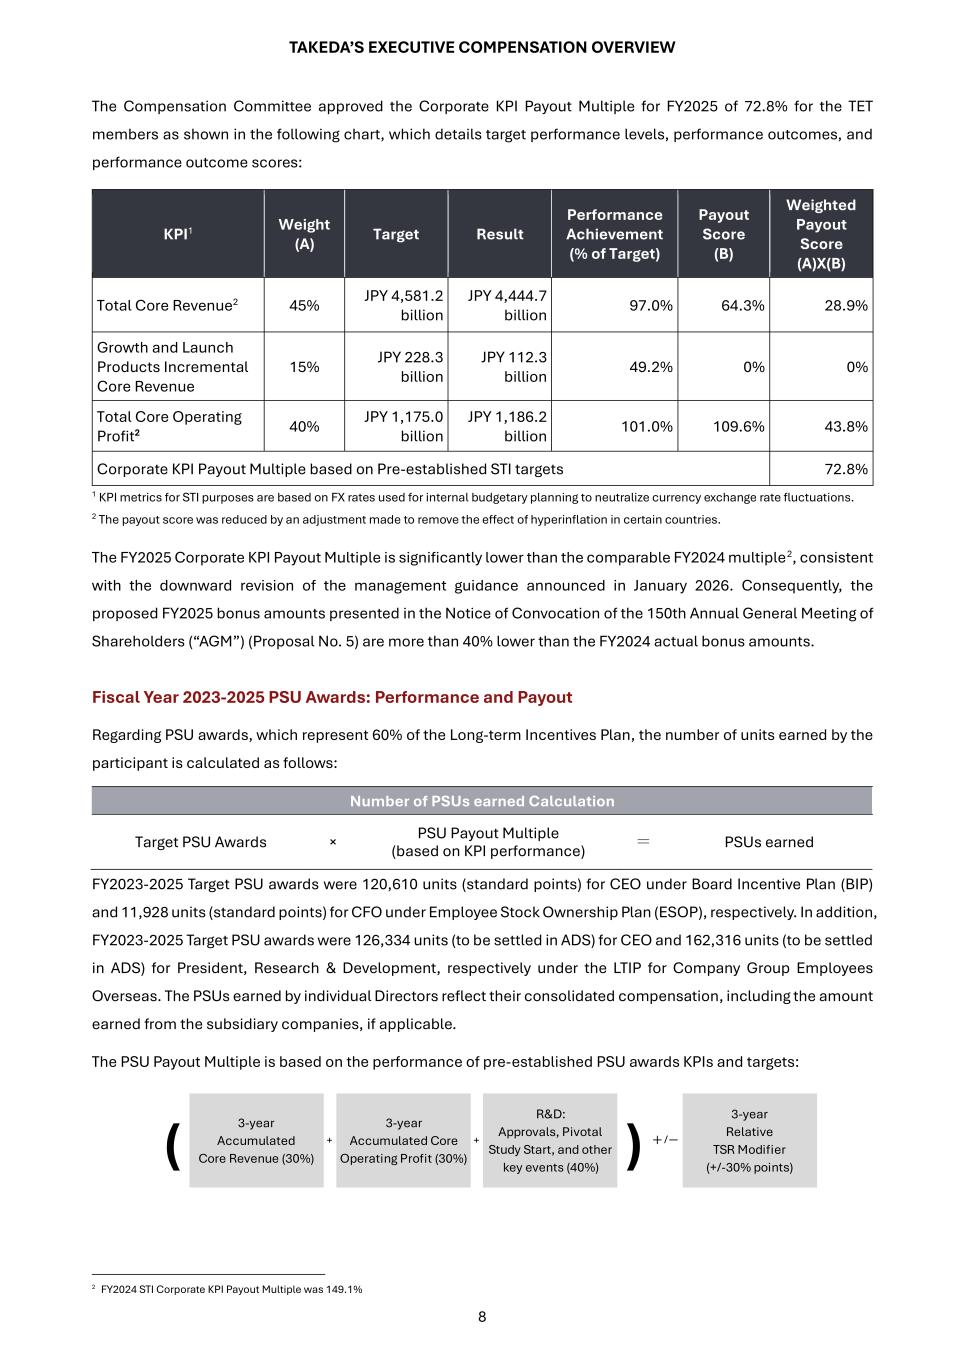
TAKEDA’S EXECUTIVE COMPENSATION OVERVIEW 8 The Compensation Committee approved the Corporate KPI Payout Multiple for FY2025 of 72.8% for the TET members as shown in the following chart, which details target performance levels, performance outcomes, and performance outcome scores: 1 KPI metrics for STI purposes are based on FX rates used for internal budgetary planning to neutralize currency exchange rate fluctuations. 2 The payout score was reduced by an adjustment made to remove the effect of hyperinflation in certain countries. The FY2025 Corporate KPI Payout Multiple is significantly lower than the comparable FY2024 multiple2, consistent with the downward revision of the management guidance announced in January 2026. Consequently, the proposed FY2025 bonus amounts presented in the Notice of Convocation of the 150th Annual General Meeting of Shareholders (“AGM”) (Proposal No. 5) are more than 40% lower than the FY2024 actual bonus amounts. Fiscal Year 2023-2025 PSU Awards: Performance and Payout Regarding PSU awards, which represent 60% of the Long-term Incentives Plan, the number of units earned by the participant is calculated as follows: Number of PSUs earned Calculation Target PSU Awards × PSU Payout Multiple (based on KPI performance) = PSUs earned FY2023-2025 Target PSU awards were 120,610 units (standard points) for CEO under Board Incentive Plan (BIP) and 11,928 units (standard points) for CFO under Employee Stock Ownership Plan (ESOP), respectively. In addition, FY2023-2025 Target PSU awards were 126,334 units (to be settled in ADS) for CEO and 162,316 units (to be settled in ADS) for President, Research & Development, respectively under the LTIP for Company Group Employees Overseas. The PSUs earned by individual Directors reflect their consolidated compensation, including the amount earned from the subsidiary companies, if applicable. The PSU Payout Multiple is based on the performance of pre-established PSU awards KPIs and targets: 2 FY2024 STI Corporate KPI Payout Multiple was 149.1% ( 3-year Accumulated Core Revenue (30%) + 3-year Accumulated Core Operating Profit (30%) + R&D: Approvals, Pivotal Study Start, and other key events (40%) ) +/- 3-year Relative TSR Modifier (+/-30% points) KPI1 Weight (A) Target Result Performance Achievement (% of Target) Payout Score (B) Weighted Payout Score (A)X(B) Total Core Revenue2 45% JPY 4,581.2 billion JPY 4,444.7 billion 97.0% 64.3% 28.9% Growth and Launch Products Incremental Core Revenue 15% JPY 228.3 billion JPY 112.3 billion 49.2% 0% 0% Total Core Operating Profit2 40% JPY 1,175.0 billion JPY 1,186.2 billion 101.0% 109.6% 43.8% Corporate KPI Payout Multiple based on Pre-established STI targets 72.8%
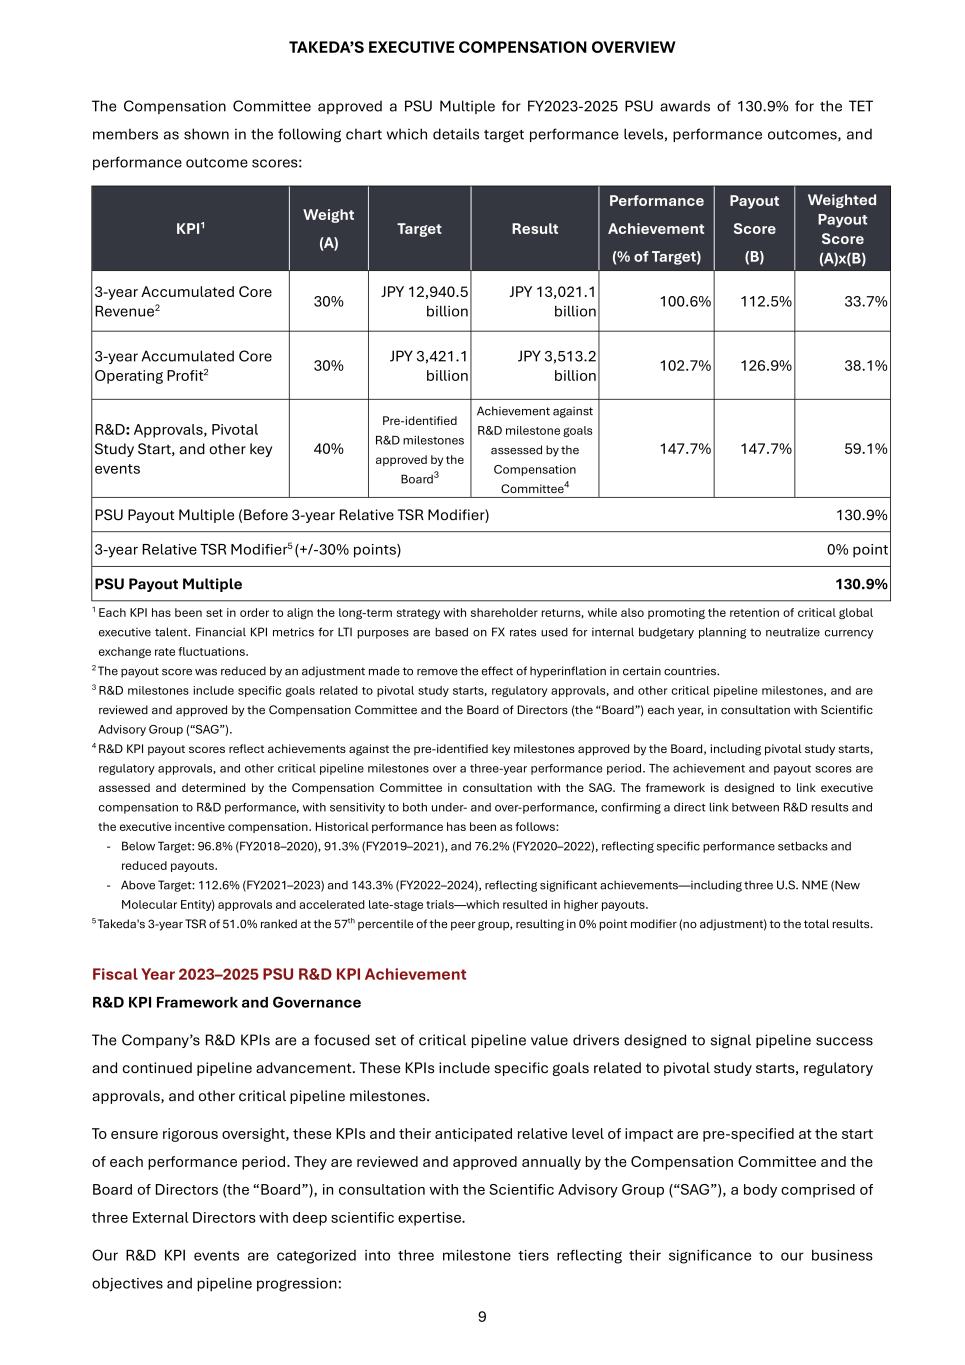
TAKEDA’S EXECUTIVE COMPENSATION OVERVIEW 9 The Compensation Committee approved a PSU Multiple for FY2023-2025 PSU awards of 130.9% for the TET members as shown in the following chart which details target performance levels, performance outcomes, and performance outcome scores: KPI1 Weight (A) Target Result Performance Achievement (% of Target) Payout Score (B) Weighted Payout Score (A)x(B) 3-year Accumulated Core Revenue2 30% JPY 12,940.5 billion JPY 13,021.1 billion 100.6% 112.5% 33.7% 3-year Accumulated Core Operating Profit2 30% JPY 3,421.1 billion JPY 3,513.2 billion 102.7% 126.9% 38.1% R&D: Approvals, Pivotal Study Start, and other key events 40% Pre-identified R&D milestones approved by the Board3 Achievement against R&D milestone goals assessed by the Compensation Committee4 147.7% 147.7% 59.1% PSU Payout Multiple (Before 3-year Relative TSR Modifier) 130.9% 3-year Relative TSR Modifier5 (+/-30% points) 0% point PSU Payout Multiple 130.9% 1 Each KPI has been set in order to align the long-term strategy with shareholder returns, while also promoting the retention of critical global executive talent. Financial KPI metrics for LTI purposes are based on FX rates used for internal budgetary planning to neutralize currency exchange rate fluctuations. 2 The payout score was reduced by an adjustment made to remove the effect of hyperinflation in certain countries. 3 R&D milestones include specific goals related to pivotal study starts, regulatory approvals, and other critical pipeline milestones, and are reviewed and approved by the Compensation Committee and the Board of Directors (the “Board”) each year, in consultation with Scientific Advisory Group (“SAG”). 4 R&D KPI payout scores reflect achievements against the pre-identified key milestones approved by the Board, including pivotal study starts, regulatory approvals, and other critical pipeline milestones over a three-year performance period. The achievement and payout scores are assessed and determined by the Compensation Committee in consultation with the SAG. The framework is designed to link executive compensation to R&D performance, with sensitivity to both under- and over-performance, confirming a direct link between R&D results and the executive incentive compensation. Historical performance has been as follows: - Below Target: 96.8% (FY2018–2020), 91.3% (FY2019–2021), and 76.2% (FY2020–2022), reflecting specific performance setbacks and reduced payouts. - Above Target: 112.6% (FY2021–2023) and 143.3% (FY2022–2024), reflecting significant achievements—including three U.S. NME (New Molecular Entity) approvals and accelerated late-stage trials—which resulted in higher payouts. 5 Takeda's 3-year TSR of 51.0% ranked at the 57th percentile of the peer group, resulting in 0% point modifier (no adjustment) to the total results. Fiscal Year 2023–2025 PSU R&D KPI Achievement R&D KPI Framework and Governance The Company’s R&D KPIs are a focused set of critical pipeline value drivers designed to signal pipeline success and continued pipeline advancement. These KPIs include specific goals related to pivotal study starts, regulatory approvals, and other critical pipeline milestones. To ensure rigorous oversight, these KPIs and their anticipated relative level of impact are pre-specified at the start of each performance period. They are reviewed and approved annually by the Compensation Committee and the Board of Directors (the “Board”), in consultation with the Scientific Advisory Group (“SAG”), a body comprised of three External Directors with deep scientific expertise. Our R&D KPI events are categorized into three milestone tiers reflecting their significance to our business objectives and pipeline progression:
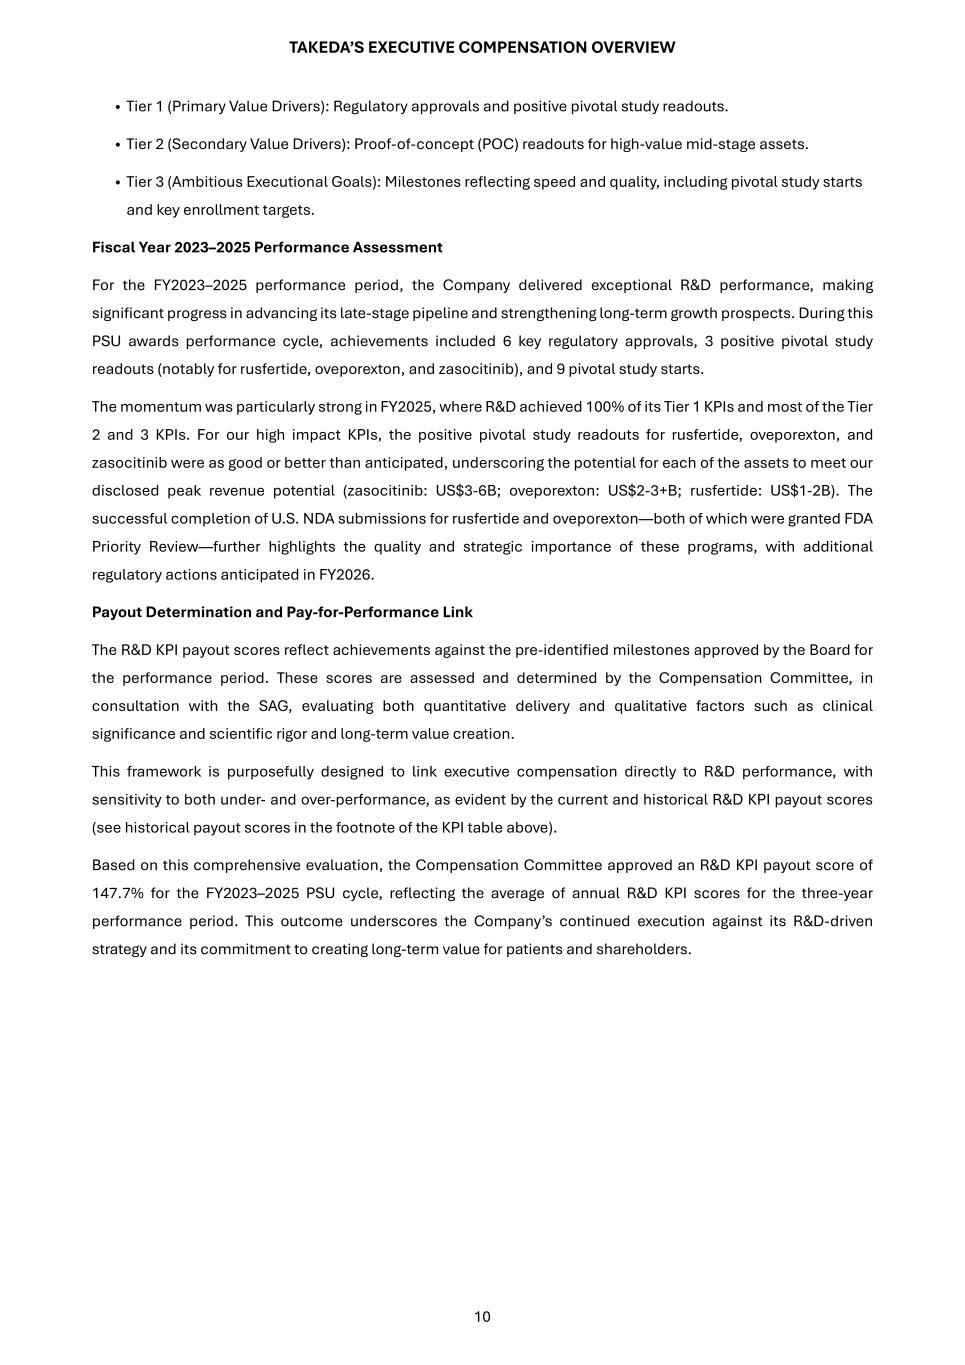
TAKEDA’S EXECUTIVE COMPENSATION OVERVIEW 10 • Tier 1 (Primary Value Drivers): Regulatory approvals and positive pivotal study readouts. • Tier 2 (Secondary Value Drivers): Proof-of-concept (POC) readouts for high-value mid-stage assets. • Tier 3 (Ambitious Executional Goals): Milestones reflecting speed and quality, including pivotal study starts and key enrollment targets. Fiscal Year 2023–2025 Performance Assessment For the FY2023–2025 performance period, the Company delivered exceptional R&D performance, making significant progress in advancing its late-stage pipeline and strengthening long-term growth prospects. During this PSU awards performance cycle, achievements included 6 key regulatory approvals, 3 positive pivotal study readouts (notably for rusfertide, oveporexton, and zasocitinib), and 9 pivotal study starts. The momentum was particularly strong in FY2025, where R&D achieved 100% of its Tier 1 KPIs and most of the Tier 2 and 3 KPIs. For our high impact KPIs, the positive pivotal study readouts for rusfertide, oveporexton, and zasocitinib were as good or better than anticipated, underscoring the potential for each of the assets to meet our disclosed peak revenue potential (zasocitinib: US$3-6B; oveporexton: US$2-3+B; rusfertide: US$1-2B). The successful completion of U.S. NDA submissions for rusfertide and oveporexton—both of which were granted FDA Priority Review—further highlights the quality and strategic importance of these programs, with additional regulatory actions anticipated in FY2026. Payout Determination and Pay-for-Performance Link The R&D KPI payout scores reflect achievements against the pre-identified milestones approved by the Board for the performance period. These scores are assessed and determined by the Compensation Committee, in consultation with the SAG, evaluating both quantitative delivery and qualitative factors such as clinical significance and scientific rigor and long-term value creation. This framework is purposefully designed to link executive compensation directly to R&D performance, with sensitivity to both under- and over-performance, as evident by the current and historical R&D KPI payout scores (see historical payout scores in the footnote of the KPI table above). Based on this comprehensive evaluation, the Compensation Committee approved an R&D KPI payout score of 147.7% for the FY2023–2025 PSU cycle, reflecting the average of annual R&D KPI scores for the three-year performance period. This outcome underscores the Company’s continued execution against its R&D-driven strategy and its commitment to creating long-term value for patients and shareholders.
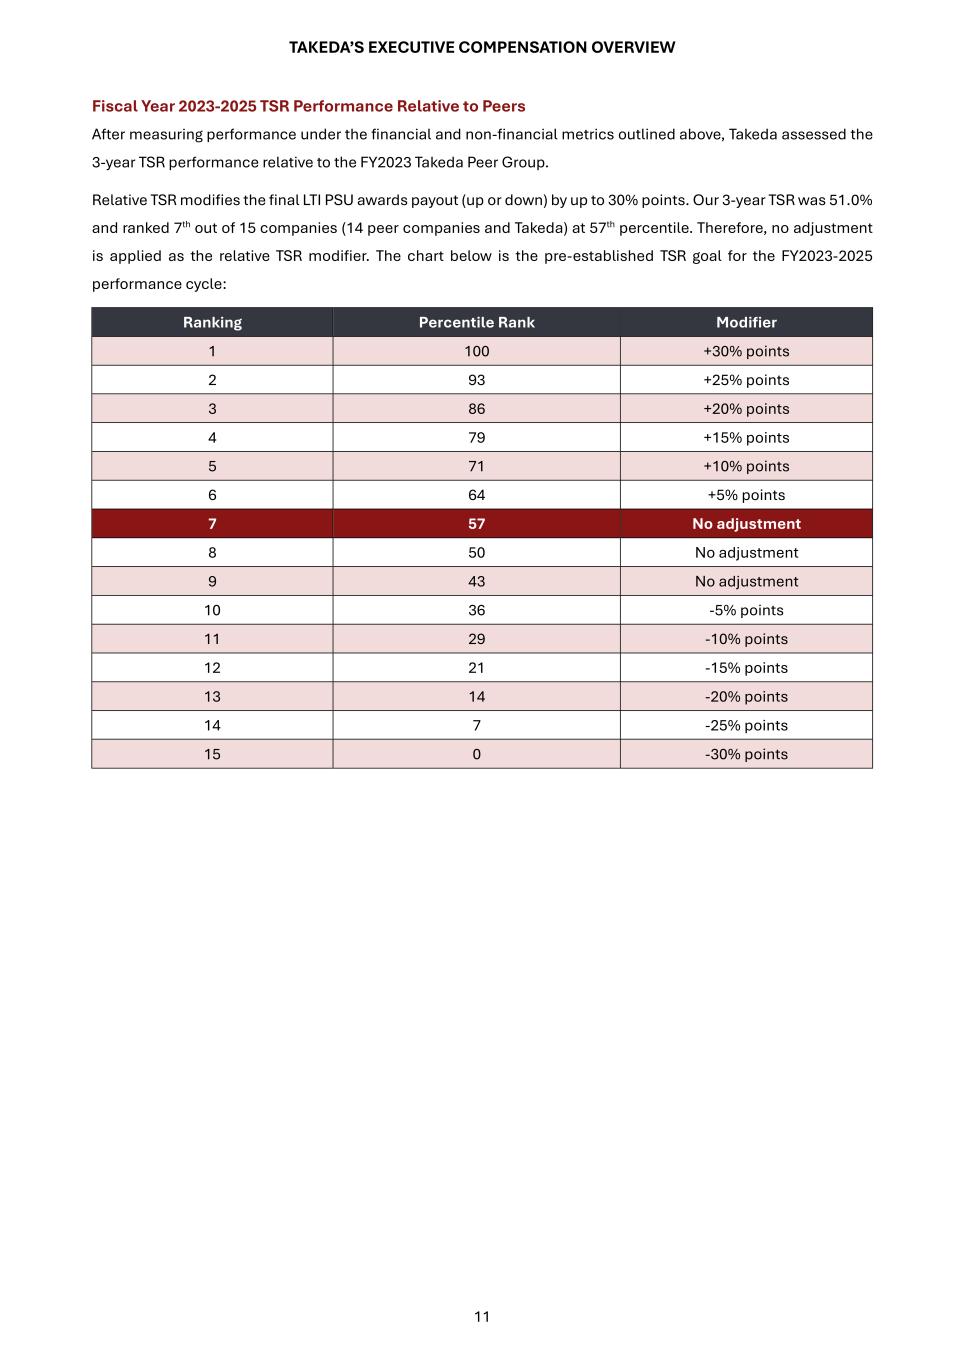
TAKEDA’S EXECUTIVE COMPENSATION OVERVIEW 11 Fiscal Year 2023-2025 TSR Performance Relative to Peers After measuring performance under the financial and non-financial metrics outlined above, Takeda assessed the 3-year TSR performance relative to the FY2023 Takeda Peer Group. Relative TSR modifies the final LTI PSU awards payout (up or down) by up to 30% points. Our 3-year TSR was 51.0% and ranked 7th out of 15 companies (14 peer companies and Takeda) at 57th percentile. Therefore, no adjustment is applied as the relative TSR modifier. The chart below is the pre-established TSR goal for the FY2023-2025 performance cycle: Ranking Percentile Rank Modifier 1 100 +30% points 2 93 +25% points 3 86 +20% points 4 79 +15% points 5 71 +10% points 6 64 +5% points 7 57 No adjustment 8 50 No adjustment 9 43 No adjustment 10 36 -5% points 11 29 -10% points 12 21 -15% points 13 14 -20% points 14 7 -25% points 15 0 -30% points
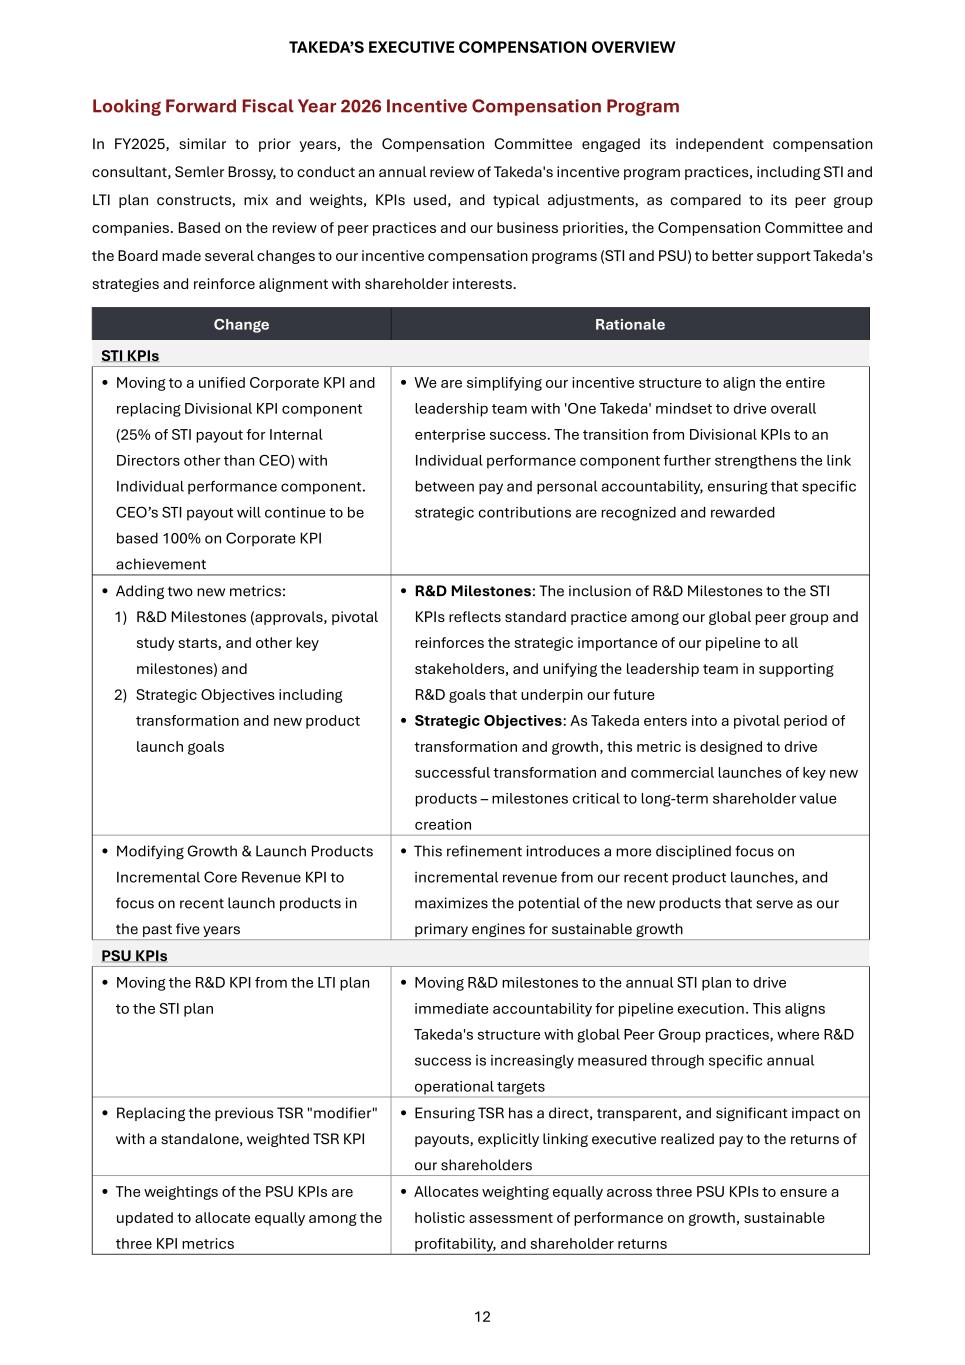
TAKEDA’S EXECUTIVE COMPENSATION OVERVIEW 12 Looking Forward Fiscal Year 2026 Incentive Compensation Program In FY2025, similar to prior years, the Compensation Committee engaged its independent compensation consultant, Semler Brossy, to conduct an annual review of Takeda's incentive program practices, including STI and LTI plan constructs, mix and weights, KPIs used, and typical adjustments, as compared to its peer group companies. Based on the review of peer practices and our business priorities, the Compensation Committee and the Board made several changes to our incentive compensation programs (STI and PSU) to better support Takeda's strategies and reinforce alignment with shareholder interests. Change Rationale STI KPIs • Moving to a unified Corporate KPI and replacing Divisional KPI component (25% of STI payout for Internal Directors other than CEO) with Individual performance component. CEO’s STI payout will continue to be based 100% on Corporate KPI achievement • We are simplifying our incentive structure to align the entire leadership team with 'One Takeda' mindset to drive overall enterprise success. The transition from Divisional KPIs to an Individual performance component further strengthens the link between pay and personal accountability, ensuring that specific strategic contributions are recognized and rewarded • Adding two new metrics: 1) R&D Milestones (approvals, pivotal study starts, and other key milestones) and 2) Strategic Objectives including transformation and new product launch goals • R&D Milestones: The inclusion of R&D Milestones to the STI KPIs reflects standard practice among our global peer group and reinforces the strategic importance of our pipeline to all stakeholders, and unifying the leadership team in supporting R&D goals that underpin our future • Strategic Objectives: As Takeda enters into a pivotal period of transformation and growth, this metric is designed to drive successful transformation and commercial launches of key new products – milestones critical to long-term shareholder value creation • Modifying Growth & Launch Products Incremental Core Revenue KPI to focus on recent launch products in the past five years • This refinement introduces a more disciplined focus on incremental revenue from our recent product launches, and maximizes the potential of the new products that serve as our primary engines for sustainable growth PSU KPIs • Moving the R&D KPI from the LTI plan to the STI plan • Moving R&D milestones to the annual STI plan to drive immediate accountability for pipeline execution. This aligns Takeda's structure with global Peer Group practices, where R&D success is increasingly measured through specific annual operational targets • Replacing the previous TSR "modifier" with a standalone, weighted TSR KPI • Ensuring TSR has a direct, transparent, and significant impact on payouts, explicitly linking executive realized pay to the returns of our shareholders • The weightings of the PSU KPIs are updated to allocate equally among the three KPI metrics • Allocates weighting equally across three PSU KPIs to ensure a holistic assessment of performance on growth, sustainable profitability, and shareholder returns
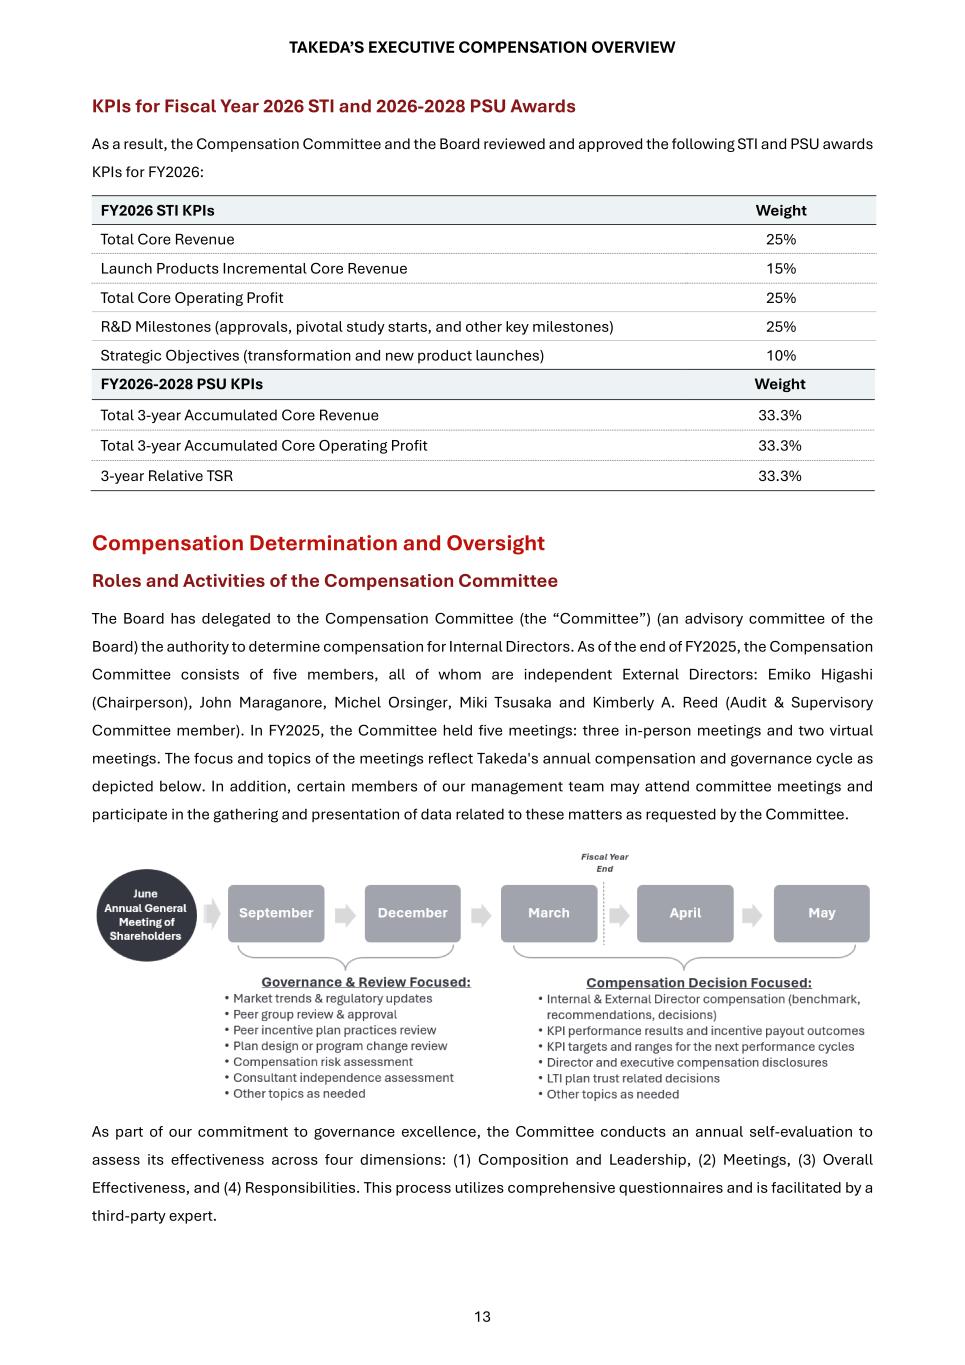
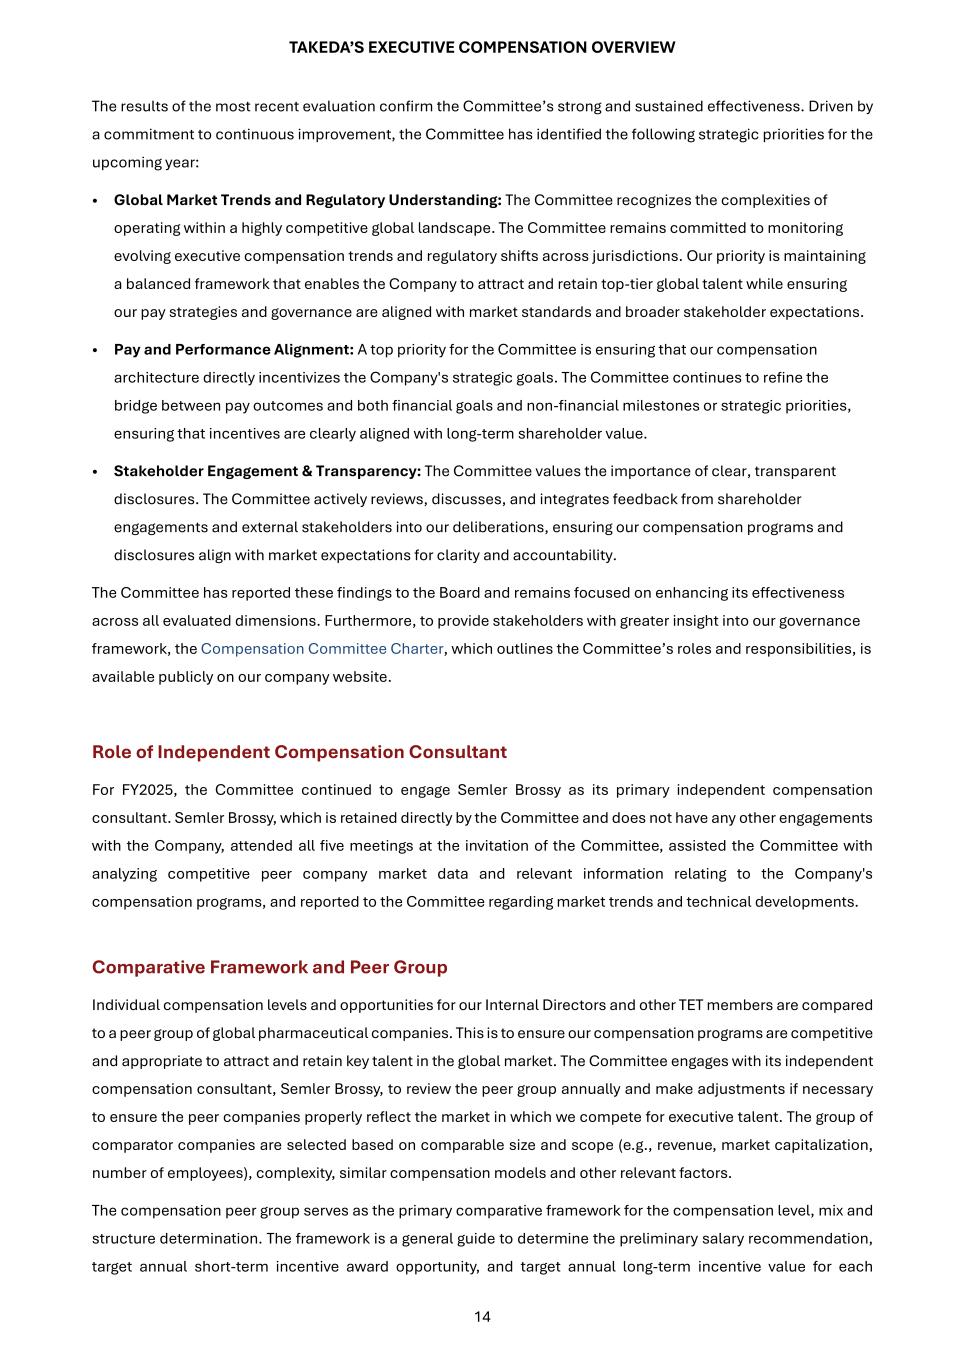
TAKEDA’S EXECUTIVE COMPENSATION OVERVIEW 13 KPIs for Fiscal Year 2026 STI and 2026-2028 PSU Awards As a result, the Compensation Committee and the Board reviewed and approved the following STI and PSU awards KPIs for FY2026: FY2026 STI KPIs Weight Total Core Revenue 25% Launch Products Incremental Core Revenue 15% Total Core Operating Profit 25% R&D Milestones (approvals, pivotal study starts, and other key milestones) 25% Strategic Objectives (transformation and new product launches) 10% FY2026-2028 PSU KPIs Weight Total 3-year Accumulated Core Revenue 33.3% Total 3-year Accumulated Core Operating Profit 33.3% 3-year Relative TSR 33.3% Compensation Determination and Oversight Roles and Activities of the Compensation Committee The Board has delegated to the Compensation Committee (the “Committee”) (an advisory committee of the Board) the authority to determine compensation for Internal Directors. As of the end of FY2025, the Compensation Committee consists of five members, all of whom are independent External Directors: Emiko Higashi (Chairperson), John Maraganore, Michel Orsinger, Miki Tsusaka and Kimberly A. Reed (Audit & Supervisory Committee member). In FY2025, the Committee held five meetings: three in-person meetings and two virtual meetings. The focus and topics of the meetings reflect Takeda's annual compensation and governance cycle as depicted below. In addition, certain members of our management team may attend committee meetings and participate in the gathering and presentation of data related to these matters as requested by the Committee. As part of our commitment to governance excellence, the Committee conducts an annual self-evaluation to assess its effectiveness across four dimensions: (1) Composition and Leadership, (2) Meetings, (3) Overall Effectiveness, and (4) Responsibilities. This process utilizes comprehensive questionnaires and is facilitated by a third-party expert.
TAKEDA’S EXECUTIVE COMPENSATION OVERVIEW 14 The results of the most recent evaluation confirm the Committee’s strong and sustained effectiveness. Driven by a commitment to continuous improvement, the Committee has identified the following strategic priorities for the upcoming year: • Global Market Trends and Regulatory Understanding: The Committee recognizes the complexities of operating within a highly competitive global landscape. The Committee remains committed to monitoring evolving executive compensation trends and regulatory shifts across jurisdictions. Our priority is maintaining a balanced framework that enables the Company to attract and retain top-tier global talent while ensuring our pay strategies and governance are aligned with market standards and broader stakeholder expectations. • Pay and Performance Alignment: A top priority for the Committee is ensuring that our compensation architecture directly incentivizes the Company's strategic goals. The Committee continues to refine the bridge between pay outcomes and both financial goals and non-financial milestones or strategic priorities, ensuring that incentives are clearly aligned with long-term shareholder value. • Stakeholder Engagement & Transparency: The Committee values the importance of clear, transparent disclosures. The Committee actively reviews, discusses, and integrates feedback from shareholder engagements and external stakeholders into our deliberations, ensuring our compensation programs and disclosures align with market expectations for clarity and accountability. The Committee has reported these findings to the Board and remains focused on enhancing its effectiveness across all evaluated dimensions. Furthermore, to provide stakeholders with greater insight into our governance framework, the Compensation Committee Charter, which outlines the Committee’s roles and responsibilities, is available publicly on our company website. Role of Independent Compensation Consultant For FY2025, the Committee continued to engage Semler Brossy as its primary independent compensation consultant. Semler Brossy, which is retained directly by the Committee and does not have any other engagements with the Company, attended all five meetings at the invitation of the Committee, assisted the Committee with analyzing competitive peer company market data and relevant information relating to the Company's compensation programs, and reported to the Committee regarding market trends and technical developments. Comparative Framework and Peer Group Individual compensation levels and opportunities for our Internal Directors and other TET members are compared to a peer group of global pharmaceutical companies. This is to ensure our compensation programs are competitive and appropriate to attract and retain key talent in the global market. The Committee engages with its independent compensation consultant, Semler Brossy, to review the peer group annually and make adjustments if necessary to ensure the peer companies properly reflect the market in which we compete for executive talent. The group of comparator companies are selected based on comparable size and scope (e.g., revenue, market capitalization, number of employees), complexity, similar compensation models and other relevant factors. The compensation peer group serves as the primary comparative framework for the compensation level, mix and structure determination. The framework is a general guide to determine the preliminary salary recommendation, target annual short-term incentive award opportunity, and target annual long-term incentive value for each
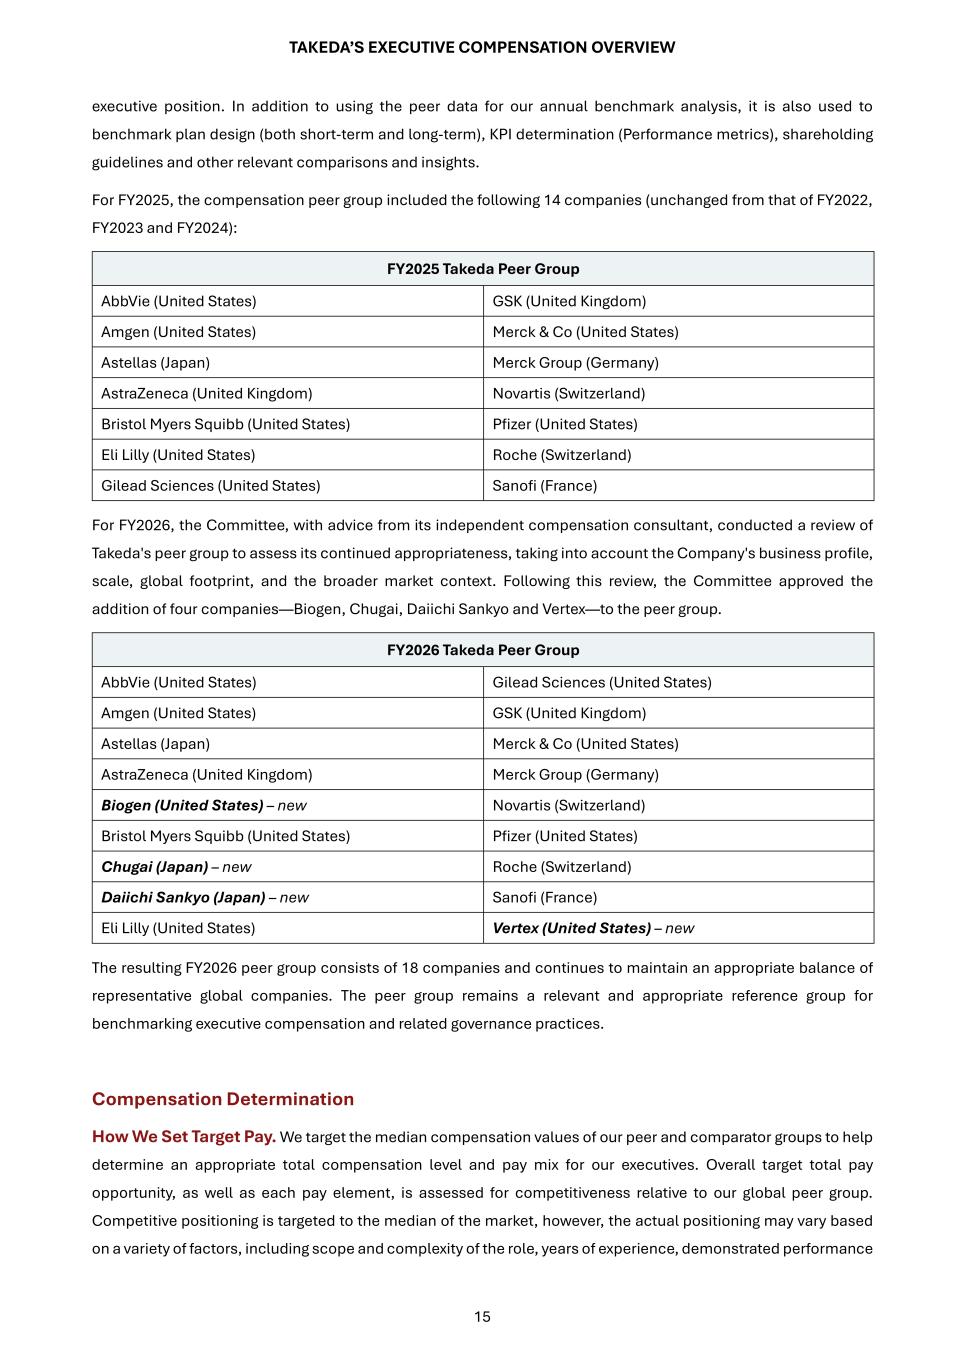
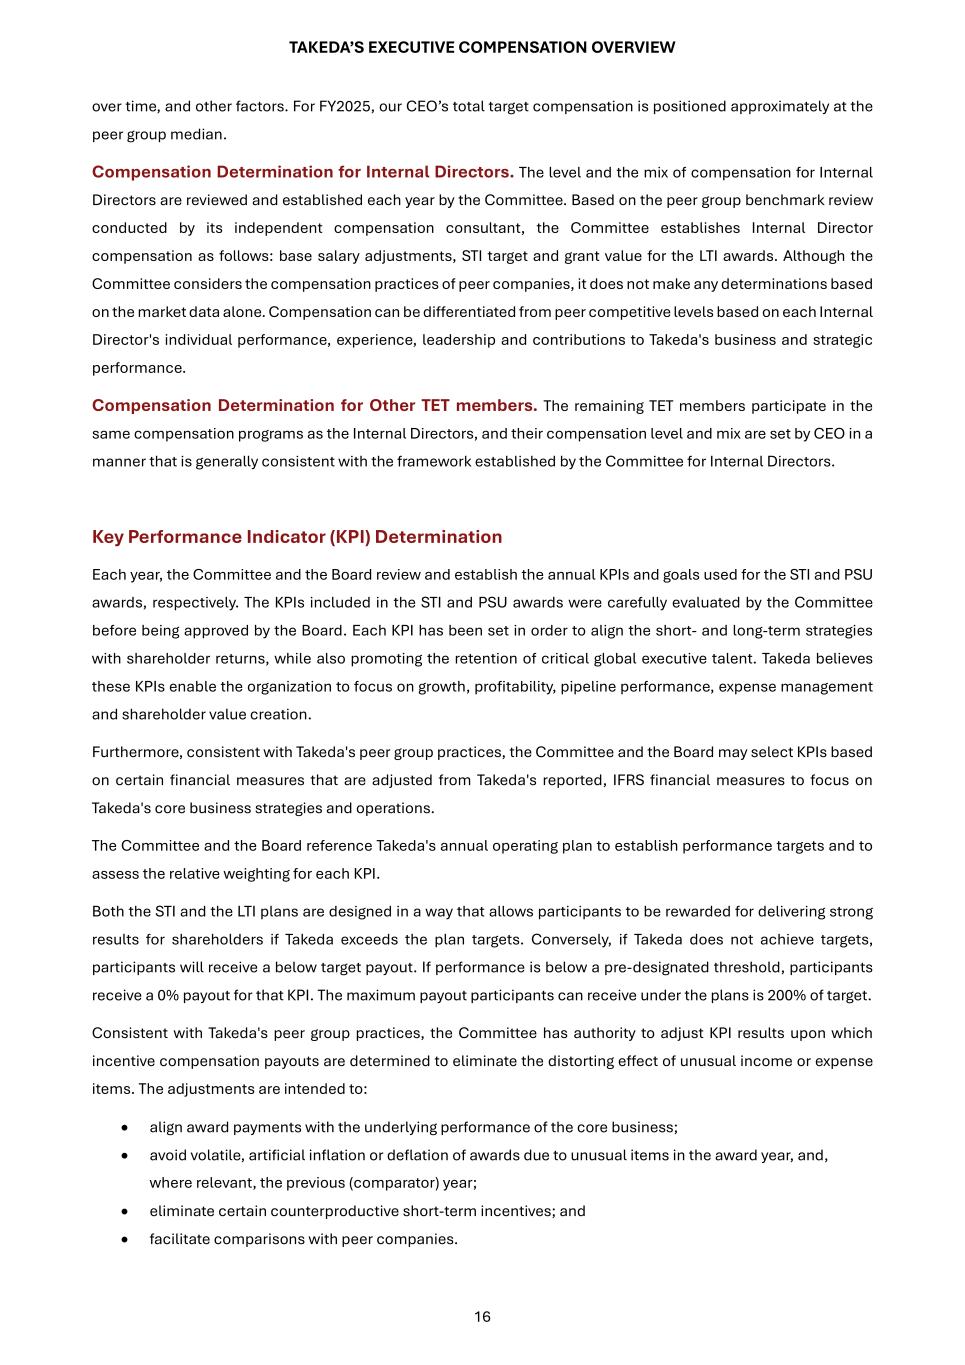
TAKEDA’S EXECUTIVE COMPENSATION OVERVIEW 15 executive position. In addition to using the peer data for our annual benchmark analysis, it is also used to benchmark plan design (both short-term and long-term), KPI determination (Performance metrics), shareholding guidelines and other relevant comparisons and insights. For FY2025, the compensation peer group included the following 14 companies (unchanged from that of FY2022, FY2023 and FY2024): FY2025 Takeda Peer Group AbbVie (United States) GSK (United Kingdom) Amgen (United States) Merck & Co (United States) Astellas (Japan) Merck Group (Germany) AstraZeneca (United Kingdom) Novartis (Switzerland) Bristol Myers Squibb (United States) Pfizer (United States) Eli Lilly (United States) Roche (Switzerland) Gilead Sciences (United States) Sanofi (France) For FY2026, the Committee, with advice from its independent compensation consultant, conducted a review of Takeda's peer group to assess its continued appropriateness, taking into account the Company's business profile, scale, global footprint, and the broader market context. Following this review, the Committee approved the addition of four companies—Biogen, Chugai, Daiichi Sankyo and Vertex—to the peer group. FY2026 Takeda Peer Group AbbVie (United States) Gilead Sciences (United States) Amgen (United States) GSK (United Kingdom) Astellas (Japan) Merck & Co (United States) AstraZeneca (United Kingdom) Merck Group (Germany) Biogen (United States) – new Novartis (Switzerland) Bristol Myers Squibb (United States) Pfizer (United States) Chugai (Japan) – new Roche (Switzerland) Daiichi Sankyo (Japan) – new Sanofi (France) Eli Lilly (United States) Vertex (United States) – new The resulting FY2026 peer group consists of 18 companies and continues to maintain an appropriate balance of representative global companies. The peer group remains a relevant and appropriate reference group for benchmarking executive compensation and related governance practices. Compensation Determination How We Set Target Pay. We target the median compensation values of our peer and comparator groups to help determine an appropriate total compensation level and pay mix for our executives. Overall target total pay opportunity, as well as each pay element, is assessed for competitiveness relative to our global peer group. Competitive positioning is targeted to the median of the market, however, the actual positioning may vary based on a variety of factors, including scope and complexity of the role, years of experience, demonstrated performance
TAKEDA’S EXECUTIVE COMPENSATION OVERVIEW 16 over time, and other factors. For FY2025, our CEO’s total target compensation is positioned approximately at the peer group median. Compensation Determination for Internal Directors. The level and the mix of compensation for Internal Directors are reviewed and established each year by the Committee. Based on the peer group benchmark review conducted by its independent compensation consultant, the Committee establishes Internal Director compensation as follows: base salary adjustments, STI target and grant value for the LTI awards. Although the Committee considers the compensation practices of peer companies, it does not make any determinations based on the market data alone. Compensation can be differentiated from peer competitive levels based on each Internal Director's individual performance, experience, leadership and contributions to Takeda's business and strategic performance. Compensation Determination for Other TET members. The remaining TET members participate in the same compensation programs as the Internal Directors, and their compensation level and mix are set by CEO in a manner that is generally consistent with the framework established by the Committee for Internal Directors. Key Performance Indicator (KPI) Determination Each year, the Committee and the Board review and establish the annual KPIs and goals used for the STI and PSU awards, respectively. The KPIs included in the STI and PSU awards were carefully evaluated by the Committee before being approved by the Board. Each KPI has been set in order to align the short- and long-term strategies with shareholder returns, while also promoting the retention of critical global executive talent. Takeda believes these KPIs enable the organization to focus on growth, profitability, pipeline performance, expense management and shareholder value creation. Furthermore, consistent with Takeda's peer group practices, the Committee and the Board may select KPIs based on certain financial measures that are adjusted from Takeda's reported, IFRS financial measures to focus on Takeda's core business strategies and operations. The Committee and the Board reference Takeda's annual operating plan to establish performance targets and to assess the relative weighting for each KPI. Both the STI and the LTI plans are designed in a way that allows participants to be rewarded for delivering strong results for shareholders if Takeda exceeds the plan targets. Conversely, if Takeda does not achieve targets, participants will receive a below target payout. If performance is below a pre-designated threshold, participants receive a 0% payout for that KPI. The maximum payout participants can receive under the plans is 200% of target. Consistent with Takeda's peer group practices, the Committee has authority to adjust KPI results upon which incentive compensation payouts are determined to eliminate the distorting effect of unusual income or expense items. The adjustments are intended to: • align award payments with the underlying performance of the core business; • avoid volatile, artificial inflation or deflation of awards due to unusual items in the award year, and, where relevant, the previous (comparator) year; • eliminate certain counterproductive short-term incentives; and • facilitate comparisons with peer companies.
TAKEDA’S EXECUTIVE COMPENSATION OVERVIEW 17 The Committee reviews and approves adjustments, including the impact of significant acquisitions or divestitures, the impact of share repurchases that differ significantly from business plan, and the impacts of hyperinflation, large swings in foreign exchange rates, and other significant events where warranted. Amounts listed above for “Target” and “Results” incorporate these adjustments, to the extent applicable, with adjustments having a significant impact on results separately identified, if applicable. Compensation Risk Assessment As part of an annual exercise, the Committee engages its independent compensation consultant to conduct a comprehensive assessment of the potential compensation-related risks to Takeda. This analysis focused on Takeda's compensation governance and incentive design elements applicable to Takeda's Internal Directors. It focuses on: (1) ensuring an appropriate balance in our program structure to mitigate compensation-related risk by using an appropriate mix of cash versus stock, short-term versus long-term measurements and financial versus non-financial goals; and (2) best-practice policies to mitigate compensation-related risk, including recoupment provisions providing clawbacks and forfeitures, shareholding requirements, equity administration rules, and insider-trading and hedging/pledging prohibitions. These risk assessments concluded that the design of the Internal Director compensation programs and policies are not likely to encourage inappropriate risk-taking that could lead to a material adverse effect on the Company. In addition, these assessments suggest that Takeda's governance, oversight, and controls processes effectively mitigated potential risks. Other Matters 2026 Chief Executive Officer Succession CEO Transition Summary Takeda announced on January 30, 2025 that its Board of Directors unanimously approved the appointment of Julie Kim as the successor to Christophe Weber, Takeda's President, Chief Executive Officer and Representative Director, upon Mr. Weber’s retirement from the Board at the close of the Annual General Meeting of Shareholders in June 2026. Ms. Kim is proposed as a candidate for election to the Board at the 2026 AGM and, subject to her election as a Director, is expected to be appointed as Representative Director, President and CEO by the Board following the AGM, effective June 2026. Determining Target Compensation for the Incoming CEO Independent Review and Competitive Framework. In determining Ms. Kim’s CEO compensation framework, the Committee engaged with its independent compensation consultant, Semler Brossy consultants, to assess market competitiveness and relevant pay considerations. Semler Brossy consultants conducted a comprehensive market benchmark analysis and provided recommendations on the pay level and approach to the Committee. The FY2026 peer group served as the main competitive framework for benchmarking CEO compensation levels and practices, augmented by Semler Brossy’s broader experience and expert insights. Philosophy and Approach for Setting Incoming CEO Pay. In setting initial compensation for new incumbents, Takeda’ s historical approach and philosophy are informed by the individual’ s relative experience and tenure in the role. Consistent with this approach and prevailing market practice, the Committee positioned the incoming CEO’s initial pay toward the lower end of the peer range at commencement of her appointment, with the intention to
TAKEDA’S EXECUTIVE COMPENSATION OVERVIEW 18 move compensation gradually toward market-competitive levels over time, subject to individual performance, company performance and ongoing market conditions. Alignment with Takeda's Pay Policy and Governance Framework. Ms. Kim’s CEO compensation is structured to be fully aligned with: • Takeda's shareholder-approved director compensation schemes and policies • Takeda's pay-for-performance philosophy, with a substantial portion of compensation delivered through at-risk short-term and long-term incentives • Takeda's Internal Director and TET compensation framework, ensuring consistency and internal equity Contractual Arrangement The Committee also reviewed and approved Ms. Kim’s contractual arrangements, considering Takeda's global operating model, governance requirements and various other factors. Conditioned on Ms. Kim’s election as a Director at the 2026 AGM and her subsequent appointment as Representative Director, President and CEO, the Committee approved a dual-contract structure, consisting of: • A mandate agreement with Takeda Pharmaceutical Company Limited (TPC), reflecting her role as Representative Director, President and CEO of TPC • An employment agreement with Takeda Pharmaceuticals U.S.A., Inc. (TPUSA) reflecting her role as Director and CEO of TPUSA This structure is designed to appropriately reflect Ms. Kim’s roles, responsibilities and expected work allocation between Japan and the United States, and is generally consistent with the contractual arrangements of Mr. Weber, the current CEO. Retirement of the Current CEO Mr. Weber continues to serve as Takeda's Representative Director, President and Chief Executive Officer through the end of the mandate term, until his retirement from the Board at the close of the 2026 AGM. There have been no changes to Mr. Weber’s contractual arrangements in FY2025 for his last year of Board term and employment. His compensation continues to be governed by two existing agreements that reflect his work allocation between Japan and the United States: (i) a Mandate Agreement with TPC, and (ii) an Employment Agreement with TPUSA. These arrangements are intended solely to allocate compensation in line with his work location and do not increase the total amount of his compensation. Both agreements will terminate upon completion of his mandate term, and no further compensation or benefits will be provided following his retirement. His previously granted outstanding LTI awards will continue to vest following his retirement, in accordance with Takeda's LTI plans and policies, and the terms of Mr. Weber’s agreements, as he satisfies the applicable retirement conditions for outstanding LTI awards. The Committee reviewed and determined Mr. Weber’s compensation for FY2025. The total amount of his individual compensation will be disclosed in the Company's Annual Securities Report in the same manner as that of other Directors. Shareholding Requirement Takeda's shareholding requirement is designed to further promote sustained shareholder return and to ensure the Company's senior executives remain focused on both short- and long-term objectives. Beginning with LTI grants in
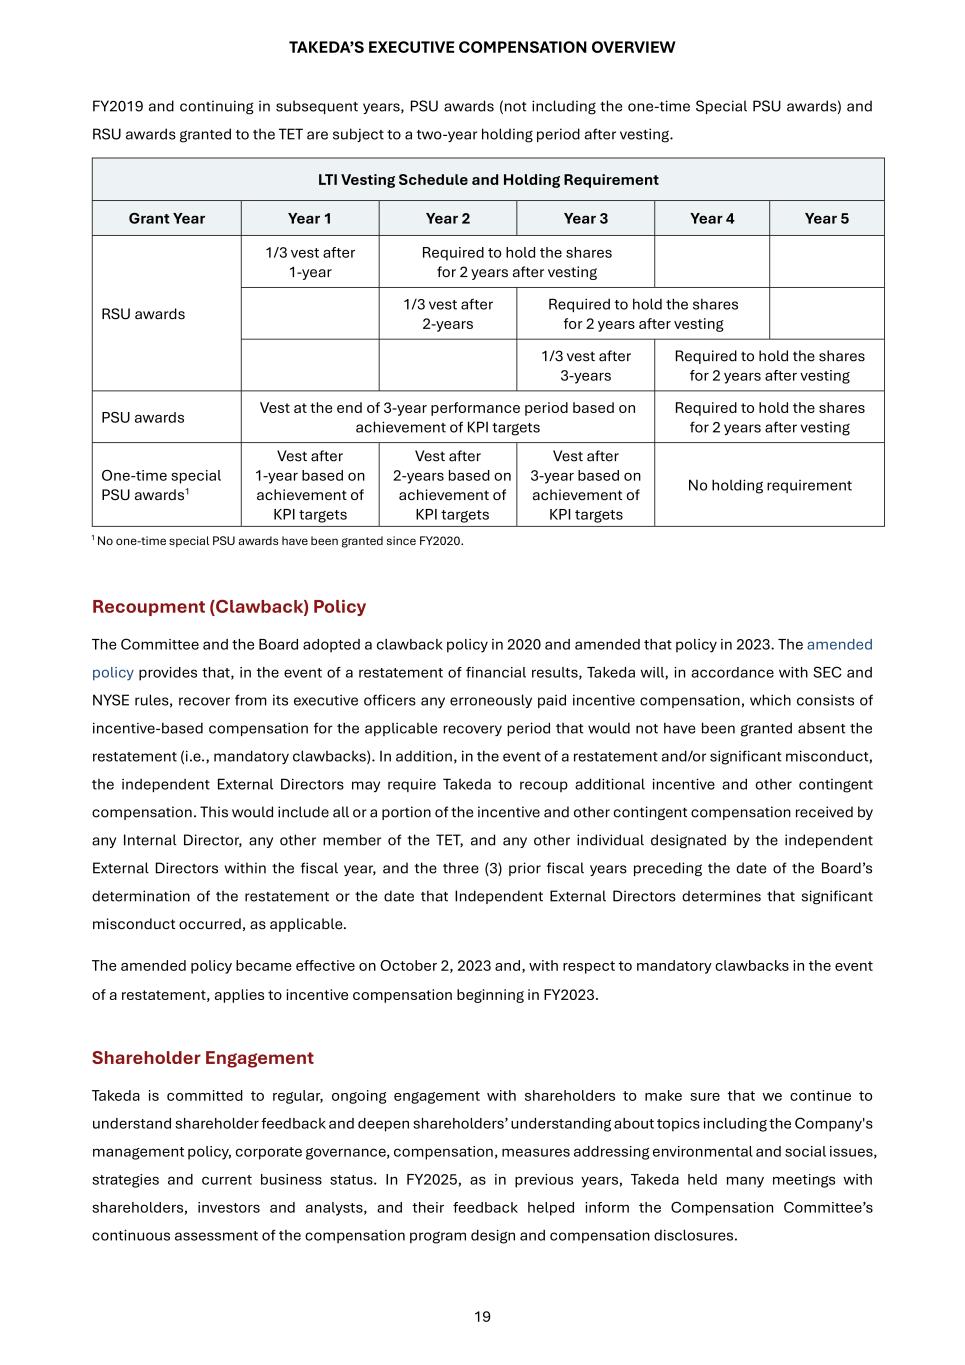
TAKEDA’S EXECUTIVE COMPENSATION OVERVIEW 19 FY2019 and continuing in subsequent years, PSU awards (not including the one-time Special PSU awards) and RSU awards granted to the TET are subject to a two-year holding period after vesting. LTI Vesting Schedule and Holding Requirement Grant Year Year 1 Year 2 Year 3 Year 4 Year 5 RSU awards 1/3 vest after 1-year Required to hold the shares for 2 years after vesting 1/3 vest after 2-years Required to hold the shares for 2 years after vesting 1/3 vest after 3-years Required to hold the shares for 2 years after vesting PSU awards Vest at the end of 3-year performance period based on achievement of KPI targets Required to hold the shares for 2 years after vesting One-time special PSU awards1 Vest after 1-year based on achievement of KPI targets Vest after 2-years based on achievement of KPI targets Vest after 3-year based on achievement of KPI targets No holding requirement 1 No one-time special PSU awards have been granted since FY2020. Recoupment (Clawback) Policy The Committee and the Board adopted a clawback policy in 2020 and amended that policy in 2023. The amended policy provides that, in the event of a restatement of financial results, Takeda will, in accordance with SEC and NYSE rules, recover from its executive officers any erroneously paid incentive compensation, which consists of incentive-based compensation for the applicable recovery period that would not have been granted absent the restatement (i.e., mandatory clawbacks). In addition, in the event of a restatement and/or significant misconduct, the independent External Directors may require Takeda to recoup additional incentive and other contingent compensation. This would include all or a portion of the incentive and other contingent compensation received by any Internal Director, any other member of the TET, and any other individual designated by the independent External Directors within the fiscal year, and the three (3) prior fiscal years preceding the date of the Board’s determination of the restatement or the date that Independent External Directors determines that significant misconduct occurred, as applicable. The amended policy became effective on October 2, 2023 and, with respect to mandatory clawbacks in the event of a restatement, applies to incentive compensation beginning in FY2023. Shareholder Engagement Takeda is committed to regular, ongoing engagement with shareholders to make sure that we continue to understand shareholder feedback and deepen shareholders’ understanding about topics including the Company's management policy, corporate governance, compensation, measures addressing environmental and social issues, strategies and current business status. In FY2025, as in previous years, Takeda held many meetings with shareholders, investors and analysts, and their feedback helped inform the Compensation Committee’s continuous assessment of the compensation program design and compensation disclosures.

TAKEDA’S EXECUTIVE COMPENSATION OVERVIEW 20 Specific examples of updated disclosures in this Executive Compensation Overview report based on shareholder feedback include: • Additional disclosure on changes and rationale in Key Performance Indicators (KPIs) • Expanded disclosure on the Role and Activities of the Compensation Committee • Result of Self-Evaluation of the Compensation Committee’s Effectiveness
TAKEDA’S EXECUTIVE COMPENSATION OVERVIEW 21 Forward-Looking Statements This report and any materials distributed in connection with this report may contain forward-looking statements, beliefs or opinions regarding Takeda's future business, future position and results of operations, including estimates, forecasts, targets and plans for Takeda. For additional information about forward-looking statements, including important cautionary language, please refer to Takeda's FY2025 investor presentation (available at https://www.takeda.com/investors/financial- results/quarterly-results/), which is hereby incorporated by reference., and Takeda's most recent Annual Report on Form 20-F and Takeda's other reports filed with the U.S. Securities and Exchange Commission, available on Takeda's website at: https://www.takeda.com/investors/sec-filings-and-security-reports/ or at www.sec.gov. Takeda does not undertake to update any of the forward-looking statements contained in this report or any other forward-looking statements it may make, except as required by law or stock exchange rule. Past performance is not an indicator of future results and the results or statements of Takeda in this report may not be indicative of, and are not an estimate, forecast, guarantee or projection of Takeda's future results. Financial Information and Non-IFRS Measures Takeda’s financial statements are prepared in accordance with International Financial Reporting Standards (“IFRS”). This report and materials distributed in connection with this report include certain financial measures not presented in accordance with IFRS, such as Core Revenue, Core Operating Profit, Core Net Profit for the year attributable to owners of the Company, Core EPS, Constant Exchange Rate (“CER”) change, Net Debt, Adjusted Net Debt, EBITDA, Adjusted EBITDA, Free Cash Flow and Adjusted Free Cash Flow. For additional information about Takeda’s use of non-IFRS measures, including Core financial measures, please refer to Takeda’s FY2025 investor presentation (available at https://www.takeda.com/investors/financial-results/quarterly-results/), which is hereby incorporated by reference., and Takeda’s most recent Annual Report on Form 20-F and Takeda’s other reports filed with the U.S. Securities and Exchange Commission, available on Takeda’s website at: https://www.takeda.com/investors/sec-filings-and-security-reports/ or at www.sec.gov. Peak Revenue Potential References in this presentation to peak revenue ranges are estimates that have not been adjusted for probability of technical and regulatory success (PTRS) and should not be considered a forecast or target. These peak revenue ranges represent Takeda’s assessments of various possible future commercial scenarios that may or may not occur.