Exhibit (c)(1)
PRELIMINARY BACKGROUND MATERIALS Project Panda Presentation to the Special Committee of the Board of Directors June 18, 2022
Exhibit (c)(1)
PRELIMINARY BACKGROUND MATERIALS Project Panda Presentation to the Special Committee of the Board of Directors June 18, 2022
PRELIMINARY BACKGROUND MATERIALS Agenda Items 1 Summary of Proposals 2 Trading Overview 3 Premiums and Multiples Overview 4 Selected Valuation Benchmarks A Appendix June 2022 2
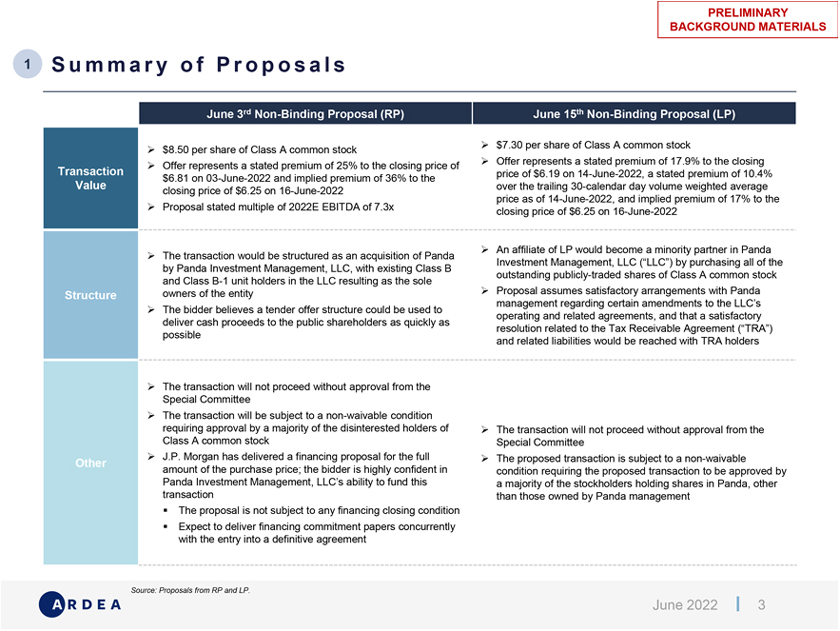
PRELIMINARY BACKGROUND MATERIALS 1 Summary of Proposals $8.50 per share of Class A common stock $7.30 per share of Class A common stock Offer represents a stated premium of 25% to the closing price of Offer represents a stated premium of 17.9% to the closing $6.81 on 03-June-2022 and implied premium of 36% to the price of $6.19 on 14-June-2022, a stated premium of 10.4% over the trailing 30-calendar day volume weighted average closing price of $6.25 on 16-June-2022 price as of 14-June-2022, and implied premium of 17% to the Proposal stated multiple of 2022E EBITDA of 7.3x closing price of $6.25 on 16-June-2022 An affiliate of LP would become a minority partner in Panda The transaction would be structured as an acquisition of Panda Investment Management, LLC (“LLC”) by purchasing all of the by Panda Investment Management, LLC, with existing Class B outstanding publicly-traded shares of Class A common stock and Class B-1 unit holders in the LLC resulting as the sole owners of the entity Proposal assumes satisfactory arrangements with Panda management regarding certain amendments to the LLC’s The bidder believes a tender offer structure could be used to operating and related agreements, and that a satisfactory deliver cash proceeds to the public shareholders as quickly as resolution related to the Tax Receivable Agreement (“TRA”) possible and related liabilities would be reached with TRA holders The transaction will not proceed without approval from the Special Committee The transaction will be subject to a non-waivable condition requiring approval by a majority of the disinterested holders of The transaction will not proceed without approval from the Class A common stock Special Committee J.P. Morgan has delivered a financing proposal for the full The proposed transaction is subject to a non-waivable amount of the purchase price; the bidder is highly confident in condition requiring the proposed transaction to be approved by Panda Investment Management, LLC’s ability to fund this a majority of the stockholders holding shares in Panda, other transaction than those owned by Panda management The proposal is not subject to any financing closing condition Expect to deliver financing commitment papers concurrently with the entry into a definitive agreement Source: Proposals from RP and LP. June 2022 3
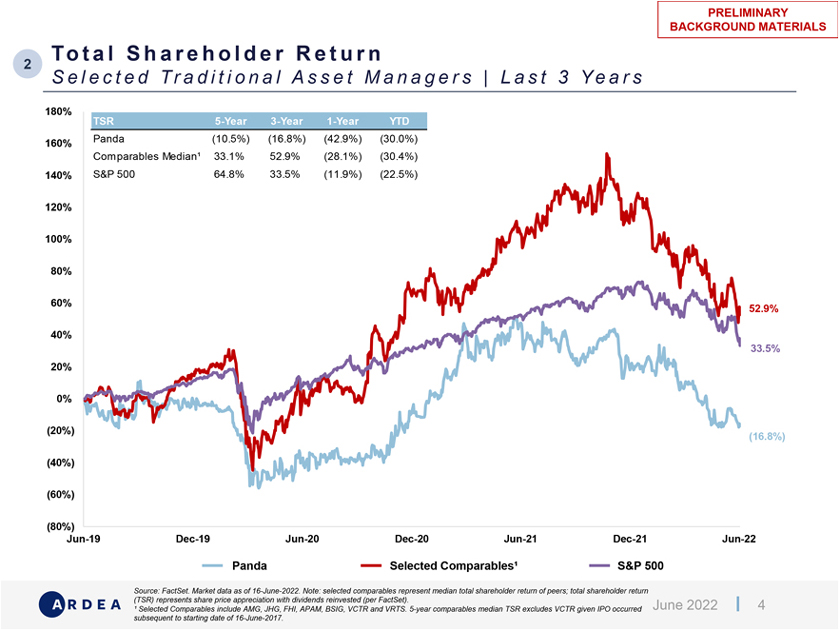
PRELIMINARY BACKGROUND MATERIALS Total Share holder Return 2 Selected Traditional Asset Managers | Last 3 Years 180% 160% Panda (10.5%) (16.8%) (42.9%) (30.0%) Comparables Median¹ 33.1% 52.9% (28.1%) (30.4%) 140% S&P 500 64.8% 33.5% (11.9%) (22.5%) 120% 100% 80% 60% 52.9% 40% 33.5% 20% 0% (20%) (16.8%) (40%) (60%) (80%) Jun-19 Dec-19 Jun-20 Dec-20 Jun-21 Dec-21 Jun-22 Panda Selected Comparables¹ S&P 500 Source: FactSet. Market data as of 16-June-2022. Note: selected comparables represent median total shareholder return of peers; total shareholder return (TSR) represents share price appreciation with dividends reinvested (per FactSet). June 2022 4 ¹ Selected Comparables include AMG, JHG, FHI, APAM, BSIG, VCTR and VRTS. 5-year comparables median TSR excludes VCTR given IPO occurred subsequent to starting date of 16-June-2017.
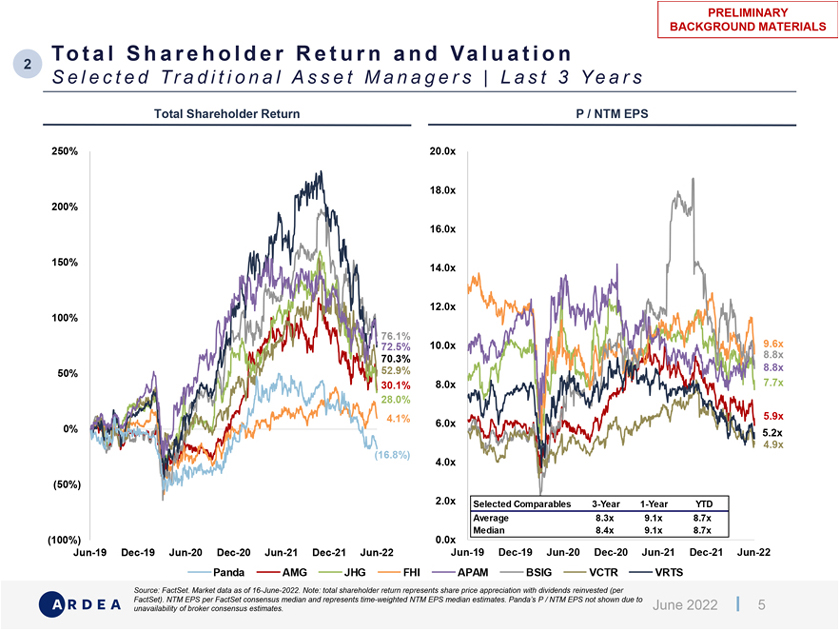
PRELIMINARY BACKGROUND MATERIALS Total Share holder Return and Valuation Selected Traditional Asset Managers | Last 3 Years Total Shareholder Return P / NTM EPS 250% 20.0x 18.0x 200% 16.0x 150% 14.0x 12.0x 100% 76.1% 72.5% 10.0x 9.6x 70.3% 8.8x 52.9% 8.8x 50% 7.7x 30.1% 8.0x 28.0% 4.1% 5.9x 6.0x 0% 5.2x 4.9x (16.8%) 4.0x (50%) 2.0x Selected Comparables 3-Year 1-Year YTD Average 8.3x 9.1x 8.7x Median 8.4x 9.1x 8.7x (100%) 0.0x Jun-19 Dec-19 Jun-20 Dec-20 Jun-21 Dec-21 Jun-22 Jun-19 Dec-19 Jun-20 Dec-20 Jun-21 Dec-21 Jun-22 Panda AMG JHG FHI APAM BSIG VCTR VRTS Source: FactSet. Market data as of 16-June-2022. Note: total shareholder return represents share price appreciation with dividends reinvested (per FactSet). NTM EPS per FactSet consensus median and represents time-weighted NTM EPS median estimates. Panda’s P / NTM EPS not shown due to June 2022 5 unavailability of broker consensus estimates.
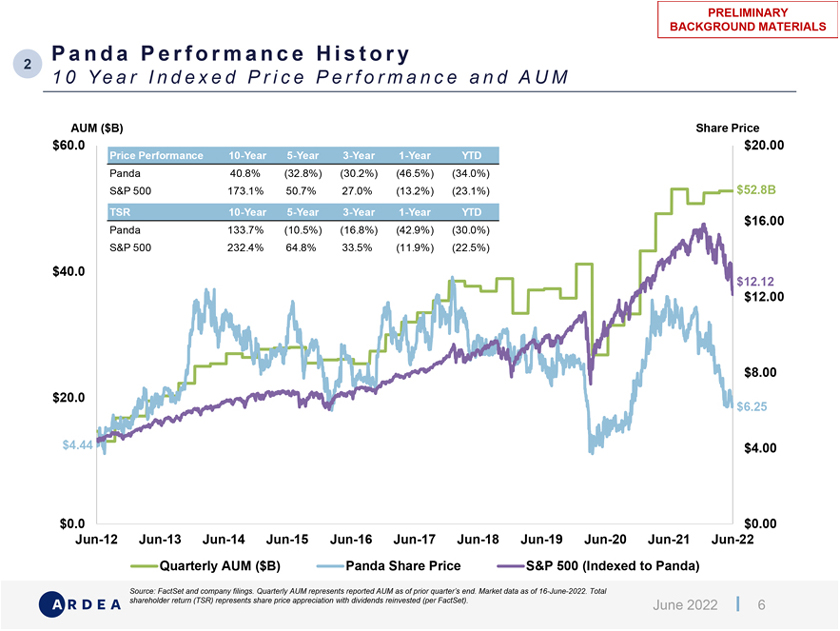
PRELIMINARY BACKGROUND MATERIALS Panda Performance History 2 10 Year Indexed Price Performance and AUM AUM ($B) Share Price $60.0 Price Performance 10-Year 5-Year 3-Year 1-Year YTD $20.00 Panda 40.8% (32.8%) (30.2%) (46.5%) (34.0%) S&P 500 173.1% 50.7% 27.0% (13.2%) (23.1%) $52.8B TSR 10-Year 5-Year 3-Year 1-Year YTD $16.00 Panda 133.7% (10.5%) (16.8%) (42.9%) (30.0%) S&P 500 232.4% 64.8% 33.5% (11.9%) (22.5%) $40.0 $12.12 $12.00 $8.00 $20.0 $6.25 $4.44 $4.00 $0.0 $0.00 Jun-12 Jun-13 Jun-14 Jun-15 Jun-16 Jun-17 Jun-18 Jun-19 Jun-20 Jun-21 Jun-22 Quarterly AUM ($B) Panda Share Price S&P 500 (Indexed to Panda) Source: FactSet and company filings. Quarterly AUM represents reported AUM as of prior quarter’s end. Market data as of 16-June-2022. Total shareholder return (TSR) represents share price appreciation with dividends reinvested (per FactSet). June 2022 6
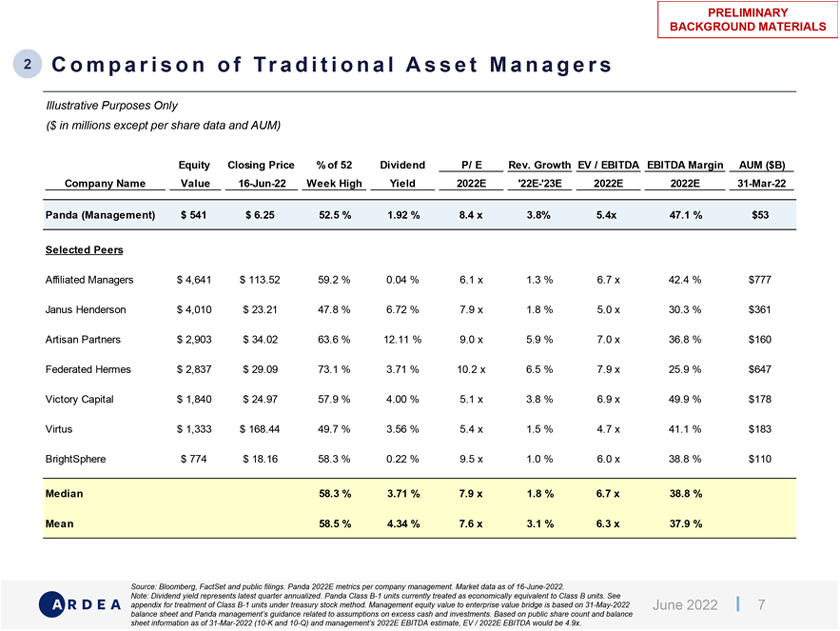
PRELIMINARY BACKGROUND MATERIALS 2 comparison of Traditional Asset Managers Illustrative Purposes Only ($ in millions except per share data and AUM) Equity Closing Price % of 52 Dividend P/ E Rev. Growth EV / EBITDA EBITDA Margin AUM ($B) Company Name Value 16-Jun-22 Week High Yield 2022E ‘22E-‘23E 2022E 2022E 31-Mar-22 Panda (Management) $ 541 $ 6.25 52.5 % 1.92 % 8.4 x 3.8% 5.4x 47.1 % $53 Selected Peers Affiliated Managers $ 4,641 $ 113.52 59.2 % 0.04 % 6.1 x 1.3 % 6.7 x 42.4 % $777 Janus Henderson $ 4,010 $ 23.21 47.8 % 6.72 % 7.9 x 1.8 % 5.0 x 30.3 % $361 Artisan Partners $ 2,903 $ 34.02 63.6 % 12.11 % 9.0 x 5.9 % 7.0 x 36.8 % $160 Federated Hermes $ 2,837 $ 29.09 73.1 % 3.71 % 10.2 x 6.5 % 7.9 x 25.9 % $647 Victory Capital $ 1,840 $ 24.97 57.9 % 4.00 % 5.1 x 3.8 % 6.9 x 49.9 % $178 Virtus $ 1,333 $ 168.44 49.7 % 3.56 % 5.4 x 1.5 % 4.7 x 41.1 % $183 BrightSphere $ 774 $ 18.16 58.3 % 0.22 % 9.5 x 1.0 % 6.0 x 38.8 % $110 Median 58.3 % 3.71 % 7.9 x 1.8 % 6.7 x 38.8 % Mean 58.5 % 4.34 % 7.6 x 3.1 % 6.3 x 37.9 % Source: Bloomberg, FactSet and public filings. Panda 2022E metrics per company management. Market data as of 16-June-2022. Note: Dividend yield represents latest quarter annualized. Panda Class B-1 units currently treated as economically equivalent to Class B units. See appendix for treatment of Class B-1 units under treasury stock method. Management equity value to enterprise value bridge is based on 31-May-2022 June 2022 7 balance sheet and Panda management’s guidance related to assumptions on excess cash and investments. Based on public share count and balance sheet information as of 31-Mar-2022 (10-K and 10-Q) and management’s 2022E EBITDA estimate, EV / 2022E EBITDA would be 4.9x.
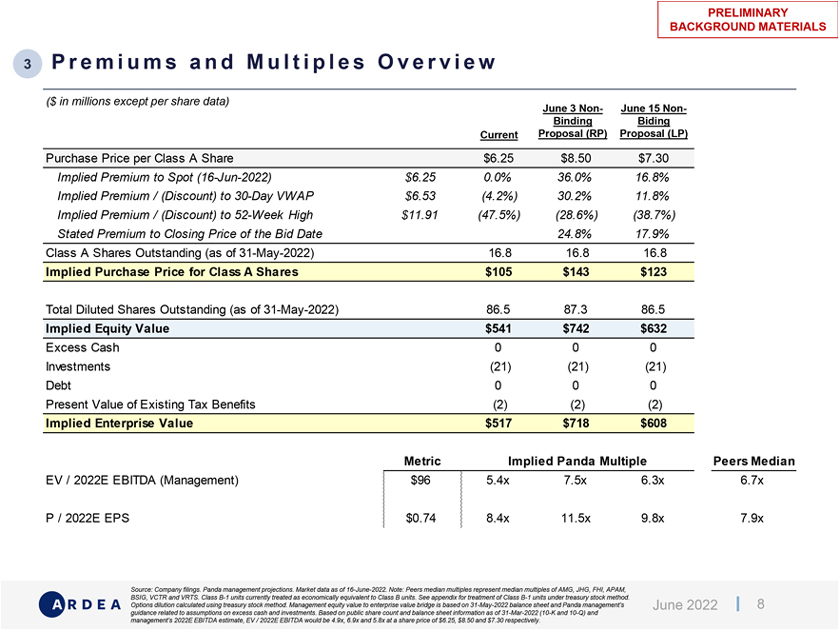
PRELIMINARY BACKGROUND MATERIALS 3 Premiums and Multiples Overview ($ in millions except per share data) June 3 Non- June 15 Non-Binding Biding Current Proposal (RP) Proposal (LP) Purchase Price per Class A Share $6.25 $8.50 $7.30 Implied Premium to Spot (16-Jun-2022) $6.25 0.0% 36.0% 16.8% Implied Premium / (Discount) to 30-Day VWAP $6.53 (4.2%) 30.2% 11.8% Implied Premium / (Discount) to 52-Week High $11.91 (47.5%) (28.6%) (38.7%) Stated Premium to Closing Price of the Bid Date 24.8% 17.9% Class A Shares Outstanding (as of 31-May-2022) 16.8 16.8 16.8 Implied Purchase Price for Class A Shares $105 $143 $123 Total Diluted Shares Outstanding (as of 31-May-2022) 86.5 87.3 86.5 Implied Equity Value $541 $742 $632 Excess Cash 0 0 0 Investments (21) (21) (21) Debt 0 0 0 Present Value of Existing Tax Benefits (2) (2) (2) Implied Enterprise Value $517 $718 $608 Metric Implied Panda Multiple Peers Median EV / 2022E EBITDA (Management) $96 5.4x 7.5x 6.3x 6.7x P / 2022E EPS $0.74 8.4x 11.5x 9.8x 7.9x Source: Company filings. Panda management projections. Market data as of 16-June-2022. Note: Peers median multiples represent median multiples of AMG, JHG, FHI, APAM, BSIG, VCTR and VRTS. Class B-1 units currently treated as economically equivalent to Class B units. See appendix for treatment of Class B-1 units under treasury stock method. Options dilution calculated using treasury stock method. Management equity value to enterprise value bridge is based on 31-May-2022 balance sheet and Panda management’s June 2022 8 guidance related to assumptions on excess cash and investments. Based on public share count and balance sheet information as of 31-Mar-2022 (10-K and 10-Q) and management’s 2022E EBITDA estimate, EV / 2022E EBITDA would be 4.9x, 6.9x and 5.8x at a share price of $6.25, $8.50 and $7.30 respectively.
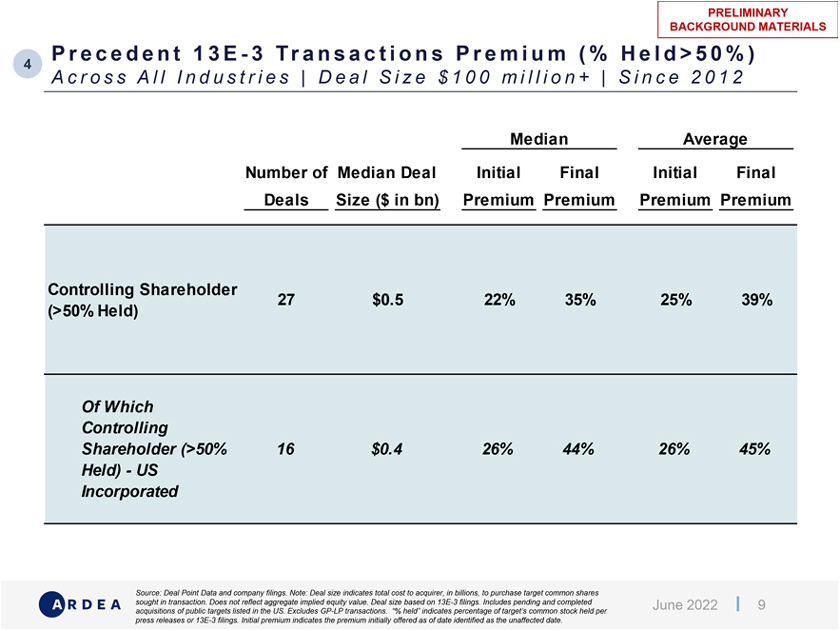
PRELIMINARY BACKGROUND MATERIALS Precedent 13 E-3 TRANSACTIONS Premium (% Held 50%) 4 Across All Industries | Deal Size $ 100 million + | Since 2012 Median Average Number of Median Deal Initial Final Initial Final Deals Size ($ in bn) Premium Premium Premium Premium Controlling Shareholder 27 $0.5 22% 35% 25% 39% (>50% Held) Of Which Controlling Shareholder (>50% 16 $0.4 26% 44% 26% 45% Held)—US Incorporated Source: Deal Point Data and company filings. Note: Deal size indicates total cost to acquirer, in billions, to purchase target common shares sought in transaction. Does not reflect aggregate implied equity value. Deal size based on 13E-3 filings. Includes pending and completed June 2022 9 acquisitions of public targets listed in the US. Excludes GP-LP transactions. “% held” indicates percentage of target’s common stock held per press releases or 13E-3 filings. Initial premium indicates the premium initially offered as of date identified as the unaffected date.
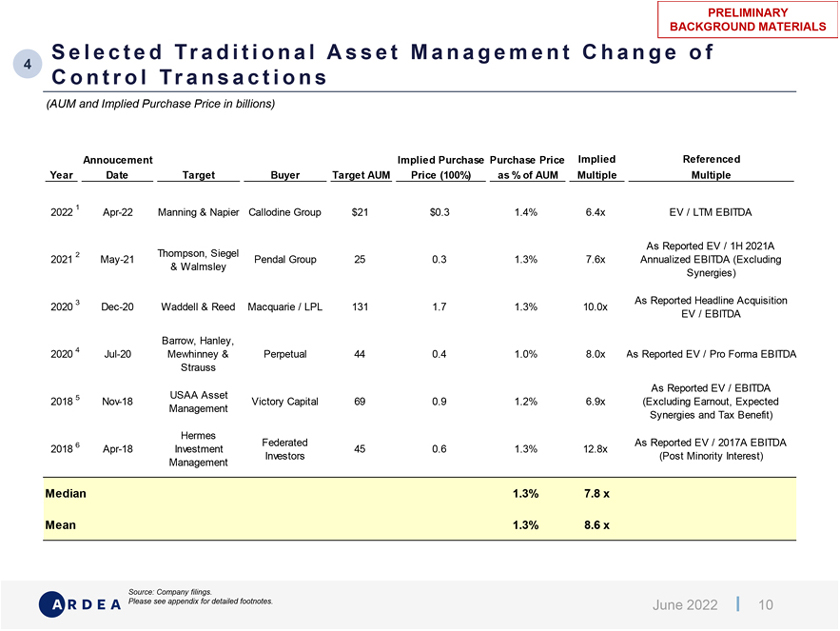
PRELIMINARY BACKGROUND MATERIALS Selected Traditional Asset Management Change of 4 Con trol Transactions (AUM and Implied Purchase Price in billions) Annoucement Implied Purchase Purchase Price Implied Referenced Year Date Target Buyer Target AUM Price (100%) as % of AUM Multiple Multiple 1 2022 Apr-22 Manning & Napier Callodine Group $21 $0.3 1.4% 6.4x EV / LTM EBITDA As Reported EV / 1H 2021A 2 Thompson, Siegel 2021 May-21 Pendal Group 25 0.3 1.3% 7.6x Annualized EBITDA (Excluding & Walmsley Synergies) 3 As Reported Headline Acquisition 2020 Dec-20 Waddell & Reed Macquarie / LPL 131 1.7 1.3% 10.0x EV / EBITDA Barrow, Hanley, 2020 4 Jul-20 Mewhinney & Perpetual 44 0.4 1.0% 8.0x As Reported EV / Pro Forma EBITDA Strauss As Reported EV / EBITDA 5 USAA Asset 2018 Nov-18 Victory Capital 69 0.9 1.2% 6.9x (Excluding Earnout, Expected Management Synergies and Tax Benefit) Hermes 6 Federated As Reported EV / 2017A EBITDA 2018 Apr-18 Investment 45 0.6 1.3% 12.8x Investors (Post Minority Interest) Management Median 1.3% 7.8 x Mean 1.3% 8.6 x Source: Company filings. Please see appendix for detailed footnotes. June 2022 10
PRELIMINARY BACKGROUND MATERIALS A Appendix June 2022 11
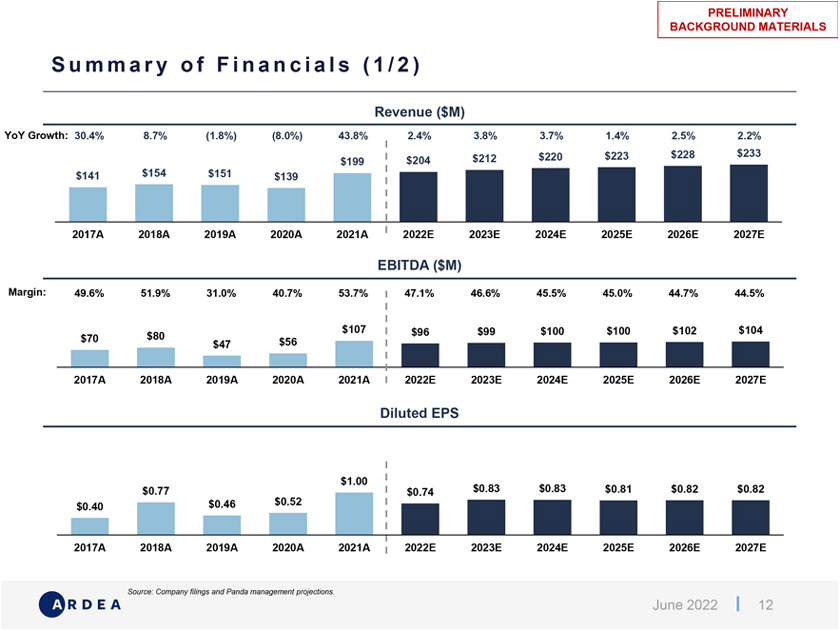
PRELIMINARY BACKGROUND MATERIALS Summary of Financials ( 1 / 2 ) Revenue ($M) YoY Growth: 30.4% 8.7% (1.8%) (8.0%) 43.8% 2.4% 3.8% 3.7% 1.4% 2.5% 2.2% $220 $223 $228 $233 $199 $204 $212 $141 $154 $151 $139 2017A 2018A 2019A 2020A 2021A 2022E 2023E 2024E 2025E 2026E 2027E EBITDA ($M) Margin: 49.6% 51.9% 31.0% 40.7% 53.7% 47.1% 46.6% 45.5% 45.0% 44.7% 44.5% $107 $96 $99 $100 $100 $102 $104 $70 $80 $47 $56 2017A 2018A 2019A 2020A 2021A 2022E 2023E 2024E 2025E 2026E 2027E Diluted EPS $1.00 $0.77 $0.74 $0.83 $0.83 $0.81 $0.82 $0.82 $0.46 $0.52 $0.40 2017A 2018A 2019A 2020A 2021A 2022E 2023E 2024E 2025E 2026E 2027E Source: Company filings and Panda management projections. June 2022 12
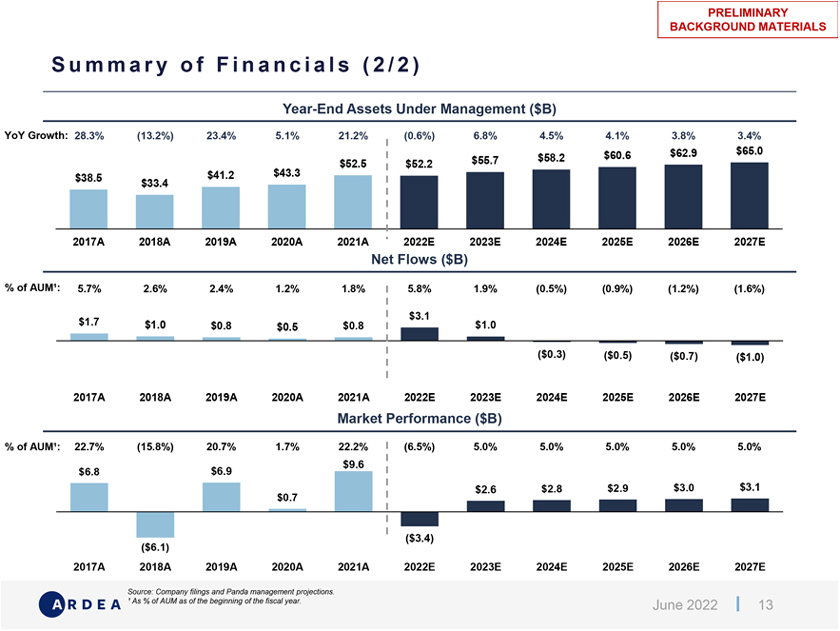
PRELIMINARY BACKGROUND MATERIALS Summary of Financials ( 2 / 2 ) Year-End Assets Under Management ($B) YoY Growth: 28.3% (13.2%) 23.4% 5.1% 21.2% (0.6%) 6.8% 4.5% 4.1% 3.8% 3.4% $60.6 $62.9 $65.0 $55.7 $58.2 $43.3 $52.5 $52.2 $38.5 $41.2 $33.4 2017A 2018A 2019A 2020A 2021A 2022E 2023E 2024E 2025E 2026E 2027E Net Flows ($B) % of AUM¹: 5.7% 2.6% 2.4% 1.2% 1.8% 5.8% 1.9% (0.5%) (0.9%) (1.2%) (1.6%) $3.1 $1.7 $1.0 $0.8 $0.8 $1.0 $0.5 ($0.3) ($0.5) ($0.7) ($1.0) 2017A 2018A 2019A 2020A 2021A 2022E 2023E 2024E 2025E 2026E 2027E Market Performance ($B) % of AUM¹: 22.7% (15.8%) 20.7% 1.7% 22.2% (6.5%) 5.0% 5.0% 5.0% 5.0% 5.0% $9.6 $6.8 $6.9 $2.6 $2.8 $2.9 $3.0 $3.1 $0.7 ($6.1) ($3.4) 2017A 2018A 2019A 2020A 2021A 2022E 2023E 2024E 2025E 2026E 2027E Source: Company filings and Panda management projections. ¹ As % of AUM as of the beginning of the fiscal year. June 2022 13
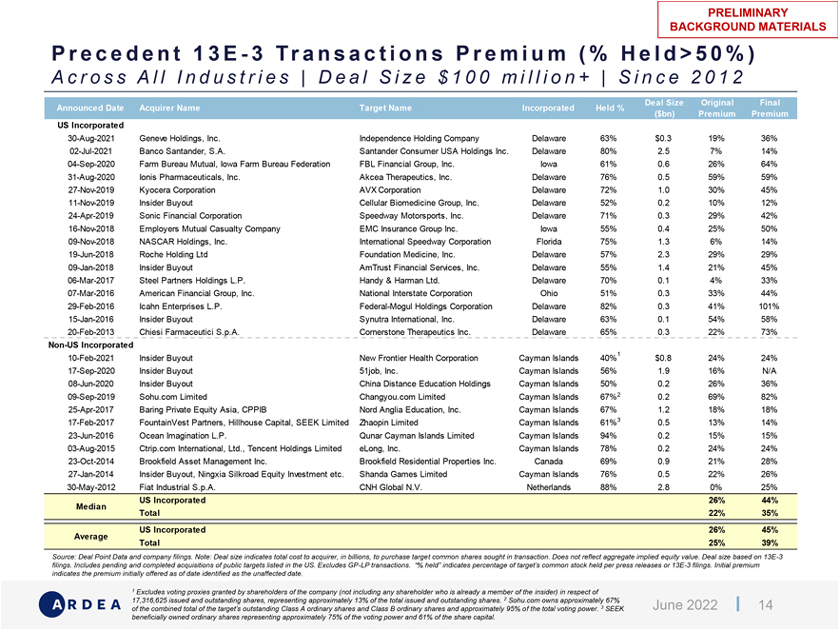
PRELIMINARY BACKGROUND MATERIALS Precedent 13 E—3 Transactions Premium ( % Held > 5 0 % ) Across All Industries | Deal Size $ 1 0 0 million + | Since 2012 US Incorporated 30-Aug-2021 Geneve Holdings, Inc. Independence Holding Company Delaware 63% $0.3 19% 36% 02-Jul-2021 Banco Santander, S.A. Santander Consumer USA Holdings Inc. Delaware 80% 2.5 7% 14% 04-Sep-2020 Farm Bureau Mutual, Iowa Farm Bureau Federation FBL Financial Group, Inc. Iowa 61% 0.6 26% 64% 31-Aug-2020 Ionis Pharmaceuticals, Inc. Akcea Therapeutics, Inc. Delaware 76% 0.5 59% 59% 27-Nov-2019 Kyocera Corporation AVX Corporation Delaware 72% 1.0 30% 45% 11-Nov-2019 Insider Buyout Cellular Biomedicine Group, Inc. Delaware 52% 0.2 10% 12% 24-Apr-2019 Sonic Financial Corporation Speedway Motorsports, Inc. Delaware 71% 0.3 29% 42% 16-Nov-2018 Employers Mutual Casualty Company EMC Insurance Group Inc. Iowa 55% 0.4 25% 50% 09-Nov-2018 NASCAR Holdings, Inc. International Speedway Corporation Florida 75% 1.3 6% 14% 19-Jun-2018 Roche Holding Ltd Foundation Medicine, Inc. Delaware 57% 2.3 29% 29% 09-Jan-2018 Insider Buyout AmTrust Financial Services, Inc. Delaware 55% 1.4 21% 45% 06-Mar-2017 Steel Partners Holdings L.P. Handy & Harman Ltd. Delaware 70% 0.1 4% 33% 07-Mar-2016 American Financial Group, Inc. National Interstate Corporation Ohio 51% 0.3 33% 44% 29-Feb-2016 Icahn Enterprises L.P. Federal-Mogul Holdings Corporation Delaware 82% 0.3 41% 101% 15-Jan-2016 Insider Buyout Synutra International, Inc. Delaware 63% 0.1 54% 58% 20-Feb-2013 Chiesi Farmaceutici S.p.A. Cornerstone Therapeutics Inc. Delaware 65% 0.3 22% 73% Non-US Incorporated 10-Feb-2021 Insider Buyout New Frontier Health Corporation Cayman Islands 40%1 $0.8 24% 24% 17-Sep-2020 Insider Buyout 51job, Inc. Cayman Islands 56% 1.9 16% N/A 08-Jun-2020 Insider Buyout China Distance Education Holdings Cayman Islands 50% 0.2 26% 36% 09-Sep-2019 Sohu.com Limited Changyou.com Limited Cayman Islands 67%2 0.2 69% 82% 25-Apr-2017 Baring Private Equity Asia, CPPIB Nord Anglia Education, Inc. Cayman Islands 67% 1.2 18% 18% 17-Feb-2017 FountainVest Partners, Hillhouse Capital, SEEK Limited Zhaopin Limited Cayman Islands 61%3 0.5 13% 14% 23-Jun-2016 Ocean Imagination L.P. Qunar Cayman Islands Limited Cayman Islands 94% 0.2 15% 15% 03-Aug-2015 Ctrip.com International, Ltd., Tencent Holdings Limited eLong, Inc. Cayman Islands 78% 0.2 24% 24% 23-Oct-2014 Brookfield Asset Management Inc. Brookfield Residential Properties Inc. Canada 69% 0.9 21% 28% 27-Jan-2014 Insider Buyout, Ningxia Silkroad Equity Investment etc. Shanda Games Limited Cayman Islands 76% 0.5 22% 26% 30-May-2012 Fiat Industrial S.p.A. CNH Global N.V. Netherlands 88% 2.8 0% 25% US Incorporated 26% 44% Median Total 22% 35% US Incorporated 26% 45% Average Total 25% 39% Source: Deal Point Data and company filings. Note: Deal size indicates total cost to acquirer, in billions, to purchase target common shares sought in transaction. Does not reflect aggregate implied equity value. Deal size based on 13E-3 filings. Includes pending and completed acquisitions of public targets listed in the US. Excludes GP-LP transactions. “% held” indicates percentage of target’s common stock held per press releases or 13E-3 filings. Initial premium indicates the premium initially offered as of date identified as the unaffected date. 1 Excludes voting proxies granted by shareholders of the company (not including any shareholder who is already a member of the insider) in respect of 17,316,625 issued and outstanding shares, representing approximately 13% of the total issued and outstanding shares. 2 Sohu.com owns approximately 67% of the combined total of the target’s outstanding Class A ordinary shares and Class B ordinary shares and approximately 95% of the total voting power. 3 SEEK June 2022 14 beneficially owned ordinary shares representing approximately 75% of the voting power and 61% of the share capital.
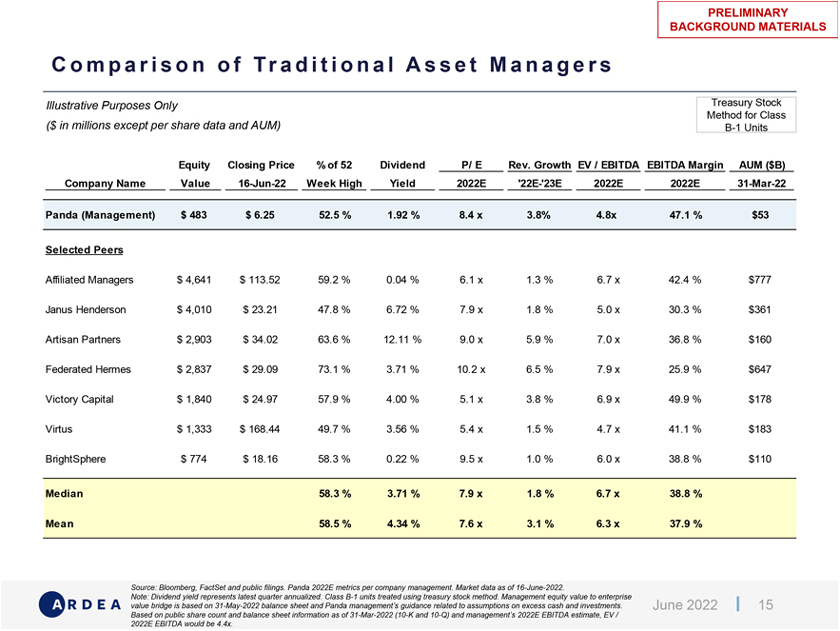
PRELIMINARY BACKGROUND MATERIALS Comparison of Traditional Asset Managers Illustrative Purposes Only Treasury Stock ($ in millions except per share data and AUM) Method for Class B-1 Units Equity Closing Price % of 52 Dividend P/ E Rev. Growth EV / EBITDA EBITDA Margin AUM ($B) Company Name Value 16-Jun-22 Week High Yield 2022E ‘22E-‘23E 2022E 2022E 31-Mar-22 Panda (Management) $ 483 $ 6.25 52.5 % 1.92 % 8.4 x 3.8% 4.8x 47.1 % $53 Selected Peers Affiliated Managers $ 4,641 $ 113.52 59.2 % 0.04 % 6.1 x 1.3 % 6.7 x 42.4 % $777 Janus Henderson $ 4,010 $ 23.21 47.8 % 6.72 % 7.9 x 1.8 % 5.0 x 30.3 % $361 Artisan Partners $ 2,903 $ 34.02 63.6 % 12.11 % 9.0 x 5.9 % 7.0 x 36.8 % $160 Federated Hermes $ 2,837 $ 29.09 73.1 % 3.71 % 10.2 x 6.5 % 7.9 x 25.9 % $647 Victory Capital $ 1,840 $ 24.97 57.9 % 4.00 % 5.1 x 3.8 % 6.9 x 49.9 % $178 Virtus $ 1,333 $ 168.44 49.7 % 3.56 % 5.4 x 1.5 % 4.7 x 41.1 % $183 BrightSphere $ 774 $ 18.16 58.3 % 0.22 % 9.5 x 1.0 % 6.0 x 38.8 % $110 Median 58.3 % 3.71 % 7.9 x 1.8 % 6.7 x 38.8 % Mean 58.5 % 4.34 % 7.6 x 3.1 % 6.3 x 37.9 % Source: Bloomberg, FactSet and public filings. Panda 2022E metrics per company management. Market data as of 16-June-2022. Note: Dividend yield represents latest quarter annualized. Class B-1 units treated using treasury stock method. Management equity value to enterprise value bridge is based on 31-May-2022 balance sheet and Panda management’s guidance related to assumptions on excess cash and investments. June 2022 15 Based on public share count and balance sheet information as of 31-Mar-2022 (10-K and 10-Q) and management’s 2022E EBITDA estimate, EV / 2022E EBITDA would be 4.4x.
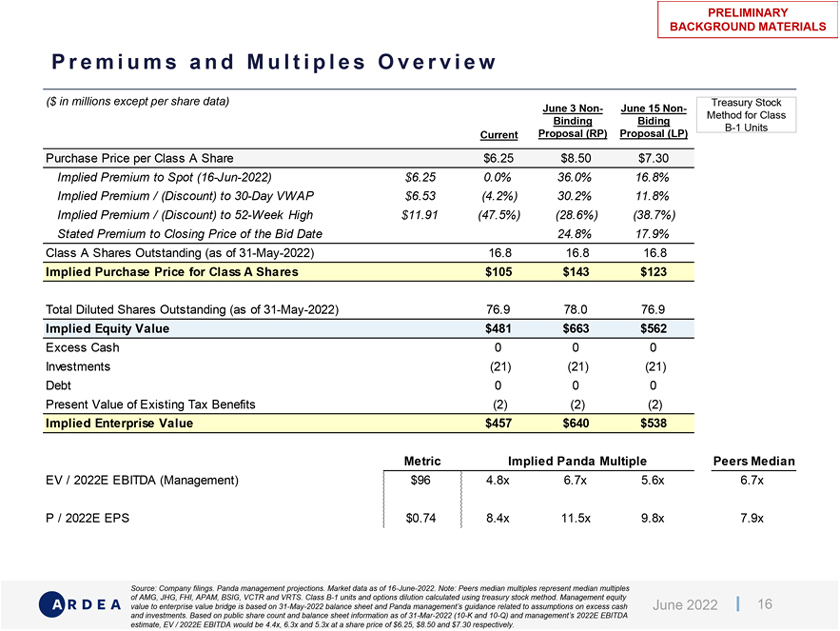
PRELIMINARY BACKGROUND MATERIALS Premium sand Multiples Overview ($ in millions except per share data) Treasury Stock June 3 Non- June 15 Non- Method for Class Binding Biding B-1 Units Current Proposal (RP) Proposal (LP) Purchase Price per Class A Share $6.25 $8.50 $7.30 Implied Premium to Spot (16-Jun-2022) $6.25 0.0% 36.0% 16.8% Implied Premium / (Discount) to 30-Day VWAP $6.53 (4.2%) 30.2% 11.8% Implied Premium / (Discount) to 52-Week High $11.91 (47.5%) (28.6%) (38.7%) Stated Premium to Closing Price of the Bid Date 24.8% 17.9% Class A Shares Outstanding (as of 31-May-2022) 16.8 16.8 16.8 Implied Purchase Price for Class A Shares $105 $143 $123 Total Diluted Shares Outstanding (as of 31-May-2022) 76.9 78.0 76.9 Implied Equity Value $481 $663 $562 Excess Cash 0 0 0 Investments (21) (21) (21) Debt 0 0 0 Present Value of Existing Tax Benefits (2) (2) (2) Implied Enterprise Value $457 $640 $538 Metric Implied Panda Multiple Peers Median EV / 2022E EBITDA (Management) $96 4.8x 6.7x 5.6x 6.7x P / 2022E EPS $0.74 8.4x 11.5x 9.8x 7.9x Source: Company filings. Panda management projections. Market data as of 16-June-2022. Note: Peers median multiples represent median multiples of AMG, JHG, FHI, APAM, BSIG, VCTR and VRTS. Class B-1 units and options dilution calculated using treasury stock method. Management equity 16 value to enterprise value bridge is based on 31-May-2022 balance sheet and Panda management’s guidance related to assumptions on excess cash June 2022 and investments. Based on public share count and balance sheet information as of 31-Mar-2022 (10-K and 10-Q) and management’s 2022E EBITDA estimate, EV / 2022E EBITDA would be 4.4x, 6.3x and 5.3x at a share price of $6.25, $8.50 and $7.30 respectively.
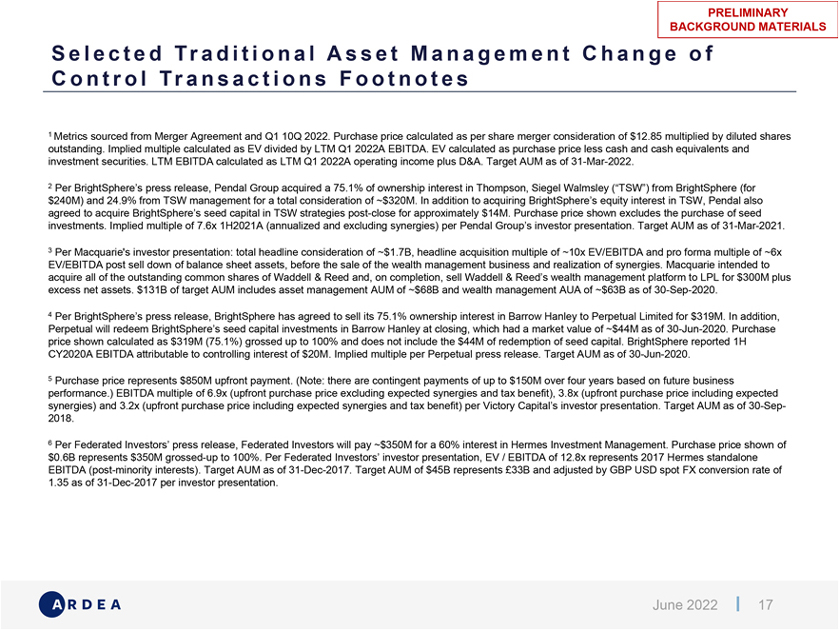
PRELIMINARY BACKGROUND MATERIALS Selected Traditional Asset Management Change of Control Transactions Footnotes 1 Metrics sourced from Merger Agreement and Q1 10Q 2022. Purchase price calculated as per share merger consideration of $12.85 multiplied by diluted shares outstanding. Implied multiple calculated as EV divided by LTM Q1 2022A EBITDA. EV calculated as purchase price less cash and cash equivalents and investment securities. LTM EBITDA calculated as LTM Q1 2022A operating income plus D&A. Target AUM as of 31-Mar-2022. 2 Per BrightSphere’s press release, Pendal Group acquired a 75.1% of ownership interest in Thompson, Siegel Walmsley (“TSW”) from BrightSphere (for $240M) and 24.9% from TSW management for a total consideration of $320M. In addition to acquiring BrightSphere’s equity interest in TSW, Pendal also agreed to acquire BrightSphere’s seed capital in TSW strategies post-close for approximately $14M. Purchase price shown excludes the purchase of seed investments. Implied multiple of 7.6x 1H2021A (annualized and excluding synergies) per Pendal Group’s investor presentation. Target AUM as of 31-Mar-2021. 3 Per Macquarie’s investor presentation: total headline consideration of $1.7B, headline acquisition multiple of 10x EV/EBITDA and pro forma multiple of 6x EV/EBITDA post sell down of balance sheet assets, before the sale of the wealth management business and realization of synergies. Macquarie intended to acquire all of the outstanding common shares of Waddell & Reed and, on completion, sell Waddell & Reed’s wealth management platform to LPL for $300M plus excess net assets. $131B of target AUM includes asset management AUM of $68B and wealth management AUA of $63B as of 30-Sep-2020. 4 Per BrightSphere’s press release, BrightSphere has agreed to sell its 75.1% ownership interest in Barrow Hanley to Perpetual Limited for $319M. In addition, Perpetual will redeem BrightSphere’s seed capital investments in Barrow Hanley at closing, which had a market value of $44M as of 30-Jun-2020. Purchase price shown calculated as $319M (75.1%) grossed up to 100% and does not include the $44M of redemption of seed capital. BrightSphere reported 1H CY2020A EBITDA attributable to controlling interest of $20M. Implied multiple per Perpetual press release. Target AUM as of 30-Jun-2020. 5 Purchase price represents $850M upfront payment. (Note: there are contingent payments of up to $150M over four years based on future business performance.) EBITDA multiple of 6.9x (upfront purchase price excluding expected synergies and tax benefit), 3.8x (upfront purchase price including expected synergies) and 3.2x (upfront purchase price including expected synergies and tax benefit) per Victory Capital’s investor presentation. Target AUM as of 30-Sep-2018. 6 Per Federated Investors’ press release, Federated Investors will pay $350M for a 60% interest in Hermes Investment Management. Purchase price shown of $0.6B represents $350M grossed-up to 100%. Per Federated Investors’ investor presentation, EV / EBITDA of 12.8x represents 2017 Hermes standalone EBITDA (post-minority interests). Target AUM as of 31-Dec-2017. Target AUM of $45B represents Ł33B and adjusted by GBP USD spot FX conversion rate of 1.35 as of 31-Dec-2017 per investor presentation. June 2022 17
DISCLAIMER Ardea Partners LP (“Ardea”) has prepared and provided these materials and Ardea’s related oral presentation (collectively, the “Confidential Information”) solely for the information and assistance of the Special Committee of the Board of Directors of Panda (the “Company”) in connection with their consideration of the matters referred to herein. Without Ardea’s prior written consent, the Confidential Information, and Ardea’s preparation and provision of such Confidential Information, may not be used for any other purpose or disclosed or otherwise referred to in any manner. The Confidential Information is (a) for discussion purposes only and (b) speaks only as of the date it is given, reflecting prevailing economic, monetary, market and other conditions as in effect on, and the information made available to Ardea as of, such date. Ardea assumes no responsibility for updating or revising the Confidential Information. The views expressed herein are subject to change based upon a number of factors, including economic, monetary, market and other conditions and the Company’s and any prospective counterparty’s business and prospects. Analyses based upon forecasts of future results are not necessarily indicative of actual future results, which may be significantly more or less favorable than suggested by these analyses, and Ardea does not assume responsibility if future results are materially different from those forecast. The Confidential Information is incomplete without reference to, and should be viewed solely in conjunction with, the oral briefing provided by Ardea, if any. The Confidential Information has been prepared using publicly available information and information in reports, due diligence materials, forecasts, projections and other materials provided by or on behalf of the Company and/or any prospective counterparty. Ardea does not assume responsibility for and has relied on, without independent verification, the accuracy and completeness of such information. Ardea has not, and does not, provide advice for tax, legal, regulatory or accounting matters and the Company will remain solely responsible for all aspects of due diligence in connection with the Transaction and the commercial assumptions on which any advice provided by Ardea is based. The Confidential Information does not address the underlying business decision of the Company to engage in any transaction or the relative merits of any strategic alternatives referred to herein as compared to any other alternative that may be available to the Company. Ardea and its affiliates and/or their respective employees, as well as investment funds in which any of them may have a financial interest, may at any time, directly or indirectly, hold long or short positions and may trade or otherwise effect transactions for their own accounts or the accounts of customers, in debt or equity securities, senior loans and/or derivative products relating to the Company or its affiliates, potential parties to a Transaction and their affiliates or persons that are competitors, customers or suppliers of the Company. Nothing herein or any previous or existing relationship between the Company and Ardea will be deemed to create a fiduciary duty or fiduciary or agency relationship between Ardea and the Company, its security holders, affiliates, employees or creditors. June 2022 18