Exhibit (c)(6) Honesty | Integrity | Performance Project Panda Confidential Presentation to the Special Committee of the Board of Directors 25 July 2022 www.castleoaklp.com
CONFIDENTIAL Table of Contents Valuation Summary p. 2 DCF Analysis p. 5 Selected Public Market Comparisons p. 11 Selected Private Market Transactions p. 18 Appendix p. 21 1
Honesty | Integrity | Performance Valuation Summary www.castleoaklp.com 2 2
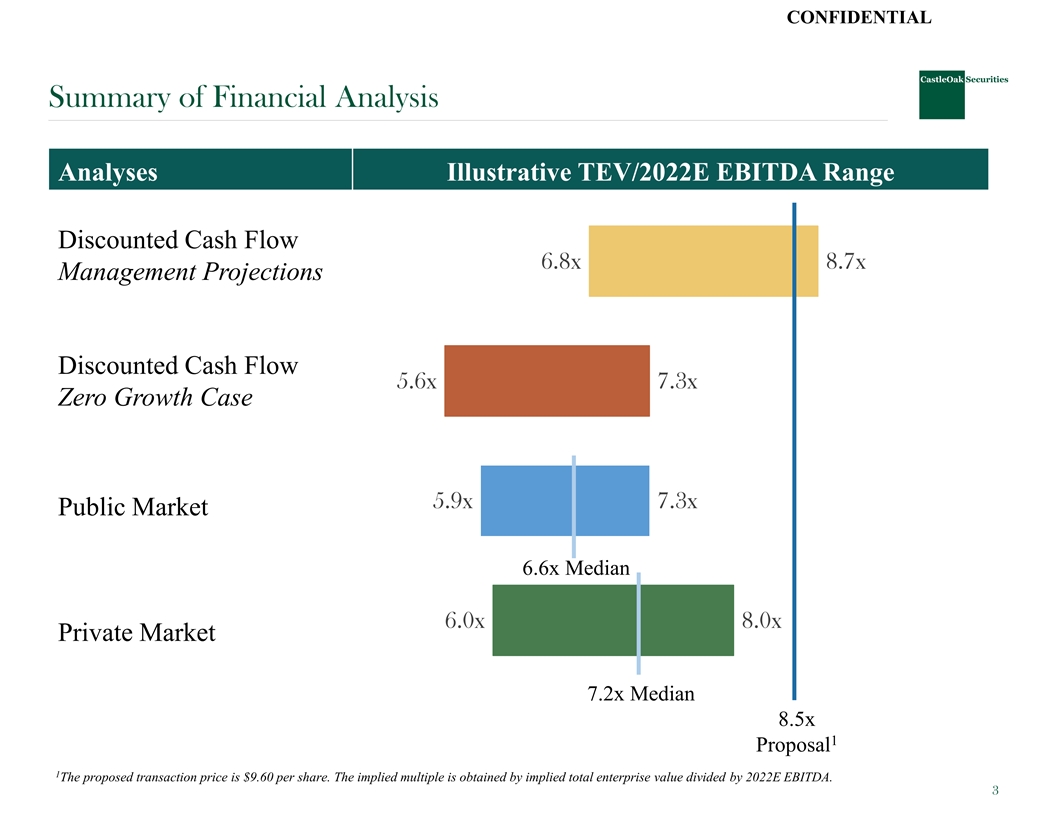
CONFIDENTIAL Summary of Financial Analysis Analyses Illustrative TEV/2022E EBITDA Range Discounted Cash Flow 6.8x 8.7x Management Projections Discounted Cash Flow 5.6x 7.3x Zero Growth Case 5.9x 7.3x Public Market 6.6x Median 6.0x 8.0x Private Market 7.2x Median 8.5x 1 Proposal 1 The proposed transaction price is $9.60 per share. The implied multiple is obtained by implied total enterprise value divided by 2022E EBITDA. 3
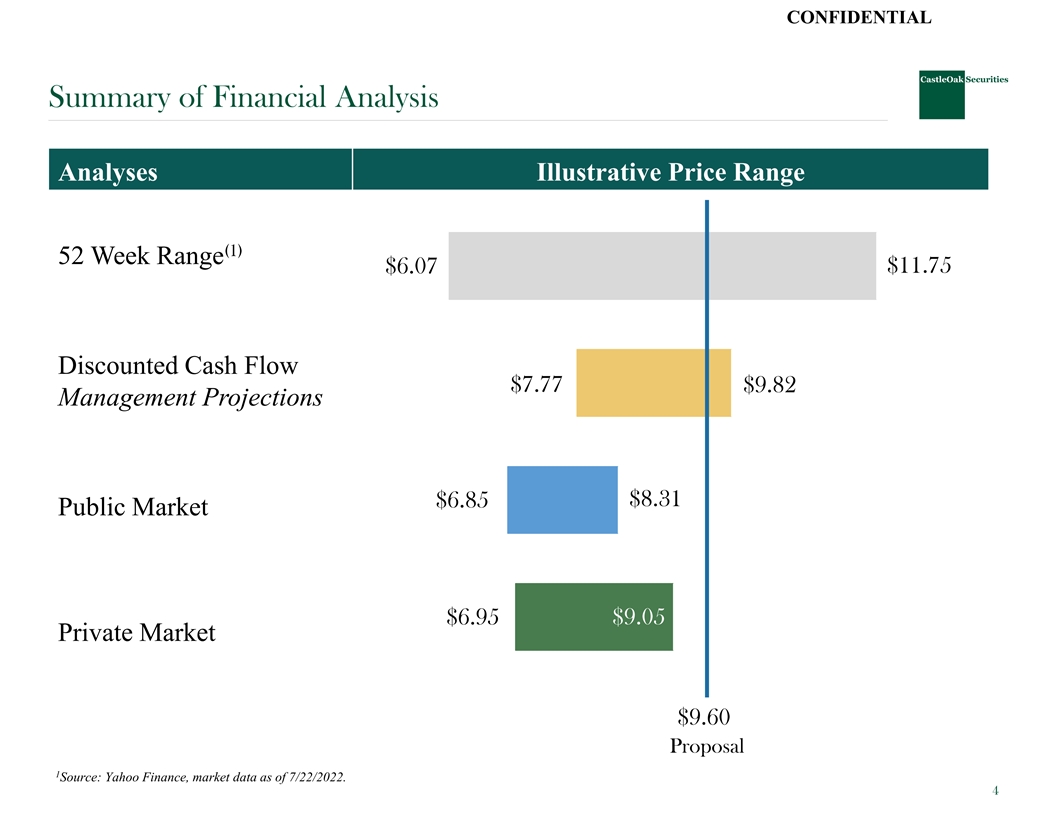
CONFIDENTIAL Summary of Financial Analysis Analyses Illustrative Price Range (1) 52 Week Range $6.07 $11.75 Discounted Cash Flow $7.77 $9.82 Management Projections $8.31 $6.85 Public Market $9.05 $6.95 $9.04 Private Market $9.60 Proposal 1 Source: Yahoo Finance, market data as of 7/22/2022. 4
Honesty | Integrity | Performance DCF Analysis www.castleoaklp.com 5 5
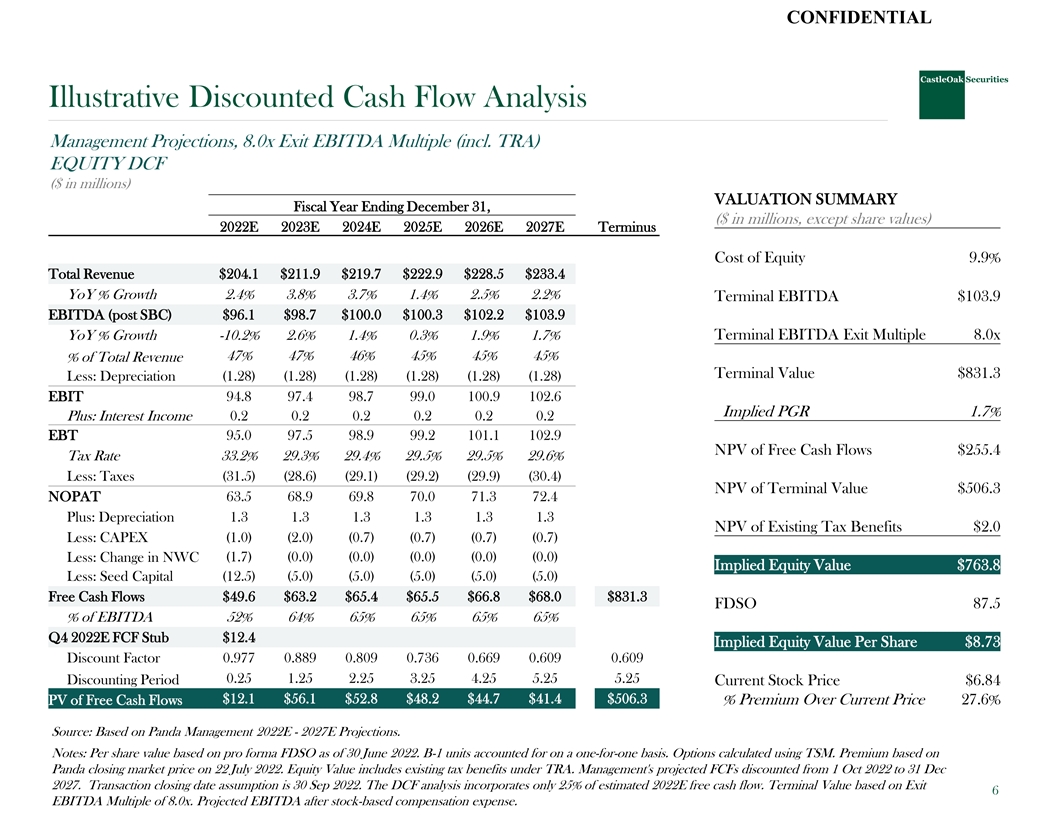
CONFIDENTIAL Illustrative Discounted Cash Flow Analysis Management Projections, 8.0x Exit EBITDA Multiple (incl. TRA) EQUITY DCF ($ in millions) VALUATION SUMMARY Fiscal Year Ending December 31, ($ in millions, except share values) 2022E 2023E 2024E 2025E 2026E 2027E Terminus Cost of Equity 9.9% Total Revenue $204.1 $211.9 $219.7 $222.9 $228.5 $233.4 YoY % Growth 2.4% 3.8% 3.7% 1.4% 2.5% 2.2% Terminal EBITDA $103.9 EBITDA (post SBC) $96.1 $98.7 $100.0 $100.3 $102.2 $103.9 YoY % Growth -10.2% 2.6% 1.4% 0.3% 1.9% 1.7% Terminal EBITDA Exit Multiple 8.0x 47% 47% 46% 45% 45% 45% % of Total Revenue Terminal Value $831.3 Less: Depreciation (1.28) (1.28) (1.28) (1.28) (1.28) (1.28) EBIT 94.8 97.4 98.7 99.0 100.9 102.6 Implied PGR 1.7% Plus: Interest Income 0.2 0.2 0.2 0.2 0.2 0.2 EBT 95.0 97.5 98.9 99.2 101.1 102.9 NPV of Free Cash Flows $255.4 Tax Rate 33.2% 29.3% 29.4% 29.5% 29.5% 29.6% Less: Taxes (31.5) (28.6) (29.1) (29.2) (29.9) (30.4) NPV of Terminal Value $506.3 NOPAT 63.5 68.9 69.8 70.0 71.3 72.4 Plus: Depreciation 1.3 1.3 1.3 1.3 1.3 1.3 NPV of Existing Tax Benefits $2.0 Less: CAPEX (1.0) (2.0) (0.7) (0.7) (0.7) (0.7) (1.7) (0.0) (0.0) (0.0) (0.0) (0.0) Less: Change in NWC Implied Equity Value $763.8 Less: Seed Capital (12.5) (5.0) (5.0) (5.0) (5.0) (5.0) Free Cash Flows $49.6 $63.2 $65.4 $65.5 $66.8 $68.0 $831.3 FDSO 87.5 % of EBITDA 52% 64% 65% 65% 65% 65% Q4 2022E FCF Stub $12.4 Implied Equity Value Per Share $8.73 Discount Factor 0.977 0.889 0.809 0.736 0.669 0.609 0.609 0.25 1.25 2.25 3.25 4.25 5.25 5.25 Discounting Period Current Stock Price $6.84 $12.1 $56.1 $52.8 $48.2 $44.7 $41.4 $506.3 PV of Free Cash Flows % Premium Over Current Price 27.6% Source: Based on Panda Management 2022E - 2027E Projections. Notes: Per share value based on pro forma FDSO as of 30 June 2022. B-1 units accounted for on a one-for-one basis. Options calculated using TSM. Premium based on Panda closing market price on 22 July 2022. Equity Value includes existing tax benefits under TRA. Management's projected FCFs discounted from 1 Oct 2022 to 31 Dec 2027. Transaction closing date assumption is 30 Sep 2022. The DCF analysis incorporates only 25% of estimated 2022E free cash flow. Terminal Value based on Exit 6 EBITDA Multiple of 8.0x. Projected EBITDA after stock-based compensation expense.
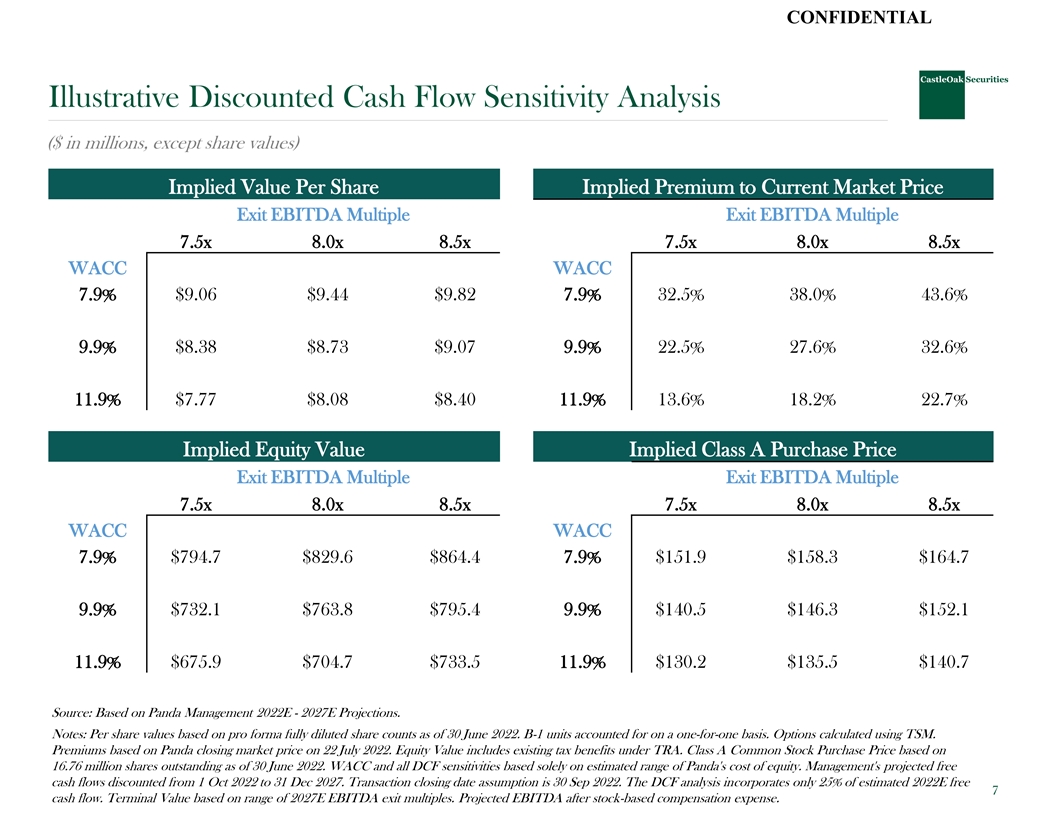
CONFIDENTIAL Illustrative Discounted Cash Flow Sensitivity Analysis ($ in millions, except share values) Implied Value Per Share Implied Premium to Current Market Price Exit EBITDA Multiple Exit EBITDA Multiple 7.5x 8.0x 8.5x 7.5x 8.0x 8.5x WACC WACC 7.9% $9.06 $9.44 $9.82 7.9% 32.5% 38.0% 43.6% 9.9% $8.38 $8.73 $9.07 9.9% 22.5% 27.6% 32.6% 11.9% $7.77 $8.08 $8.40 11.9% 13.6% 18.2% 22.7% Implied Equity Value Implied Class A Purchase Price Exit EBITDA Multiple Exit EBITDA Multiple 7.5x 8.0x 8.5x 7.5x 8.0x 8.5x WACC WACC 7.9% $794.7 $829.6 $864.4 7.9% $151.9 $158.3 $164.7 9.9% $732.1 $763.8 $795.4 9.9% $140.5 $146.3 $152.1 11.9% $675.9 $704.7 $733.5 11.9% $130.2 $135.5 $140.7 Source: Based on Panda Management 2022E - 2027E Projections. Notes: Per share values based on pro forma fully diluted share counts as of 30 June 2022. B-1 units accounted for on a one-for-one basis. Options calculated using TSM. Premiums based on Panda closing market price on 22 July 2022. Equity Value includes existing tax benefits under TRA. Class A Common Stock Purchase Price based on 16.76 million shares outstanding as of 30 June 2022. WACC and all DCF sensitivities based solely on estimated range of Panda's cost of equity. Management's projected free cash flows discounted from 1 Oct 2022 to 31 Dec 2027. Transaction closing date assumption is 30 Sep 2022. The DCF analysis incorporates only 25% of estimated 2022E free 7 cash flow. Terminal Value based on range of 2027E EBITDA exit multiples. Projected EBITDA after stock-based compensation expense.
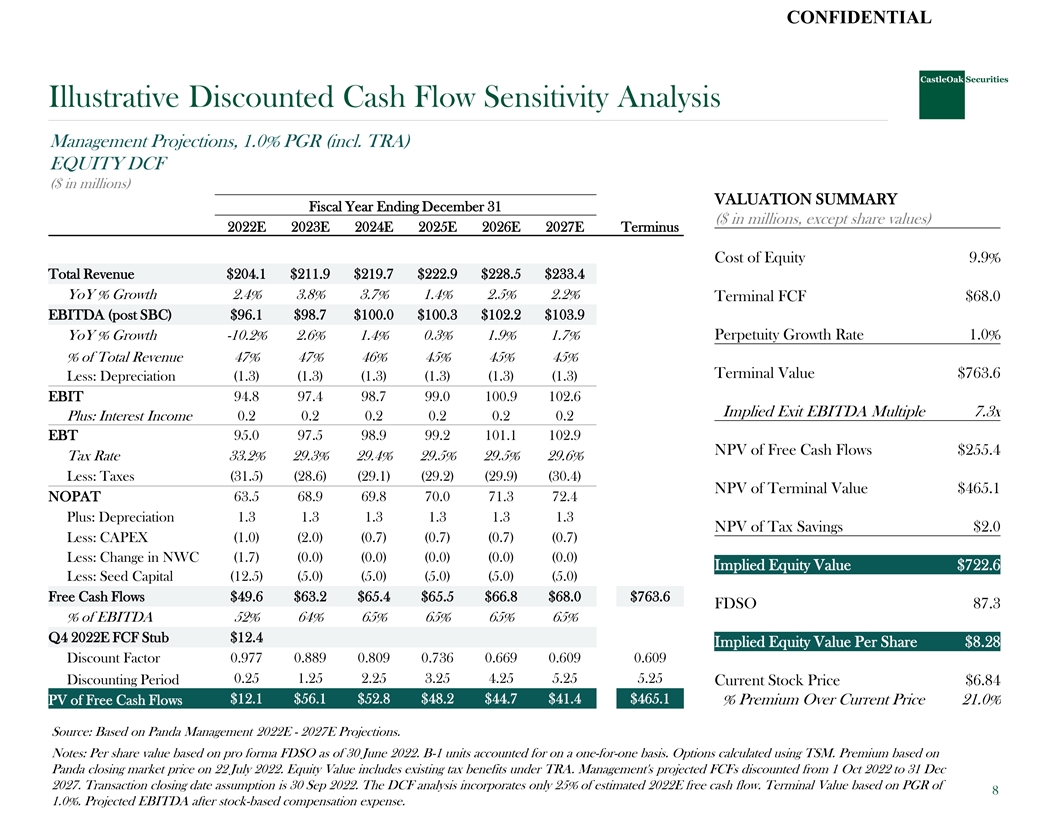
CONFIDENTIAL Illustrative Discounted Cash Flow Sensitivity Analysis Management Projections, 1.0% PGR (incl. TRA) EQUITY DCF ($ in millions) VALUATION SUMMARY Fiscal Year Ending December 31 ($ in millions, except share values) 2022E 2023E 2024E 2025E 2026E 2027E Terminus Cost of Equity 9.9% Total Revenue $204.1 $211.9 $219.7 $222.9 $228.5 $233.4 YoY % Growth 2.4% 3.8% 3.7% 1.4% 2.5% 2.2% Terminal FCF $68.0 EBITDA (post SBC) $96.1 $98.7 $100.0 $100.3 $102.2 $103.9 YoY % Growth -10.2% 2.6% 1.4% 0.3% 1.9% 1.7% Perpetuity Growth Rate 1.0% % of Total Revenue 47% 47% 46% 45% 45% 45% Terminal Value $763.6 Less: Depreciation (1.3) (1.3) (1.3) (1.3) (1.3) (1.3) EBIT 94.8 97.4 98.7 99.0 100.9 102.6 Implied Exit EBITDA Multiple 7.3x Plus: Interest Income 0.2 0.2 0.2 0.2 0.2 0.2 EBT 95.0 97.5 98.9 99.2 101.1 102.9 NPV of Free Cash Flows $255.4 Tax Rate 33.2% 29.3% 29.4% 29.5% 29.5% 29.6% Less: Taxes (31.5) (28.6) (29.1) (29.2) (29.9) (30.4) NPV of Terminal Value $465.1 NOPAT 63.5 68.9 69.8 70.0 71.3 72.4 Plus: Depreciation 1.3 1.3 1.3 1.3 1.3 1.3 NPV of Tax Savings $2.0 Less: CAPEX (1.0) (2.0) (0.7) (0.7) (0.7) (0.7) Less: Change in NWC (1.7) (0.0) (0.0) (0.0) (0.0) (0.0) Implied Equity Value $722.6 Less: Seed Capital (12.5) (5.0) (5.0) (5.0) (5.0) (5.0) Free Cash Flows $49.6 $63.2 $65.4 $65.5 $66.8 $68.0 $763.6 FDSO 87.3 % of EBITDA 52% 64% 65% 65% 65% 65% Q4 2022E FCF Stub $12.4 Implied Equity Value Per Share $8.28 Discount Factor 0.977 0.889 0.809 0.736 0.669 0.609 0.609 0.25 1.25 2.25 3.25 4.25 5.25 5.25 Discounting Period Current Stock Price $6.84 $12.1 $56.1 $52.8 $48.2 $44.7 $41.4 $465.1 PV of Free Cash Flows % Premium Over Current Price 21.0% Source: Based on Panda Management 2022E - 2027E Projections. Notes: Per share value based on pro forma FDSO as of 30 June 2022. B-1 units accounted for on a one-for-one basis. Options calculated using TSM. Premium based on Panda closing market price on 22 July 2022. Equity Value includes existing tax benefits under TRA. Management's projected FCFs discounted from 1 Oct 2022 to 31 Dec 2027. Transaction closing date assumption is 30 Sep 2022. The DCF analysis incorporates only 25% of estimated 2022E free cash flow. Terminal Value based on PGR of 8 1.0%. Projected EBITDA after stock-based compensation expense.
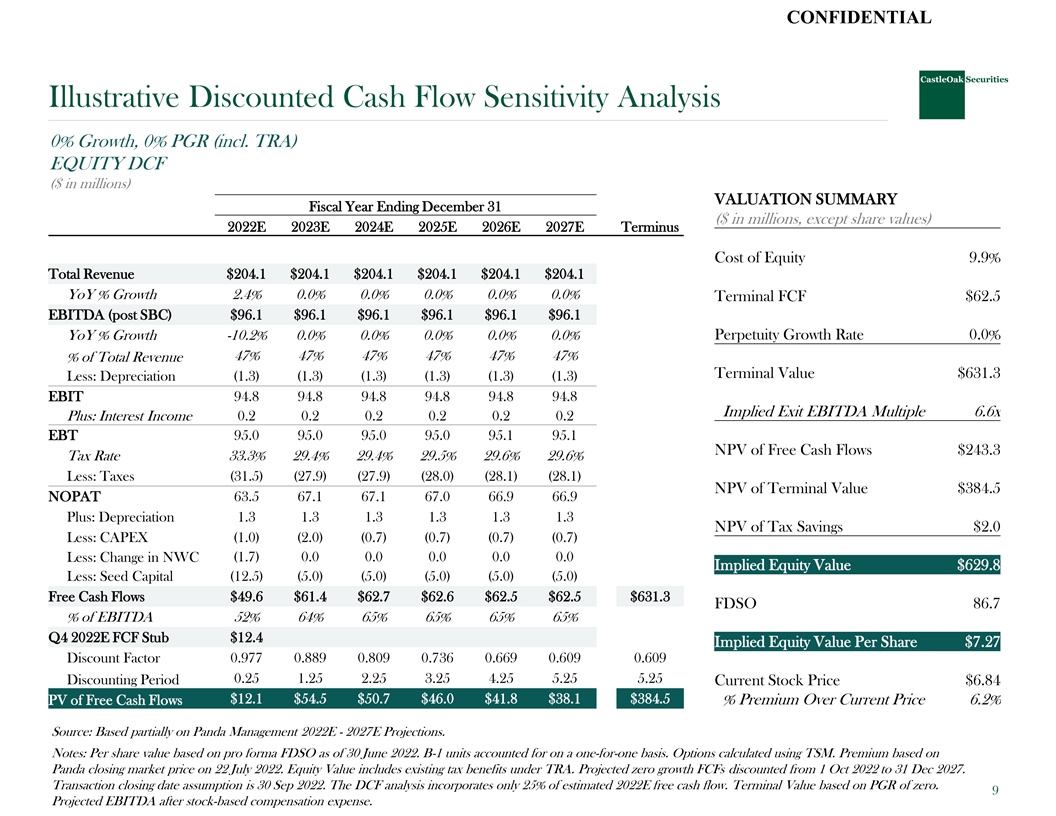
CONFIDENTIAL Illustrative Discounted Cash Flow Sensitivity Analysis 0% Growth, 0% PGR (incl. TRA) EQUITY DCF ($ in millions) VALUATION SUMMARY Fiscal Year Ending December 31 ($ in millions, except share values) 2022E 2023E 2024E 2025E 2026E 2027E Terminus Cost of Equity 9.9% Total Revenue $204.1 $204.1 $204.1 $204.1 $204.1 $204.1 YoY % Growth 2.4% 0.0% 0.0% 0.0% 0.0% 0.0% Terminal FCF $62.5 EBITDA (post SBC) $96.1 $96.1 $96.1 $96.1 $96.1 $96.1 YoY % Growth -10.2% 0.0% 0.0% 0.0% 0.0% 0.0% Perpetuity Growth Rate 0.0% 47% 47% 47% 47% 47% 47% % of Total Revenue Terminal Value $631.3 Less: Depreciation (1.3) (1.3) (1.3) (1.3) (1.3) (1.3) EBIT 94.8 94.8 94.8 94.8 94.8 94.8 Implied Exit EBITDA Multiple 6.6x Plus: Interest Income 0.2 0.2 0.2 0.2 0.2 0.2 EBT 95.0 95.0 95.0 95.0 95.1 95.1 NPV of Free Cash Flows $243.3 Tax Rate 33.3% 29.4% 29.4% 29.5% 29.6% 29.6% Less: Taxes (31.5) (27.9) (27.9) (28.0) (28.1) (28.1) NPV of Terminal Value $384.5 NOPAT 63.5 67.1 67.1 67.0 66.9 66.9 Plus: Depreciation 1.3 1.3 1.3 1.3 1.3 1.3 NPV of Tax Savings $2.0 Less: CAPEX (1.0) (2.0) (0.7) (0.7) (0.7) (0.7) (1.7) 0.0 0.0 0.0 0.0 0.0 Less: Change in NWC Implied Equity Value $629.8 Less: Seed Capital (12.5) (5.0) (5.0) (5.0) (5.0) (5.0) Free Cash Flows $49.6 $61.4 $62.7 $62.6 $62.5 $62.5 $631.3 FDSO 86.7 % of EBITDA 52% 64% 65% 65% 65% 65% Q4 2022E FCF Stub $12.4 Implied Equity Value Per Share $7.27 Discount Factor 0.977 0.889 0.809 0.736 0.669 0.609 0.609 0.25 1.25 2.25 3.25 4.25 5.25 5.25 Discounting Period Current Stock Price $6.84 $12.1 $54.5 $50.7 $46.0 $41.8 $38.1 $384.5 PV of Free Cash Flows % Premium Over Current Price 6.2% Source: Based partially on Panda Management 2022E - 2027E Projections. Notes: Per share value based on pro forma FDSO as of 30 June 2022. B-1 units accounted for on a one-for-one basis. Options calculated using TSM. Premium based on Panda closing market price on 22 July 2022. Equity Value includes existing tax benefits under TRA. Projected zero growth FCFs discounted from 1 Oct 2022 to 31 Dec 2027. Transaction closing date assumption is 30 Sep 2022. The DCF analysis incorporates only 25% of estimated 2022E free cash flow. Terminal Value based on PGR of zero. 9 Projected EBITDA after stock-based compensation expense.
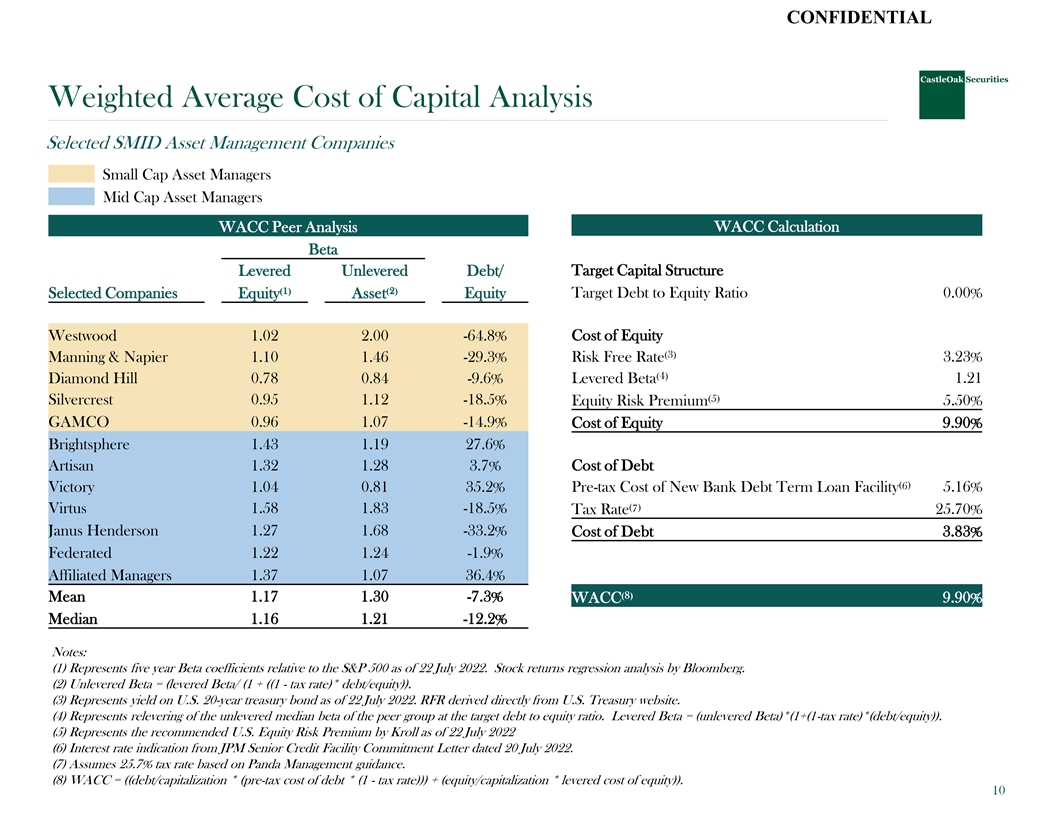
CONFIDENTIAL Weighted Average Cost of Capital Analysis Selected SMID Asset Management Companies Small Cap Asset Managers Mid Cap Asset Managers WACC Peer Analysis WACC Calculation Beta Levered Unlevered Debt/ Target Capital Structure Target Debt to Equity Ratio 0.00% Selected Companies Equity⁽¹⁾ Asset⁽²⁾ Equity Cost of Equity Westwood 1.02 2.00 -64.8% 3 3.23% Manning & Napier 1.10 1.46 -29.3% Risk Free Rate⁽⁾ 4 1.21 Diamond Hill 0.78 0.84 -9.6% Levered Beta⁽⁾ 5 Silvercrest 0.95 1.12 -18.5% Equity Risk Premium 5.50% ⁽⁾ GAMCO 0.96 1.07 -14.9% Cost of Equity 9.90% Brightsphere 1.43 1.19 27.6% Artisan 1.32 1.28 3.7% Cost of Debt 6 Victory 1.04 0.81 35.2% Pre-tax Cost of New Bank Debt Term Loan Facility⁽⁾ 5.16% 7 Virtus 1.58 1.83 -18.5% Tax Rate⁽⁾ 25.70% Janus Henderson 1.27 1.68 -33.2% Cost of Debt 3.83% Federated 1.22 1.24 -1.9% Affiliated Managers 1.37 1.07 36.4% 8 Mean 1.17 1.30 -7.3% WACC⁽⁾ 9.90% Median 1.16 1.21 -12.2% Notes: (1) Represents five year Beta coefficients relative to the S&P 500 as of 22 July 2022. Stock returns regression analysis by Bloomberg. (2) Unlevered Beta = (levered Beta/ (1 + ((1 - tax rate)* debt/equity)). (3) Represents yield on U.S. 20-year treasury bond as of 22 July 2022. RFR derived directly from U.S. Treasury website. (4) Represents relevering of the unlevered median beta of the peer group at the target debt to equity ratio. Levered Beta = (unlevered Beta)*(1+(1-tax rate)*(debt/equity)). (5) Represents the recommended U.S. Equity Risk Premium by Kroll as of 22 July 2022 (6) Interest rate indication from JPM Senior Credit Facility Commitment Letter dated 20 July 2022. (7) Assumes 25.7% tax rate based on Panda Management guidance. (8) WACC = ((debt/capitalization * (pre-tax cost of debt * (1 - tax rate))) + (equity/capitalization * levered cost of equity)). 10
Honesty | Integrity | Performance Selected Public Market Comparisons www.castleoaklp.com 11 11
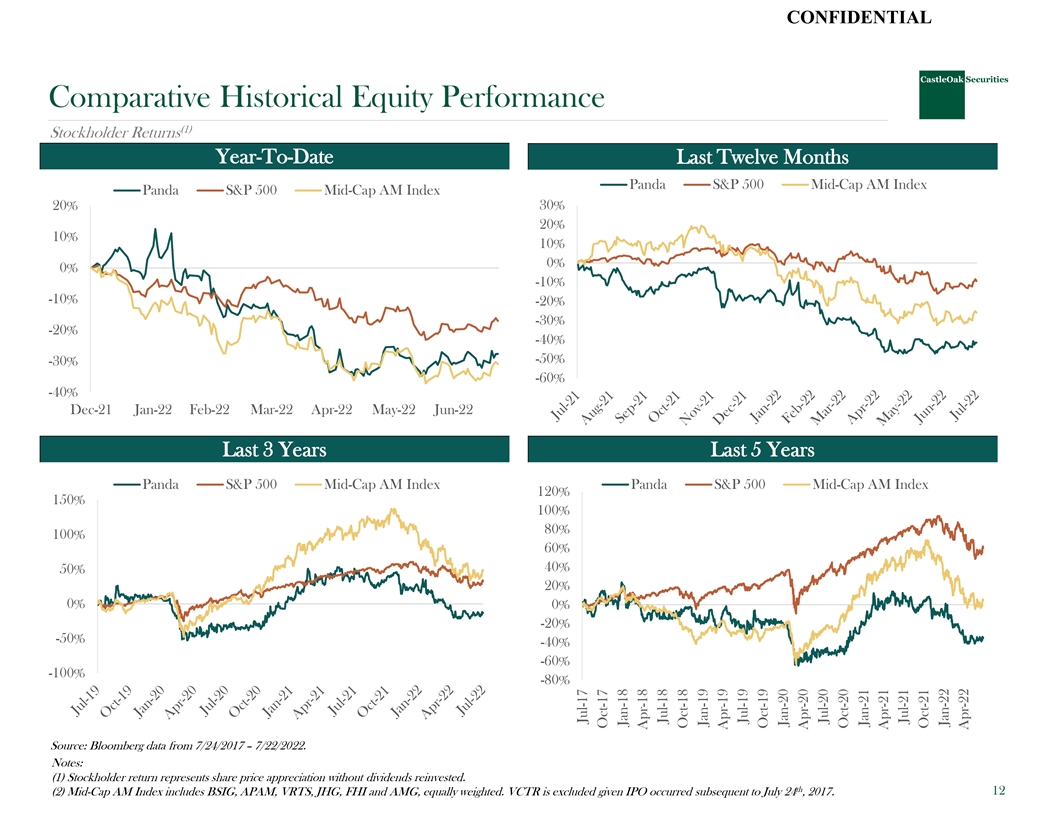
CONFIDENTIAL Comparative Historical Equity Performance (1) Stockholder Returns Year-To-Date Last Twelve Months Panda S&P 500 Mid-Cap AM Index Panda S&P 500 Mid-Cap AM Index 30% 20% 20% 10% 10% 0% 0% -10% -10% -20% -30% -20% -40% -50% -30% -60% -40% Dec-21 Jan-22 Feb-22 Mar-22 Apr-22 May-22 Jun-22 Last 3 Years Last 5 Years Panda S&P 500 Mid-Cap AM Index Panda S&P 500 Mid-Cap AM Index 120% 150% 100% 80% 100% 60% 40% 50% 20% 0% 0% -20% -50% -40% -60% -100% -80% Source: Bloomberg data from 7/24/2017 – 7/22/2022. Notes: (1) Stockholder return represents share price appreciation without dividends reinvested. th 12 (2) Mid-Cap AM Index includes BSIG, APAM, VRTS, JHG, FHI and AMG, equally weighted. VCTR is excluded given IPO occurred subsequent to July 24 , 2017. Jul-17 Oct-17 Jan-18 Apr-18 Jul-18 Oct-18 Jan-19 Apr-19 Jul-19 Oct-19 Jan-20 Apr-20 Jul-20 Oct-20 Jan-21 Apr-21 Jul-21 Oct-21 Jan-22 Apr-22
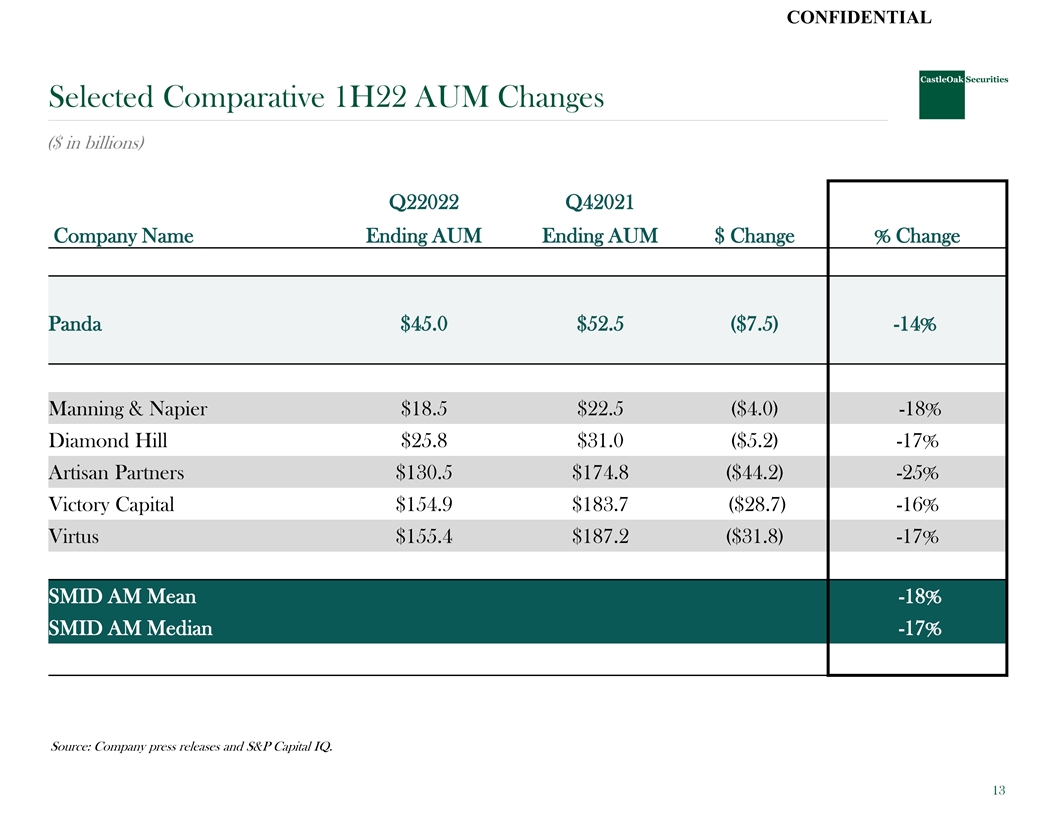
CONFIDENTIAL Selected Comparative 1H22 AUM Changes ($ in billions) Q22022 Q42021 Company Name Ending AUM Ending AUM $ Change % Change Panda $45.0 $52.5 ($7.5) -14% Manning & Napier $18.5 $22.5 ($4.0) -18% Diamond Hill $25.8 $31.0 ($5.2) -17% Artisan Partners $130.5 $174.8 ($44.2) -25% Victory Capital $154.9 $183.7 ($28.7) -16% Virtus $155.4 $187.2 ($31.8) -17% SMID AM Mean -18% SMID AM Median -17% Source: Company press releases and S&P Capital IQ. 13
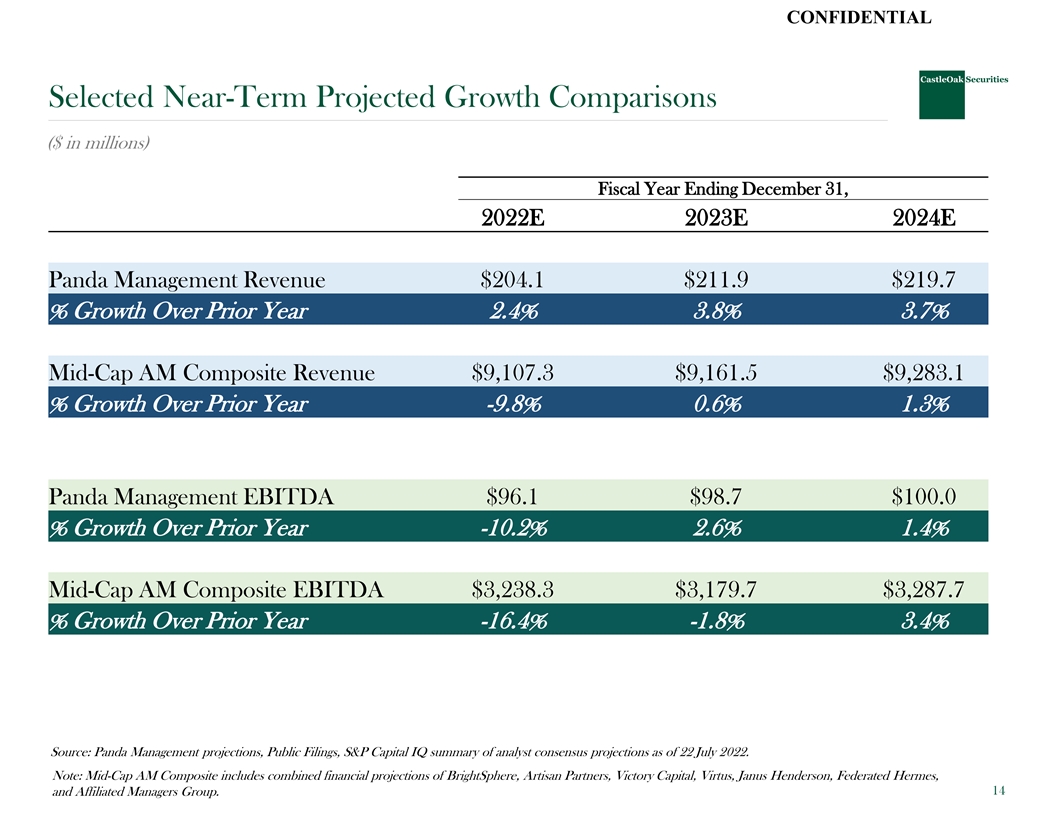
CONFIDENTIAL Selected Near-Term Projected Growth Comparisons ($ in millions) Fiscal Year Ending December 31, 2022E 2023E 2024E Panda Management Revenue $204.1 $211.9 $219.7 % Growth Over Prior Year 2.4% 3.8% 3.7% Mid-Cap AM Composite Revenue $9,107.3 $9,161.5 $9,283.1 % Growth Over Prior Year -9.8% 0.6% 1.3% Panda Management EBITDA $96.1 $98.7 $100.0 % Growth Over Prior Year -10.2% 2.6% 1.4% Mid-Cap AM Composite EBITDA $3,238.3 $3,179.7 $3,287.7 % Growth Over Prior Year -16.4% -1.8% 3.4% Source: Panda Management projections, Public Filings, S&P Capital IQ summary of analyst consensus projections as of 22 July 2022. Note: Mid-Cap AM Composite includes combined financial projections of BrightSphere, Artisan Partners, Victory Capital, Virtus, Janus Henderson, Federated Hermes, 14 and Affiliated Managers Group.
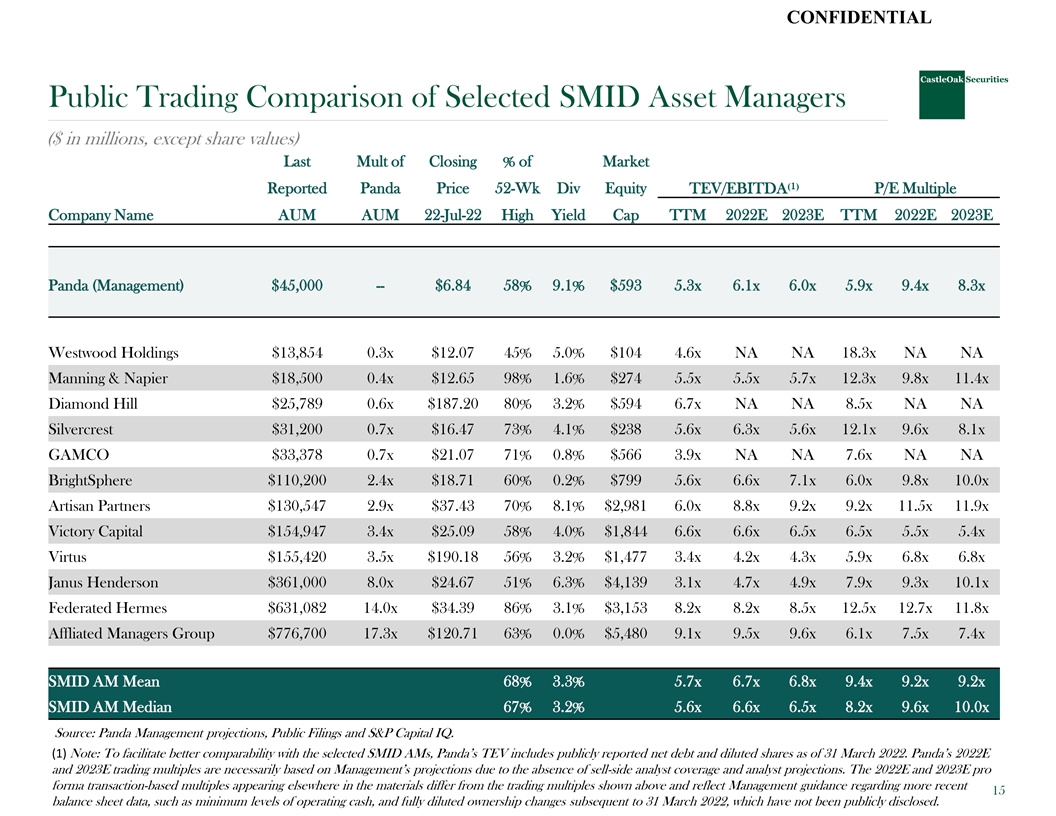
CONFIDENTIAL Public Trading Comparison of Selected SMID Asset Managers ($ in millions, except share values) Last Mult of Closing % of Market Reported Panda Price 52-Wk Div Equity TEV/EBITDA⁽¹⁾ P/E Multiple Company Name AUM AUM 22-Jul-22 High Yield Cap TTM 2022E 2023E TTM 2022E 2023E Panda (Management) $45,000 -- $6.84 58% 9.1% $593 5.3x 6.1x 6.0x 5.9x 9.4x 8.3x Westwood Holdings $13,854 0.3x $12.07 45% 5.0% $104 4.6x NA NA 18.3x NA NA Manning & Napier $18,500 0.4x $12.65 98% 1.6% $274 5.5x 5.5x 5.7x 12.3x 9.8x 11.4x Diamond Hill $25,789 0.6x $187.20 80% 3.2% $594 6.7x NA NA 8.5x NA NA Silvercrest $31,200 0.7x $16.47 73% 4.1% $238 5.6x 6.3x 5.6x 12.1x 9.6x 8.1x GAMCO $33,378 0.7x $21.07 71% 0.8% $566 3.9x NA NA 7.6x NA NA BrightSphere $110,200 2.4x $18.71 60% 0.2% $799 5.6x 6.6x 7.1x 6.0x 9.8x 10.0x Artisan Partners $130,547 2.9x $37.43 70% 8.1% $2,981 6.0x 8.8x 9.2x 9.2x 11.5x 11.9x Victory Capital $154,947 3.4x $25.09 58% 4.0% $1,844 6.6x 6.6x 6.5x 6.5x 5.5x 5.4x Virtus $155,420 3.5x $190.18 56% 3.2% $1,477 3.4x 4.2x 4.3x 5.9x 6.8x 6.8x Janus Henderson $361,000 8.0x $24.67 51% 6.3% $4,139 3.1x 4.7x 4.9x 7.9x 9.3x 10.1x Federated Hermes $631,082 14.0x $34.39 86% 3.1% $3,153 8.2x 8.2x 8.5x 12.5x 12.7x 11.8x Affliated Managers Group $776,700 17.3x $120.71 63% 0.0% $5,480 9.1x 9.5x 9.6x 6.1x 7.5x 7.4x SMID AM Mean 68% 3.3% 5.7x 6.7x 6.8x 9.4x 9.2x 9.2x SMID AM Median 67% 3.2% 5.6x 6.6x 6.5x 8.2x 9.6x 10.0x Source: Panda Management projections, Public Filings and S&P Capital IQ. (1) Note: To facilitate better comparability with the selected SMID AMs, Panda’s TEV includes publicly reported net debt and diluted shares as of 31 March 2022. Panda’s 2022E and 2023E trading multiples are necessarily based on Management’s projections due to the absence of sell-side analyst coverage and analyst projections. The 2022E and 2023E pro forma transaction-based multiples appearing elsewhere in the materials differ from the trading multiples shown above and reflect Management guidance regarding more recent 15 balance sheet data, such as minimum levels of operating cash, and fully diluted ownership changes subsequent to 31 March 2022, which have not been publicly disclosed.
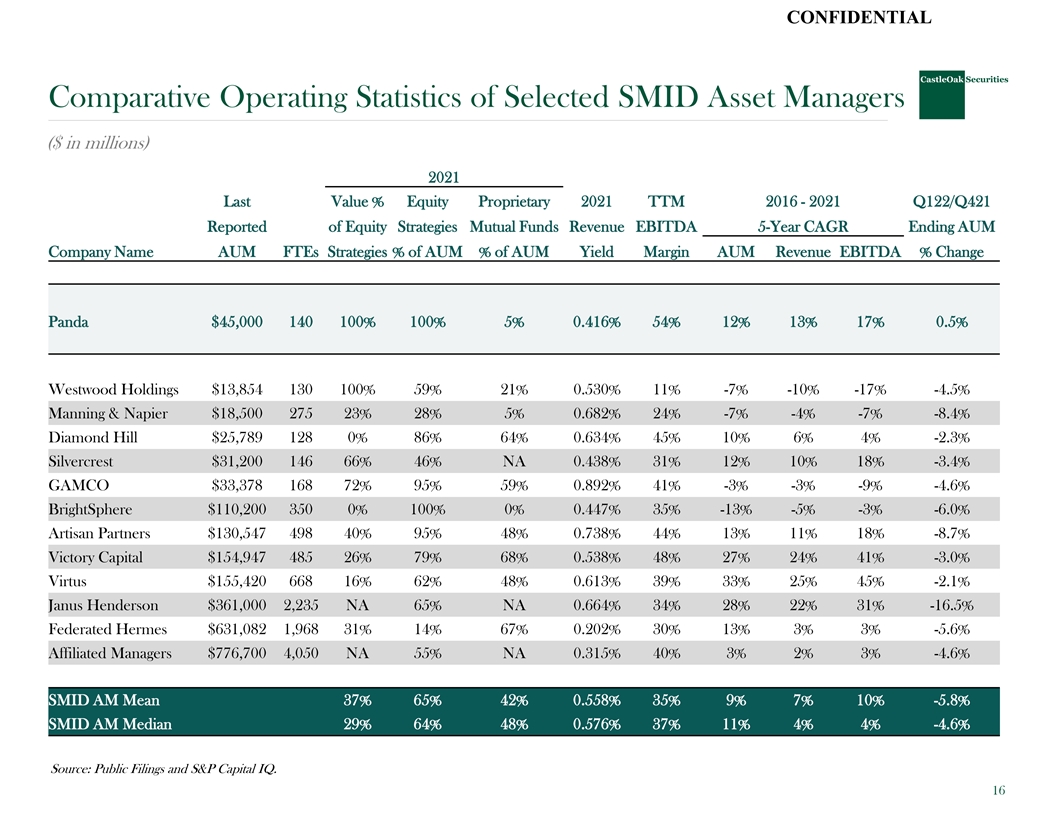
CONFIDENTIAL Comparative Operating Statistics of Selected SMID Asset Managers ($ in millions) 2021 Last Value % Equity Proprietary 2021 TTM 2016 - 2021 Q122/Q421 Reported of Equity Strategies Mutual Funds Revenue EBITDA 5-Year CAGR Ending AUM Company Name AUM FTEs Strategies % of AUM % of AUM Yield Margin AUM Revenue EBITDA % Change Panda $45,000 140 100% 100% 5% 0.416% 54% 12% 13% 17% 0.5% Westwood Holdings $13,854 130 100% 59% 21% 0.530% 11% -7% -10% -17% -4.5% Manning & Napier $18,500 275 23% 28% 5% 0.682% 24% -7% -4% -7% -8.4% Diamond Hill $25,789 128 0% 86% 64% 0.634% 45% 10% 6% 4% -2.3% Silvercrest $31,200 146 66% 46% NA 0.438% 31% 12% 10% 18% -3.4% GAMCO $33,378 168 72% 95% 59% 0.892% 41% -3% -3% -9% -4.6% BrightSphere $110,200 350 0% 100% 0% 0.447% 35% -13% -5% -3% -6.0% Artisan Partners $130,547 498 40% 95% 48% 0.738% 44% 13% 11% 18% -8.7% Victory Capital $154,947 485 26% 79% 68% 0.538% 48% 27% 24% 41% -3.0% Virtus $155,420 668 16% 62% 48% 0.613% 39% 33% 25% 45% -2.1% Janus Henderson $361,000 2,235 NA 65% NA 0.664% 34% 28% 22% 31% -16.5% Federated Hermes $631,082 1,968 31% 14% 67% 0.202% 30% 13% 3% 3% -5.6% Affiliated Managers $776,700 4,050 NA 55% NA 0.315% 40% 3% 2% 3% -4.6% SMID AM Mean 37% 65% 42% 0.558% 35% 9% 7% 10% -5.8% SMID AM Median 29% 64% 48% 0.576% 37% 11% 4% 4% -4.6% Source: Public Filings and S&P Capital IQ. 16
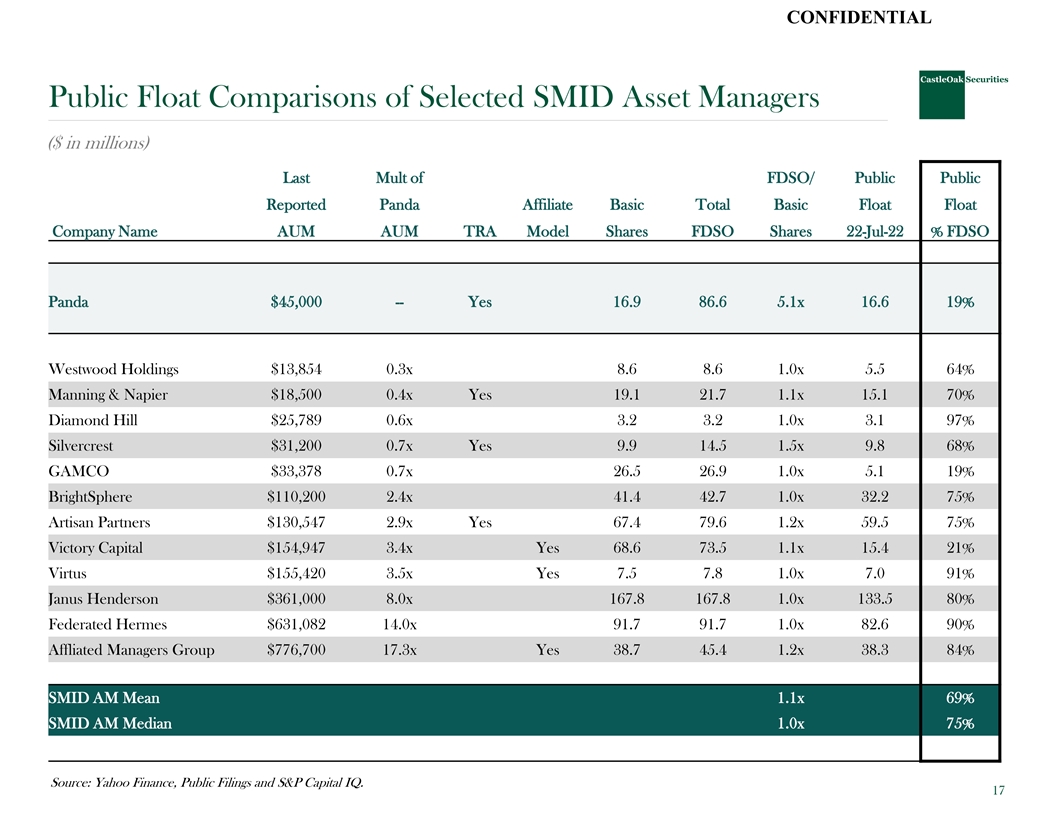
CONFIDENTIAL Public Float Comparisons of Selected SMID Asset Managers ($ in millions) Last Mult of FDSO/ Public Public Reported Panda Affiliate Basic Total Basic Float Float Company Name AUM AUM TRA Model Shares FDSO Shares 22-Jul-22 % FDSO Panda $45,000 -- Yes 16.9 86.6 5.1x 16.6 19% Westwood Holdings $13,854 0.3x 8.6 8.6 1.0x 5.5 64% Manning & Napier $18,500 0.4x Yes 19.1 21.7 1.1x 15.1 70% Diamond Hill $25,789 0.6x 3.2 3.2 1.0x 3.1 97% Silvercrest $31,200 0.7x Yes 9.9 14.5 1.5x 9.8 68% GAMCO $33,378 0.7x 26.5 26.9 1.0x 5.1 19% BrightSphere $110,200 2.4x 41.4 42.7 1.0x 32.2 75% Artisan Partners $130,547 2.9x Yes 67.4 79.6 1.2x 59.5 75% Victory Capital $154,947 3.4x Yes 68.6 73.5 1.1x 15.4 21% Virtus $155,420 3.5x Yes 7.5 7.8 1.0x 7.0 91% Janus Henderson $361,000 8.0x 167.8 167.8 1.0x 133.5 80% Federated Hermes $631,082 14.0x 91.7 91.7 1.0x 82.6 90% Affliated Managers Group $776,700 17.3x Yes 38.7 45.4 1.2x 38.3 84% SMID AM Mean 1.1x 69% SMID AM Median 1.0x 75% Source: Yahoo Finance, Public Filings and S&P Capital IQ. 17
Honesty | Integrity | Performance Selected Private Market Transactions www.castleoaklp.com 18 18
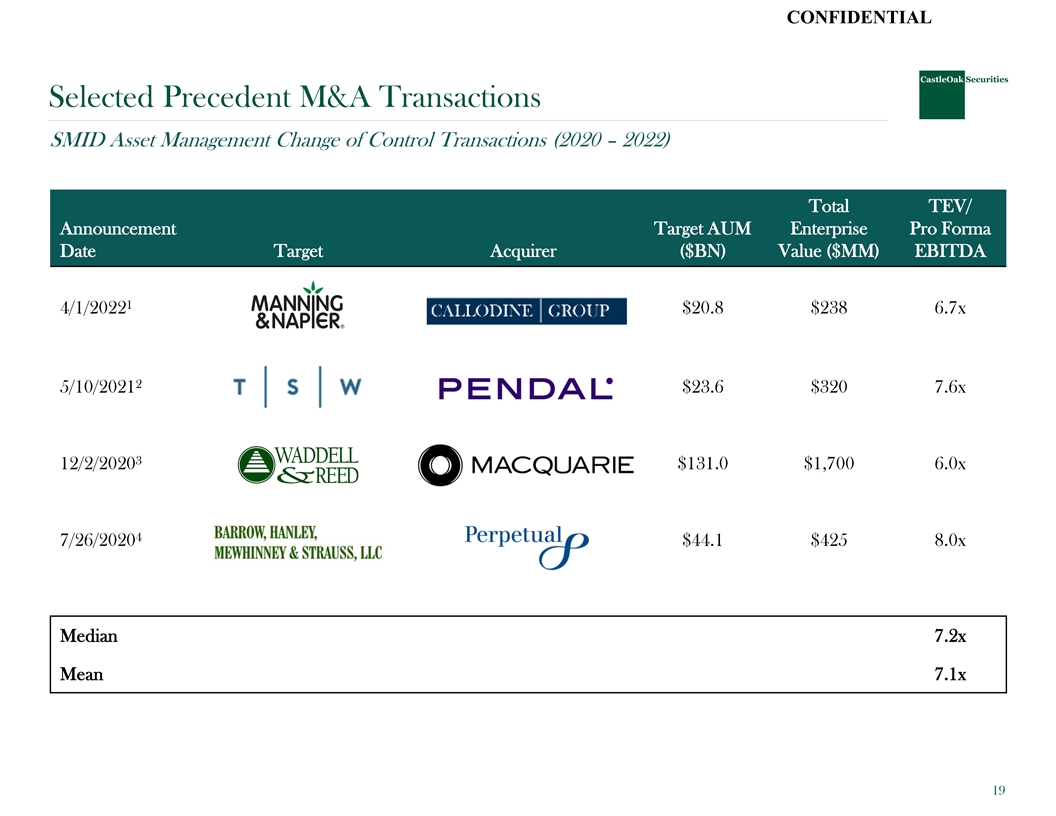
CONFIDENTIAL Selected Precedent M&A Transactions SMID Asset Management Change of Control Transactions (2020 – 2022) Total TEV/ Announcement Target AUM Enterprise Pro Forma Date Target Acquirer ($BN) Value ($MM) EBITDA 1 4/1/2022 $20.8 $238 6.7x 2 5/10/2021 $23.6 $320 7.6x 3 12/2/2020 $131.0 $1,700 6.0x 4 7/26/2020 $44.1 $425 8.0x Median 7.2x Mean 7.1x 19
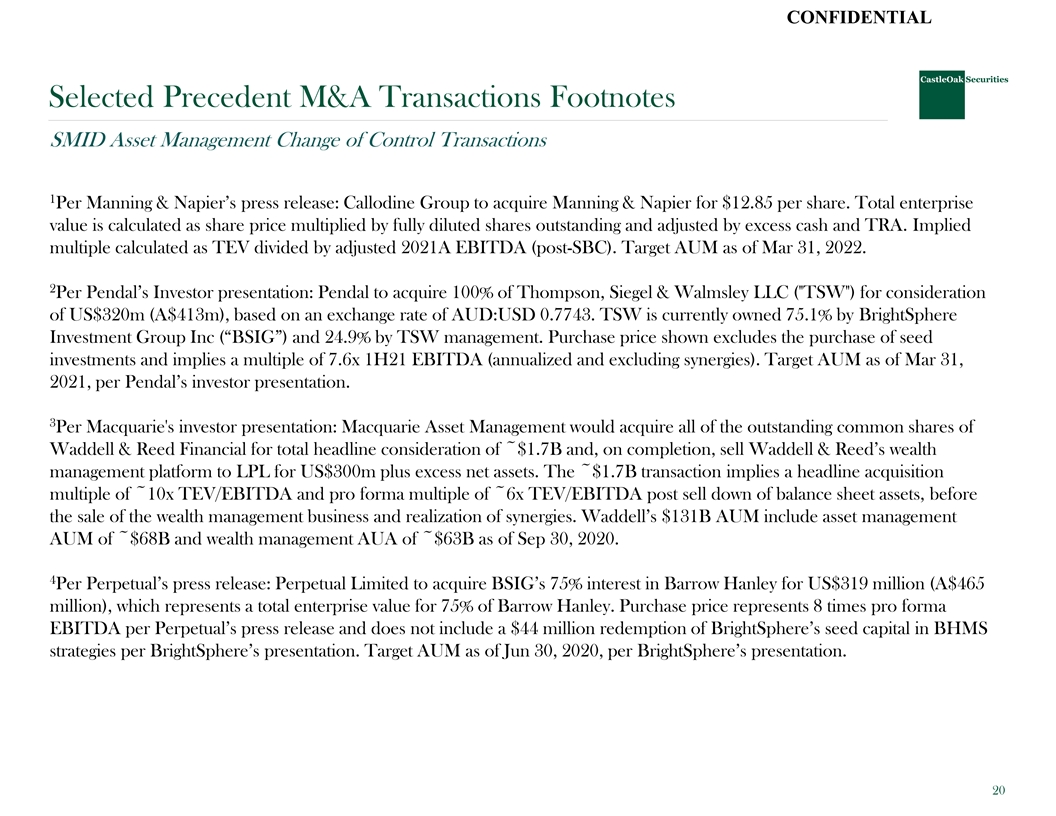
CONFIDENTIAL Selected Precedent M&A Transactions Footnotes SMID Asset Management Change of Control Transactions 1 Per Manning & Napier’s press release: Callodine Group to acquire Manning & Napier for $12.85 per share. Total enterprise value is calculated as share price multiplied by fully diluted shares outstanding and adjusted by excess cash and TRA. Implied multiple calculated as TEV divided by adjusted 2021A EBITDA (post-SBC). Target AUM as of Mar 31, 2022. 2 Per Pendal’s Investor presentation: Pendal to acquire 100% of Thompson, Siegel & Walmsley LLC ( TSW ) for consideration of US$320m (A$413m), based on an exchange rate of AUD:USD 0.7743. TSW is currently owned 75.1% by BrightSphere Investment Group Inc (“BSIG”) and 24.9% by TSW management. Purchase price shown excludes the purchase of seed investments and implies a multiple of 7.6x 1H21 EBITDA (annualized and excluding synergies). Target AUM as of Mar 31, 2021, per Pendal’s investor presentation. 3 Per Macquarie's investor presentation: Macquarie Asset Management would acquire all of the outstanding common shares of Waddell & Reed Financial for total headline consideration of ~$1.7B and, on completion, sell Waddell & Reed’s wealth management platform to LPL for US$300m plus excess net assets. The ~$1.7B transaction implies a headline acquisition multiple of ~10x TEV/EBITDA and pro forma multiple of ~6x TEV/EBITDA post sell down of balance sheet assets, before the sale of the wealth management business and realization of synergies. Waddell’s $131B AUM include asset management AUM of ~$68B and wealth management AUA of ~$63B as of Sep 30, 2020. 4 Per Perpetual’s press release: Perpetual Limited to acquire BSIG’s 75% interest in Barrow Hanley for US$319 million (A$465 million), which represents a total enterprise value for 75% of Barrow Hanley. Purchase price represents 8 times pro forma EBITDA per Perpetual’s press release and does not include a $44 million redemption of BrightSphere’s seed capital in BHMS strategies per BrightSphere’s presentation. Target AUM as of Jun 30, 2020, per BrightSphere’s presentation. 20
Honesty | Integrity | Performance Appendix www.castleoaklp.com 21 21
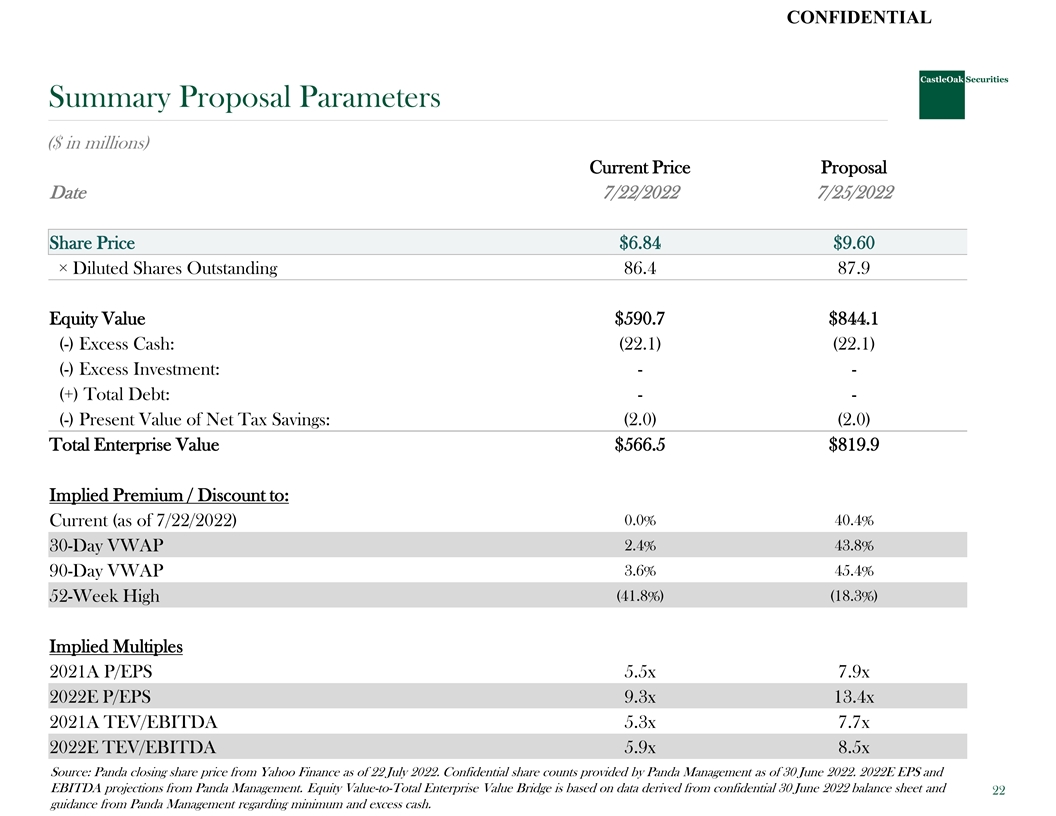
CONFIDENTIAL Summary Proposal Parameters ($ in millions) Current Price Proposal Date 7/22/2022 7/25/2022 Share Price $6.84 $9.60 × Diluted Shares Outstanding 86.4 87.9 Equity Value $590.7 $844.1 (-) Excess Cash: (22.1) (22.1) (-) Excess Investment: - - (+) Total Debt: - - (-) Present Value of Net Tax Savings: (2.0) (2.0) Total Enterprise Value $566.5 $819.9 Implied Premium / Discount to: 0.0% 40.4% Current (as of 7/22/2022) 2.4% 43.8% 30-Day VWAP 3.6% 45.4% 90-Day VWAP (41.8%) (18.3%) 52-Week High Implied Multiples 2021A P/EPS 5.5x 7.9x 2022E P/EPS 9.3x 13.4x 2021A TEV/EBITDA 5.3x 7.7x 2022E TEV/EBITDA 5.9x 8.5x Source: Panda closing share price from Yahoo Finance as of 22 July 2022. Confidential share counts provided by Panda Management as of 30 June 2022. 2022E EPS and EBITDA projections from Panda Management. Equity Value-to-Total Enterprise Value Bridge is based on data derived from confidential 30 June 2022 balance sheet and 22 guidance from Panda Management regarding minimum and excess cash.
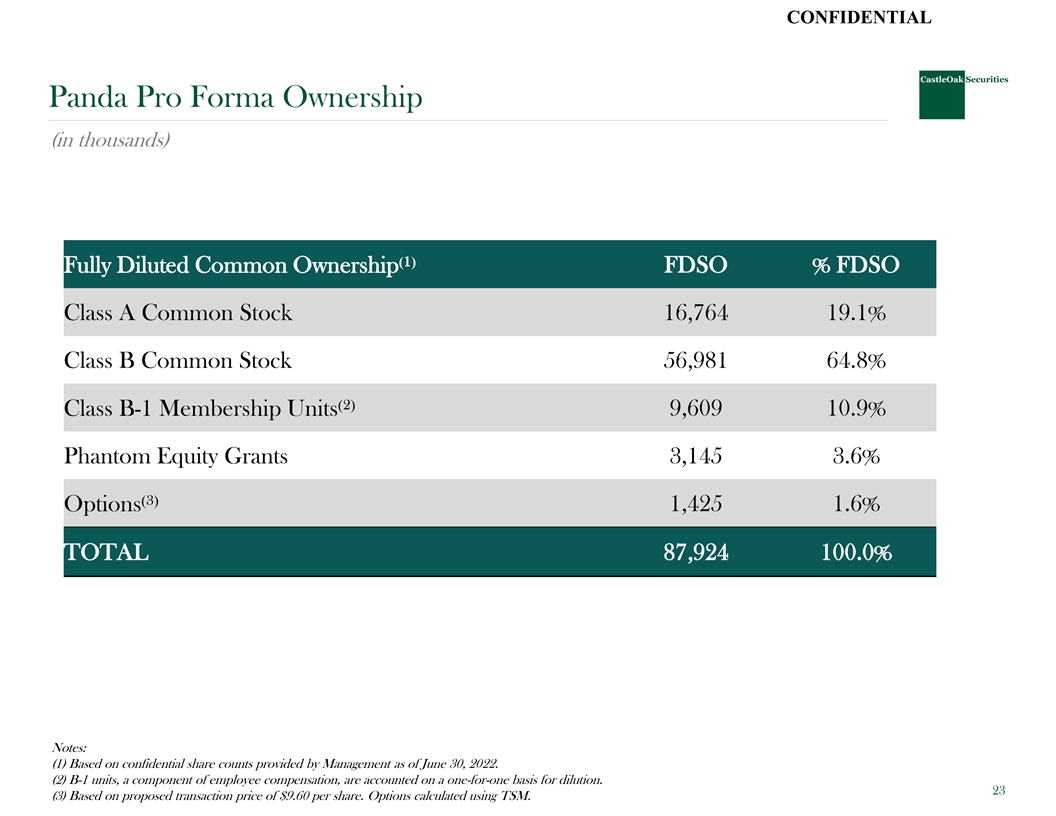
CONFIDENTIAL Panda Pro Forma Ownership (in thousands) FDSO % FDSO Fully Diluted Common Ownership⁽¹⁾ Class A Common Stock 16,764 19.1% Class B Common Stock 56,981 64.8% Class B-1 Membership Units⁽²⁾ 9,609 10.9% Phantom Equity Grants 3,145 3.6% Options⁽³⁾ 1,425 1.6% TOTAL 87,924 100.0% Notes: (1) Based on confidential share counts provided by Management as of June 30, 2022. (2) B-1 units, a component of employee compensation, are accounted on a one-for-one basis for dilution. 23 (3) Based on proposed transaction price of $9.60 per share. Options calculated using TSM.
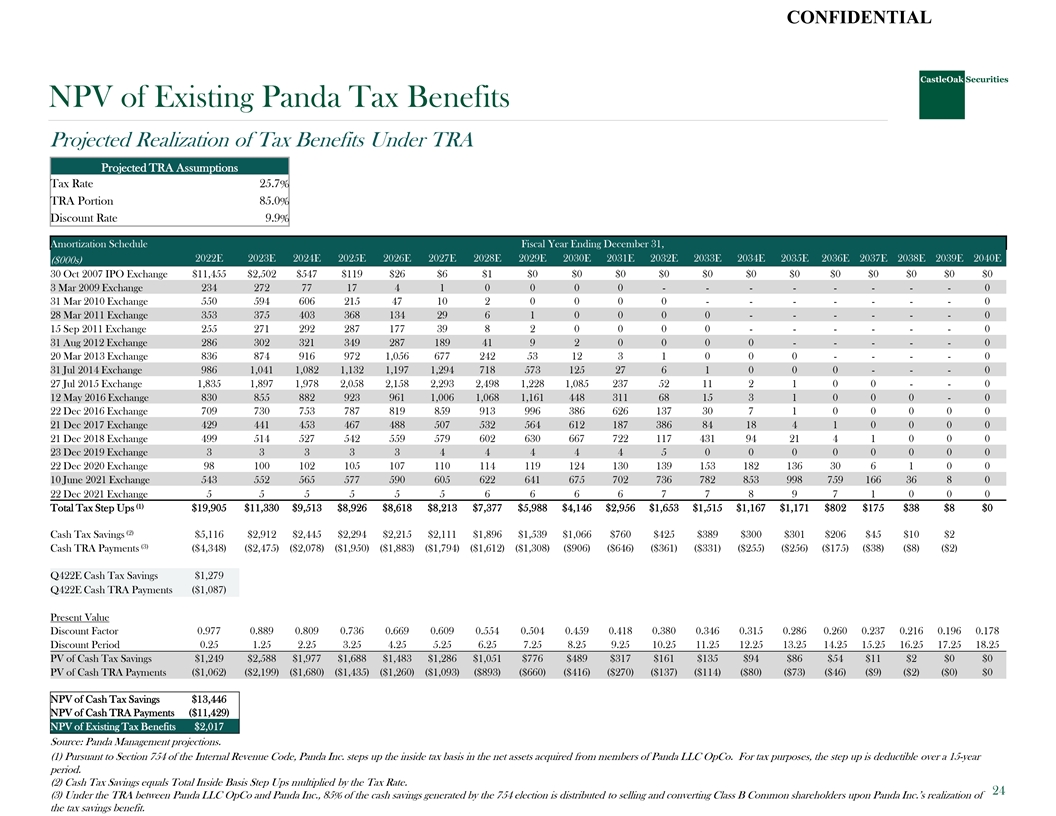
CONFIDENTIAL NPV of Existing Panda Tax Benefits Projected Realization of Tax Benefits Under TRA Projected TRA Assumptions Tax Rate 25.7% TRA Portion 85.0% Discount Rate 9.9% Amortization Schedule Fiscal Year Ending December 31, 2022E 2023E 2024E 2025E 2026E 2027E 2028E 2029E 2030E 2031E 2032E 2033E 2034E 2035E 2036E 2037E 2038E 2039E 2040E ($000s) 30 Oct 2007 IPO Exchange $11,455 $2,502 $547 $119 $26 $6 $1 $0 $0 $0 $0 $0 $0 $0 $0 $0 $0 $0 $0 3 Mar 2009 Exchange 234 272 77 17 4 1 0 0 0 0 - - - - - - - - 0 31 Mar 2010 Exchange 550 594 606 215 47 10 2 0 0 0 0 - - - - - - - 0 28 Mar 2011 Exchange 353 375 403 368 134 29 6 1 0 0 0 0 - - - - - - 0 15 Sep 2011 Exchange 255 271 292 287 177 39 8 2 0 0 0 0 - - - - - - 0 31 Aug 2012 Exchange 286 302 321 349 287 189 41 9 2 0 0 0 0 - - - - - 0 20 Mar 2013 Exchange 836 874 916 972 1,056 677 242 53 12 3 1 0 0 0 - - - - 0 31 Jul 2014 Exchange 986 1,041 1,082 1,132 1,197 1,294 718 573 125 27 6 1 0 0 0 - - - 0 27 Jul 2015 Exchange 1,835 1,897 1,978 2,058 2,158 2,293 2,498 1,228 1,085 237 52 11 2 1 0 0 - - 0 12 May 2016 Exchange 830 855 882 923 961 1,006 1,068 1,161 448 311 68 15 3 1 0 0 0 - 0 22 Dec 2016 Exchange 709 730 753 787 819 859 913 996 386 626 137 30 7 1 0 0 0 0 0 21 Dec 2017 Exchange 429 441 453 467 488 507 532 564 612 187 386 84 18 4 1 0 0 0 0 21 Dec 2018 Exchange 499 514 527 542 559 579 602 630 667 722 117 431 94 21 4 1 0 0 0 23 Dec 2019 Exchange 3 3 3 3 3 4 4 4 4 4 5 0 0 0 0 0 0 0 0 22 Dec 2020 Exchange 98 100 102 105 107 110 114 119 124 130 139 153 182 136 30 6 1 0 0 10 June 2021 Exchange 543 552 565 577 590 605 622 641 675 702 736 782 853 998 759 166 36 8 0 22 Dec 2021 Exchange 5 5 5 5 5 5 6 6 6 6 7 7 8 9 7 1 0 0 0 (1) Total Tax Step Ups $19,905 $11,330 $9,513 $8,926 $8,618 $8,213 $7,377 $5,988 $4,146 $2,956 $1,653 $1,515 $1,167 $1,171 $802 $175 $38 $8 $0 (2) Cash Tax Savings $5,116 $2,912 $2,445 $2,294 $2,215 $2,111 $1,896 $1,539 $1,066 $760 $425 $389 $300 $301 $206 $45 $10 $2 (3) Cash TRA Payments ($4,348) ($2,475) ($2,078) ($1,950) ($1,883) ($1,794) ($1,612) ($1,308) ($906) ($646) ($361) ($331) ($255) ($256) ($175) ($38) ($8) ($2) Q422E Cash Tax Savings $1,279 Q422E Cash TRA Payments ($1,087) Present Value Discount Factor 0.977 0.889 0.809 0.736 0.669 0.609 0.554 0.504 0.459 0.418 0.380 0.346 0.315 0.286 0.260 0.237 0.216 0.196 0.178 Discount Period 0.25 1.25 2.25 3.25 4.25 5.25 6.25 7.25 8.25 9.25 10.25 11.25 12.25 13.25 14.25 15.25 16.25 17.25 18.25 PV of Cash Tax Savings $1,249 $2,588 $1,977 $1,688 $1,483 $1,286 $1,051 $776 $489 $317 $161 $135 $94 $86 $54 $11 $2 $0 $0 PV of Cash TRA Payments ($1,062) ($2,199) ($1,680) ($1,435) ($1,260) ($1,093) ($893) ($660) ($416) ($270) ($137) ($114) ($80) ($73) ($46) ($9) ($2) ($0) $0 NPV of Cash Tax Savings $13,446 NPV of Cash TRA Payments ($11,429) NPV of Existing Tax Benefits $2,017 Source: Panda Management projections. (1) Pursuant to Section 754 of the Internal Revenue Code, Panda Inc. steps up the inside tax basis in the net assets acquired from members of Panda LLC OpCo. For tax purposes, the step up is deductible over a 15-year period. (2) Cash Tax Savings equals Total Inside Basis Step Ups multiplied by the Tax Rate. 24 (3) Under the TRA between Panda LLC OpCo and Panda Inc., 85% of the cash savings generated by the 754 election is distributed to selling and converting Class B Common shareholders upon Panda Inc.’s realization of the tax savings benefit.
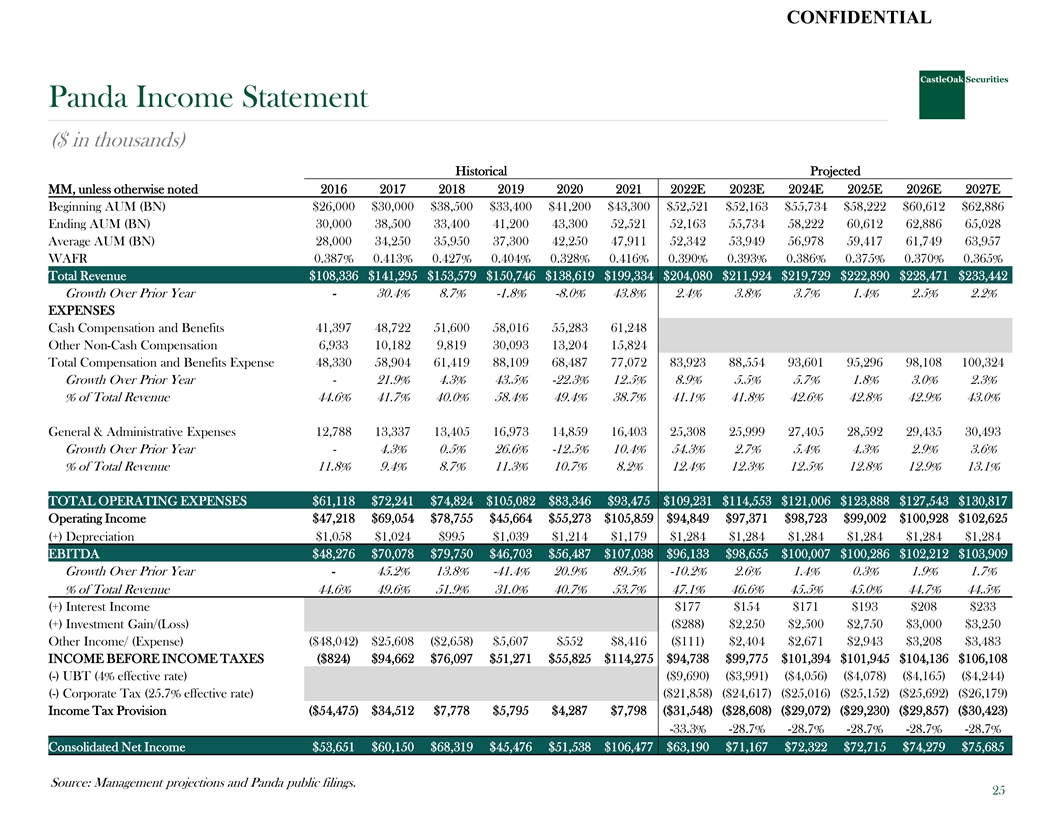
CONFIDENTIAL Panda Income Statement ($ in thousands) Historical Projected MM, unless otherwise noted 2016 2017 2018 2019 2020 2021 2022E 2023E 2024E 2025E 2026E 2027E Beginning AUM (BN) $26,000 $30,000 $38,500 $33,400 $41,200 $43,300 $52,521 $52,163 $55,734 $58,222 $60,612 $62,886 Ending AUM (BN) 30,000 38,500 33,400 41,200 43,300 52,521 52,163 55,734 58,222 60,612 62,886 65,028 Average AUM (BN) 28,000 34,250 35,950 37,300 42,250 47,911 52,342 53,949 56,978 59,417 61,749 63,957 WAFR 0.387% 0.413% 0.427% 0.404% 0.328% 0.416% 0.390% 0.393% 0.386% 0.375% 0.370% 0.365% Total Revenue $108,336 $141,295 $153,579 $150,746 $138,619 $199,334 $204,080 $211,924 $219,729 $222,890 $228,471 $233,442 Growth Over Prior Year - 30.4% 8.7% -1.8% -8.0% 43.8% 2.4% 3.8% 3.7% 1.4% 2.5% 2.2% EXPENSES Cash Compensation and Benefits 41,397 48,722 51,600 58,016 55,283 61,248 Other Non-Cash Compensation 6,933 10,182 9,819 30,093 13,204 15,824 Total Compensation and Benefits Expense 48,330 58,904 61,419 88,109 68,487 77,072 83,923 88,554 93,601 95,296 98,108 100,324 Growth Over Prior Year - 21.9% 4.3% 43.5% -22.3% 12.5% 8.9% 5.5% 5.7% 1.8% 3.0% 2.3% % of Total Revenue 44.6% 41.7% 40.0% 58.4% 49.4% 38.7% 41.1% 41.8% 42.6% 42.8% 42.9% 43.0% General & Administrative Expenses 12,788 13,337 13,405 16,973 14,859 16,403 25,308 25,999 27,405 28,592 29,435 30,493 Growth Over Prior Year - 4.3% 0.5% 26.6% -12.5% 10.4% 54.3% 2.7% 5.4% 4.3% 2.9% 3.6% % of Total Revenue 11.8% 9.4% 8.7% 11.3% 10.7% 8.2% 12.4% 12.3% 12.5% 12.8% 12.9% 13.1% TOTAL OPERATING EXPENSES $61,118 $72,241 $74,824 $105,082 $83,346 $93,475 $109,231 $114,553 $121,006 $123,888 $127,543 $130,817 Operating Income $47,218 $69,054 $78,755 $45,664 $55,273 $105,859 $94,849 $97,371 $98,723 $99,002 $100,928 $102,625 (+) Depreciation $1,058 $1,024 $995 $1,039 $1,214 $1,179 $1,284 $1,284 $1,284 $1,284 $1,284 $1,284 EBITDA $48,276 $70,078 $79,750 $46,703 $56,487 $107,038 $96,133 $98,655 $100,007 $100,286 $102,212 $103,909 Growth Over Prior Year - 45.2% 13.8% -41.4% 20.9% 89.5% -10.2% 2.6% 1.4% 0.3% 1.9% 1.7% % of Total Revenue 44.6% 49.6% 51.9% 31.0% 40.7% 53.7% 47.1% 46.6% 45.5% 45.0% 44.7% 44.5% (+) Interest Income $177 $154 $171 $193 $208 $233 (+) Investment Gain/(Loss) ($288) $2,250 $2,500 $2,750 $3,000 $3,250 Other Income/ (Expense) ($48,042) $25,608 ($2,658) $5,607 $552 $8,416 ($111) $2,404 $2,671 $2,943 $3,208 $3,483 INCOME BEFORE INCOME TAXES ($824) $94,662 $76,097 $51,271 $55,825 $114,275 $94,738 $99,775 $101,394 $101,945 $104,136 $106,108 (-) UBT (4% effective rate) ($9,690) ($3,991) ($4,056) ($4,078) ($4,165) ($4,244) (-) Corporate Tax (25.7% effective rate) ($21,858) ($24,617) ($25,016) ($25,152) ($25,692) ($26,179) Income Tax Provision ($54,475) $34,512 $7,778 $5,795 $4,287 $7,798 ($31,548) ($28,608) ($29,072) ($29,230) ($29,857) ($30,423) -33.3% -28.7% -28.7% -28.7% -28.7% -28.7% Consolidated Net Income $53,651 $60,150 $68,319 $45,476 $51,538 $106,477 $63,190 $71,167 $72,322 $72,715 $74,279 $75,685 Source: Management projections and Panda public filings. 25
CONFIDENTIAL Legal Disclaimer By accepting this presentation, the recipient agrees to be bound by the following obligations and limitations. This document is confidential and has been prepared for informational purposes only. This document is not to be construed as a recommendation, an offer to sell or a solicitation of an offer to buy any securities. Any dissemination, distribution or reproduction of this document is strictly prohibited without the consent of CastleOak Securities, L.P. The information herein is obtained from sources deemed reliable, but its accuracy and completeness cannot be guaranteed, and is subject to change without notice. Purpose. This presentation has been prepared by CastleOak Securities, L.P. (“CastleOak ) for the exclusive use of the party to whom CastleOak delivers this presentation (together with its subsidiaries and affiliates, hereinafter the Recipient ). No independent verification. The information in this presentation has been obtained from the Recipient and other publicly available sources and has not been independently verified by CastleOak or any of its employees or partners (“Representatives”). No representation or warranty. No representation, warranty, or undertaking, either express or implied, is or will be given by CastleOak or its representatives as to or in relation to the accuracy, completeness, reliability or sufficiency of the information contained in this presentation or as to the reasonableness of any assumption contained in this presentation. No liability. By accepting receipt of this presentation, the Recipient acknowledges and agrees that to the maximum extent permitted by law and except in the case of fraud, each of CastleOak and its Representatives expressly disclaims any and all liability that may arise from this presentation, or any other written or oral information provided in connection with this presentation, and any errors contained therein and/or omissions therefrom, or from relying on or any use of the contents of this presentation or otherwise in connection with this presentation. Forecasts. The valuations, projections, estimates, forecasts, targets, prospects, returns and/or opinions (including, without limitation, projections of revenue, expense, net income and stock performance) contained herein involve elements of subjective judgment and analysis. Any opinions expressed in this presentation are subject to change without notice and may differ from or be contrary to opinions expressed by other business areas or groups of CastleOak as a result of using different assumptions and criteria. This presentation may contain forward-looking statements. CastleOak gives no undertaking and is under no obligation to update these forward-looking statements for events or circumstances that occur subsequent to the date of this presentation. Nothing contained herein is, or shall be relied upon as, a promise or representation as to the past or future, or that any of the estimates or projections contained herein will be achieved. No duty to update. This presentation speaks as at the date hereof (unless an earlier date is otherwise indicated in the presentation) and in furnishing this presentation, no obligation is undertaken nor is any representation or undertaking given by CastleOak or its Representatives to provide the Recipient with additional information or to update, revise or reaffirm the information in this presentation or to correct any inaccuracies therein which may become apparent. Information or education only. This presentation has been prepared solely for informational or educational purposes and does not suggest taking or refraining from any action. It does not constitute or contain an invitation, solicitation or an offer to buy or sell any securities or related financial instruments or any assets, business, or undertakings described herein. No advice given. The Recipient should not construe the contents of this presentation as legal, tax, accounting or investment advice or a recommendation. The Recipient should consult its own counsel, tax and financial advisors as to legal and related matters concerning any transaction described herein. This presentation does not purport to be all-inclusive or to contain all of the information that the Recipient may require or request upon due diligence if it wishes to proceed further. No investment, divestment or other financial decisions or actions should be based on the information in this presentation. This presentation should not be viewed as an investment recommendation because it is provided as part of the general marketing and advertising activities of CastleOak. No distribution. This presentation has been prepared on a confidential basis solely for your use and benefit; provided that you and any of your employees, representatives, or other agents may disclose to any and all persons, without limitation of any kind, the tax treatment and tax structure of the transaction and all materials of any kind (including opinions or other tax analyses) that are provided to you relating to such tax treatment and tax structure. Distribution of this presentation to any person other than you and those persons retained to advise you, who agree to maintain the confidentiality of this material and be bound by the limitations outlined herein, is unauthorized. CastleOak specifically prohibits the redistribution or reproduction of this presentation in whole or in part without the prior written permission of CastleOak and CastleOak accepts no liability whatsoever for the actions of third parties in this respect. 26