
• | Monetization activity in Private Markets drove After-tax Distributable Earnings of $464.5 million, or $0.57 per adjusted unit eligible for distribution, for the third quarter of 2017 |
• | Book value was $11.2 billion as of September 30, 2017 or $13.80 per outstanding adjusted unit |
• | As of September 30, 2017, Assets Under Management (“AUM”) and Fee Paying Assets Under Management (“FPAUM”) were $153 billion and $114 billion, respectively, up 17% and 22%, respectively, compared to September 30, 2016. New fee paying capital raised exceeded $37 billion over the past 12 months on an organic basis |
• | In the quarter, KKR closed on two strategic investor partnerships, which includes total commitments of $7 billion, a portion of which was included in our AUM and FPAUM as of June 30, 2017. Both strategic investor partnerships include recycling provisions and have expected lives greater than 20 years |
• | KKR's regular distribution per common unit of $0.17 was declared for the quarter ended September 30, 2017 |
KKR | ||||||||||||||||
CONDENSED CONSOLIDATED STATEMENTS OF OPERATIONS (GAAP BASIS - UNAUDITED) | ||||||||||||||||
(Amounts in thousands, except common unit and per common unit amounts) | ||||||||||||||||
Quarter Ended | Nine Months Ended | |||||||||||||||
September 30, 2017 | September 30, 2016 | September 30, 2017 | September 30, 2016 | |||||||||||||
Revenues | ||||||||||||||||
Fees and Other | $ | 692,877 | $ | 687,056 | $ | 2,340,617 | $ | 1,426,618 | ||||||||
Expenses | ||||||||||||||||
Compensation and Benefits | 368,513 | 358,161 | 1,234,317 | 780,062 | ||||||||||||
Occupancy and Related Charges | 15,267 | 16,405 | 44,150 | 49,159 | ||||||||||||
General, Administrative and Other | 146,467 | 136,551 | 421,522 | 413,437 | ||||||||||||
Total Expenses | 530,247 | 511,117 | 1,699,989 | 1,242,658 | ||||||||||||
Investment Income (Loss) | ||||||||||||||||
Net Gains (Losses) from Investment Activities | 108,779 | 735,144 | 1,085,655 | 9,089 | ||||||||||||
Dividend Income | 20,774 | 73,105 | 100,144 | 167,987 | ||||||||||||
Interest Income | 317,134 | 256,505 | 893,832 | 753,194 | ||||||||||||
Interest Expense | (211,959 | ) | (255,105 | ) | (597,403 | ) | (607,812 | ) | ||||||||
Total Investment Income (Loss) | 234,728 | 809,649 | 1,482,228 | 322,458 | ||||||||||||
Income (Loss) Before Taxes | 397,358 | 985,588 | 2,122,856 | 506,418 | ||||||||||||
Income Tax (Benefit) | 18,420 | 10,826 | 77,500 | 18,761 | ||||||||||||
Net Income (Loss) | 378,938 | 974,762 | 2,045,356 | 487,657 | ||||||||||||
Net Income (Loss) Attributable to | ||||||||||||||||
Redeemable Noncontrolling Interests | 20,876 | 3,121 | 64,196 | 4,616 | ||||||||||||
Net Income (Loss) Attributable to | ||||||||||||||||
Noncontrolling Interests | 196,158 | 611,288 | 1,137,585 | 353,044 | ||||||||||||
Net Income (Loss) Attributable to KKR & Co. L.P. | 161,904 | 360,353 | 843,575 | 129,997 | ||||||||||||
Net Income (Loss) Attributable to Series A Preferred Unitholders | 5,822 | 5,822 | 17,466 | 11,515 | ||||||||||||
Net Income (Loss) Attributable to Series B Preferred Unitholders | 2,519 | 2,379 | 7,557 | 2,379 | ||||||||||||
Net Income (Loss) Attributable to KKR & Co. L.P. Common Unitholders | $ | 153,563 | $ | 352,152 | $ | 818,552 | $ | 116,103 | ||||||||
Net Income (Loss) Attributable to KKR & Co. L.P. Per Common Unit | ||||||||||||||||
Basic | $ | 0.33 | $ | 0.79 | $ | 1.76 | $ | 0.26 | ||||||||
Diluted (1) | $ | 0.30 | $ | 0.73 | $ | 1.63 | $ | 0.24 | ||||||||
Weighted Average Common Units Outstanding | ||||||||||||||||
Basic | 471,758,886 | 445,989,300 | 463,941,084 | 448,149,747 | ||||||||||||
Diluted (1) | 506,873,177 | 479,975,675 | 501,615,635 | 483,134,985 | ||||||||||||
KKR | ||||||||
CONDENSED CONSOLIDATED STATEMENTS OF FINANCIAL CONDITION (GAAP BASIS - UNAUDITED) | ||||||||
(Amounts in thousands, except per common unit amounts) | ||||||||
As of | ||||||||
September 30, 2017 | December 31, 2016 | |||||||
Assets | ||||||||
Cash and Cash Equivalents | $ | 2,436,566 | $ | 2,508,902 | ||||
Investments | 37,251,837 | 31,409,765 | ||||||
Other Assets | 4,617,236 | 5,084,230 | ||||||
Total Assets | 44,305,639 | 39,002,897 | ||||||
Liabilities and Equity | ||||||||
Debt Obligations | 20,290,714 | 18,544,075 | ||||||
Other Liabilities | 4,149,491 | 3,340,739 | ||||||
Total Liabilities | 24,440,205 | 21,884,814 | ||||||
Redeemable Noncontrolling Interests | 570,134 | 632,348 | ||||||
Equity | ||||||||
Series A Preferred Units | 332,988 | 332,988 | ||||||
Series B Preferred Units | 149,566 | 149,566 | ||||||
KKR & Co. L.P. Capital - Common Unitholders | 6,380,654 | 5,457,279 | ||||||
Noncontrolling Interests | 12,432,092 | 10,545,902 | ||||||
Total Equity | 19,295,300 | 16,485,735 | ||||||
Total Liabilities and Equity | $ | 44,305,639 | $ | 39,002,897 | ||||
KKR & Co. L.P. Capital Per Outstanding Common Unit - Basic | $ | 13.49 | $ | 12.06 | ||||
KKR | ||||||||||||||||||||
STATEMENTS OF OPERATIONS AND OTHER SELECTED FINANCIAL INFORMATION | ||||||||||||||||||||
TOTAL REPORTABLE SEGMENTS (UNAUDITED) | ||||||||||||||||||||
(Amounts in thousands, except unit and per unit amounts) | ||||||||||||||||||||
Quarter Ended | Nine Months Ended | |||||||||||||||||||
September 30, 2017 | June 30, 2017 | September 30, 2016 | September 30, 2017 | September 30, 2016 | ||||||||||||||||
Segment Revenues | ||||||||||||||||||||
Management, Monitoring and Transaction Fees, Net | ||||||||||||||||||||
Management Fees | $ | 232,954 | $ | 229,569 | $ | 201,508 | $ | 670,807 | $ | 599,725 | ||||||||||
Monitoring Fees | 14,342 | 30,510 | 11,091 | 58,072 | 52,126 | |||||||||||||||
Transaction Fees | 179,167 | 156,465 | 111,354 | 578,667 | 276,003 | |||||||||||||||
Fee Credits | (70,747 | ) | (51,384 | ) | (47,392 | ) | (211,148 | ) | (109,272 | ) | ||||||||||
Total Management, Monitoring and Transaction Fees, Net | 355,716 | 365,160 | 276,561 | 1,096,398 | 818,582 | |||||||||||||||
Performance Income (Loss) | ||||||||||||||||||||
Realized Incentive Fees | 4,074 | 2,624 | 3,659 | 8,384 | 9,897 | |||||||||||||||
Realized Carried Interest | 419,438 | 264,668 | 350,469 | 890,310 | 753,032 | |||||||||||||||
Unrealized Carried Interest | (59,638 | ) | 296,719 | 70,351 | 377,707 | (134,756 | ) | |||||||||||||
Total Performance Income (Loss) | 363,874 | 564,011 | 424,479 | 1,276,401 | 628,173 | |||||||||||||||
Investment Income (Loss) | ||||||||||||||||||||
Net Realized Gains (Losses) | 76,053 | 7,180 | 170,078 | 162,684 | 370,594 | |||||||||||||||
Net Unrealized Gains (Losses) | (50,902 | ) | 307,977 | 136,740 | 461,111 | (725,699 | ) | |||||||||||||
Total Realized and Unrealized | 25,151 | 315,157 | 306,818 | 623,795 | (355,105 | ) | ||||||||||||||
Interest Income and Dividends | 70,557 | 67,836 | 71,185 | 195,275 | 253,756 | |||||||||||||||
Interest Expense | (45,613 | ) | (47,026 | ) | (47,506 | ) | (134,348 | ) | (144,497 | ) | ||||||||||
Net Interest and Dividends | 24,944 | 20,810 | 23,679 | 60,927 | 109,259 | |||||||||||||||
Total Investment Income (Loss) | 50,095 | 335,967 | 330,497 | 684,722 | (245,846 | ) | ||||||||||||||
Total Segment Revenues | 769,685 | 1,265,138 | 1,031,537 | 3,057,521 | 1,200,909 | |||||||||||||||
Segment Expenses | ||||||||||||||||||||
Compensation and Benefits | ||||||||||||||||||||
Cash Compensation and Benefits | 130,621 | 135,522 | 101,967 | 405,578 | 299,756 | |||||||||||||||
Realized Performance Income Compensation | 177,705 | 111,917 | 159,151 | 377,689 | 322,671 | |||||||||||||||
Unrealized Performance Income Compensation | (19,826 | ) | 119,774 | 29,393 | 157,162 | (48,724 | ) | |||||||||||||
Total Compensation and Benefits | 288,500 | 367,213 | 290,511 | 940,429 | 573,703 | |||||||||||||||
Occupancy and Related Charges | 14,672 | 13,407 | 15,877 | 42,448 | 47,486 | |||||||||||||||
Other Operating Expenses | 70,517 | 53,069 | 55,123 | 177,084 | 166,542 | |||||||||||||||
Total Segment Expenses | 373,689 | 433,689 | 361,511 | 1,159,961 | 787,731 | |||||||||||||||
Income (Loss) attributable to noncontrolling interests | 1,046 | 1,180 | 760 | 3,810 | 2,002 | |||||||||||||||
Economic Net Income (Loss) | 394,950 | 830,269 | 669,266 | 1,893,750 | 411,176 | |||||||||||||||
Equity-based Compensation | 54,921 | 44,976 | 50,270 | 149,840 | 148,257 | |||||||||||||||
Pre-tax Economic Net Income (Loss) | 340,029 | 785,293 | 618,996 | 1,743,910 | 262,919 | |||||||||||||||
Provision for Income Tax (Benefit) | 23,317 | 24,408 | 12,611 | 108,050 | 12,617 | |||||||||||||||
Preferred Distributions | 8,341 | 8,341 | 8,201 | 25,023 | 13,894 | |||||||||||||||
After-tax Economic Net Income (Loss) | $ | 308,371 | $ | 752,544 | $ | 598,184 | $ | 1,610,837 | $ | 236,408 | ||||||||||
After-tax Economic Net Income (Loss) Per Adjusted Unit | $ | 0.36 | $ | 0.89 | $ | 0.71 | $ | 1.90 | $ | 0.28 | ||||||||||
Weighted Average Adjusted Units (Fully Diluted Basis) | 848,087,704 | 847,650,747 | 837,504,674 | 848,332,124 | 841,988,454 | |||||||||||||||
Other Operating Measures: | ||||||||||||||||||||
Fee Related Earnings (1) | $ | 191,880 | $ | 214,357 | $ | 142,253 | $ | 628,226 | $ | 421,012 | ||||||||||
After-tax Distributable Earnings (2) | $ | 464,454 | $ | 321,922 | $ | 461,498 | $ | 1,132,843 | $ | 1,137,822 | ||||||||||
Assets Under Management | $ | 153,339,500 | $ | 148,483,000 | $ | 131,101,800 | $ | 153,339,500 | $ | 131,101,800 | ||||||||||
Fee Paying Assets Under Management | $ | 113,723,000 | $ | 112,646,200 | $ | 93,153,800 | $ | 113,723,000 | $ | 93,153,800 | ||||||||||
Capital Invested and Syndicated Capital | $ | 5,144,800 | $ | 5,369,400 | $ | 4,392,000 | $ | 17,073,300 | $ | 9,738,200 | ||||||||||
Uncalled Commitments | $ | 47,250,500 | $ | 42,551,600 | $ | 38,267,300 | $ | 47,250,500 | $ | 38,267,300 | ||||||||||
KKR | ||||||||||||||||||||
CALCULATION OF DISTRIBUTABLE SEGMENT REVENUES (UNAUDITED) (1) | ||||||||||||||||||||
(Amounts in thousands) | ||||||||||||||||||||
Quarter Ended | Nine Months Ended | |||||||||||||||||||
September 30, 2017 | June 30, 2017 | September 30, 2016 | September 30, 2017 | September 30, 2016 | ||||||||||||||||
Distributable Segment Revenues | ||||||||||||||||||||
Fees and Other, Net | ||||||||||||||||||||
Management Fees | $ | 232,954 | $ | 229,569 | $ | 201,508 | $ | 670,807 | $ | 599,725 | ||||||||||
Monitoring Fees | 14,342 | 30,510 | 11,091 | 58,072 | 52,126 | |||||||||||||||
Transaction Fees | 179,167 | 156,465 | 111,354 | 578,667 | 276,003 | |||||||||||||||
Fee Credits | (70,747 | ) | (51,384 | ) | (47,392 | ) | (211,148 | ) | (109,272 | ) | ||||||||||
Total Fees and Other, Net | 355,716 | 365,160 | 276,561 | 1,096,398 | 818,582 | |||||||||||||||
Realized Performance Income (Loss) | ||||||||||||||||||||
Incentive Fees | 4,074 | 2,624 | 3,659 | 8,384 | 9,897 | |||||||||||||||
Carried Interest | 419,438 | 264,668 | 350,469 | 890,310 | 753,032 | |||||||||||||||
Total Realized Performance Income (Loss) | 423,512 | 267,292 | 354,128 | 898,694 | 762,929 | |||||||||||||||
Realized Investment Income (Loss) | ||||||||||||||||||||
Net Realized Gains (Losses) | 76,053 | 7,180 | 170,078 | 162,684 | 370,594 | |||||||||||||||
Interest Income and Dividends | 70,557 | 67,836 | 71,185 | 195,275 | 253,756 | |||||||||||||||
Interest Expense | (45,613 | ) | (47,026 | ) | (47,506 | ) | (134,348 | ) | (144,497 | ) | ||||||||||
Total Realized Investment Income (Loss) | 100,997 | 27,990 | 193,757 | 223,611 | 479,853 | |||||||||||||||
Total Distributable Segment Revenues | $ | 880,225 | $ | 660,442 | $ | 824,446 | $ | 2,218,703 | $ | 2,061,364 | ||||||||||
CALCULATION OF DISTRIBUTABLE SEGMENT EXPENSES (UNAUDITED) (1) | ||||||||||||||||||||
(Amounts in thousands) | ||||||||||||||||||||
Quarter Ended | Nine Months Ended | |||||||||||||||||||
September 30, 2017 | June 30, 2017 | September 30, 2016 | September 30, 2017 | September 30, 2016 | ||||||||||||||||
Distributable Segment Expenses | ||||||||||||||||||||
Compensation and Benefits | ||||||||||||||||||||
Cash Compensation and Benefits | 130,621 | 135,522 | 101,967 | 405,578 | 299,756 | |||||||||||||||
Performance Income Compensation | 177,705 | 111,917 | 159,151 | 377,689 | 322,671 | |||||||||||||||
Total Compensation and Benefits | 308,326 | 247,439 | 261,118 | 783,267 | 622,427 | |||||||||||||||
Occupancy and Related Charges | 14,672 | 13,407 | 15,877 | 42,448 | 47,486 | |||||||||||||||
Other Operating Expenses | 70,517 | 53,069 | 55,123 | 177,084 | 166,542 | |||||||||||||||
Total Distributable Segment Expenses | $ | 393,515 | $ | 313,915 | $ | 332,118 | $ | 1,002,799 | $ | 836,455 | ||||||||||
CALCULATION OF AFTER-TAX DISTRIBUTABLE EARNINGS (UNAUDITED) (1) | ||||||||||||||||||||
(Amounts in thousands, except per unit amounts) | ||||||||||||||||||||
Quarter Ended | Nine Months Ended | |||||||||||||||||||
September 30, 2017 | June 30, 2017 | September 30, 2016 | September 30, 2017 | September 30, 2016 | ||||||||||||||||
After-tax Distributable Earnings | ||||||||||||||||||||
Distributable Segment Revenues | 880,225 | 660,442 | 824,446 | 2,218,703 | 2,061,364 | |||||||||||||||
Distributable Segment Expenses | 393,515 | 313,915 | 332,118 | 1,002,799 | 836,455 | |||||||||||||||
Income (Loss) Attributable to Noncontrolling Interests | 1,046 | 1,180 | 760 | 3,810 | 2,002 | |||||||||||||||
Income Taxes Paid | 12,869 | 15,084 | 21,869 | 54,228 | 71,191 | |||||||||||||||
Preferred Distributions | 8,341 | 8,341 | 8,201 | 25,023 | 13,894 | |||||||||||||||
After-tax Distributable Earnings | $ | 464,454 | $ | 321,922 | $ | 461,498 | $ | 1,132,843 | $ | 1,137,822 | ||||||||||
Per Adjusted Unit Eligible for Distribution | $ | 0.57 | $ | 0.39 | $ | 0.57 | $ | 1.39 | $ | 1.41 | ||||||||||
KKR | ||||||||||||||||||||
SCHEDULE OF SEGMENT REVENUES AND OTHER SELECTED FINANCIAL INFORMATION (UNAUDITED) | ||||||||||||||||||||
(Amounts in thousands) | ||||||||||||||||||||
PRIVATE MARKETS | ||||||||||||||||||||
Quarter Ended | Nine Months Ended | |||||||||||||||||||
September 30, 2017 | June 30, 2017 | September 30, 2016 | September 30, 2017 | September 30, 2016 | ||||||||||||||||
Segment Revenues | ||||||||||||||||||||
Management, Monitoring and Transaction Fees, Net | ||||||||||||||||||||
Management Fees | $ | 153,841 | $ | 142,253 | $ | 117,795 | $ | 419,606 | $ | 354,376 | ||||||||||
Monitoring Fees | 14,342 | 30,510 | 11,091 | 58,072 | 52,126 | |||||||||||||||
Transaction Fees | 82,258 | 37,252 | 53,223 | 237,392 | 114,021 | |||||||||||||||
Fee Credits | (59,854 | ) | (31,750 | ) | (37,127 | ) | (177,254 | ) | (93,042 | ) | ||||||||||
Total Management, Monitoring and Transaction Fees, Net | 190,587 | 178,265 | 144,982 | 537,816 | 427,481 | |||||||||||||||
Performance Income (Loss) | ||||||||||||||||||||
Realized Incentive Fees | — | — | — | — | — | |||||||||||||||
Realized Carried Interest | 419,438 | 264,668 | 350,469 | 890,310 | 749,194 | |||||||||||||||
Unrealized Carried Interest | (96,571 | ) | 279,010 | 53,339 | 305,945 | (131,386 | ) | |||||||||||||
Total Performance Income (Loss) | 322,867 | 543,678 | 403,808 | 1,196,255 | 617,808 | |||||||||||||||
Investment Income (Loss) | ||||||||||||||||||||
Net Realized Gains (Losses) | — | — | — | — | — | |||||||||||||||
Net Unrealized Gains (Losses) | — | — | — | — | — | |||||||||||||||
Total Realized and Unrealized | — | — | — | — | — | |||||||||||||||
Interest Income and Dividends | — | — | — | — | — | |||||||||||||||
Interest Expense | — | — | — | — | — | |||||||||||||||
Net Interest and Dividends | — | — | — | — | — | |||||||||||||||
Total Investment Income (Loss) | — | — | — | — | — | |||||||||||||||
Total Segment Revenues | $ | 513,454 | $ | 721,943 | $ | 548,790 | $ | 1,734,071 | $ | 1,045,289 | ||||||||||
Assets Under Management | $ | 87,609,800 | $ | 84,984,000 | $ | 75,181,600 | $ | 87,609,800 | $ | 75,181,600 | ||||||||||
Fee Paying Assets Under Management | $ | 61,706,500 | $ | 62,008,900 | $ | 44,010,300 | $ | 61,706,500 | $ | 44,010,300 | ||||||||||
Capital Invested | $ | 2,972,300 | $ | 3,623,300 | $ | 2,370,600 | $ | 11,079,800 | $ | 5,475,300 | ||||||||||
Uncalled Commitments | $ | 39,421,900 | $ | 35,792,900 | $ | 31,839,100 | $ | 39,421,900 | $ | 31,839,100 | ||||||||||
PUBLIC MARKETS | ||||||||||||||||||||
Quarter Ended | Nine Months Ended | |||||||||||||||||||
September 30, 2017 | June 30, 2017 | September 30, 2016 | September 30, 2017 | September 30, 2016 | ||||||||||||||||
Segment Revenues | ||||||||||||||||||||
Management, Monitoring and Transaction Fees, Net | ||||||||||||||||||||
Management Fees (1) | $ | 79,113 | $ | 87,316 | $ | 83,713 | $ | 251,201 | $ | 245,349 | ||||||||||
Monitoring Fees | — | — | — | — | — | |||||||||||||||
Transaction Fees | 11,469 | 25,515 | 10,748 | 41,040 | 17,768 | |||||||||||||||
Fee Credits | (10,893 | ) | (19,634 | ) | (10,265 | ) | (33,894 | ) | (16,230 | ) | ||||||||||
Total Management, Monitoring and Transaction Fees, Net | 79,689 | 93,197 | 84,196 | 258,347 | 246,887 | |||||||||||||||
Performance Income (Loss) | ||||||||||||||||||||
Realized Incentive Fees | 4,074 | 2,624 | 3,659 | 8,384 | 9,897 | |||||||||||||||
Realized Carried Interest | — | — | — | — | 3,838 | |||||||||||||||
Unrealized Carried Interest | 36,933 | 17,709 | 17,012 | 71,762 | (3,370 | ) | ||||||||||||||
Total Performance Income (Loss) | 41,007 | 20,333 | 20,671 | 80,146 | 10,365 | |||||||||||||||
Investment Income (Loss) | ||||||||||||||||||||
Net Realized Gains (Losses) | — | — | — | — | — | |||||||||||||||
Net Unrealized Gains (Losses) | — | — | — | — | — | |||||||||||||||
Total Realized and Unrealized | — | — | — | — | — | |||||||||||||||
Interest Income and Dividends | — | — | — | — | — | |||||||||||||||
Interest Expense | — | — | — | — | — | |||||||||||||||
Net Interest and Dividends | — | — | — | — | — | |||||||||||||||
Total Investment Income (Loss) | — | — | — | — | — | |||||||||||||||
Total Segment Revenues | $ | 120,696 | $ | 113,530 | $ | 104,867 | $ | 338,493 | $ | 257,252 | ||||||||||
Assets Under Management | $ | 65,729,700 | $ | 63,499,000 | $ | 55,920,200 | $ | 65,729,700 | $ | 55,920,200 | ||||||||||
Fee Paying Assets Under Management | $ | 52,016,500 | $ | 50,637,300 | $ | 49,143,500 | $ | 52,016,500 | $ | 49,143,500 | ||||||||||
Capital Invested | $ | 1,639,200 | $ | 1,293,100 | $ | 1,484,400 | $ | 3,825,900 | $ | 3,049,400 | ||||||||||
Uncalled Commitments | $ | 7,828,600 | $ | 6,758,700 | $ | 6,428,200 | $ | 7,828,600 | $ | 6,428,200 | ||||||||||
KKR | ||||||||||||||||||||
SCHEDULE OF SEGMENT REVENUES AND OTHER SELECTED FINANCIAL INFORMATION (UNAUDITED) | ||||||||||||||||||||
(Amounts in thousands) | ||||||||||||||||||||
CAPITAL MARKETS | ||||||||||||||||||||
Quarter Ended | Nine Months Ended | |||||||||||||||||||
September 30, 2017 | June 30, 2017 | September 30, 2016 | September 30, 2017 | September 30, 2016 | ||||||||||||||||
Segment Revenues | ||||||||||||||||||||
Management, Monitoring and Transaction Fees, Net | ||||||||||||||||||||
Management Fees | $ | — | $ | — | $ | — | $ | — | $ | — | ||||||||||
Monitoring Fees | — | — | — | — | — | |||||||||||||||
Transaction Fees | 85,440 | 93,698 | 47,383 | 300,235 | 144,214 | |||||||||||||||
Fee Credits | — | — | — | — | — | |||||||||||||||
Total Management, Monitoring and Transaction Fees, Net | 85,440 | 93,698 | 47,383 | 300,235 | 144,214 | |||||||||||||||
Performance Income (Loss) | ||||||||||||||||||||
Realized Incentive Fees | — | — | — | — | — | |||||||||||||||
Realized Carried Interest | — | — | — | — | — | |||||||||||||||
Unrealized Carried Interest | — | — | — | — | — | |||||||||||||||
Total Performance Income (Loss) | — | — | — | — | — | |||||||||||||||
Investment Income (Loss) | ||||||||||||||||||||
Net Realized Gains (Losses) | — | — | — | — | — | |||||||||||||||
Net Unrealized Gains (Losses) | — | — | — | — | — | |||||||||||||||
Total Realized and Unrealized | — | — | — | — | — | |||||||||||||||
Interest Income and Dividends | — | — | — | — | — | |||||||||||||||
Interest Expense | — | — | — | — | — | |||||||||||||||
Net Interest and Dividends | — | — | — | — | — | |||||||||||||||
Total Investment Income (Loss) | — | — | — | — | — | |||||||||||||||
Total Segment Revenues | $ | 85,440 | $ | 93,698 | $ | 47,383 | $ | 300,235 | $ | 144,214 | ||||||||||
Syndicated Capital | $ | 533,300 | $ | 453,000 | $ | 537,000 | $ | 2,167,600 | $ | 1,213,500 | ||||||||||
PRINCIPAL ACTIVITIES | ||||||||||||||||||||
Quarter Ended | Nine Months Ended | |||||||||||||||||||
September 30, 2017 | June 30, 2017 | September 30, 2016 | September 30, 2017 | September 30, 2016 | ||||||||||||||||
Segment Revenues | ||||||||||||||||||||
Management, Monitoring and Transaction Fees, Net | ||||||||||||||||||||
Management Fees | $ | — | $ | — | $ | — | $ | — | $ | — | ||||||||||
Monitoring Fees | — | — | — | — | — | |||||||||||||||
Transaction Fees | — | — | — | — | — | |||||||||||||||
Fee Credits | — | — | — | — | — | |||||||||||||||
Total Management, Monitoring and Transaction Fees, Net | — | — | — | — | — | |||||||||||||||
Performance Income (Loss) | ||||||||||||||||||||
Realized Incentive Fees | — | — | — | — | — | |||||||||||||||
Realized Carried Interest | — | — | — | — | — | |||||||||||||||
Unrealized Carried Interest | — | — | — | — | — | |||||||||||||||
Total Performance Income (Loss) | — | — | — | — | — | |||||||||||||||
Investment Income (Loss) | ||||||||||||||||||||
Net Realized Gains (Losses) | 76,053 | 7,180 | 170,078 | 162,684 | 370,594 | |||||||||||||||
Net Unrealized Gains (Losses) | (50,902 | ) | 307,977 | 136,740 | 461,111 | (725,699 | ) | |||||||||||||
Total Realized and Unrealized | 25,151 | 315,157 | 306,818 | 623,795 | (355,105 | ) | ||||||||||||||
Interest Income and Dividends | 70,557 | 67,836 | 71,185 | 195,275 | 253,756 | |||||||||||||||
Interest Expense | (45,613 | ) | (47,026 | ) | (47,506 | ) | (134,348 | ) | (144,497 | ) | ||||||||||
Net Interest and Dividends | 24,944 | 20,810 | 23,679 | 60,927 | 109,259 | |||||||||||||||
Total Investment Income (Loss) | 50,095 | 335,967 | 330,497 | 684,722 | (245,846 | ) | ||||||||||||||
Total Segment Revenues | $ | 50,095 | $ | 335,967 | $ | 330,497 | $ | 684,722 | $ | (245,846 | ) | |||||||||
KKR | ||||||||||||
BALANCE SHEET | ||||||||||||
TOTAL REPORTABLE SEGMENTS (UNAUDITED) | ||||||||||||
(Amounts in thousands, except per unit amounts) | ||||||||||||
As of | ||||||||||||
September 30, 2017 | December 31, 2016 | |||||||||||
Cash and Short-term Investments | $ | 3,623,773 | $ | 3,387,673 | ||||||||
Investments | 8,123,514 | (1) | 6,958,873 | |||||||||
Unrealized Carry | 1,474,693 | (2) | 1,213,692 | (2) | ||||||||
Other Assets | 1,964,794 | 1,611,678 | ||||||||||
Corporate Real Estate | 161,225 | 161,225 | ||||||||||
Total Assets | $ | 15,347,999 | $ | 13,333,141 | ||||||||
Debt Obligations - KKR (ex-KFN) | $ | 2,000,000 | $ | 2,000,000 | ||||||||
Debt Obligations - KFN | 639,767 | 398,560 | ||||||||||
Preferred Shares - KFN | 373,750 | 373,750 | ||||||||||
Other Liabilities | 596,079 | 244,676 | ||||||||||
Total Liabilities | 3,609,596 | 3,016,986 | ||||||||||
Noncontrolling Interests | 20,849 | 19,564 | ||||||||||
Preferred Units | 500,000 | 500,000 | ||||||||||
Book Value | $ | 11,217,554 | $ | 9,796,591 | ||||||||
Book Value Per Outstanding Adjusted Unit (3) | $ | 13.80 | $ | 12.15 | ||||||||
Last Twelve Months Ended | ||||||||||||
September 30, 2017 | December 31, 2016 | |||||||||||
Return on Equity (After-tax Economic Net Income (Loss) ) (4) | 19% | 6% | ||||||||||
Return on Equity (After-tax Distributable Earnings) (5) | 15% | 16% | ||||||||||
As of | ||||||||||||
September 30, 2017 | December 31, 2016 | |||||||||||
Private Markets | $ | 1,347,729 | $ | 1,141,610 | ||||||||
Public Markets | 126,964 | 72,082 | ||||||||||
Total | $ | 1,474,693 | $ | 1,213,692 | ||||||||
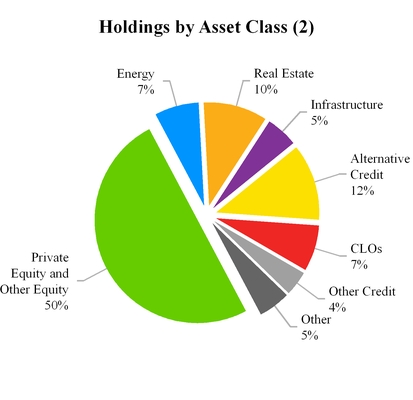
KKR |
SCHEDULE OF INVESTMENTS (1) |
TOTAL REPORTABLE SEGMENTS (UNAUDITED) |
(Amounts in thousands, except percentage amounts) |
As of September 30, 2017 | ||||
Investments | Carrying Value | |||
Private Equity Co-Investments and Other Equity | $ | 2,697,619 | ||
Private Equity Funds | 1,348,599 | |||
Private Equity Total | 4,046,218 | |||
Energy | 549,607 | |||
Real Estate | 795,042 | |||
Infrastructure | 370,318 | |||
Real Assets Total | 1,714,967 | |||
Special Situations | 820,148 | |||
Direct Lending | 97,111 | |||
Mezzanine | 39,052 | |||
Alternative Credit Total | 956,311 | |||
CLOs | 578,587 | |||
Liquid Credit | 152,699 | |||
Specialty Finance | 209,755 | |||
Credit Total | 1,897,352 | |||
Other | 464,977 | |||
Total Investments | $ | 8,123,514 | ||
As of September 30, 2017 | |||||||
Significant Investments: (3) | Carrying Value | Carrying Value as a Percentage of Total Investments | |||||
First Data Corporation | $ | 1,279,098 | 15.7 | % | |||
USI, Inc. | 503,711 | 6.2 | % | ||||
KKR Real Estate Finance Trust Inc. | 325,000 | 4.0 | % | ||||
PortAventura Entertainment S.A. | 255,821 | 3.1 | % | ||||
Natural Gas Midstream Investment | 209,728 | 2.6 | % | ||||
Total Significant Investments | 2,573,358 | 31.6 | % | ||||
Other Investments | 5,550,156 | 68.4 | % | ||||
Total Investments | $ | 8,123,514 | 100.0 | % | |||
KKR | ||||||||||||
ASSETS UNDER MANAGEMENT (UNAUDITED) | ||||||||||||
(Amounts in thousands) | ||||||||||||
Private Markets Segment | Public Markets Segment | Total Reportable Segments | ||||||||||
Quarter Ended September 30, 2017 | ||||||||||||
June 30, 2017 | $ | 84,984,000 | $ | 63,499,000 | $ | 148,483,000 | ||||||
New Capital Raised | 4,287,200 | 3,392,200 | 7,679,400 | |||||||||
Distributions | (3,798,300 | ) | (1,832,900 | ) | (2) | (5,631,200 | ) | |||||
Change in Value | 2,136,900 | 671,400 | 2,808,300 | |||||||||
September 30, 2017 | $ | 87,609,800 | $ | 65,729,700 | $ | 153,339,500 | ||||||
Nine Months Ended September 30, 2017 | ||||||||||||
December 31, 2016 | $ | 73,815,500 | $ | 55,740,200 | $ | 129,555,700 | ||||||
New Capital Raised | 15,367,500 | 7,608,900 | 22,976,400 | |||||||||
Impact of Other Transactions | — | 3,811,400 | (1) | 3,811,400 | ||||||||
Distributions and Other | (9,166,800 | ) | (5) | (4,545,800 | ) | (3) | (13,712,600 | ) | ||||
Change in Value | 7,593,600 | 3,115,000 | 10,708,600 | |||||||||
September 30, 2017 | $ | 87,609,800 | $ | 65,729,700 | $ | 153,339,500 | ||||||
Trailing Twelve Months Ended September 30, 2017 | ||||||||||||
September 30, 2016 | $ | 75,181,600 | $ | 55,920,200 | $ | 131,101,800 | ||||||
New Capital Raised | 17,159,200 | 10,291,500 | 27,450,700 | |||||||||
Impact of Other Transactions | — | 3,811,400 | (1) | 3,811,400 | ||||||||
Distributions and Other | (13,588,800 | ) | (5) | (7,273,600 | ) | (4) | (20,862,400 | ) | ||||
Change in Value | 8,857,800 | 2,980,200 | 11,838,000 | |||||||||
September 30, 2017 | $ | 87,609,800 | $ | 65,729,700 | $ | 153,339,500 | ||||||
KKR | ||||||||||||
FEE PAYING ASSETS UNDER MANAGEMENT (UNAUDITED) | ||||||||||||
(Amounts in thousands) | ||||||||||||
Private Markets Segment | Public Markets Segment | Total Reportable Segments | ||||||||||
Quarter Ended September 30, 2017 | ||||||||||||
June 30, 2017 | $ | 62,008,900 | $ | 50,637,300 | $ | 112,646,200 | ||||||
New Capital Raised | 1,202,900 | 2,950,000 | 4,152,900 | |||||||||
Distributions | (1,968,700 | ) | (2,311,600 | ) | (2) | (4,280,300 | ) | |||||
Change in Value | 463,400 | 740,800 | 1,204,200 | |||||||||
September 30, 2017 | $ | 61,706,500 | $ | 52,016,500 | $ | 113,723,000 | ||||||
Nine Months Ended September 30, 2017 | ||||||||||||
December 31, 2016 | $ | 52,204,800 | $ | 49,268,600 | $ | 101,473,400 | ||||||
New Capital Raised | 14,653,000 | 7,630,100 | 22,283,100 | |||||||||
Impact of Other Transactions | — | (1,600,000 | ) | (1) | (1,600,000 | ) | ||||||
Distributions | (3,719,400 | ) | (5,824,200 | ) | (3) | (9,543,600 | ) | |||||
Net Changes in Fee Base of Certain Funds (5) | (2,418,800 | ) | — | (2,418,800 | ) | |||||||
Change in Value | 986,900 | 2,542,000 | 3,528,900 | |||||||||
September 30, 2017 | $ | 61,706,500 | $ | 52,016,500 | $ | 113,723,000 | ||||||
Trailing Twelve Months Ended September 30, 2017 | ||||||||||||
September 30, 2016 | $ | 44,010,300 | $ | 49,143,500 | $ | 93,153,800 | ||||||
New Capital Raised | 26,893,500 | 10,808,300 | 37,701,800 | |||||||||
Impact of Other Transactions | — | (1,600,000 | ) | (1) | (1,600,000 | ) | ||||||
Distributions | (5,408,600 | ) | (8,688,600 | ) | (4) | (14,097,200 | ) | |||||
Net Changes in Fee Base of Certain Funds (5) | (4,619,900 | ) | — | (4,619,900 | ) | |||||||
Change in Value | 831,200 | 2,353,300 | 3,184,500 | |||||||||
September 30, 2017 | $ | 61,706,500 | $ | 52,016,500 | $ | 113,723,000 | ||||||
KKR | |||||||||||||||||||||
INVESTMENT VEHICLE SUMMARY (1) (UNAUDITED) | |||||||||||||||||||||
As of September 30, 2017 | |||||||||||||||||||||
(Amounts in millions, except percentages) | |||||||||||||||||||||
Investment Period | Amount | ||||||||||||||||||||
Start Date | End Date | Commitment | Uncalled Commitments | Percentage Committed by General Partner | Invested | Realized | Remaining Cost | Remaining Fair Value | |||||||||||||
Private Markets | |||||||||||||||||||||
Private Equity and Growth Funds | |||||||||||||||||||||
Asian Fund III (2) | 4/2017 | 4/2023 | $ | 9,000.0 | $ | 9,000.0 | 5.6% | $ | — | $ | — | $ | — | $ | — | ||||||
Americas Fund XII (2) | 1/2017 | 1/2023 | 13,500.0 | 13,500.0 | 7.2% | — | — | — | 5.6 | ||||||||||||
Health Care Strategic Growth (2) | 12/2016 | 12/2021 | 1,214.9 | 1,214.9 | 12.3% | — | — | — | — | ||||||||||||
Next Generation Technology Growth (2) | 3/2016 | 3/2021 | 658.9 | 431.3 | 22.5% | 227.6 | — | 227.6 | 325.1 | ||||||||||||
European Fund IV (2) | 12/2014 | 12/2020 | 3,537.4 | 1,507.5 | 5.6% | 2,059.6 | 29.2 | 2,038.7 | 2,629.8 | ||||||||||||
Asian Fund II (2) | 4/2013 | 4/2017 | 5,825.0 | 1,012.7 | 1.3% | 5,782.0 | 1,469.1 | 4,749.0 | 7,070.8 | ||||||||||||
North America Fund XI (2) | 9/2012 | 1/2017 | 8,718.4 | 874.2 | 2.9% | 9,268.2 | 4,344.4 | 6,743.5 | 11,525.2 | ||||||||||||
China Growth Fund | 11/2010 | 11/2016 | 1,010.0 | — | 1.0% | 1,010.0 | 565.0 | 665.3 | 801.4 | ||||||||||||
E2 Investors (Annex Fund) | 8/2009 | 11/2013 | 195.8 | — | 4.9% | 195.8 | 195.7 | 18.1 | 1.7 | ||||||||||||
European Fund III | 3/2008 | 3/2014 | 6,165.5 | 838.2 | 4.6% | 5,327.3 | 6,989.1 | 2,029.3 | 3,427.6 | ||||||||||||
Asian Fund | 7/2007 | 4/2013 | 3,983.3 | — | 2.5% | 3,945.9 | 7,681.6 | 813.8 | 917.2 | ||||||||||||
2006 Fund | 9/2006 | 9/2012 | 17,642.2 | 337.7 | 2.1% | 17,304.5 | 26,586.4 | 4,957.8 | 6,960.9 | ||||||||||||
European Fund II | 11/2005 | 10/2008 | 5,750.8 | — | 2.1% | 5,750.8 | 8,467.3 | — | 58.4 | ||||||||||||
Millennium Fund | 12/2002 | 12/2008 | 6,000.0 | — | 2.5% | 6,000.0 | 13,305.4 | 444.9 | 610.6 | ||||||||||||
Total Private Equity and Growth | 83,202.2 | 28,716.5 | 56,871.7 | 69,633.2 | 22,688.0 | 34,334.3 | |||||||||||||||
Co-Investment Vehicles and Other (2) | Various | Various | 6,674.1 | 1,830.0 | Various | 5,042.9 | 2,712.0 | 3,686.4 | 4,848.5 | ||||||||||||
Total Private Equity and Growth | 89,876.3 | 30,546.5 | 61,914.6 | 72,345.2 | 26,374.4 | 39,182.8 | |||||||||||||||
Real Assets | |||||||||||||||||||||
Energy Income and Growth Fund (2) | 9/2013 | 9/2018 | 1,974.2 | 667.7 | 12.9% | 1,336.5 | 284.1 | 1,072.6 | 1,132.7 | ||||||||||||
Natural Resources Fund | Various | Various | 887.4 | 2.8 | Various | 884.6 | 113.4 | 794.9 | 151.9 | ||||||||||||
Global Energy Opportunities (2) | Various | Various | 979.2 | 613.2 | Various | 405.5 | 59.0 | 291.0 | 315.0 | ||||||||||||
Global Infrastructure Investors (2) | 9/2011 | 10/2014 | 1,040.2 | 59.9 | 4.8% | 1,011.3 | 844.8 | 604.2 | 775.9 | ||||||||||||
Global Infrastructure Investors II (2) | 10/2014 | 10/2020 | 3,045.4 | 1,820.2 | 4.1% | 1,412.3 | 192.9 | 1,221.0 | 1,532.5 | ||||||||||||
Real Estate Partners Americas (2) | 5/2013 | 5/2017 | 1,229.1 | 363.3 | 16.3% | 993.7 | 776.0 | 562.2 | 631.9 | ||||||||||||
Real Estate Partners Americas II (2) | 5/2017 | (4) | 782.7 | 782.7 | 19.2% | — | — | — | — | ||||||||||||
Real Estate Partners Europe (2) | 9/2015 | 6/2020 | 721.2 | 594.7 | 9.2% | 132.6 | 12.0 | 125.4 | 158.1 | ||||||||||||
Real Estate Credit Opportunity Partners (2) | 2/2017 | 2/2019 | 1,090.0 | 918.0 | 4.6% | 172.0 | — | 172.0 | 184.4 | ||||||||||||
Co-Investment Vehicles and Other | Various | Various | 1,401.9 | 11.8 | Various | 1,390.1 | 511.9 | 1,387.7 | 1,799.8 | ||||||||||||
Real Assets | 13,151.3 | 5,834.3 | 7,738.6 | 2,794.1 | 6,231.0 | 6,682.2 | |||||||||||||||
Unallocated Commitments (5) | 3,041.1 | 3,041.1 | Various | — | — | — | — | ||||||||||||||
Private Markets Total | 106,068.7 | 39,421.9 | 69,653.2 | 75,139.3 | 32,605.4 | 45,865.0 | |||||||||||||||
Public Markets (3) | |||||||||||||||||||||
Special Situations Fund | 12/2012 | 1/2016 | 2,274.3 | 42.7 | 11.6% | 2,231.6 | 690.1 | 1,887.3 | 2,024.7 | ||||||||||||
Special Situations Fund II | 12/2014 | 3/2019 | 3,285.8 | 1,938.2 | 9.0% | 1,347.6 | — | 1,347.6 | 1,320.1 | ||||||||||||
Mezzanine Partners | 3/2010 | 3/2015 | 1,022.8 | 100.9 | 4.4% | 921.9 | 812.5 | 470.3 | 488.6 | ||||||||||||
Lending Partners | 12/2011 | 12/2014 | 460.2 | 54.9 | 15.2% | 405.3 | 321.0 | 264.2 | 195.7 | ||||||||||||
Lending Partners II | 6/2014 | 6/2017 | 1,335.9 | 199.2 | 3.7% | 1,136.7 | 258.9 | 1,116.2 | 1,158.6 | ||||||||||||
Lending Partners III | 4/2017 | (4) | 795.8 | 760.0 | 3.3% | 35.8 | — | 35.8 | 41.9 | ||||||||||||
Lending Partners Europe | 3/2015 | 3/2019 | 847.6 | 523.5 | 5.0% | 324.1 | 42.3 | 324.1 | 344.7 | ||||||||||||
Other Alternative Credit Vehicles | Various | Various | 6,336.0 | 2,809.2 | Various | 3,526.8 | 1,973.0 | 2,502.6 | 2,822.1 | ||||||||||||
Unallocated Commitments (5) | Various | Various | 1,400.0 | 1,400.0 | Various | — | — | — | — | ||||||||||||
Public Markets Total | 17,758.4 | 7,828.6 | 9,929.8 | 4,097.8 | 7,948.1 | 8,396.4 | |||||||||||||||
Grand Total | $ | 123,827.1 | $ | 47,250.5 | $ | 79,583.0 | $ | 79,237.1 | $ | 40,553.5 | $ | 54,261.4 | |||||||||
KKR | ||||||||||||||||||||
EXHIBIT A | ||||||||||||||||||||
OTHER FINANCIAL INFORMATION (UNAUDITED) | ||||||||||||||||||||
(Amounts in thousands) | ||||||||||||||||||||
Quarter Ended | Nine Months Ended | |||||||||||||||||||
September 30, 2017 | June 30, 2017 | September 30, 2016 | September 30, 2017 | September 30, 2016 | ||||||||||||||||
Fee Related Earnings | ||||||||||||||||||||
Management, Monitoring and Transaction Fees, Net | $ | 355,716 | $ | 365,160 | $ | 276,561 | $ | 1,096,398 | $ | 818,582 | ||||||||||
Less: Cash Compensation and Benefits | 130,621 | 135,522 | 101,967 | 405,578 | 299,756 | |||||||||||||||
Less: Occupancy and Related Charges | 14,672 | 13,407 | 15,877 | 42,448 | 47,486 | |||||||||||||||
Less: Other Operating Expenses | 70,517 | 53,069 | 55,123 | 177,084 | 166,542 | |||||||||||||||
Plus: Expenses of Principal Activities Segment | 51,974 | 51,195 | 38,659 | 156,938 | 116,214 | |||||||||||||||
Fee Related Earnings (1) | 191,880 | 214,357 | 142,253 | 628,226 | 421,012 | |||||||||||||||
Plus: Net Interest and Dividends | 24,944 | 20,810 | 23,679 | 60,927 | 109,259 | |||||||||||||||
Plus: Depreciation and Amortization | 3,709 | 3,864 | 4,121 | 11,750 | 11,967 | |||||||||||||||
Plus: Core Interest Expense | 29,587 | 30,642 | 29,006 | 89,391 | 87,499 | |||||||||||||||
Less: Expenses of Principal Activities Segment | 51,974 | 51,195 | 38,659 | 156,938 | 116,214 | |||||||||||||||
Fee and Yield Segment EBITDA (2) | 198,146 | 218,478 | 160,400 | 633,356 | 513,523 | |||||||||||||||
Plus: Realized Performance Income (Loss), net | 245,807 | 155,375 | 194,977 | 521,005 | 440,258 | |||||||||||||||
Plus: Net Realized Gains (Losses) | 76,053 | 7,180 | 170,078 | 162,684 | 370,594 | |||||||||||||||
Total Segment EBITDA (2) | $ | 520,006 | $ | 381,033 | $ | 525,455 | $ | 1,317,045 | $ | 1,324,375 | ||||||||||
Core Interest Expense | ||||||||||||||||||||
GAAP Interest Expense | $ | 211,959 | $ | 198,590 | $ | 255,105 | $ | 597,403 | $ | 607,812 | ||||||||||
Less: Interest expense related to debt obligations of consolidated investment funds, CLOs and other | 166,346 | 151,564 | 207,599 | 463,055 | 463,315 | |||||||||||||||
Segment Interest Expense | 45,613 | 47,026 | 47,506 | 134,348 | 144,497 | |||||||||||||||
Less: Interest Expense related to debt obligations from KFN and other | 16,026 | 16,384 | 18,500 | 44,957 | 56,998 | |||||||||||||||
Core Interest Expense (3) | $ | 29,587 | $ | 30,642 | $ | 29,006 | $ | 89,391 | $ | 87,499 | ||||||||||
KKR | |||
EXHIBIT B | |||
KKR'S PORTION OF TOTAL UNCALLED COMMITMENTS TO ITS INVESTMENT FUNDS (UNAUDITED) | |||
(Amounts in thousands) | |||
Uncalled Commitments | |||
Private Markets | |||
Americas Fund XII | $ | 975,000 | |
Asian Fund III | 500,000 | ||
Health Care Strategic Growth Fund | 150,000 | ||
Real Estate Partners Americas II | 150,000 | ||
Next Generation Technology Growth Fund | 97,100 | ||
Energy Income and Growth | 86,400 | ||
European Fund IV | 79,800 | ||
Global Infrastructure Investors II | 74,200 | ||
Real Estate Partners Europe | 58,300 | ||
Real Estate Credit Opportunity Partners | 45,000 | ||
Other Private Markets Vehicles | 332,500 | ||
Total Private Markets Commitments | 2,548,300 | ||
Public Markets | |||
Special Situations Fund II | 173,700 | ||
Lending Partners Europe | 26,700 | ||
Lending Partners III | 24,700 | ||
Other Public Markets Vehicles | 164,000 | ||
Total Public Markets Commitments | 389,100 | ||
Total Uncalled Commitments | $ | 2,937,400 | |
KKR | ||||||||||||
EXHIBIT C | ||||||||||||
RECONCILIATION OF NET INCOME (LOSS) ATTRIBUTABLE TO KKR & CO. L.P. PER COMMON UNIT - BASIC (GAAP BASIS) | ||||||||||||
TO AFTER TAX ENI PER ADJUSTED UNIT (UNAUDITED) | ||||||||||||
(Amounts in thousands, except common unit and per common unit amounts) | ||||||||||||
Quarter Ended | ||||||||||||
September 30, 2017 | June 30, 2017 | September 30, 2016 | ||||||||||
Net income (loss) attributable to KKR & Co. L.P. per common unit - Basic | $ | 0.33 | $ | 0.87 | $ | 0.79 | ||||||
Weighted Average Common Units Outstanding - Basic | 471,758,886 | 466,170,025 | 445,989,300 | |||||||||
Net Income (Loss) Attributable to KKR & Co. L.P. Common Unitholders | 153,563 | 405,646 | 352,152 | |||||||||
Plus: Preferred Distributions | 8,341 | 8,341 | 8,201 | |||||||||
Plus: Net income (loss) attributable to noncontrolling interests held by KKR Holdings L.P. | 115,434 | 305,280 | 284,834 | |||||||||
Plus: Non-cash equity-based charges | 78,728 | 87,940 | 61,552 | |||||||||
Plus: Amortization of intangibles, placement fees and other, net | 20,464 | 4,524 | (48,299 | ) | ||||||||
Plus: Income tax (benefit) | 18,420 | 18,538 | 10,826 | |||||||||
Economic Net Income (Loss) | 394,950 | 830,269 | 669,266 | |||||||||
Less: Equity-based compensation associated with the KKR & Co. L.P. 2010 equity incentive plan | 54,921 | 44,976 | 50,270 | |||||||||
Pre-tax Economic Net Income (Loss) | 340,029 | 785,293 | 618,996 | |||||||||
Less: Provision for income tax (benefit) | 23,317 | 24,408 | 12,611 | |||||||||
Less: Preferred Distributions | 8,341 | 8,341 | 8,201 | |||||||||
After-tax Economic Net Income (Loss) | 308,371 | 752,544 | 598,184 | |||||||||
Weighted Average Adjusted Units | 848,087,704 | 847,650,747 | 837,504,674 | |||||||||
After-tax Economic Net Income (Loss) Per Adjusted Unit | $ | 0.36 | $ | 0.89 | $ | 0.71 | ||||||
Nine Months Ended | ||||||||||||
September 30, 2017 | September 30, 2016 | |||||||||||
Net income (loss) attributable to KKR & Co. L.P. per common unit - Basic | $ | 1.76 | $ | 0.26 | ||||||||
Weighted Average Common Units Outstanding - Basic | 463,941,084 | 448,149,747 | ||||||||||
Net Income (Loss) Attributable to KKR & Co. L.P. Common Unitholders | 818,552 | 116,103 | ||||||||||
Plus: Preferred Distributions | 25,023 | 13,894 | ||||||||||
Plus: Net income (loss) attributable to noncontrolling interests held by KKR Holdings L.P. | 637,146 | 86,659 | ||||||||||
Plus: Non-cash equity-based charges | 277,704 | 186,032 | ||||||||||
Plus: Amortization of intangibles, placement fees and other, net | 57,825 | (10,273 | ) | |||||||||
Plus: Income tax (benefit) | 77,500 | 18,761 | ||||||||||
Economic Net Income (Loss) | 1,893,750 | 411,176 | ||||||||||
Less: Equity-based compensation associated with the KKR & Co. L.P. 2010 equity incentive plan | 149,840 | 148,257 | ||||||||||
Pre-tax Economic Net Income (Loss) | 1,743,910 | 262,919 | ||||||||||
Less: Provision for income tax (benefit) | 108,050 | 12,617 | ||||||||||
Less: Preferred Distributions | 25,023 | 13,894 | ||||||||||
After-tax Economic Net Income (Loss) | 1,610,837 | 236,408 | ||||||||||
Weighted Average Adjusted Units | 848,332,124 | 841,988,454 | ||||||||||
After-tax Economic Net Income (Loss) Per Adjusted Unit | $ | 1.90 | $ | 0.28 | ||||||||
KKR | ||||||||||||
EXHIBIT C (CONTINUED) | ||||||||||||
RECONCILIATION OF FEES AND OTHER (GAAP BASIS) TO TOTAL SEGMENT REVENUES AND TOTAL DISTRIBUTABLE SEGMENT REVENUES (UNAUDITED) | ||||||||||||
(Amounts in thousands) | ||||||||||||
Quarter Ended | ||||||||||||
September 30, 2017 | June 30, 2017 | September 30, 2016 | ||||||||||
Fees and Other | $ | 692,877 | $ | 931,788 | $ | 687,056 | ||||||
Plus: Management fees relating to consolidated funds and placement fees | 54,012 | 52,300 | 49,017 | |||||||||
Less: Fee credits relating to consolidated funds | 106 | 2,707 | 417 | |||||||||
Plus: Net realized and unrealized carried interest - consolidated funds | 22,341 | 10,384 | 5,956 | |||||||||
Plus: Total investment income (loss) | 50,095 | 335,967 | 330,497 | |||||||||
Less: Revenue earned by oil & gas producing entities | 12,441 | 17,382 | 16,191 | |||||||||
Less: Reimbursable expenses | 27,506 | 36,076 | 12,064 | |||||||||
Less: Other | 9,587 | 9,136 | 12,317 | |||||||||
Total Segment Revenues | $ | 769,685 | $ | 1,265,138 | $ | 1,031,537 | ||||||
Less: Unrealized Carried Interest | (59,638 | ) | 296,719 | 70,351 | ||||||||
Less: Net Unrealized Gains (Losses) | (50,902 | ) | 307,977 | 136,740 | ||||||||
Total Distributable Segment Revenues | $ | 880,225 | $ | 660,442 | $ | 824,446 | ||||||
Nine Months Ended | ||||||||||||
September 30, 2017 | September 30, 2016 | |||||||||||
Fees and Other | $ | 2,340,617 | $ | 1,426,618 | ||||||||
Plus: Management fees relating to consolidated funds and placement fees | 153,414 | 131,335 | ||||||||||
Less: Fee credits relating to consolidated funds | 3,752 | 2,766 | ||||||||||
Plus: Net realized and unrealized carried interest - consolidated funds | 43,782 | 15,581 | ||||||||||
Plus: Total investment income (loss) | 684,722 | (245,846 | ) | |||||||||
Less: Revenue earned by oil & gas producing entities | 47,096 | 47,977 | ||||||||||
Less: Reimbursable expenses | 87,131 | 46,583 | ||||||||||
Less: Other | 27,035 | 29,453 | ||||||||||
Total Segment Revenues | $ | 3,057,521 | $ | 1,200,909 | ||||||||
Less: Unrealized Carried Interest | 377,707 | (134,756 | ) | |||||||||
Less: Net Unrealized Gains (Losses) | 461,111 | (725,699 | ) | |||||||||
Total Distributable Segment Revenues | $ | 2,218,703 | $ | 2,061,364 | ||||||||
KKR | ||||||||||||
EXHIBIT C (CONTINUED) | ||||||||||||
RECONCILIATION OF TOTAL EXPENSES (GAAP BASIS) TO TOTAL SEGMENT EXPENSES AND TOTAL DISTRIBUTABLE SEGMENT EXPENSES (UNAUDITED) | ||||||||||||
(Amounts in thousands) | ||||||||||||
Quarter Ended | ||||||||||||
September 30, 2017 | June 30, 2017 | September 30, 2016 | ||||||||||
Total Expenses | $ | 530,247 | $ | 629,728 | $ | 511,117 | ||||||
Less: Equity based compensation | 72,250 | 87,940 | 61,552 | |||||||||
Less: Reimbursable expenses and placement fees | 37,508 | 58,860 | 18,255 | |||||||||
Less: Operating expenses relating to consolidated funds, CFEs and other entities | 21,858 | 21,229 | 20,141 | |||||||||
Less: Expenses incurred by oil & gas producing entities | 10,725 | 12,924 | 17,782 | |||||||||
Less: Intangible amortization | 2,473 | 5,062 | 22,112 | |||||||||
Less: Other | 11,744 | 10,024 | 9,764 | |||||||||
Total Segment Expenses | $ | 373,689 | $ | 433,689 | $ | 361,511 | ||||||
Less: Unrealized Performance Income Compensation | (19,826 | ) | 119,774 | 29,393 | ||||||||
Total Distributable Segment Expenses | $ | 393,515 | $ | 313,915 | $ | 332,118 | ||||||
Nine Months Ended | ||||||||||||
September 30, 2017 | September 30, 2016 | |||||||||||
Total Expenses | $ | 1,699,989 | $ | 1,242,658 | ||||||||
Less: Equity based compensation | 271,226 | 186,032 | ||||||||||
Less: Reimbursable expenses and placement fees | 132,491 | 72,887 | ||||||||||
Less: Operating expenses relating to consolidated funds, CFEs and other entities | 56,517 | 85,093 | ||||||||||
Less: Expenses incurred by oil & gas producing entities | 34,826 | 56,000 | ||||||||||
Less: Intangible amortization | 13,901 | 35,640 | ||||||||||
Less: Other | 31,067 | 19,275 | ||||||||||
Total Segment Expenses | $ | 1,159,961 | $ | 787,731 | ||||||||
Less: Unrealized Performance Income Compensation | 157,162 | (48,724 | ) | |||||||||
Total Distributable Segment Expenses | $ | 1,002,799 | $ | 836,455 | ||||||||
KKR | ||||||||||||
EXHIBIT C (CONTINUED) | ||||||||||||
RECONCILIATION OF NET INCOME (LOSS) ATTRIBUTABLE TO KKR & CO. L.P. COMMON UNITHOLDERS (GAAP BASIS) | ||||||||||||
TO ECONOMIC NET INCOME (LOSS), FEE RELATED EARNINGS, FEE AND YIELD SEGMENT EBITDA, AFTER TAX DISTRIBUTABLE EARNINGS AND TOTAL SEGMENT EBITDA (UNAUDITED) | ||||||||||||
(Amounts in thousands) | ||||||||||||
Quarter Ended | ||||||||||||
September 30, 2017 | June 30, 2017 | September 30, 2016 | ||||||||||
Net Income (Loss) Attributable to KKR & Co. L.P. Common Unitholders | $ | 153,563 | $ | 405,646 | $ | 352,152 | ||||||
Plus: Preferred Distributions | 8,341 | 8,341 | 8,201 | |||||||||
Plus: Net income (loss) attributable to noncontrolling interests held by KKR Holdings L.P. | 115,434 | 305,280 | 284,834 | |||||||||
Plus: Non-cash equity-based charges | 78,728 | 87,940 | 61,552 | |||||||||
Plus: Amortization of intangibles, placement fees and other, net | 20,464 | 4,524 | (48,299 | ) | ||||||||
Plus: Income tax (benefit) | 18,420 | 18,538 | 10,826 | |||||||||
Economic Net Income (Loss) | 394,950 | 830,269 | 669,266 | |||||||||
Plus: Income attributable to segment noncontrolling interests | 1,046 | 1,180 | 760 | |||||||||
Less: Total investment income (loss) | 50,095 | 335,967 | 330,497 | |||||||||
Less: Net performance income (loss) | 205,995 | 332,320 | 235,935 | |||||||||
Plus: Expenses of Principal Activities Segment | 51,974 | 51,195 | 38,659 | |||||||||
Fee Related Earnings | 191,880 | 214,357 | 142,253 | |||||||||
Plus: Net interest and dividends | 24,944 | 20,810 | 23,679 | |||||||||
Plus: Depreciation and amortization | 3,709 | 3,864 | 4,121 | |||||||||
Plus: Core interest expense | 29,587 | 30,642 | 29,006 | |||||||||
Less: Expenses of Principal Activities Segment | 51,974 | 51,195 | 38,659 | |||||||||
Fee and Yield Segment EBITDA | 198,146 | 218,478 | 160,400 | |||||||||
Less: Depreciation and amortization | 3,709 | 3,864 | 4,121 | |||||||||
Less: Core interest expense | 29,587 | 30,642 | 29,006 | |||||||||
Plus: Realized performance income (loss), net | 245,807 | 155,375 | 194,977 | |||||||||
Plus: Net realized gains (losses) | 76,053 | 7,180 | 170,078 | |||||||||
Less: Income taxes paid | 12,869 | 15,084 | 21,869 | |||||||||
Less: Preferred Distributions | 8,341 | 8,341 | 8,201 | |||||||||
Less: Income attributable to segment noncontrolling interests | 1,046 | 1,180 | 760 | |||||||||
After-tax Distributable Earnings | 464,454 | 321,922 | 461,498 | |||||||||
Plus: Depreciation and amortization | 3,709 | 3,864 | 4,121 | |||||||||
Plus: Core interest expense | 29,587 | 30,642 | 29,006 | |||||||||
Plus: Income taxes paid | 12,869 | 15,084 | 21,869 | |||||||||
Plus: Preferred Distributions | 8,341 | 8,341 | 8,201 | |||||||||
Plus: Income attributable to segment noncontrolling interests | 1,046 | 1,180 | 760 | |||||||||
Total Segment EBITDA | $ | 520,006 | $ | 381,033 | $ | 525,455 | ||||||
Nine Months Ended | ||||||||||||
September 30, 2017 | September 30, 2016 | |||||||||||
Net Income (Loss) Attributable to KKR & Co. L.P. Common Unitholders | $ | 818,552 | $ | 116,103 | ||||||||
Plus: Preferred Distributions | 25,023 | 13,894 | ||||||||||
Plus: Net income (loss) attributable to noncontrolling interests held by KKR Holdings L.P. | 637,146 | 86,659 | ||||||||||
Plus: Non-cash equity-based charges | 277,704 | 186,032 | ||||||||||
Plus: Amortization of intangibles, placement fees and other, net | 57,825 | (10,273 | ) | |||||||||
Plus: Income tax (benefit) | 77,500 | 18,761 | ||||||||||
Economic Net Income (Loss) | 1,893,750 | 411,176 | ||||||||||
Plus: Income attributable to segment noncontrolling interests | 3,810 | 2,002 | ||||||||||
Less: Total investment income (loss) | 684,722 | (245,846 | ) | |||||||||
Less: Net performance income (loss) | 741,550 | 354,226 | ||||||||||
Plus: Expenses of Principal Activities Segment | 156,938 | 116,214 | ||||||||||
Fee Related Earnings | 628,226 | 421,012 | ||||||||||
Plus: Net interest and dividends | 60,927 | 109,259 | ||||||||||
Plus: Depreciation and amortization | 11,750 | 11,967 | ||||||||||
Plus: Core interest expense | 89,391 | 87,499 | ||||||||||
Less: Expenses of Principal Activities Segment | 156,938 | 116,214 | ||||||||||
Fee and Yield Segment EBITDA | 633,356 | 513,523 | ||||||||||
Less: Depreciation and amortization | 11,750 | 11,967 | ||||||||||
Less: Core interest expense | 89,391 | 87,499 | ||||||||||
Plus: Realized performance income (loss), net | 521,005 | 440,258 | ||||||||||
Plus: Net realized gains (losses) | 162,684 | 370,594 | ||||||||||
Less: Income taxes paid | 54,228 | 71,191 | ||||||||||
Less: Preferred Distributions | 25,023 | 13,894 | ||||||||||
Less: Income attributable to segment noncontrolling interests | 3,810 | 2,002 | ||||||||||
After-tax Distributable Earnings | 1,132,843 | 1,137,822 | ||||||||||
Plus: Depreciation and amortization | 11,750 | 11,967 | ||||||||||
Plus: Core interest expense | 89,391 | 87,499 | ||||||||||
Plus: Income taxes paid | 54,228 | 71,191 | ||||||||||
Plus: Preferred Distributions | 25,023 | 13,894 | ||||||||||
Plus: Income attributable to segment noncontrolling interests | 3,810 | 2,002 | ||||||||||
Total Segment EBITDA | $ | 1,317,045 | $ | 1,324,375 | ||||||||
KKR | |||||||||||||||||||||||
EXHIBIT C (CONTINUED) | |||||||||||||||||||||||
RECONCILIATION OF CONDENSED CONSOLIDATED STATEMENTS OF FINANCIAL CONDITION (GAAP BASIS) | |||||||||||||||||||||||
TO TOTAL REPORTABLE SEGMENTS BALANCE SHEET (UNAUDITED) | |||||||||||||||||||||||
September 30, 2017 | |||||||||||||||||||||||
(Amounts in thousands) | |||||||||||||||||||||||
CONDENSED CONSOLIDATED STATEMENTS OF FINANCIAL CONDITION (GAAP BASIS) | 1 | 2 | 3 | 4 | 5 | TOTAL REPORTABLE SEGMENTS BALANCE SHEET | |||||||||||||||||
Assets | |||||||||||||||||||||||
Cash and Cash Equivalents | $ | 2,436,566 | — | — | 1,187,207 | — | — | $ | 3,623,773 | Cash and Short-term Investments | |||||||||||||
Investments | 37,251,837 | (26,522,559 | ) | (1,131,071 | ) | (1,474,693 | ) | — | — | 8,123,514 | Investments | ||||||||||||
— | — | 1,474,693 | — | — | 1,474,693 | Unrealized Carry | |||||||||||||||||
Other Assets | 4,617,236 | (1,002,082 | ) | — | (1,348,432 | ) | — | (301,928 | ) | 1,964,794 | Other Assets | ||||||||||||
— | — | 161,225 | — | — | 161,225 | Corporate Real Estate | |||||||||||||||||
Total Assets | $ | 44,305,639 | (27,524,641 | ) | (1,131,071 | ) | — | — | (301,928 | ) | $ | 15,347,999 | |||||||||||
Liabilities and Equity | |||||||||||||||||||||||
Debt Obligations | 20,290,714 | (17,650,947 | ) | — | (639,767 | ) | — | — | 2,000,000 | Debt Obligations - KKR (ex-KFN) | |||||||||||||
— | — | 639,767 | — | — | 639,767 | Debt Obligations - KFN | |||||||||||||||||
— | — | 373,750 | — | — | 373,750 | Preferred Shares - KFN | |||||||||||||||||
Other Liabilities | 4,149,491 | (2,245,511 | ) | (1,131,071 | ) | — | — | (176,830 | ) | 596,079 | Other Liabilities | ||||||||||||
Total Liabilities | 24,440,205 | (19,896,458 | ) | (1,131,071 | ) | 373,750 | — | (176,830 | ) | 3,609,596 | |||||||||||||
Redeemable Noncontrolling Interests | 570,134 | (570,134 | ) | — | — | — | — | ||||||||||||||||
Equity | |||||||||||||||||||||||
Series A Preferred Units | 332,988 | — | — | (332,988 | ) | — | — | ||||||||||||||||
Series B Preferred Units | 149,566 | — | — | (149,566 | ) | — | — | ||||||||||||||||
KKR & Co. L.P. Capital - Common Unitholders | 6,380,654 | 166,480 | — | (17,446 | ) | 4,812,964 | (125,098 | ) | 11,217,554 | Book Value | |||||||||||||
Noncontrolling Interests | 12,432,092 | (7,224,529 | ) | — | (373,750 | ) | (4,812,964 | ) | — | 20,849 | Noncontrolling Interests | ||||||||||||
— | — | 500,000 | — | — | 500,000 | Preferred Units | |||||||||||||||||
Total Liabilities and Equity | $ | 44,305,639 | (27,524,641 | ) | (1,131,071 | ) | — | — | (301,928 | ) | $ | 15,347,999 | |||||||||||
1 | IMPACT OF CONSOLIDATION OF INVESTMENT VEHICLES AND OTHER ENTITIES | ||||||||||||||||||||||
2 | CARRY POOL RECLASSIFICATION | ||||||||||||||||||||||
3 | OTHER RECLASSIFICATIONS | ||||||||||||||||||||||
4 | NONCONTROLLING INTERESTS HELD BY KKR HOLDINGS L.P. AND OTHER | ||||||||||||||||||||||
5 | EQUITY IMPACT OF KKR MANAGEMENT HOLDINGS CORP. | ||||||||||||||||||||||
KKR | |||||||||||||||||||||||
EXHIBIT C (CONTINUED) | |||||||||||||||||||||||
RECONCILIATION OF CONDENSED CONSOLIDATED STATEMENTS OF FINANCIAL CONDITION (GAAP BASIS) | |||||||||||||||||||||||
TO TOTAL REPORTABLE SEGMENTS BALANCE SHEET (UNAUDITED) | |||||||||||||||||||||||
DECEMBER 31, 2016 | |||||||||||||||||||||||
(Amounts in thousands) | |||||||||||||||||||||||
CONDENSED CONSOLIDATED STATEMENTS OF FINANCIAL CONDITION (GAAP BASIS) | 1 | 2 | 3 | 4 | 5 | TOTAL REPORTABLE SEGMENTS BALANCE SHEET | |||||||||||||||||
Assets | |||||||||||||||||||||||
Cash and Cash Equivalents | $ | 2,508,902 | — | — | 878,771 | — | — | $ | 3,387,673 | Cash and Short-term Investments | |||||||||||||
Investments | 31,409,765 | (22,249,206 | ) | (987,994 | ) | (1,213,692 | ) | — | — | 6,958,873 | Investments | ||||||||||||
— | — | 1,213,692 | — | — | 1,213,692 | Unrealized Carry | |||||||||||||||||
Other Assets | 5,084,230 | (2,118,364 | ) | — | (1,039,996 | ) | — | (314,192 | ) | 1,611,678 | Other Assets | ||||||||||||
— | — | 161,225 | — | — | 161,225 | Corporate Real Estate | |||||||||||||||||
Total Assets | $ | 39,002,897 | (24,367,570 | ) | (987,994 | ) | — | — | (314,192 | ) | $ | 13,333,141 | |||||||||||
Liabilities and Equity | |||||||||||||||||||||||
Debt Obligations | 18,544,075 | (16,145,515 | ) | — | (398,560 | ) | — | — | 2,000,000 | Debt Obligations - KKR (ex-KFN) | |||||||||||||
— | — | 398,560 | — | — | 398,560 | Debt Obligations - KFN | |||||||||||||||||
— | — | 373,750 | — | — | 373,750 | Preferred Shares - KFN | |||||||||||||||||
Other Liabilities | 3,340,739 | (1,945,039 | ) | (987,994 | ) | — | — | (163,030 | ) | 244,676 | Other Liabilities | ||||||||||||
Total Liabilities | 21,884,814 | (18,090,554 | ) | (987,994 | ) | 373,750 | — | (163,030 | ) | 3,016,986 | |||||||||||||
Redeemable Noncontrolling Interests | 632,348 | (632,348 | ) | — | — | — | — | ||||||||||||||||
Equity | |||||||||||||||||||||||
Series A Preferred Units | 332,988 | — | — | (332,988 | ) | — | — | ||||||||||||||||
Series B Preferred Units | 149,566 | — | — | (149,566 | ) | — | — | ||||||||||||||||
KKR & Co. L.P. Capital - Common Unitholders | 5,457,279 | 118,635 | — | (17,446 | ) | 4,389,285 | (151,162 | ) | 9,796,591 | Book Value | |||||||||||||
Noncontrolling Interests | 10,545,902 | (5,763,303 | ) | — | (373,750 | ) | (4,389,285 | ) | — | 19,564 | Noncontrolling Interests | ||||||||||||
— | — | 500,000 | — | — | 500,000 | Preferred Units | |||||||||||||||||
Total Liabilities and Equity | $ | 39,002,897 | (24,367,570 | ) | (987,994 | ) | — | — | (314,192 | ) | $ | 13,333,141 | |||||||||||
1 | IMPACT OF CONSOLIDATION OF INVESTMENT VEHICLES AND OTHER ENTITIES | ||||||||||||||||||||||
2 | CARRY POOL RECLASSIFICATION | ||||||||||||||||||||||
3 | OTHER RECLASSIFICATIONS | ||||||||||||||||||||||
4 | NONCONTROLLING INTERESTS HELD BY KKR HOLDINGS L.P. AND OTHER | ||||||||||||||||||||||
5 | EQUITY IMPACT OF KKR MANAGEMENT HOLDINGS CORP. | ||||||||||||||||||||||
KKR | |||||||||
EXHIBIT D | |||||||||
RECONCILIATION OF WEIGHTED AVERAGE GAAP COMMON UNITS OUTSTANDING (UNAUDITED) | |||||||||
The following table provides a reconciliation of KKR's Weighted Average GAAP Common Units Outstanding to Weighted Average Adjusted Units: | |||||||||
Quarter Ended | |||||||||
September 30, 2017 | June 30, 2017 | September 30, 2016 | |||||||
Weighted Average GAAP Common Units Outstanding - Basic | 471,758,886 | 466,170,025 | 445,989,300 | ||||||
Adjustments: | |||||||||
Weighted Average Unvested Common Units and Other Securities (1) | 35,114,291 | 35,007,398 | 33,986,375 | ||||||
Weighted Average GAAP Common Units Outstanding - Diluted | 506,873,177 | 501,177,423 | 479,975,675 | ||||||
Adjustments: | |||||||||
Weighted Average KKR Holdings Units (2) | 341,214,527 | 346,473,324 | 357,528,999 | ||||||
Weighted Average Adjusted Units | 848,087,704 | 847,650,747 | 837,504,674 | ||||||
Nine Months Ended | |||||||||
September 30, 2017 | September 30, 2016 | ||||||||
Weighted Average GAAP Common Units Outstanding - Basic | 463,941,084 | 448,149,747 | |||||||
Adjustments: | |||||||||
Weighted Average Unvested Common Units and Other Securities (1) | 37,674,551 | 34,985,238 | |||||||
Weighted Average GAAP Common Units Outstanding - Diluted | 501,615,635 | 483,134,985 | |||||||
Adjustments: | |||||||||
Weighted Average KKR Holdings Units (2) | 346,716,489 | 358,853,469 | |||||||
Weighted Average Adjusted Units | 848,332,124 | 841,988,454 | |||||||
RECONCILIATION OF GAAP COMMON UNITS OUTSTANDING (UNAUDITED) | |||||||||
The following table provides a reconciliation of KKR's GAAP Common Units Outstanding to Adjusted Units, Adjusted Units Eligible for Distribution and Outstanding Adjusted Units: | |||||||||
As of | |||||||||
September 30, 2017 | December 31, 2016 | ||||||||
GAAP Common Units Outstanding - Basic | 473,134,387 | 452,380,335 | |||||||
Unvested Common Units and Other Securities (1) | 35,104,599 | 42,119,756 | |||||||
GAAP Common Units Outstanding - Diluted | 508,238,986 | 494,500,091 | |||||||
Adjustments: | |||||||||
KKR Holdings Units (2) | 339,845,707 | 353,757,398 | |||||||
Adjusted Units | 848,084,693 | 848,257,489 | |||||||
Adjustments: | |||||||||
Unvested Common Units | (31,116,886 | ) | (37,519,436 | ) | |||||
Adjusted Units Eligible for Distribution | 816,967,807 | 810,738,053 | |||||||
Adjustments: | |||||||||
Vested Other Securities | (3,987,713 | ) | (4,600,320 | ) | |||||
Outstanding Adjusted Units | 812,980,094 | 806,137,733 | |||||||