Investor Day 2025 NOVEMBER 5, 2025
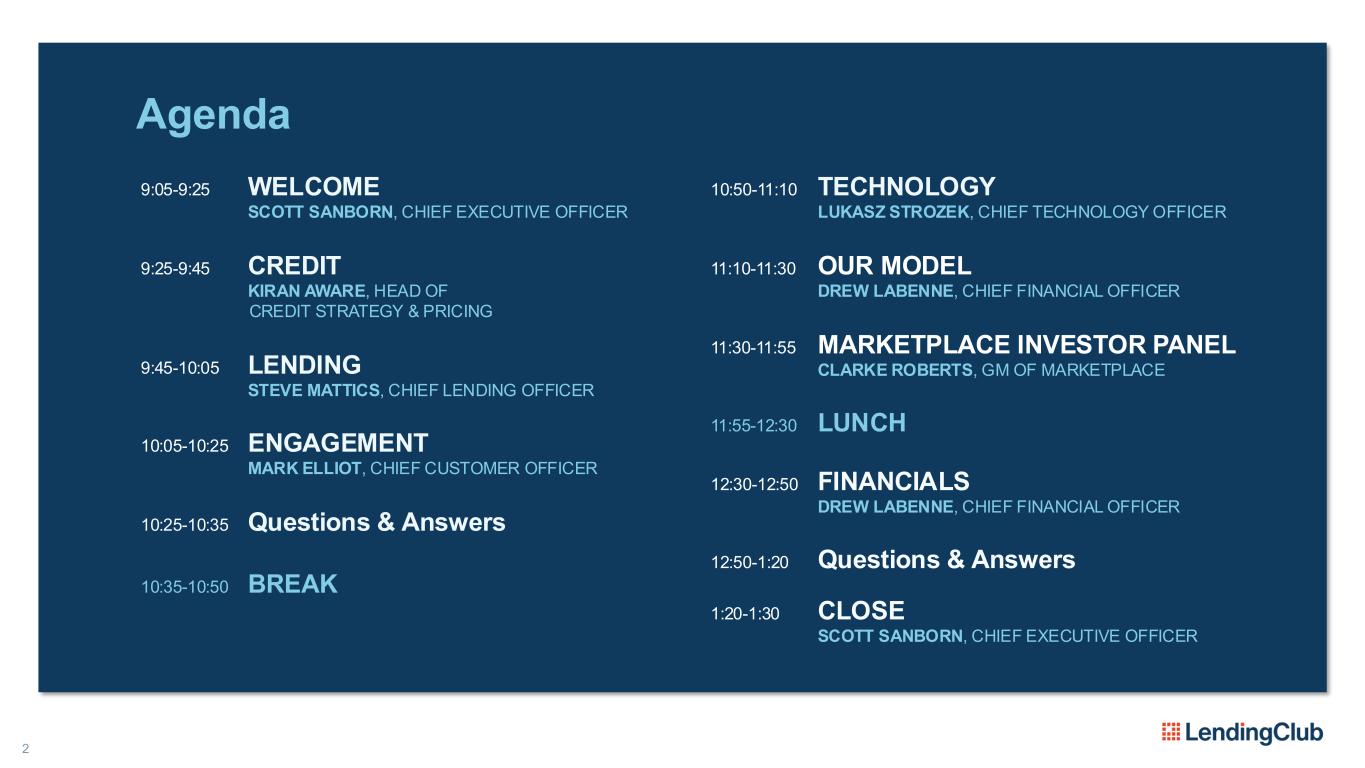
2 9:05-9:25 WELCOME SCOTT SANBORN, CHIEF EXECUTIVE OFFICER 9:25-9:45 CREDIT KIRAN AWARE, HEAD OF CREDIT STRATEGY & PRICING 9:45-10:05 LENDING STEVE MATTICS, CHIEF LENDING OFFICER 10:05-10:25 ENGAGEMENT MARK ELLIOT, CHIEF CUSTOMER OFFICER 10:25-10:35 Questions & Answers 10:35-10:50 BREAK 10:50-11:10 TECHNOLOGY LUKASZ STROZEK, CHIEF TECHNOLOGY OFFICER 11:10-11:30 OUR MODEL DREW LABENNE, CHIEF FINANCIAL OFFICER 11:30-11:55 MARKETPLACE INVESTOR PANEL CLARKE ROBERTS, GM OF MARKETPLACE 11:55-12:30 LUNCH 12:30-12:50 FINANCIALS DREW LABENNE, CHIEF FINANCIAL OFFICER 12:50-1:20 Questions & Answers 1:20-1:30 CLOSE SCOTT SANBORN, CHIEF EXECUTIVE OFFICER Agenda
3 Disclaimer Some of the statements in this presentation, including statements regarding our competitive advantages, loan and financial performance, business growth opportunities and outlook, and demand for our products, are “forward-looking statements.” The words “anticipate,” “believe,” “estimate,” “expect,” “intend,” “may,” “outlook,” “plan,” “predict,” “project,” “will,” “would” and similar expressions may identify forward-looking statements, although not all forward-looking statements contain these identifying words. Factors that could cause actual results to differ materially from those contemplated by these forward-looking statements include: our ability to continue to attract new and retain existing borrowers and platform investors; the impact of current and planned initiatives; competition; overall economic conditions; the interest rate and macroeconomic environment; the regulatory environment; default rates and those factors set forth in the section titled “Risk Factors” in our most recent Annual Report on Form 10-K as filed with the Securities and Exchange Commission, as well as in our subsequent filings with the Securities and Exchange Commission. We may not actually achieve the plans, intentions or expectations disclosed in forward-looking statements, and you should not place undue reliance on forward-looking statements. Actual results or events could differ materially from the plans, intentions and expectations disclosed in forward-looking statements. Accordingly, you should not place undue reliance on the forward-looking statements in this presentation and we do not assume any obligation to update any forward-looking statements, whether as a result of new information, future events or otherwise, except as required by law. This presentation contains non-GAAP financial measures relating to our performance, including: Tangible Book Value Per Common Share, Return on Invested Capital and Return on Tangible Common Equity. Our non-GAAP financial measures have limitations as analytical tools, are not prepared under any comprehensive set of accounting rules or principles and should not be considered in isolation or as a substitute for our results under accounting principles generally accepted in the United States (GAAP). We believe these non-GAAP financial measures provide management and investors with useful supplemental information about the financial performance of our business, enable comparison of financial results between periods where certain items may vary independent of business performance, and enable comparison of our financial results with other public companies. You can find the reconciliation of certain non-GAAP financial measures to the most directly comparable GAAP measures on pages 132 of this presentation. Note that we do not provide a reconciliation of forward-looking non-GAAP financial measures to the most directly comparable GAAP financial measures on a forward-looking basis because we are unable to predict certain elements of such forward-looking measures with reasonable certainty without unreasonable effort. Credit Karma, Bankrate, LendingTree, NerdWallet, Moasic, Wisetack, Apple AppStore, Google Play, Narmi, and Cushion are not registered marks of LendingClub. The inclusion of these marks in this presentation is not reflective of an endorsement of this presentation, or its contents, by the third-party owners of these marks. LendingClub Corporation (NYSE: LC) is the parent company of LendingClub Bank, National Association, Member FDIC.
A New Model for Banking SCOTT SANBORN CHIEF EXECUTIVE OFFICER
5 We are radically different today.
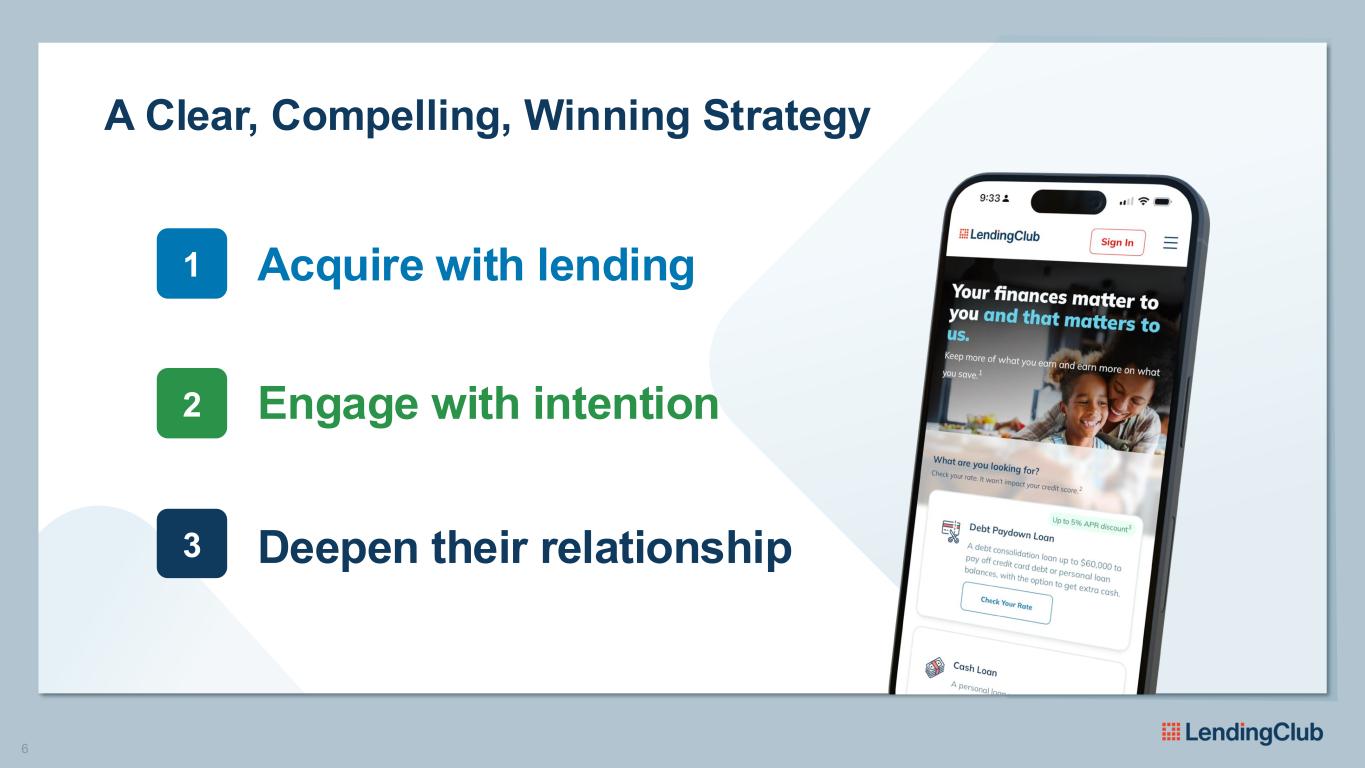
6 A Clear, Compelling, Winning Strategy 1 Acquire with lending 2 Engage with intention 3 Deepen their relationship
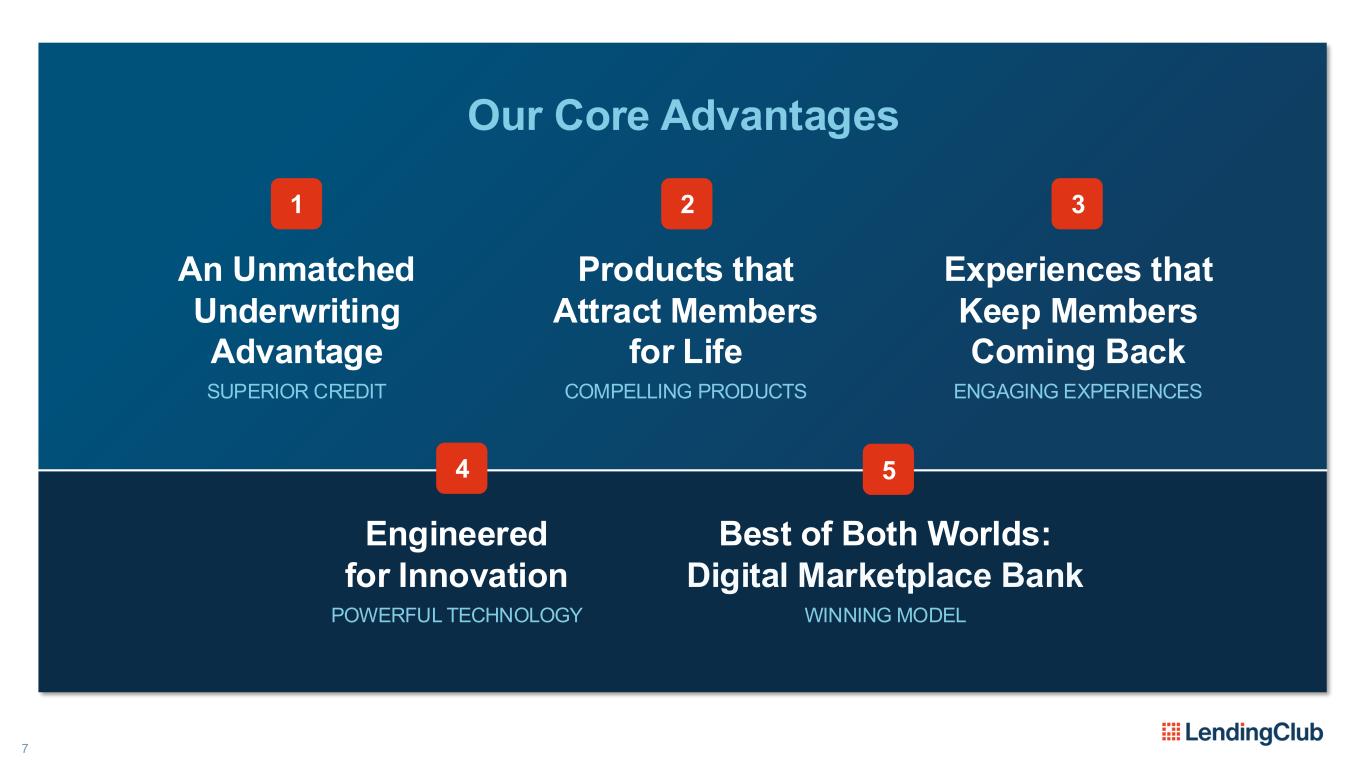
7 Our Core Advantages An Unmatched Underwriting Advantage SUPERIOR CREDIT 1 Products that Attract Members for Life COMPELLING PRODUCTS 2 Experiences that Keep Members Coming Back ENGAGING EXPERIENCES 3 Best of Both Worlds: Digital Marketplace Bank WINNING MODEL 5 Engineered for Innovation POWERFUL TECHNOLOGY 4
8 The math is simple. The path is clear.
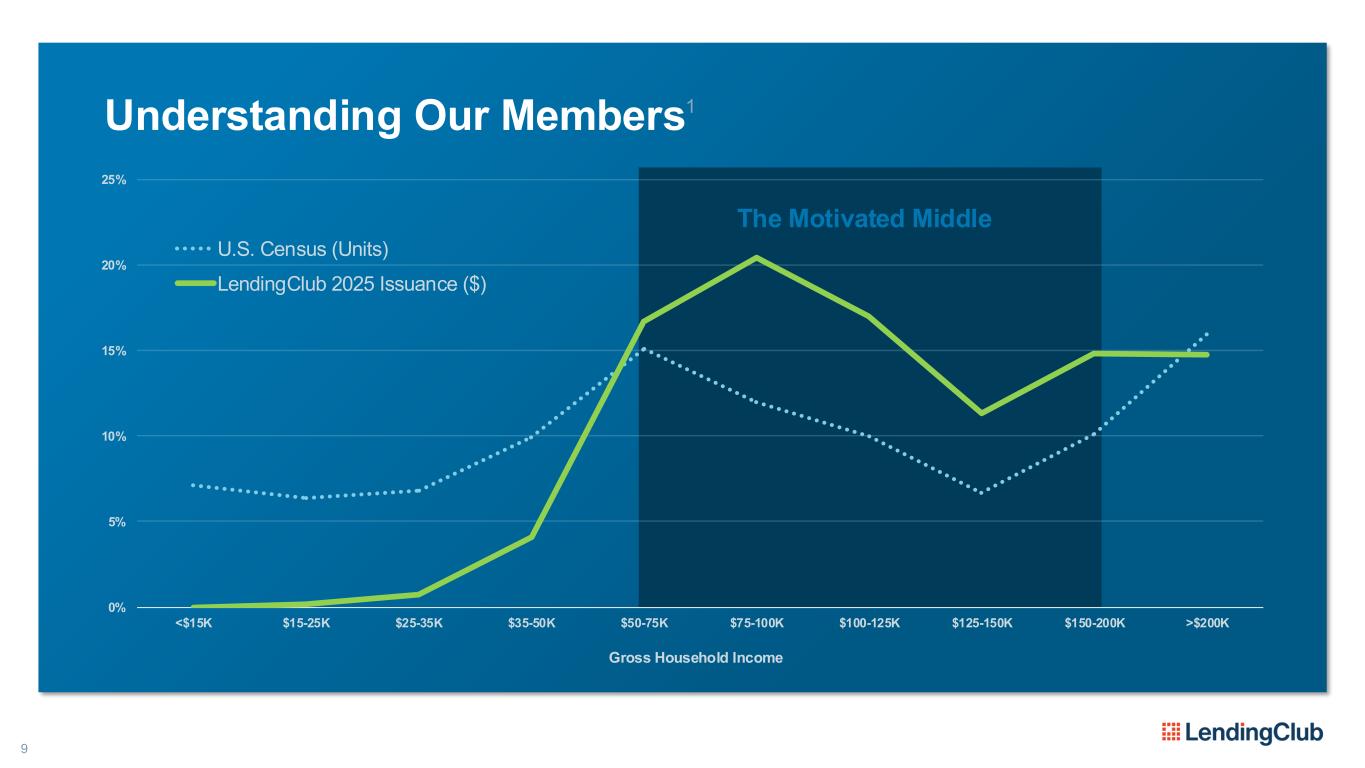
9 Understanding Our Members1 0% 5% 10% 15% 20% 25% <$15K $15-25K $25-35K $35-50K $50-75K $75-100K $100-125K $125-150K $150-200K >$200K Gross Household Income U.S. Census (Units) LendingClub 2025 Issuance ($) The Motivated Middle
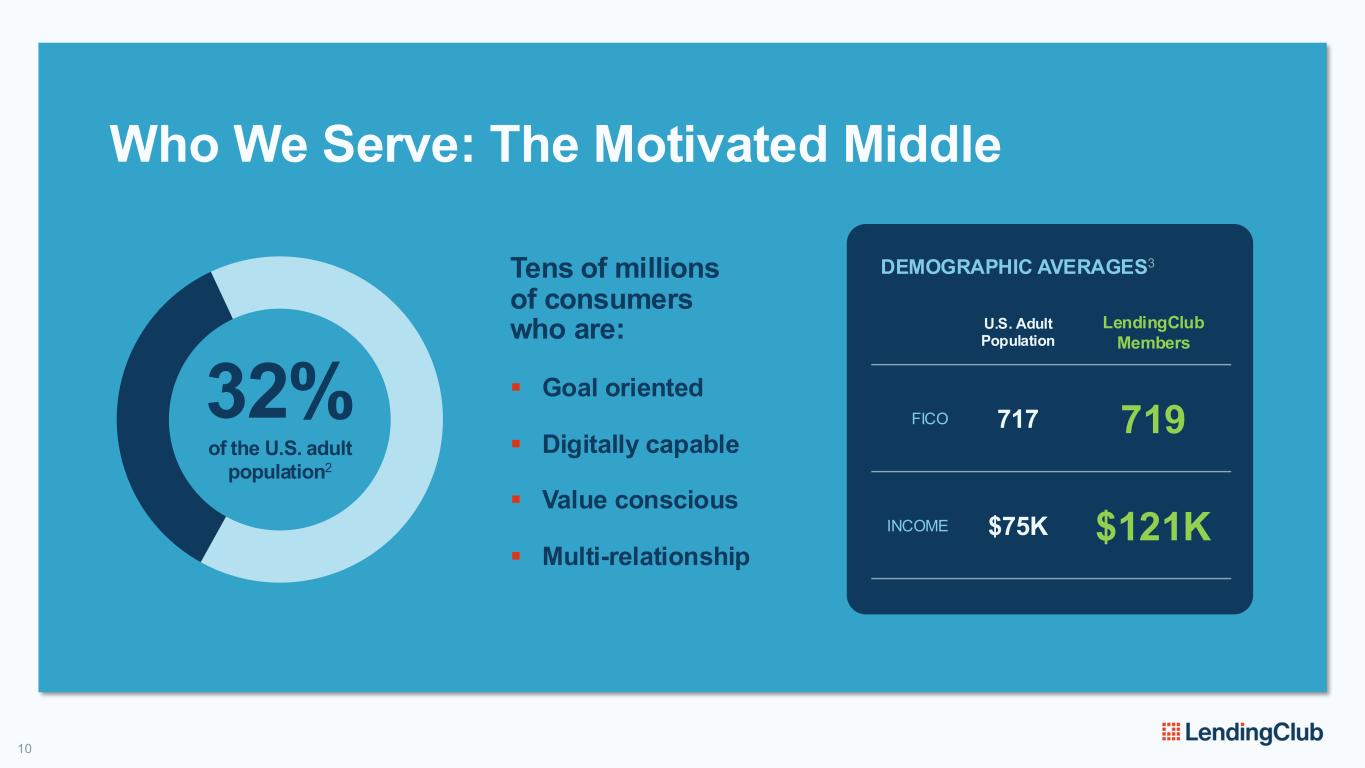
Who We Serve: The Motivated Middle U.S. Adult Population LendingClub Members FICO 717 719 INCOME $75K $121K DEMOGRAPHIC AVERAGES3Tens of millions of consumers who are: ▪ Goal oriented ▪ Digitally capable ▪ Value conscious ▪ Multi-relationship 32% of the U.S. adult population2 10
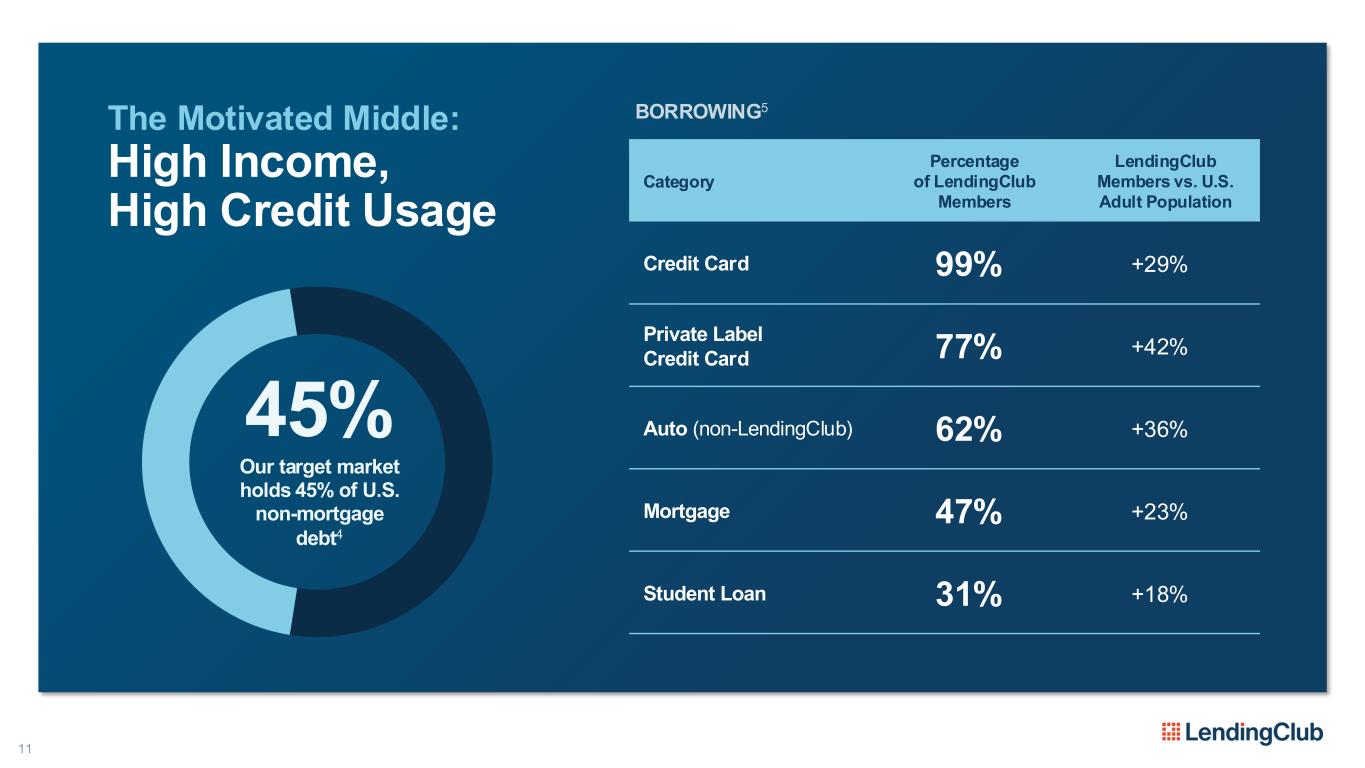
11 The Motivated Middle: High Income, High Credit Usage BORROWING5 Category Percentage of LendingClub Members LendingClub Members vs. U.S. Adult Population Credit Card 99% +29% Private Label Credit Card 77% +42% Auto (non-LendingClub) 62% +36% Mortgage 47% +23% Student Loan 31% +18% 45% Our target market holds 45% of U.S. non-mortgage debt4

12 Banking is no longer a place you go – it’s something you do.
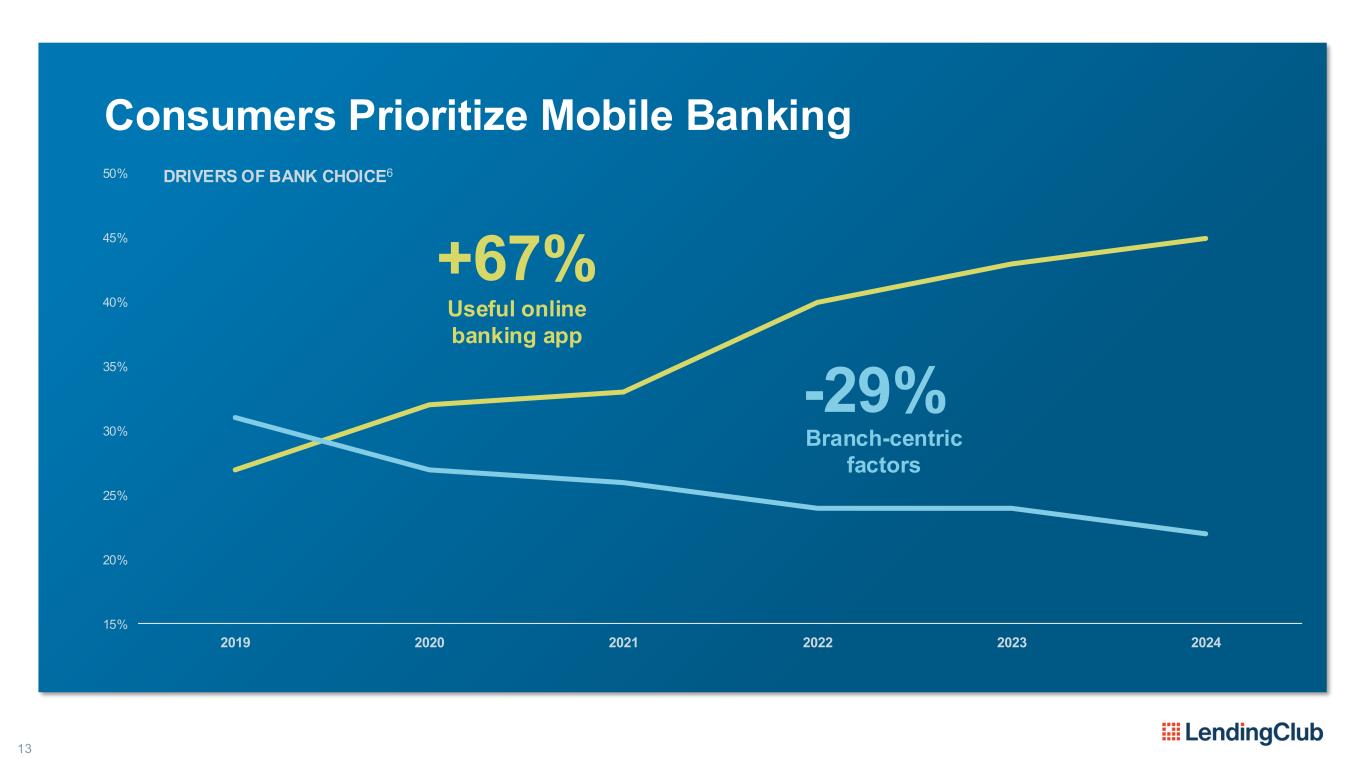
13 Consumers Prioritize Mobile Banking 15% 20% 25% 30% 35% 40% 45% 50% 2019 2020 2021 2022 2023 2024 DRIVERS OF BANK CHOICE6 Useful online banking app Branch-centric factors +67% -29%
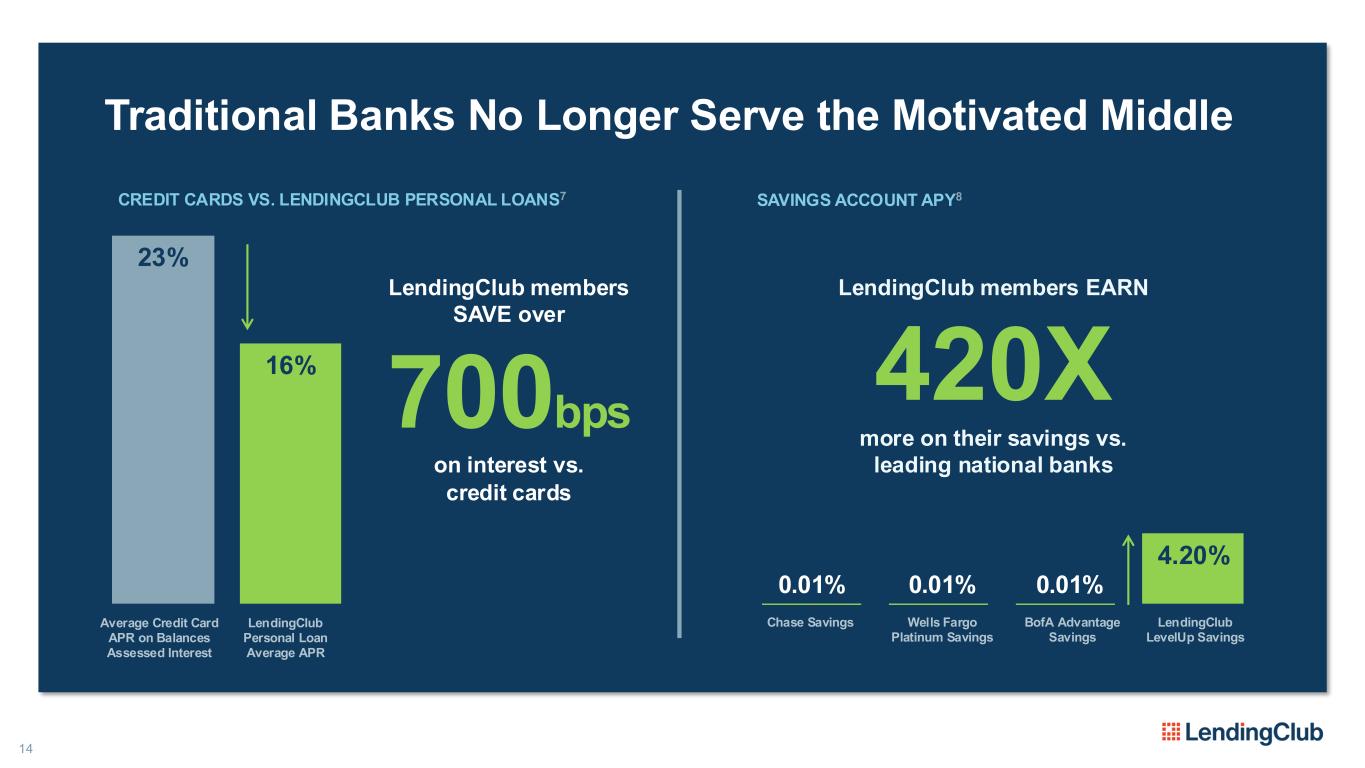
14 Traditional Banks No Longer Serve the Motivated Middle CREDIT CARDS VS. LENDINGCLUB PERSONAL LOANS7 LendingClub members SAVE over 700bps on interest vs. credit cards LendingClub members EARN 420X more on their savings vs. leading national banks LendingClub LevelUp Savings SAVINGS ACCOUNT APY8 Chase Savings Wells Fargo Platinum Savings BofA Advantage Savings 0.01% 0.01% 0.01% 4.20% Average Credit Card APR on Balances Assessed Interest LendingClub Personal Loan Average APR 16% 23%
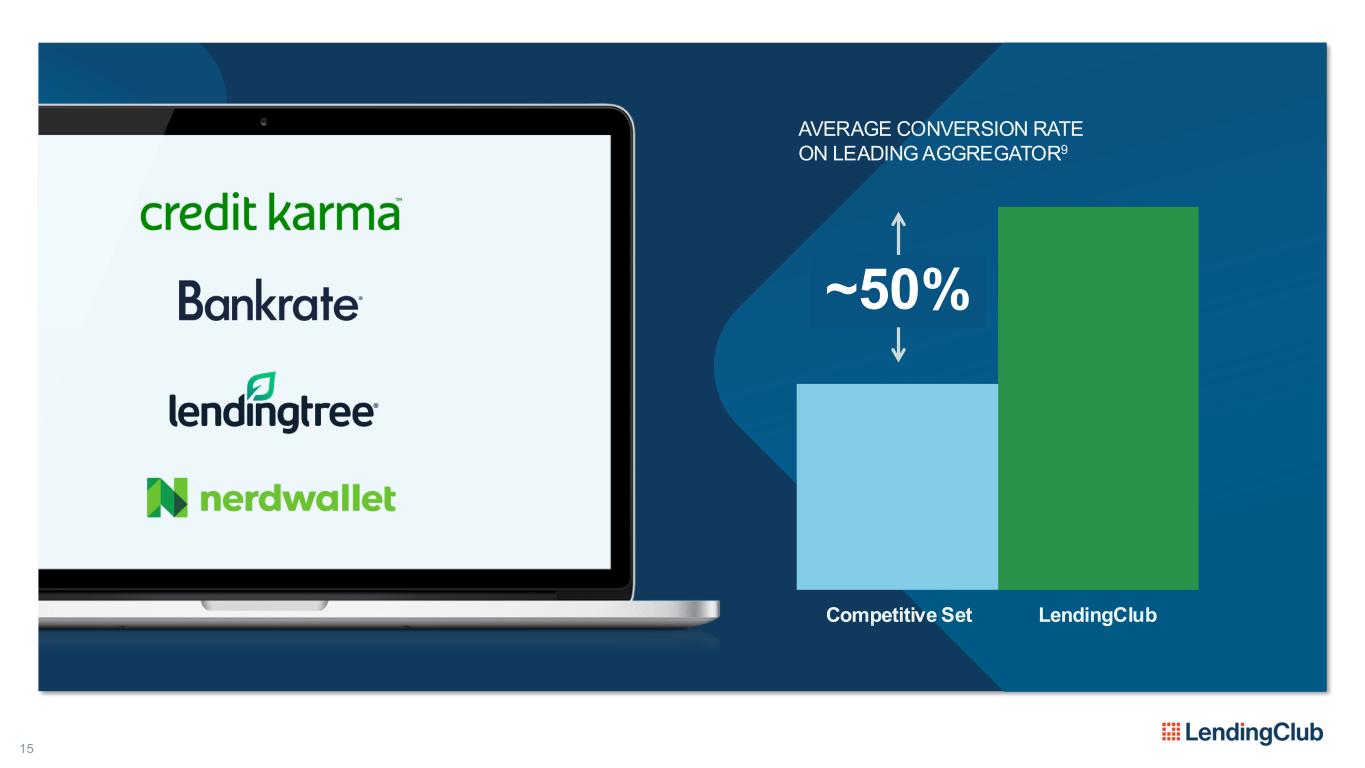
15 ~50% AVERAGE CONVERSION RATE ON LEADING AGGREGATOR9 Competitive Set LendingClub
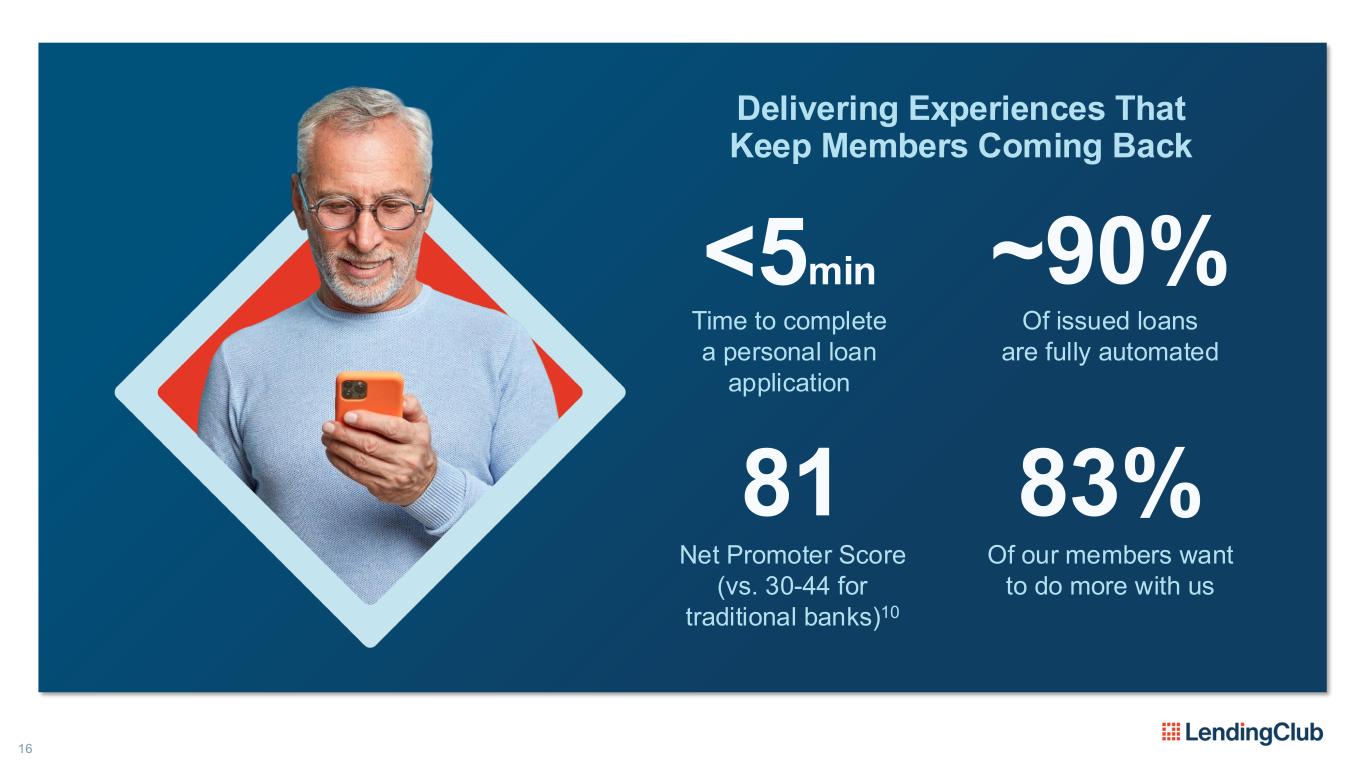
16 Delivering Experiences That Keep Members Coming Back <5min Time to complete a personal loan application ~90% Of issued loans are fully automated 83% Of our members want to do more with us 81 Net Promoter Score (vs. 30-44 for traditional banks)10
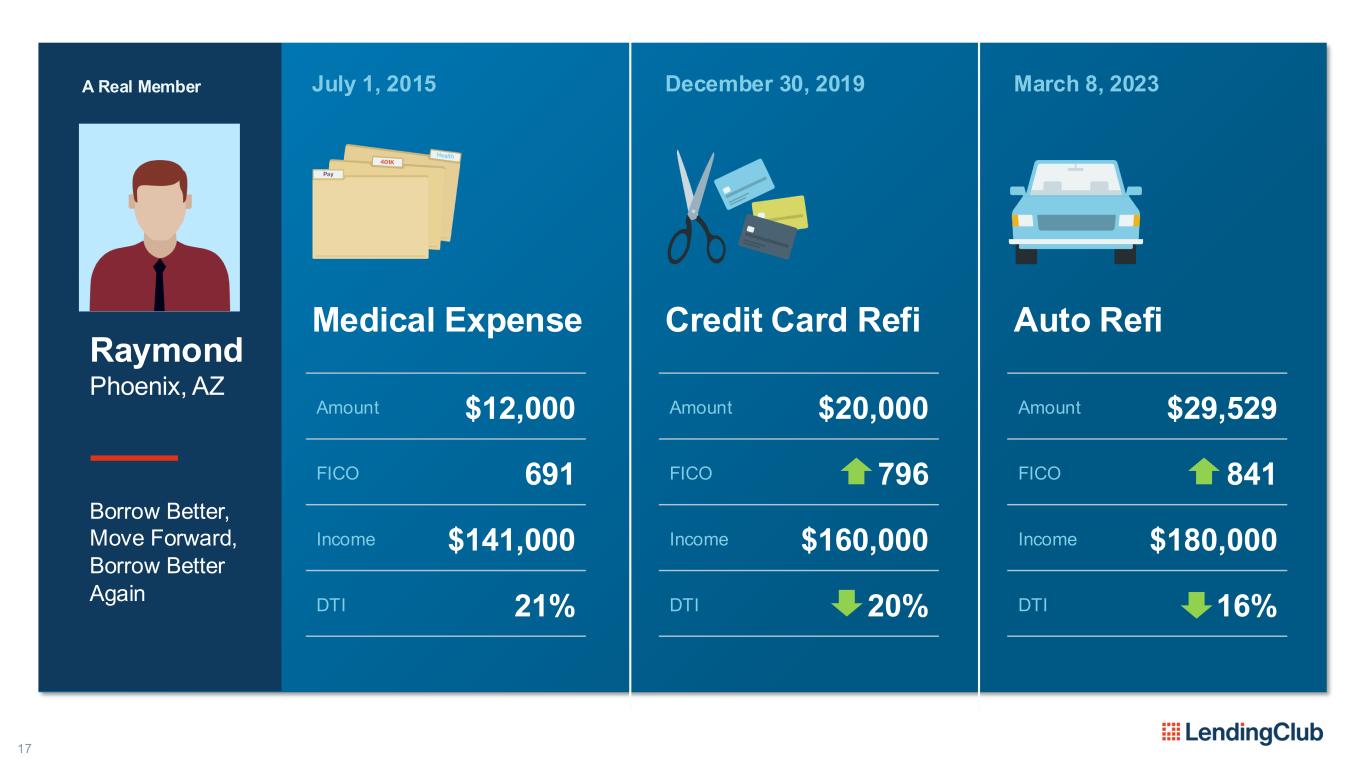
17 Raymond Phoenix, AZ July 1, 2015 Medical Expense Amount $12,000 FICO 691 Income $141,000 DTI 21% December 30, 2019 Credit Card Refi Amount $20,000 FICO 796 Income $160,000 DTI 20% March 8, 2023 Auto Refi Amount $29,529 FICO 841 Income $180,000 DTI 16% Borrow Better, Move Forward, Borrow Better Again A Real Member
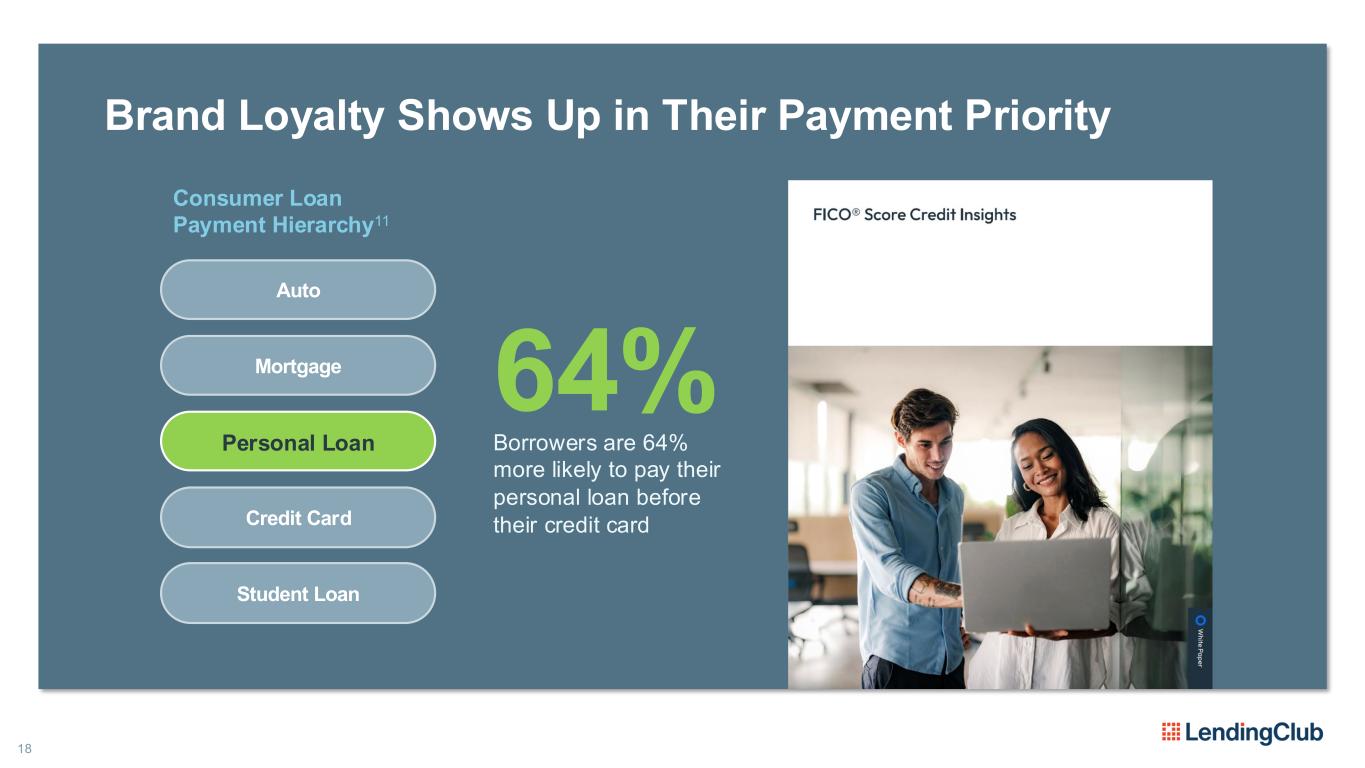
18 Brand Loyalty Shows Up in Their Payment Priority Consumer Loan Payment Hierarchy11 Auto Mortgage Personal Loan Credit Card Student Loan 64% Borrowers are 64% more likely to pay their personal loan before their credit card
19 Our strategy is working.
An Unmatched Underwriting Advantage KIRAN AWARE HEAD OF CREDIT STRATEGY & PRICING
21 Lending is a data problem.
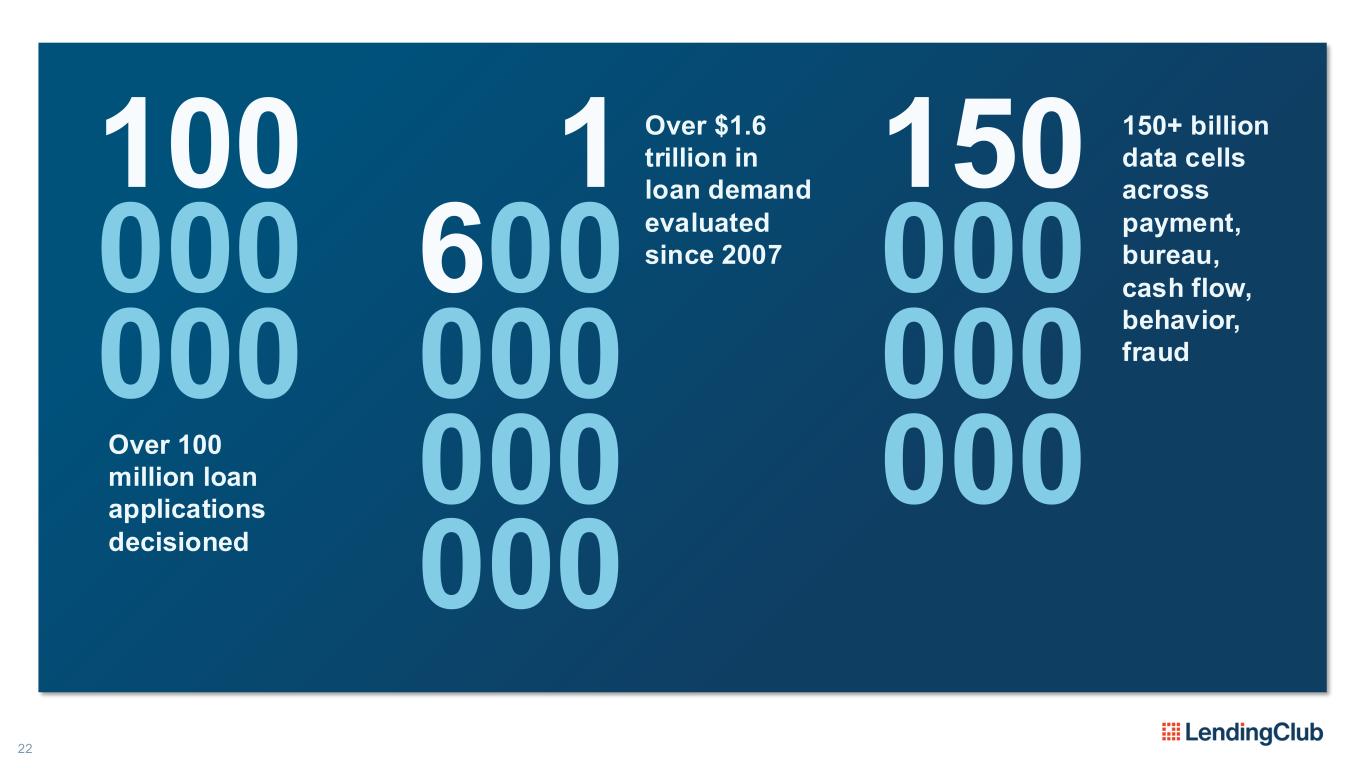
22 150 000 000 000 150+ billion data cells across payment, bureau, cash flow, behavior, fraud 1 600 000 000 000 100 000 000 Over 100 million loan applications decisioned Over $1.6 trillion in loan demand evaluated since 2007
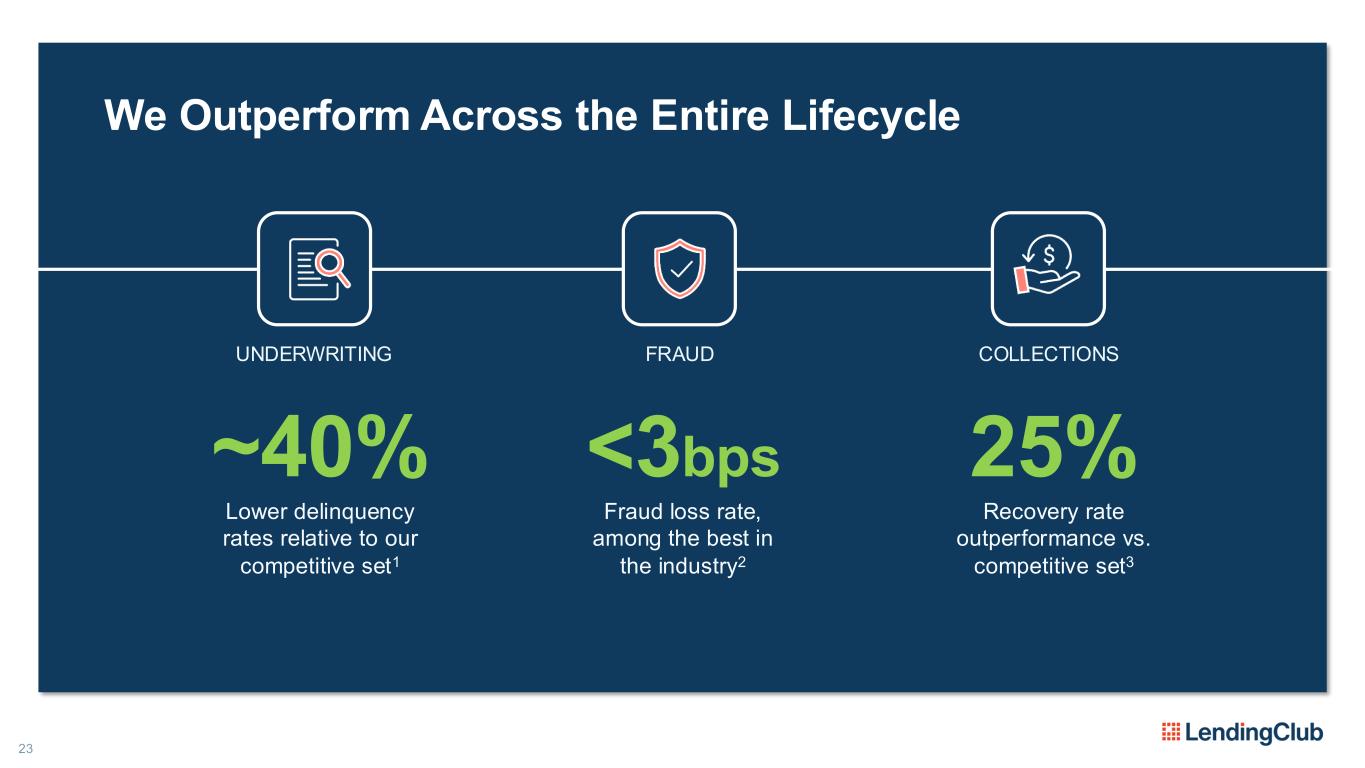
23 We Outperform Across the Entire Lifecycle UNDERWRITING FRAUD COLLECTIONS ~40% Lower delinquency rates relative to our competitive set1 <3bps Fraud loss rate, among the best in the industry2 Recovery rate outperformance vs. competitive set3 25%
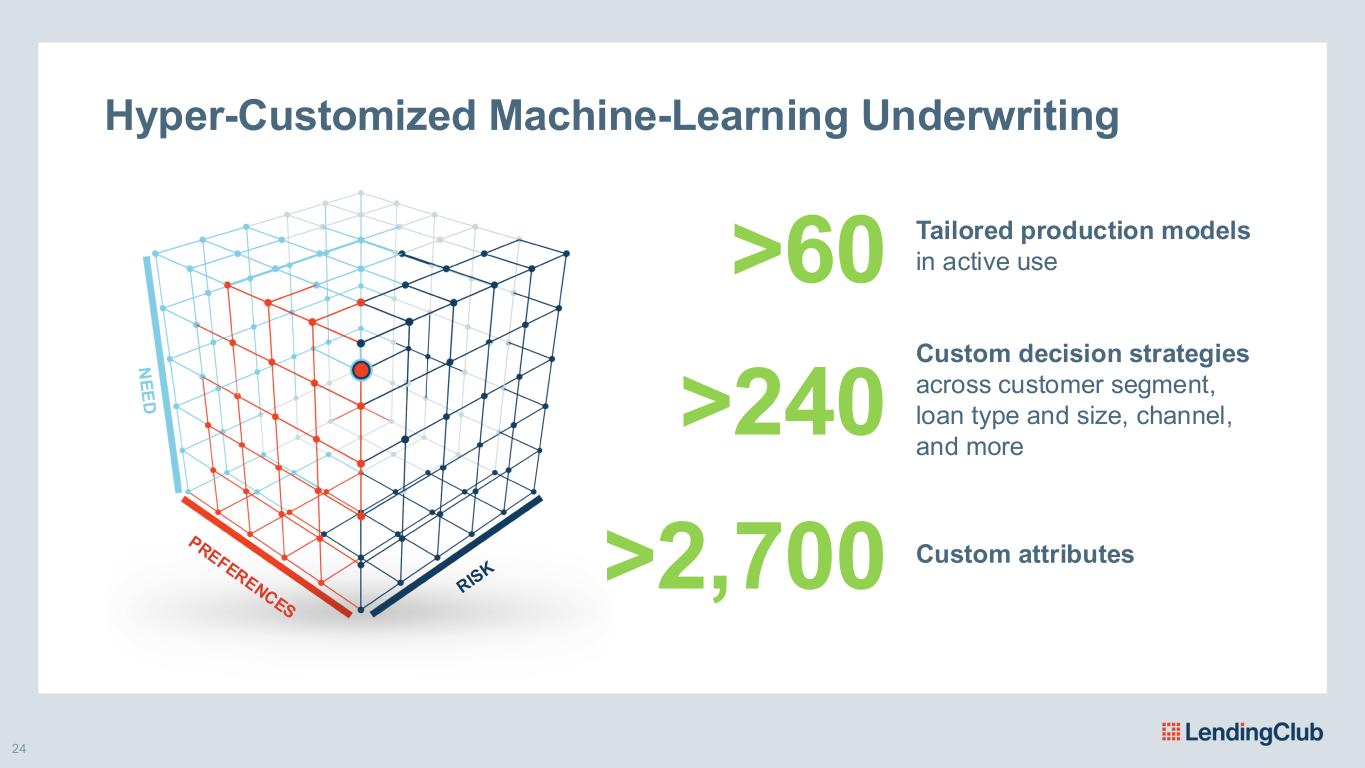
24 Hyper-Customized Machine-Learning Underwriting >60 Tailored production models in active use >240 Custom decision strategies across customer segment, loan type and size, channel, and more >2,700 Custom attributes
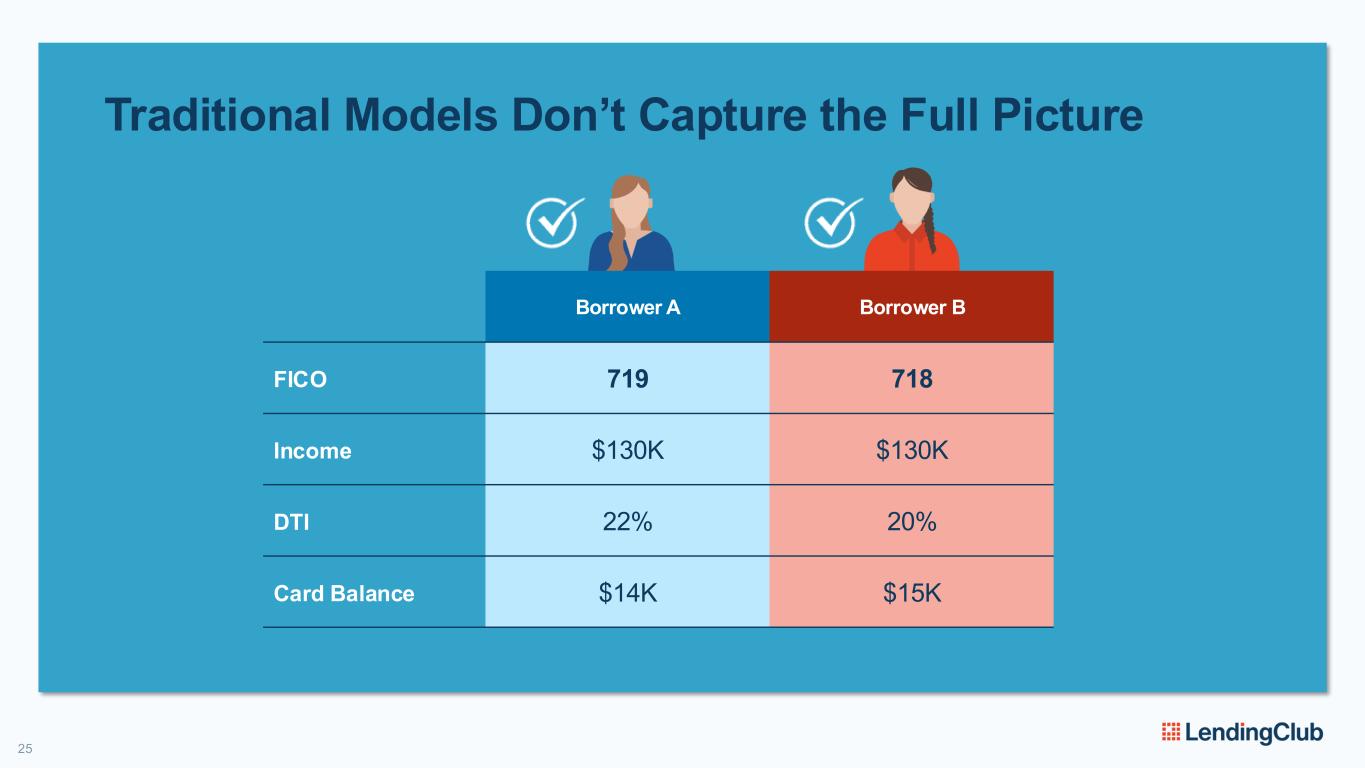
25 Traditional Models Don’t Capture the Full Picture Borrower A Borrower B FICO 719 718 Income $130K $130K DTI 22% 20% Card Balance $14K $15K
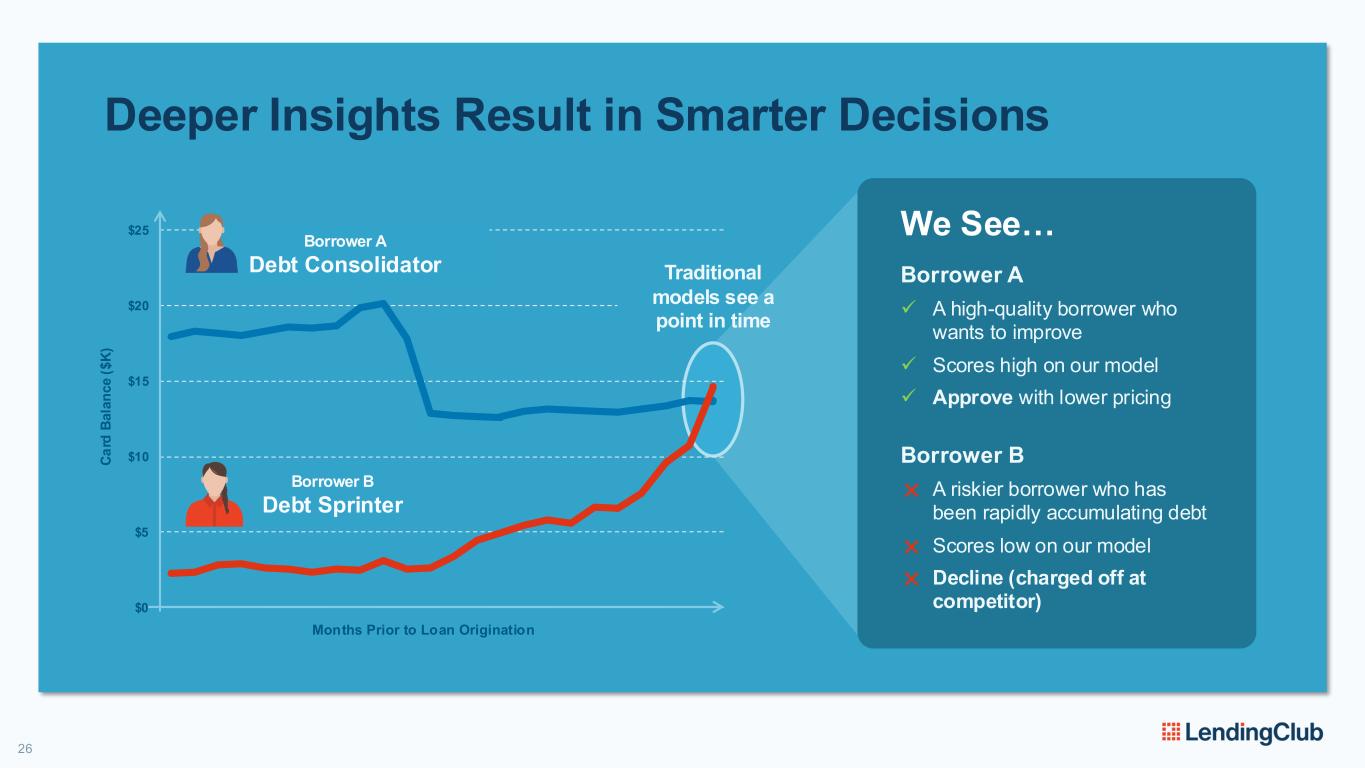
We See… Borrower A ✓ A high-quality borrower who wants to improve ✓ Scores high on our model ✓ Approve with lower pricing Borrower B ❌ A riskier borrower who has been rapidly accumulating debt ❌ Scores low on our model ❌ Decline (charged off at competitor) 26 Deeper Insights Result in Smarter Decisions $0 $5 $10 $15 $20 $25 C a rd B a la n c e ( $ K ) Months Prior to Loan Origination Borrower A Debt Consolidator Borrower B Debt Sprinter Traditional models see a point in time
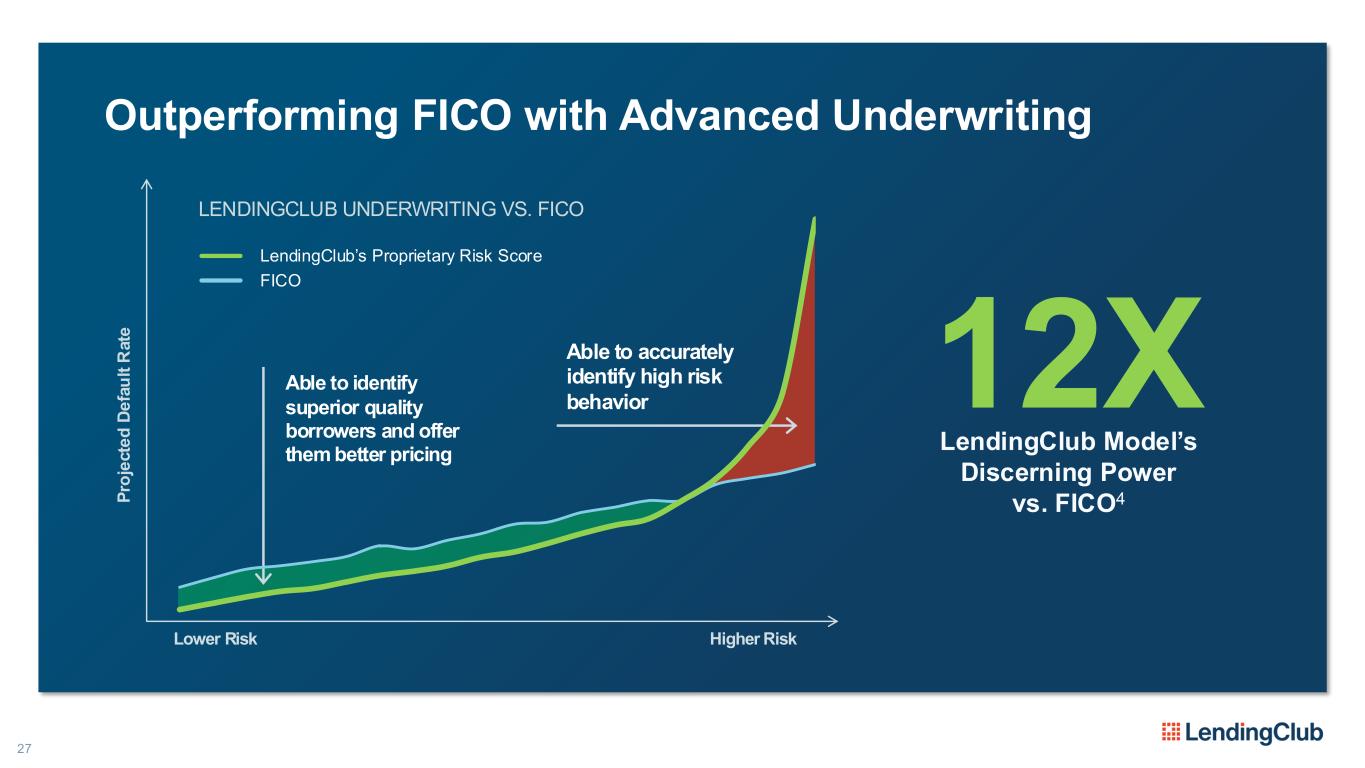
Able to accurately identify high risk behavior Able to identify superior quality borrowers and offer them better pricing Outperforming FICO with Advanced Underwriting LendingClub’s Proprietary Risk Score FICO LENDINGCLUB UNDERWRITING VS. FICO 12X LendingClub Model’s Discerning Power vs. FICO4 Lower Risk Higher Risk P ro je c te d D e fa u lt R a te 27
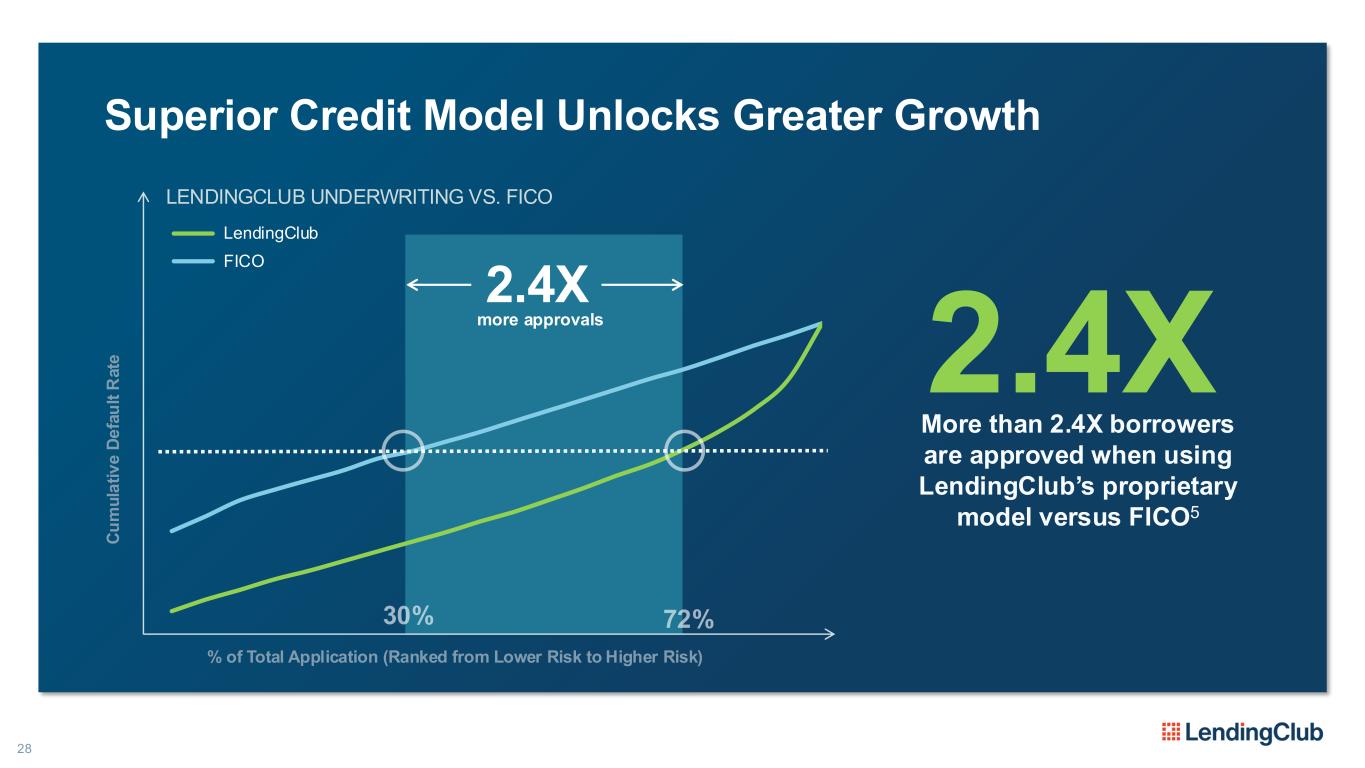
C u m u la ti v e D e fa u lt R a te % of Total Application (Ranked from Lower Risk to Higher Risk) Superior Credit Model Unlocks Greater Growth LendingClub FICO LENDINGCLUB UNDERWRITING VS. FICO More than 2.4X borrowers are approved when using LendingClub’s proprietary model versus FICO5 2.4X 2.4X more approvals 28
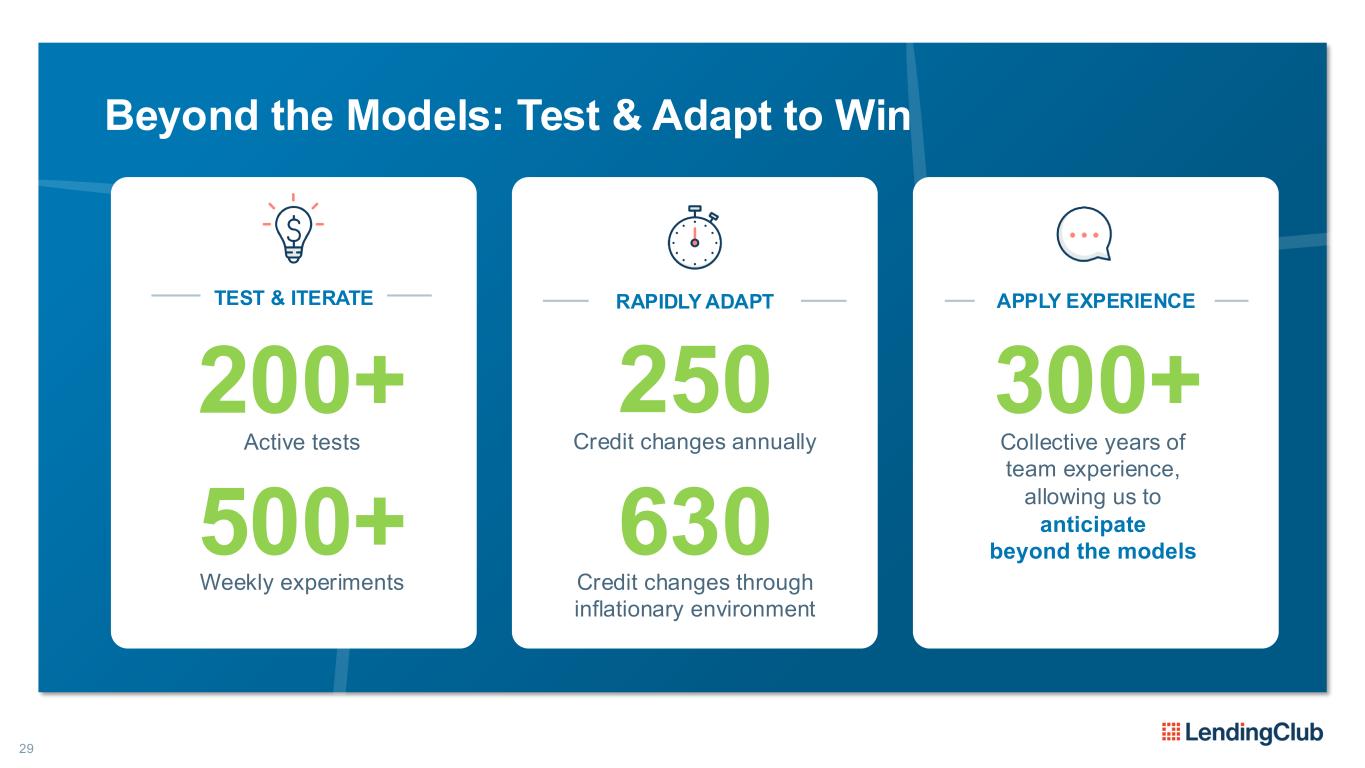
29 Beyond the Models: Test & Adapt to Win TEST & ITERATE 200+ Active tests 500+ Weekly experiments RAPIDLY ADAPT 630 Credit changes through inflationary environment 250 Credit changes annually APPLY EXPERIENCE 300+ Collective years of team experience, allowing us to anticipate beyond the models
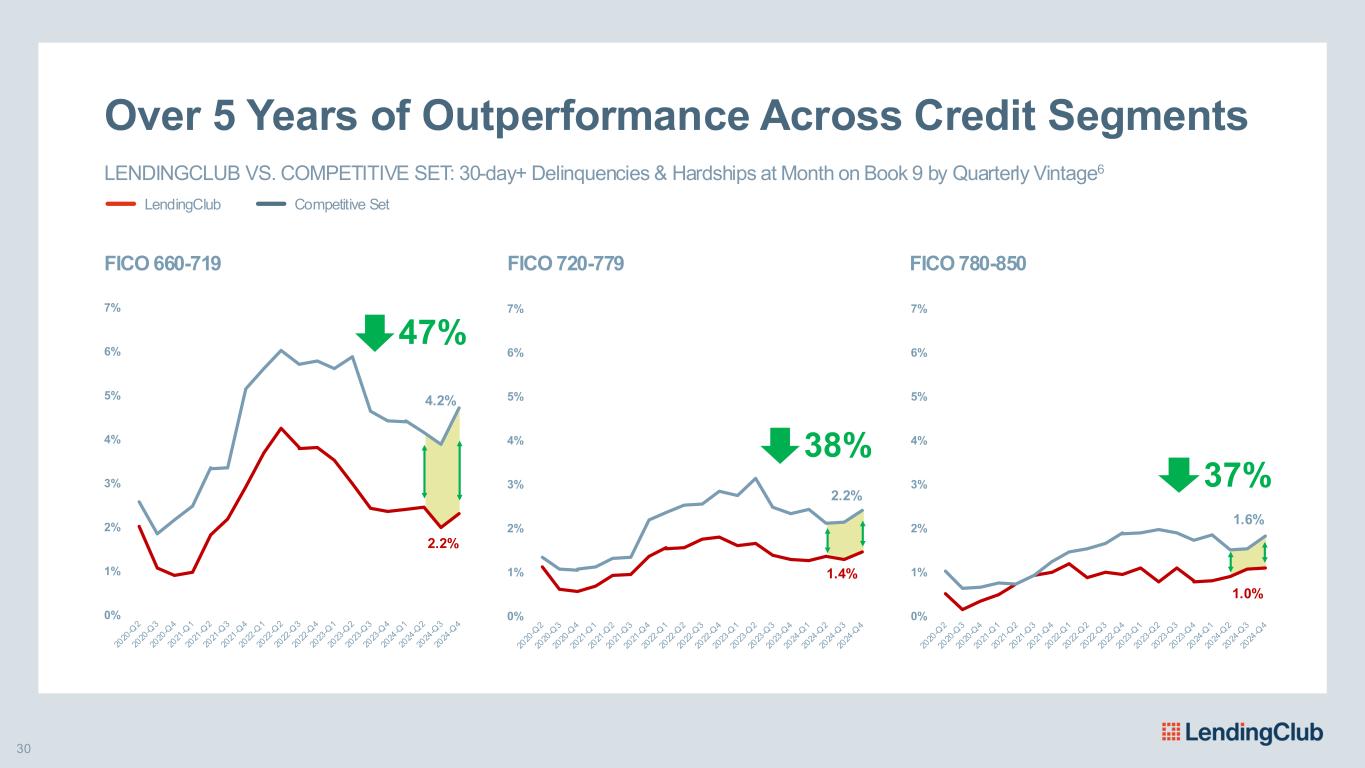
0% 1% 2% 3% 4% 5% 6% 7% 0% 1% 2% 3% 4% 5% 6% 7% 30 Over 5 Years of Outperformance Across Credit Segments LENDINGCLUB VS. COMPETITIVE SET: 30-day+ Delinquencies & Hardships at Month on Book 9 by Quarterly Vintage6 LendingClub Competitive Set FICO 660-719 FICO 720-779 FICO 780-850 47% 38% 4.2% 2.2% 2.2% 1.4% 1.6% 1.0% 0% 1% 2% 3% 4% 5% 6% 7% 37%
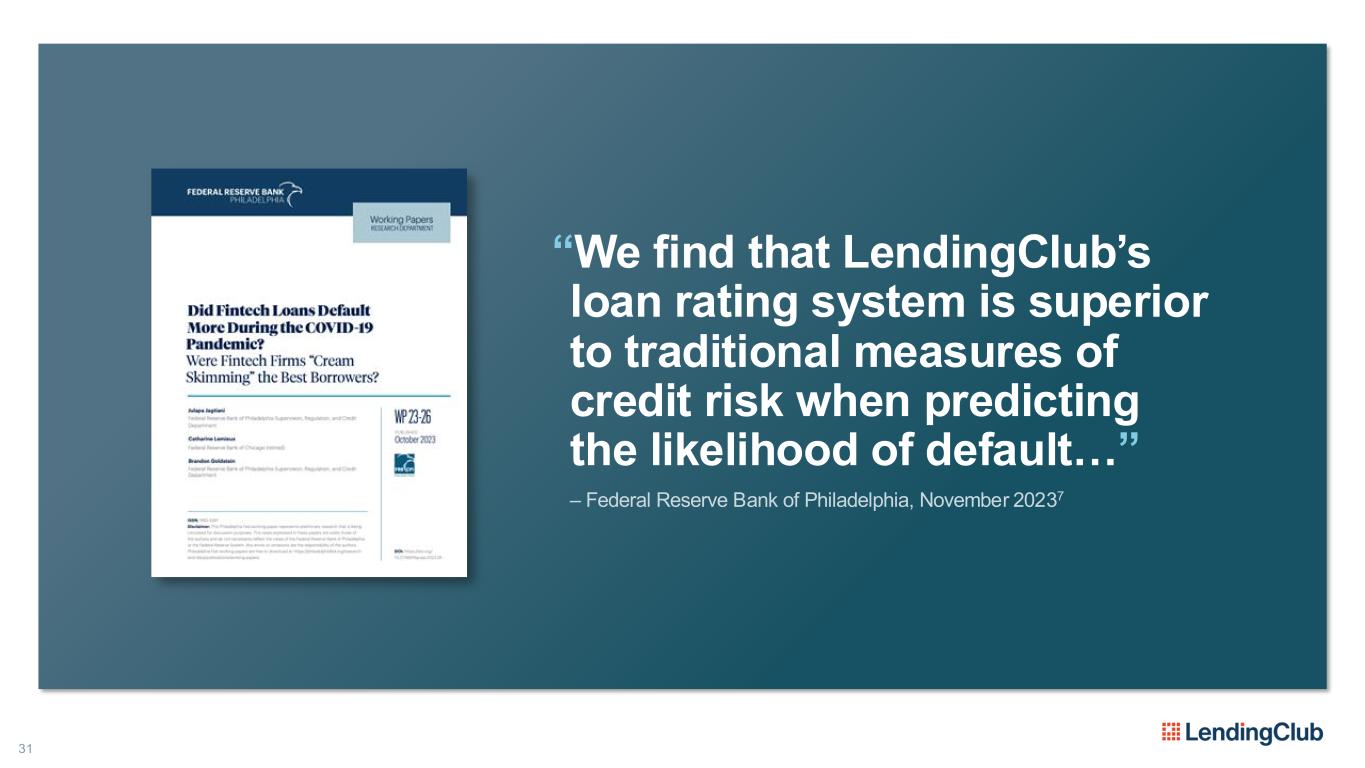
31 “We find that LendingClub’s loan rating system is superior to traditional measures of credit risk when predicting the likelihood of default…” – Federal Reserve Bank of Philadelphia, November 20237
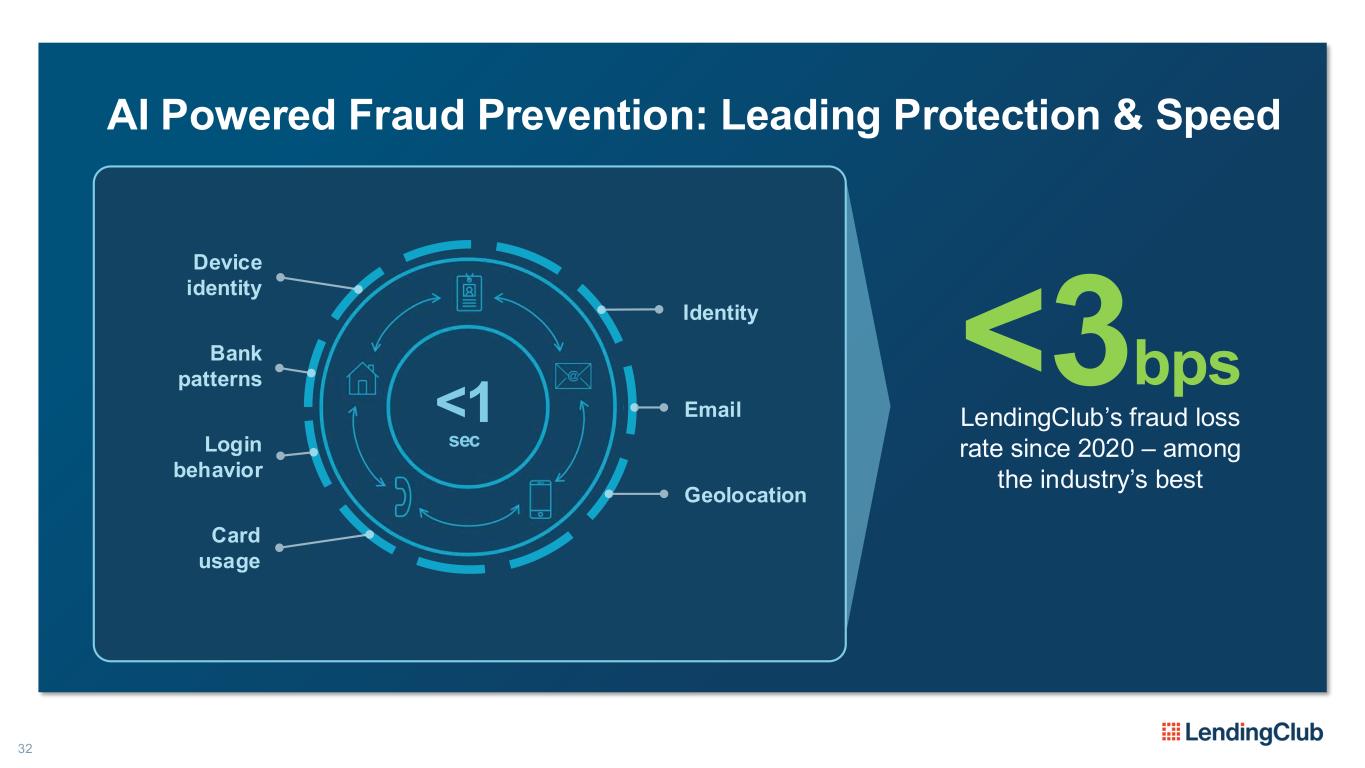
32 AI Powered Fraud Prevention: Leading Protection & Speed <3bps LendingClub’s fraud loss rate since 2020 – among the industry’s best Device identity Login behavior Bank patterns Geolocation Card usage Identity Email<1 sec
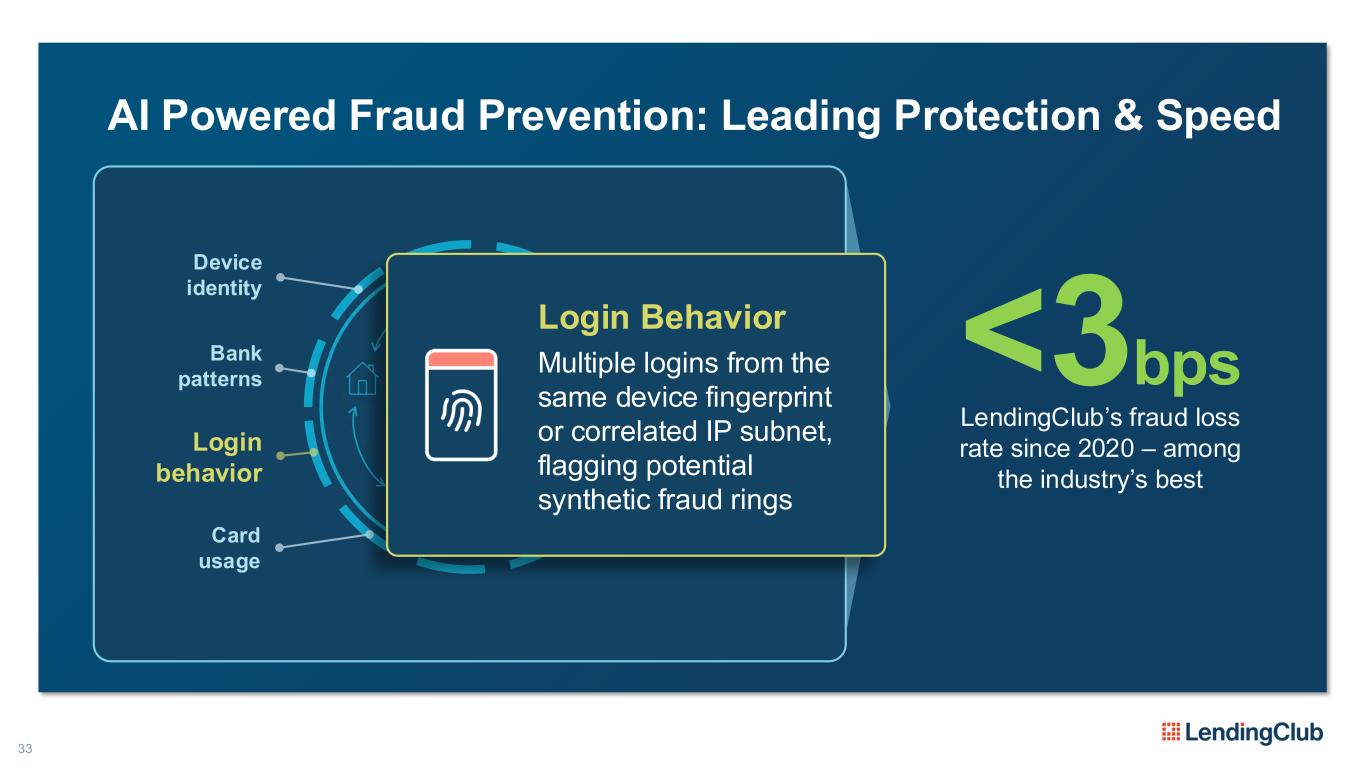
33 AI Powered Fraud Prevention: Leading Protection & Speed <3bps LendingClub’s fraud loss rate since 2020 – among the industry’s best Device identity Login behavior Bank patterns Geolocation Card usage Identity Email<1 sec Login Behavior Multiple logins from the same device fingerprint or correlated IP subnet, flagging potential synthetic fraud rings
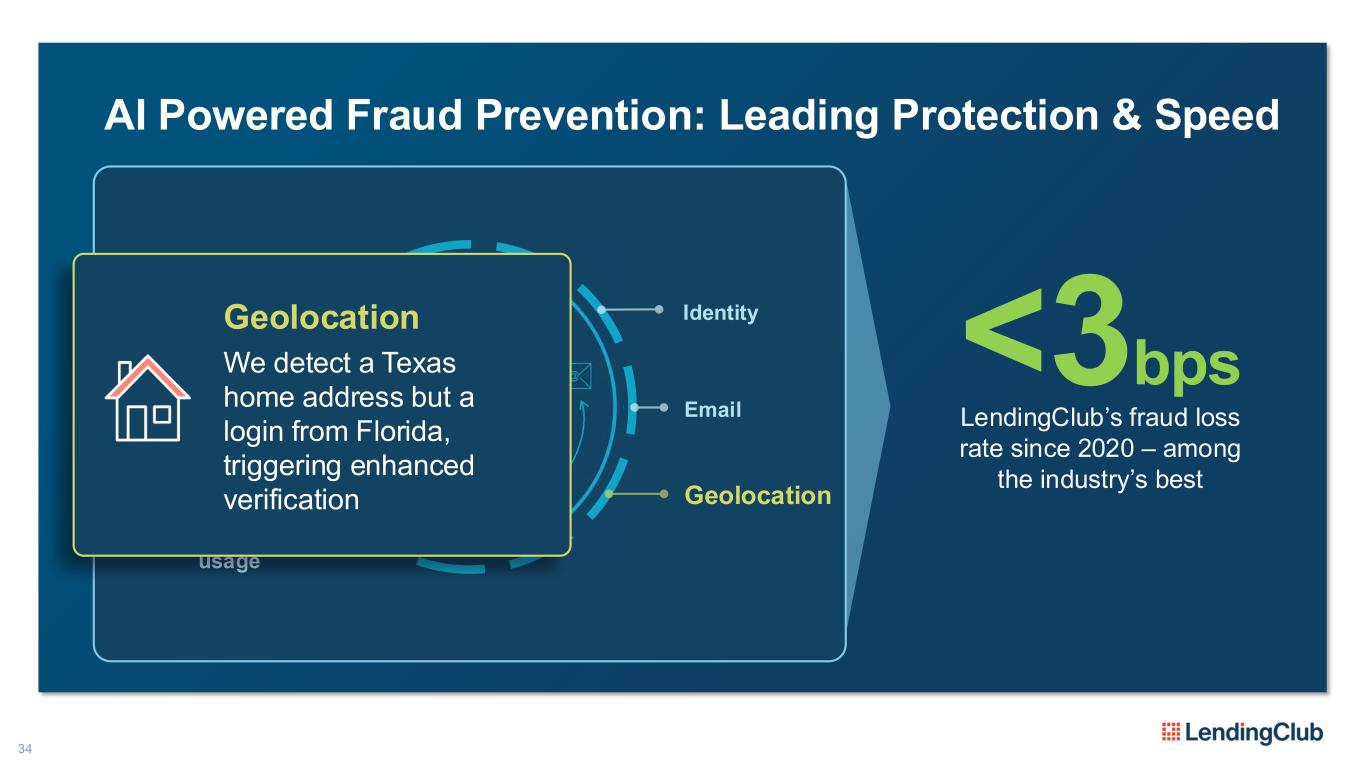
34 AI Powered Fraud Prevention: Leading Protection & Speed <3bps LendingClub’s fraud loss rate since 2020 – among the industry’s best Device identity Login behavior Bank patterns Geolocation Card usage Identity Email<1 sec Geolocation We detect a Texas home address but a login from Florida, triggering enhanced verification
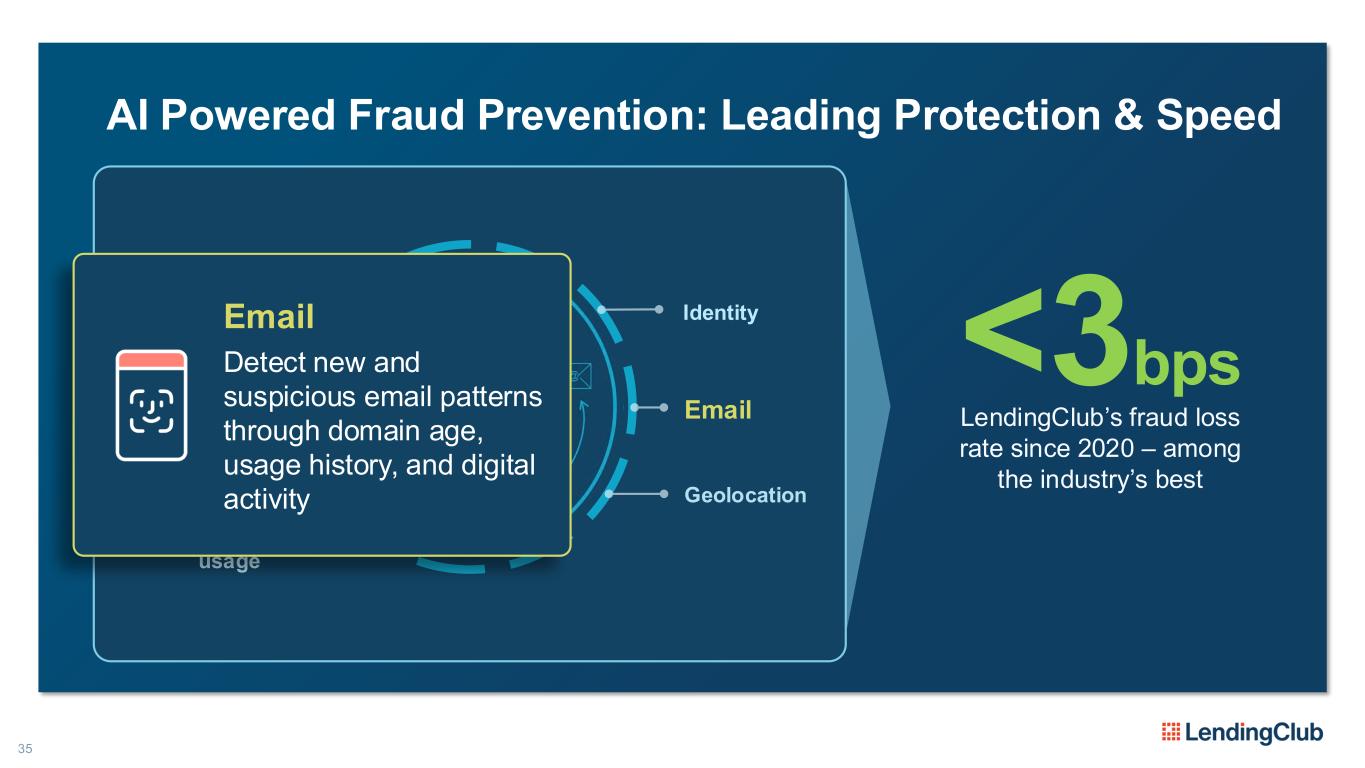
35 AI Powered Fraud Prevention: Leading Protection & Speed <3bps LendingClub’s fraud loss rate since 2020 – among the industry’s best Device identity Login behavior Bank patterns Geolocation Card usage Identity Email<1 sec Email Detect new and suspicious email patterns through domain age, usage history, and digital activity
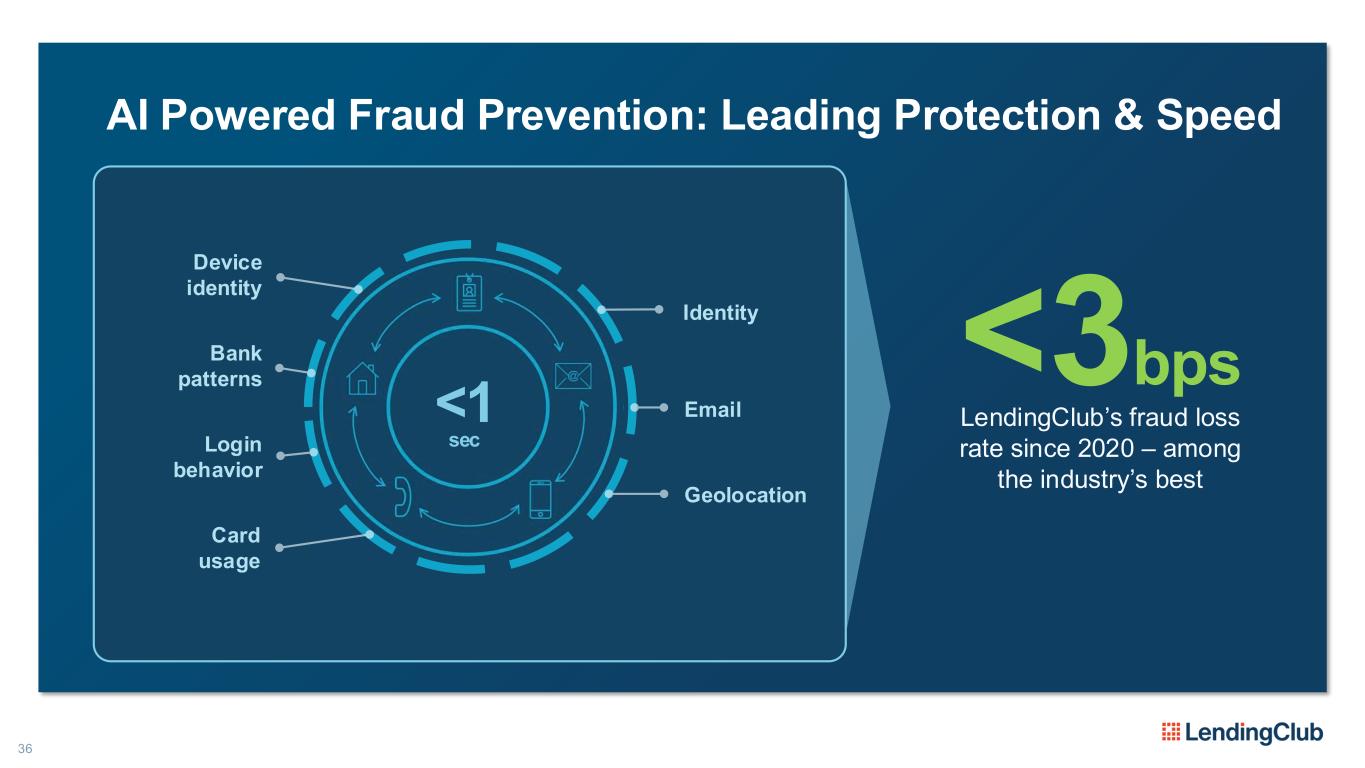
36 AI Powered Fraud Prevention: Leading Protection & Speed <3bps LendingClub’s fraud loss rate since 2020 – among the industry’s best Device identity Login behavior Bank patterns Geolocation Card usage Identity Email<1 sec
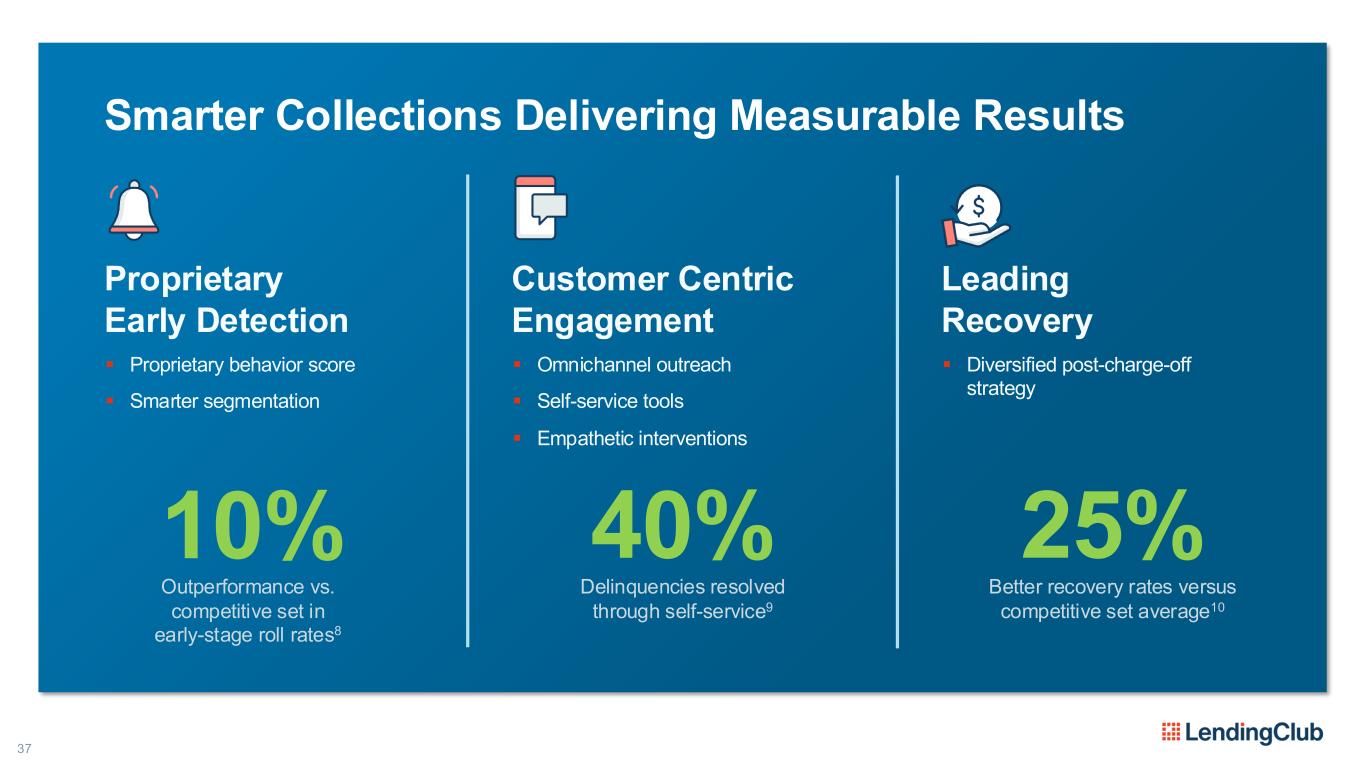
37 Smarter Collections Delivering Measurable Results Proprietary Early Detection ▪ Proprietary behavior score ▪ Smarter segmentation 10% Outperformance vs. competitive set in early-stage roll rates8 Customer Centric Engagement ▪ Omnichannel outreach ▪ Self-service tools ▪ Empathetic interventions 40% Delinquencies resolved through self-service9 Leading Recovery ▪ Diversified post-charge-off strategy 25% Better recovery rates versus competitive set average10
38 Data Driven. Tech Enabled. Artificial + Human Intelligence.

STEVE MATTICS CHIEF LENDING OFFICER Products that Attract Members for Life
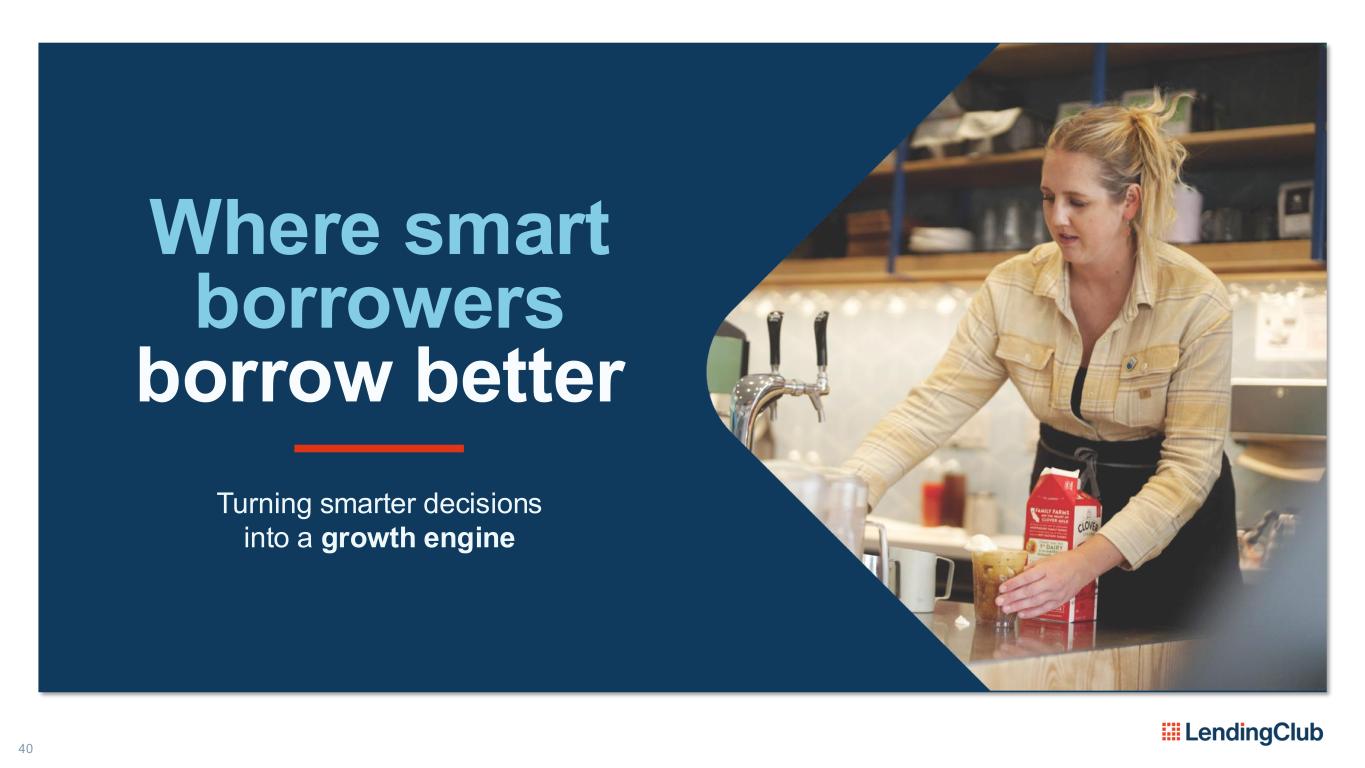
40 Where smart borrowers borrow better Turning smarter decisions into a growth engine
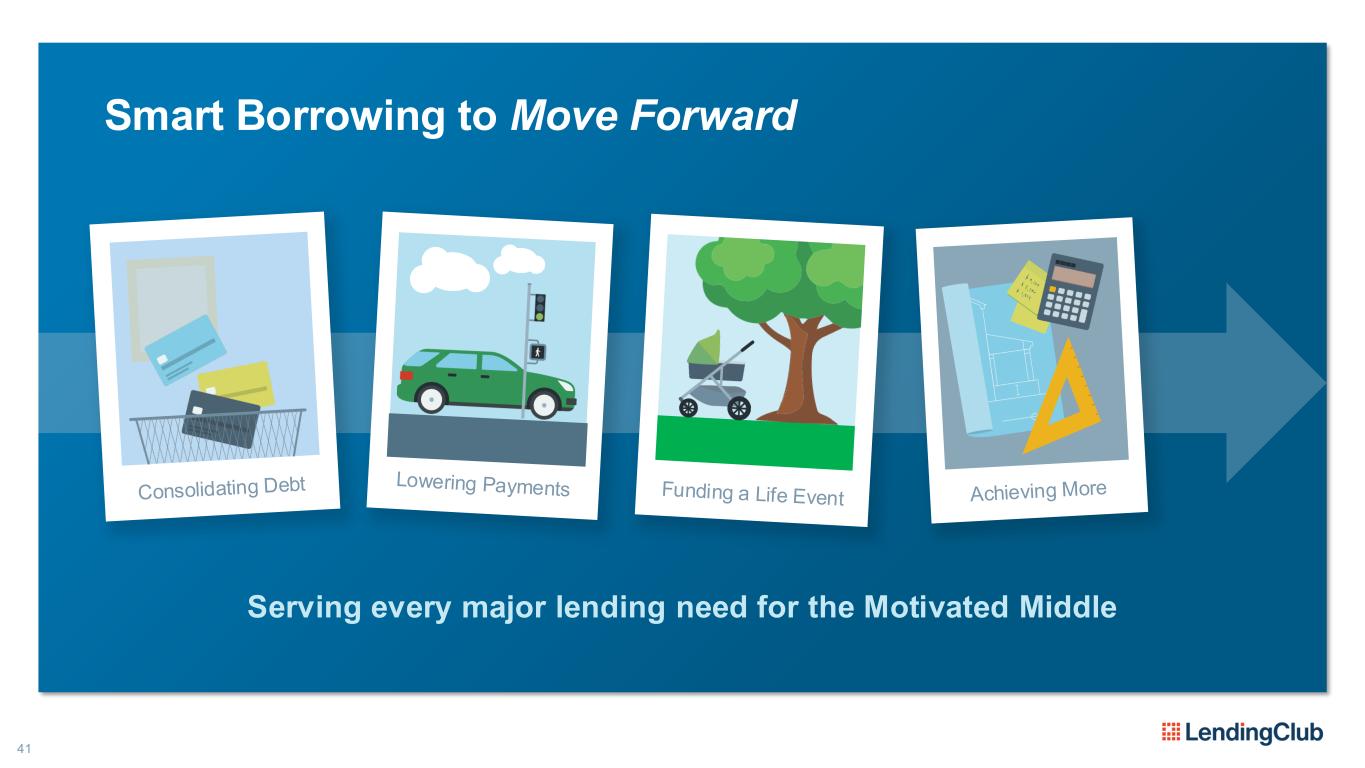
41 Smart Borrowing to Move Forward Serving every major lending need for the Motivated Middle
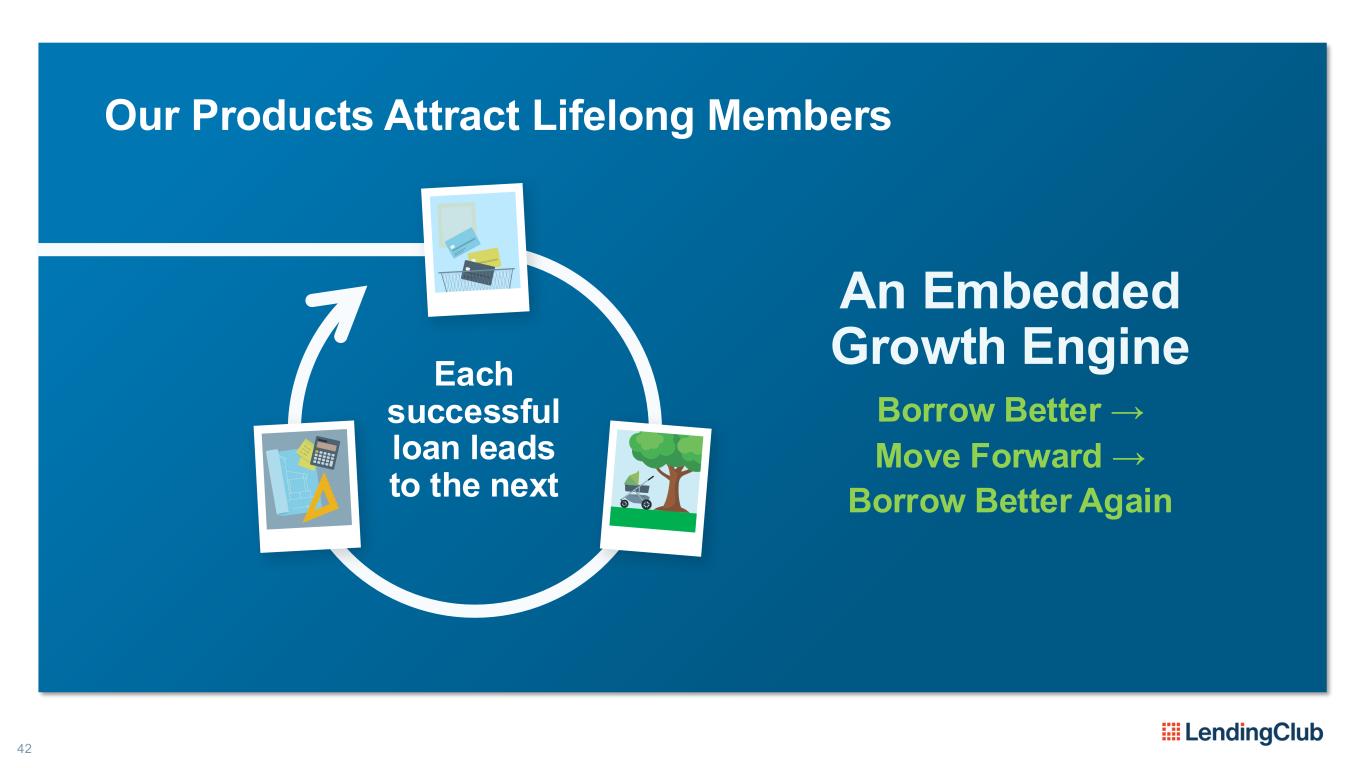
42 Our Products Attract Lifelong Members Each successful loan leads to the next An Embedded Growth Engine Borrow Better → Move Forward → Borrow Better Again
43 Debt Consolidation Is How We Scaled Our Core Business PERSONAL LOANS
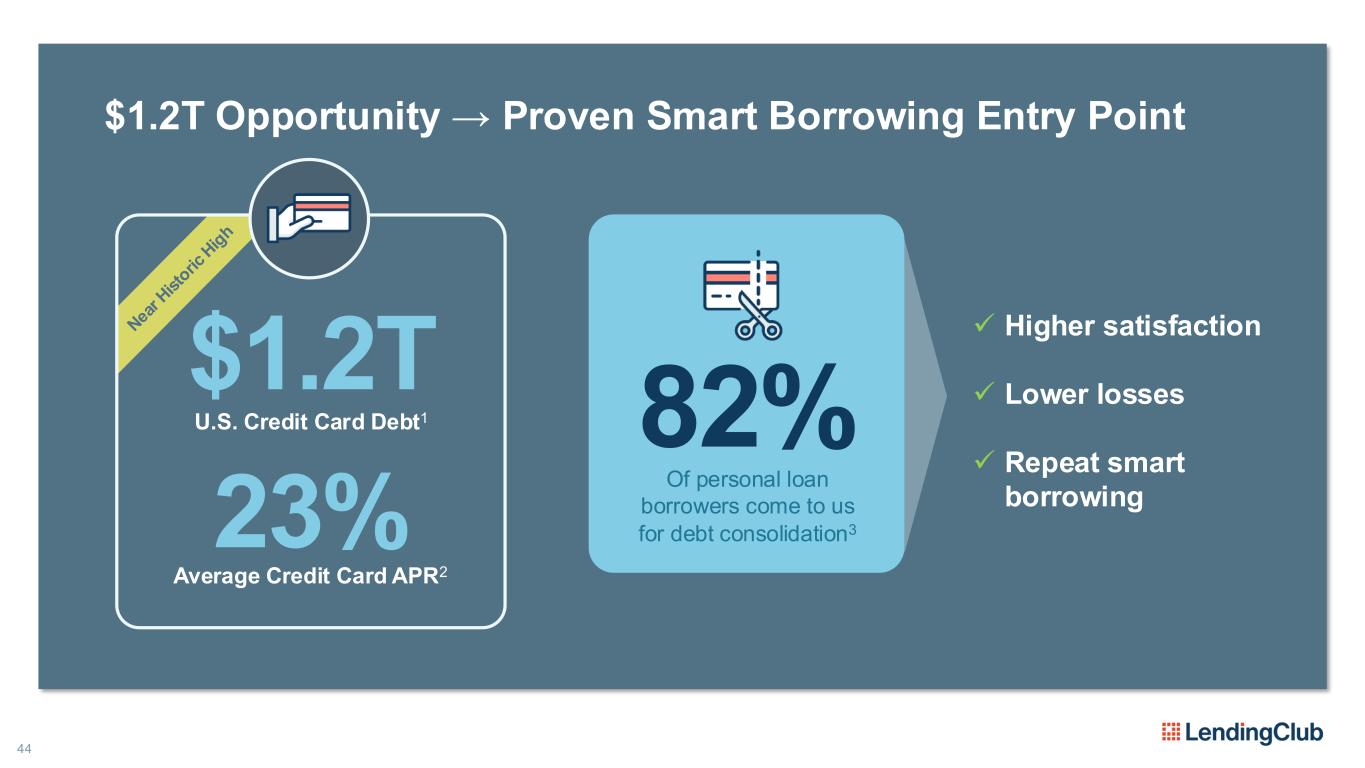
44 $1.2T Opportunity → Proven Smart Borrowing Entry Point U.S. Credit Card Debt1 $1.2T 82% Of personal loan borrowers come to us for debt consolidation3 ✓ Higher satisfaction ✓ Lower losses ✓ Repeat smart borrowing Average Credit Card APR2 23%
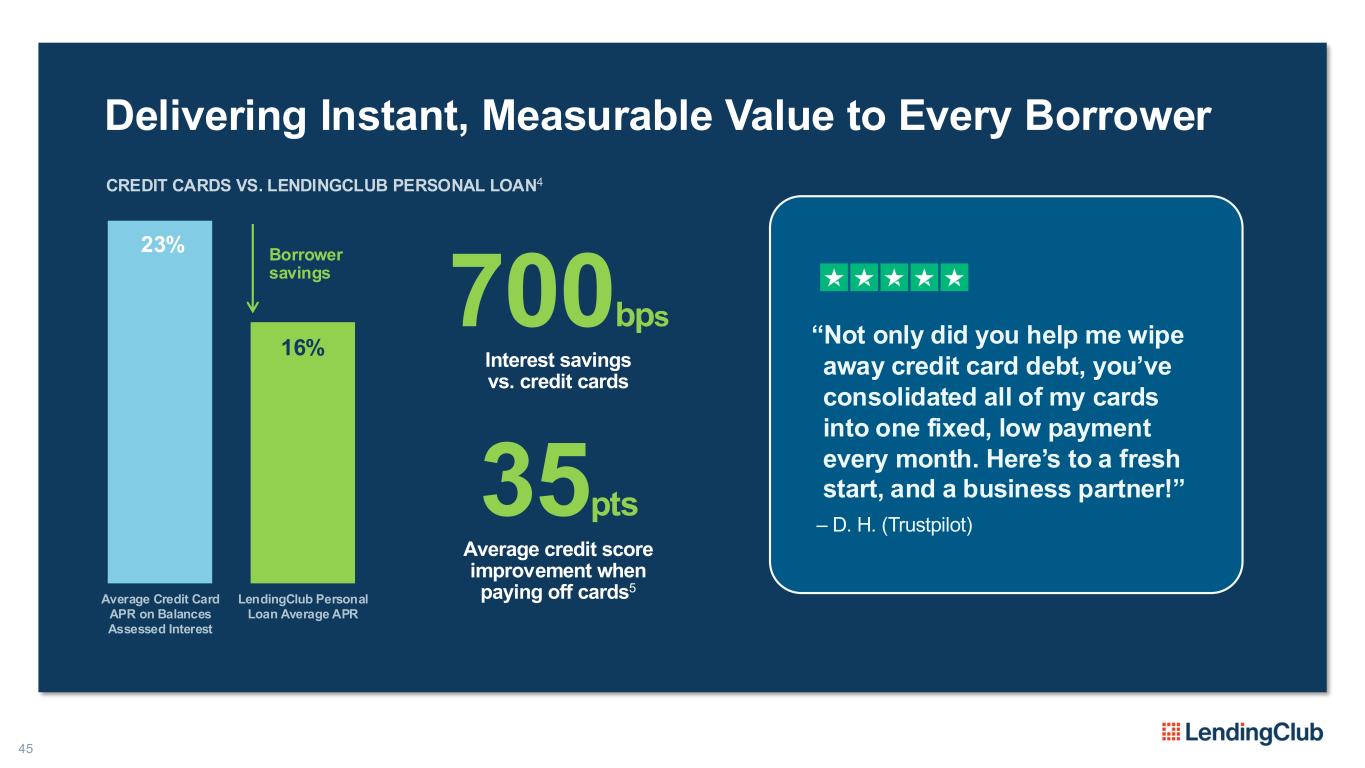
45 Delivering Instant, Measurable Value to Every Borrower “Not only did you help me wipe away credit card debt, you’ve consolidated all of my cards into one fixed, low payment every month. Here’s to a fresh start, and a business partner!” – D. H. (Trustpilot) 23% 16% Average Credit Card APR on Balances Assessed Interest LendingClub Personal Loan Average APR CREDIT CARDS VS. LENDINGCLUB PERSONAL LOAN4 700bps Interest savings vs. credit cards 35pts Average credit score improvement when paying off cards5 Borrower savings
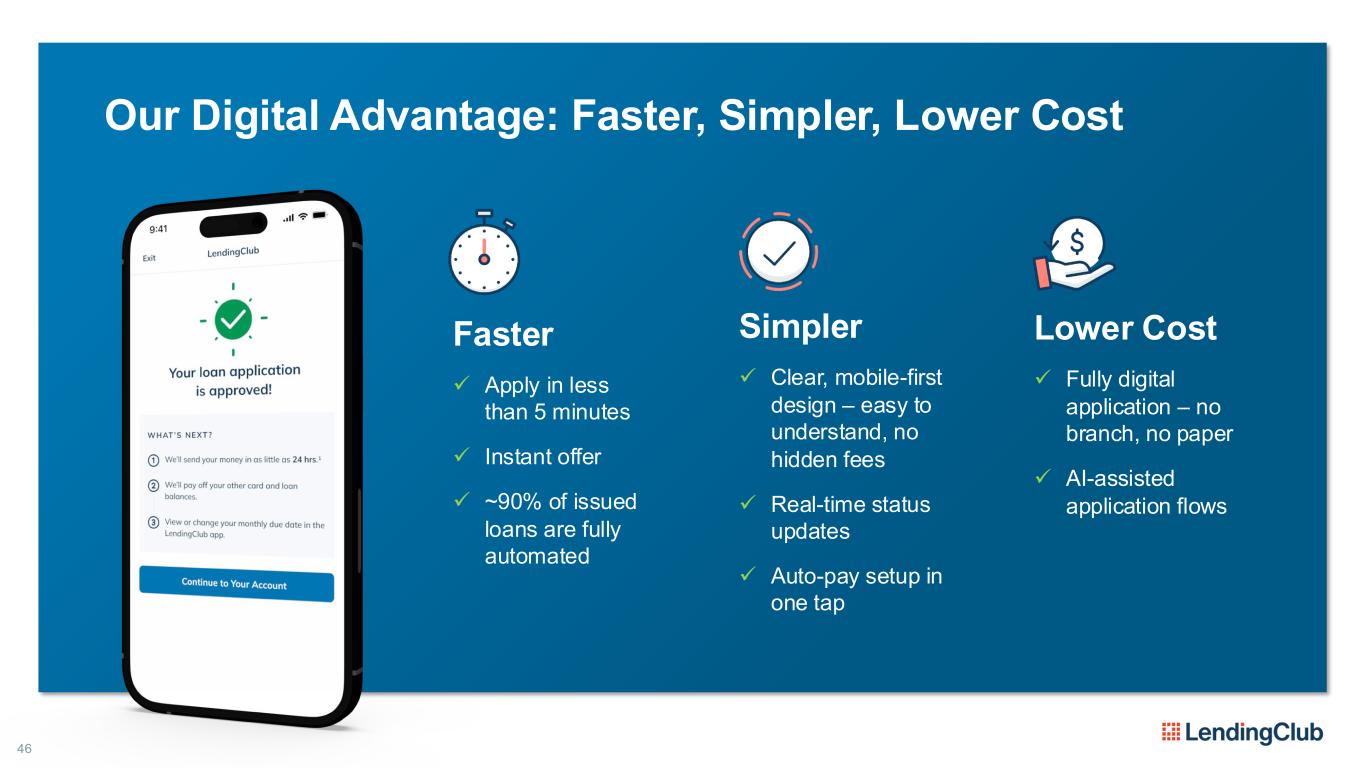
46 Our Digital Advantage: Faster, Simpler, Lower Cost Faster ✓ Apply in less than 5 minutes ✓ Instant offer ✓ ~90% of issued loans are fully automated Simpler ✓ Clear, mobile-first design – easy to understand, no hidden fees ✓ Real-time status updates ✓ Auto-pay setup in one tap Lower Cost ✓ Fully digital application – no branch, no paper ✓ AI-assisted application flows
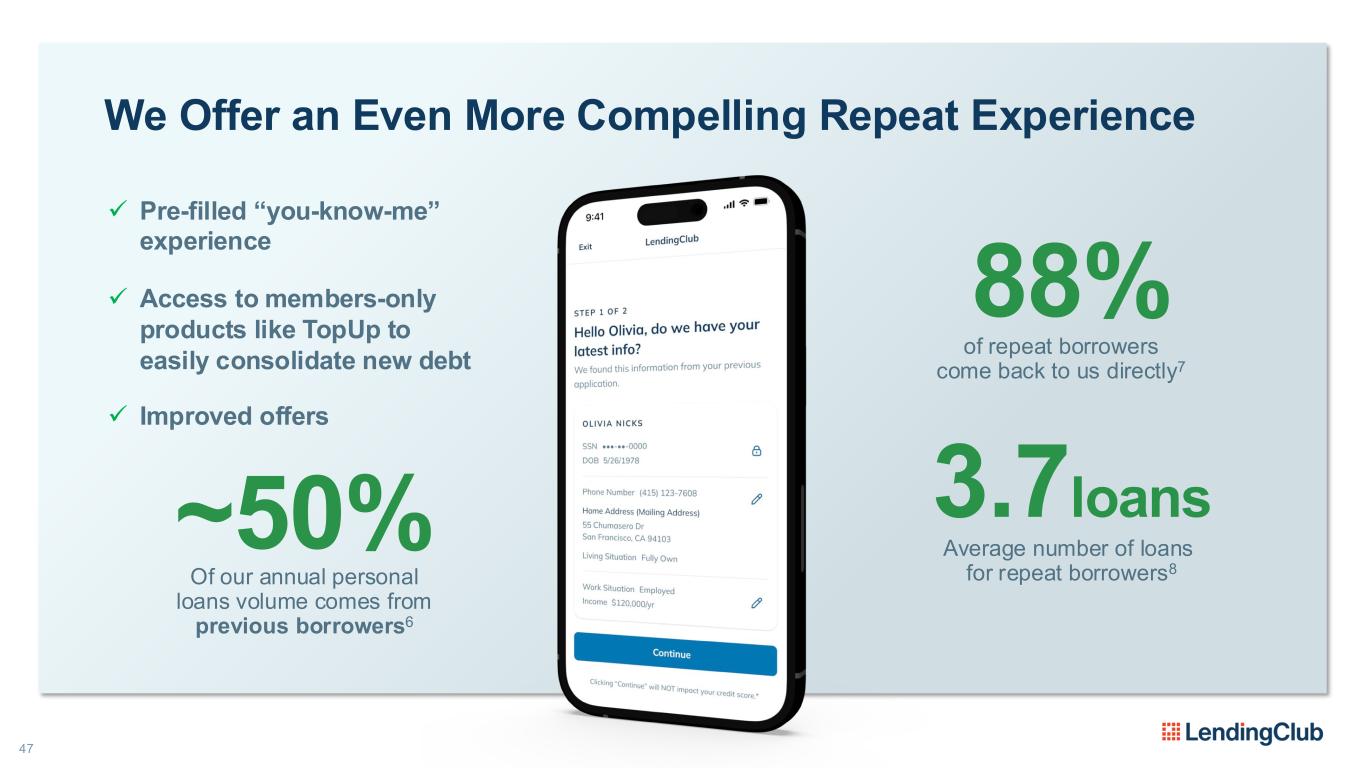
47 We Offer an Even More Compelling Repeat Experience ~50% Of our annual personal loans volume comes from previous borrowers6 3.7loans Average number of loans for repeat borrowers8 ✓ Pre-filled “you-know-me” experience ✓ Access to members-only products like TopUp to easily consolidate new debt ✓ Improved offers of repeat borrowers come back to us directly7 88%
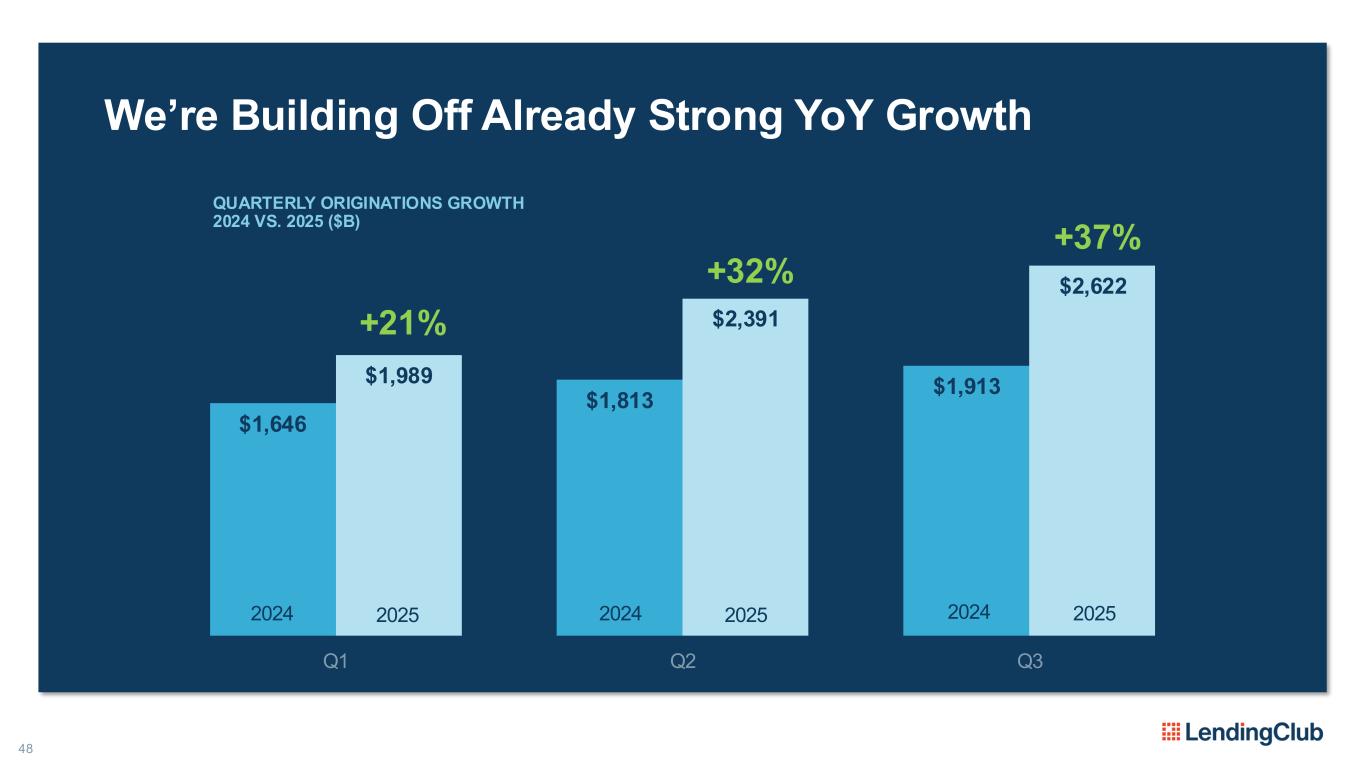
48 We’re Building Off Already Strong YoY Growth $1,646 $1,813 $1,913 $1,989 $2,391 $2,622 Q1 Q2 Q3 QUARTERLY ORIGINATIONS GROWTH 2024 VS. 2025 ($B) +21% +32% +37% 2024 2025 2024 2025 2024 2025
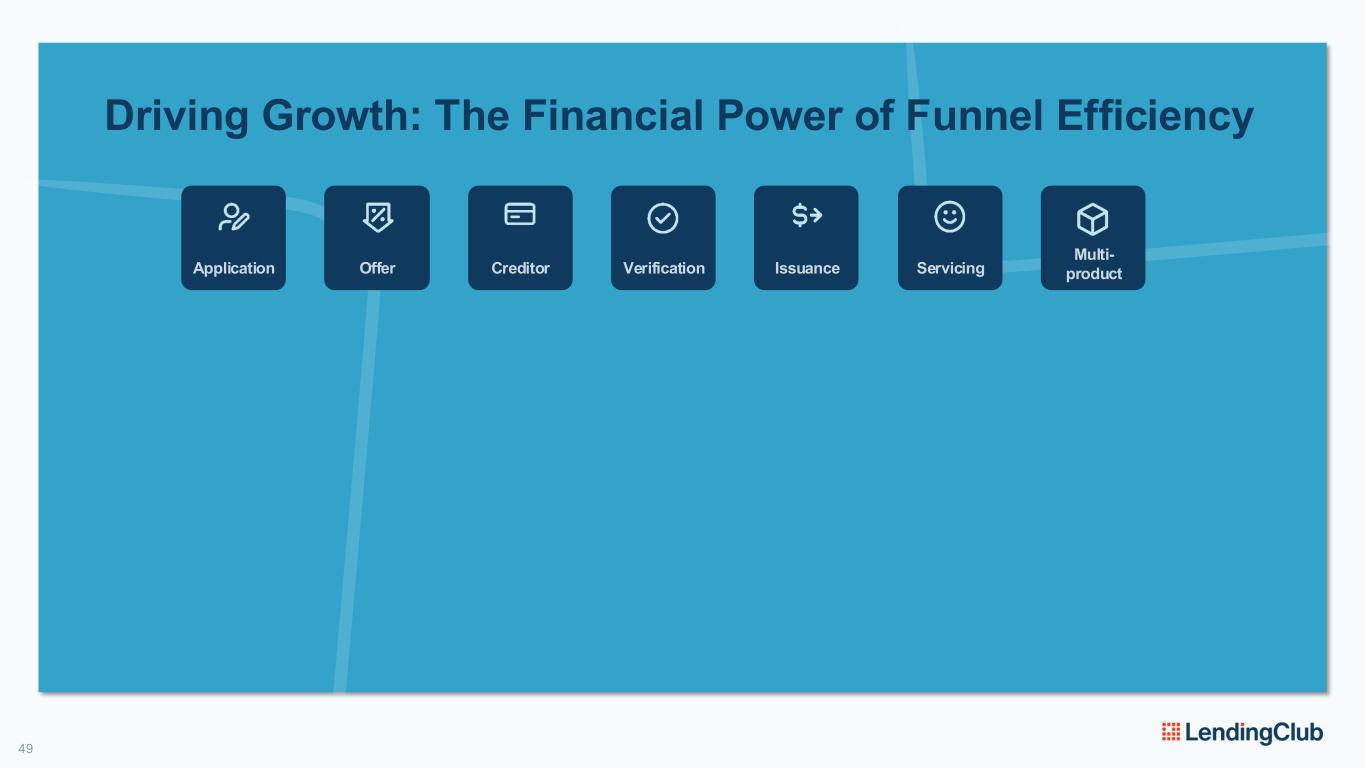
49 Driving Growth: The Financial Power of Funnel Efficiency Application Offer Creditor Verification Issuance Servicing Multi- product
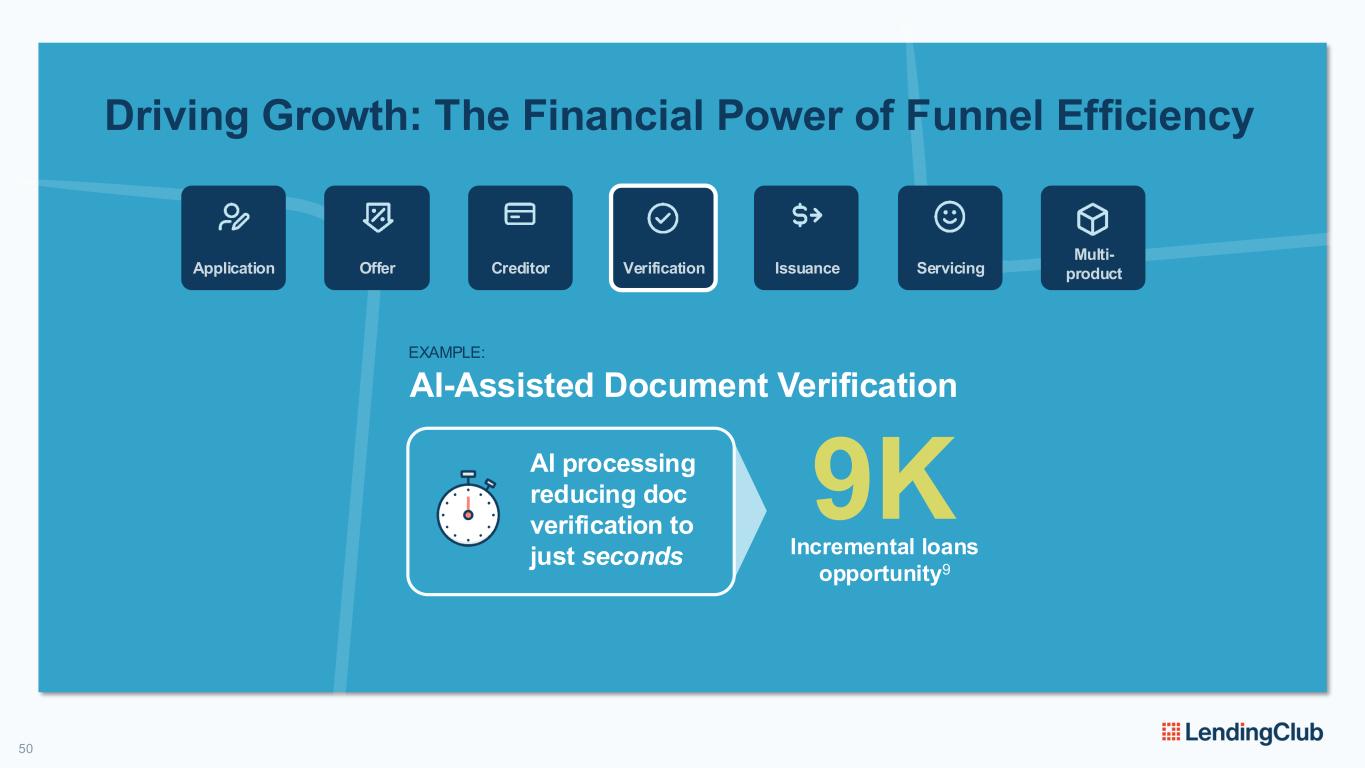
50 Driving Growth: The Financial Power of Funnel Efficiency Application Offer Creditor Verification Issuance Servicing Multi- product EXAMPLE: AI-Assisted Document Verification AI processing reducing doc verification to just seconds 9K Incremental loans opportunity9
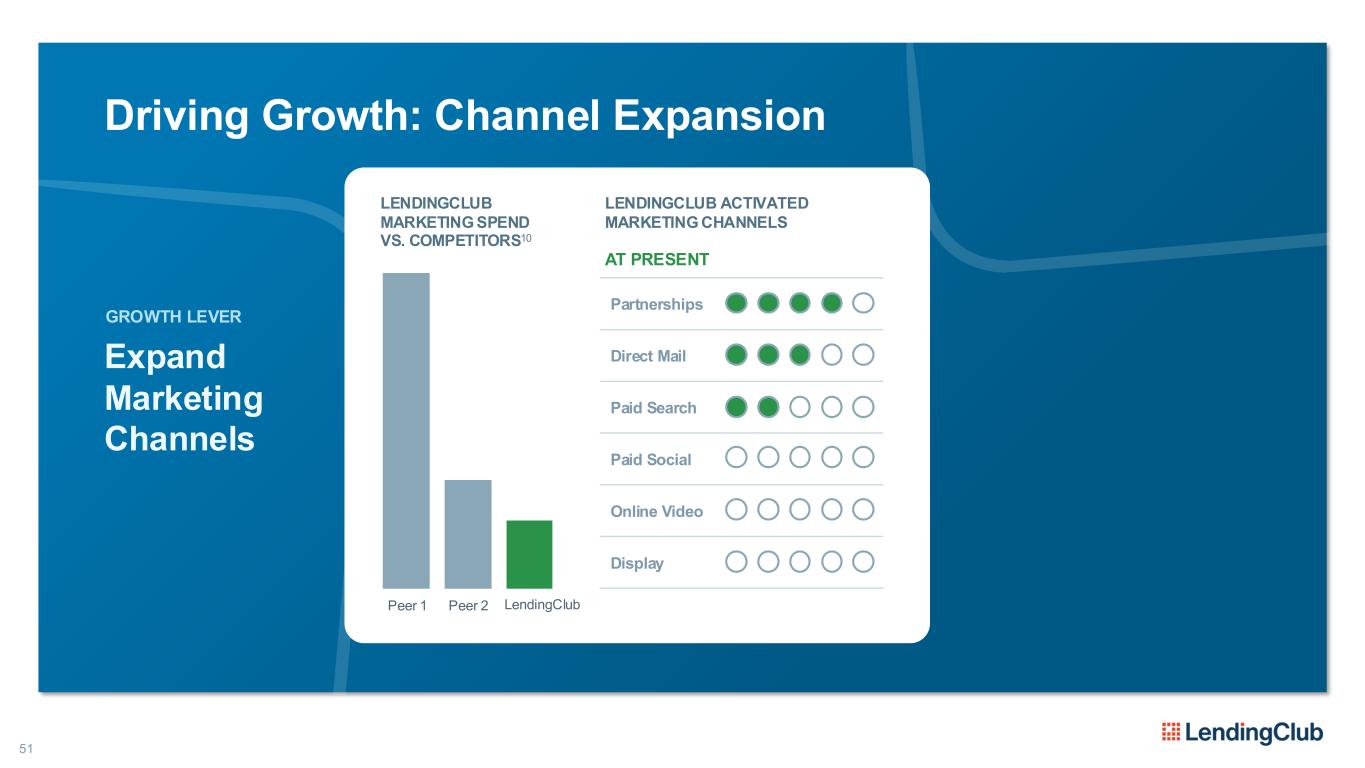
Partnerships Direct Mail Paid Search Paid Social Online Video Display 51 Driving Growth: Channel Expansion LENDINGCLUB MARKETING SPEND VS. COMPETITORS10 Peer 1 Peer 2 LendingClub LENDINGCLUB ACTIVATED MARKETING CHANNELS AT PRESENT Expand Marketing Channels GROWTH LEVER
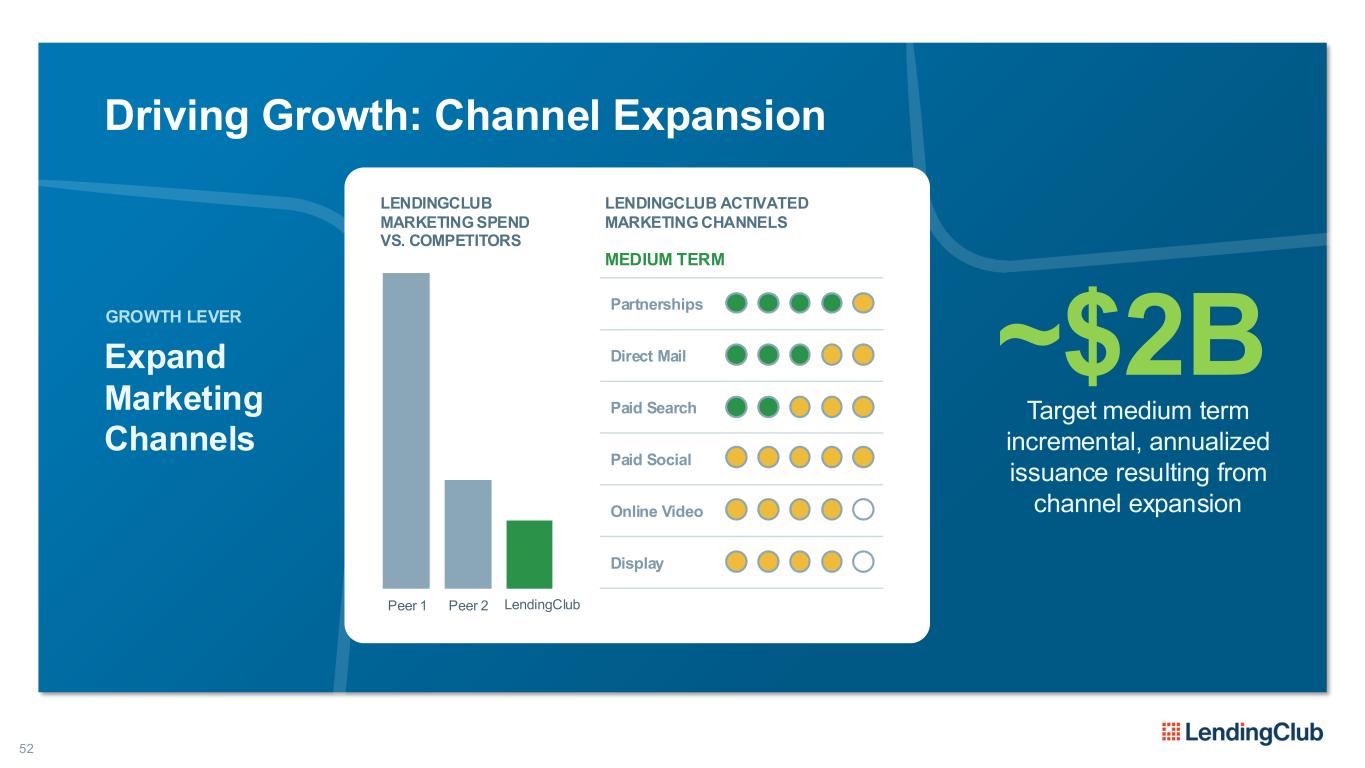
52 Driving Growth: Channel Expansion LENDINGCLUB MARKETING SPEND VS. COMPETITORS ~$2B Target medium term incremental, annualized issuance resulting from channel expansion Peer 1 Peer 2 LendingClub LENDINGCLUB ACTIVATED MARKETING CHANNELS MEDIUM TERM Expand Marketing Channels GROWTH LEVER Partnerships Direct Mail Paid Search Paid Social Online Video Display
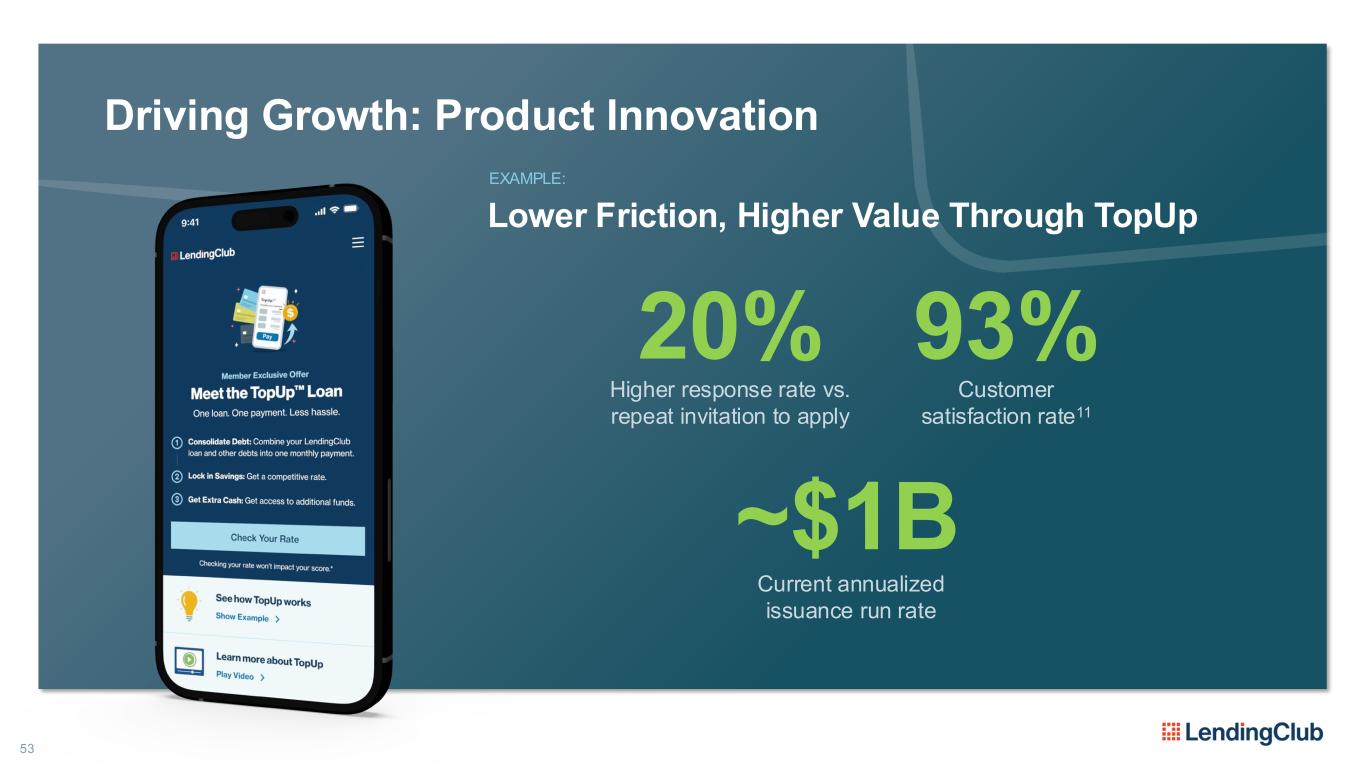
53 Driving Growth: Product Innovation 20% ~$1B Current annualized issuance run rate Higher response rate vs. repeat invitation to apply 93% Customer satisfaction rate11 EXAMPLE: Lower Friction, Higher Value Through TopUp
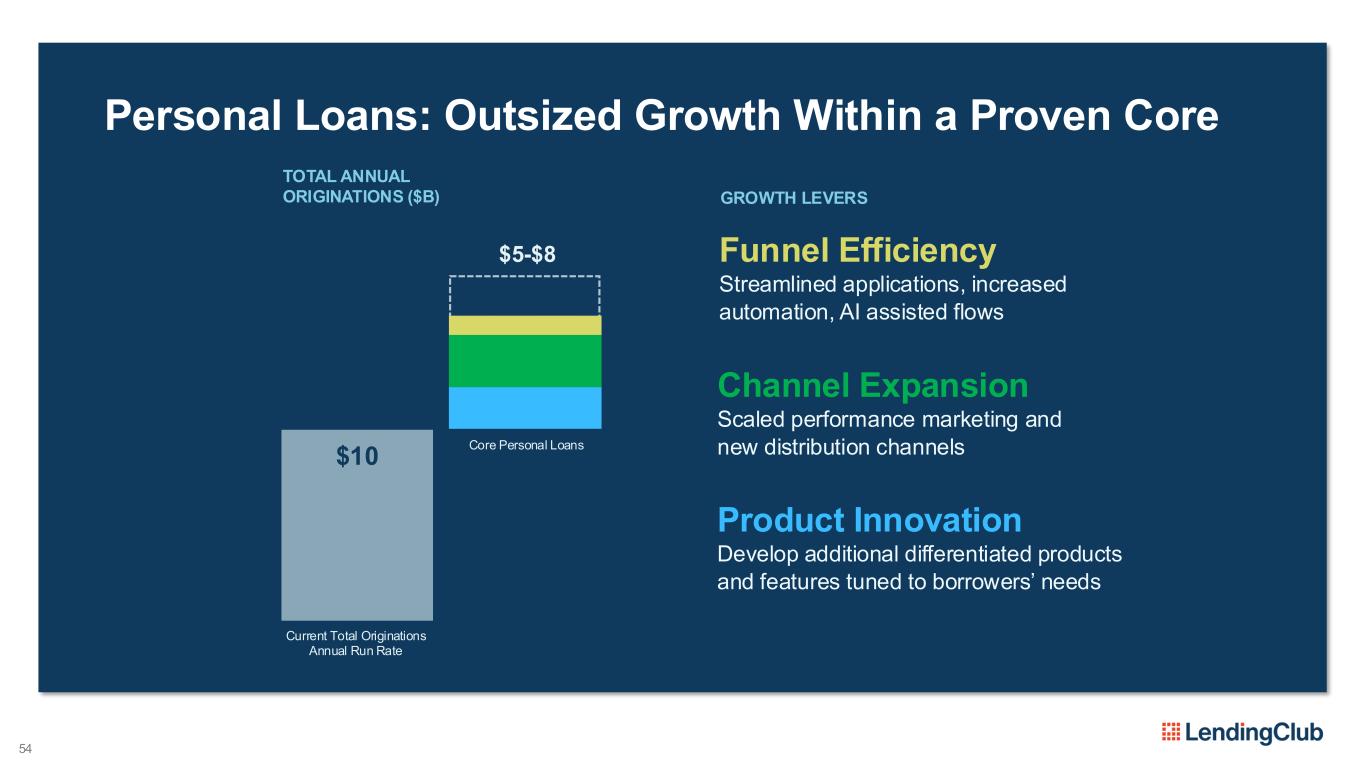
54 Personal Loans: Outsized Growth Within a Proven Core $10 Current Total Originations Annual Run Rate Core Personal Loans TOTAL ANNUAL ORIGINATIONS ($B) GROWTH LEVERS Product Innovation Develop additional differentiated products and features tuned to borrowers’ needs Funnel Efficiency Streamlined applications, increased automation, AI assisted flows Channel Expansion Scaled performance marketing and new distribution channels $5-$8
55 A Natural Extension of Our Lending Advantage AUTO REFINANCE
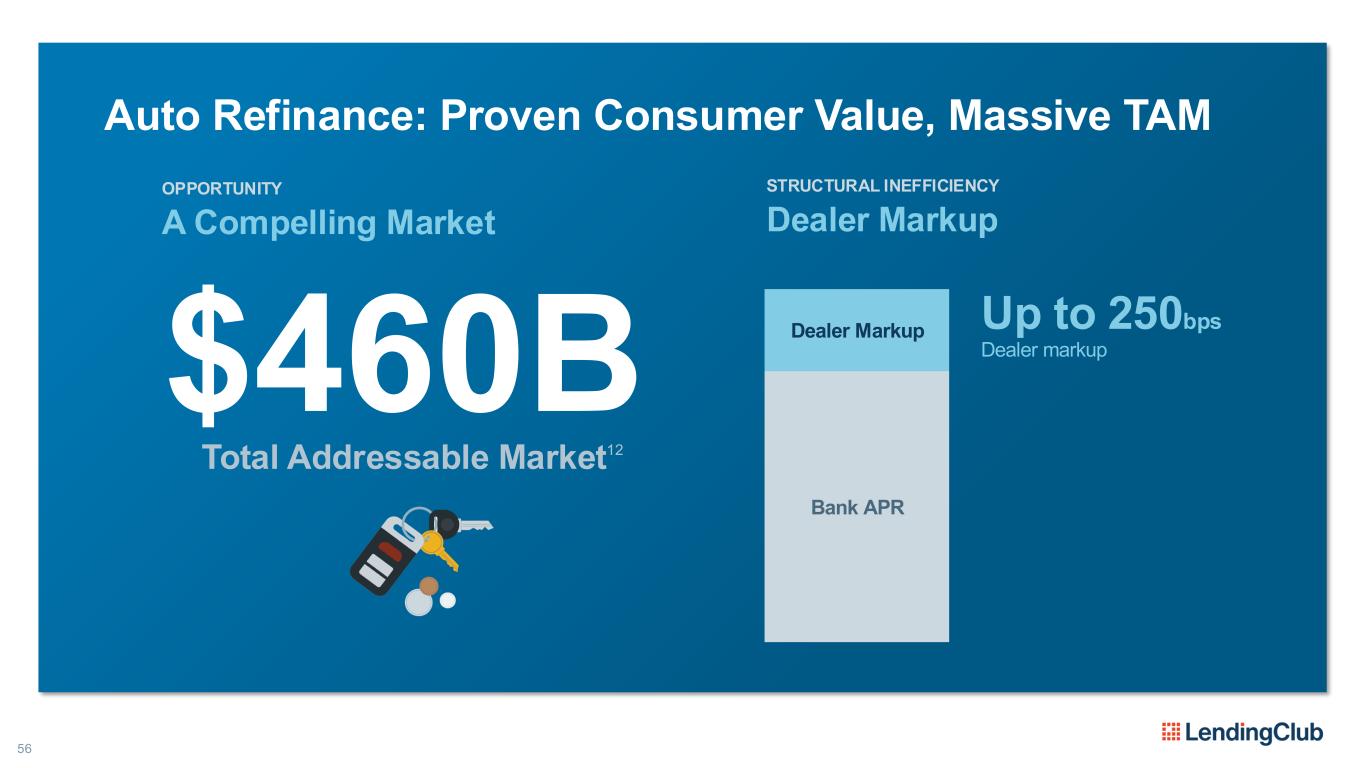
56 Auto Refinance: Proven Consumer Value, Massive TAM Bank APR STRUCTURAL INEFFICIENCY Dealer Markup Dealer Markup Up to 250bps Dealer markup OPPORTUNITY A Compelling Market $460B Total Addressable Market12
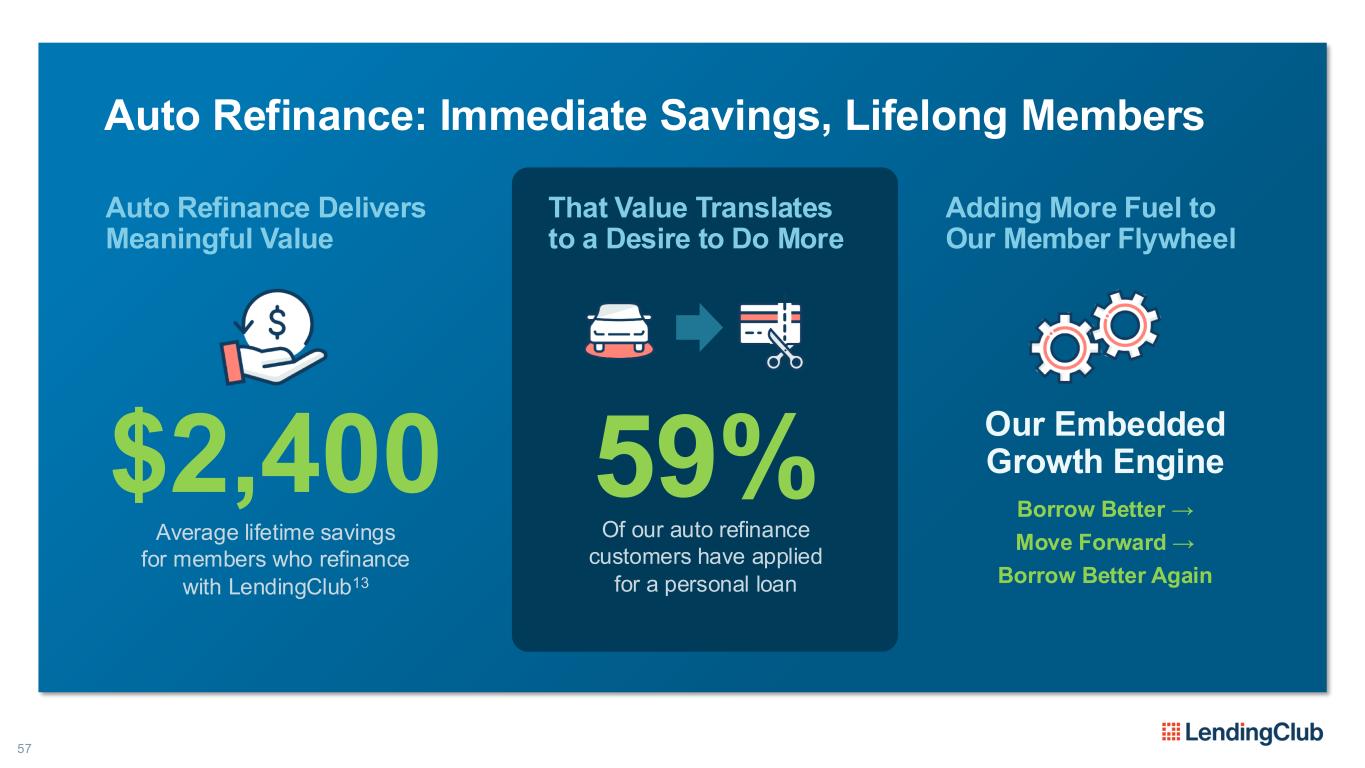
57 Auto Refinance: Immediate Savings, Lifelong Members 59% Of our auto refinance customers have applied for a personal loan Auto Refinance Delivers Meaningful Value That Value Translates to a Desire to Do More Adding More Fuel to Our Member Flywheel Our Embedded Growth Engine Borrow Better → Move Forward → Borrow Better Again $2,400 Average lifetime savings for members who refinance with LendingClub13
58 B2B2C Lending for Life’s Important Choices MAJOR PURCHASE FINANCE
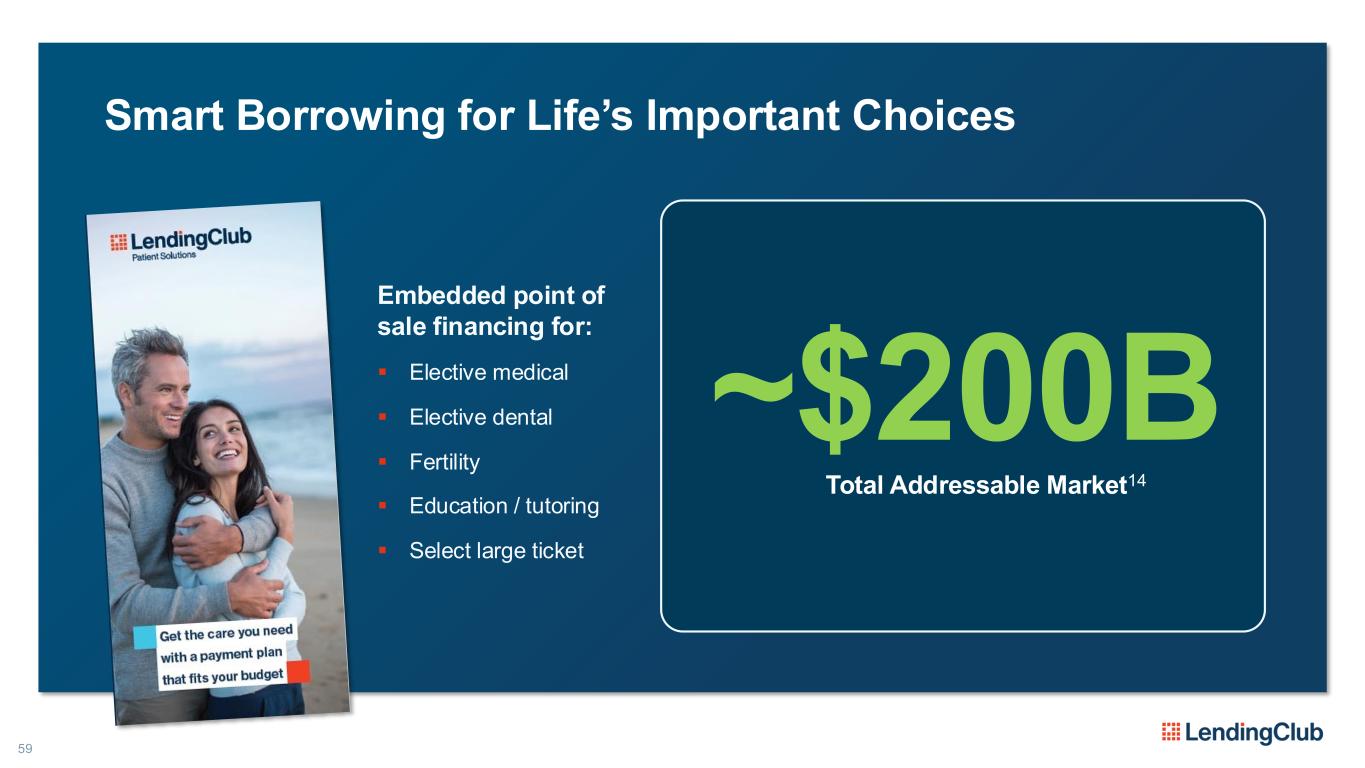
59 Smart Borrowing for Life’s Important Choices Embedded point of sale financing for: ▪ Elective medical ▪ Elective dental ▪ Fertility ▪ Education / tutoring ▪ Select large ticket Total Addressable Market14 ~$200B
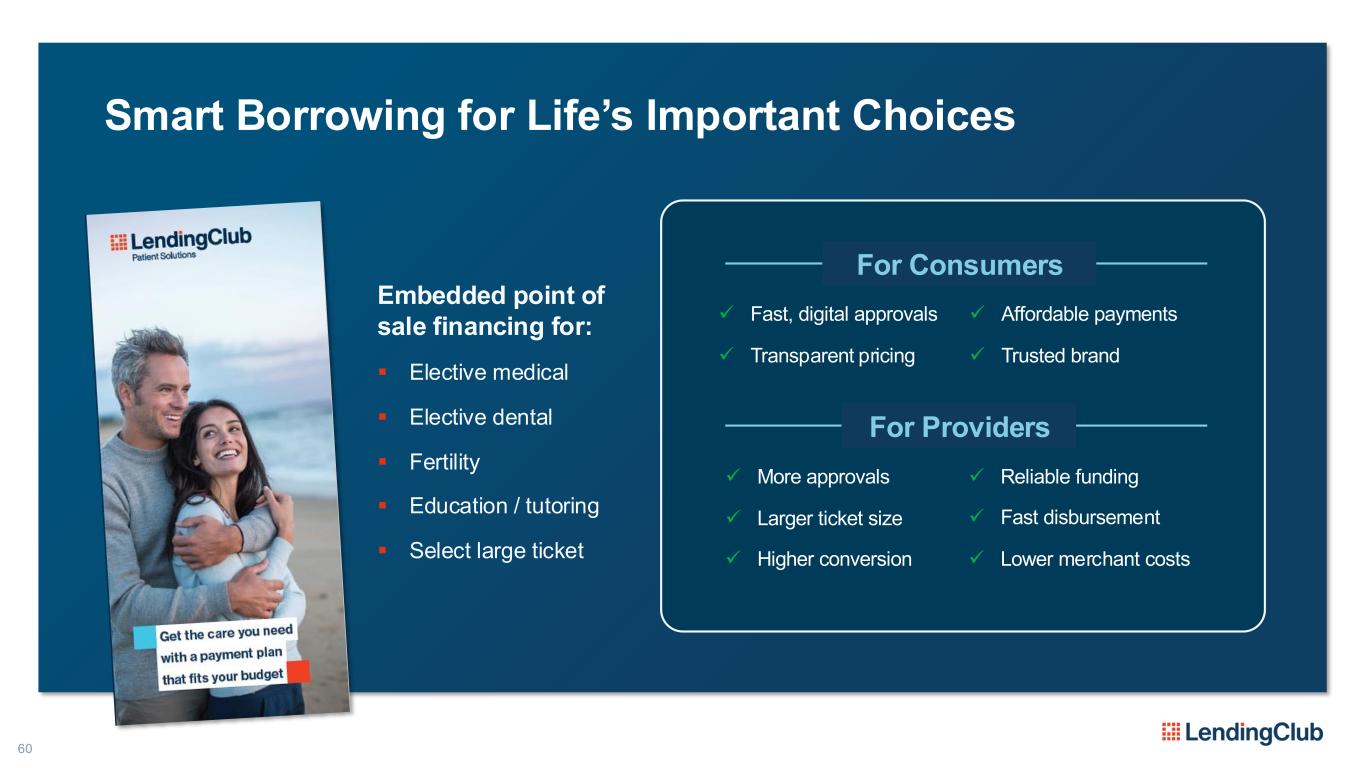
60 Smart Borrowing for Life’s Important Choices Embedded point of sale financing for: ▪ Elective medical ▪ Elective dental ▪ Fertility ▪ Education / tutoring ▪ Select large ticket ✓ Fast, digital approvals ✓ Transparent pricing ✓ Affordable payments ✓ Trusted brand For Consumers For Providers ✓ More approvals ✓ Larger ticket size ✓ Higher conversion ✓ Reliable funding ✓ Fast disbursement ✓ Lower merchant costs
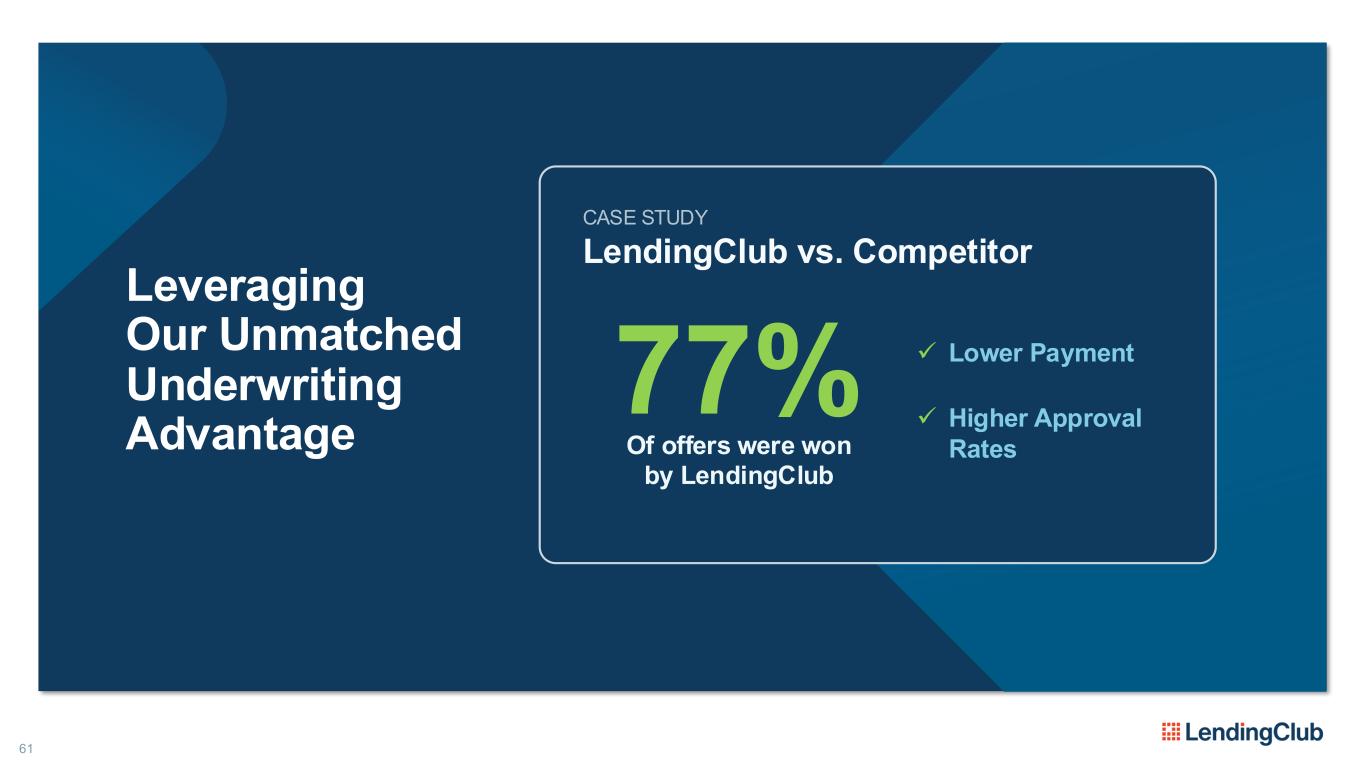
Leveraging Our Unmatched Underwriting Advantage 61 CASE STUDY LendingClub vs. Competitor 77% Of offers were won by LendingClub ✓ Lower Payment ✓ Higher Approval Rates
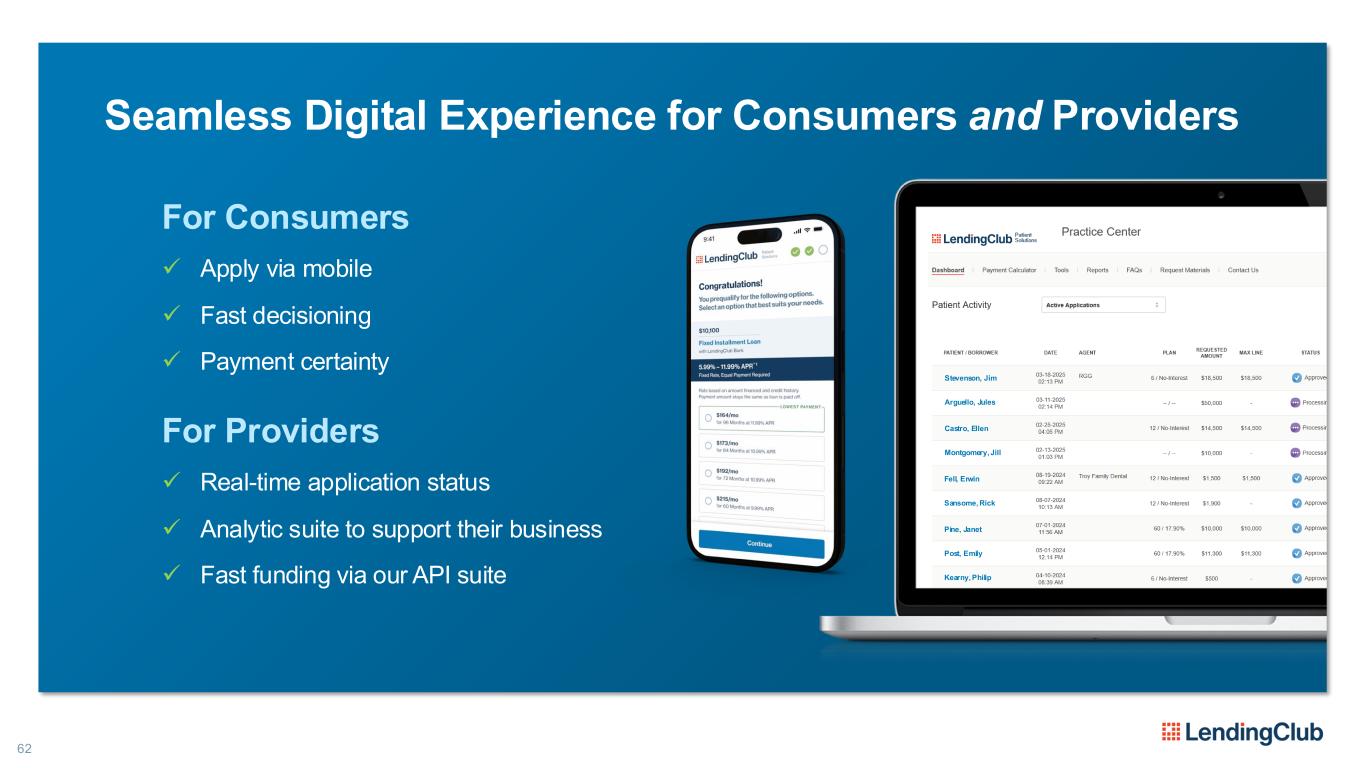
62 Seamless Digital Experience for Consumers and Providers For Consumers ✓ Apply via mobile ✓ Fast decisioning ✓ Payment certainty For Providers ✓ Real-time application status ✓ Analytic suite to support their business ✓ Fast funding via our API suite Stevenson, Jim Arguello, Jules Castro, Ellen Montgomery, Jill Fell, Erwin Sansome, Rick Pine, Janet Post, Emily Kearny, Philip
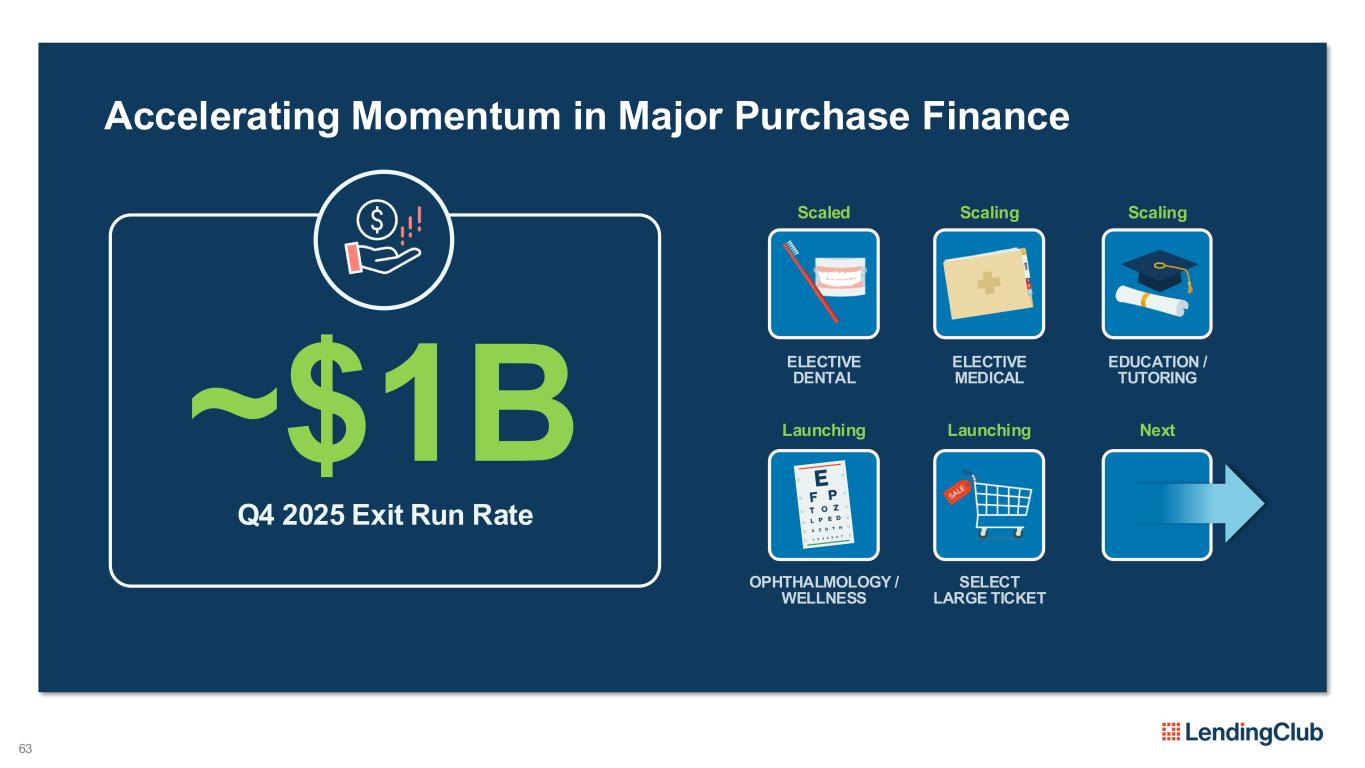
63 Accelerating Momentum in Major Purchase Finance ELECTIVE DENTAL ELECTIVE MEDICAL EDUCATION / TUTORING SELECT LARGE TICKET Scaled Scaling Scaling OPHTHALMOLOGY / WELLNESS Launching Launching~$1B Q4 2025 Exit Run Rate Next
64 Home Improvement: Our Next Major Scalable Adjacency HOME IMPROVEMENT FINANCING
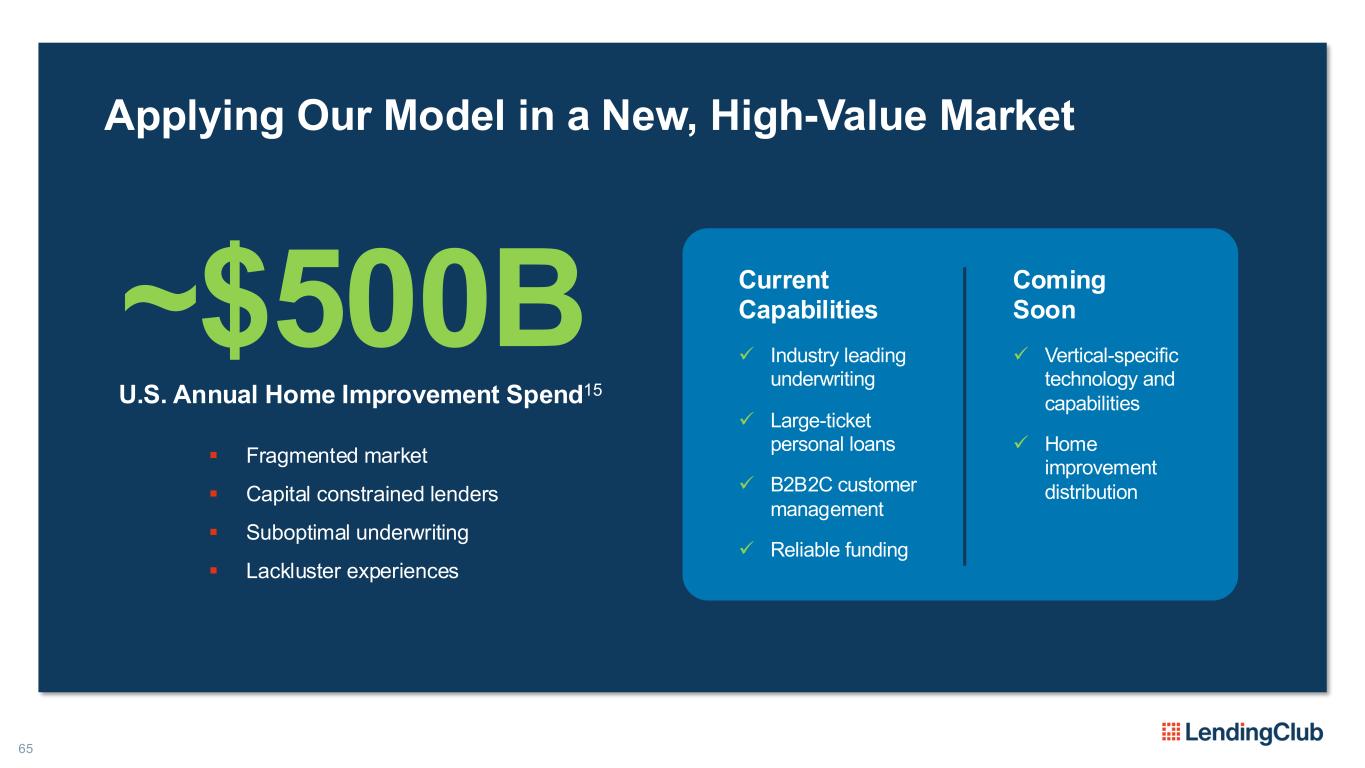
65 Applying Our Model in a New, High-Value Market Current Capabilities ✓ Industry leading underwriting ✓ Large-ticket personal loans ✓ B2B2C customer management ✓ Reliable funding U.S. Annual Home Improvement Spend15 ~$500B ▪ Fragmented market ▪ Capital constrained lenders ▪ Suboptimal underwriting ▪ Lackluster experiences Coming Soon ✓ Vertical-specific technology and capabilities ✓ Home improvement distribution
66 Jumpstarting Our Entry Acquired foundational technology New key strategic partnership
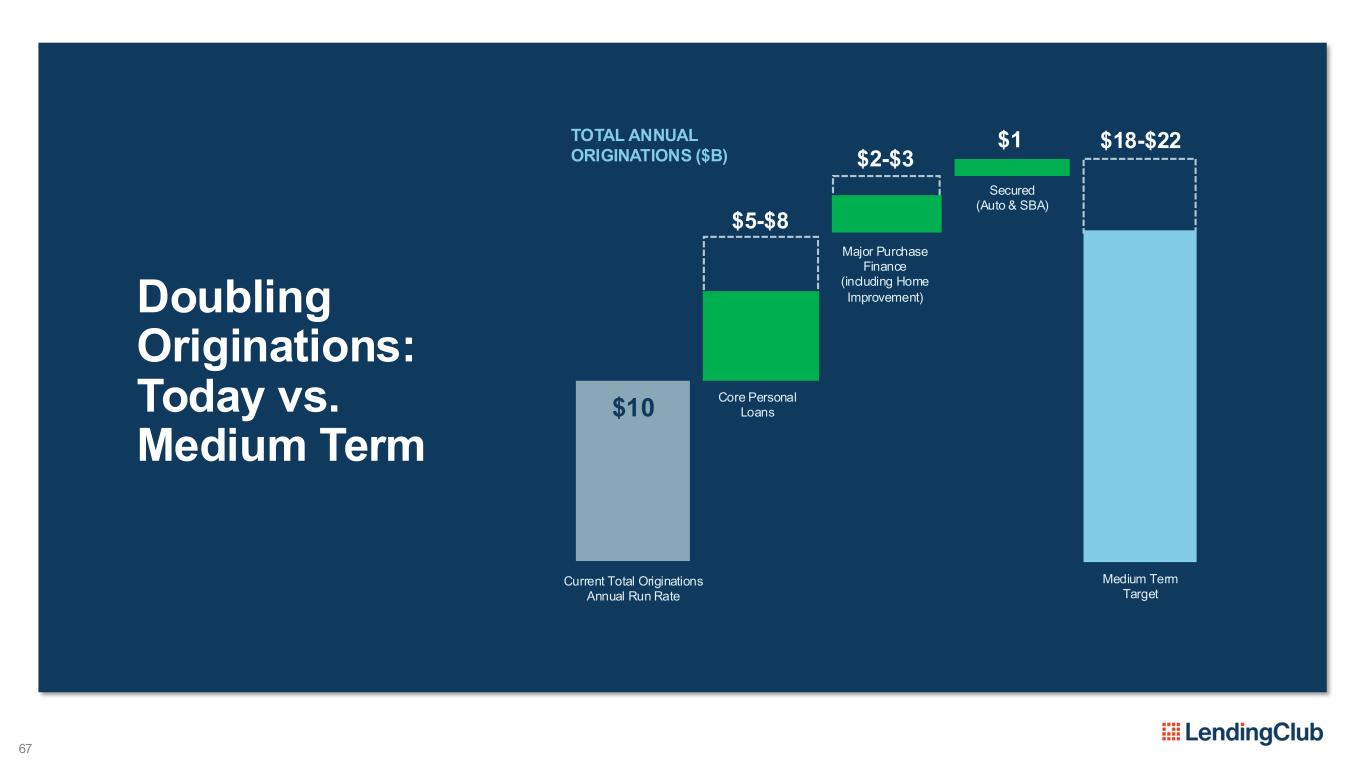
67 Doubling Originations: Today vs. Medium Term TOTAL ANNUAL ORIGINATIONS ($B) $10 Current Total Originations Annual Run Rate Core Personal Loans Secured (Auto & SBA) Major Purchase Finance (including Home Improvement) $5-$8 $1 $2-$3 Medium Term Target $18-$22
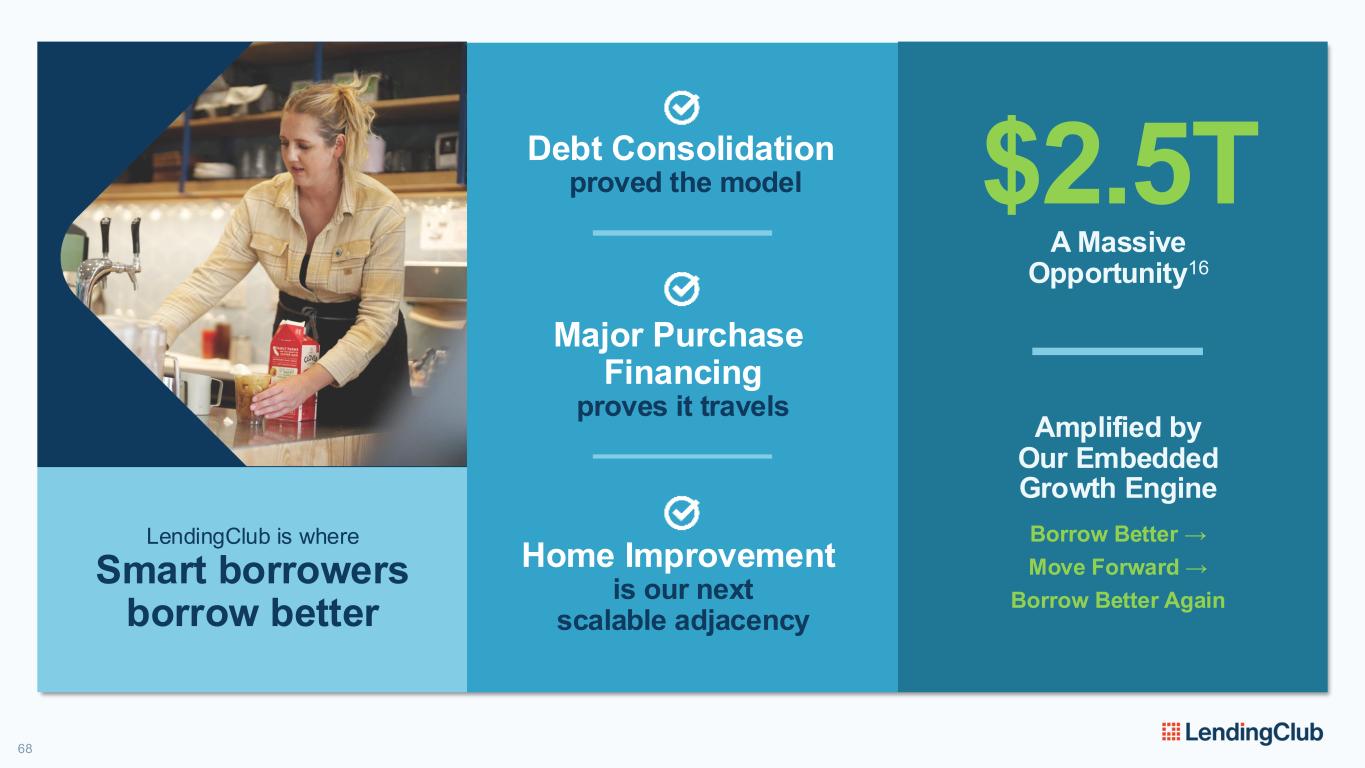
68 LendingClub is where Smart borrowers borrow better Debt Consolidation proved the model Home Improvement is our next scalable adjacency Major Purchase Financing proves it travels Amplified by Our Embedded Growth Engine Borrow Better → Move Forward → Borrow Better Again A Massive Opportunity16 $2.5T
Experiences that Keep Members Coming Back MARK ELLIOT CHIEF CUSTOMER OFFICER
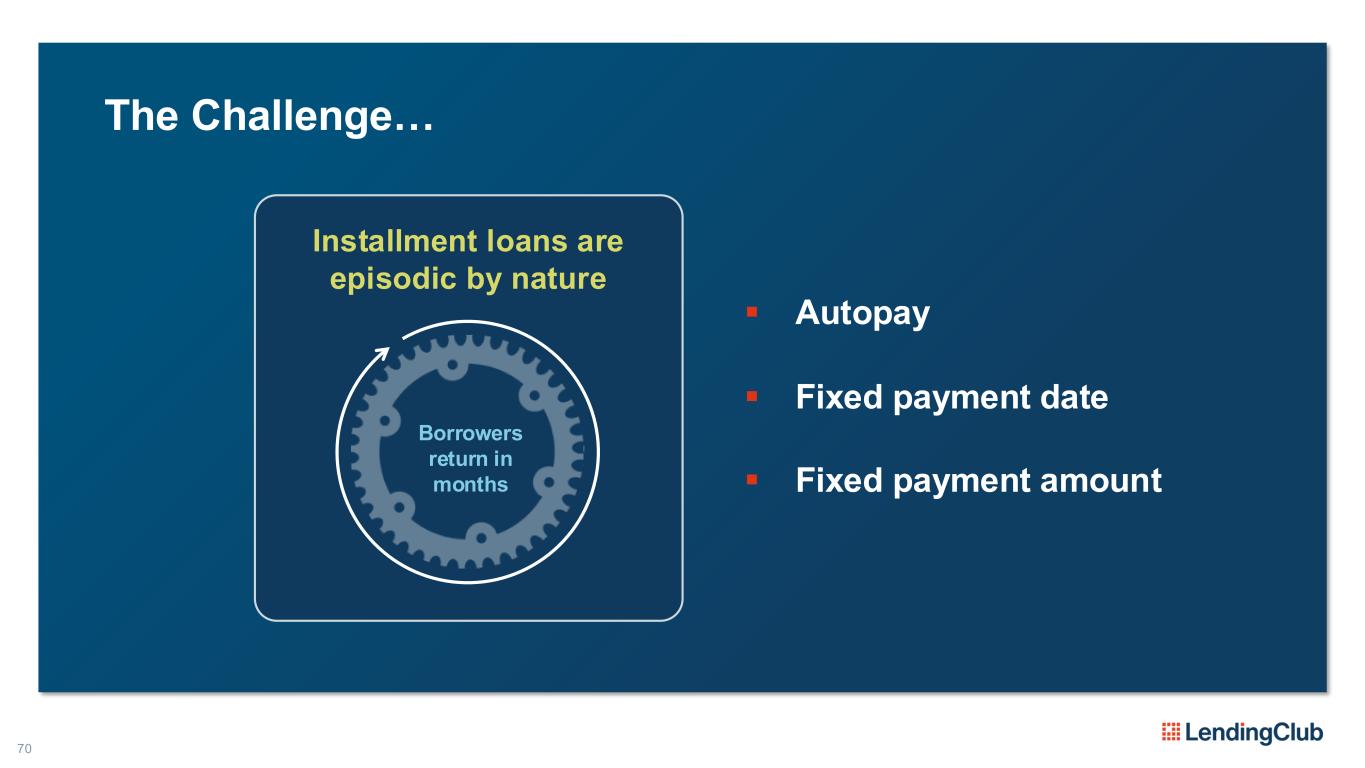
Borrowers return in months Installment loans are episodic by nature The Challenge… ▪ Autopay ▪ Fixed payment date ▪ Fixed payment amount 70
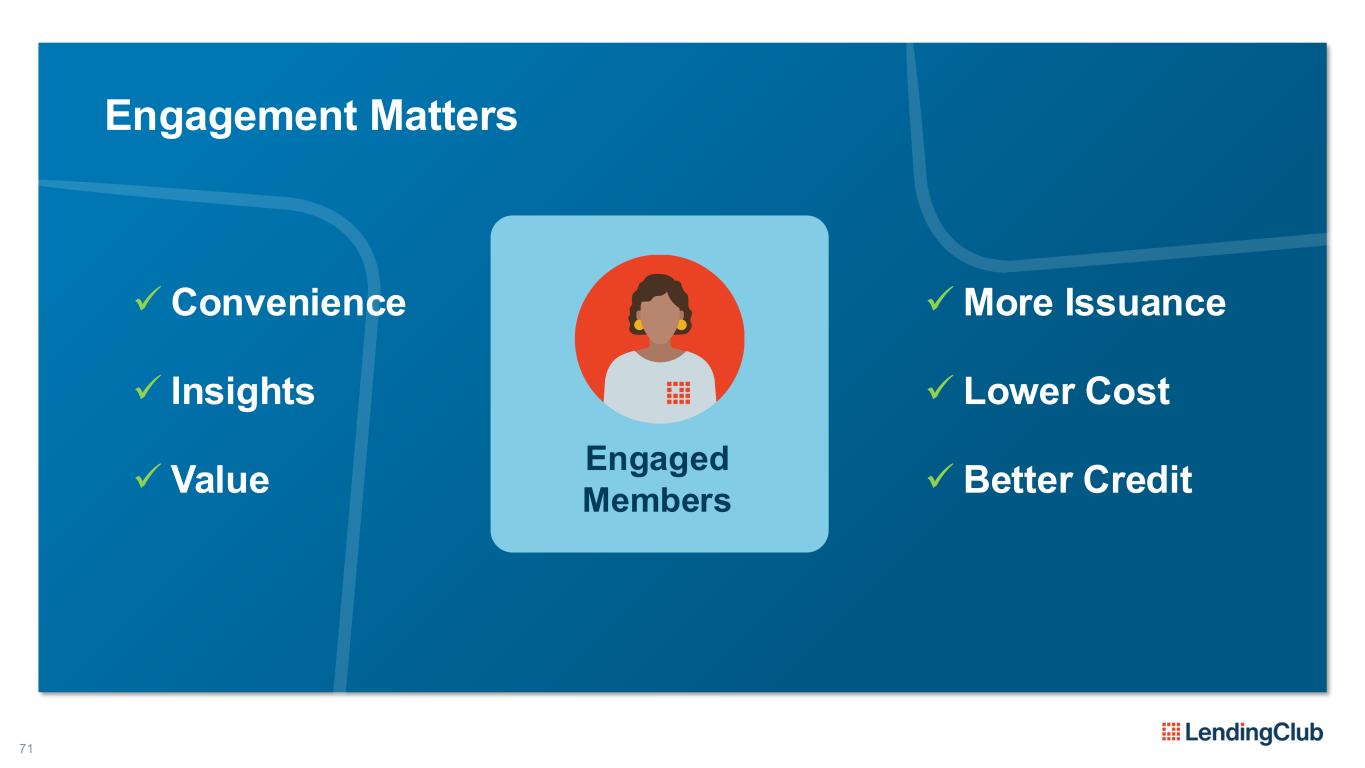
71 Engagement Matters Engaged Members ✓More Issuance ✓ Lower Cost ✓Better Credit ✓Convenience ✓ Insights ✓ Value
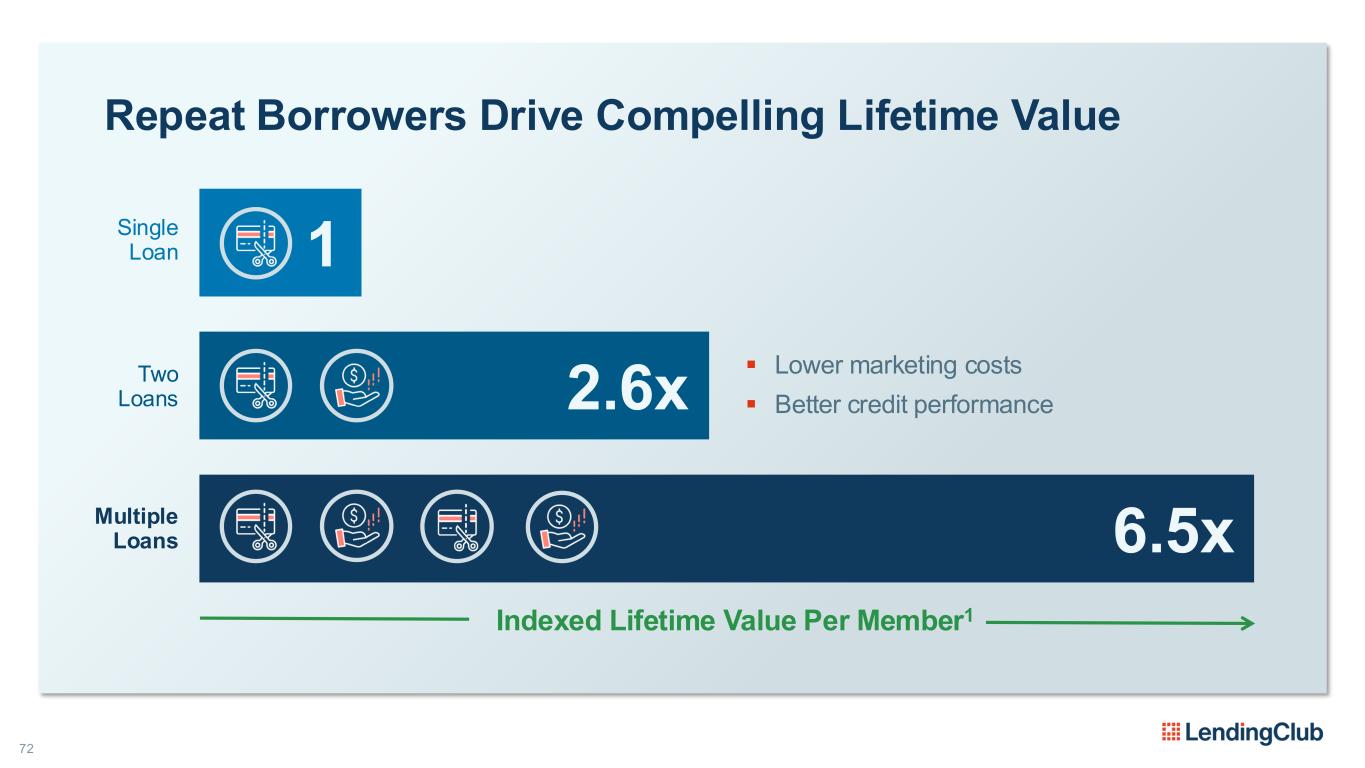
72 Repeat Borrowers Drive Compelling Lifetime Value 1 Single Loan 2.6x ▪ Lower marketing costs ▪ Better credit performance Two Loans 6.5xMultiple Loans Indexed Lifetime Value Per Member1
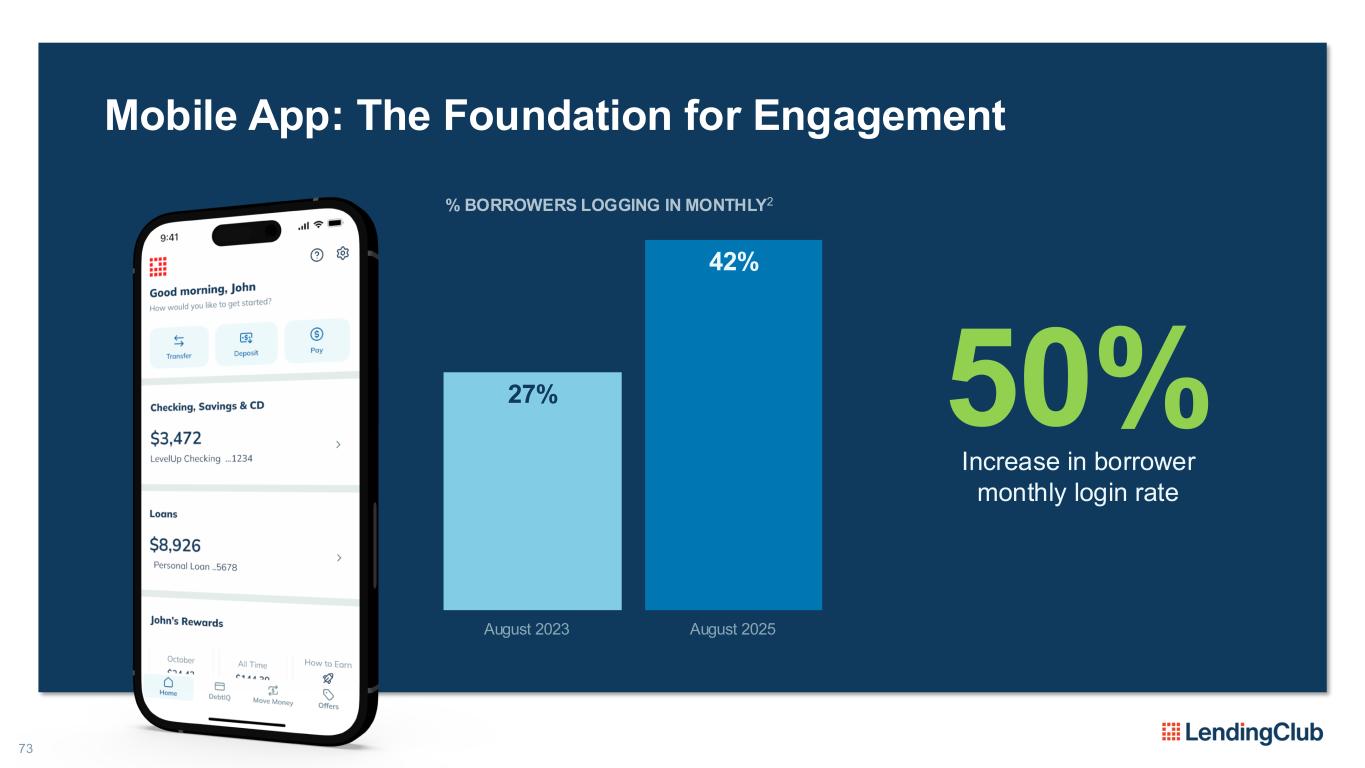
73 Mobile App: The Foundation for Engagement % BORROWERS LOGGING IN MONTHLY2 Increase in borrower monthly login rate 50%27% 42% August 2023 August 2025
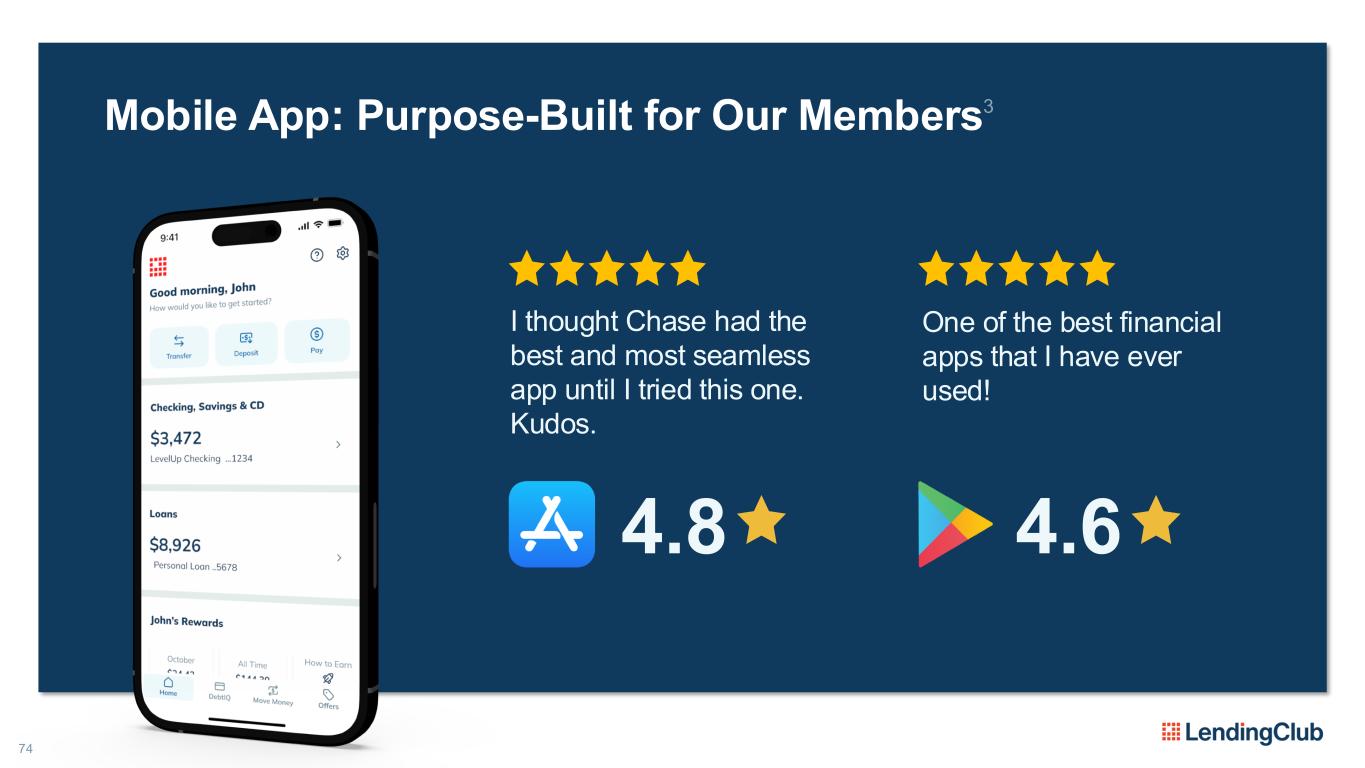
74 Mobile App: Purpose-Built for Our Members3 4.8 4.6 I thought Chase had the best and most seamless app until I tried this one. Kudos. One of the best financial apps that I have ever used!
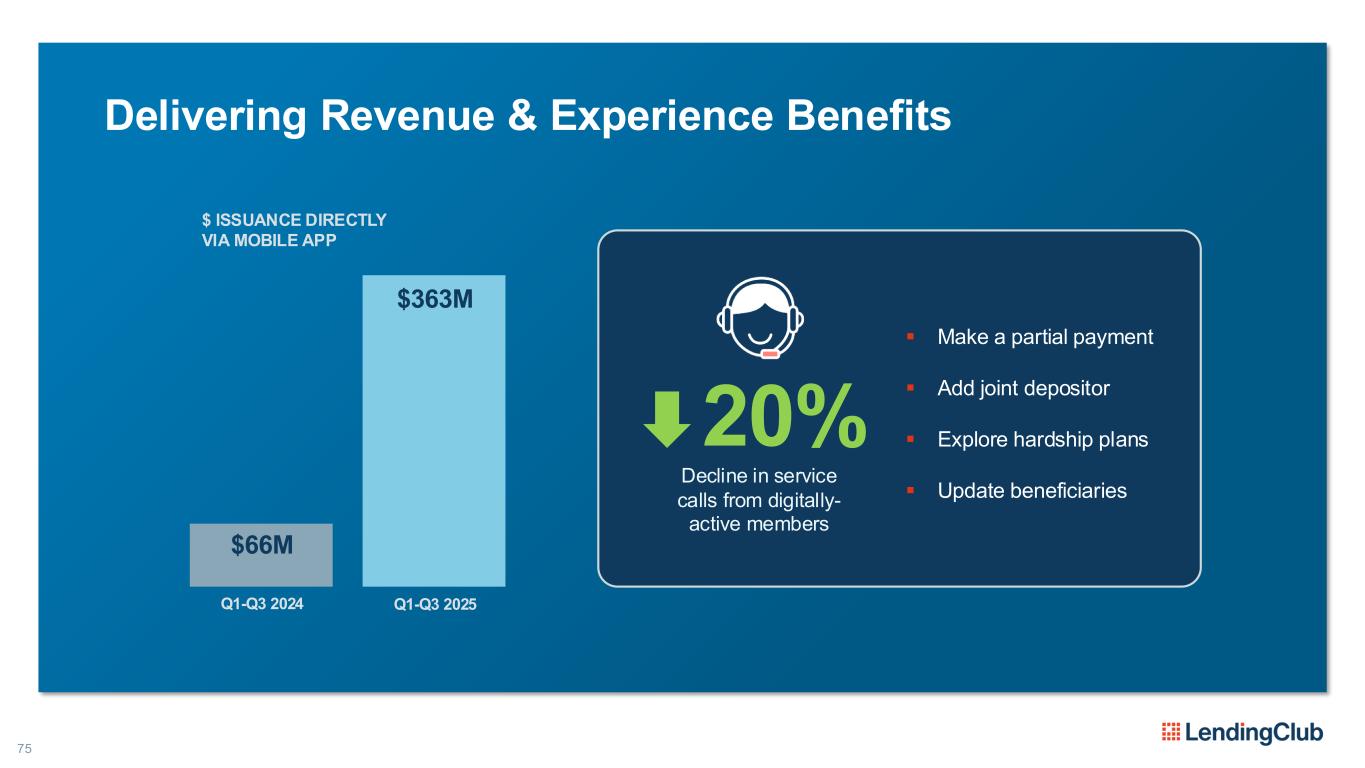
75 Delivering Revenue & Experience Benefits $ ISSUANCE DIRECTLY VIA MOBILE APP Q1-Q3 2024 $66M Q1-Q3 2025 $363M X% ▪ Make a partial payment ▪ Add joint depositor ▪ Explore hardship plans ▪ Update beneficiaries 20% Decline in service calls from digitally- active members
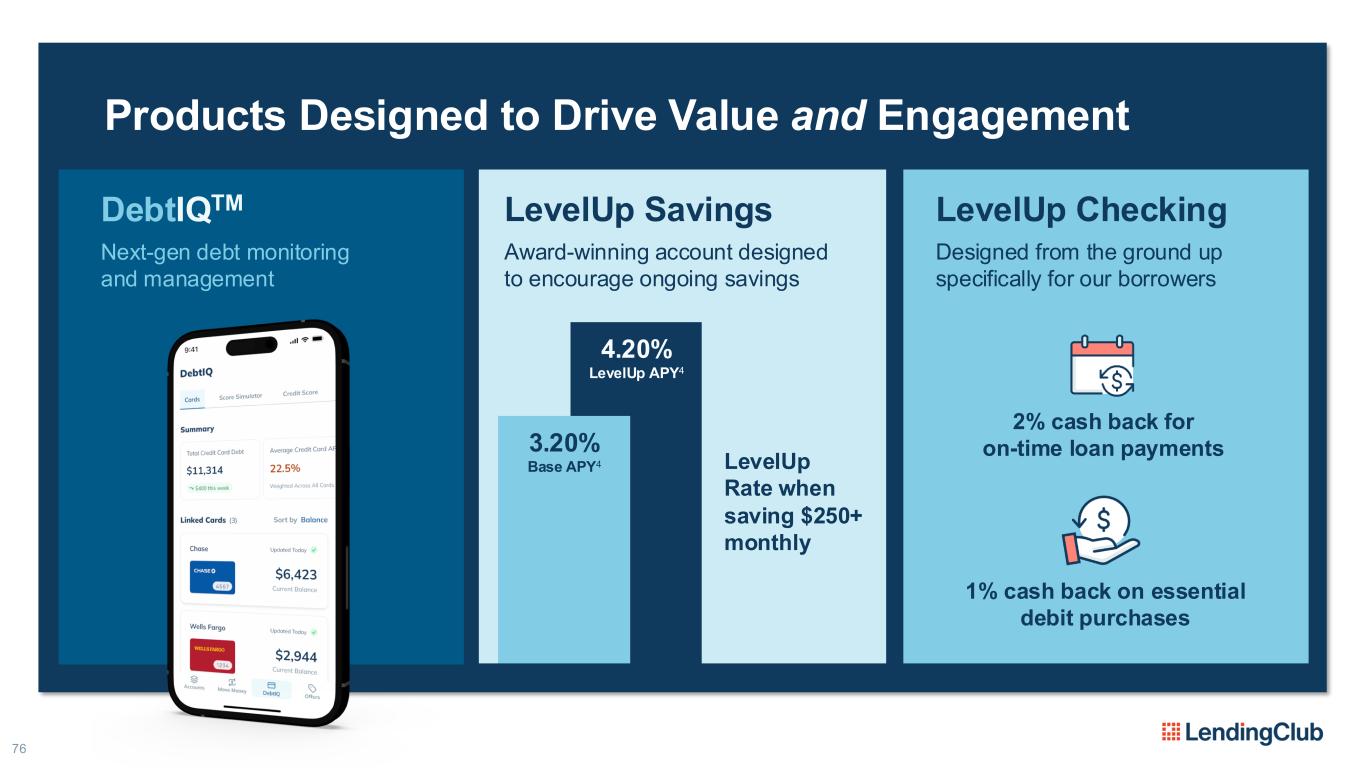
4.20% LevelUp APY4 76 Products Designed to Drive Value and Engagement LevelUp Savings Award-winning account designed to encourage ongoing savings LevelUp Checking Designed from the ground up specifically for our borrowers 3.20% Base APY4 LevelUp Rate when saving $250+ monthly 2% cash back for on-time loan payments 1% cash back on essential debit purchases DebtIQTM Next-gen debt monitoring and management
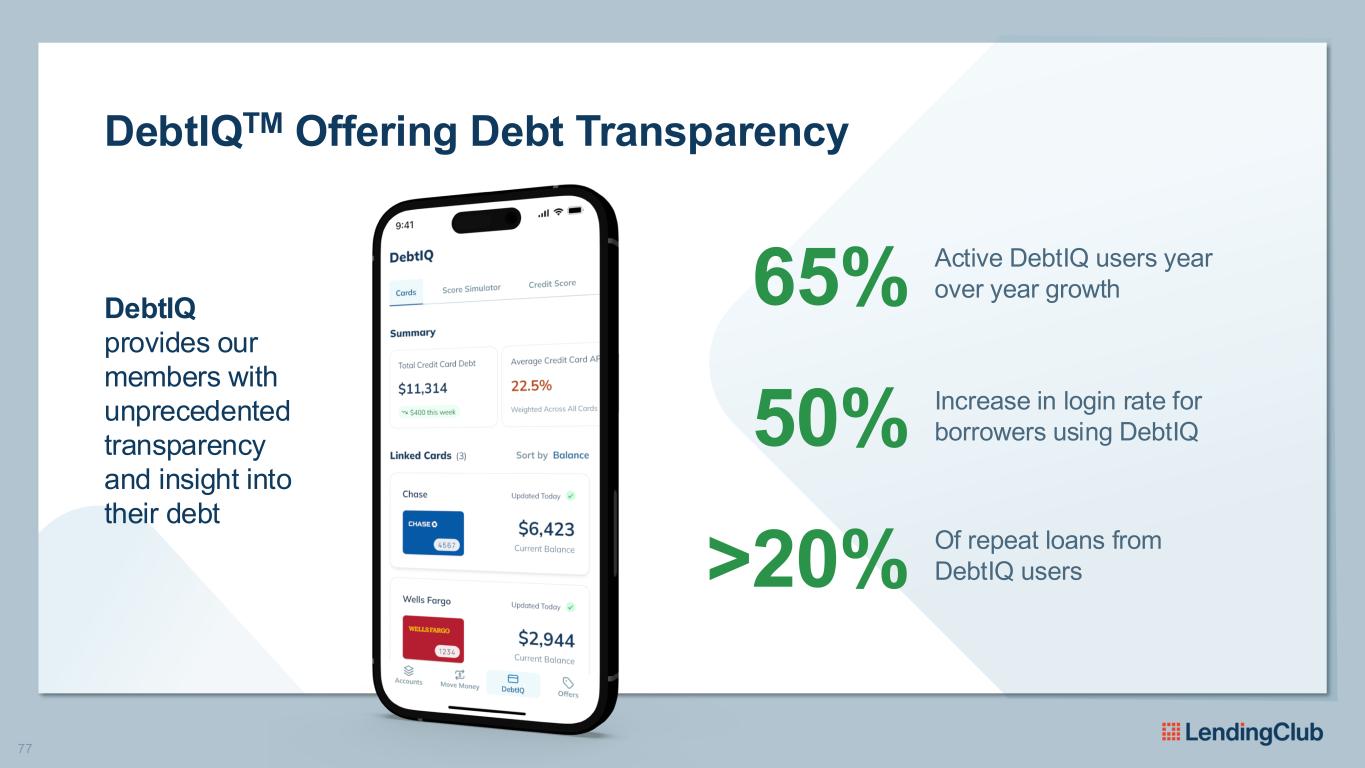
77 DebtIQTM Offering Debt Transparency Active DebtIQ users year over year growth65% Increase in login rate for borrowers using DebtIQ50% Of repeat loans from DebtIQ users >20% DebtIQ provides our members with unprecedented transparency and insight into their debt
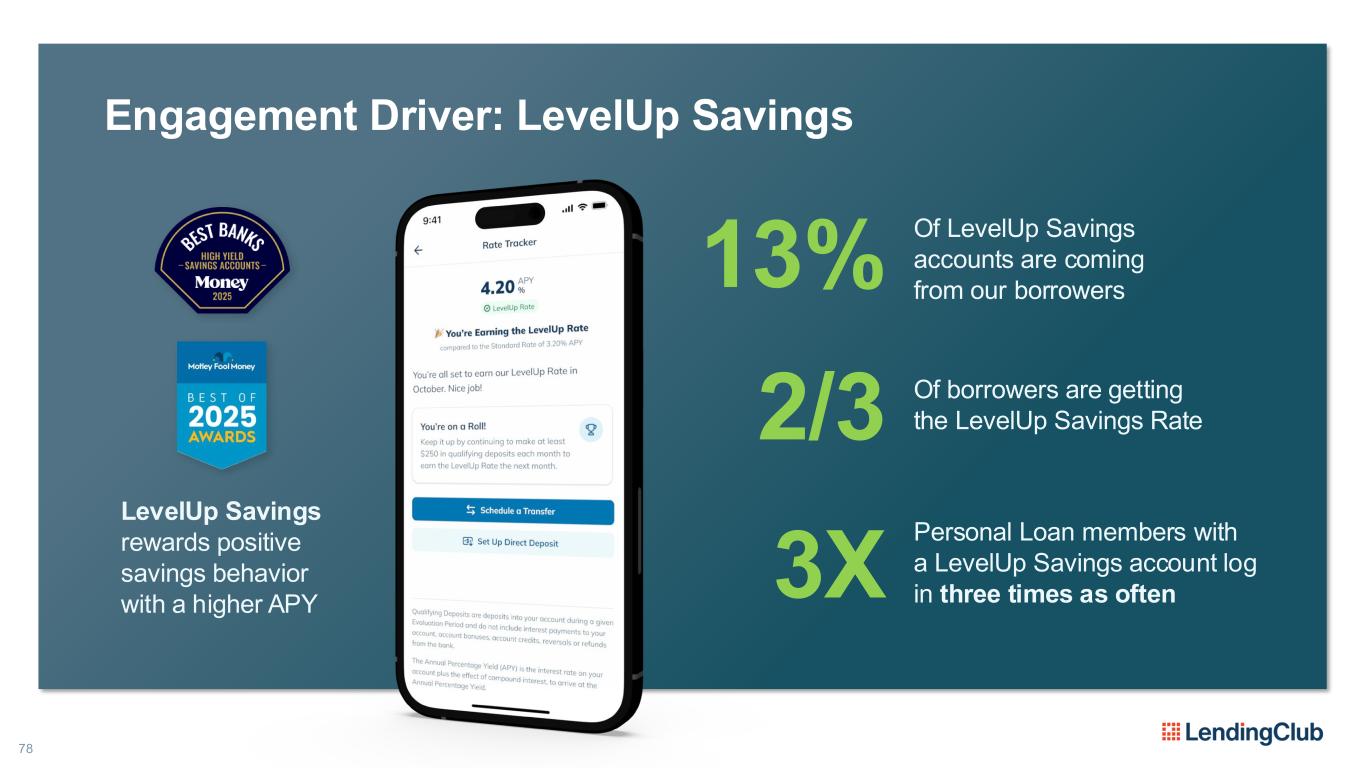
78 Engagement Driver: LevelUp Savings LevelUp Savings rewards positive savings behavior with a higher APY Personal Loan members with a LevelUp Savings account log in three times as often3X 13% 2/3 Of borrowers are getting the LevelUp Savings Rate Of LevelUp Savings accounts are coming from our borrowers
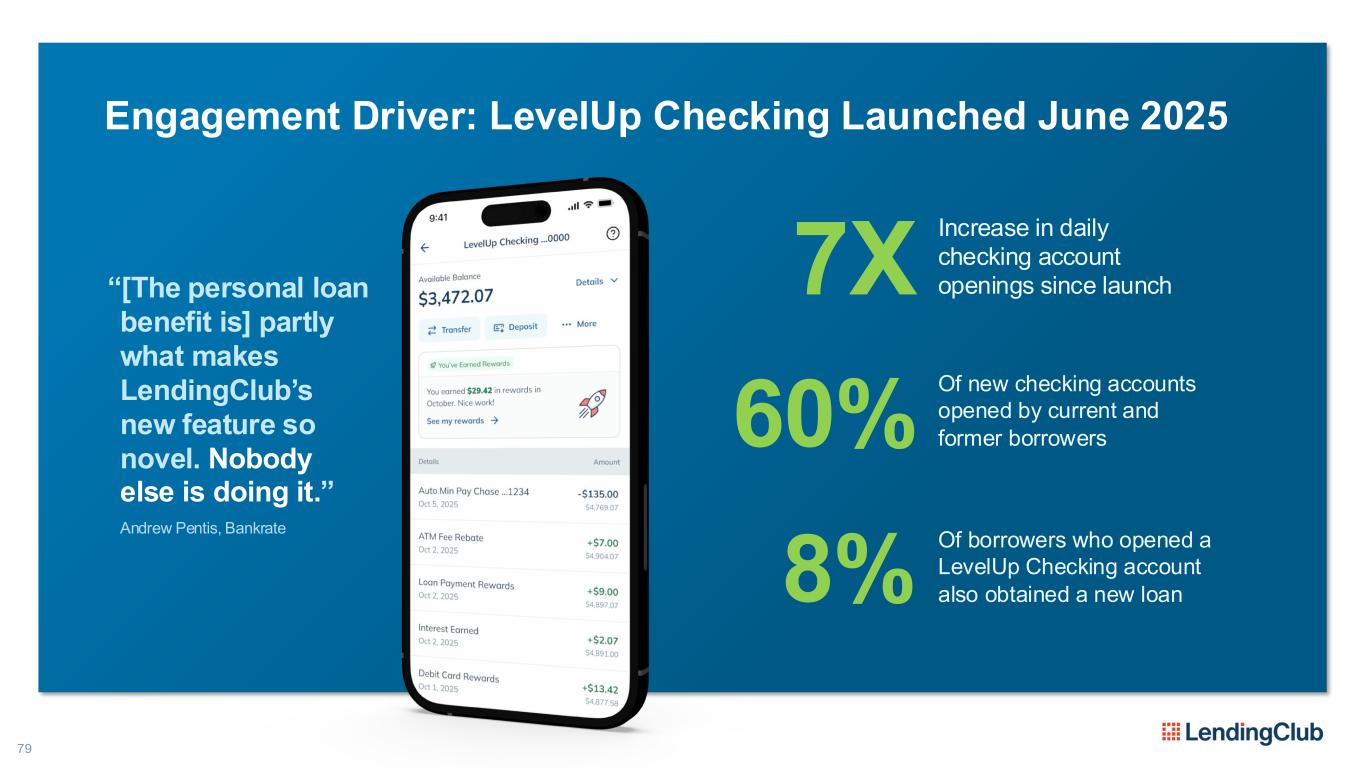
79 Engagement Driver: LevelUp Checking Launched June 2025 Increase in daily checking account openings since launch7X“[The personal loan benefit is] partly what makes LendingClub’s new feature so novel. Nobody else is doing it.” Andrew Pentis, Bankrate Of borrowers who opened a LevelUp Checking account also obtained a new loan8% Of new checking accounts opened by current and former borrowers60%
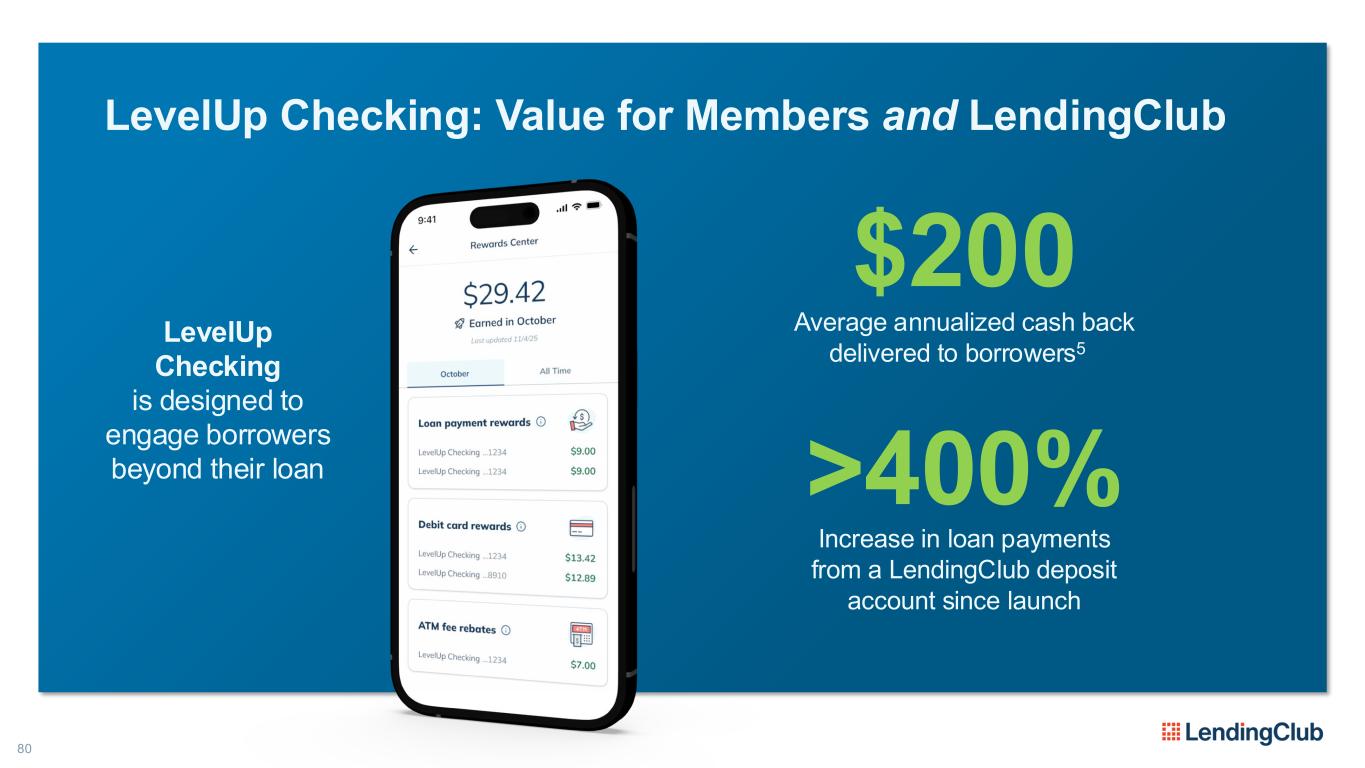
80 LevelUp Checking: Value for Members and LendingClub LevelUp Checking is designed to engage borrowers beyond their loan Increase in loan payments from a LendingClub deposit account since launch >400% Average annualized cash back delivered to borrowers5 $200
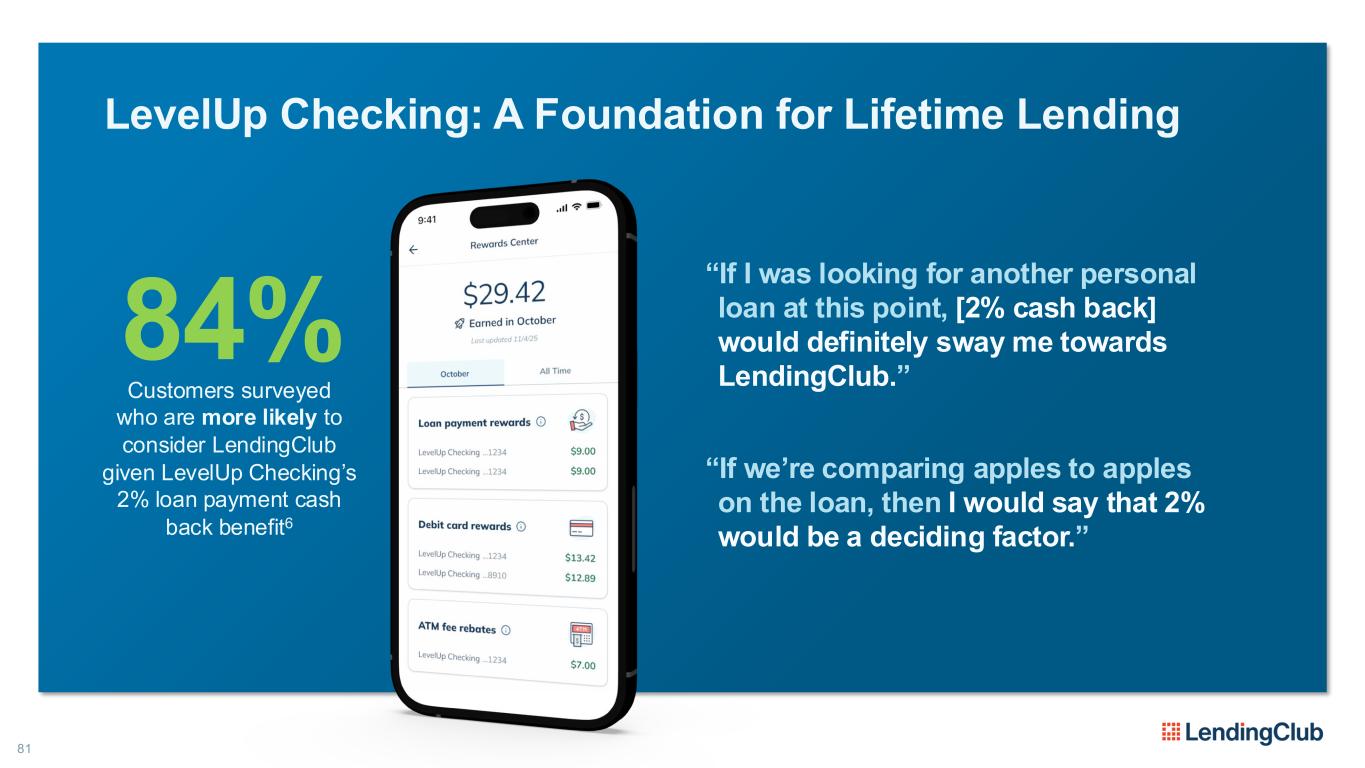
81 LevelUp Checking: A Foundation for Lifetime Lending Customers surveyed who are more likely to consider LendingClub given LevelUp Checking’s 2% loan payment cash back benefit6 84% “If I was looking for another personal loan at this point, [2% cash back] would definitely sway me towards LendingClub.” “If we’re comparing apples to apples on the loan, then I would say that 2% would be a deciding factor.”
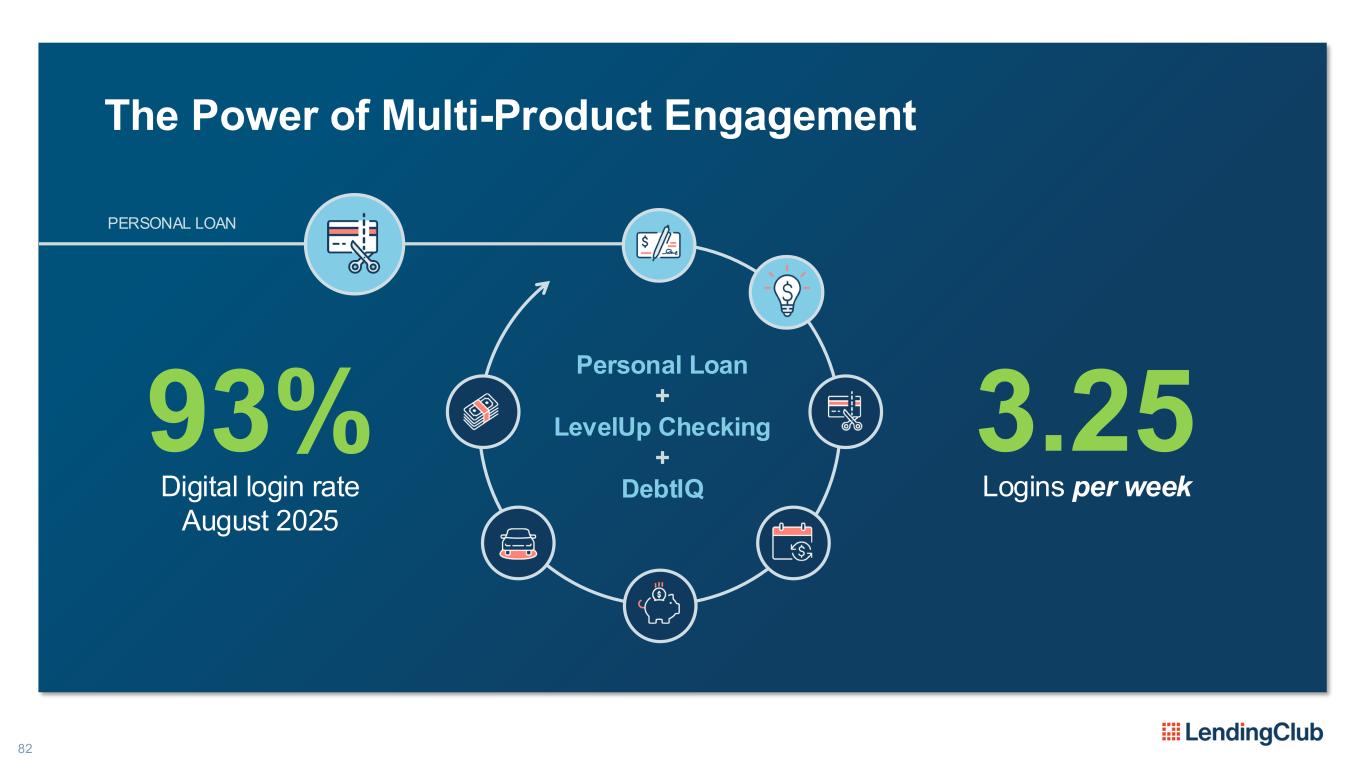
82 The Power of Multi-Product Engagement PERSONAL LOAN Personal Loan + LevelUp Checking + DebtIQ 93% Digital login rate August 2025 3.25 Logins per week
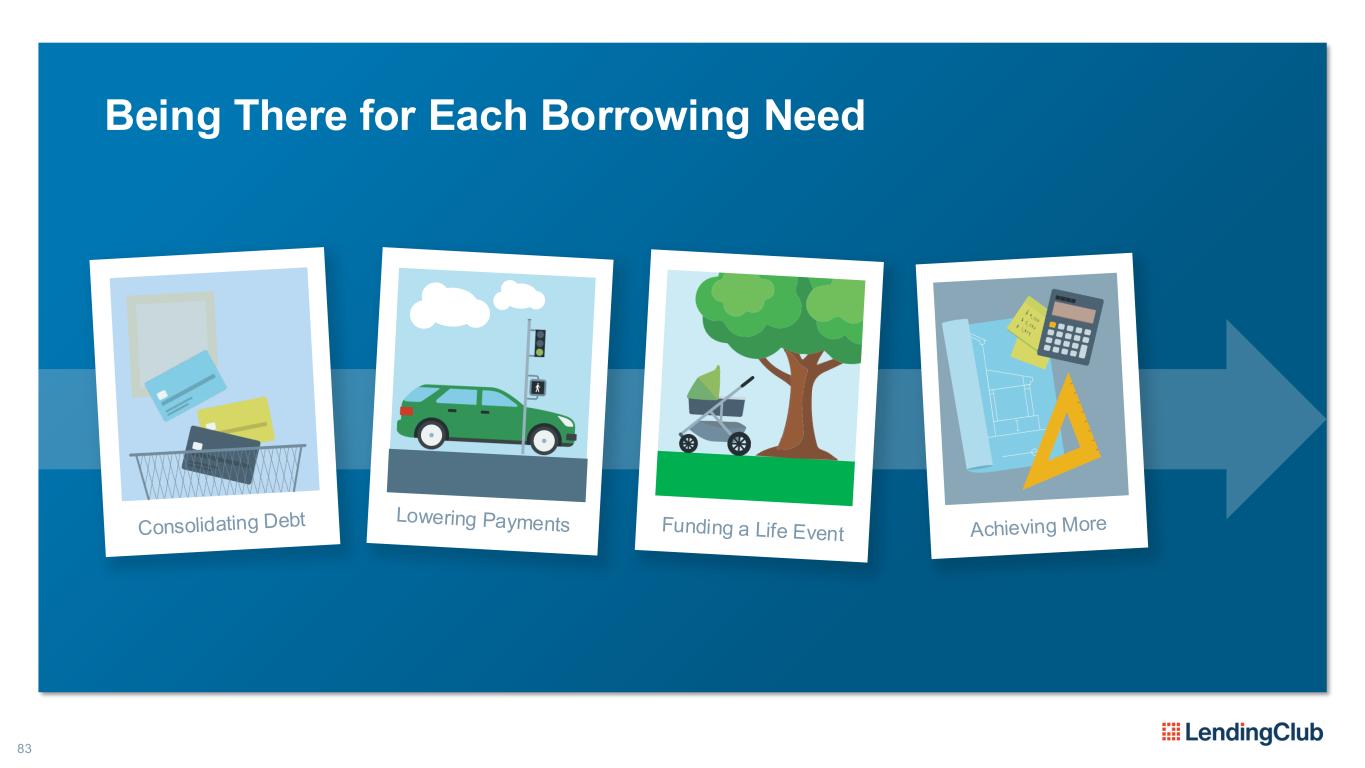
83 Being There for Each Borrowing Need
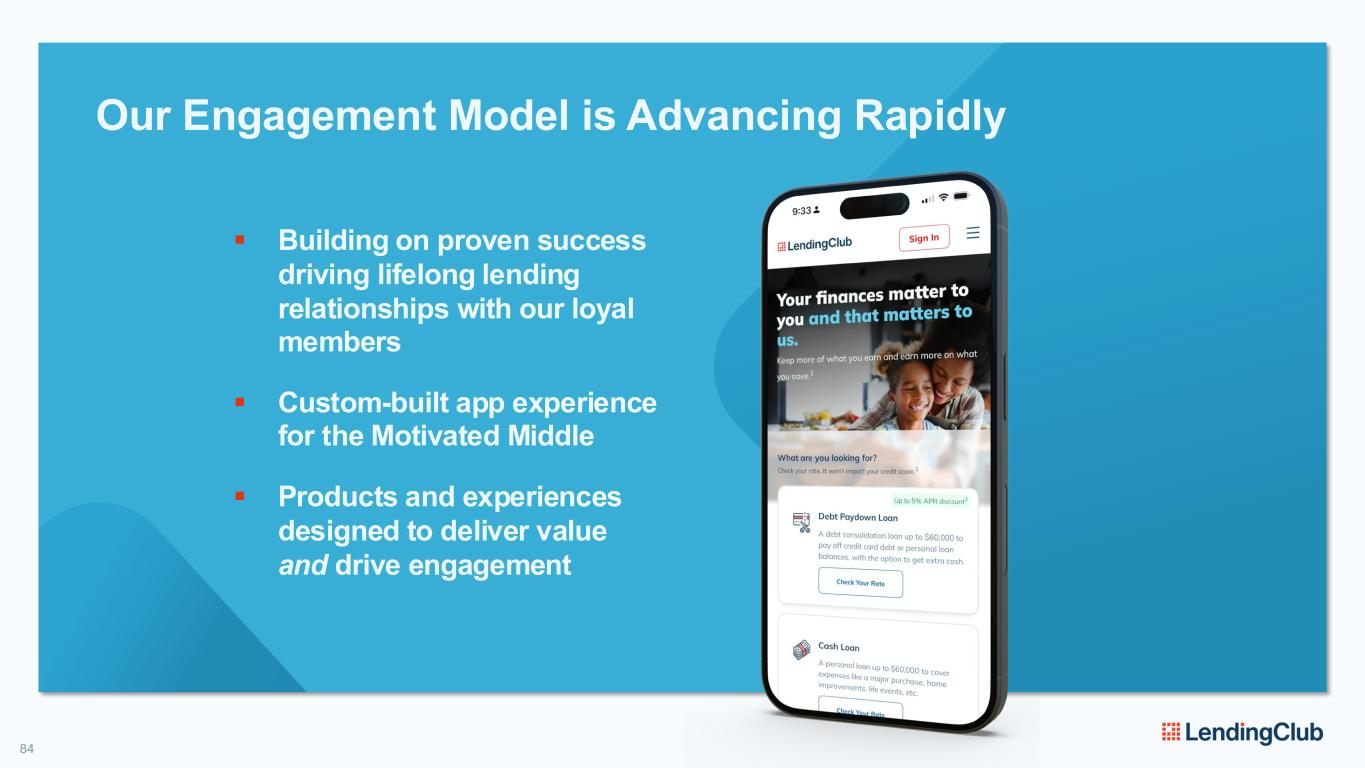
84 Our Engagement Model is Advancing Rapidly ▪ Building on proven success driving lifelong lending relationships with our loyal members ▪ Custom-built app experience for the Motivated Middle ▪ Products and experiences designed to deliver value and drive engagement
Questions & Answers 85 10 minutes on information presented to this point Please raise your hand so we can pass you a microphone
Break AFTER THE BREAK TECHNOLOGY LUKASZ STROZEK, CHIEF TECHNOLOGY OFFICER OUR MODEL DREW LABENNE, CHIEF FINANCIAL OFFICER MARKETPLACE INVESTOR PANEL CLARKE ROBERTS, GM OF MARKETPLACE LUNCH FINANCIALS DREW LABENNE, CHIEF FINANCIAL OFFICER Questions & Answers CLOSE SCOTT SANBORN, CHIEF EXECUTIVE OFFICER

Engineered for Innovation LUKASZ STROZEK CHIEF TECHNOLOGY OFFICER
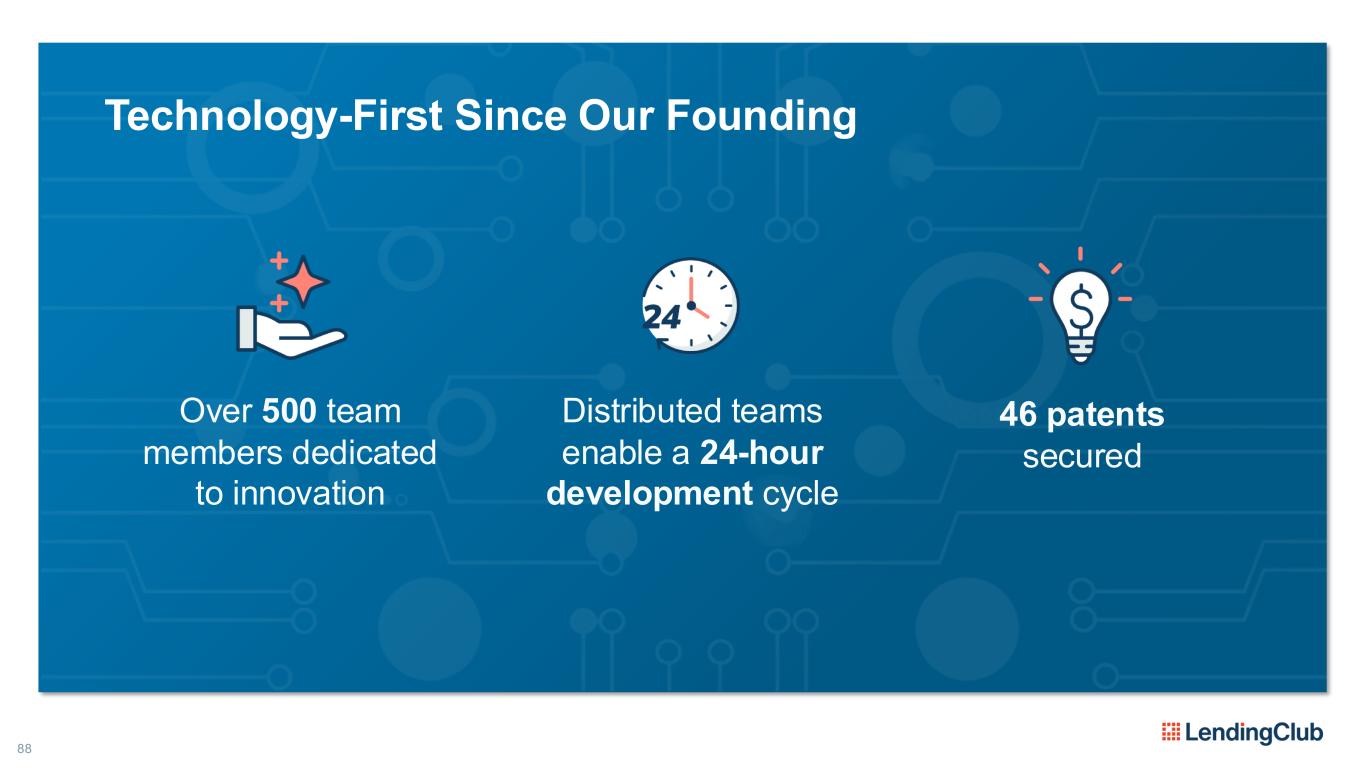
88 Technology-First Since Our Founding Over 500 team members dedicated to innovation Distributed teams enable a 24-hour development cycle 46 patents secured
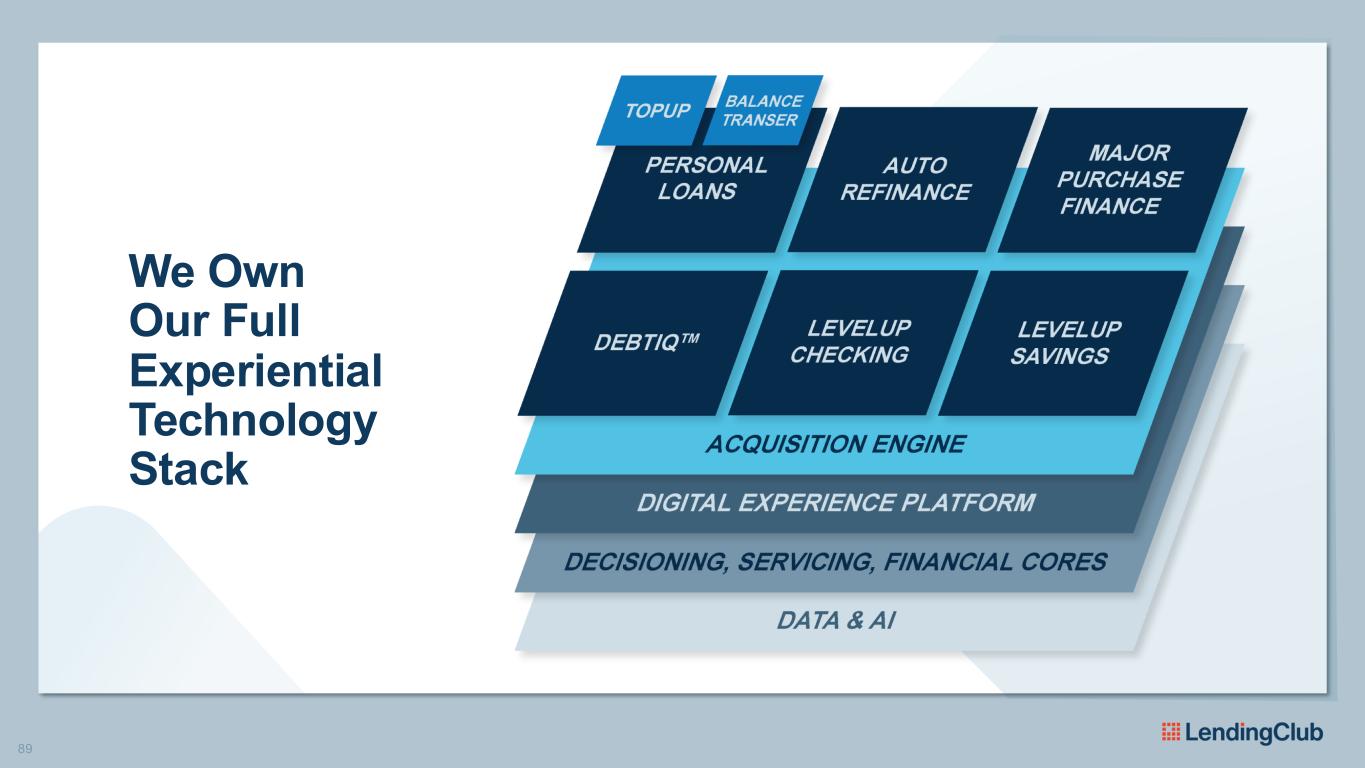
89 We Own Our Full Experiential Technology Stack
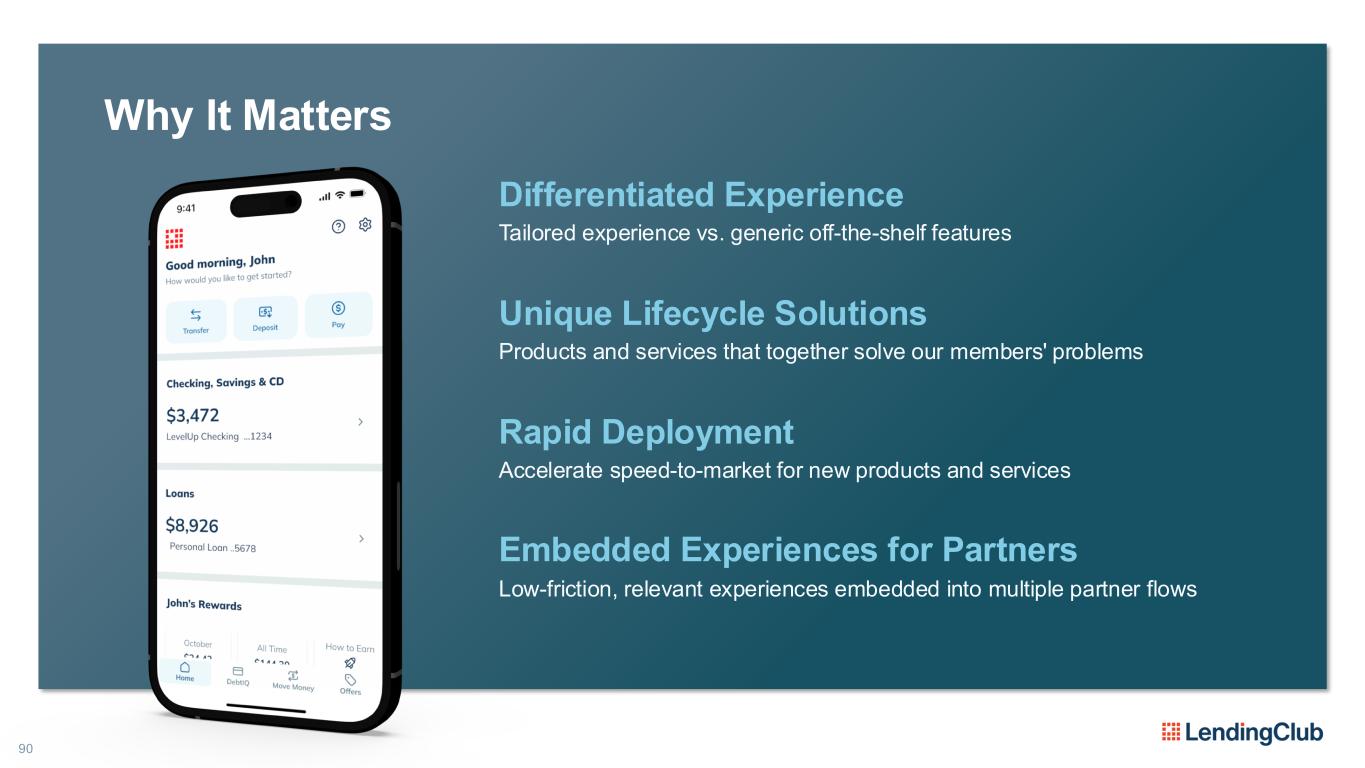
90 Why It Matters Differentiated Experience Tailored experience vs. generic off-the-shelf features Rapid Deployment Accelerate speed-to-market for new products and services Unique Lifecycle Solutions Products and services that together solve our members' problems Embedded Experiences for Partners Low-friction, relevant experiences embedded into multiple partner flows
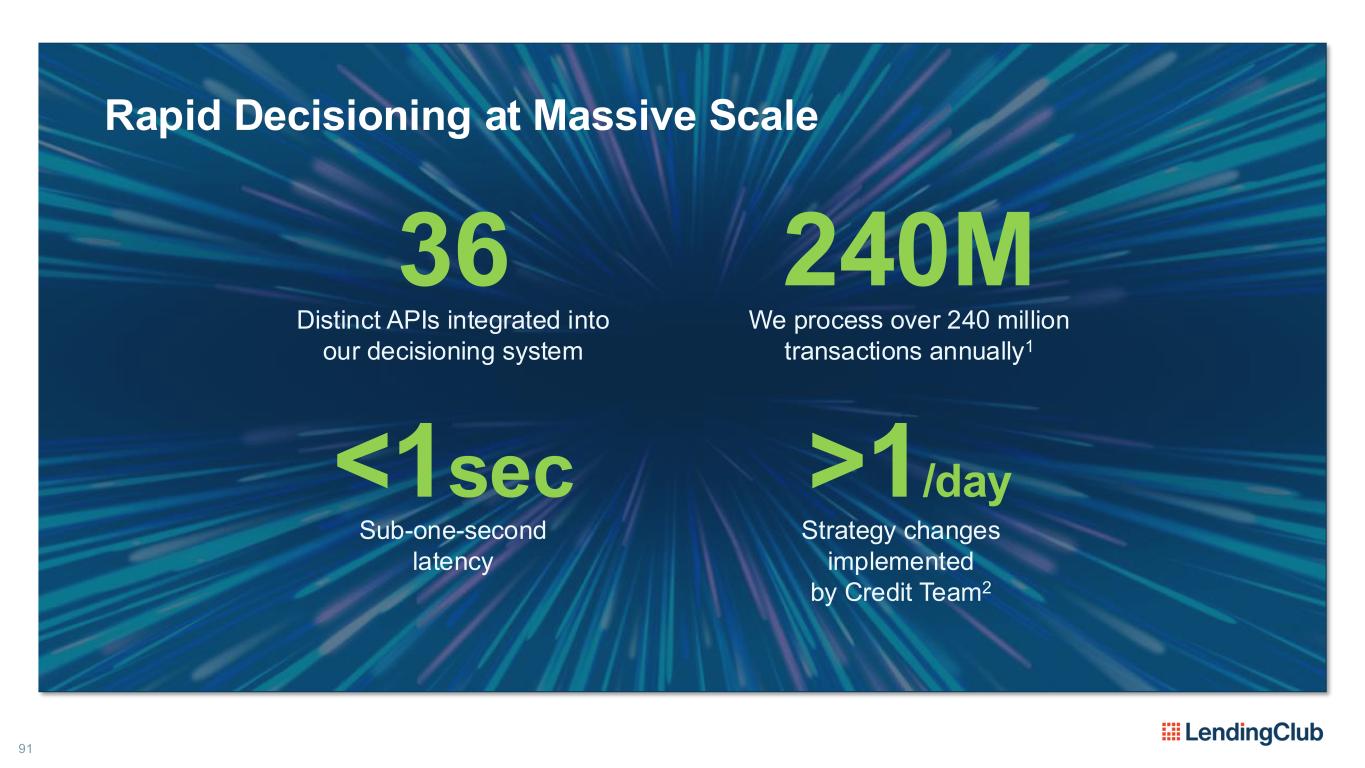
91 Rapid Decisioning at Massive Scale 240M We process over 240 million transactions annually1 <1sec Sub-one-second latency Distinct APIs integrated into our decisioning system >1/day Strategy changes implemented by Credit Team2 36
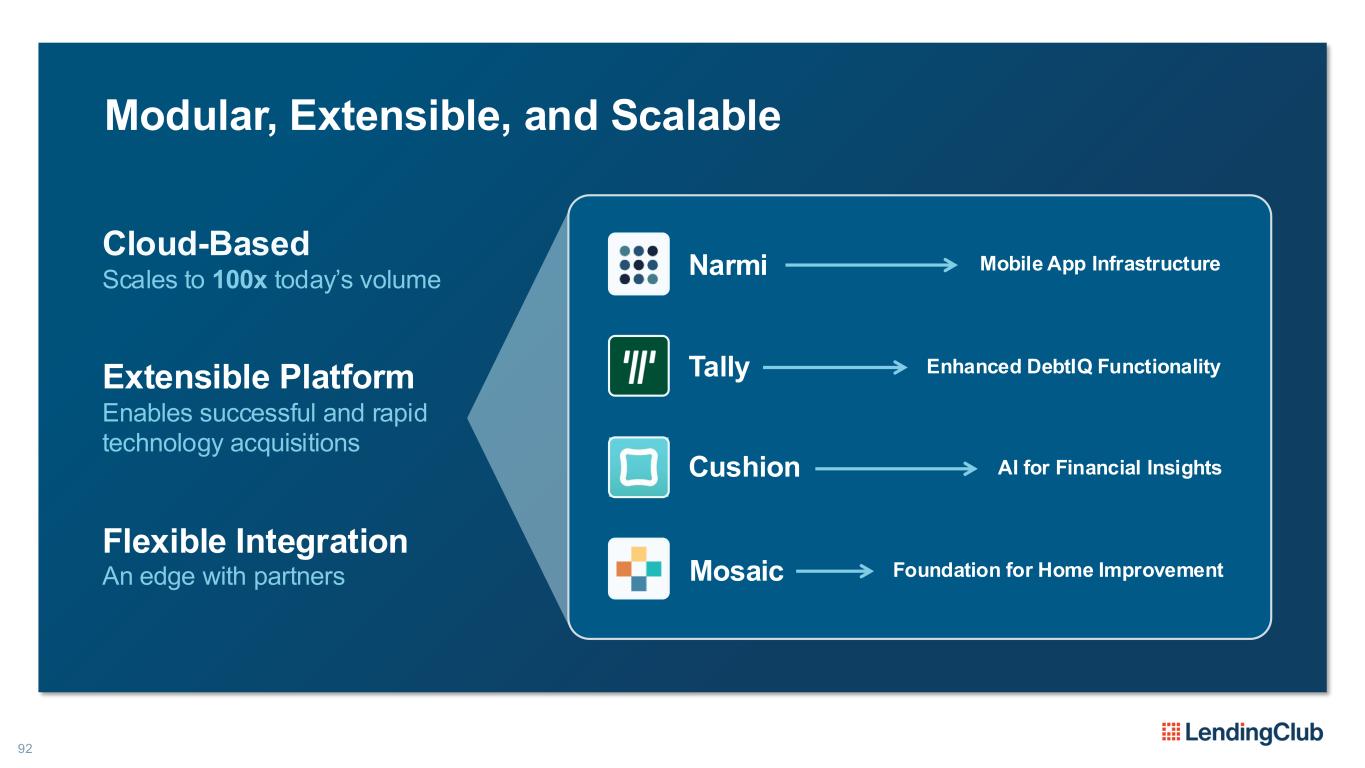
92 Modular, Extensible, and Scalable Cloud-Based Scales to 100x today’s volume Flexible Integration An edge with partners Extensible Platform Enables successful and rapid technology acquisitions Mobile App InfrastructureNarmi Tally Cushion Mosaic Enhanced DebtIQ Functionality AI for Financial Insights Foundation for Home Improvement
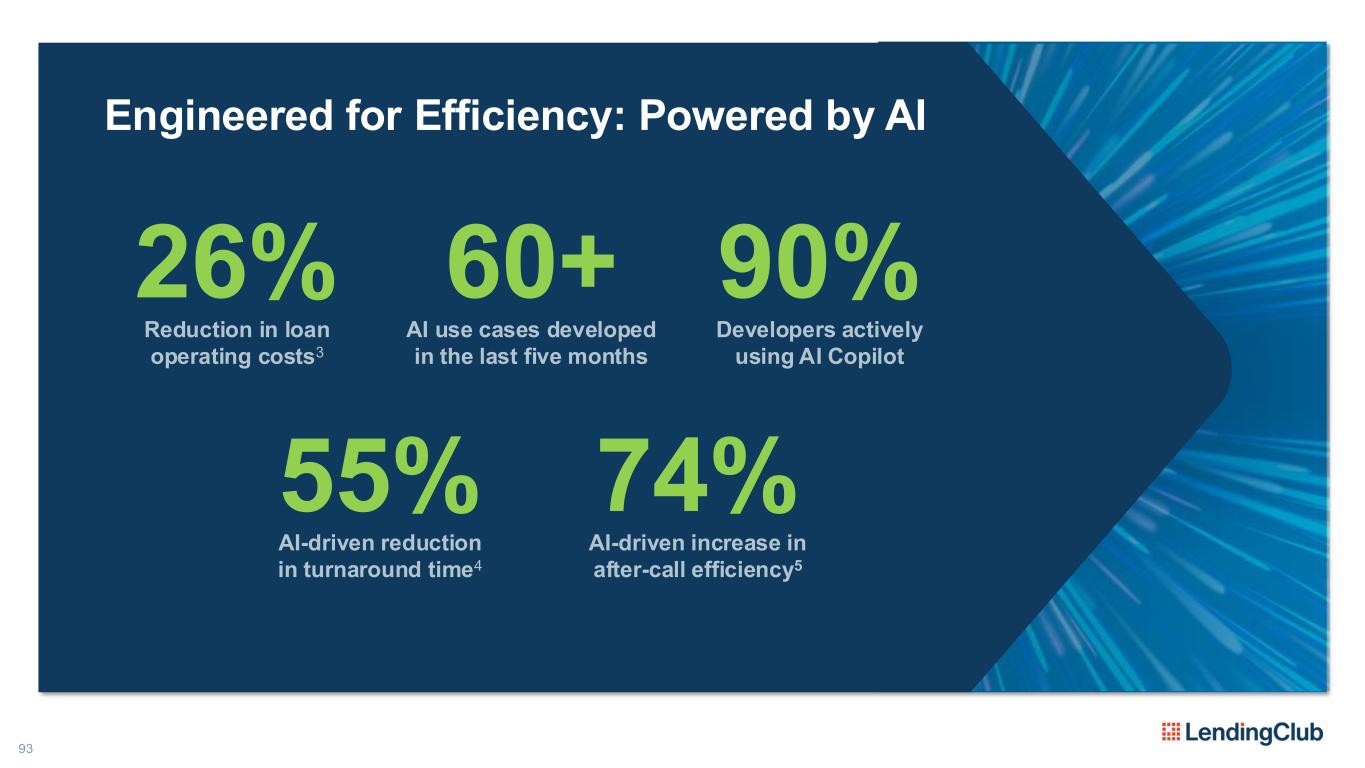
93 Engineered for Efficiency: Powered by AI Reduction in loan operating costs3 26% 60+ 74%55% 90% AI use cases developed in the last five months Developers actively using AI Copilot AI-driven reduction in turnaround time4 AI-driven increase in after-call efficiency5
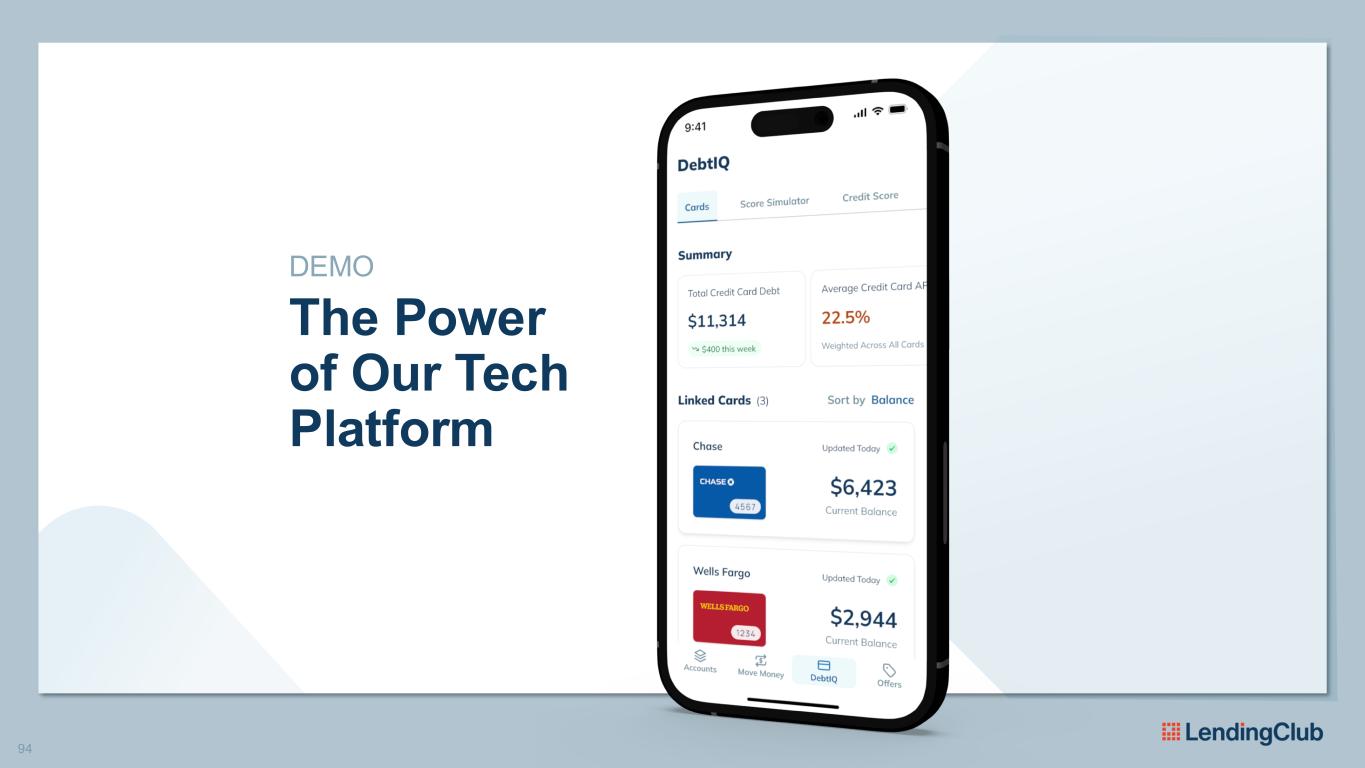
94 DEMO The Power of Our Tech Platform
95 Founded in technology, engineered for innovation.
Best of Both Worlds: Digital Marketplace Bank DREW LABENNE CHIEF FINANCIAL OFFICER
Winning with a digital marketplace bank model A powerful combination of a high-yielding asset and a technology- forward bank 97
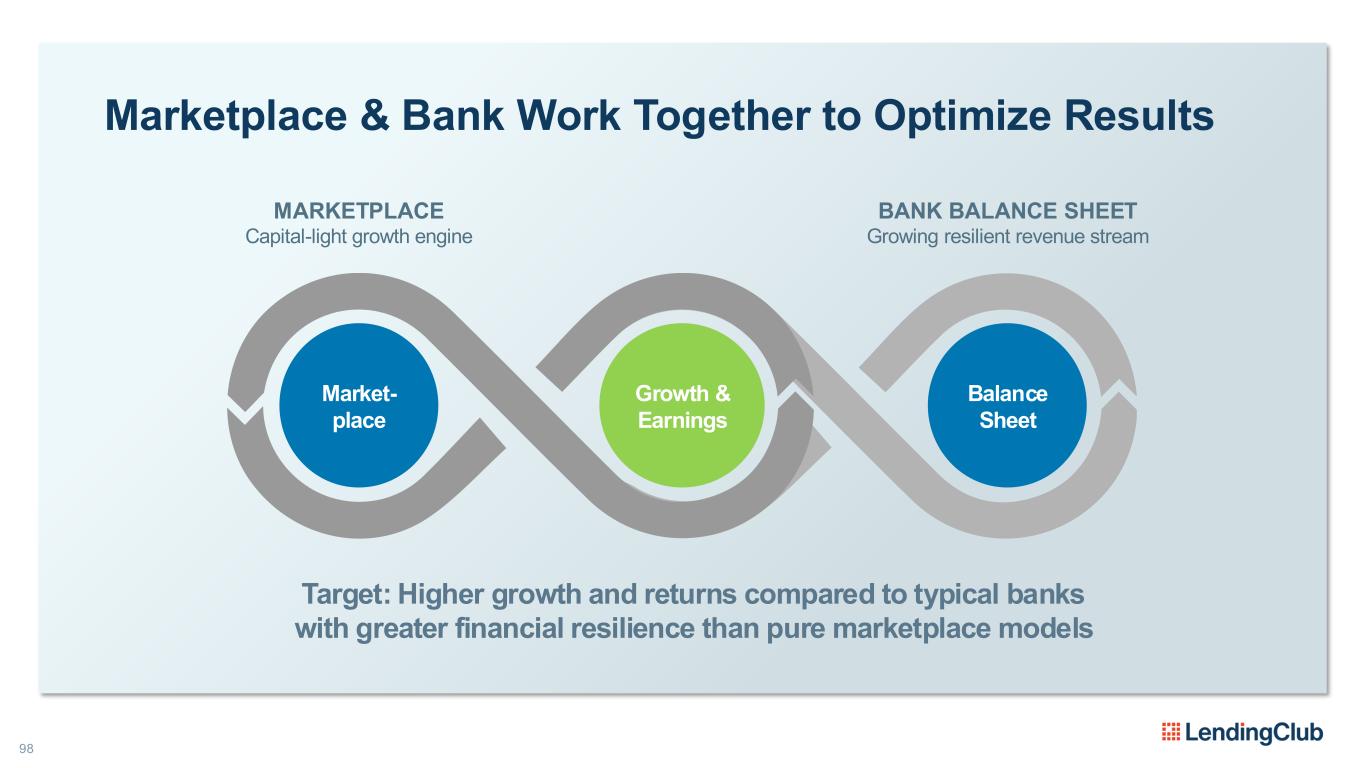
98 Marketplace & Bank Work Together to Optimize Results Market- place Balance Sheet Growth & Earnings Target: Higher growth and returns compared to typical banks with greater financial resilience than pure marketplace models MARKETPLACE Capital-light growth engine BANK BALANCE SHEET Growing resilient revenue stream
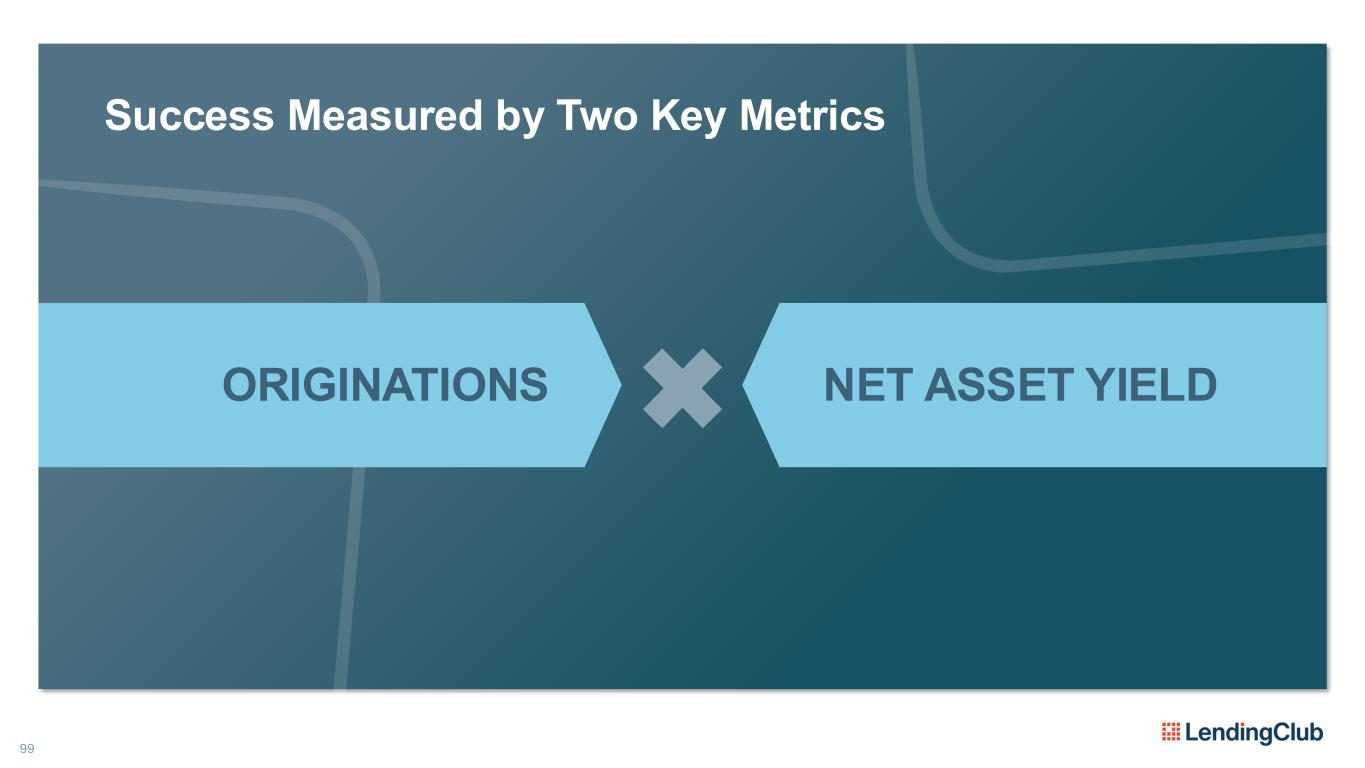
99 Success Measured by Two Key Metrics ORIGINATIONS NET ASSET YIELD
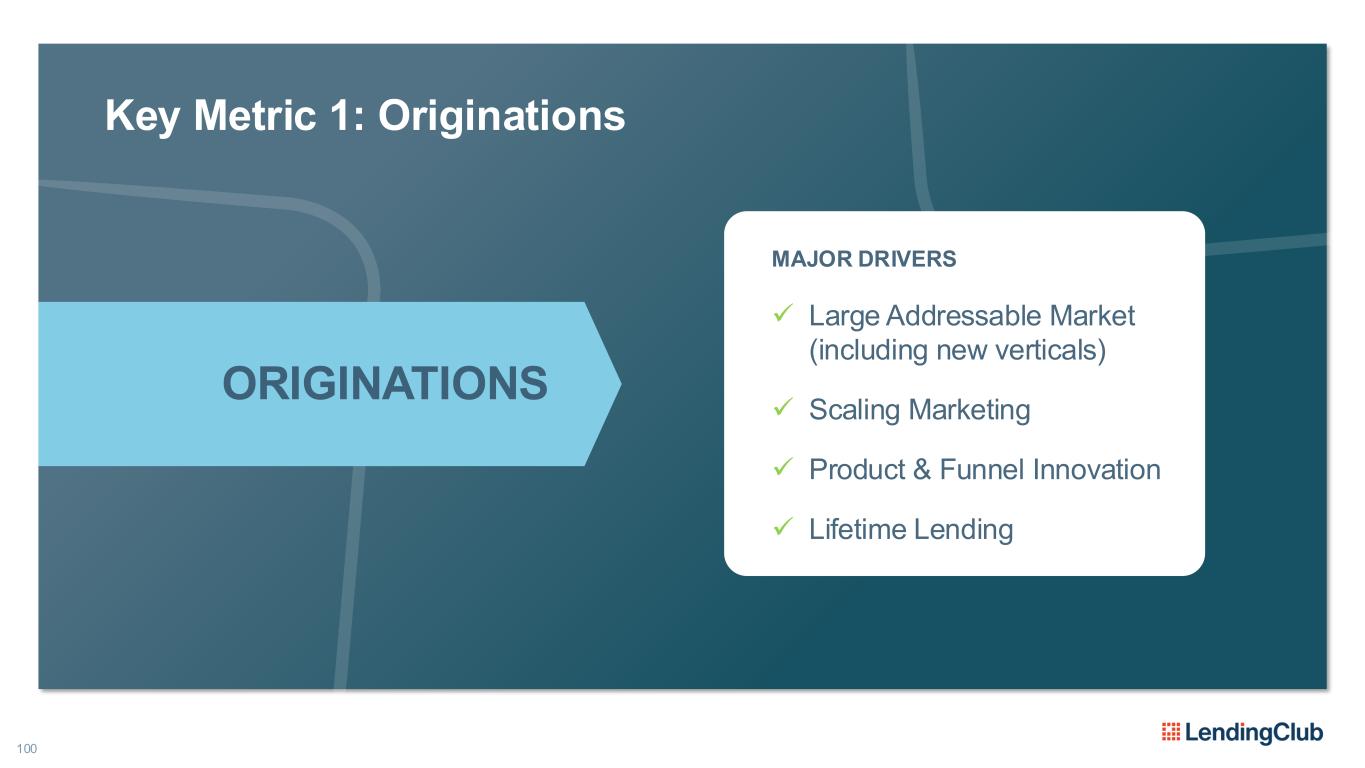
100 Key Metric 1: Originations ORIGINATIONS MAJOR DRIVERS ✓ Large Addressable Market (including new verticals) ✓ Scaling Marketing ✓ Product & Funnel Innovation ✓ Lifetime Lending
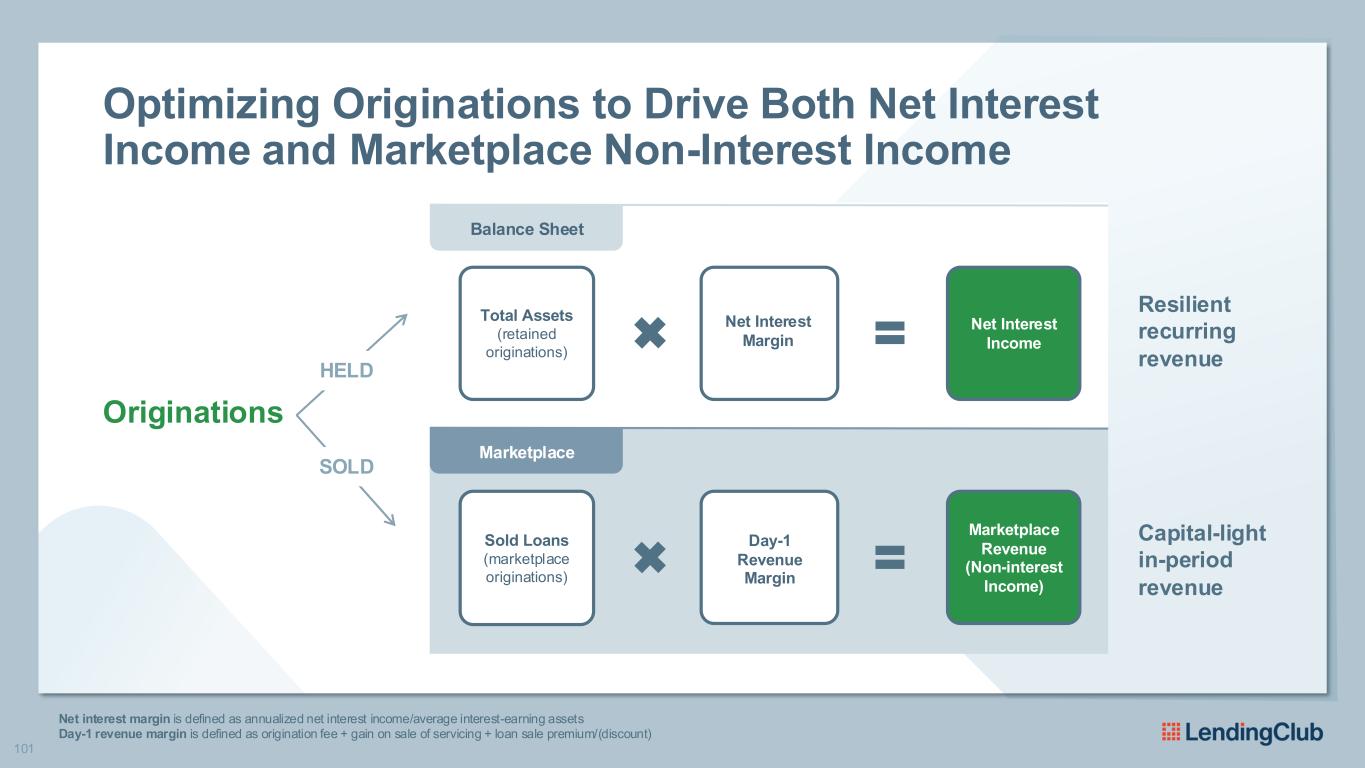
Balance Sheet Marketplace Total Assets (retained originations) Sold Loans (marketplace originations) Day-1 Revenue Margin Marketplace Revenue (Non-interest Income) Net Interest Income Net Interest Margin Net interest margin is defined as annualized net interest income/average interest-earning assets Day-1 revenue margin is defined as origination fee + gain on sale of servicing + loan sale premium/(discount) Optimizing Originations to Drive Both Net Interest Income and Marketplace Non-Interest Income HELD SOLD Originations Resilient recurring revenue Capital-light in-period revenue 101
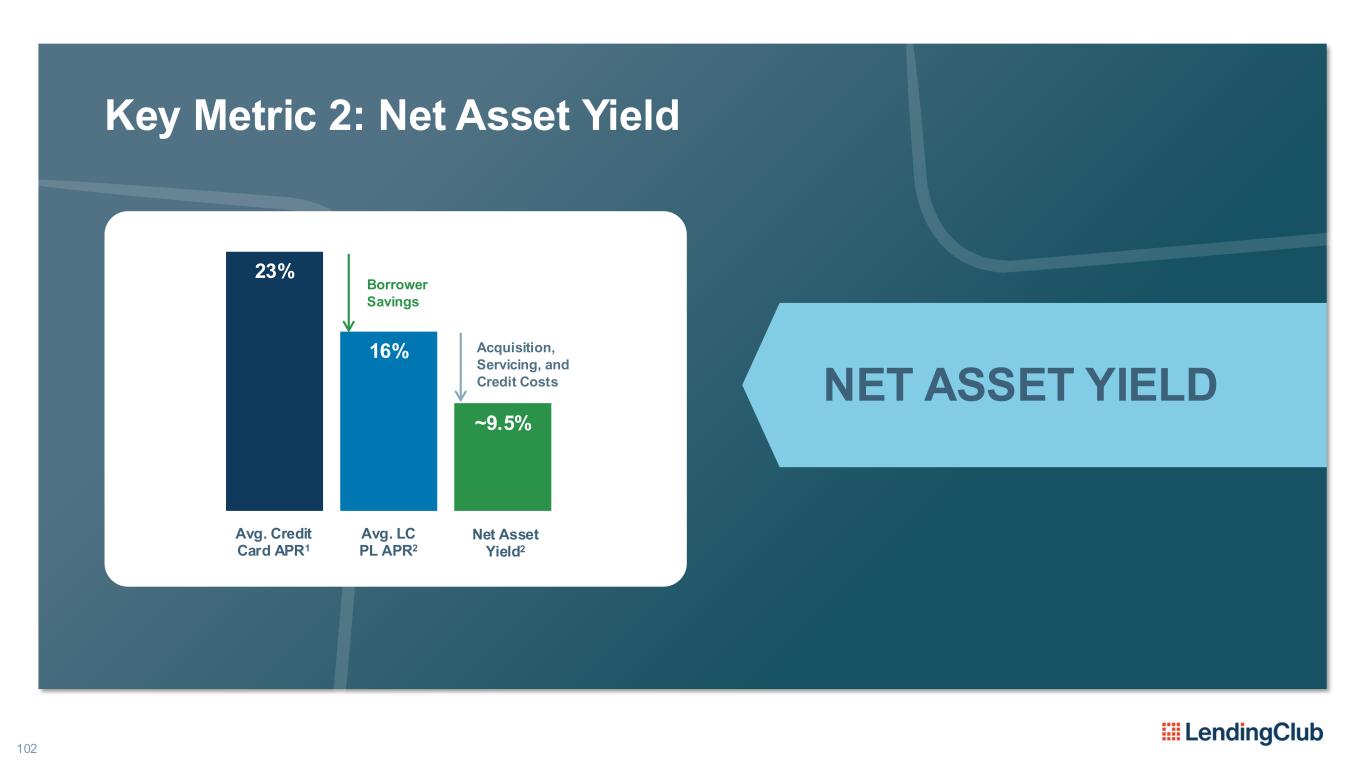
102 Key Metric 2: Net Asset Yield Avg. Credit Card APR1 Avg. LC PL APR2 Net Asset Yield2 Borrower Savings 23% 16% ~9.5% NET ASSET YIELD Acquisition, Servicing, and Credit Costs
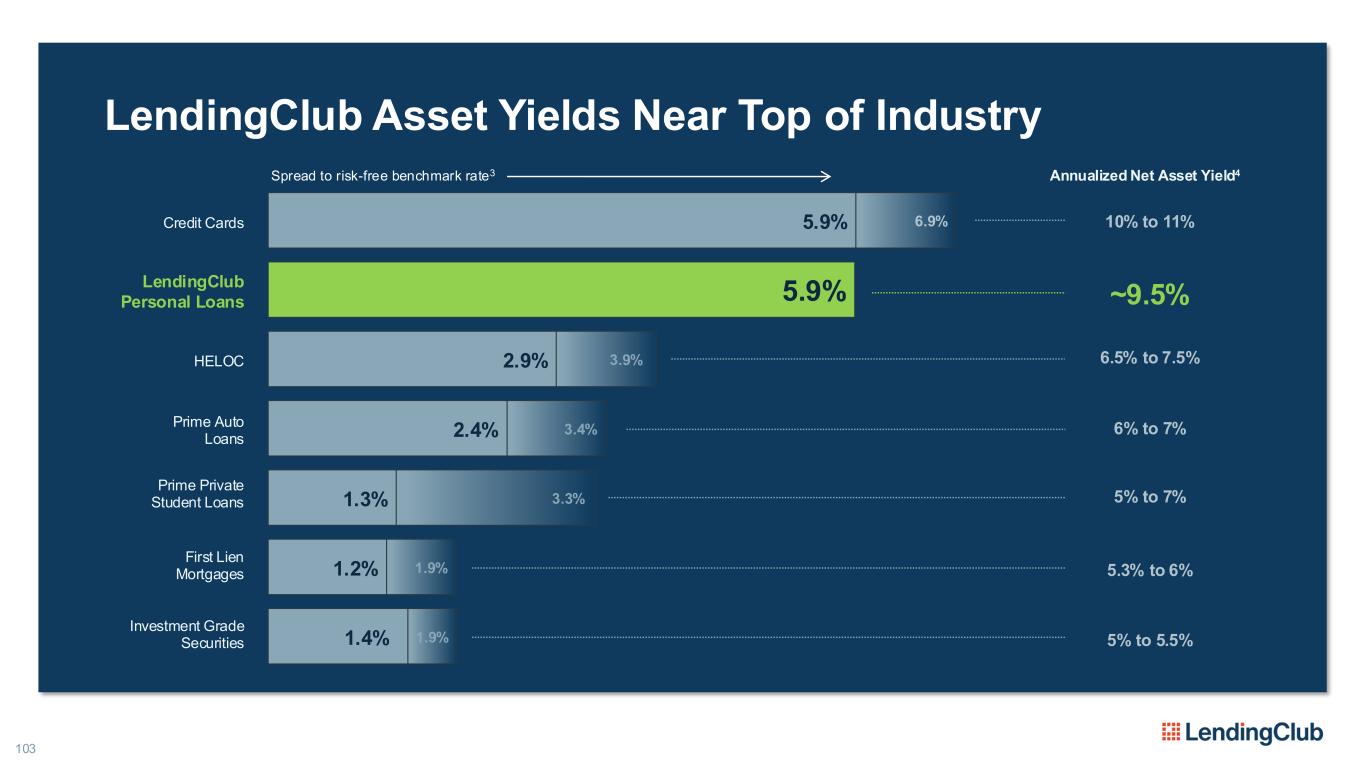
103 LendingClub Asset Yields Near Top of Industry Annualized Net Asset Yield4 1.4% 1.2% 1.3% 2.4% 2.9% 5.9% 5.9% 1.9% 1.9% 3.3% 3.4% 3.9% 6.9%Credit Cards LendingClub Personal Loans HELOC Prime Auto Loans Prime Private Student Loans First Lien Mortgages Investment Grade Securities 10% to 11% ~9.5% 6.5% to 7.5% 6% to 7% 5% to 7% 5.3% to 6% 5% to 5.5% Spread to risk-free benchmark rate3
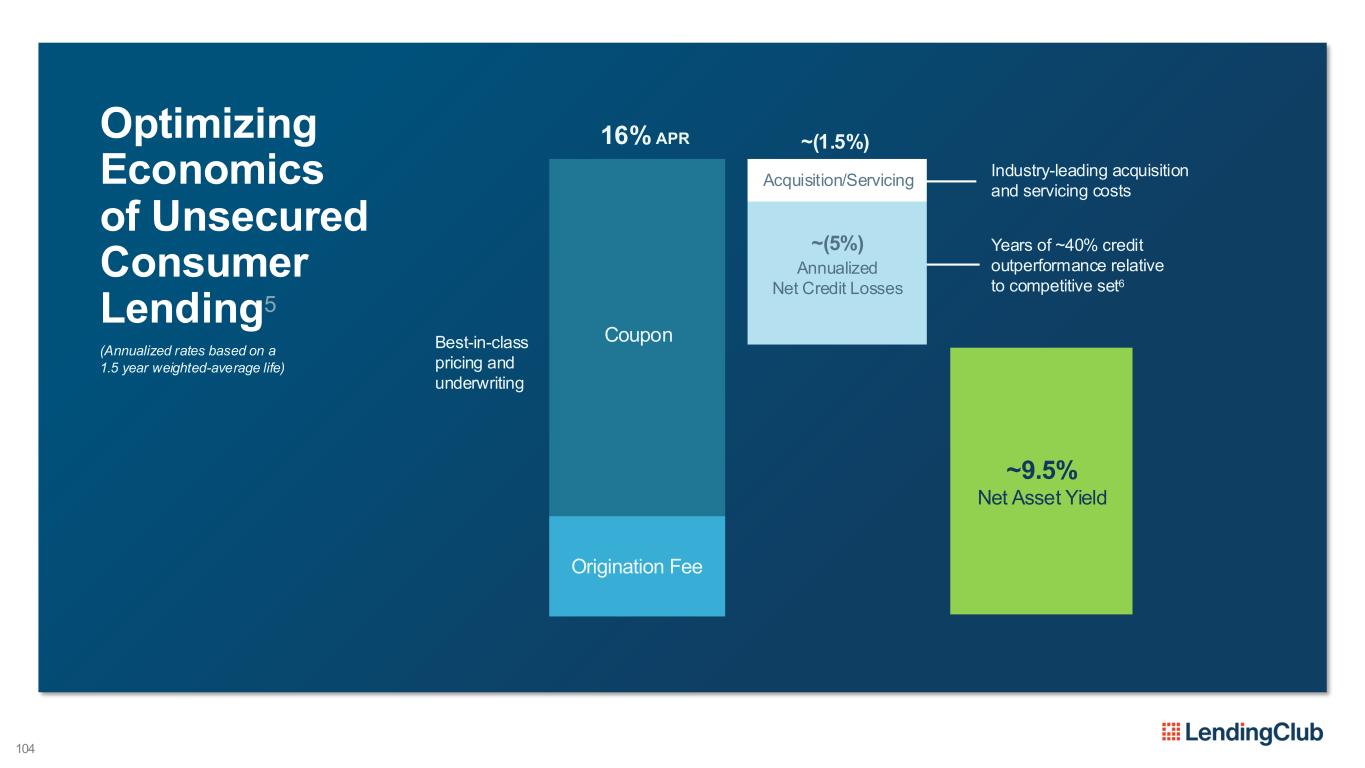
~(5%) 104 Optimizing Economics of Unsecured Consumer Lending5 Industry-leading acquisition and servicing costs Years of ~40% credit outperformance relative to competitive set6 ~(1.5%) Best-in-class pricing and underwriting (Annualized rates based on a 1.5 year weighted-average life) Coupon Origination Fee Acquisition/Servicing Annualized Net Credit Losses ~9.5% Net Asset Yield 16% APR
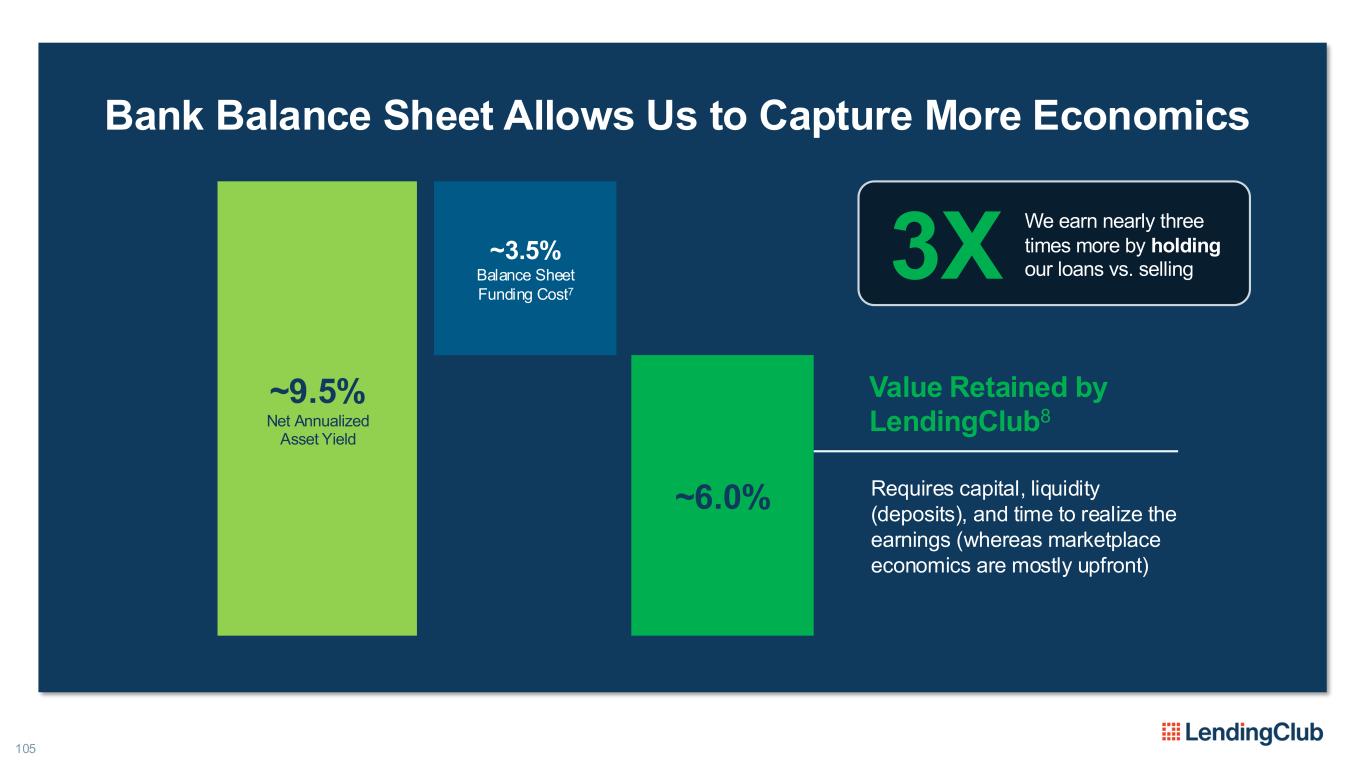
105 Bank Balance Sheet Allows Us to Capture More Economics Requires capital, liquidity (deposits), and time to realize the earnings (whereas marketplace economics are mostly upfront) Value Retained by LendingClub8 ~9.5% Net Annualized Asset Yield ~3.5% Balance Sheet Funding Cost7 ~6.0% 3X We earn nearly three times more by holding our loans vs. selling
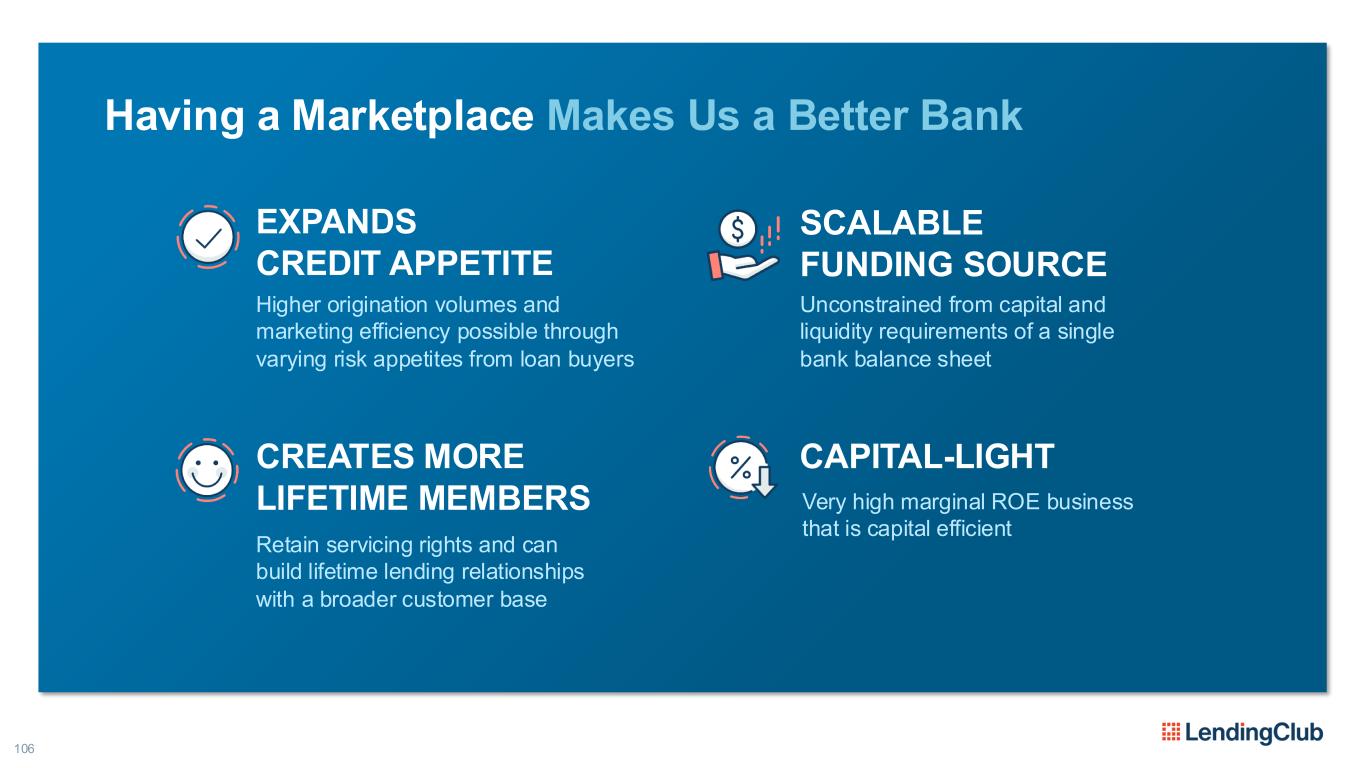
106 Having a Marketplace Makes Us a Better Bank SCALABLE FUNDING SOURCE Unconstrained from capital and liquidity requirements of a single bank balance sheet CAPITAL-LIGHT Very high marginal ROE business that is capital efficient CREATES MORE LIFETIME MEMBERS Retain servicing rights and can build lifetime lending relationships with a broader customer base EXPANDS CREDIT APPETITE Higher origination volumes and marketing efficiency possible through varying risk appetites from loan buyers
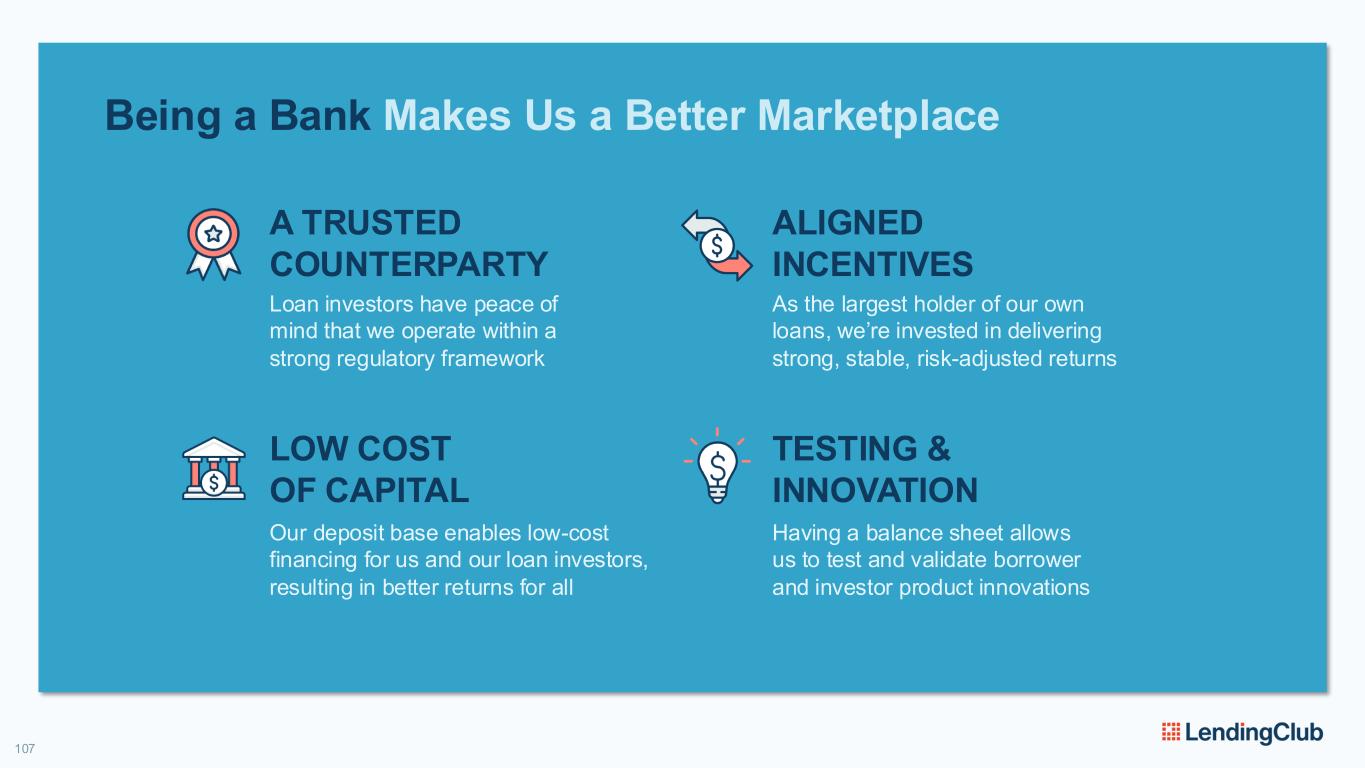
107 Being a Bank Makes Us a Better Marketplace A TRUSTED COUNTERPARTY Loan investors have peace of mind that we operate within a strong regulatory framework ALIGNED INCENTIVES As the largest holder of our own loans, we’re invested in delivering strong, stable, risk-adjusted returns LOW COST OF CAPITAL Our deposit base enables low-cost financing for us and our loan investors, resulting in better returns for all TESTING & INNOVATION Having a balance sheet allows us to test and validate borrower and investor product innovations
Marketplace Investor Panel 108
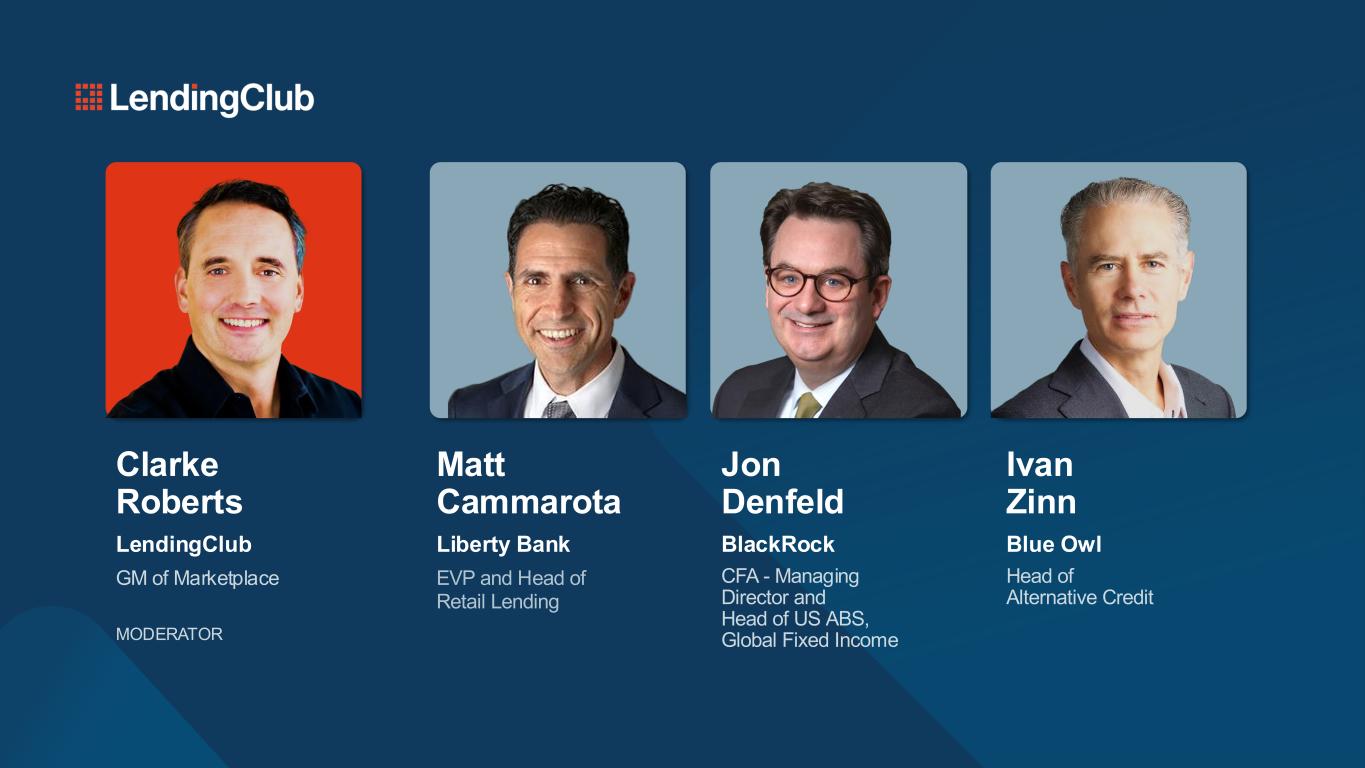
Clarke Roberts LendingClub GM of Marketplace Matt Cammarota Liberty Bank EVP and Head of Retail Lending Jon Denfeld BlackRock CFA - Managing Director and Head of US ABS, Global Fixed IncomeMODERATOR Ivan Zinn Blue Owl Head of Alternative Credit
Lunch 110 We’ll begin again in 35 minutes
Where the Model Can Take Us DREW LABENNE CHIEF FINANCIAL OFFICER
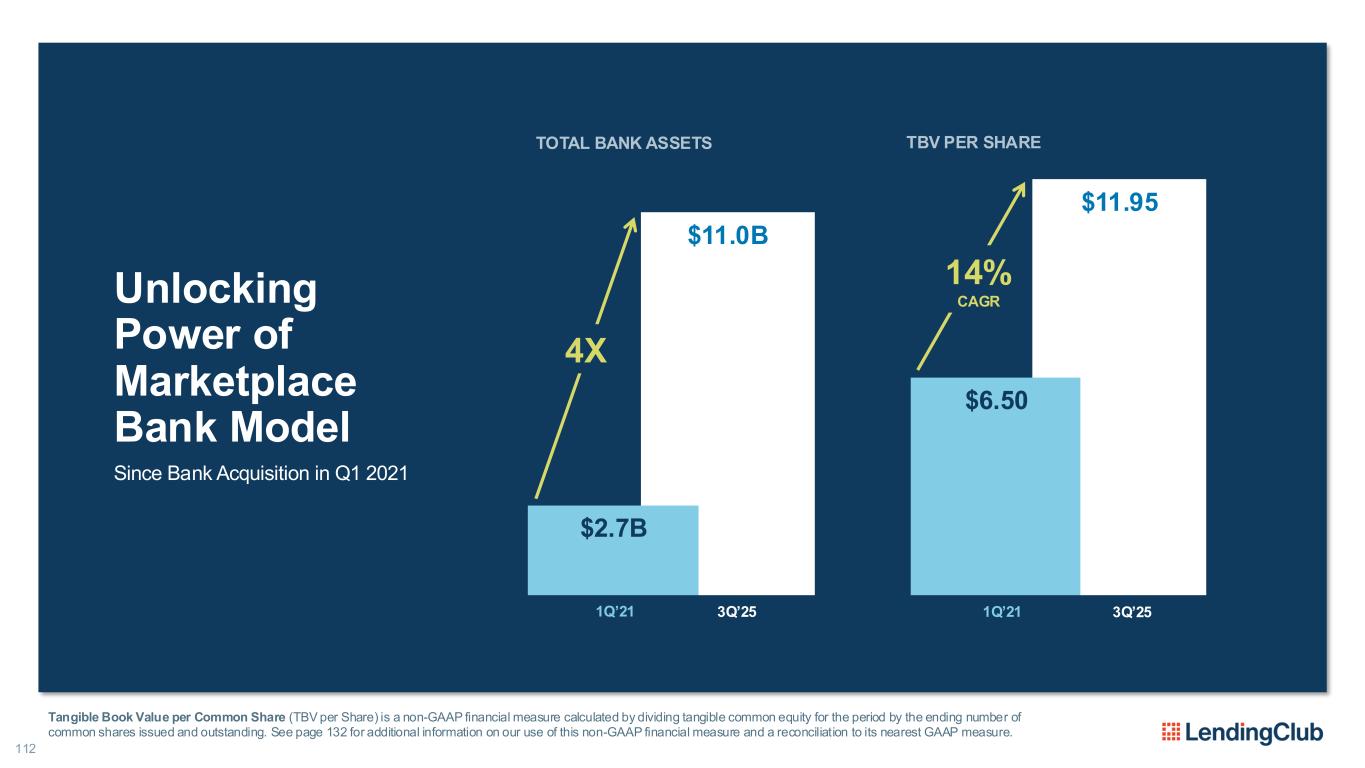
$11.0B $11.95 $2.7B $6.50 112 Unlocking Power of Marketplace Bank Model Since Bank Acquisition in Q1 2021 1Q’21 3Q’251Q’21 3Q’25 14% CAGR 4X TBV PER SHARETOTAL BANK ASSETS Tangible Book Value per Common Share (TBV per Share) is a non-GAAP financial measure calculated by dividing tangible common equity for the period by the ending number of common shares issued and outstanding. See page 132 for additional information on our use of this non-GAAP financial measure and a reconciliation to its nearest GAAP measure.
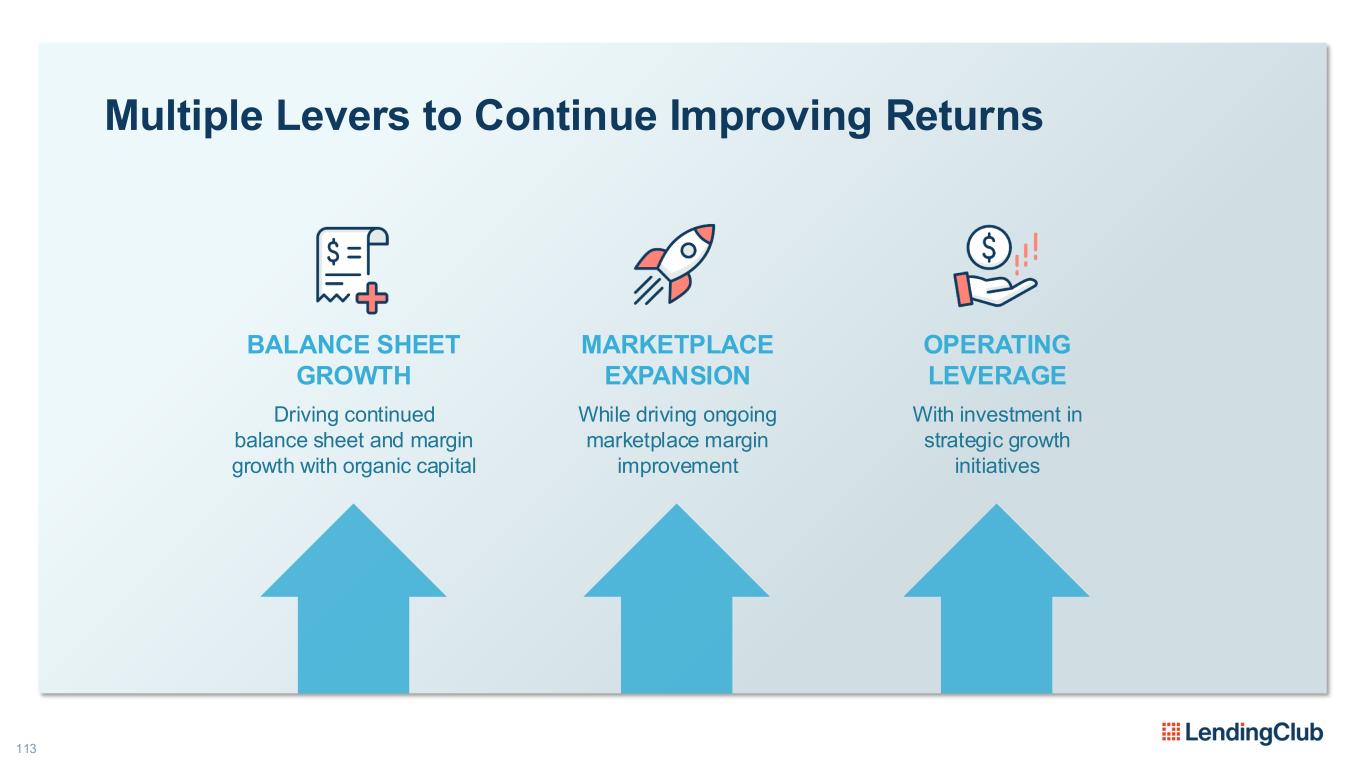
113 Multiple Levers to Continue Improving Returns BALANCE SHEET GROWTH Driving continued balance sheet and margin growth with organic capital MARKETPLACE EXPANSION OPERATING LEVERAGE With investment in strategic growth initiatives While driving ongoing marketplace margin improvement
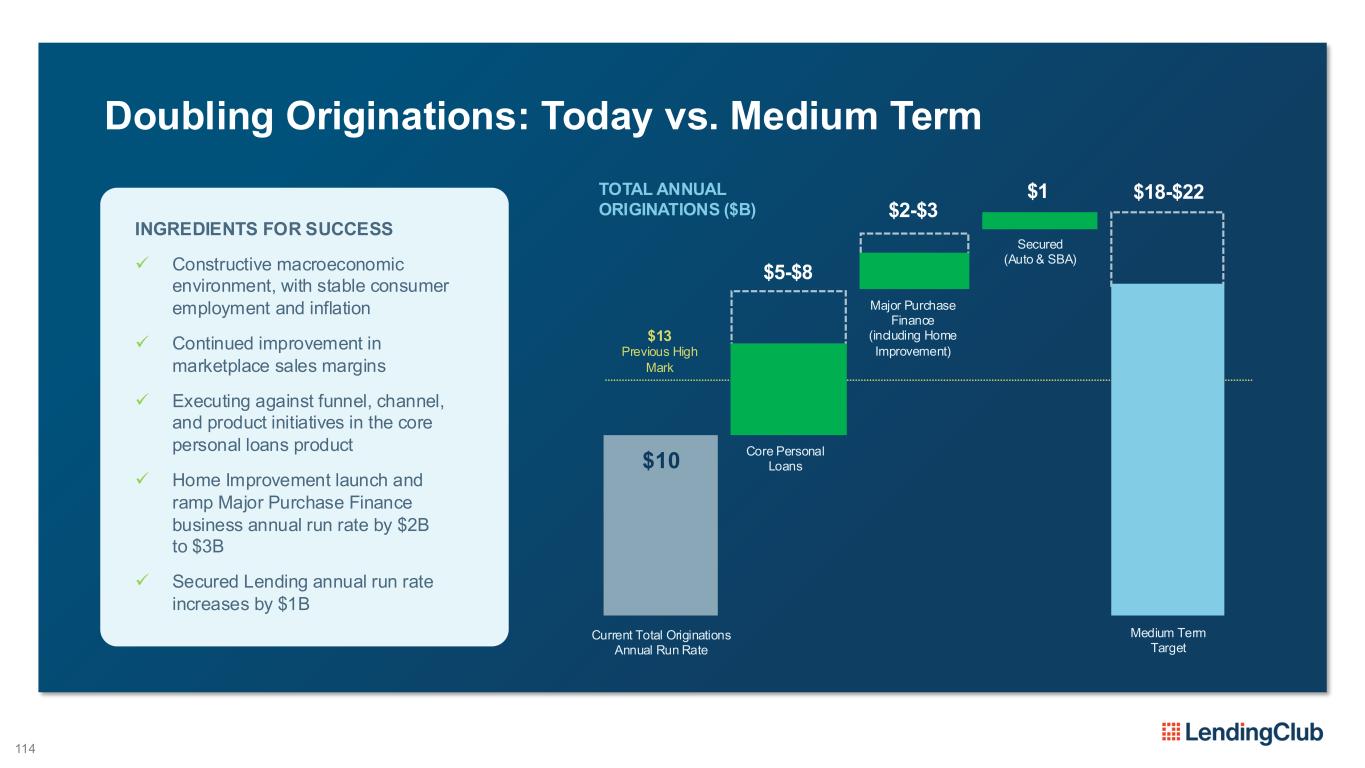
$13 Previous High Mark 114 Doubling Originations: Today vs. Medium Term INGREDIENTS FOR SUCCESS ✓ Constructive macroeconomic environment, with stable consumer employment and inflation ✓ Continued improvement in marketplace sales margins ✓ Executing against funnel, channel, and product initiatives in the core personal loans product ✓ Home Improvement launch and ramp Major Purchase Finance business annual run rate by $2B to $3B ✓ Secured Lending annual run rate increases by $1B TOTAL ANNUAL ORIGINATIONS ($B) $10 Current Total Originations Annual Run Rate Core Personal Loans Secured (Auto & SBA) Major Purchase Finance (including Home Improvement) $5-$8 $1 $2-$3 Medium Term Target $18-$22
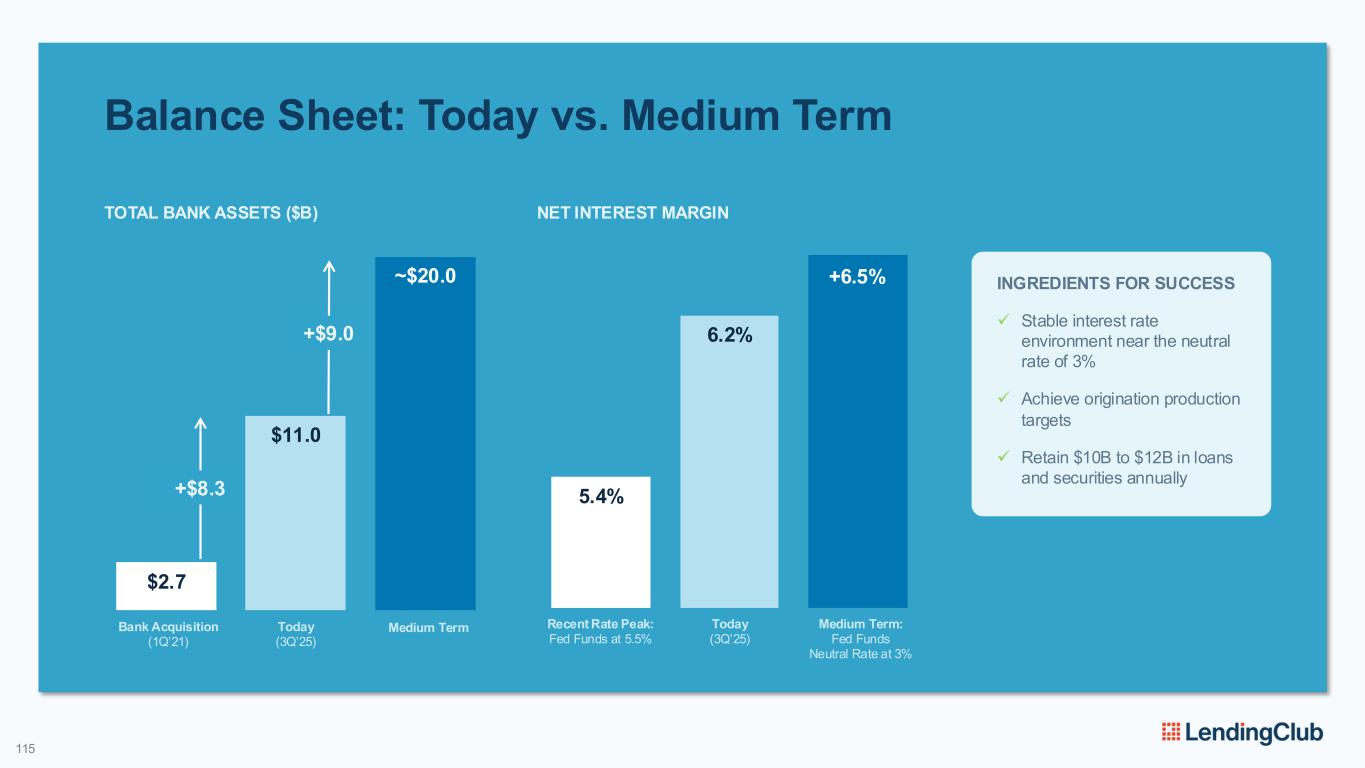
5.4% 6.2% 115 Balance Sheet: Today vs. Medium Term INGREDIENTS FOR SUCCESS ✓ Stable interest rate environment near the neutral rate of 3% ✓ Achieve origination production targets ✓ Retain $10B to $12B in loans and securities annually $2.7 $11.0 ~$20.0 TOTAL BANK ASSETS ($B) +6.5% +$8.3 +$9.0 NET INTEREST MARGIN Recent Rate Peak: Fed Funds at 5.5% Today (3Q’25) Medium Term: Fed Funds Neutral Rate at 3% Bank Acquisition (1Q’21) Today (3Q’25) Medium Term
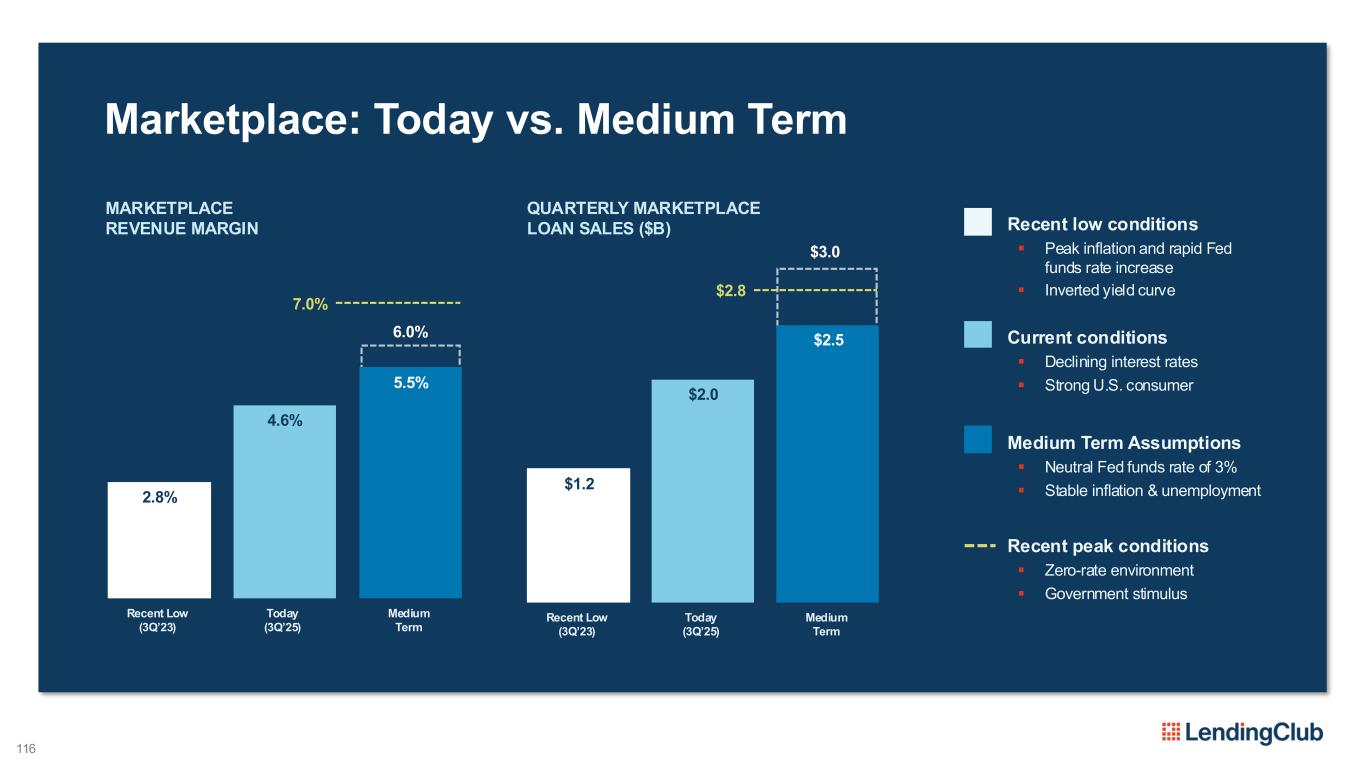
6.0% 5.5% Medium Term $3.0 $2.5 Medium Term 7.0% $2.8 116 Marketplace: Today vs. Medium Term QUARTERLY MARKETPLACE LOAN SALES ($B) MARKETPLACE REVENUE MARGIN Recent low conditions ▪ Peak inflation and rapid Fed funds rate increase ▪ Inverted yield curve Current conditions ▪ Declining interest rates ▪ Strong U.S. consumer 2.8% Recent Low (3Q’23) 4.6% Today (3Q’25) $1.2 Recent Low (3Q’23) $2.0 Today (3Q’25) Recent peak conditions ▪ Zero-rate environment ▪ Government stimulus Medium Term Assumptions ▪ Neutral Fed funds rate of 3% ▪ Stable inflation & unemployment
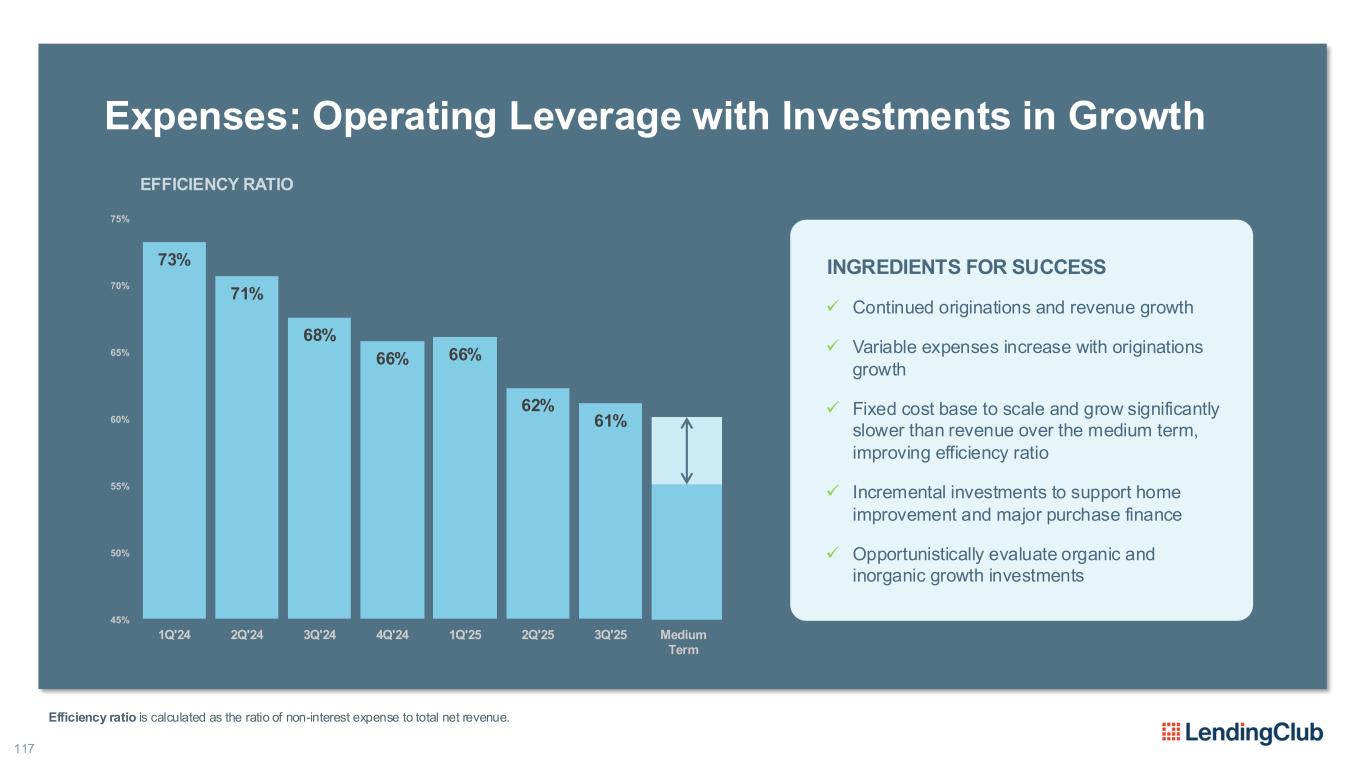
117 Expenses: Operating Leverage with Investments in Growth 73% 71% 68% 66% 66% 62% 61% 45% 50% 55% 60% 65% 70% 75% 1Q'24 2Q'24 3Q'24 4Q'24 1Q'25 2Q'25 3Q'25 Medium Term EFFICIENCY RATIO INGREDIENTS FOR SUCCESS ✓ Continued originations and revenue growth ✓ Variable expenses increase with originations growth ✓ Fixed cost base to scale and grow significantly slower than revenue over the medium term, improving efficiency ratio ✓ Incremental investments to support home improvement and major purchase finance ✓ Opportunistically evaluate organic and inorganic growth investments Efficiency ratio is calculated as the ratio of non-interest expense to total net revenue.
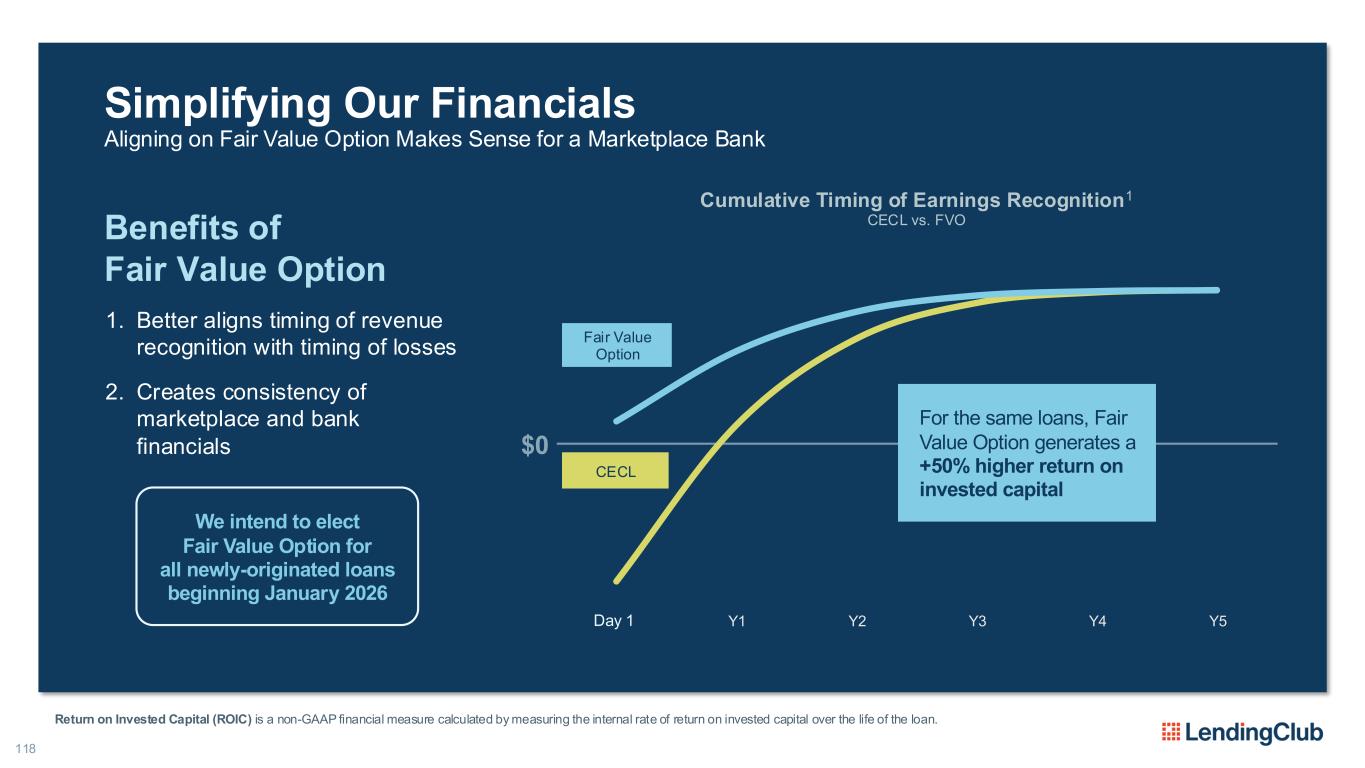
118 Simplifying Our Financials Aligning on Fair Value Option Makes Sense for a Marketplace Bank Benefits of Fair Value Option 1. Better aligns timing of revenue recognition with timing of losses 2. Creates consistency of marketplace and bank financials D1 Y1 Y2 Y3 Y4 Y5 Cumulative Timing of Earnings Recognition1 CECL vs. FVO CECL For the same loans, Fair Value Option generates a +50% higher return on invested capital Fair Value Option Day 1 We intend to elect Fair Value Option for all newly-originated loans beginning January 2026 $0 Return on Invested Capital (ROIC) is a non-GAAP financial measure calculated by measuring the internal rate of return on invested capital over the life of the loan.
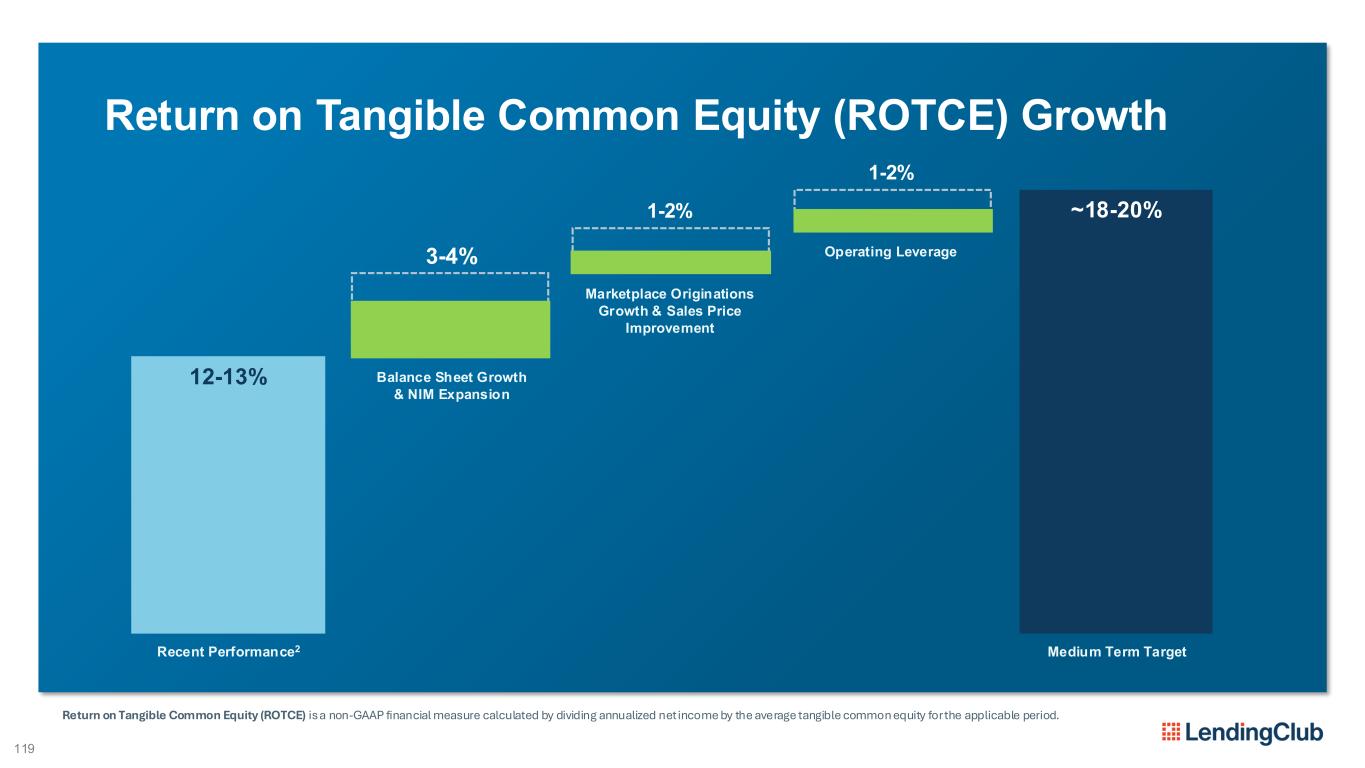
119 Return on Tangible Common Equity (ROTCE) Growth Recent Performance2 Medium Term Target Balance Sheet Growth & NIM Expansion Marketplace Originations Growth & Sales Price Improvement Operating Leverage 1-2% ~18-20% 12-13% Return on Tangible Common Equity (ROTCE) is a non-GAAP financial measure calculated by dividing annualized net income by the average tangible common equity for the applicable period. 12-13% ~18-20% 3-4% 1-2%
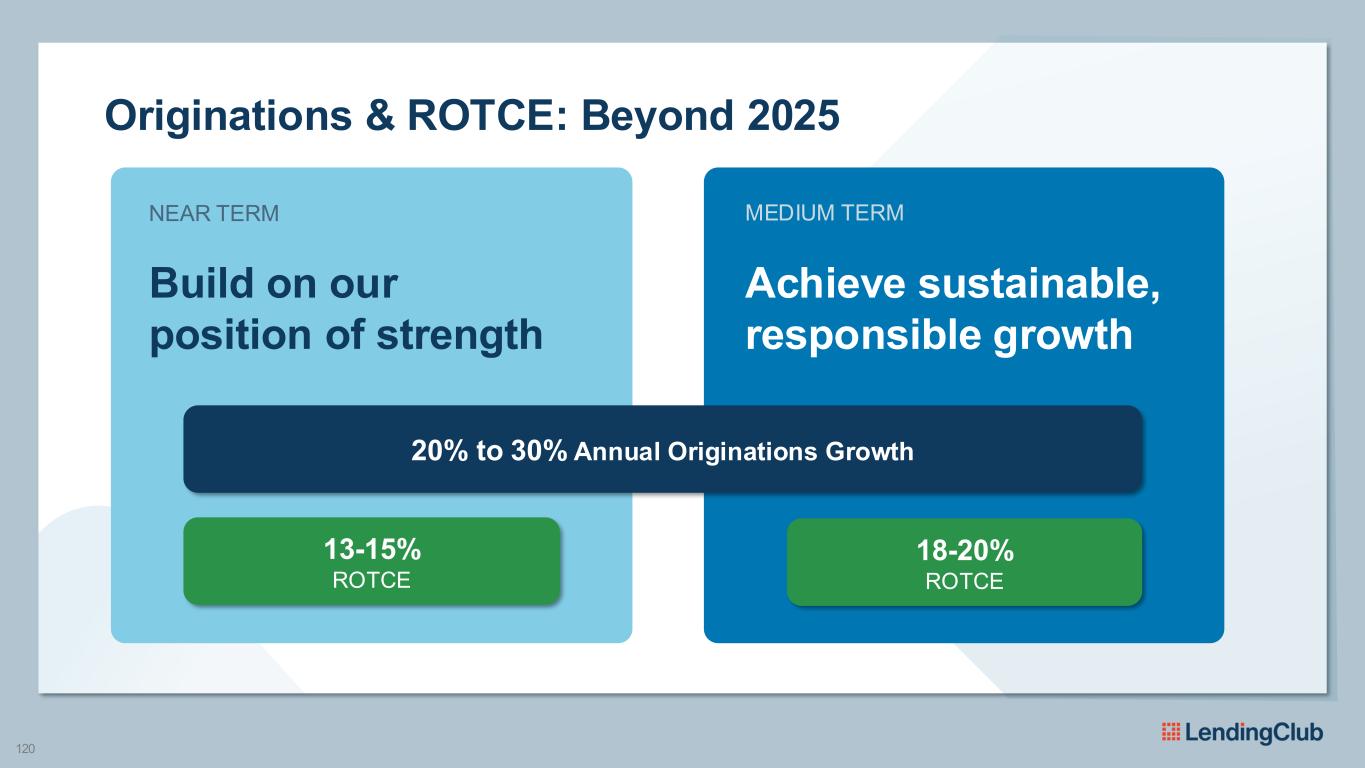
120 Originations & ROTCE: Beyond 2025 NEAR TERM MEDIUM TERM Build on our position of strength Achieve sustainable, responsible growth 13-15% ROTCE 18-20% ROTCE 20% to 30% Annual Originations Growth
Why Invest Now? 121
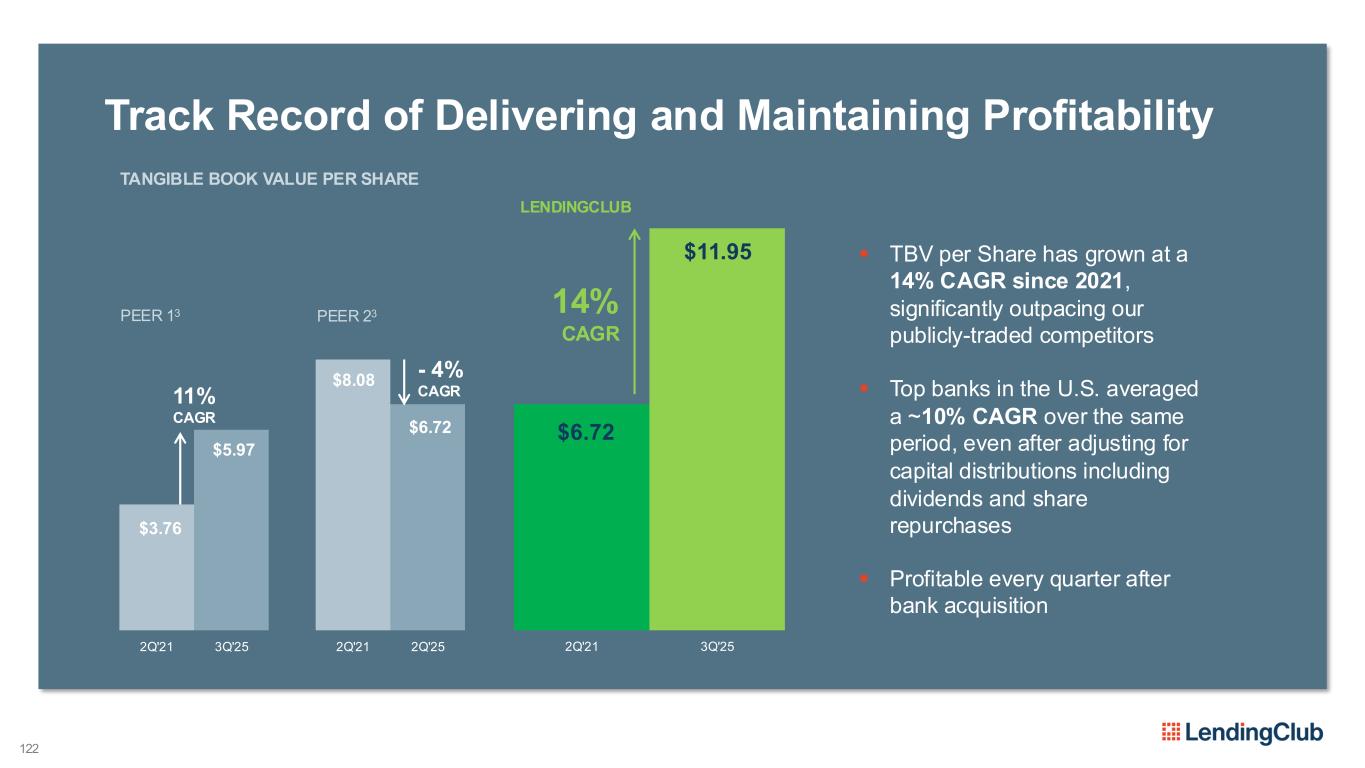
$8.08 $6.72 2Q'21 2Q'25 122 Track Record of Delivering and Maintaining Profitability ▪ TBV per Share has grown at a 14% CAGR since 2021, significantly outpacing our publicly-traded competitors ▪ Top banks in the U.S. averaged a ~10% CAGR over the same period, even after adjusting for capital distributions including dividends and share repurchases ▪ Profitable every quarter after bank acquisition TANGIBLE BOOK VALUE PER SHARE LENDINGCLUB $3.76 $5.97 2Q'21 3Q'25 PEER 13 11% CAGR PEER 23 - 4% CAGR $6.72 $11.95 2Q'21 3Q'25 14% CAGR
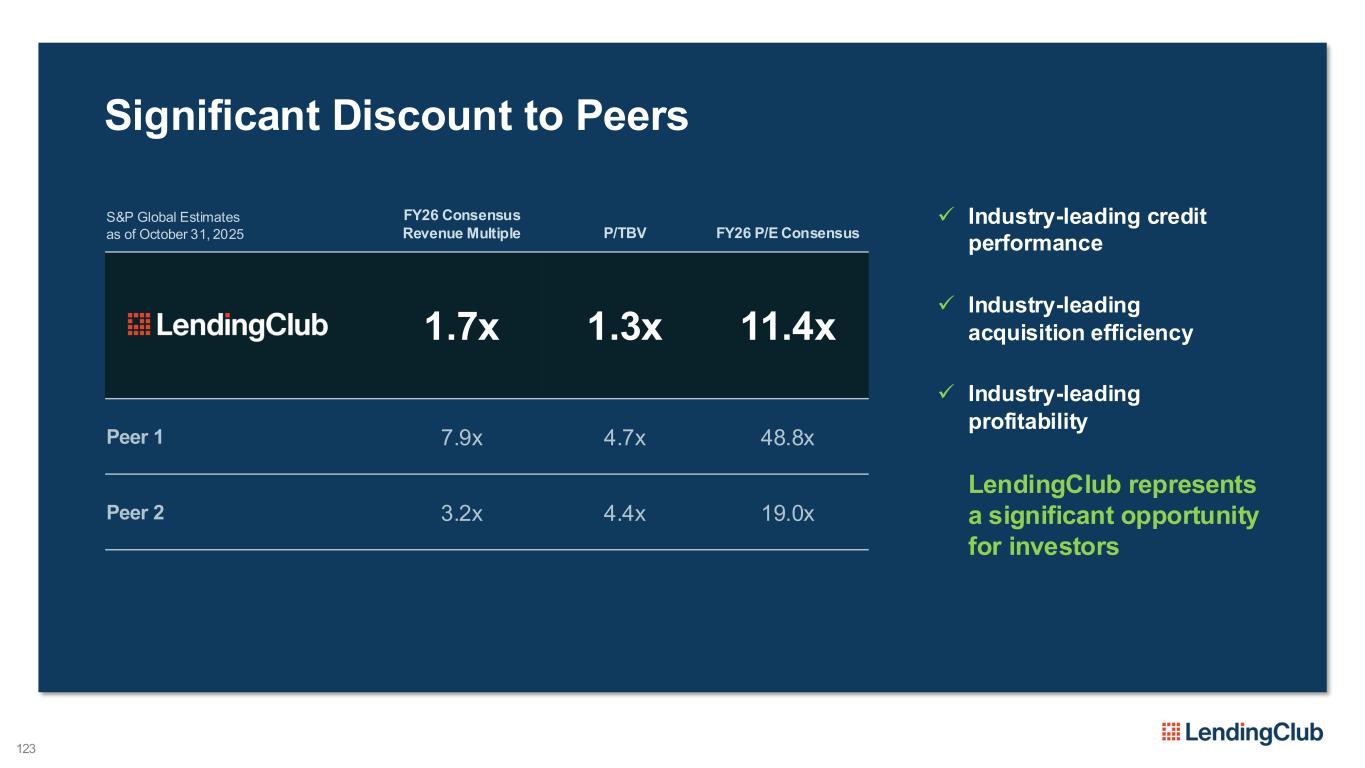
S&P Global Estimates as of October 31, 2025 FY26 Consensus Revenue Multiple P/TBV FY26 P/E Consensus 1.7x 1.3x 11.4x Peer 1 7.9x 4.7x 48.8x Peer 2 3.2x 4.4x 19.0x 123 Significant Discount to Peers ✓ Industry-leading credit performance ✓ Industry-leading acquisition efficiency ✓ Industry-leading profitability LendingClub represents a significant opportunity for investors
124 $100M Stock Repurchase & Acquisition Program ✓ Strong growth in originations and earnings provide high-level of internal capital generation ✓ Current excess capital position will simultaneously support announced program and growth objectives ✓ Valuation represents opportunity to deploy capital at attractive returns
Questions & Answers 125 Please raise your hand so we can pass you a microphone
Closing Comments SCOTT SANBORN CHIEF EXECUTIVE OFFICER
127 We are radically different today.
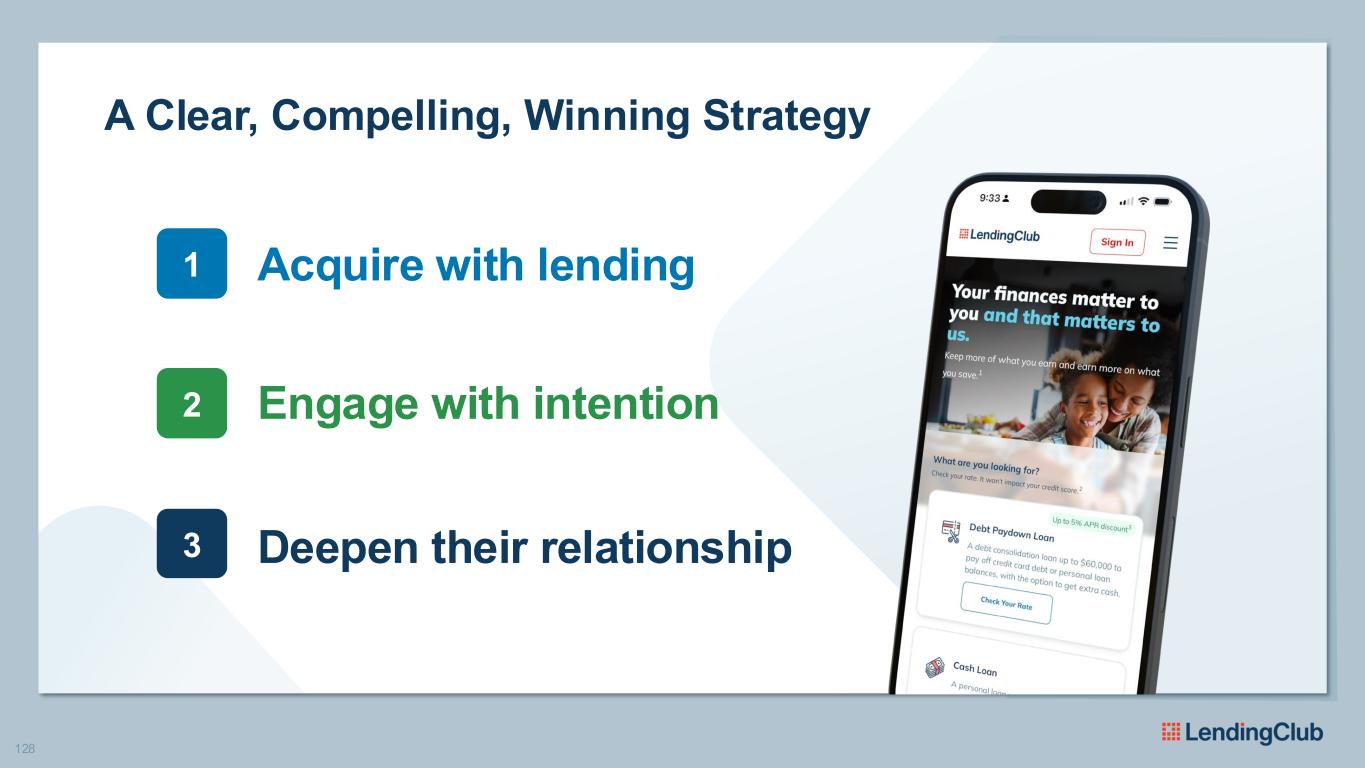
128 A Clear, Compelling, Winning Strategy 1 Acquire with lending 2 Engage with intention 3 Deepen their relationship
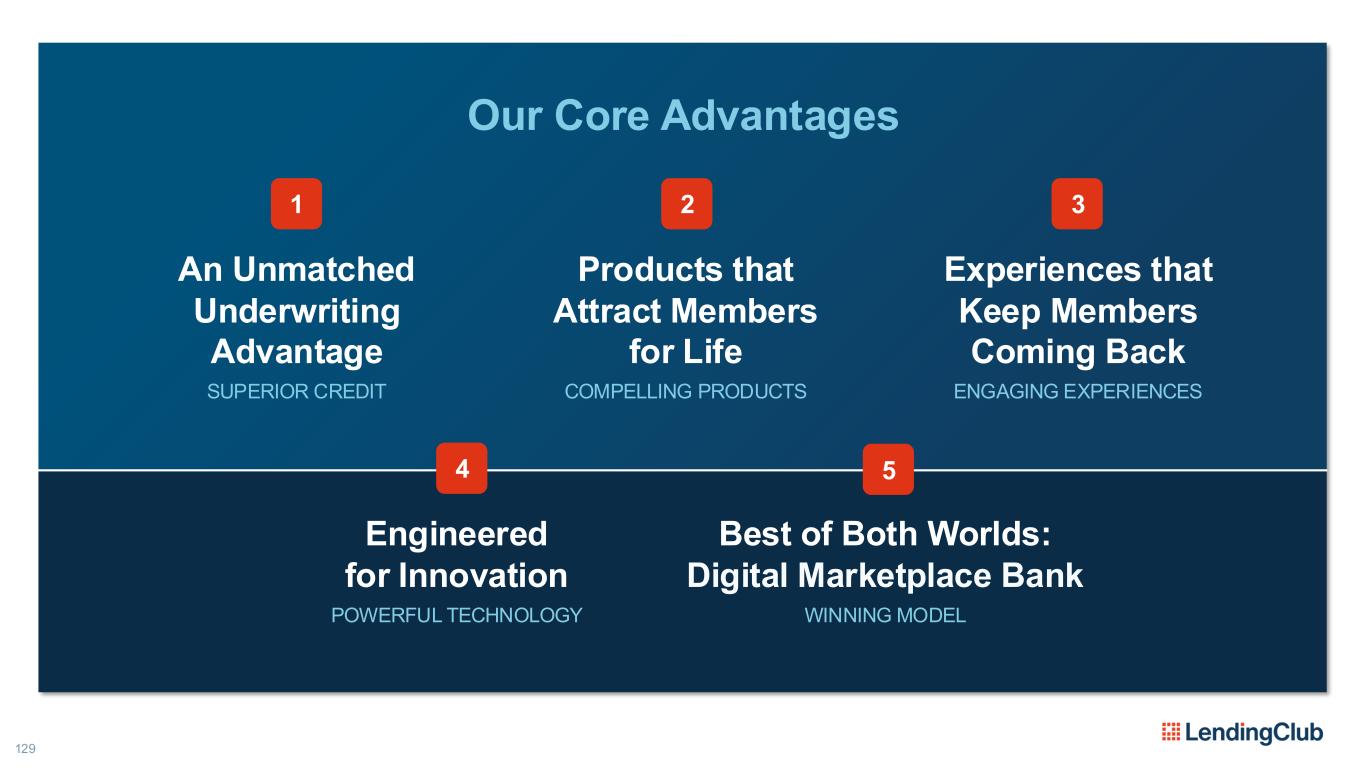
129 Our Core Advantages An Unmatched Underwriting Advantage SUPERIOR CREDIT 1 Products that Attract Members for Life COMPELLING PRODUCTS 2 Experiences that Keep Members Coming Back ENGAGING EXPERIENCES 3 Best of Both Worlds: Digital Marketplace Bank WINNING MODEL 5 Engineered for Innovation POWERFUL TECHNOLOGY 4
130 The math is simple. The path is clear.
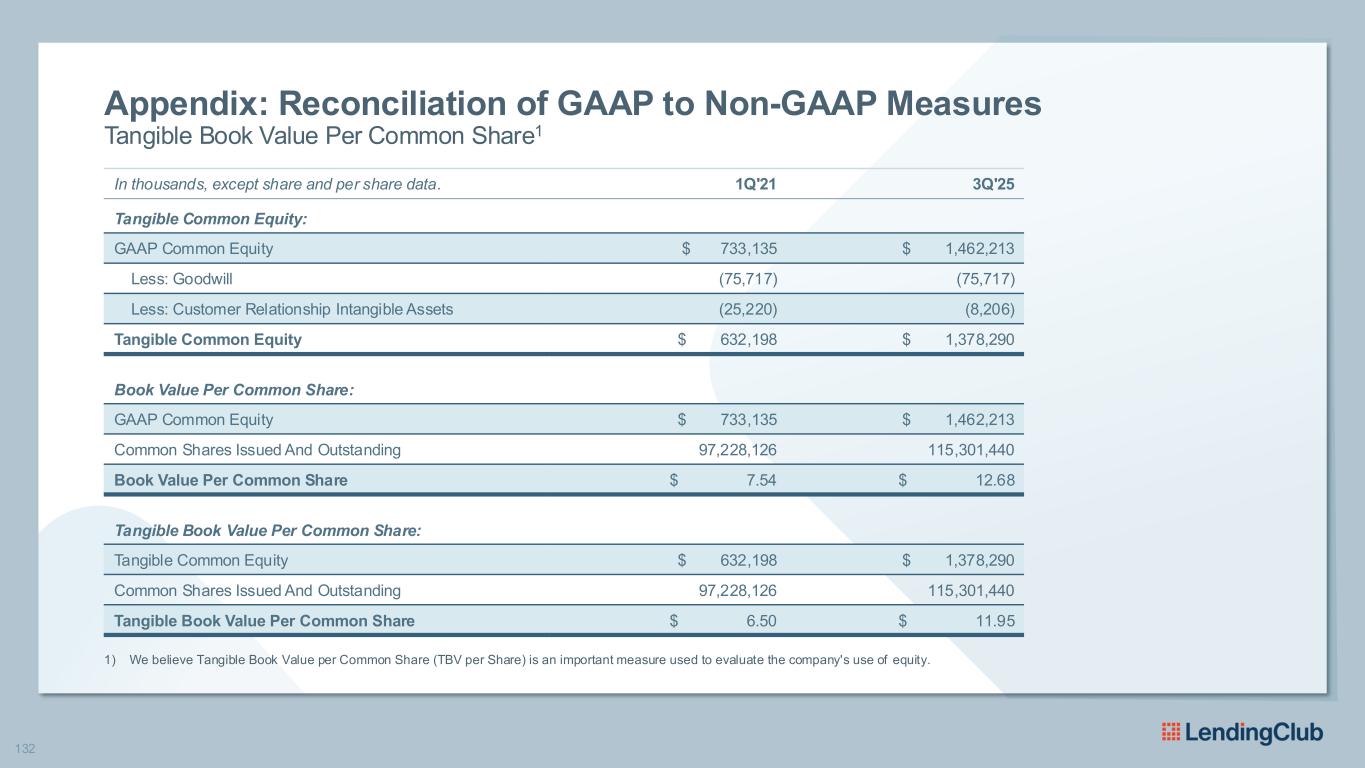
132 Appendix: Reconciliation of GAAP to Non-GAAP Measures Tangible Book Value Per Common Share1 1) We believe Tangible Book Value per Common Share (TBV per Share) is an important measure used to evaluate the company's use of equity. In thousands, except share and per share data. 1Q'21 3Q'25 Tangible Common Equity: GAAP Common Equity $ 733,135 $ 1,462,213 Less: Goodwill (75,717) (75,717) Less: Customer Relationship Intangible Assets (25,220) (8,206) Tangible Common Equity $ 632,198 $ 1,378,290 Book Value Per Common Share: GAAP Common Equity $ 733,135 $ 1,462,213 Common Shares Issued And Outstanding 97,228,126 115,301,440 Book Value Per Common Share $ 7.54 $ 12.68 Tangible Book Value Per Common Share: Tangible Common Equity $ 632,198 $ 1,378,290 Common Shares Issued And Outstanding 97,228,126 115,301,440 Tangible Book Value Per Common Share $ 6.50 $ 11.95
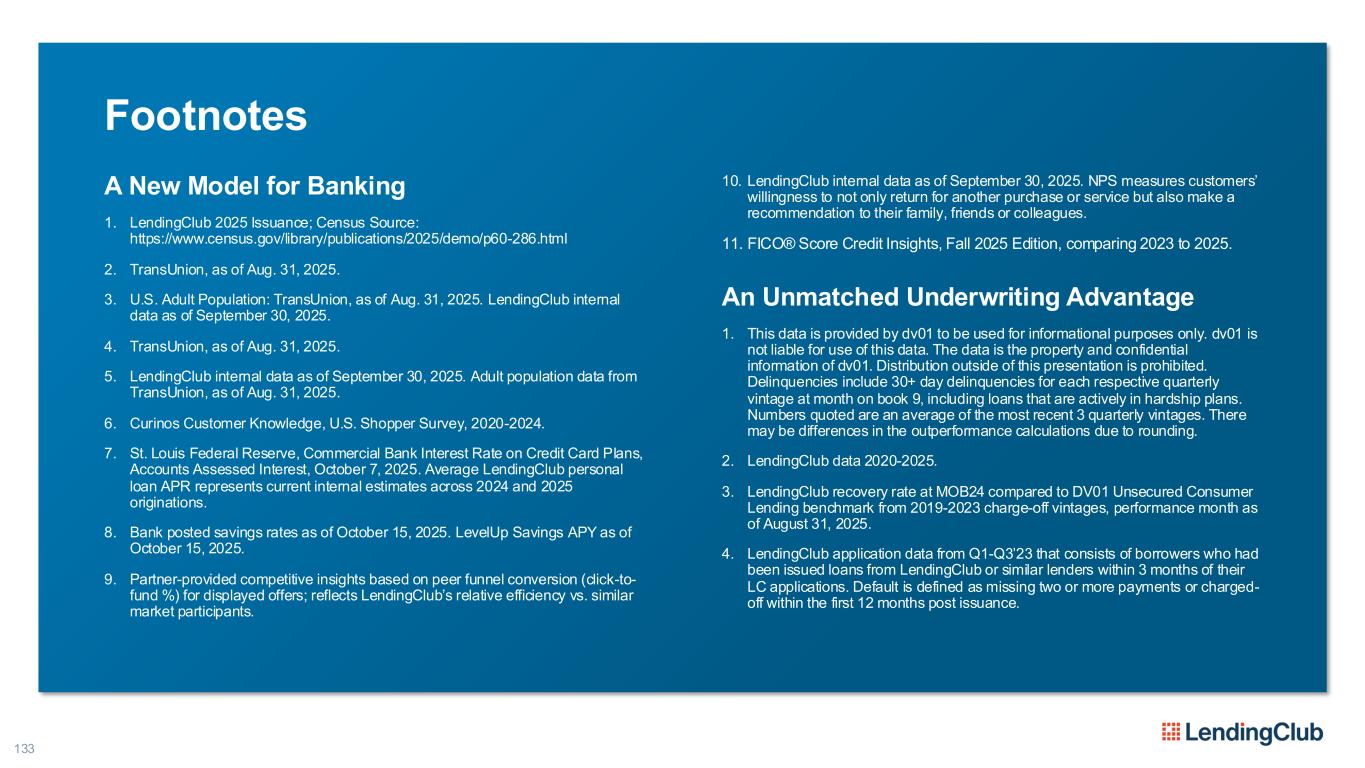
133 Footnotes A New Model for Banking 1. LendingClub 2025 Issuance; Census Source: https://www.census.gov/library/publications/2025/demo/p60-286.html 2. TransUnion, as of Aug. 31, 2025. 3. U.S. Adult Population: TransUnion, as of Aug. 31, 2025. LendingClub internal data as of September 30, 2025. 4. TransUnion, as of Aug. 31, 2025. 5. LendingClub internal data as of September 30, 2025. Adult population data from TransUnion, as of Aug. 31, 2025. 6. Curinos Customer Knowledge, U.S. Shopper Survey, 2020-2024. 7. St. Louis Federal Reserve, Commercial Bank Interest Rate on Credit Card Plans, Accounts Assessed Interest, October 7, 2025. Average LendingClub personal loan APR represents current internal estimates across 2024 and 2025 originations. 8. Bank posted savings rates as of October 15, 2025. LevelUp Savings APY as of October 15, 2025. 9. Partner-provided competitive insights based on peer funnel conversion (click-to- fund %) for displayed offers; reflects LendingClub’s relative efficiency vs. similar market participants. 10. LendingClub internal data as of September 30, 2025. NPS measures customers’ willingness to not only return for another purchase or service but also make a recommendation to their family, friends or colleagues. 11. FICO® Score Credit Insights, Fall 2025 Edition, comparing 2023 to 2025. An Unmatched Underwriting Advantage 1. This data is provided by dv01 to be used for informational purposes only. dv01 is not liable for use of this data. The data is the property and confidential information of dv01. Distribution outside of this presentation is prohibited. Delinquencies include 30+ day delinquencies for each respective quarterly vintage at month on book 9, including loans that are actively in hardship plans. Numbers quoted are an average of the most recent 3 quarterly vintages. There may be differences in the outperformance calculations due to rounding. 2. LendingClub data 2020-2025. 3. LendingClub recovery rate at MOB24 compared to DV01 Unsecured Consumer Lending benchmark from 2019-2023 charge-off vintages, performance month as of August 31, 2025. 4. LendingClub application data from Q1-Q3’23 that consists of borrowers who had been issued loans from LendingClub or similar lenders within 3 months of their LC applications. Default is defined as missing two or more payments or charged- off within the first 12 months post issuance.
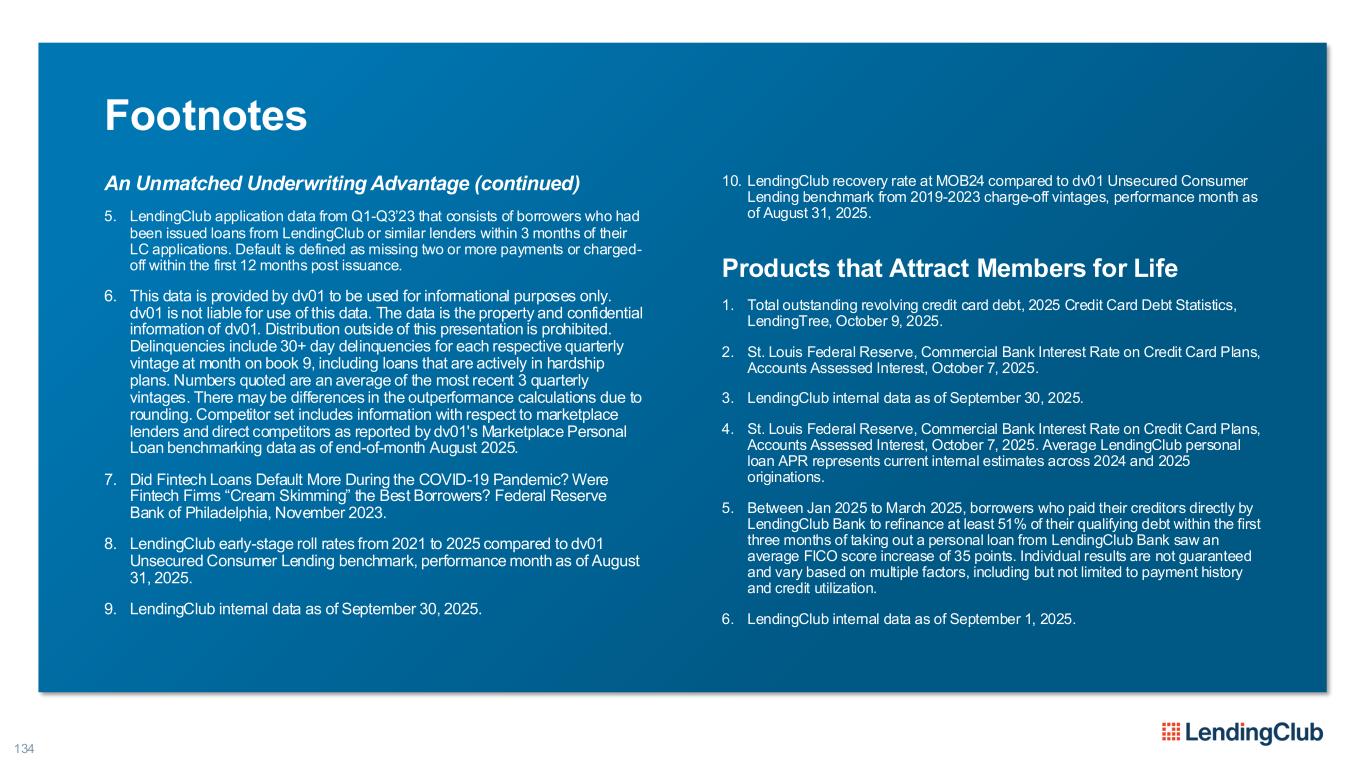
134 Footnotes An Unmatched Underwriting Advantage (continued) 5. LendingClub application data from Q1-Q3’23 that consists of borrowers who had been issued loans from LendingClub or similar lenders within 3 months of their LC applications. Default is defined as missing two or more payments or charged- off within the first 12 months post issuance. 6. This data is provided by dv01 to be used for informational purposes only. dv01 is not liable for use of this data. The data is the property and confidential information of dv01. Distribution outside of this presentation is prohibited. Delinquencies include 30+ day delinquencies for each respective quarterly vintage at month on book 9, including loans that are actively in hardship plans. Numbers quoted are an average of the most recent 3 quarterly vintages. There may be differences in the outperformance calculations due to rounding. Competitor set includes information with respect to marketplace lenders and direct competitors as reported by dv01's Marketplace Personal Loan benchmarking data as of end-of-month August 2025. 7. Did Fintech Loans Default More During the COVID-19 Pandemic? Were Fintech Firms “Cream Skimming” the Best Borrowers? Federal Reserve Bank of Philadelphia, November 2023. 8. LendingClub early-stage roll rates from 2021 to 2025 compared to dv01 Unsecured Consumer Lending benchmark, performance month as of August 31, 2025. 9. LendingClub internal data as of September 30, 2025. 10. LendingClub recovery rate at MOB24 compared to dv01 Unsecured Consumer Lending benchmark from 2019-2023 charge-off vintages, performance month as of August 31, 2025. Products that Attract Members for Life 1. Total outstanding revolving credit card debt, 2025 Credit Card Debt Statistics, LendingTree, October 9, 2025. 2. St. Louis Federal Reserve, Commercial Bank Interest Rate on Credit Card Plans, Accounts Assessed Interest, October 7, 2025. 3. LendingClub internal data as of September 30, 2025. 4. St. Louis Federal Reserve, Commercial Bank Interest Rate on Credit Card Plans, Accounts Assessed Interest, October 7, 2025. Average LendingClub personal loan APR represents current internal estimates across 2024 and 2025 originations. 5. Between Jan 2025 to March 2025, borrowers who paid their creditors directly by LendingClub Bank to refinance at least 51% of their qualifying debt within the first three months of taking out a personal loan from LendingClub Bank saw an average FICO score increase of 35 points. Individual results are not guaranteed and vary based on multiple factors, including but not limited to payment history and credit utilization. 6. LendingClub internal data as of September 1, 2025.
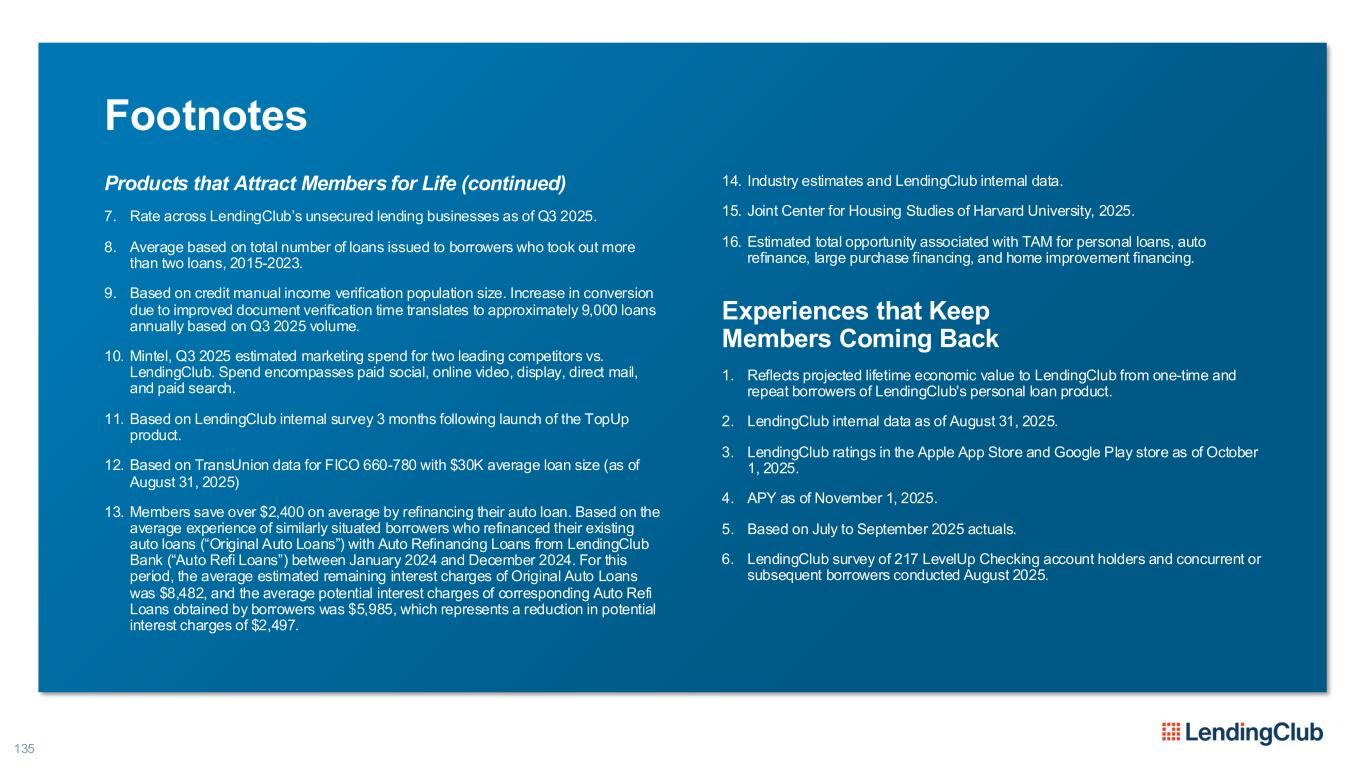
135 Footnotes Products that Attract Members for Life (continued) 7. Rate across LendingClub’s unsecured lending businesses as of Q3 2025. 8. Average based on total number of loans issued to borrowers who took out more than two loans, 2015-2023. 9. Based on credit manual income verification population size. Increase in conversion due to improved document verification time translates to approximately 9,000 loans annually based on Q3 2025 volume. 10. Mintel, Q3 2025 estimated marketing spend for two leading competitors vs. LendingClub. Spend encompasses paid social, online video, display, direct mail, and paid search. 11. Based on LendingClub internal survey 3 months following launch of the TopUp product. 12. Based on TransUnion data for FICO 660-780 with $30K average loan size (as of August 31, 2025) 13. Members save over $2,400 on average by refinancing their auto loan. Based on the average experience of similarly situated borrowers who refinanced their existing auto loans (“Original Auto Loans”) with Auto Refinancing Loans from LendingClub Bank (“Auto Refi Loans”) between January 2024 and December 2024. For this period, the average estimated remaining interest charges of Original Auto Loans was $8,482, and the average potential interest charges of corresponding Auto Refi Loans obtained by borrowers was $5,985, which represents a reduction in potential interest charges of $2,497. 14. Industry estimates and LendingClub internal data. 15. Joint Center for Housing Studies of Harvard University, 2025. 16. Estimated total opportunity associated with TAM for personal loans, auto refinance, large purchase financing, and home improvement financing. Experiences that Keep Members Coming Back 1. Reflects projected lifetime economic value to LendingClub from one-time and repeat borrowers of LendingClub's personal loan product. 2. LendingClub internal data as of August 31, 2025. 3. LendingClub ratings in the Apple App Store and Google Play store as of October 1, 2025. 4. APY as of November 1, 2025. 5. Based on July to September 2025 actuals. 6. LendingClub survey of 217 LevelUp Checking account holders and concurrent or subsequent borrowers conducted August 2025.
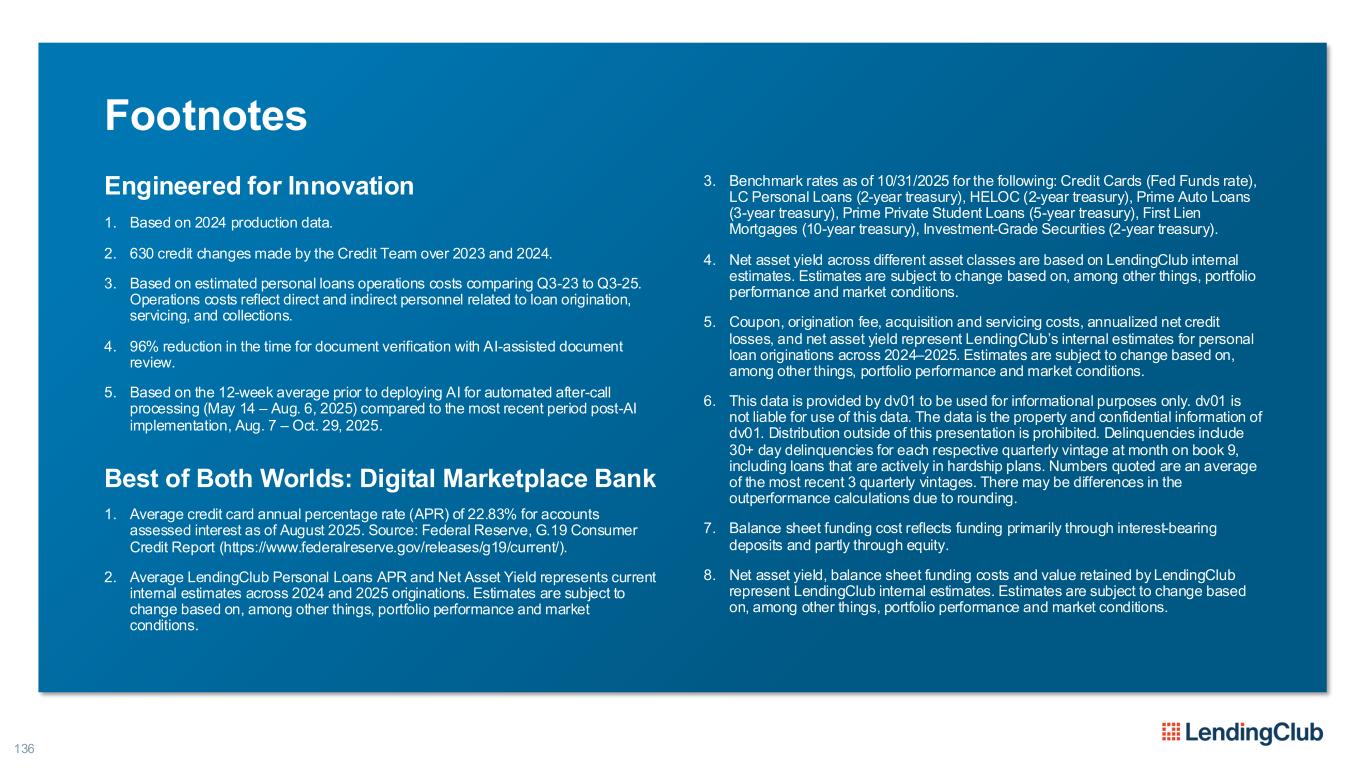
136 Footnotes Engineered for Innovation 1. Based on 2024 production data. 2. 630 credit changes made by the Credit Team over 2023 and 2024. 3. Based on estimated personal loans operations costs comparing Q3-23 to Q3-25. Operations costs reflect direct and indirect personnel related to loan origination, servicing, and collections. 4. 96% reduction in the time for document verification with AI-assisted document review. 5. Based on the 12-week average prior to deploying AI for automated after-call processing (May 14 – Aug. 6, 2025) compared to the most recent period post-AI implementation, Aug. 7 – Oct. 29, 2025. Best of Both Worlds: Digital Marketplace Bank 1. Average credit card annual percentage rate (APR) of 22.83% for accounts assessed interest as of August 2025. Source: Federal Reserve, G.19 Consumer Credit Report (https://www.federalreserve.gov/releases/g19/current/). 2. Average LendingClub Personal Loans APR and Net Asset Yield represents current internal estimates across 2024 and 2025 originations. Estimates are subject to change based on, among other things, portfolio performance and market conditions. 3. Benchmark rates as of 10/31/2025 for the following: Credit Cards (Fed Funds rate), LC Personal Loans (2-year treasury), HELOC (2-year treasury), Prime Auto Loans (3-year treasury), Prime Private Student Loans (5-year treasury), First Lien Mortgages (10-year treasury), Investment-Grade Securities (2-year treasury). 4. Net asset yield across different asset classes are based on LendingClub internal estimates. Estimates are subject to change based on, among other things, portfolio performance and market conditions. 5. Coupon, origination fee, acquisition and servicing costs, annualized net credit losses, and net asset yield represent LendingClub’s internal estimates for personal loan originations across 2024–2025. Estimates are subject to change based on, among other things, portfolio performance and market conditions. 6. This data is provided by dv01 to be used for informational purposes only. dv01 is not liable for use of this data. The data is the property and confidential information of dv01. Distribution outside of this presentation is prohibited. Delinquencies include 30+ day delinquencies for each respective quarterly vintage at month on book 9, including loans that are actively in hardship plans. Numbers quoted are an average of the most recent 3 quarterly vintages. There may be differences in the outperformance calculations due to rounding. 7. Balance sheet funding cost reflects funding primarily through interest-bearing deposits and partly through equity. 8. Net asset yield, balance sheet funding costs and value retained by LendingClub represent LendingClub internal estimates. Estimates are subject to change based on, among other things, portfolio performance and market conditions.
137 Footnotes Where the Model Can Take Us 1. Cumulative Timing of Earnings Recognition reflects LendingClub internal estimates. Estimates are subject to change based on, among other things, portfolio performance and market conditions. 2. Recent performance reflects ROTCE of 11.8% in 2Q 2025 and 13.2% in 3Q 2025. 3. S&P Global figures as of October 31, 2025.
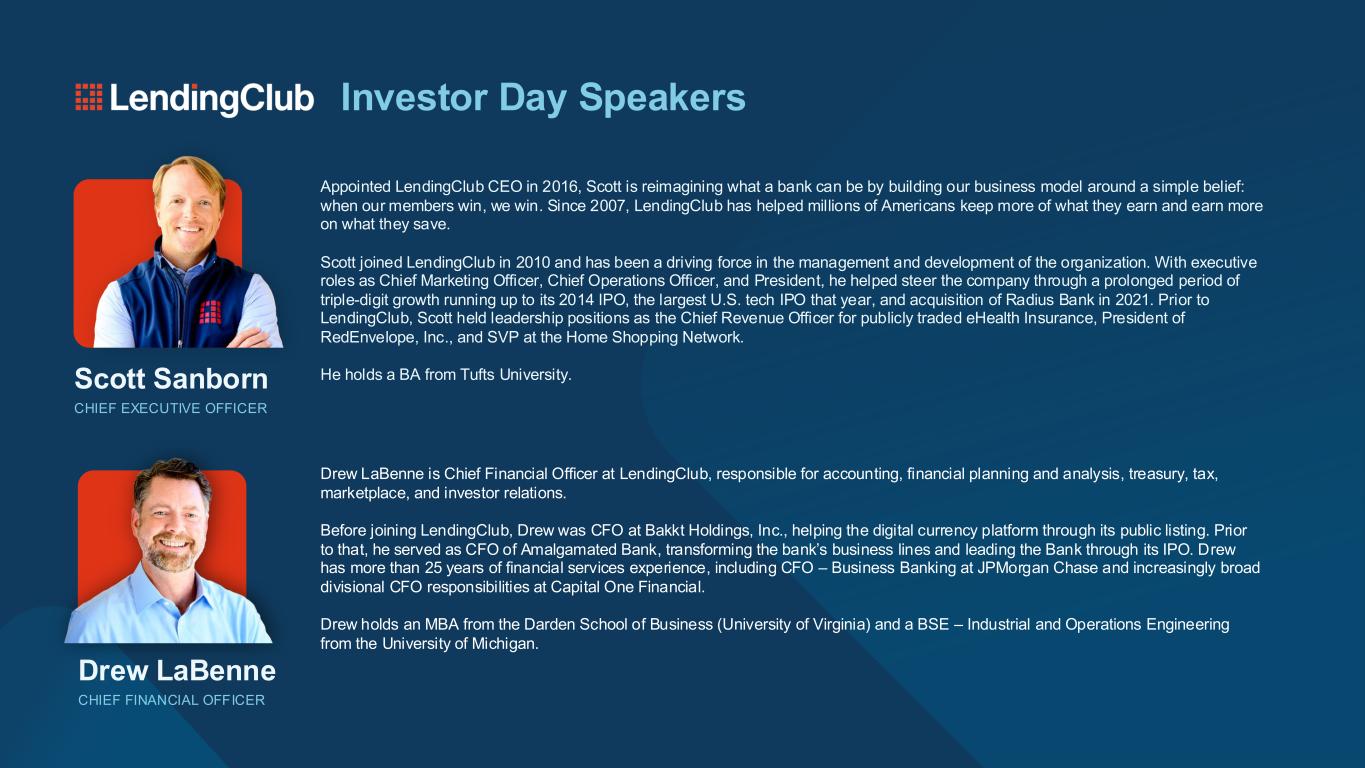
Investor Day Speakers Appointed LendingClub CEO in 2016, Scott is reimagining what a bank can be by building our business model around a simple belief: when our members win, we win. Since 2007, LendingClub has helped millions of Americans keep more of what they earn and earn more on what they save. Scott joined LendingClub in 2010 and has been a driving force in the management and development of the organization. With executive roles as Chief Marketing Officer, Chief Operations Officer, and President, he helped steer the company through a prolonged period of triple-digit growth running up to its 2014 IPO, the largest U.S. tech IPO that year, and acquisition of Radius Bank in 2021. Prior to LendingClub, Scott held leadership positions as the Chief Revenue Officer for publicly traded eHealth Insurance, President of RedEnvelope, Inc., and SVP at the Home Shopping Network. He holds a BA from Tufts University.Scott Sanborn CHIEF EXECUTIVE OFFICER Drew LaBenne is Chief Financial Officer at LendingClub, responsible for accounting, financial planning and analysis, treasury, tax, marketplace, and investor relations. Before joining LendingClub, Drew was CFO at Bakkt Holdings, Inc., helping the digital currency platform through its public listing. Prior to that, he served as CFO of Amalgamated Bank, transforming the bank’s business lines and leading the Bank through its IPO. Drew has more than 25 years of financial services experience, including CFO – Business Banking at JPMorgan Chase and increasingly broad divisional CFO responsibilities at Capital One Financial. Drew holds an MBA from the Darden School of Business (University of Virginia) and a BSE – Industrial and Operations Engineering from the University of Michigan. Drew LaBenne CHIEF FINANCIAL OFFICER
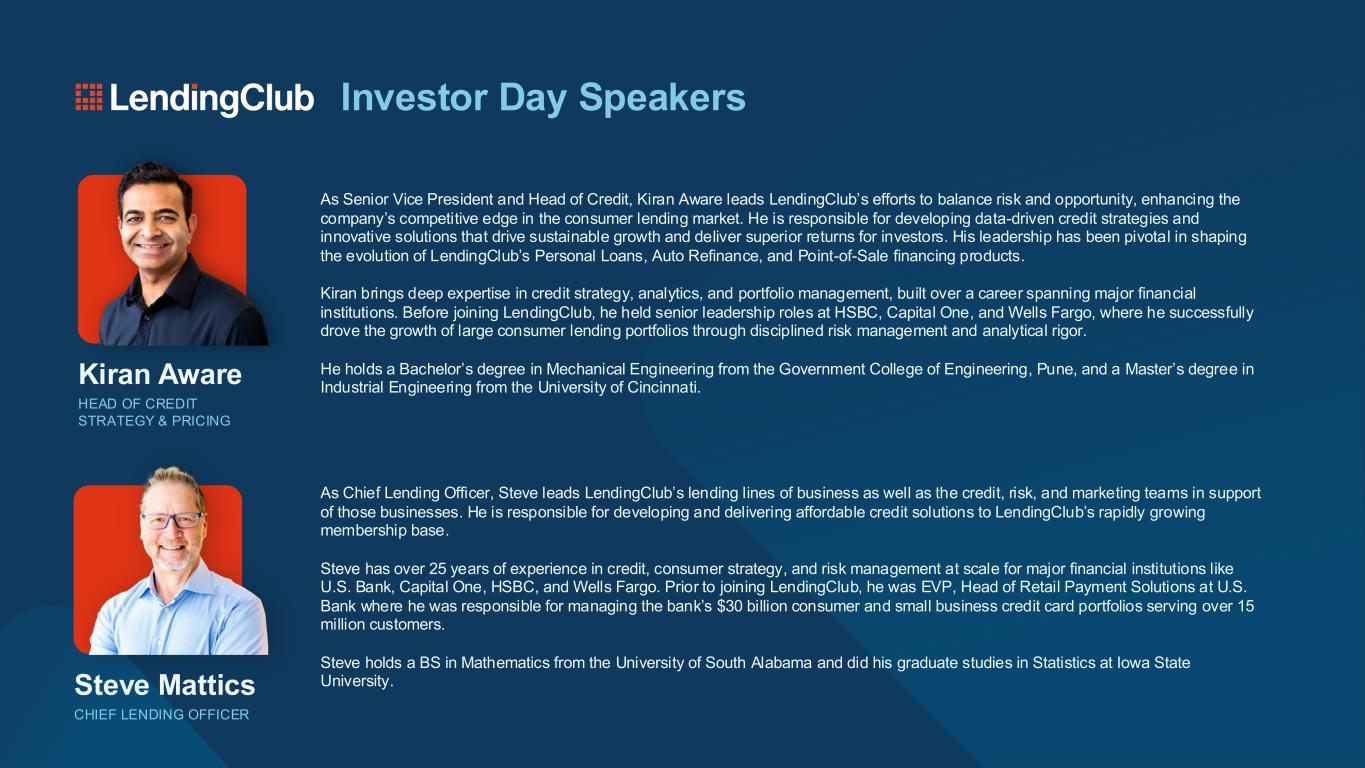
Investor Day Speakers As Senior Vice President and Head of Credit, Kiran Aware leads LendingClub’s efforts to balance risk and opportunity, enhancing the company’s competitive edge in the consumer lending market. He is responsible for developing data-driven credit strategies and innovative solutions that drive sustainable growth and deliver superior returns for investors. His leadership has been pivotal in shaping the evolution of LendingClub’s Personal Loans, Auto Refinance, and Point-of-Sale financing products. Kiran brings deep expertise in credit strategy, analytics, and portfolio management, built over a career spanning major financial institutions. Before joining LendingClub, he held senior leadership roles at HSBC, Capital One, and Wells Fargo, where he successfully drove the growth of large consumer lending portfolios through disciplined risk management and analytical rigor. He holds a Bachelor’s degree in Mechanical Engineering from the Government College of Engineering, Pune, and a Master’s degree in Industrial Engineering from the University of Cincinnati. Kiran Aware HEAD OF CREDIT STRATEGY & PRICING As Chief Lending Officer, Steve leads LendingClub’s lending lines of business as well as the credit, risk, and marketing teams in support of those businesses. He is responsible for developing and delivering affordable credit solutions to LendingClub’s rapidly growing membership base. Steve has over 25 years of experience in credit, consumer strategy, and risk management at scale for major financial institutions like U.S. Bank, Capital One, HSBC, and Wells Fargo. Prior to joining LendingClub, he was EVP, Head of Retail Payment Solutions at U.S. Bank where he was responsible for managing the bank’s $30 billion consumer and small business credit card portfolios serving over 15 million customers. Steve holds a BS in Mathematics from the University of South Alabama and did his graduate studies in Statistics at Iowa State University.Steve Mattics CHIEF LENDING OFFICER
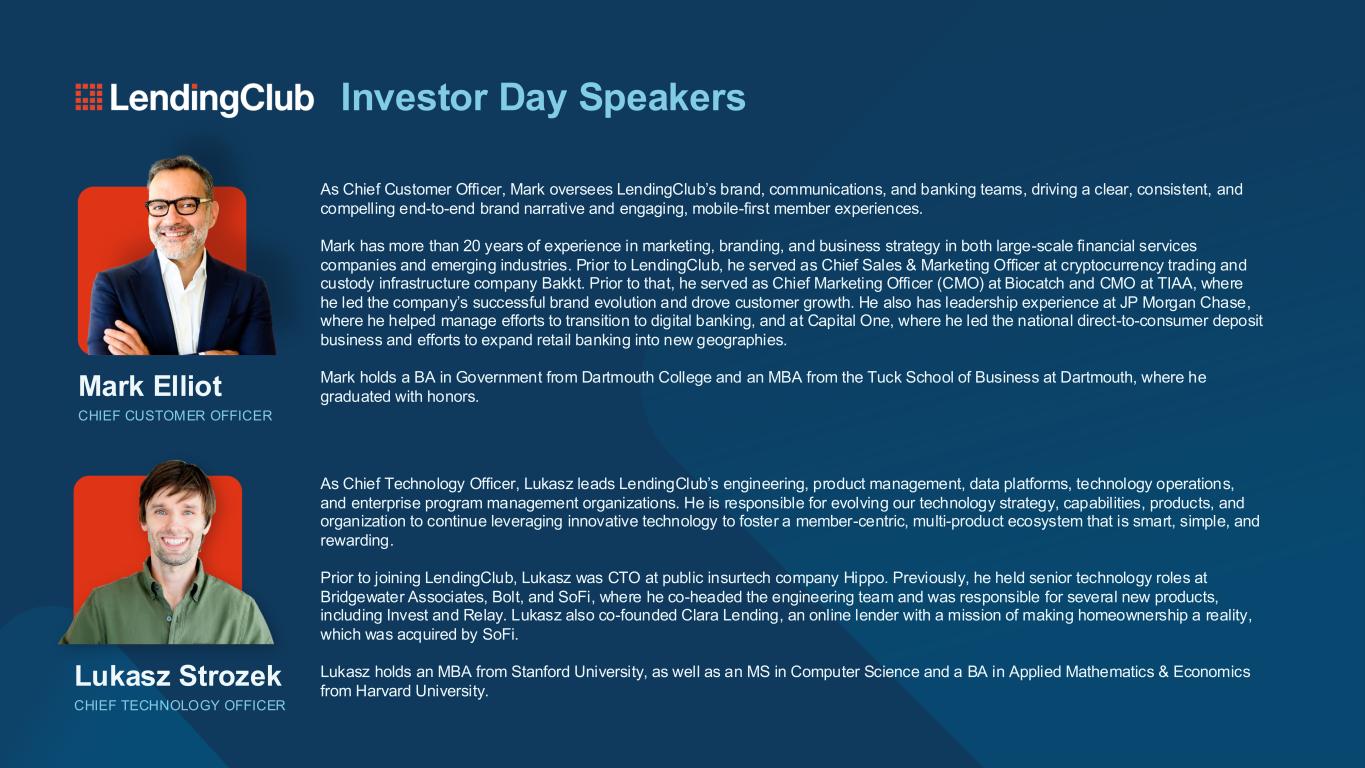
Investor Day Speakers As Chief Customer Officer, Mark oversees LendingClub’s brand, communications, and banking teams, driving a clear, consistent, and compelling end-to-end brand narrative and engaging, mobile-first member experiences. Mark has more than 20 years of experience in marketing, branding, and business strategy in both large-scale financial services companies and emerging industries. Prior to LendingClub, he served as Chief Sales & Marketing Officer at cryptocurrency trading and custody infrastructure company Bakkt. Prior to that, he served as Chief Marketing Officer (CMO) at Biocatch and CMO at TIAA, where he led the company’s successful brand evolution and drove customer growth. He also has leadership experience at JP Morgan Chase, where he helped manage efforts to transition to digital banking, and at Capital One, where he led the national direct-to-consumer deposit business and efforts to expand retail banking into new geographies. Mark holds a BA in Government from Dartmouth College and an MBA from the Tuck School of Business at Dartmouth, where he graduated with honors. Mark Elliot CHIEF CUSTOMER OFFICER As Chief Technology Officer, Lukasz leads LendingClub’s engineering, product management, data platforms, technology operations, and enterprise program management organizations. He is responsible for evolving our technology strategy, capabilities, products, and organization to continue leveraging innovative technology to foster a member-centric, multi-product ecosystem that is smart, simple, and rewarding. Prior to joining LendingClub, Lukasz was CTO at public insurtech company Hippo. Previously, he held senior technology roles at Bridgewater Associates, Bolt, and SoFi, where he co-headed the engineering team and was responsible for several new products, including Invest and Relay. Lukasz also co-founded Clara Lending, an online lender with a mission of making homeownership a reality, which was acquired by SoFi. Lukasz holds an MBA from Stanford University, as well as an MS in Computer Science and a BA in Applied Mathematics & Economics from Harvard University. Lukasz Strozek CHIEF TECHNOLOGY OFFICER

Investor Day Speakers As Senior Vice President and General Manager of Marketplace, Clarke Roberts leads the growth and evolution of the marketplace business at LendingClub, combining strategic vision with operational excellence to deliver scalable digital lending solutions. He is responsible for end-to-end development of the marketplace ecosystem — from investor segmentation and pricing models to platform execution and partner integrations — enabling LendingClub to extend its reach and strengthen competitive differentiation. With more than two decades of experience in fintech, capital markets and trading infrastructure, Clarke brings a rare blend of entrepreneurial and institutional leadership. He co-founded a high-performance low-latency managed-services business backed by leading global investment banks and previously held senior roles spanning portfolio and automated trading at Merrill Lynch Global Markets, trading analytics at ITG, and early-career economic research at Nasdaq and Charles Schwab. Clarke holds a BA in Economics from the University of Virginia.Clarke Roberts GM, MARKETPLACE