.2
Q3 2025 Earnings Release October 29th, 2025 [Graphic Appears Here] Dave Graziosi, Chair & CEO Fred Bohley, COO Scott Mell, CFO & Treasurer
.2
Q3 2025 Earnings Release October 29th, 2025 [Graphic Appears Here] Dave Graziosi, Chair & CEO Fred Bohley, COO Scott Mell, CFO & Treasurer
Safe Harbor Statement The following information contains forward-looking statements. The words “believe,” “expect,” “anticipate,” “intend,” “estimate” and other expressions that are predictions of or indicate future events and trends and that do not relate to historical matters identify forward-looking statements. You should not place undue reliance on these forward-looking statements. Although forward-looking statements reflect management’s good faith beliefs, reliance should not be placed on forward-looking statements because they involve known and unknown risks, uncertainties and other factors, which may cause actual results, performance or achievements to differ materially from anticipated future results, performance or achievements expressed or implied by such forward-looking statements. Forward-looking statements speak only as of the date the statements are made. We undertake no obligation to publicly update or revise any forward-looking statement, whether as a result of new information, future events, changed circumstances or otherwise. These forward-looking statements are subject to numerous risks and uncertainties, including, but not limited to: risks relating to the pending acquisition of the Off-Highway business of Dana Incorporated, including: the acquisition may not be completed in a timely manner or at all; we may experience delays, unanticipated costs or restrictions resulting from regulatory review of the acquisition, including the risk that Allison may be unable to obtain governmental and regulatory approvals required for the acquisition or that such approvals may result in the imposition of conditions that could adversely affect the combined company or the expected benefits of the acquisition; the financing intended to fund the acquisition may not be obtained; uncertainties associated with the acquisition may cause a loss of both companies’ management personnel and other key employees, and cause disruptions to both companies’ business relationships; the purchase agreement subjects Allison and Dana to restrictions on business activities prior to the effective time of the acquisition; Allison is expected to incur significant costs in connection with the acquisition and integration; litigation risks relating to the acquisition; the off-highway business of Dana and its operations may not be integrated successfully in the expected time frame; the acquisition may result in a loss of customers, vendors, and other business counterparties; the combined company may fail to realize all of the anticipated benefits of the acquisition or fail to effectively manage its expanded operations; our participation in markets that are competitive; our ability to prepare for, respond to and successfully achieve our objectives relating to technological and market developments, competitive threats and changing customer needs, including with respect to electric hybrid and fully electric commercial vehicles; increases in cost, disruption of supply or shortage of labor, freight, raw materials, energy or components used to manufacture or transport our products or those of our customers or suppliers, including as a result of geopolitical risks, natural disasters, extreme weather events, wars and public health crises such as pandemics; global economic volatility; general economic and industry conditions, including the risk of prolonged inflation and recession; labor strikes, work stoppages or similar labor disputes, which could significantly disrupt our operations or those of our principal customers or suppliers; the highly cyclical industries in which certain of our end users operate; uncertainty in the global regulatory and business environments in which we operate; the concentration of our net sales in our top five customers and the loss of any one of these; cybersecurity risks to our operational systems, security systems or infrastructure owned by us or our third-party vendors and suppliers; the failure of markets outside North America to increase adoption of fully automatic transmissions; the success of our research and development efforts, the outcome of which is uncertain; U.S. and foreign defense spending; risks associated with our international operations, including acts of war and increased trade protectionism and tariffs; the discovery of defects in our products, resulting in delays in new model launches, recall campaigns and/or increased warranty costs and reduction in future sales or damage to our brand and reputation; our ability to identify, consummate and effectively integrate acquisitions and collaborations; and risks related to our indebtedness. Allison Transmission cannot assure you that the assumptions made in preparing any of the forward-looking statements will prove accurate or that any long-term financial goals will be realized. All forward-looking statements included in this presentation speak only as of the date made, and Allison Transmission undertakes no obligation to update or revise publicly any such forward-looking statements, whether as a result of new information, future events, or otherwise. In particular, Allison Transmission cautions you not to place undue weight on certain forward-looking statements pertaining to potential growth opportunities or long-term financial goals set forth herein. Actual results may vary significantly from these statements. Allison Transmission’s business is subject to numerous risks and uncertainties, which may cause future results of operations to vary significantly from those presented herein. Important factors that could cause actual results to differ materially are discussed in Allison Transmission’s Annual Report on Form 10-K for the year ended December 31, 2024 and Quarterly Report on Form 10-Q for the quarter ended June 30, 2025. 2
Non-GAAP Financial Information We use Adjusted EBITDA and Adjusted EBITDA as a percent of net sales to measure our operating profitability. We believe that Adjusted EBITDA and Adjusted EBITDA as a percent of net sales provide management, investors and creditors with useful measures of the operational results of our business and increase the period-to-period comparability of our operating profitability and comparability with other companies. Adjusted EBITDA as a percent of net sales is also used in the calculation of management’s incentive compensation program. The most directly comparable GAAP measure to Adjusted EBITDA is Net income. The most directly comparable GAAP measure to Adjusted EBITDA as a percent of net sales is Net income as a percent of net sales. Adjusted EBITDA is calculated as the earnings before interest expense, net, income tax expense, amortization of intangible assets, depreciation of property, plant and equipment and other adjustments as defined by Allison Transmission, Inc.’s, the Company’s wholly-owned subsidiary, Second Amended and Restated Credit Agreement. Adjusted EBITDA as a percent of net sales is calculated as Adjusted EBITDA divided by net sales. We use Adjusted Free Cash Flow to evaluate the amount of cash generated by our business that, after the capital investment needed to maintain and grow our business and certain mandatory debt service requirements, can be used for repayment of debt, stockholder distributions and strategic opportunities, including investing in our business. We believe that Adjusted Free Cash Flow enhances the understanding of the cash flows of our business for management, investors and creditors. Adjusted Free Cash Flow is also used in the calculation of management’s incentive compensation program. The most directly comparable GAAP measure to Adjusted Free Cash Flow is Net cash provided by operating activities. Adjusted Free Cash Flow is calculated as Net cash provided by operating activities, after additions of long-lived assets.

[Graphic Appears Here] 3 Call Agenda Business Update Recent Announcements Q3 2025 Performance 2025 Guidance Update
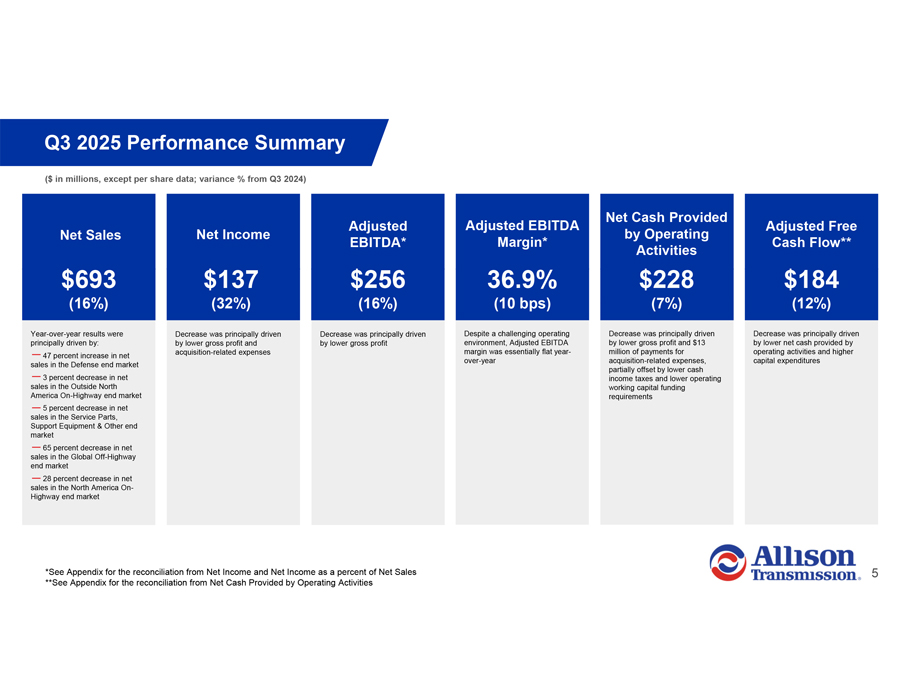
Q3 2025 Performance Summary ($ in millions, except per share data; variance % from Q3 2024) Net Cash Provided Adjusted Adjusted EBITDA Adjusted Free Net Sales Net Income by Operating EBITDA* Margin* Cash Flow** Activities $693 $137 $256 36.9% $228 $184 (16%) (32%) (16%) (10 bps) (7%) (12%) Year-over-year results were Decrease was principally driven Decrease was principally driven Despite a challenging operating Decrease was principally driven Decrease was principally driven principally driven by: by lower gross profit and by lower gross profit environment, Adjusted EBITDA by lower gross profit and $13 by lower net cash provided by acquisition-related expenses margin was essentially flat year- million of payments for operating activities and higher 47 percent increase in net over-year acquisition-related expenses, capital expenditures sales in the Defense end market partially offset by lower cash 3 percent decrease in net income taxes and lower operating sales in the Outside North working capital funding America On-Highway end market requirements 5 percent decrease in net sales in the Service Parts, Support Equipment & Other end market 65 percent decrease in net sales in the Global Off-Highway end market 28 percent decrease in net sales in the North America On-Highway end market *See Appendix for the reconciliation from Net Income and Net Income as a percent of Net Sales **See Appendix for the reconciliation from Net Cash Provided by Operating Activities
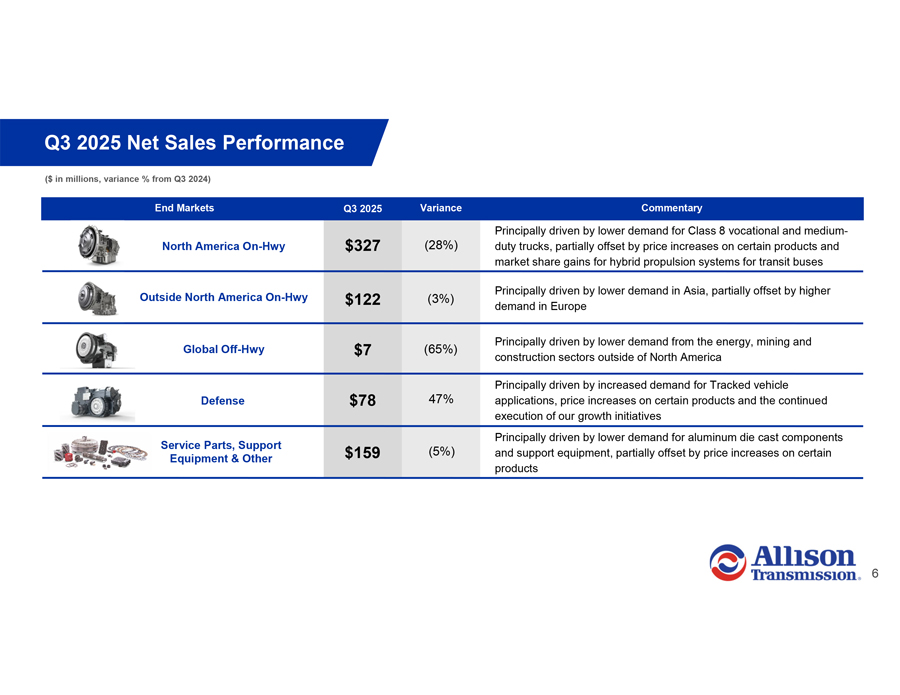
Q3 2025 Net Sales Performance ($ in millions, variance % from Q3 2024) End Markets Q3 2025 Variance Commentary Principally driven by lower demand for Class 8 vocational and medium-North America On-Hwy $327 (28%) duty trucks, partially offset by price increases on certain products and market share gains for hybrid propulsion systems for transit buses Principally driven by lower demand in Asia, partially offset by higher Outside North America On-Hwy $122 (3%) demand in Europe Principally driven by lower demand from the energy, mining and Global Off-Hwy $7 (65%) construction sectors outside of North America Principally driven by increased demand for Tracked vehicle Defense $78 47% applications, price increases on certain products and the continued execution of our growth initiatives Principally driven by lower demand for aluminum die cast components Service Parts, Support $159 (5%) and support equipment, partially offset by price increases on certain Equipment & Other products
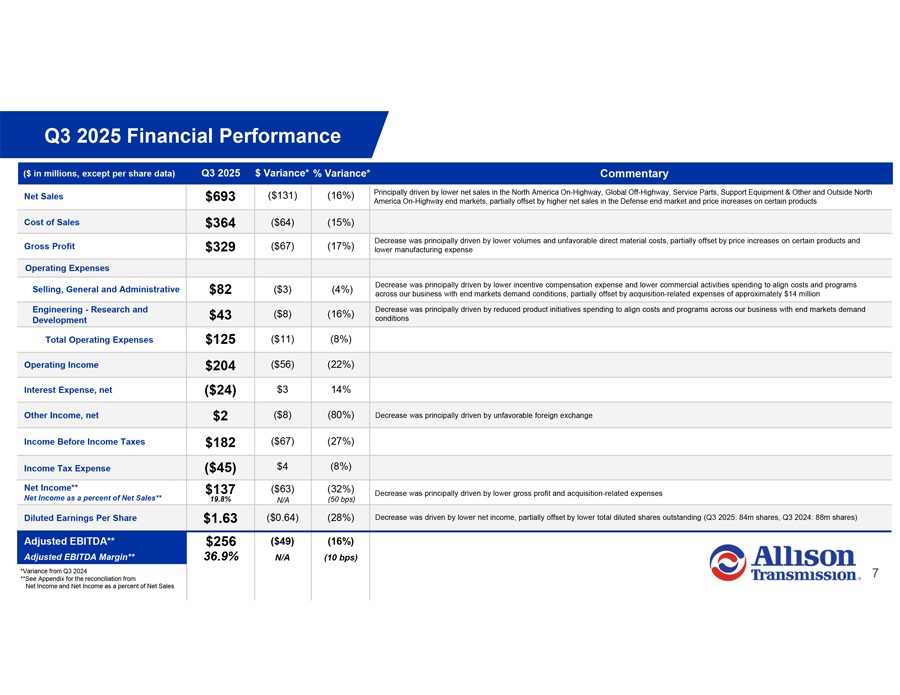
Q3 2025 Financial Performance ($ in millions, except per share data) Q3 2025 $ Variance* % Variance* Commentary Net Sales $693 ($131) (16%) Principally driven by lower net sales in the North America On-Highway, Global Off-Highway, Service Parts, Support Equipment & Other and Outside North America On-Highway end markets, partially offset by higher net sales in the Defense end market and price increases on certain products Cost of Sales $364 ($64) (15%) Decrease was principally driven by lower volumes and unfavorable direct material costs, partially offset by price increases on certain products and Gross Profit $329 ($67) (17%) lower manufacturing expense Operating Expenses Decrease was principally driven by lower incentive compensation expense and lower commercial activities spending to align costs and programs Selling, General and Administrative $82 ($3) (4%) across our business with end markets demand conditions, partially offset by acquisition-related expenses of approximately $14 million Engineering—Research and $43 ($8) (16%) Decrease was principally driven by reduced product initiatives spending to align costs and programs across our business with end markets demand Development conditions Total Operating Expenses $125 ($11) (8%) Operating Income $204 ($56) (22%) Interest Expense, net ($24) $3 14% Other Income, net $2 ($8) (80%) Decrease was principally driven by unfavorable foreign exchange Income Before Income Taxes $182 ($67) (27%) Income Tax Expense ($45) $4 (8%) Net Income** $137 ($63) (32%) Decrease was principally driven by lower gross profit and acquisition-related expenses Net Income as a percent of Net Sales** 19.8% N/A (50 bps) Diluted Earnings Per Share $1.63 ($0.64) (28%) Decrease was driven by lower net income, partially offset by lower total diluted shares outstanding (Q3 2025: 84m shares, Q3 2024: 88m shares) Adjusted EBITDA** $256 ($49) (16%) Adjusted EBITDA Margin** 36.9% N/A (10 bps) *Variance from Q3 2024 7 **See Appendix for the reconciliation from Net Income and Net Income as a percent of Net Sales
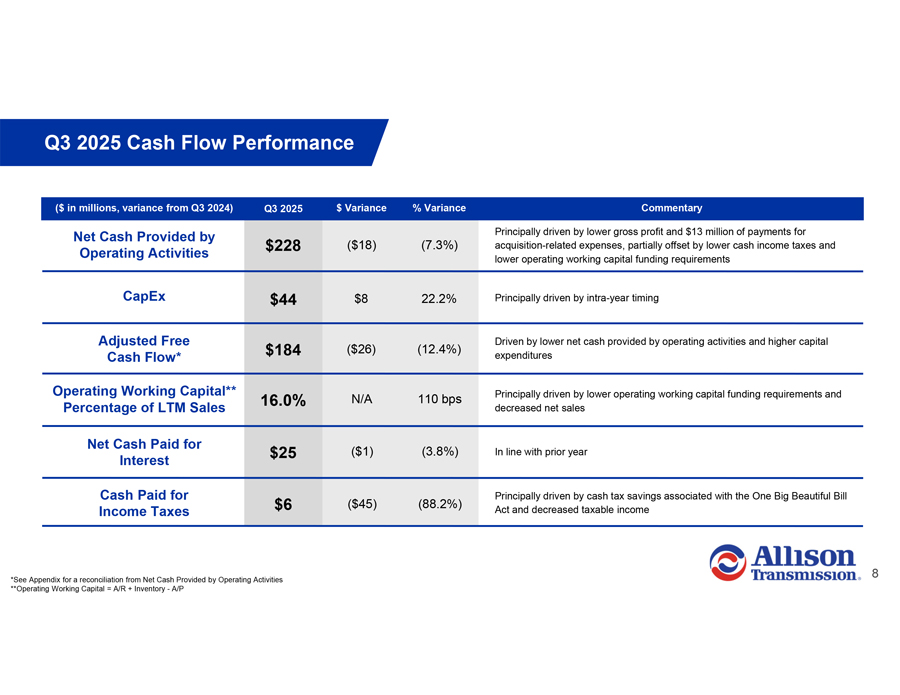
Q3 2025 Cash Flow Performance ($ in millions, variance from Q3 2024) Q3 2025 $ Variance % Variance Commentary Net Cash Provided by Principally driven by lower gross profit and $13 million of payments for $228 ($18) (7.3%) acquisition-related expenses, partially offset by lower cash income taxes and Operating Activities lower operating working capital funding requirements CapEx $44 $8 22.2% Principally driven by intra-year timing Adjusted Free Driven by lower net cash provided by operating activities and higher capital $184 ($26) (12.4%) Cash Flow* expenditures Operating Working Capital** Principally driven by lower operating working capital funding requirements and 16.0% N/A 110 bps Percentage of LTM Sales decreased net sales Net Cash Paid for $25 ($1) (3.8%) In line with prior year Interest Cash Paid for Principally driven by cash tax savings associated with the One Big Beautiful Bill $6 ($45) (88.2%) Income Taxes Act and decreased taxable income *See Appendix for a reconciliation from Net Cash Provided by Operating Activities **Operating Working Capital = A/R + Inventory—A/P
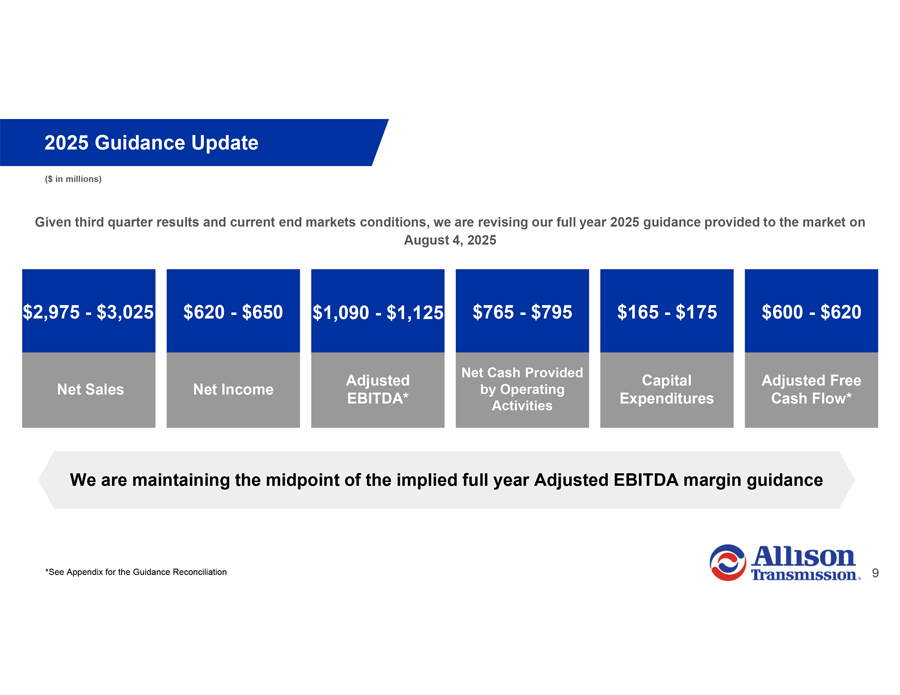
2025 Guidance Update ($ in millions) Given third quarter results and current end markets conditions, we are revising our full year 2025 guidance provided to the market on August 4, 2025 $2,975—$3,025 $620—$650 $1,090—$1,125 $765—$795 $165—$175 $600—$620 Net Cash Provided Adjusted Capital Adjusted Free Net Sales Net Income by Operating EBITDA* Expenditures Cash Flow* Activities We are maintaining the midpoint of the implied full year Adjusted EBITDA margin guidance *See Appendix for the Guidance Reconciliation

Appendix Non-GAAP Financial Information
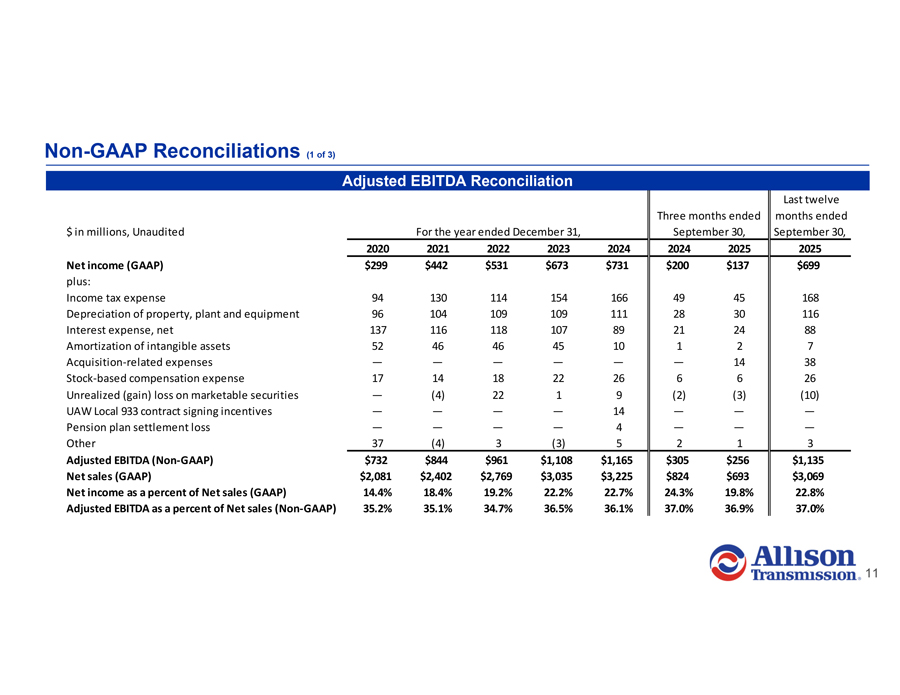
Non-GAAP Reconciliations (1 of 3) Adjusted EBITDA Reconciliation Last twelve Three months ended months ended $ in millions, Unaudited For the year ended December 31, September 30, September 30, 2020 2021 2022 2023 2024 2024 2025 2025 Net income (GAAP) $299 $442 $531 $673 $731 $200 $137 $699 plus: Income tax expense 94 130 114 154 166 49 45 168 Depreciation of property, plant and equipment 96 104 109 109 111 28 30 116 Interest expense, net 137 116 118 107 89 21 24 88 Amortization of intangible assets 52 46 46 45 10 1 2 7 Acquisition-related expenses — — — — — — 14 38 Stock-based compensation expense 17 14 18 22 26 6 6 26 Unrealized (gain) loss on marketable securities — (4) 22 1 9 (2) (3) (10) UAW Local 933 contract signing incentives — — — — 14 — — —Pension plan settlement loss — — — — 4 — — —Other 37 (4) 3 (3) 5 2 1 3 Adjusted EBITDA (Non-GAAP) $732 $844 $961 $1,108 $1,165 $305 $256 $1,135 Net sales (GAAP) $2,081 $2,402 $2,769 $3,035 $3,225 $824 $693 $3,069 Net income as a percent of Net sales (GAAP) 14.4% 18.4% 19.2% 22.2% 22.7% 24.3% 19.8% 22.8% Adjusted EBITDA as a percent of Net sales (Non-GAAP) 35.2% 35.1% 34.7% 36.5% 36.1% 37.0% 36.9% 37.0%
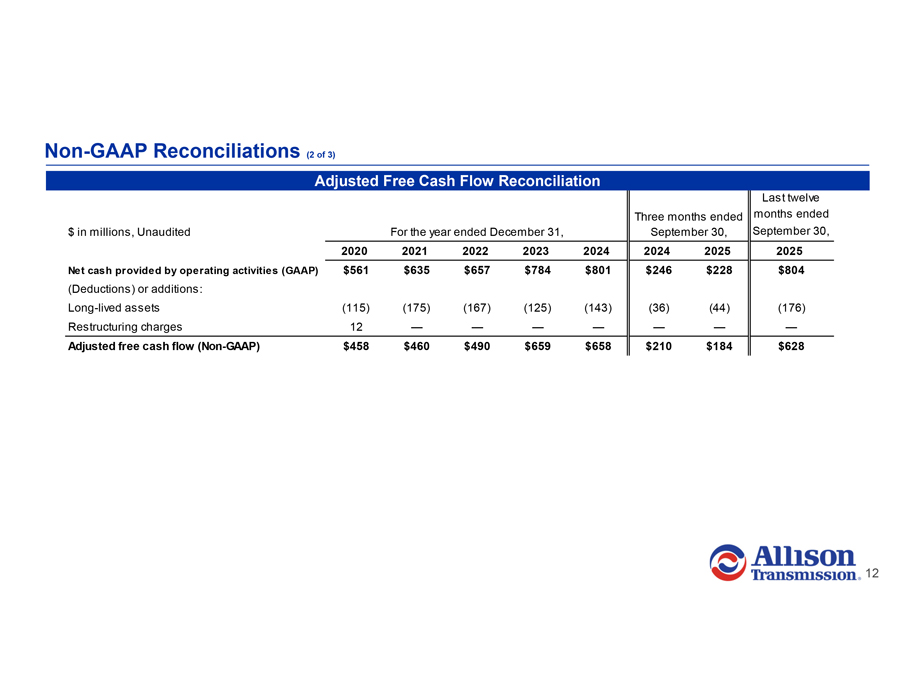
Non-GAAP Reconciliations (2 of 3) Adjusted Free Cash Flow Reconciliation Last twelve Three months ended months ended $ in millions, Unaudited For the year ended December 31, September 30, September 30, 2020 2021 2022 2023 2024 2024 2025 2025 Net cash provided by operating activities (GAAP) $561 $635 $657 $784 $801 $246 $228 $804 (Deductions) or additions: Long-lived assets (115) (175) (167) (125) (143) (36) (44) (176) Restructuring charges 12 — — — — — — — Adjusted free cash flow (Non-GAAP) $458 $460 $490 $659 $658 $210 $184 $628
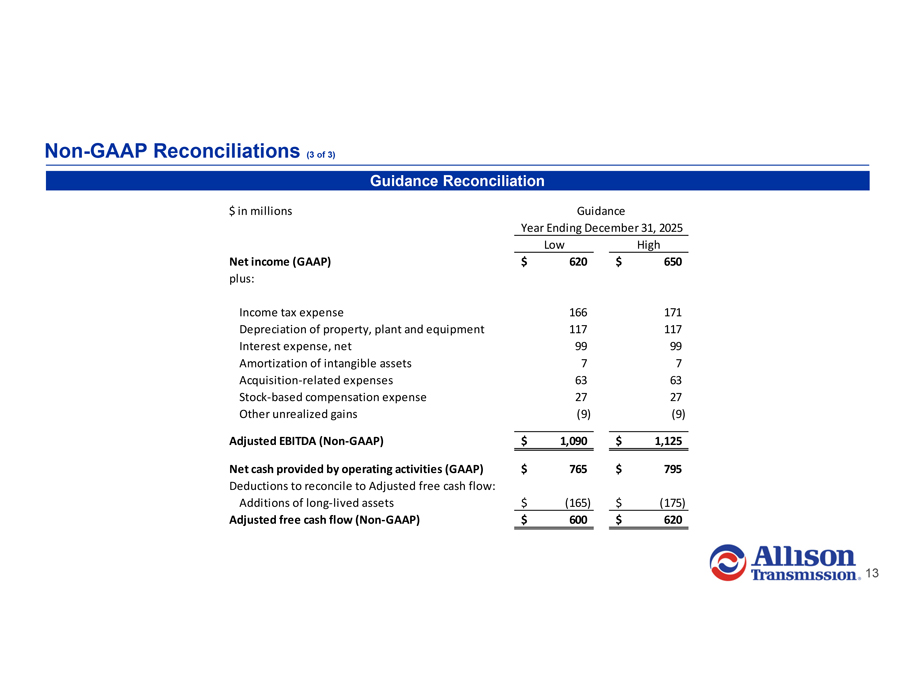
Non-GAAP Reconciliations (3 of 3) Guidance Reconciliation $ in millions Guidance Year Ending December 31, 2025 Low High Net income (GAAP) $ 620 $ 650 plus: Income tax expense 166 171 Depreciation of property, plant and equipment 117 117 Interest expense, net 99 99 Amortization of intangible assets 7 7 Acquisition-related expenses 63 63 Stock-based compensation expense 27 27 Other unrealized gains (9) (9) Adjusted EBITDA (Non-GAAP) $ 1,090 $ 1,125 Net cash provided by operating activities (GAAP) $ 765 $ 795 Deductions to reconcile to Adjusted free cash flow: Additions of long-lived assets $ (165) $ (175) Adjusted free cash flow (Non-GAAP) $ 600 $ 620 2