
Quarterly Stakeholder Letter SECOND QUARTER | FISCAL YEAR 2026
QUARTERLY STAKEHOLDER LETTER | SECOND QUARTER 2026 | 1 Dear Phreesia stakeholders, I am proud to share that Phreesia has had many noteworthy developments over the past quarter. In addition to delivering another solid set of financial results, including achieving our first-ever net income positive quarter, we have expanded our reach and capabilities, positioning us well for the future. I am excited to share that Phreesia has entered into a definitive agreement to acquire AccessOne, a market leader in providing financing solutions for healthcare receivables. This addition will expand our addressable market by roughly $6 billion and strengthens our ability to help providers improve collections while preserving patient trust. The transaction is expected to close during the third quarter or early fourth quarter of Phreesia’s 2026 fiscal year, subject to customary closing conditions and regulatory approvals. Additional details can be found later in this letter. Another exciting update is that our co-founder Evan Roberts and longtime colleague David Linetsky were recently named President, Provider Solutions, and President, Network Solutions, respectively. These titles reflect the work they’ve long been doing to grow the provider and network solutions sides of our business, meet the needs of our clients, and execute on our mission, vision and values. In addition to leading our provider solutions organization, Evan spearheaded the creation of our contracted software development teams, our recent acquisitions and our Phreesia India operation. David joined Phreesia in 2008 as the 58th employee. In 2019, he took over the network solutions organization with a belief that we could differentiate ourselves in the market by leveraging data to drive more meaningful and valuable engagements with patients. Evan and David are invaluable thought partners to me and I am so pleased to share their new titles with you. I am proud to share that Phreesia won two awards based on direct user feedback in the second fiscal quarter. We were named to Black Book Research’s 2025 list of Top-Rated Vendors for Patient Access and Front-End Management Solutions in Revenue Cycle Management (RCM), which is an awards program based on survey responses collected from 11,500+ healthcare finance professionals, administrators and RCM specialists. We were also named to the 2025 Capterra Shortlist in the Patient Engagement and Medical Scheduling categories. The Capterra Shortlist is an independent assessment that evaluates user reviews and online search activity to identify a list of market leaders in various software categories. We are honored to continue receiving this type of recognition based on first-hand feedback from our clients. Our team’s leaders were in the news during the quarter as well. Our Chief Privacy Officer Melissa Mitchell sat down for interviews with Healthcare NOW Radio’s Healthcare de Jure podcast and CDO Magazine, where she discussed the current privacy landscape and the importance of consent and transparency. I’m also excited to share that Kristin Roberts, Vice President of Product Management, was named to Becker’s Hospital Review’s 2025 list of the 100 Women in Health IT to Know—a well-earned reflection of her efforts in shaping the future of healthcare through IT. These spotlights on our people, products and practices are a testament to the work we do to make care easier every day. We look forward to updating you on our progress in the second half of fiscal 2026. Chaim Indig Chief Executive Officer and Co-Founder SEPTEMBER 4, 2025
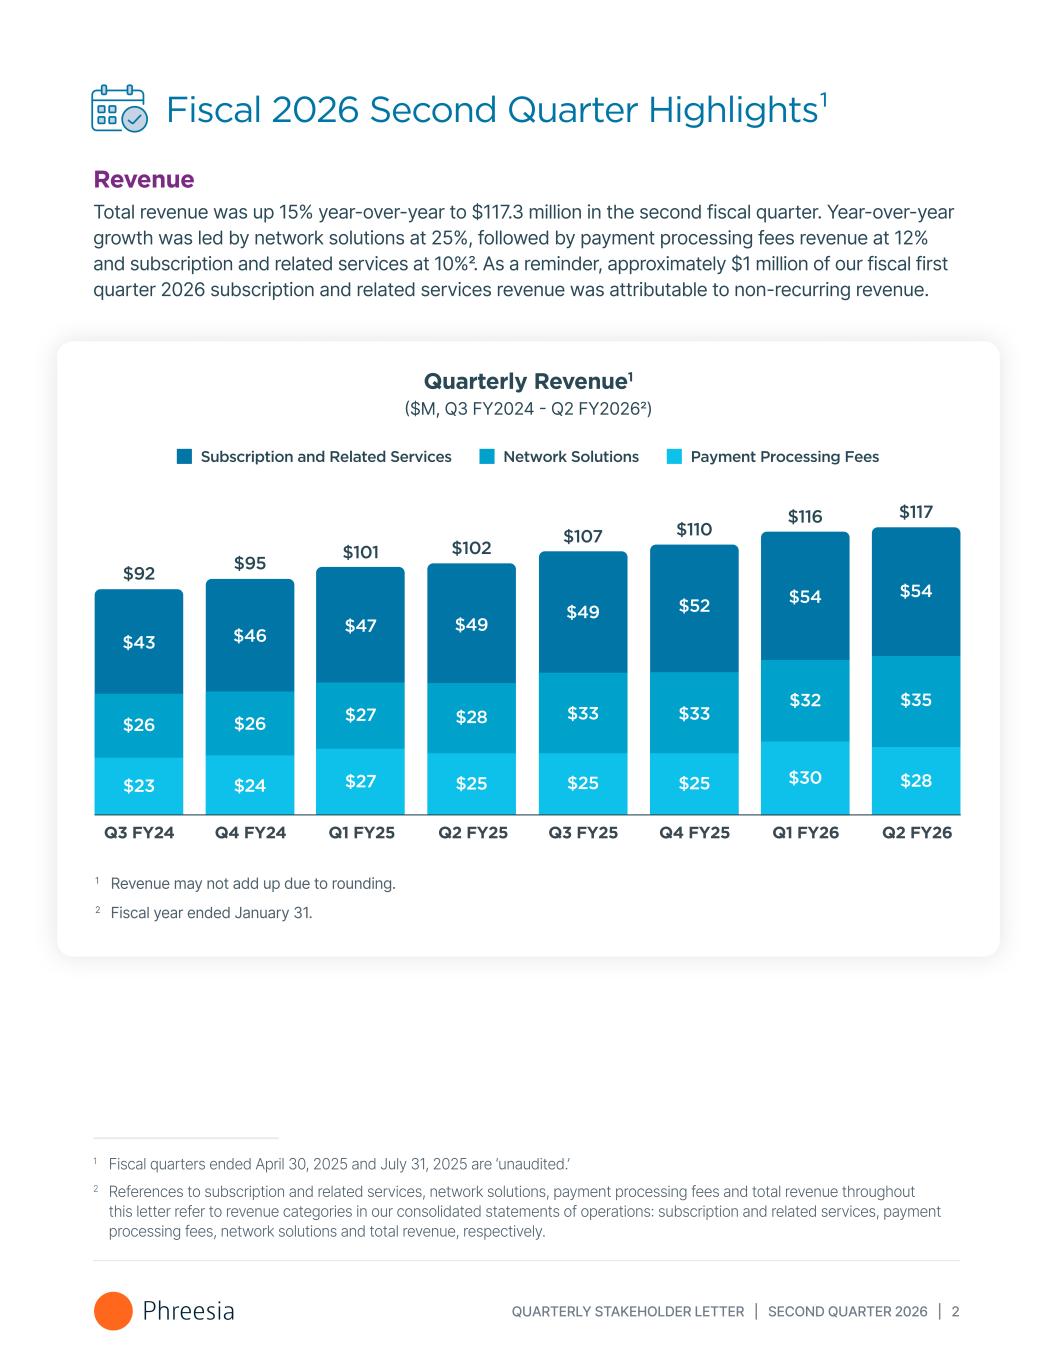
QUARTERLY STAKEHOLDER LETTER | SECOND QUARTER 2026 | 2 Fiscal 2026 Second Quarter Highlights¹ Revenue Total revenue was up 15% year-over-year to $117.3 million in the second fiscal quarter. Year-over-year growth was led by network solutions at 25%, followed by payment processing fees revenue at 12% and subscription and related services at 10%2. As a reminder, approximately $1 million of our fiscal first quarter 2026 subscription and related services revenue was attributable to non-recurring revenue. Quarterly Revenue1 ($M, Q3 FY2024 - Q2 FY20262) 1 Revenue may not add up due to rounding. 2 Fiscal year ended January 31. $43 $26 $23 $46 $26 $24 $47 $27 $27 $49 $28 $25 $49 $33 $25 $52 $33 $25 $54 $32 $30 $92 $95 $101 $102 $107 $110 $116 Q3 FY24 Q4 FY24 Q1 FY25 Q2 FY25 Q3 FY25 Q4 FY25 Q1 FY26 Q2 FY26 Subscription and Related Services Payment Processing FeesNetwork Solutions $54 $35 $28 $117 1 Fiscal quarters ended April 30, 2025 and July 31, 2025 are ‘unaudited.’ 2 References to subscription and related services, network solutions, payment processing fees and total revenue throughout this letter refer to revenue categories in our consolidated statements of operations: subscription and related services, payment processing fees, network solutions and total revenue, respectively.
QUARTERLY STAKEHOLDER LETTER | SECOND QUARTER 2026 | 3 Healthcare Services Clients Average Healthcare Services Clients In the second quarter of fiscal 2026, we supported 4,467 Average Healthcare Services Clients (AHSCs)3, an increase of 56 AHSCs (or 1%) over the first quarter of fiscal 2026 and an increase of 298 AHSCs (or 7%) year-over-year. Total Revenue Per AHSC In the second quarter of fiscal 2026, total revenue per AHSC4 was $26,249, up 7% year-over-year and flat over the previous quarter. As a reminder, approximately $1 million of our fiscal first quarter revenue was non-recurring, which brought our sequential total revenue per AHSC trend down by 1%. Revenue growth is driven by two factors: 1) the growth of our network of healthcare services clients; and 2) our ability to drive more value for our existing clients through products across our four solution areas: access to care, registration, revenue cycle and network solutions. We generate three types of revenue from these products: subscription and related services, payment processing and network solutions revenue. We believe that having multiple methods of monetizing our network is a key factor behind our historical revenue growth. 3 We define AHSCs as the average number of clients that generate subscription and related services or payment processing fees revenue each month during the applicable period. In cases where we act as a subcontractor providing white-label services to our partner's clients, we treat the contractual relationship as a single healthcare services client. 4 We define total revenue per AHSC as total revenue in a given period divided by the number of AHSCs during that same period.
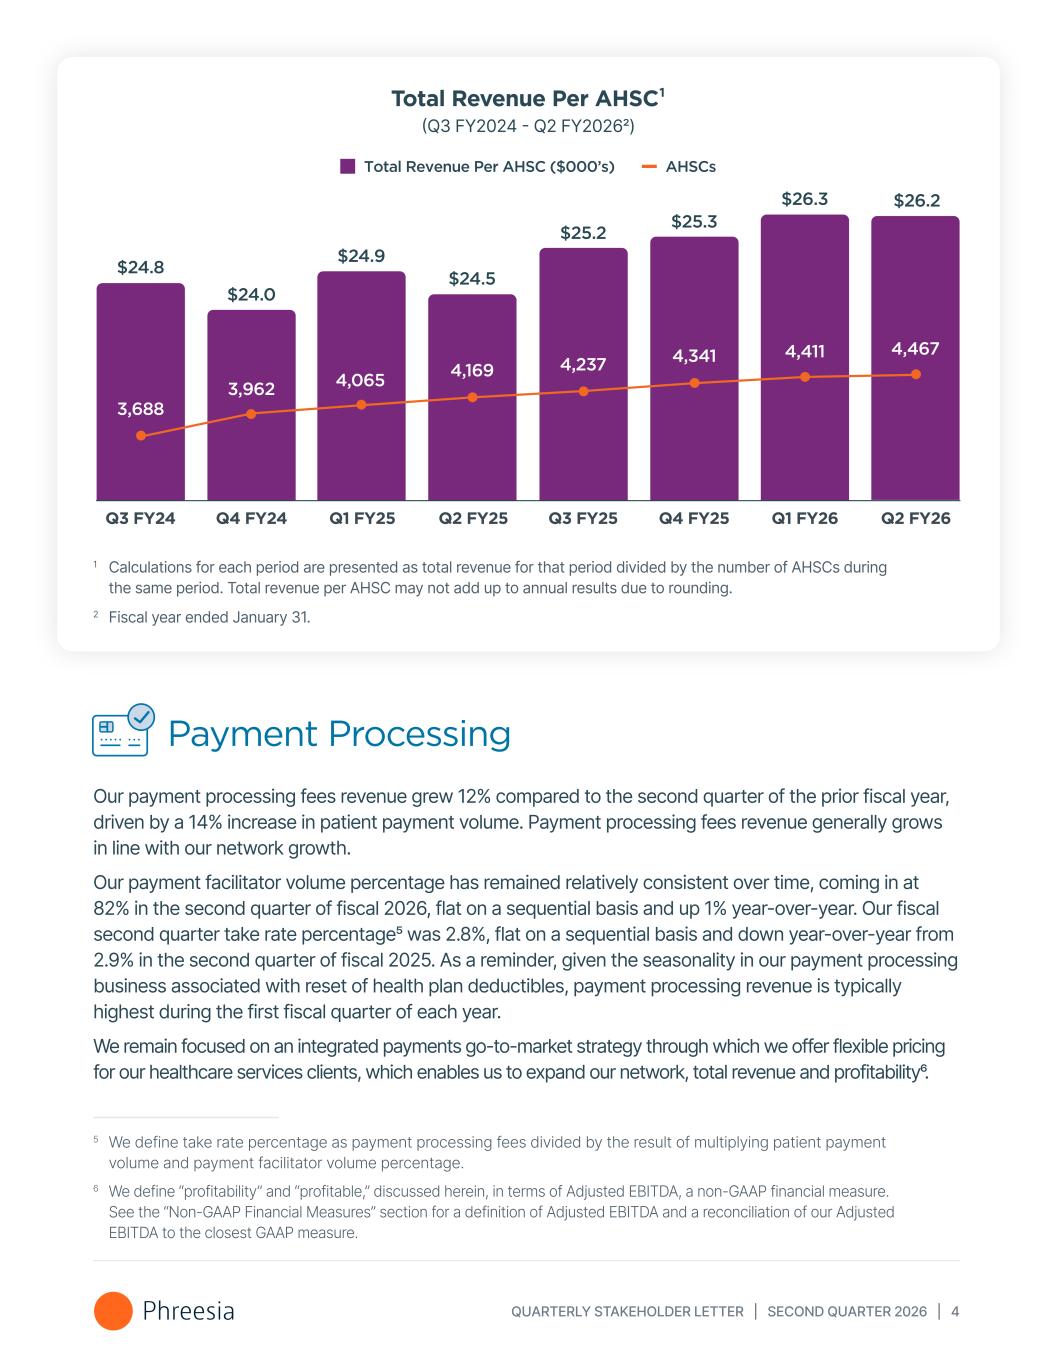
QUARTERLY STAKEHOLDER LETTER | SECOND QUARTER 2026 | 4 Payment Processing Our payment processing fees revenue grew 12% compared to the second quarter of the prior fiscal year, driven by a 14% increase in patient payment volume. Payment processing fees revenue generally grows in line with our network growth. Our payment facilitator volume percentage has remained relatively consistent over time, coming in at 82% in the second quarter of fiscal 2026, flat on a sequential basis and up 1% year-over-year. Our fiscal second quarter take rate percentage5 was 2.8%, flat on a sequential basis and down year-over-year from 2.9% in the second quarter of fiscal 2025. As a reminder, given the seasonality in our payment processing business associated with reset of health plan deductibles, payment processing revenue is typically highest during the first fiscal quarter of each year. We remain focused on an integrated payments go-to-market strategy through which we offer flexible pricing for our healthcare services clients, which enables us to expand our network, total revenue and profitability6. 3,688 3,962 4,065 4,169 4,237 4,341 4,411 $24.8 $24.0 $24.9 $24.5 $25.2 $25.3 $26.3 Q3 FY24 Q4 FY24 Q1 FY25 Q2 FY25 Q3 FY25 Q4 FY25 Q1 FY26 Q2 FY26 Total Revenue Per AHSC ($000’s) AHSCs $26.2 4,467 Total Revenue Per AHSC¹ (Q3 FY2024 - Q2 FY20262) 1 Calculations for each period are presented as total revenue for that period divided by the number of AHSCs during the same period. Total revenue per AHSC may not add up to annual results due to rounding. 2 Fiscal year ended January 31. 5 We define take rate percentage as payment processing fees divided by the result of multiplying patient payment volume and payment facilitator volume percentage. 6 We define “profitability” and “profitable,” discussed herein, in terms of Adjusted EBITDA, a non-GAAP financial measure. See the “Non-GAAP Financial Measures” section for a definition of Adjusted EBITDA and a reconciliation of our Adjusted EBITDA to the closest GAAP measure.
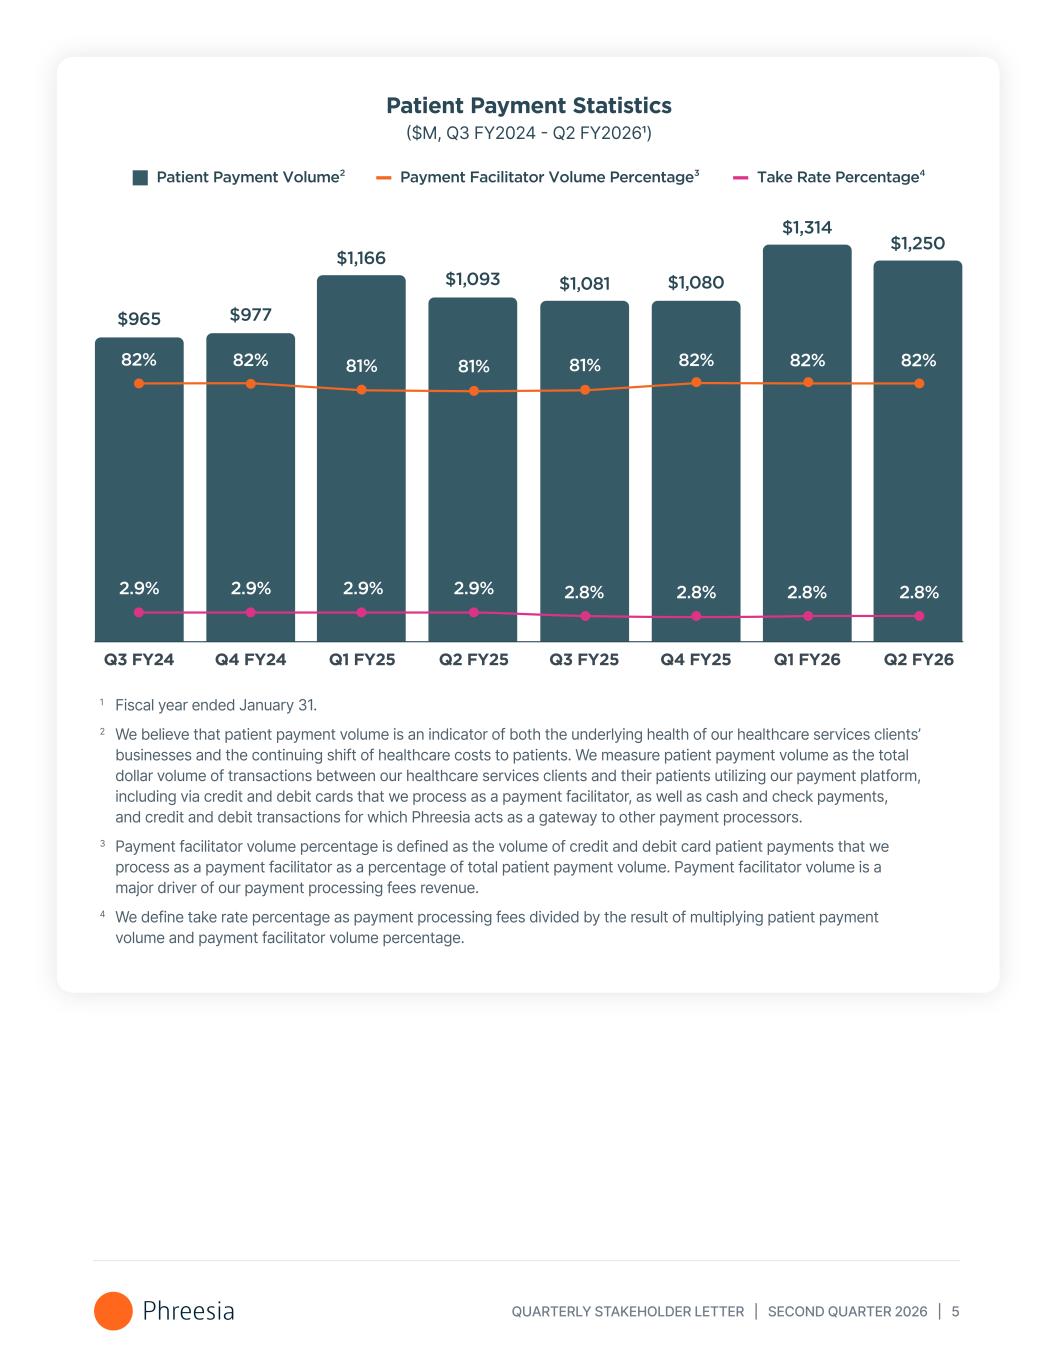
QUARTERLY STAKEHOLDER LETTER | SECOND QUARTER 2026 | 5 Patient Payment Statistics ($M, Q3 FY2024 - Q2 FY20261) 1 Fiscal year ended January 31. 2 We believe that patient payment volume is an indicator of both the underlying health of our healthcare services clients’ businesses and the continuing shift of healthcare costs to patients. We measure patient payment volume as the total dollar volume of transactions between our healthcare services clients and their patients utilizing our payment platform, including via credit and debit cards that we process as a payment facilitator, as well as cash and check payments, and credit and debit transactions for which Phreesia acts as a gateway to other payment processors. 3 Payment facilitator volume percentage is defined as the volume of credit and debit card patient payments that we process as a payment facilitator as a percentage of total patient payment volume. Payment facilitator volume is a major driver of our payment processing fees revenue. 4 We define take rate percentage as payment processing fees divided by the result of multiplying patient payment volume and payment facilitator volume percentage. $965 $977 $1,166 $1,093 $1,081 $1,080 $1,314 Q3 FY24 Q4 FY24 Q1 FY25 Q2 FY25 Q3 FY25 Q4 FY25 Q1 FY26 Q2 FY26 81% 82% 82%81%81%82%82% 2.9% 2.9%2.9% 2.9% 2.8%2.8% 2.8% Patient Payment Volume2 Payment Facilitator Volume Percentage3 Take Rate Percentage4 $1,250 82% 2.8%
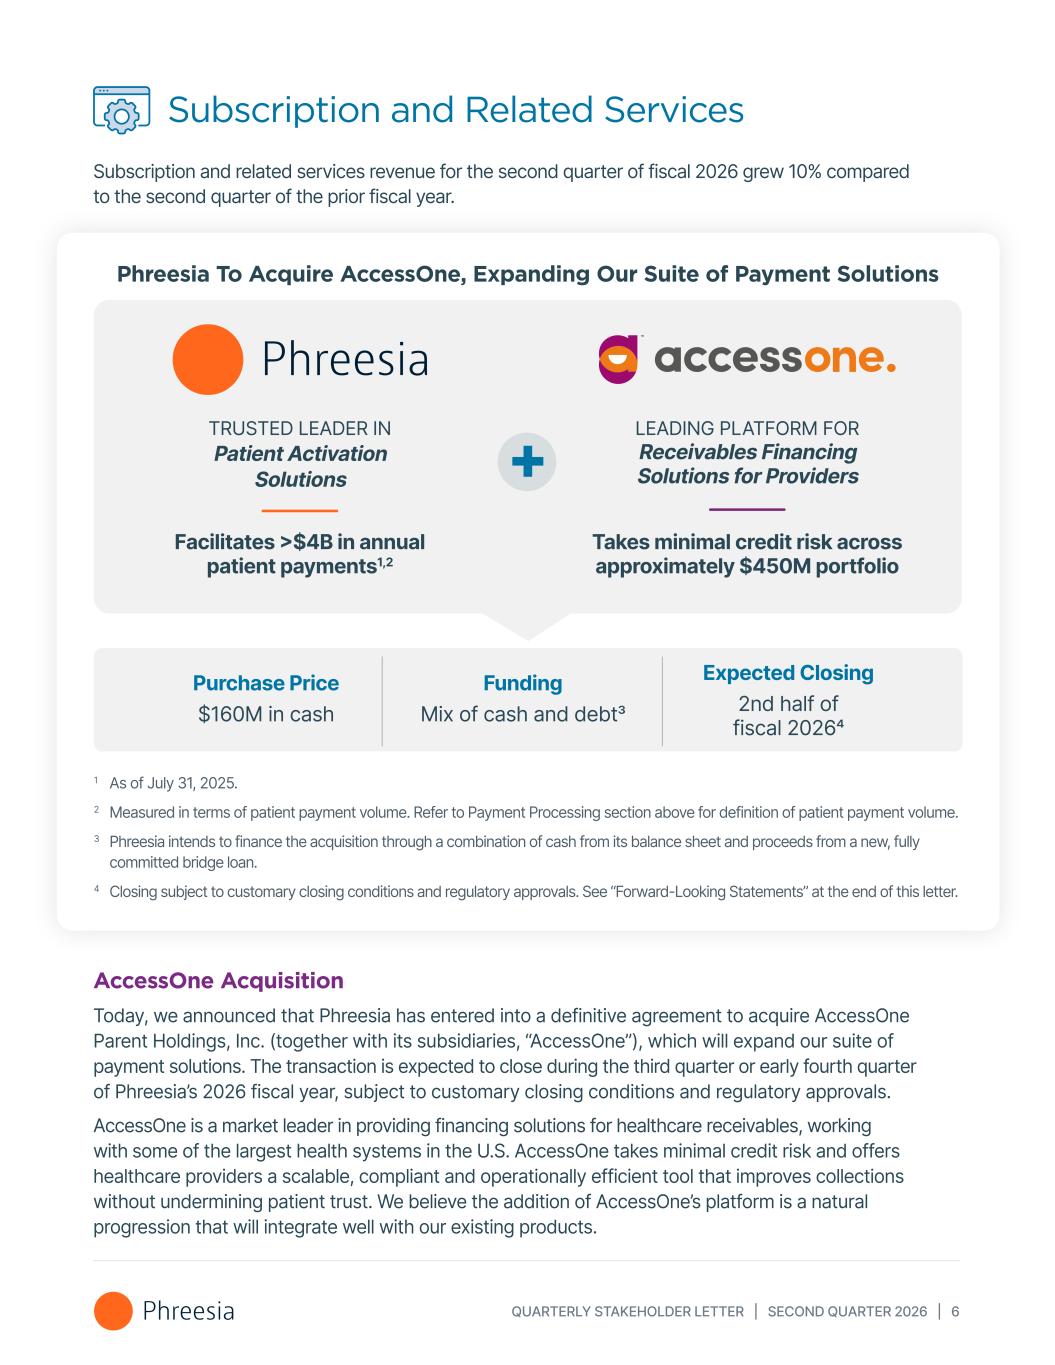
QUARTERLY STAKEHOLDER LETTER | SECOND QUARTER 2026 | 6 Subscription and Related Services Subscription and related services revenue for the second quarter of fiscal 2026 grew 10% compared to the second quarter of the prior fiscal year. 1 As of July 31, 2025. 2 Measured in terms of patient payment volume. Refer to Payment Processing section above for definition of patient payment volume. 3 Phreesia intends to finance the acquisition through a combination of cash from its balance sheet and proceeds from a new, fully committed bridge loan. 4 Closing subject to customary closing conditions and regulatory approvals. See “Forward-Looking Statements” at the end of this letter. Phreesia To Acquire AccessOne, Expanding Our Suite of Payment Solutions TRUSTED LEADER IN Patient Activation Solutions LEADING PLATFORM FOR Receivables Financing Solutions for Providers Facilitates >$4B in annual patient payments1,2 Takes minimal credit risk across approximately $450M portfolio + Purchase Price $160M in cash Funding Mix of cash and debt3 Expected Closing 2nd half of fiscal 20264 AccessOne Acquisition Today, we announced that Phreesia has entered into a definitive agreement to acquire AccessOne Parent Holdings, Inc. (together with its subsidiaries, “AccessOne”), which will expand our suite of payment solutions. The transaction is expected to close during the third quarter or early fourth quarter of Phreesia’s 2026 fiscal year, subject to customary closing conditions and regulatory approvals. AccessOne is a market leader in providing financing solutions for healthcare receivables, working with some of the largest health systems in the U.S. AccessOne takes minimal credit risk and offers healthcare providers a scalable, compliant and operationally efficient tool that improves collections without undermining patient trust. We believe the addition of AccessOne’s platform is a natural progression that will integrate well with our existing products.
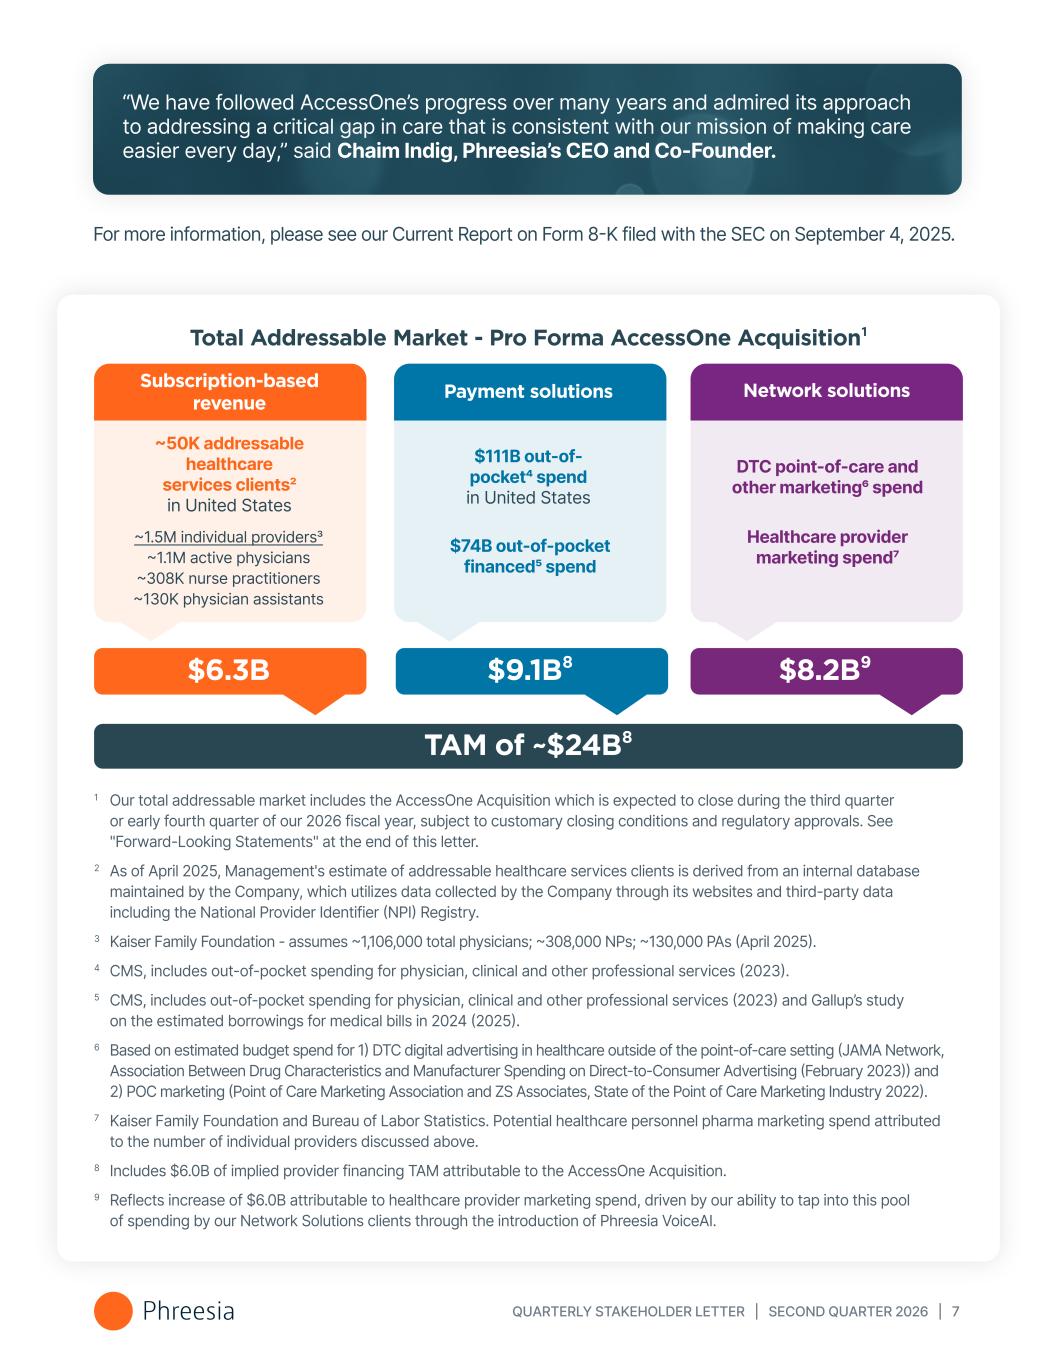
QUARTERLY STAKEHOLDER LETTER | SECOND QUARTER 2026 | 7 Subscription-based revenue ~50K addressable healthcare services clients2 in United States ~1.5M individual providers3 ~1.1M active physicians ~308K nurse practitioners ~130K physician assistants $6.3B Payment solutions $111B out-of- pocket4 spend in United States $74B out-of-pocket financed5 spend $9.1B⁸ Network solutions DTC point-of-care and other marketing6 spend Healthcare provider marketing spend7 $8.2B⁹ TAM of ~$24B⁸ 1 Our total addressable market includes the AccessOne Acquisition which is expected to close during the third quarter or early fourth quarter of our 2026 fiscal year, subject to customary closing conditions and regulatory approvals. See "Forward-Looking Statements" at the end of this letter. 2 As of April 2025, Management's estimate of addressable healthcare services clients is derived from an internal database maintained by the Company, which utilizes data collected by the Company through its websites and third-party data including the National Provider Identifier (NPI) Registry. 3 Kaiser Family Foundation - assumes ~1,106,000 total physicians; ~308,000 NPs; ~130,000 PAs (April 2025). 4 CMS, includes out-of-pocket spending for physician, clinical and other professional services (2023). 5 CMS, includes out-of-pocket spending for physician, clinical and other professional services (2023) and Gallup’s study on the estimated borrowings for medical bills in 2024 (2025). 6 Based on estimated budget spend for 1) DTC digital advertising in healthcare outside of the point-of-care setting (JAMA Network, Association Between Drug Characteristics and Manufacturer Spending on Direct-to-Consumer Advertising (February 2023)) and 2) POC marketing (Point of Care Marketing Association and ZS Associates, State of the Point of Care Marketing Industry 2022). 7 Kaiser Family Foundation and Bureau of Labor Statistics. Potential healthcare personnel pharma marketing spend attributed to the number of individual providers discussed above. 8 Includes $6.0B of implied provider financing TAM attributable to the AccessOne Acquisition. 9 Reflects increase of $6.0B attributable to healthcare provider marketing spend, driven by our ability to tap into this pool of spending by our Network Solutions clients through the introduction of Phreesia VoiceAI. Total Addressable Market - Pro Forma AccessOne Acquisition¹ “We have followed AccessOne’s progress over many years and admired its approach to addressing a critical gap in care that is consistent with our mission of making care easier every day,” said Chaim Indig, Phreesia’s CEO and Co-Founder. For more information, please see our Current Report on Form 8-K filed with the SEC on September 4, 2025.
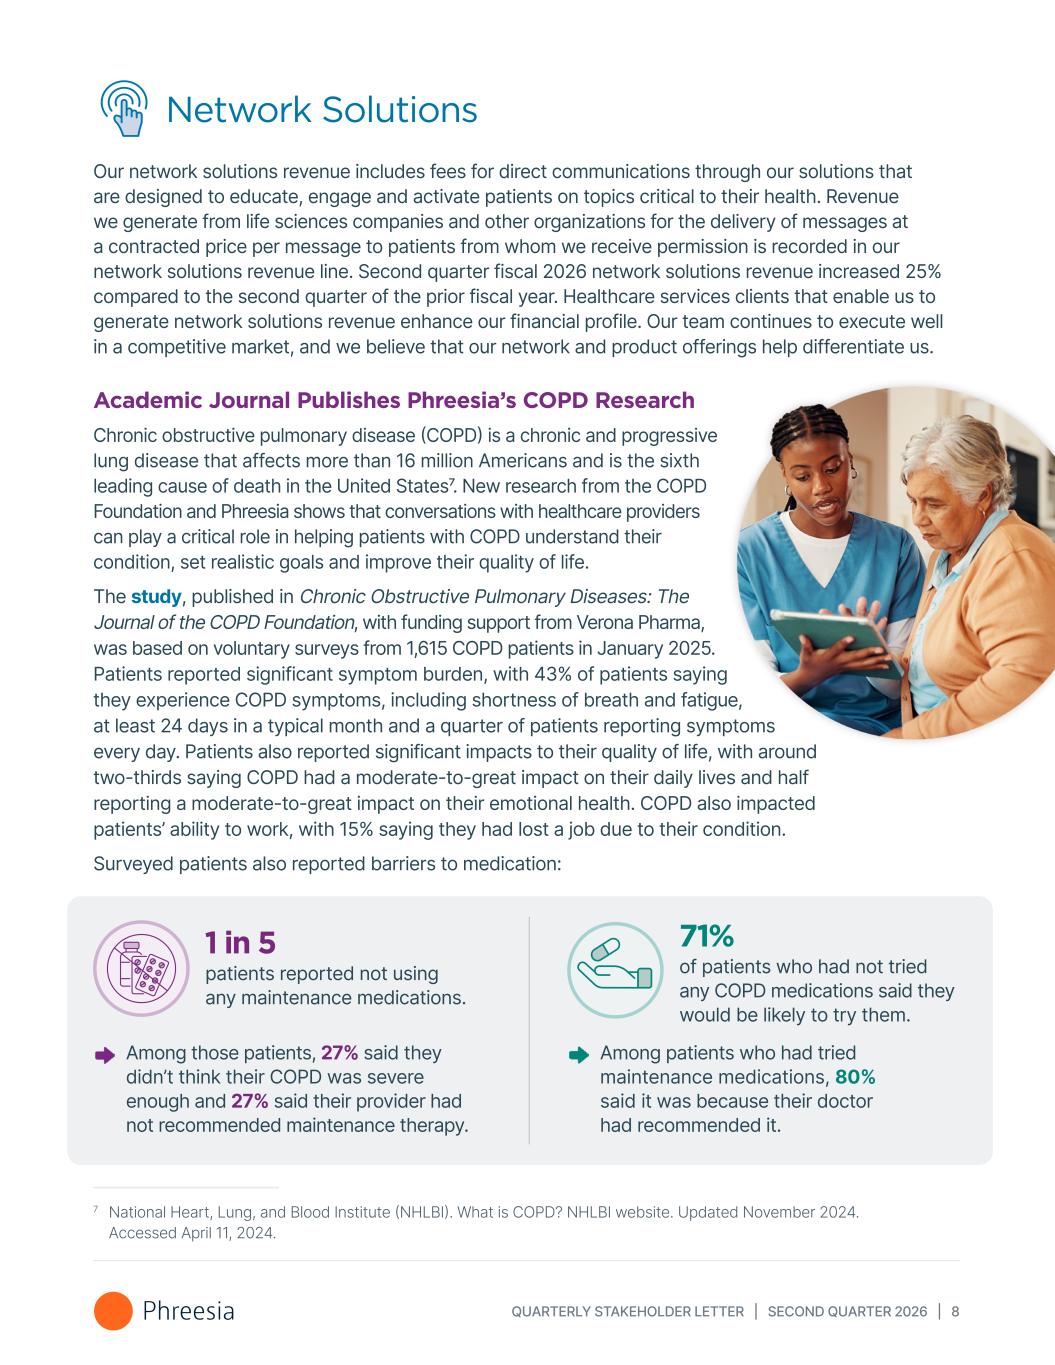
QUARTERLY STAKEHOLDER LETTER | SECOND QUARTER 2026 | 8 Network Solutions Our network solutions revenue includes fees for direct communications through our solutions that are designed to educate, engage and activate patients on topics critical to their health. Revenue we generate from life sciences companies and other organizations for the delivery of messages at a contracted price per message to patients from whom we receive permission is recorded in our network solutions revenue line. Second quarter fiscal 2026 network solutions revenue increased 25% compared to the second quarter of the prior fiscal year. Healthcare services clients that enable us to generate network solutions revenue enhance our financial profile. Our team continues to execute well in a competitive market, and we believe that our network and product offerings help differentiate us. Academic Journal Publishes Phreesia’s COPD Research Chronic obstructive pulmonary disease (COPD) is a chronic and progressive lung disease that affects more than 16 million Americans and is the sixth leading cause of death in the United States7. New research from the COPD Foundation and Phreesia shows that conversations with healthcare providers can play a critical role in helping patients with COPD understand their condition, set realistic goals and improve their quality of life. The study, published in Chronic Obstructive Pulmonary Diseases: The Journal of the COPD Foundation, with funding support from Verona Pharma, was based on voluntary surveys from 1,615 COPD patients in January 2025. Patients reported significant symptom burden, with 43% of patients saying they experience COPD symptoms, including shortness of breath and fatigue, at least 24 days in a typical month and a quarter of patients reporting symptoms every day. Patients also reported significant impacts to their quality of life, with around two-thirds saying COPD had a moderate-to-great impact on their daily lives and half reporting a moderate-to-great impact on their emotional health. COPD also impacted patients’ ability to work, with 15% saying they had lost a job due to their condition. Surveyed patients also reported barriers to medication: 7 National Heart, Lung, and Blood Institute (NHLBI). What is COPD? NHLBI website. Updated November 2024. Accessed April 11, 2024. 1 in 5 patients reported not using any maintenance medications. Among those patients, 27% said they didn’t think their COPD was severe enough and 27% said their provider had not recommended maintenance therapy. 71% of patients who had not tried any COPD medications said they would be likely to try them. Among patients who had tried maintenance medications, 80% said it was because their doctor had recommended it.
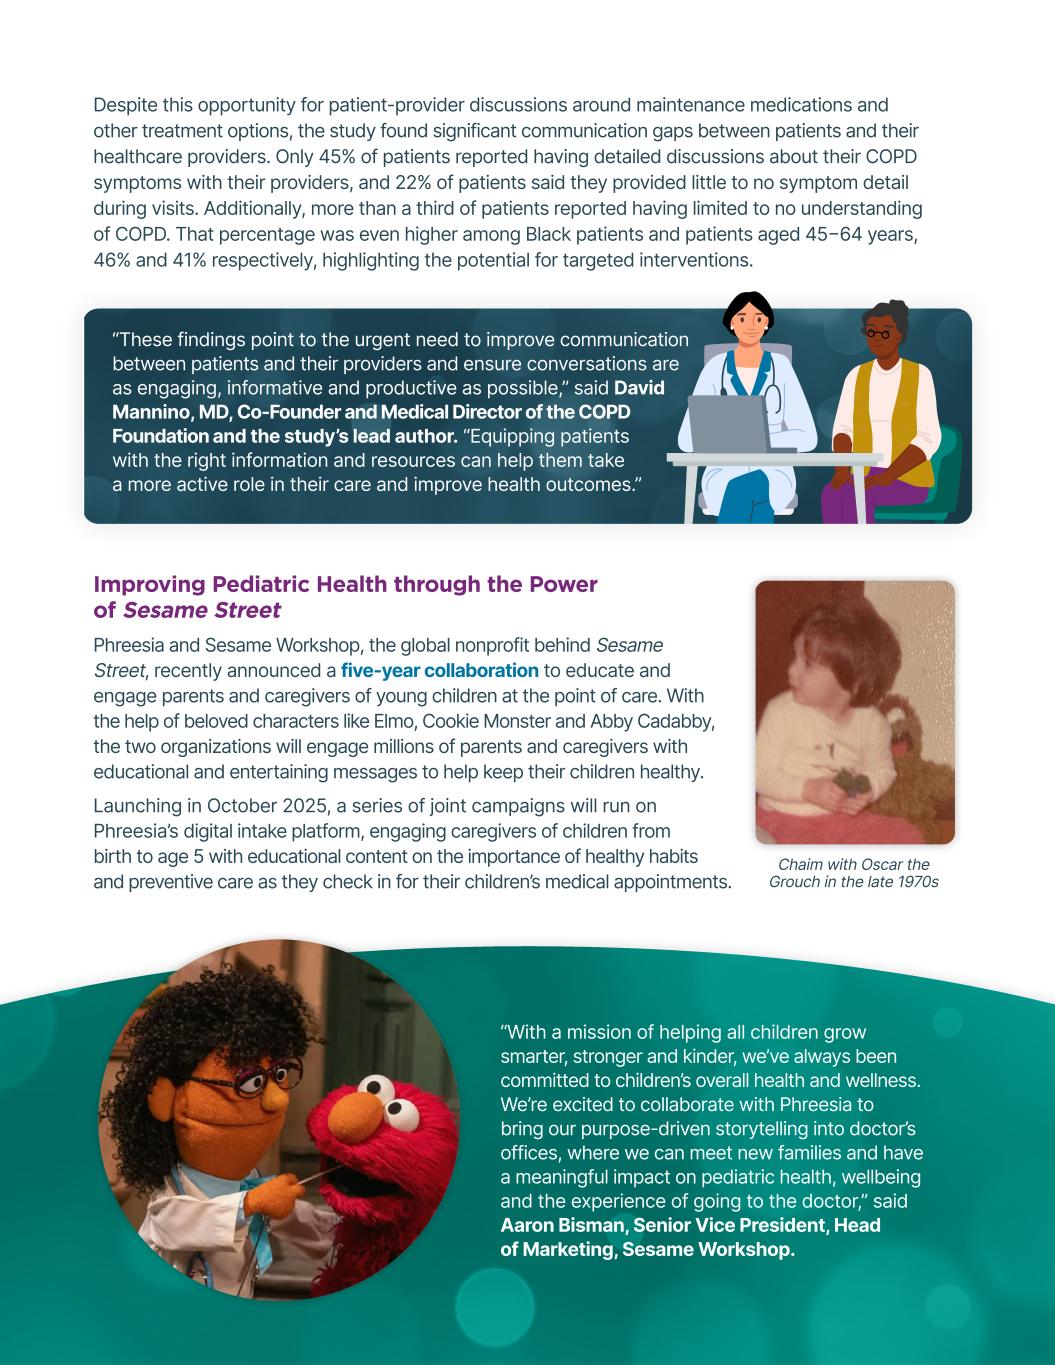
QUARTERLY STAKEHOLDER LETTER | SECOND QUARTER 2026 | 9 Improving Pediatric Health through the Power of Sesame Street Phreesia and Sesame Workshop, the global nonprofit behind Sesame Street, recently announced a five-year collaboration to educate and engage parents and caregivers of young children at the point of care. With the help of beloved characters like Elmo, Cookie Monster and Abby Cadabby, the two organizations will engage millions of parents and caregivers with educational and entertaining messages to help keep their children healthy. Launching in October 2025, a series of joint campaigns will run on Phreesia’s digital intake platform, engaging caregivers of children from birth to age 5 with educational content on the importance of healthy habits and preventive care as they check in for their children’s medical appointments. Despite this opportunity for patient-provider discussions around maintenance medications and other treatment options, the study found significant communication gaps between patients and their healthcare providers. Only 45% of patients reported having detailed discussions about their COPD symptoms with their providers, and 22% of patients said they provided little to no symptom detail during visits. Additionally, more than a third of patients reported having limited to no understanding of COPD. That percentage was even higher among Black patients and patients aged 45−64 years, 46% and 41% respectively, highlighting the potential for targeted interventions. “With a mission of helping all children grow smarter, stronger and kinder, we’ve always been committed to children’s overall health and wellness. We’re excited to collaborate with Phreesia to bring our purpose-driven storytelling into doctor’s offices, where we can meet new families and have a meaningful impact on pediatric health, wellbeing and the experience of going to the doctor,” said Aaron Bisman, Senior Vice President, Head of Marketing, Sesame Workshop. Chaim with Oscar the Grouch in the late 1970s “These findings point to the urgent need to improve communication between patients and their providers and ensure conversations are as engaging, informative and productive as possible,” said David Mannino, MD, Co-Founder and Medical Director of the COPD Foundation and the study’s lead author. “Equipping patients with the right information and resources can help them take a more active role in their care and improve health outcomes.”
QUARTERLY STAKEHOLDER LETTER | SECOND QUARTER 2026 | 10 Product Update Phreesia VoiceAI In the fiscal second quarter, Phreesia launched VoiceAI, an always-on, intelligent call-management solution that automatically answers, triages and routes patient calls in multiple languages. VoiceAI uses advanced conversational AI and real-time workflow orchestration to help practices manage high call volumes, reduce wait times and improve the patient experience, all without increasing staff workload. VoiceAI allows patients to easily resolve common requests, such as scheduling an appointment or refilling a prescription, by automatically identifying intent based on the patient’s spoken input—for example, the patient saying “I want to make an appointment,” or “I need to refill my prescription”—and routing the request accordingly. Calls requiring human support are seamlessly handed off to the right team member. PhreesiaOnCall, a subset of the VoiceAI functionality, ensures that urgent calls that come in from patients after hours reach on-call staff without delay. Consistent with our approach to rolling out new products and features, VoiceAI will be available to our clients to try at no risk and no cost for an initial promotion period. AI-Assisted Referrals As we continue strategically leveraging AI to increase operational efficiencies and further our mission of making care easier every day, we are introducing a new iteration on our referral product, AI-Assisted Referrals, to improve processing times and help patients get the specialty care they need quicker. Increasing the speed to process referrals helps specialists schedule appointments sooner, which leads to faster care delivery for the patient and faster reimbursements for the organization. When a fax is received, our AI tool transcribes the information needed for the healthcare organization before an employee manually verifies accuracy. The use of AI document transcription allows Phreesia to increase our operational efficiencies while delivering the consistent, high-quality service our provider clients expect from us. AI-Assisted Referrals is enabling rapid growth for Phreesia and our provider clients, with a 56% increase in monthly referral volume over a recent five-month period. Out-of-Network Tags Our new Out-of-Network (OON) Tags feature automatically identifies patients that are out-of-network, streamlining the insurance validation process and saving healthcare organizations up to eight days of manual verification per month. OON Tags compare the information configured in a client’s Phreesia Dashboard with appointment-specific details, including the provider and/or location and patient’s insurance plan, to quickly identify out-of-network patients ahead of a visit. For patients, the ability to have transparent financial conversations before a visit helps prevent surprise bills and further builds on the modern, convenient healthcare experience they expect.
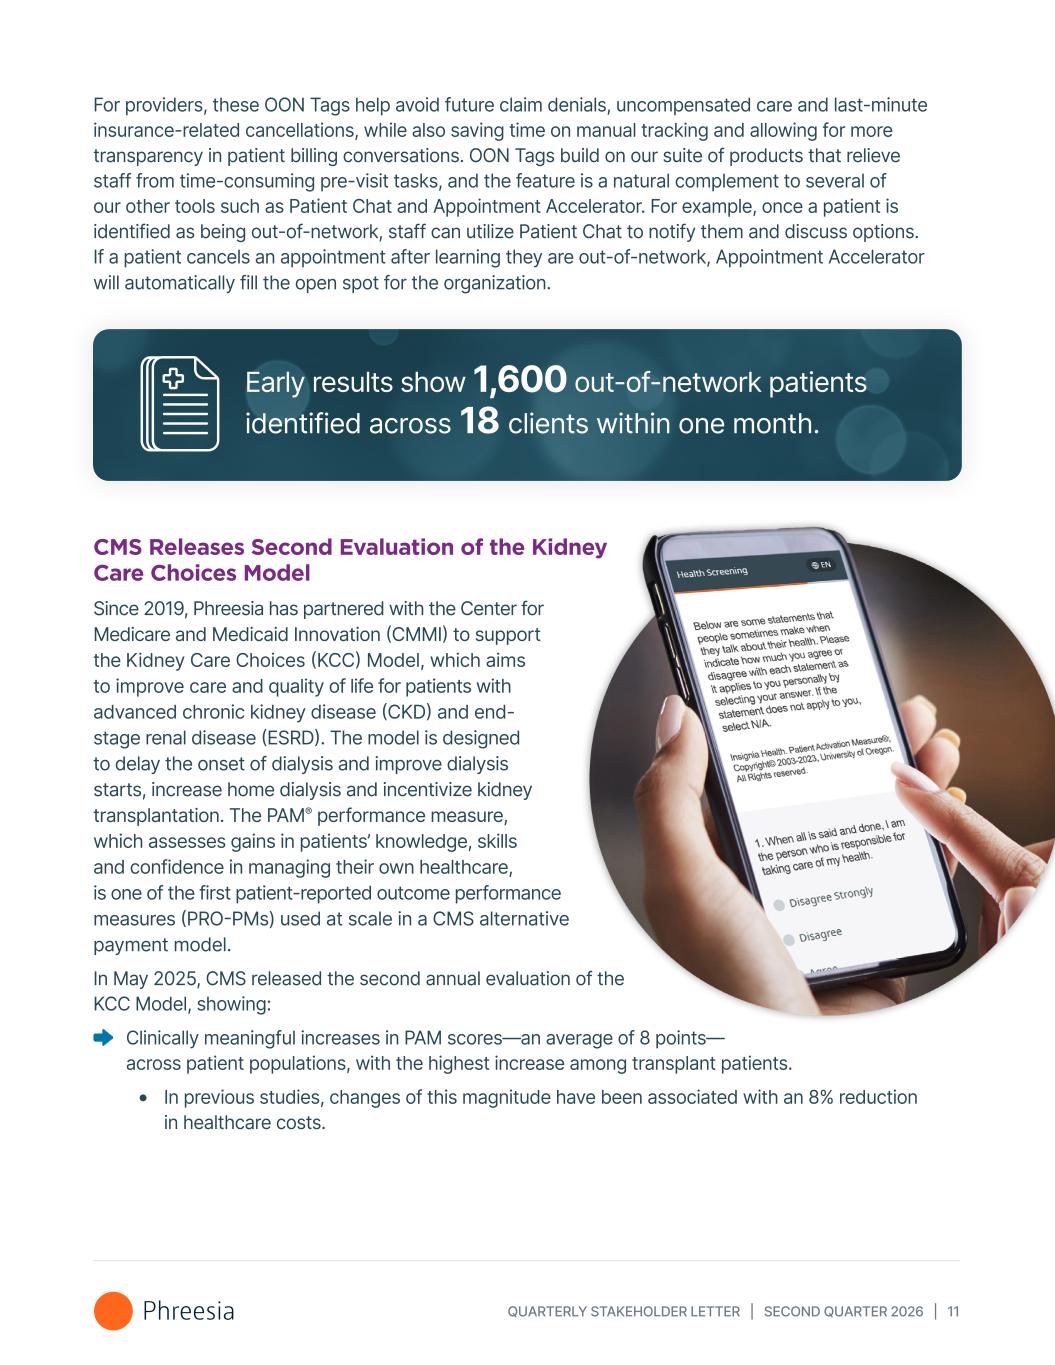
QUARTERLY STAKEHOLDER LETTER | SECOND QUARTER 2026 | 11 For providers, these OON Tags help avoid future claim denials, uncompensated care and last-minute insurance-related cancellations, while also saving time on manual tracking and allowing for more transparency in patient billing conversations. OON Tags build on our suite of products that relieve staff from time-consuming pre-visit tasks, and the feature is a natural complement to several of our other tools such as Patient Chat and Appointment Accelerator. For example, once a patient is identified as being out-of-network, staff can utilize Patient Chat to notify them and discuss options. If a patient cancels an appointment after learning they are out-of-network, Appointment Accelerator will automatically fill the open spot for the organization. Early results show 1,600 out-of-network patients identified across 18 clients within one month. CMS Releases Second Evaluation of the Kidney Care Choices Model Since 2019, Phreesia has partnered with the Center for Medicare and Medicaid Innovation (CMMI) to support the Kidney Care Choices (KCC) Model, which aims to improve care and quality of life for patients with advanced chronic kidney disease (CKD) and end- stage renal disease (ESRD). The model is designed to delay the onset of dialysis and improve dialysis starts, increase home dialysis and incentivize kidney transplantation. The PAM® performance measure, which assesses gains in patients’ knowledge, skills and confidence in managing their own healthcare, is one of the first patient-reported outcome performance measures (PRO-PMs) used at scale in a CMS alternative payment model. In May 2025, CMS released the second annual evaluation of the KCC Model, showing: Clinically meaningful increases in PAM scores—an average of 8 points— across patient populations, with the highest increase among transplant patients. In previous studies, changes of this magnitude have been associated with an 8% reduction in healthcare costs.
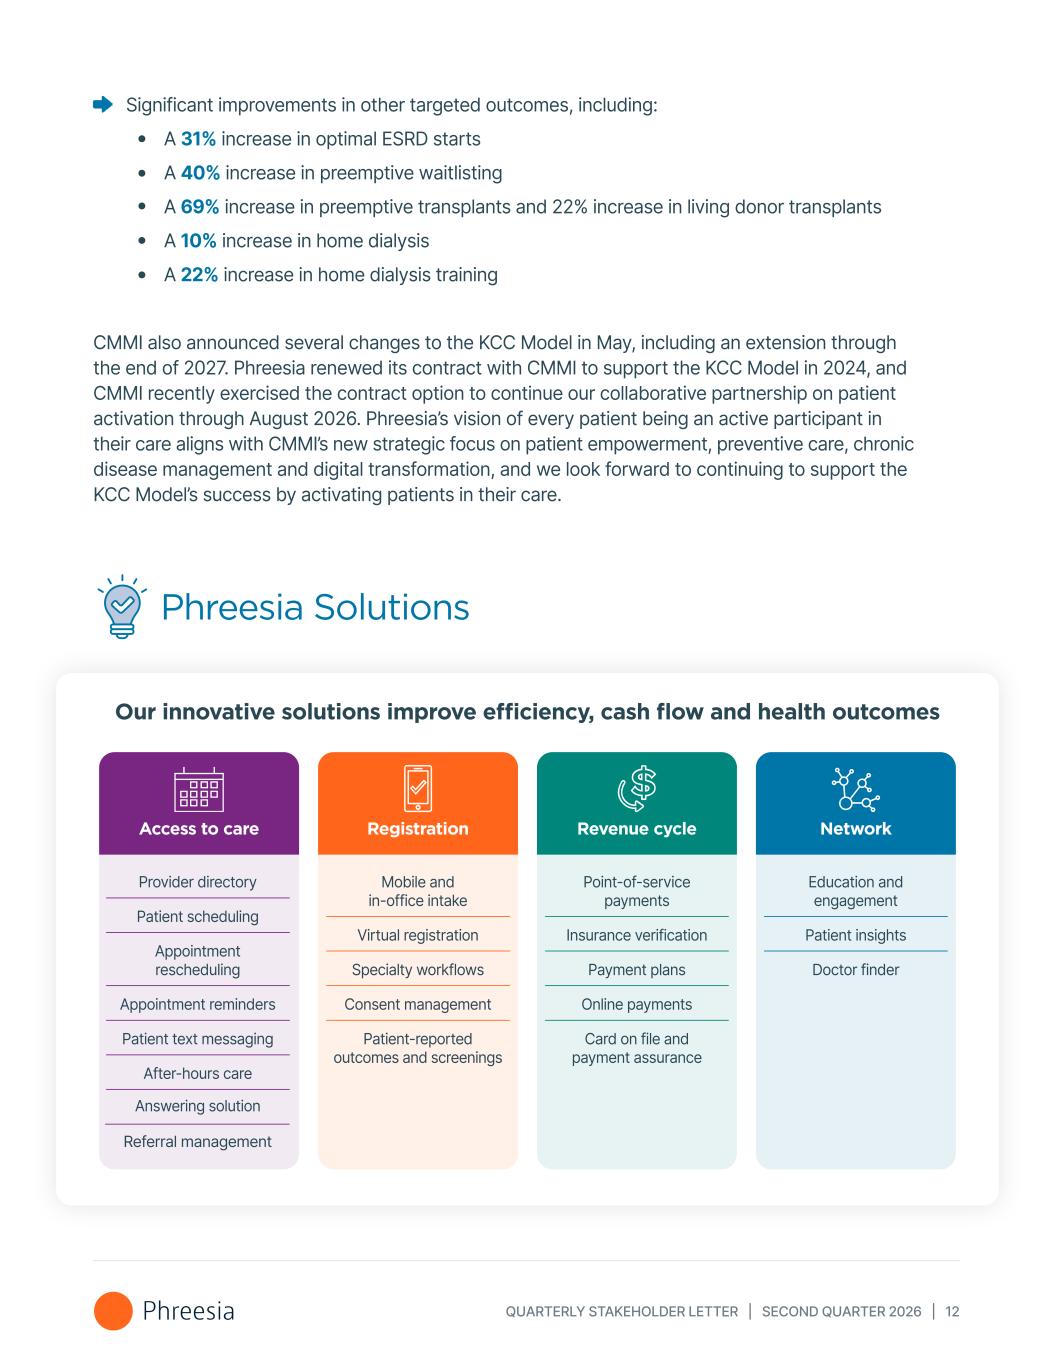
QUARTERLY STAKEHOLDER LETTER | SECOND QUARTER 2026 | 12 Significant improvements in other targeted outcomes, including: A 31% increase in optimal ESRD starts A 40% increase in preemptive waitlisting A 69% increase in preemptive transplants and 22% increase in living donor transplants A 10% increase in home dialysis A 22% increase in home dialysis training CMMI also announced several changes to the KCC Model in May, including an extension through the end of 2027. Phreesia renewed its contract with CMMI to support the KCC Model in 2024, and CMMI recently exercised the contract option to continue our collaborative partnership on patient activation through August 2026. Phreesia’s vision of every patient being an active participant in their care aligns with CMMI’s new strategic focus on patient empowerment, preventive care, chronic disease management and digital transformation, and we look forward to continuing to support the KCC Model’s success by activating patients in their care. Phreesia Solutions Our innovative solutions improve efficiency, cash flow and health outcomes Access to care Registration Revenue cycle Network Provider directory Patient scheduling Appointment rescheduling Appointment reminders Patient text messaging After-hours care Answering solution Referral management Mobile and in-office intake Virtual registration Specialty workflows Consent management Patient-reported outcomes and screenings Point-of-service payments Insurance verification Payment plans Online payments Card on file and payment assurance Education and engagement Patient insights Doctor finder
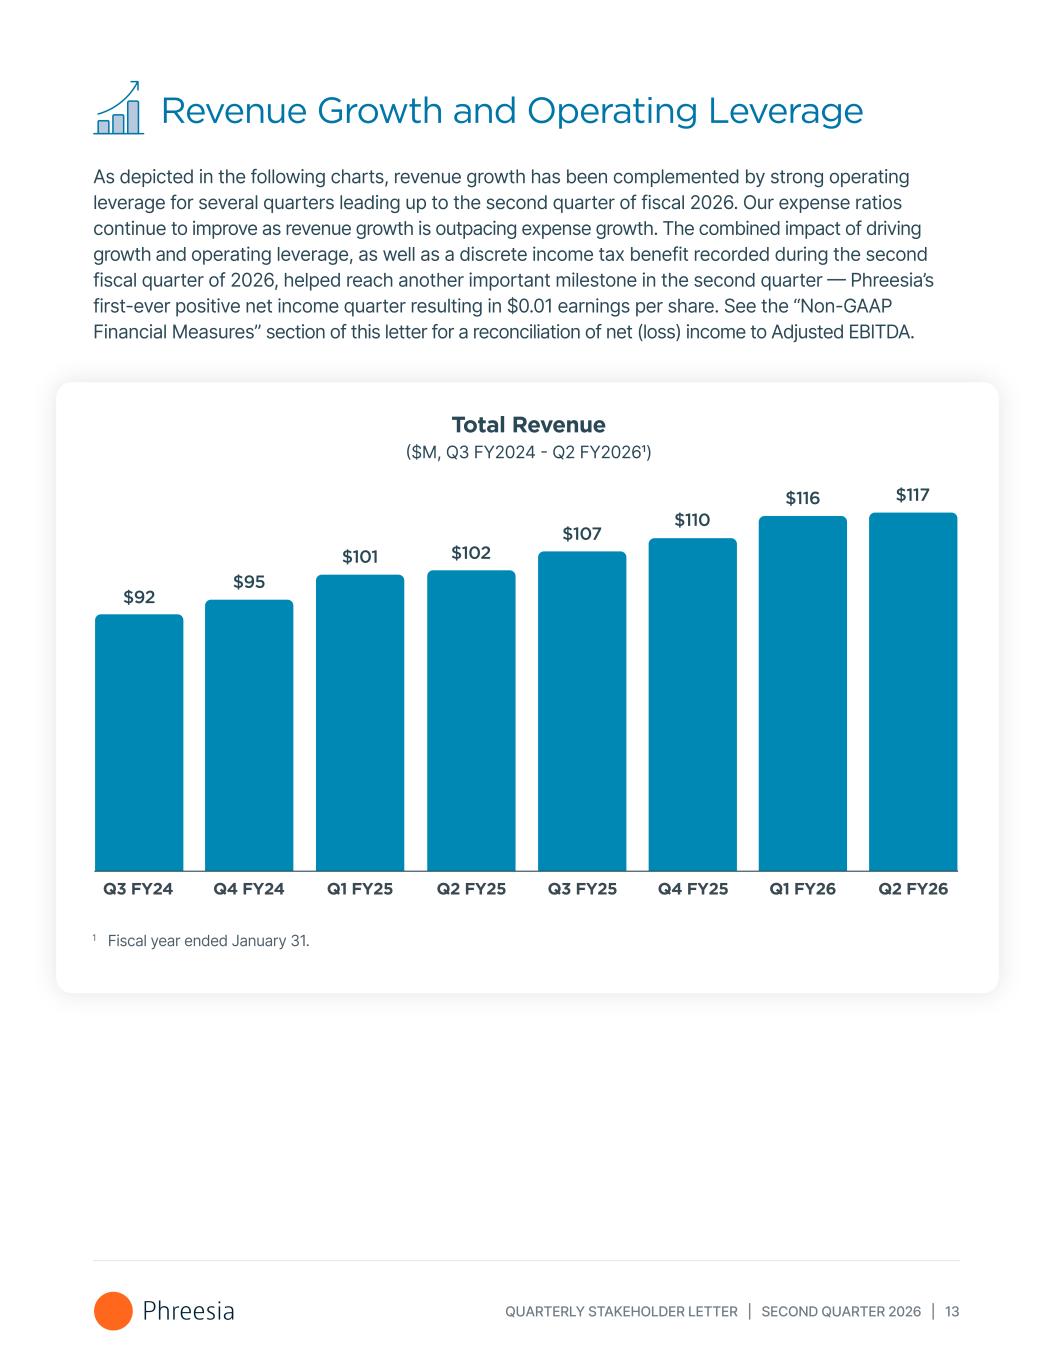
QUARTERLY STAKEHOLDER LETTER | SECOND QUARTER 2026 | 13 Revenue Growth and Operating Leverage As depicted in the following charts, revenue growth has been complemented by strong operating leverage for several quarters leading up to the second quarter of fiscal 2026. Our expense ratios continue to improve as revenue growth is outpacing expense growth. The combined impact of driving growth and operating leverage, as well as a discrete income tax benefit recorded during the second fiscal quarter of 2026, helped reach another important milestone in the second quarter — Phreesia’s first-ever positive net income quarter resulting in $0.01 earnings per share. See the “Non-GAAP Financial Measures” section of this letter for a reconciliation of net (loss) income to Adjusted EBITDA. Total Revenue ($M, Q3 FY2024 - Q2 FY20261) $92 $95 $101 $102 $107 $110 Q3 FY24 Q4 FY24 Q1 FY25 Q2 FY25 Q3 FY25 Q4 FY25 Q1 FY26 $116 Q2 FY26 $117 1 Fiscal year ended January 31.
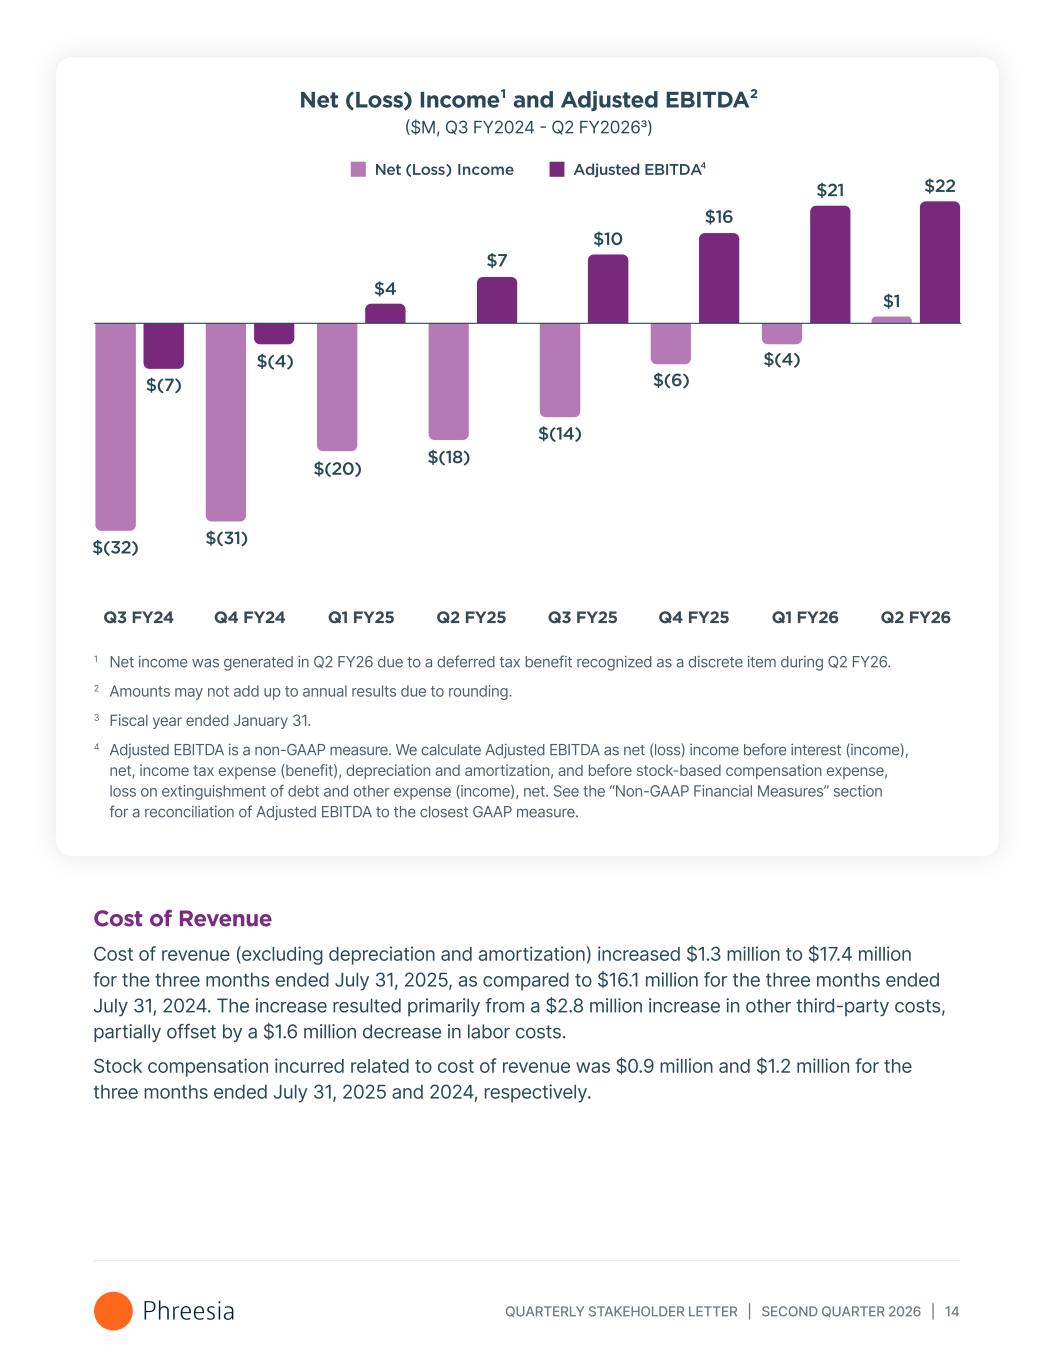
QUARTERLY STAKEHOLDER LETTER | SECOND QUARTER 2026 | 14 Cost of Revenue Cost of revenue (excluding depreciation and amortization) increased $1.3 million to $17.4 million for the three months ended July 31, 2025, as compared to $16.1 million for the three months ended July 31, 2024. The increase resulted primarily from a $2.8 million increase in other third-party costs, partially offset by a $1.6 million decrease in labor costs. Stock compensation incurred related to cost of revenue was $0.9 million and $1.2 million for the three months ended July 31, 2025 and 2024, respectively. 1 Net income was generated in Q2 FY26 due to a deferred tax benefit recognized as a discrete item during Q2 FY26. 2 Amounts may not add up to annual results due to rounding. 3 Fiscal year ended January 31. 4 Adjusted EBITDA is a non-GAAP measure. We calculate Adjusted EBITDA as net (loss) income before interest (income), net, income tax expense (benefit), depreciation and amortization, and before stock-based compensation expense, loss on extinguishment of debt and other expense (income), net. See the “Non-GAAP Financial Measures” section for a reconciliation of Adjusted EBITDA to the closest GAAP measure. Net (Loss) Income¹ and Adjusted EBITDA² ($M, Q3 FY2024 - Q2 FY20263) Q2 FY26Q3 FY24 Q4 FY24 Q1 FY25 Q2 FY25 Q3 FY25 Q4 FY25 Q1 FY26 $(32) $(31) $(20) $(18) $(14) $(6)$(7) $(4) $4 $7 $10 $16 Net (Loss) Income Adjusted EBITDA $21 $(4) $22 $1
QUARTERLY STAKEHOLDER LETTER | SECOND QUARTER 2026 | 15 Payment Processing Expense Payment processing expense increased $3.6 million to $20.2 million for the three months ended July 31, 2025, as compared to $16.7 million for the three months ended July 31, 2024. The increase resulted primarily from the increase in payment processing fees revenue and patient payments processed through our solutions, each driven by an increase in patient visits over the prior year. Our payment processing expense as a percentage of payment processing fees revenue was 71% in the second quarter of fiscal 2026, compared to 72% and 66% in the first quarter of fiscal 2026 and the second quarter of fiscal 2025, respectively. Sales & Marketing Sales and marketing expense decreased $4.8 million to $25.4 million for the three months ended July 31, 2025, as compared to $30.2 million for the three months ended July 31, 2024. The decrease resulted primarily from a $6.2 million decrease in labor costs, partially offset by a $1.4 million increase in other third-party sales and marketing costs. Stock compensation incurred related to sales and marketing expense was $4.7 million and $5.3 million for the three months ended July 31, 2025 and 2024, respectively. Research & Development Research and development expense decreased $0.3 million to $29.3 million for the three months ended July 31, 2025, as compared to $29.5 million for the three months ended July 31, 2024. The decrease resulted primarily from a $0.6 million decrease in other third-party costs, partially offset by a $0.4 million increase in software costs. Stock compensation incurred related to research and development expense was $4.2 million and $3.6 million for the three months ended July 31, 2025 and 2024, respectively. On a sequential basis, research and development expense decreased as a percentage of revenue because certain tools previously used in research and development were repurposed to use in revenue generating activities. General & Administrative General and administrative expense decreased $0.5 million to $19.0 million for the three months ended July 31, 2025, as compared to $19.5 million for the three months ended July 31, 2024. The decrease primarily resulted from a $1.8 million decrease in labor costs, partially offset by a $1.3 million increase in other third-party costs. Stock compensation incurred related to general and administrative expense was $6.4 million and $6.3 million for the three months ended July 31, 2025 and 2024, respectively. On a sequential basis, general and administrative expenses increased as a percentage of revenue compared to the first fiscal quarter because the first fiscal quarter included a one-time insurance recovery of $1.8 million, which did not recur in the second quarter.
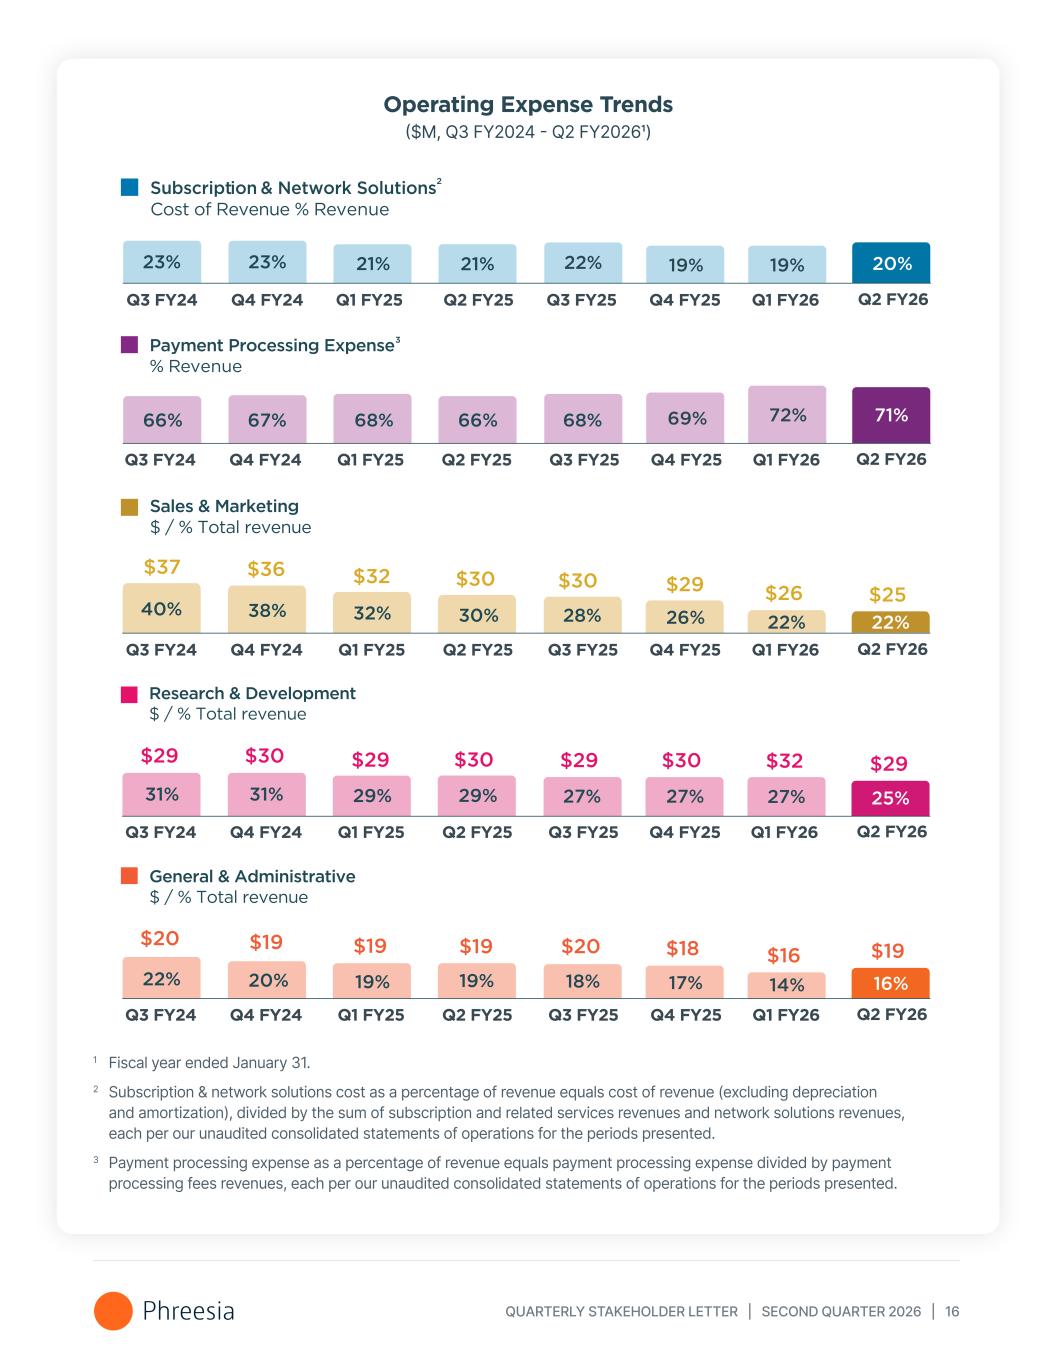
QUARTERLY STAKEHOLDER LETTER | SECOND QUARTER 2026 | 16 Operating Expense Trends ($M, Q3 FY2024 - Q2 FY20261) 1 Fiscal year ended January 31. 2 Subscription & network solutions cost as a percentage of revenue equals cost of revenue (excluding depreciation and amortization), divided by the sum of subscription and related services revenues and network solutions revenues, each per our unaudited consolidated statements of operations for the periods presented. 3 Payment processing expense as a percentage of revenue equals payment processing expense divided by payment processing fees revenues, each per our unaudited consolidated statements of operations for the periods presented. 19% Sales & Marketing $ / % Total revenue 22% $26 40% $37 38% $36 32% $32 Research & Development $ / % Total revenue 27% $32 31% $29 31% $30 29% $29 General & Administrative $ / % Total revenue 14% $16 22% $20 20% $19 19% $19 Payment Processing Expense % Revenue 72%66% 67% 68% Subscription & Network Solutions Cost of Revenue % Revenue 23% 23% 21% 21% 66% 30% $30 29% $30 19% $19 22% 68% 28% $30 27% $29 18% $20 19% 69% 26% $29 27% $30 17% $18 Q2 FY26Q3 FY24 Q4 FY24 Q1 FY25 Q2 FY25 Q3 FY25 Q4 FY25 Q1 FY26 Q2 FY26Q3 FY24 Q4 FY24 Q1 FY25 Q2 FY25 Q3 FY25 Q4 FY25 Q1 FY26 Q2 FY26Q3 FY24 Q4 FY24 Q1 FY25 Q2 FY25 Q3 FY25 Q4 FY25 Q1 FY26 Q2 FY26Q3 FY24 Q4 FY24 Q1 FY25 Q2 FY25 Q3 FY25 Q4 FY25 Q1 FY26 Q2 FY26Q3 FY24 Q4 FY24 Q1 FY25 Q2 FY25 Q3 FY25 Q4 FY25 Q1 FY26 20% 22% $25 25% $29 16% $19 71%
QUARTERLY STAKEHOLDER LETTER | SECOND QUARTER 2026 | 17 Balance Sheet and Liquidity As of July 31, 2025 and January 31, 2025, we had cash and cash equivalents of $98.3 million and $84.2 million, respectively. Cash and cash equivalents consist of money market funds and cash on deposit at various financial institutions. As our cash position grows, we will remain opportunistic and flexible in our approach to deploying cash to profitable growth and value enhancing opportunities as they arise. Cash Flow In the second quarter of fiscal 2026, we maintained positive net cash provided by operating activities8 of $14.8 million, an improvement of $3.7 million year- over-year, as compared to net cash provided by operating activities of $11.1 million in the second quarter of fiscal 2025. In the second quarter of fiscal 2026, we generated free cash flow9 of $9.6 million, an improvement of $5.9 million year-over- year, as compared to $3.7 million in the second quarter of fiscal 2025. The quarter-over-quarter improvement in operating cash flow and free cash flow are expected to fluctuate, driven by the timing of invoicing and payments. These variations are reflected in changes in working capital, alongside the timing of capital expenditures. The following charts summarize how growth in our net cash (used in) provided by operating activities, or operating cash flow, has driven growth in free cash flow. See the “Non-GAAP Financial Measures” section of this letter for a reconciliation of net cash (used in) provided by operating activities to free cash flow. 8 References to net cash provided by operating activities, free cash flow and net cash (used in) provided by operating activities throughout this letter are related to our cash flow categories in our consolidated statements of cash flows and free cash flow reconciliation within Part I - Item 1 and Item 2 of our Quarterly Report on Form 10-Q. 9 Free cash flow is a non-GAAP measure. We calculate free cash flow as net cash (used in) provided by operating activities less capitalized internal-use software development costs and purchases of property and equipment. See the “Non-GAAP Financial Measures” section for a reconciliation of free cash flow to the closest GAAP measure.
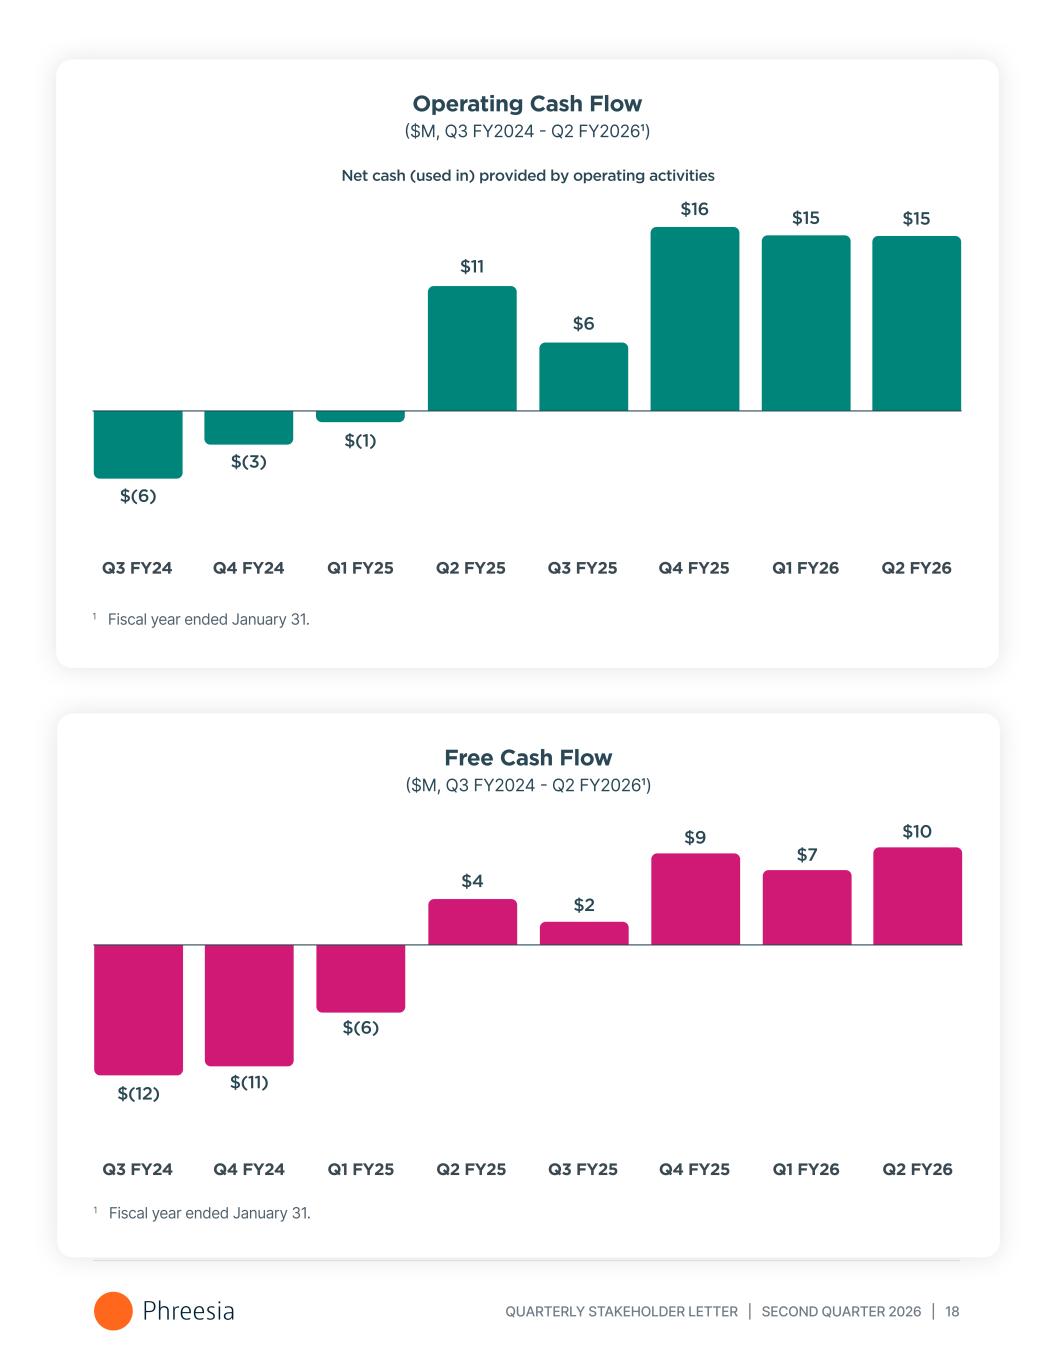
QUARTERLY STAKEHOLDER LETTER | SECOND QUARTER 2026 | 18 Operating Cash Flow ($M, Q3 FY2024 - Q2 FY20261) 1 Fiscal year ended January 31. $15 Net cash (used in) provided by operating activities $11 $6 $16 Q2 FY26Q3 FY24 Q4 FY24 Q1 FY25 Q2 FY25 Q3 FY25 Q4 FY25 Q1 FY26 $(6) $(3) $(1) $15 Free Cash Flow ($M, Q3 FY2024 - Q2 FY20261) 1 Fiscal year ended January 31. $4 $2 $9 Q2 FY26Q3 FY24 Q4 FY24 Q1 FY25 Q2 FY25 Q3 FY25 Q4 FY25 Q1 FY26 $(12) $(11) $(6) $7 $10
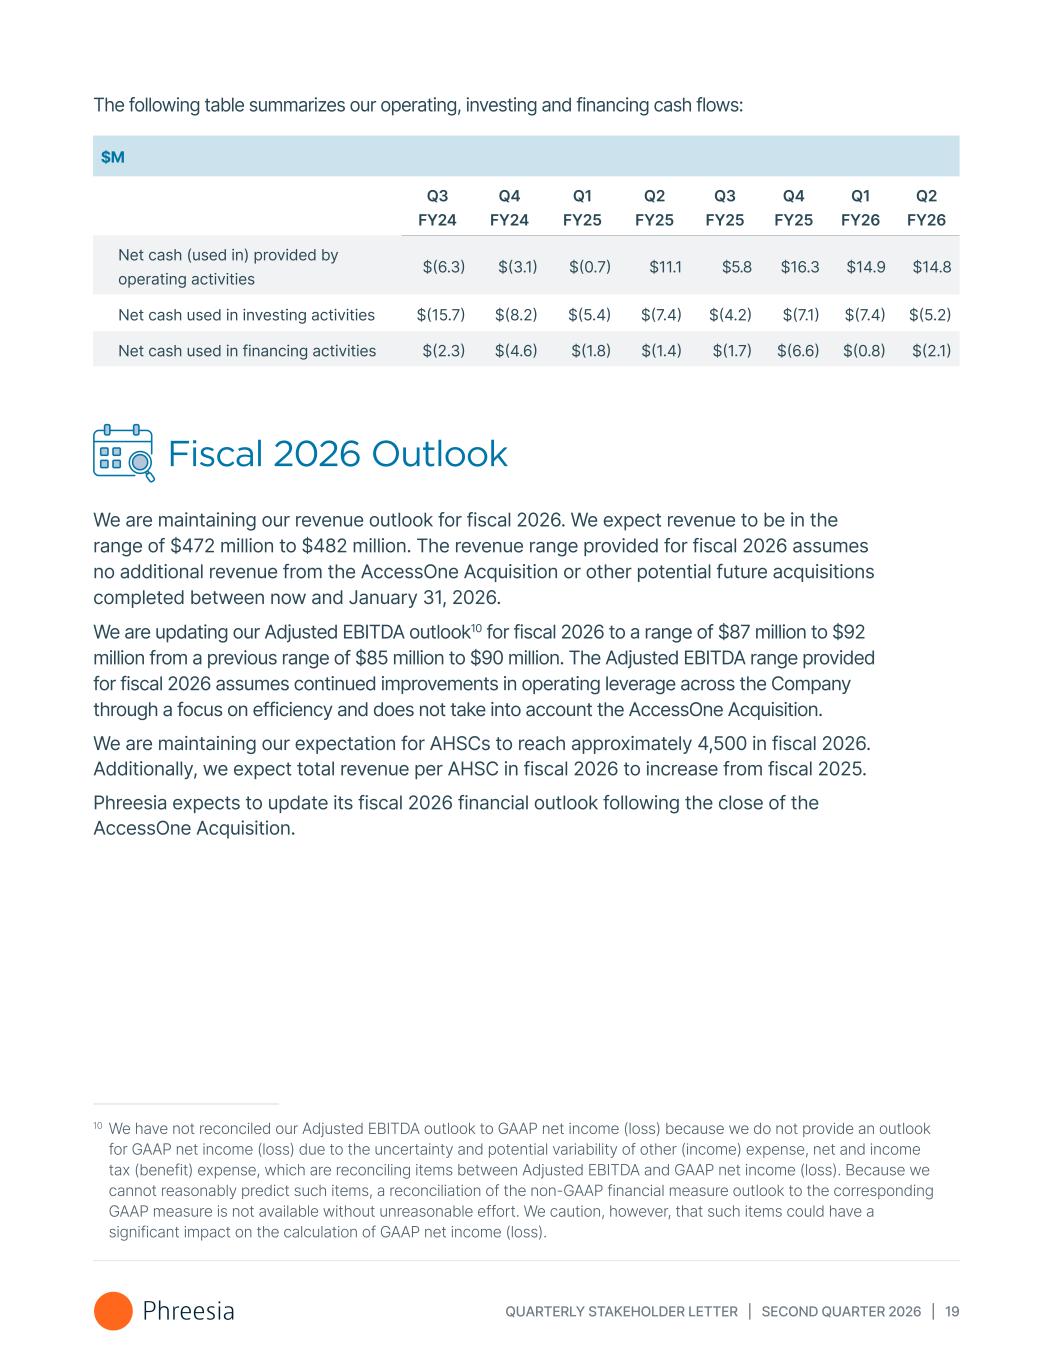
QUARTERLY STAKEHOLDER LETTER | SECOND QUARTER 2026 | 19 The following table summarizes our operating, investing and financing cash flows: $M Q3 FY24 Q4 FY24 Q1 FY25 Q2 FY25 Q3 FY25 Q4 FY25 Q1 FY26 Q2 FY26 Net cash (used in) provided by operating activities $(6.3) $(3.1) $(0.7) $11.1 $5.8 $16.3 $14.9 $14.8 Net cash used in investing activities $(15.7) $(8.2) $(5.4) $(7.4) $(4.2) $(7.1) $(7.4) $(5.2) Net cash used in financing activities $(2.3) $(4.6) $(1.8) $(1.4) $(1.7) $(6.6) $(0.8) $(2.1) Fiscal 2026 Outlook We are maintaining our revenue outlook for fiscal 2026. We expect revenue to be in the range of $472 million to $482 million. The revenue range provided for fiscal 2026 assumes no additional revenue from the AccessOne Acquisition or other potential future acquisitions completed between now and January 31, 2026. We are updating our Adjusted EBITDA outlook10 for fiscal 2026 to a range of $87 million to $92 million from a previous range of $85 million to $90 million. The Adjusted EBITDA range provided for fiscal 2026 assumes continued improvements in operating leverage across the Company through a focus on efficiency and does not take into account the AccessOne Acquisition. We are maintaining our expectation for AHSCs to reach approximately 4,500 in fiscal 2026. Additionally, we expect total revenue per AHSC in fiscal 2026 to increase from fiscal 2025. Phreesia expects to update its fiscal 2026 financial outlook following the close of the AccessOne Acquisition. 10 We have not reconciled our Adjusted EBITDA outlook to GAAP net income (loss) because we do not provide an outlook for GAAP net income (loss) due to the uncertainty and potential variability of other (income) expense, net and income tax (benefit) expense, which are reconciling items between Adjusted EBITDA and GAAP net income (loss). Because we cannot reasonably predict such items, a reconciliation of the non-GAAP financial measure outlook to the corresponding GAAP measure is not available without unreasonable effort. We caution, however, that such items could have a significant impact on the calculation of GAAP net income (loss).
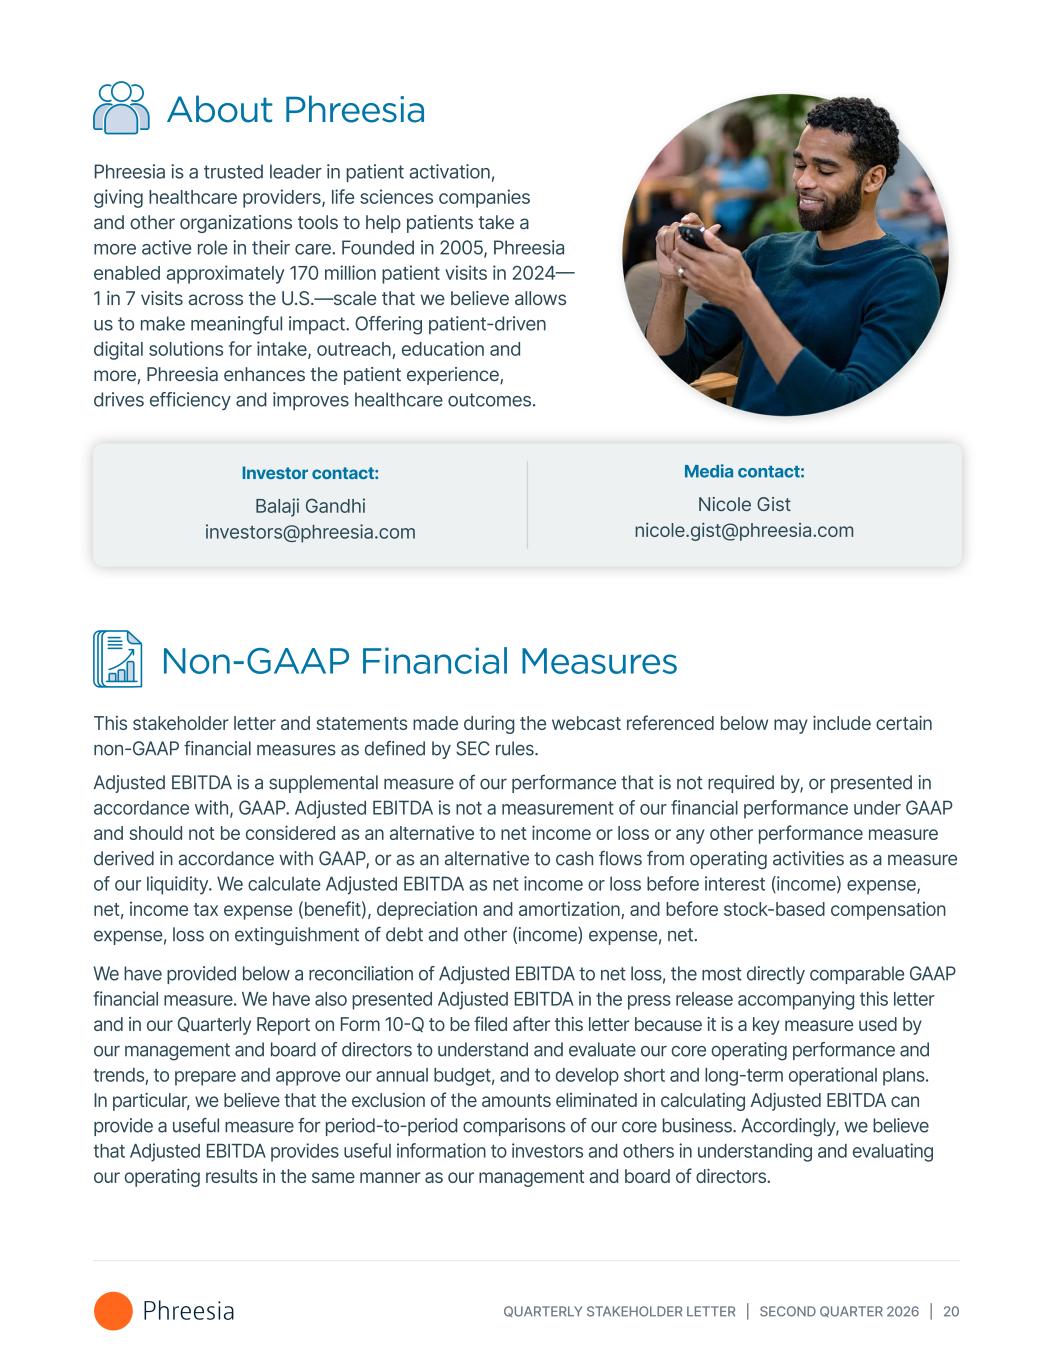
QUARTERLY STAKEHOLDER LETTER | SECOND QUARTER 2026 | 20 About Phreesia Phreesia is a trusted leader in patient activation, giving healthcare providers, life sciences companies and other organizations tools to help patients take a more active role in their care. Founded in 2005, Phreesia enabled approximately 170 million patient visits in 2024— 1 in 7 visits across the U.S.—scale that we believe allows us to make meaningful impact. Offering patient-driven digital solutions for intake, outreach, education and more, Phreesia enhances the patient experience, drives efficiency and improves healthcare outcomes. Media contact: Nicole Gist nicole.gist@phreesia.com Investor contact: Balaji Gandhi investors@phreesia.com Non-GAAP Financial Measures This stakeholder letter and statements made during the webcast referenced below may include certain non-GAAP financial measures as defined by SEC rules. Adjusted EBITDA is a supplemental measure of our performance that is not required by, or presented in accordance with, GAAP. Adjusted EBITDA is not a measurement of our financial performance under GAAP and should not be considered as an alternative to net income or loss or any other performance measure derived in accordance with GAAP, or as an alternative to cash flows from operating activities as a measure of our liquidity. We calculate Adjusted EBITDA as net income or loss before interest (income) expense, net, income tax expense (benefit), depreciation and amortization, and before stock-based compensation expense, loss on extinguishment of debt and other (income) expense, net. We have provided below a reconciliation of Adjusted EBITDA to net loss, the most directly comparable GAAP financial measure. We have also presented Adjusted EBITDA in the press release accompanying this letter and in our Quarterly Report on Form 10-Q to be filed after this letter because it is a key measure used by our management and board of directors to understand and evaluate our core operating performance and trends, to prepare and approve our annual budget, and to develop short and long-term operational plans. In particular, we believe that the exclusion of the amounts eliminated in calculating Adjusted EBITDA can provide a useful measure for period-to-period comparisons of our core business. Accordingly, we believe that Adjusted EBITDA provides useful information to investors and others in understanding and evaluating our operating results in the same manner as our management and board of directors.
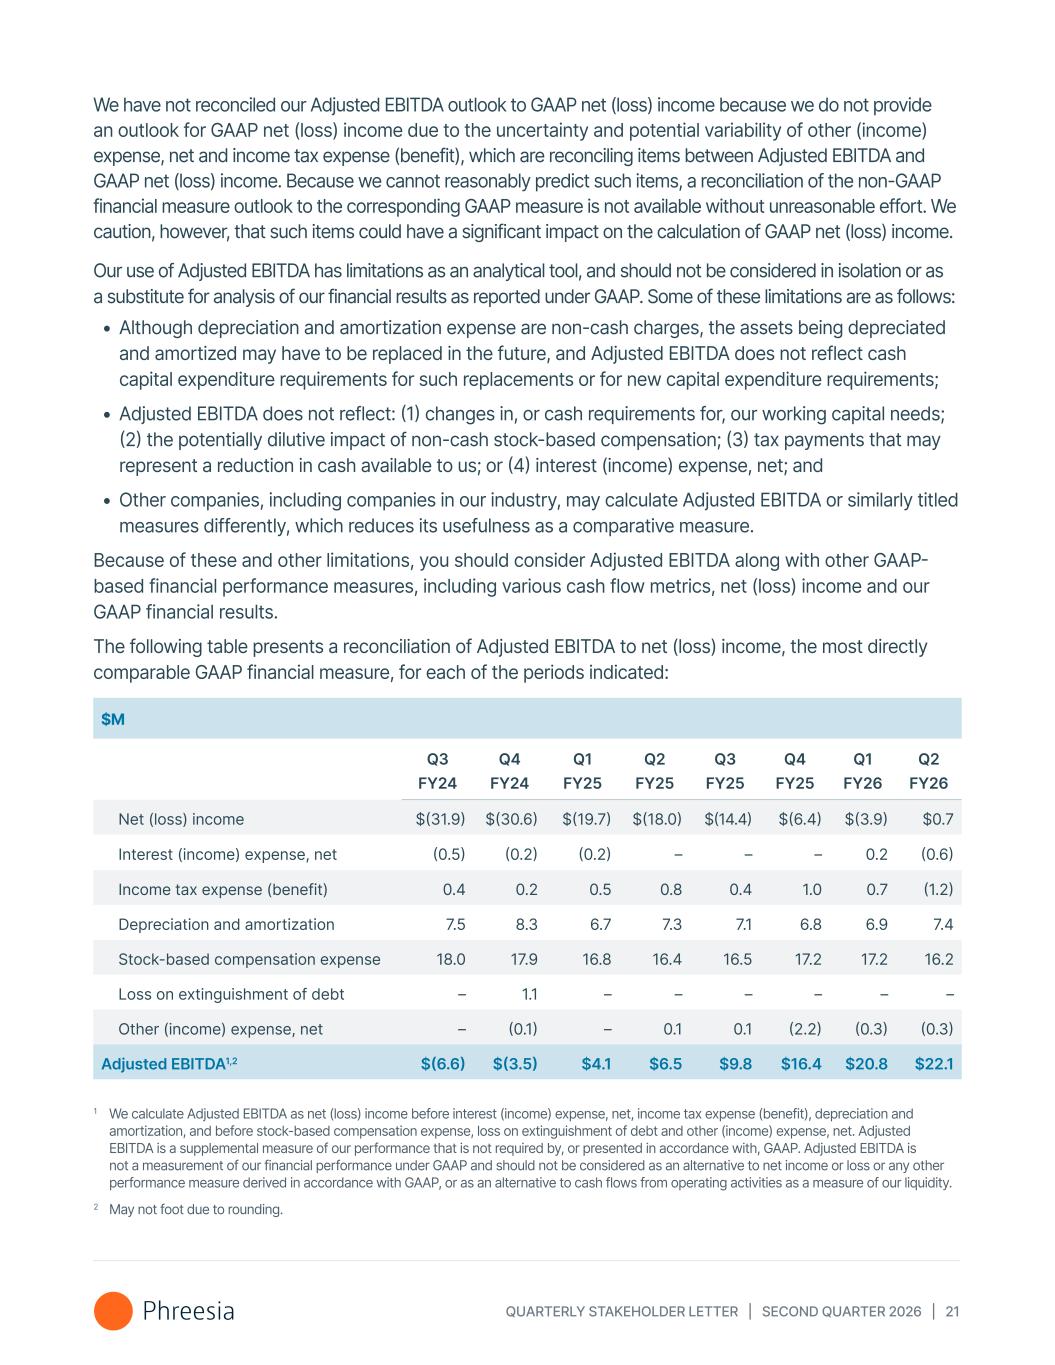
QUARTERLY STAKEHOLDER LETTER | SECOND QUARTER 2026 | 21 We have not reconciled our Adjusted EBITDA outlook to GAAP net (loss) income because we do not provide an outlook for GAAP net (loss) income due to the uncertainty and potential variability of other (income) expense, net and income tax expense (benefit), which are reconciling items between Adjusted EBITDA and GAAP net (loss) income. Because we cannot reasonably predict such items, a reconciliation of the non-GAAP financial measure outlook to the corresponding GAAP measure is not available without unreasonable effort. We caution, however, that such items could have a significant impact on the calculation of GAAP net (loss) income. Our use of Adjusted EBITDA has limitations as an analytical tool, and should not be considered in isolation or as a substitute for analysis of our financial results as reported under GAAP. Some of these limitations are as follows: • Although depreciation and amortization expense are non-cash charges, the assets being depreciated and amortized may have to be replaced in the future, and Adjusted EBITDA does not reflect cash capital expenditure requirements for such replacements or for new capital expenditure requirements; • Adjusted EBITDA does not reflect: (1) changes in, or cash requirements for, our working capital needs; (2) the potentially dilutive impact of non-cash stock-based compensation; (3) tax payments that may represent a reduction in cash available to us; or (4) interest (income) expense, net; and • Other companies, including companies in our industry, may calculate Adjusted EBITDA or similarly titled measures differently, which reduces its usefulness as a comparative measure. Because of these and other limitations, you should consider Adjusted EBITDA along with other GAAP- based financial performance measures, including various cash flow metrics, net (loss) income and our GAAP financial results. The following table presents a reconciliation of Adjusted EBITDA to net (loss) income, the most directly comparable GAAP financial measure, for each of the periods indicated: $M Q3 FY24 Q4 FY24 Q1 FY25 Q2 FY25 Q3 FY25 Q4 FY25 Q1 FY26 Q2 FY26 Net (loss) income $(31.9) $(30.6) $(19.7) $(18.0) $(14.4) $(6.4) $(3.9) $0.7 Interest (income) expense, net (0.5) (0.2) (0.2) – – – 0.2 (0.6) Income tax expense (benefit) 0.4 0.2 0.5 0.8 0.4 1.0 0.7 (1.2) Depreciation and amortization 7.5 8.3 6.7 7.3 7.1 6.8 6.9 7.4 Stock-based compensation expense 18.0 17.9 16.8 16.4 16.5 17.2 17.2 16.2 Loss on extinguishment of debt – 1.1 – – – – – – Other (income) expense, net – (0.1) – 0.1 0.1 (2.2) (0.3) (0.3) Adjusted EBITDA1,2 $(6.6) $(3.5) $4.1 $6.5 $9.8 $16.4 $20.8 $22.1 1 We calculate Adjusted EBITDA as net (loss) income before interest (income) expense, net, income tax expense (benefit), depreciation and amortization, and before stock-based compensation expense, loss on extinguishment of debt and other (income) expense, net. Adjusted EBITDA is a supplemental measure of our performance that is not required by, or presented in accordance with, GAAP. Adjusted EBITDA is not a measurement of our financial performance under GAAP and should not be considered as an alternative to net income or loss or any other performance measure derived in accordance with GAAP, or as an alternative to cash flows from operating activities as a measure of our liquidity. 2 May not foot due to rounding.
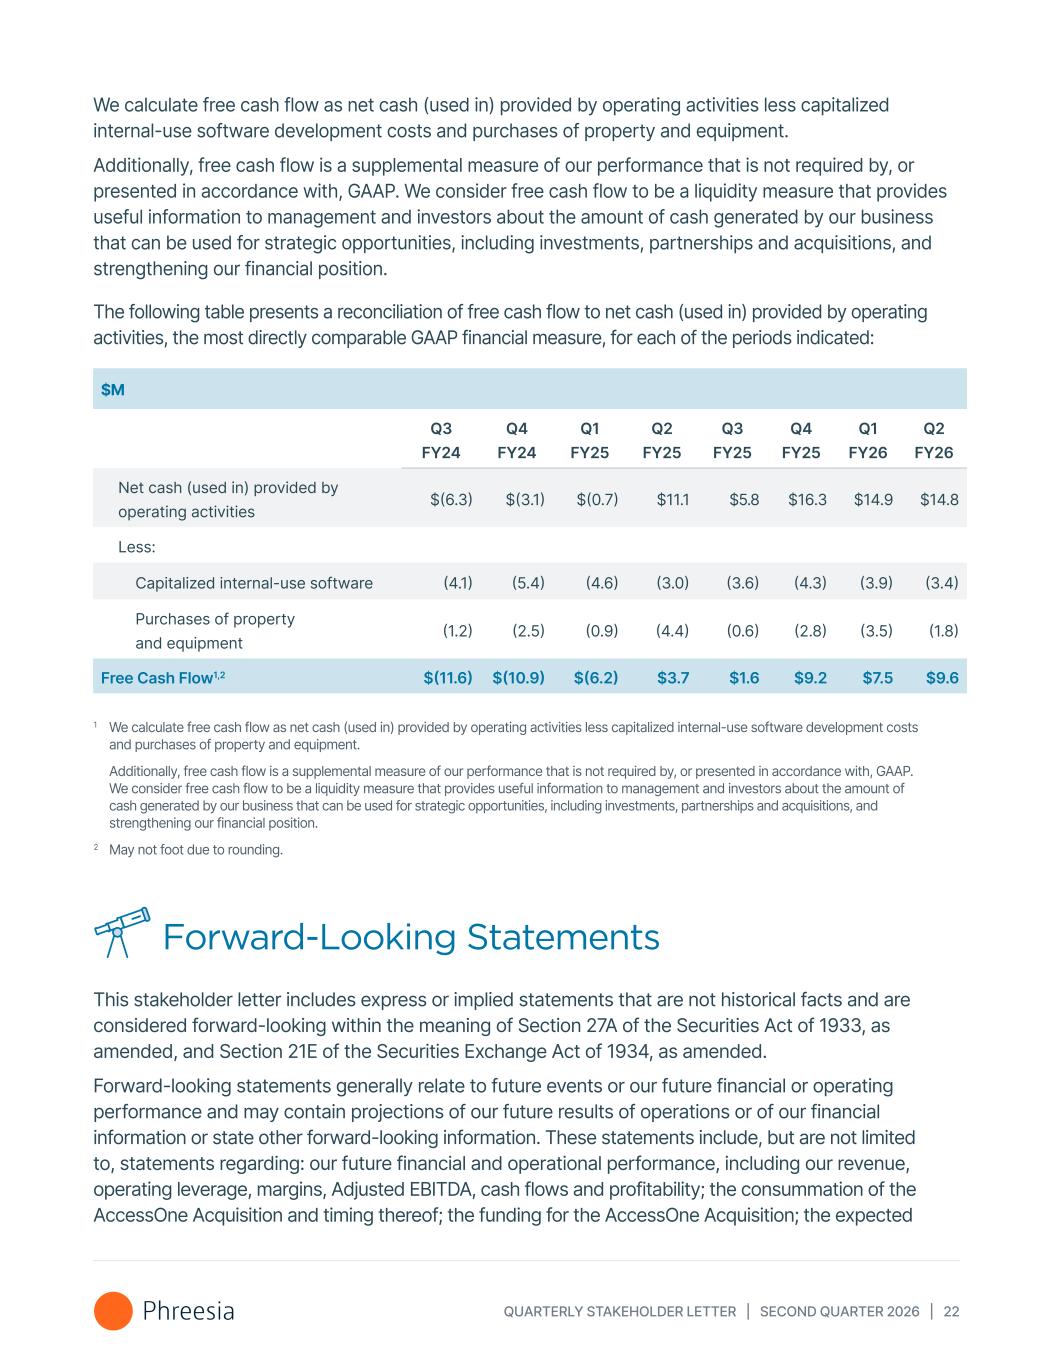
QUARTERLY STAKEHOLDER LETTER | SECOND QUARTER 2026 | 22 We calculate free cash flow as net cash (used in) provided by operating activities less capitalized internal-use software development costs and purchases of property and equipment. Additionally, free cash flow is a supplemental measure of our performance that is not required by, or presented in accordance with, GAAP. We consider free cash flow to be a liquidity measure that provides useful information to management and investors about the amount of cash generated by our business that can be used for strategic opportunities, including investments, partnerships and acquisitions, and strengthening our financial position. The following table presents a reconciliation of free cash flow to net cash (used in) provided by operating activities, the most directly comparable GAAP financial measure, for each of the periods indicated: $M Q3 FY24 Q4 FY24 Q1 FY25 Q2 FY25 Q3 FY25 Q4 FY25 Q1 FY26 Q2 FY26 Net cash (used in) provided by operating activities $(6.3) $(3.1) $(0.7) $11.1 $5.8 $16.3 $14.9 $14.8 Less: Capitalized internal-use software (4.1) (5.4) (4.6) (3.0) (3.6) (4.3) (3.9) (3.4) Purchases of property and equipment (1.2) (2.5) (0.9) (4.4) (0.6) (2.8) (3.5) (1.8) Free Cash Flow1,2 $(11.6) $(10.9) $(6.2) $3.7 $1.6 $9.2 $7.5 $9.6 1 We calculate free cash flow as net cash (used in) provided by operating activities less capitalized internal-use software development costs and purchases of property and equipment. Additionally, free cash flow is a supplemental measure of our performance that is not required by, or presented in accordance with, GAAP. We consider free cash flow to be a liquidity measure that provides useful information to management and investors about the amount of cash generated by our business that can be used for strategic opportunities, including investments, partnerships and acquisitions, and strengthening our financial position. 2 May not foot due to rounding. Forward-Looking Statements This stakeholder letter includes express or implied statements that are not historical facts and are considered forward-looking within the meaning of Section 27A of the Securities Act of 1933, as amended, and Section 21E of the Securities Exchange Act of 1934, as amended. Forward-looking statements generally relate to future events or our future financial or operating performance and may contain projections of our future results of operations or of our financial information or state other forward-looking information. These statements include, but are not limited to, statements regarding: our future financial and operational performance, including our revenue, operating leverage, margins, Adjusted EBITDA, cash flows and profitability; the consummation of the AccessOne Acquisition and timing thereof; the funding for the AccessOne Acquisition; the expected
QUARTERLY STAKEHOLDER LETTER | SECOND QUARTER 2026 | 23 results of the AccessOne Acquisition discussed herein, including anticipated additional revenue, Adjusted EBITDA and AHSCs and an expansion of our total addressable market; our outlook for fiscal 2026, including with respect to revenue, Adjusted EBITDA and our expectations on AHSCs, total revenue per AHSC, and our plans to achieve our revenue and Adjusted EBITDA targets in fiscal 2026; our ability to continue generating free cash flow; our expectations regarding growth in subscription and related services revenue over the long term; our ability to finance our plans to achieve our fiscal year outlook with our current cash balance along with cash generated in the normal course of business; our business strategy and operating plans; industry trends and predictions; our anticipated growth and operating leverage; the factors that drive our revenue growth; our expectations regarding solutions under development; and our expectations regarding the growth of our network of clients and partners. In some cases, you can identify forward-looking statements by the following words: “may,” “will,” “could,” “would,” “should,” “expect,” “intend,” “plan,” “anticipate,” “believe,” “estimate,” “predict,” “project,” “potential,” “continue,” “ongoing,” or the negative of these terms or other comparable terminology, although not all forward-looking statements contain these words. Although we believe that the expectations reflected in these forward-looking statements are reasonable, these statements relate to future events or our future operational or financial performance and involve known and unknown risks, uncertainties and other factors that may cause our actual results, performance or achievements to be materially different from any future results, performance or achievements expressed or implied by these forward-looking statements. Furthermore, actual results may differ materially from those described in the forward-looking statements and will be affected by a variety of risks and factors that are beyond our control, including, without limitation, risks associated with: our ability to effectively manage our growth and meet our growth objectives; our focus on the long-term and our investments in growth; the ability of the parties to consummate the AccessOne Acquisition in a timely manner or at all; satisfaction of the conditions precedent to consummation of the AccessOne Acquisition, including the ability to secure required consents and regulatory approvals in a timely manner or at all; the ability to obtain funding for the AccessOne Acquisition; the ability to integrate operations or realize any operational or corporate synergies and other benefits from the AccessOne Acquisition; the competitive environment in which we operate; our ability to comply with the covenants in our credit agreement with Capital One; changes in market conditions and receptivity to our products and services; our ability to develop and release new products and services and successful enhancements, features and modifications to our existing products and services; our ability to maintain the security and availability of our platform; the impact of cyberattacks, security incidents or breaches impacting our business; changes in laws and regulations applicable to our business model; our ability to make accurate predictions about our industry and addressable market; our ability to attract, retain and cross-sell to healthcare services clients; our ability to continue to operate effectively with a primarily remote workforce and attract and retain key talent; our ability to realize the intended benefits of our acquisitions and partnerships; difficulties in integrating our acquisitions and investments; artificial intelligence that can impact our business, including by posing security risks to our confidential information, proprietary information and personal data, increasing our regulatory and compliance burden and increasing competition; and other general market, political, economic and business conditions (including from the change in U.S. presidential administration, tariff and trade issues, and the warfare and/or political and economic instability in Ukraine, the Middle East or elsewhere). The forward-looking statements contained in this letter are also subject to other risks and uncertainties,
QUARTERLY STAKEHOLDER LETTER | SECOND QUARTER 2026 | 24 including those listed or described in our filings with the SEC, including in our Quarterly Report on Form 10-Q for the fiscal quarter ended July 31, 2025 that will be filed with the SEC after this letter. The forward-looking statements in this letter speak only as of the date on which the statements are made. We undertake no obligation to update, and expressly disclaim the obligation to update, any forward-looking statements made in this letter to reflect events or circumstances after the date of this letter or to reflect new information or the occurrence of unanticipated events, except as required by law. This letter also includes statistical data, estimates and forecasts that are based on industry publications or other publicly available information, as well as other information based on our internal sources. This information may be based on many assumptions and limitations, and you are cautioned not to give undue weight to such information. We have not independently verified the accuracy or completeness of the information contained in these industry publications and other publicly available information. Conference Call Information We will hold a conference call on Thursday, September 4, 2025 at 5:00 PM ET to review our fiscal 2026 second quarter financial results. To participate in our live conference call and webcast, please dial (800) 715-9871 (or (646) 307-1963 for international participants) using conference code number 7404611 or visit the “Events & Presentations” section of our Investor Relations website at ir.phreesia.com. A replay of the call will be available via webcast for on-demand listening shortly after the completion of the call, at the same web link, and will remain available for approximately 90 days.