Third Quarter 2025 Earnings Release Supplement
2 Forward Looking Statements & Non-GAAP Measures This presentation contains certain “forward-looking statements” within the meaning of such term in the Private Securities Litigation Reform Act of 1995. We and our representatives may, from time to time, make written or oral statements that are “forward-looking” and provide information other than historical information. These statements involve known and unknown risks, uncertainties and other factors that may cause actual results to be materially different from any results, levels of activity, performance or achievements expressed or implied by any forward-looking statement. These factors include, among other things, the factors listed below. Forward-looking statements, which may be based upon beliefs, expectations and assumptions of our management and on information currently available to management, are generally identifiable by the use of words such as “believe,” “expect,” “anticipate,” “should,” “could,” “would,” “plans,” “goals,” “intend,” “project,” “estimate,” “forecast,” “may” or similar expressions. These forward-looking statements are subject to certain risks and uncertainties that could cause actual results to differ materially from those expressed in, or implied by, these statements. Readers are cautioned not to place undue reliance on any such forward-looking statements, which speak only as of the date made. Additionally, we undertake no obligation to update any statement in light of new information or future events, except as required under federal securities law. Our ability to predict results or the actual effect of future plans or strategies is inherently uncertain. Factors that could have an impact on our ability to achieve operating results, growth plan goals and future prospects include, but are not limited to, the following: (1) the effects of changes in interest rates, including on our net income and the value of our securities portfolio; (2) fluctuations in the value of our investment securities; (3) effects on the U.S. economy resulting from the threat or implementation of, or changes to existing, policies and executive orders, including concerning tariffs, immigration, regulatory or other governmental agencies, DEI and ESG initiative trends, consumer protection policies, foreign policy and tax regulations; (4) volatility of rate-sensitive deposits; (5) asset/liability matching risks and liquidity risks; (6) the ability to successfully manage liquidity risk, which may increase dependence on non-core funding sources such as brokered deposits, and may negatively impact the Company’s cost of funds; (7) the concentration of large deposits from certain clients, including those who have balances above current Federal Deposit Insurance Corporation insurance limits; (8) credit quality deterioration, pronounced and sustained reduction in real estate market values, or other uncertainties, including the impact of inflationary pressures and future monetary policies of the Federal Reserve in response thereto on economic conditions and our business, resulting in an increase in the allowance for credit losses, an increase in the credit loss expense, and a reduction in net earnings; (9) the sufficiency of the allowance for credit losses to absorb the amount of expected losses inherent in our existing loan portfolio; (10) the failure of assumptions underlying the establishment of allowances for credit losses and estimation of values of collateral and various financial assets and liabilities; (11) credit risks and risks from concentrations (by type of borrower, collateral, geographic area and by industry) within our loan portfolio; (12) changes in the economic environment, competition, or other factors that may affect our ability to acquire loans or influence the anticipated growth rate of loans and deposits and the quality of the loan portfolio and loan and deposit pricing; (13) governmental monetary and fiscal policies; (14) new or revised general economic, political, or industry conditions, nationally, internationally or in the communities in which we conduct business, including the risk of a recession; (15) the imposition of domestic or foreign tariffs or other governmental policies impacting the global supply chain and the value of the agricultural or other products of our borrowers; (16) war or terrorist activities, including ongoing conflicts in the Middle East and the Russian invasion of Ukraine, widespread disease or pandemic, or other adverse external events, which may cause deterioration in the economy or cause instability in credit markets; (17) legislative and regulatory changes, including changes in banking, securities, trade, and tax laws and regulations and their application by our regulators, and including changes in interpretation or prioritization of such laws and regulations; (18) changes in accounting policies and practices, as may be adopted by state and federal regulatory agencies and the Financial Accounting Standards Board; (19) the effects of competition from other commercial banks, thrifts, mortgage banking firms, consumer finance companies, credit unions, securities brokerage firms, insurance companies, money market and other mutual funds, financial technology companies, and other financial institutions operating in our markets or elsewhere or providing similar services; (20) changes in the business and economic conditions generally and in the financial services industry, and the effects of recent developments and events in the financial services industry, including the large-scale deposit withdrawals over a short period of time that resulted in prior bank failures; (21) the occurrence of fraudulent activity, breaches, or failures of our or our third party vendors' information security controls or cyber-security related incidents, including as a result of sophisticated attacks using artificial intelligence and similar tools or as a result of insider fraud; (22) the ability to attract and retain key executives and employees experienced in banking and financial services; (23) our ability to adapt successfully to technological changes implemented by us and other parties in the financial services industry, including third-party vendors, which may be more difficult to implement or more expensive than anticipated or which may have unforeseen consequence to us and our customers, including the development and implementation of tools incorporating artificial intelligence; (24) operational risks, including data processing system failures and fraud; (25) the costs, effects and outcomes of existing or future litigation or other legal proceedings and regulatory actions; (26) the risks of mergers or branch sales, including, without limitation, the related time and costs of implementing such transactions, integrating operations as part of these transactions and possible failures to achieve expected gains, revenue growth and/or expense savings from such transactions; (27) the economic impacts on the Company and its customers of climate change, natural disasters and exceptional weather occurrences, such as: tornadoes, floods and blizzards; and (28) other risk factors detailed from time to time in Securities and Exchange Commission filings made by the Company. Non-GAAP Measures This presentation contains non-GAAP measures for tangible common equity, tangible book value per share, tangible common equity ratio, loan yield, tax equivalent, efficiency ratio, pre-tax, pre-provision earnings, return on average tangible equity, net interest margin, tax equivalent, adjusted earnings, and adjusted earnings per share. Management believes these measures provide investors with useful information regarding the Company’s profitability, financial condition and capital adequacy, consistent with how management evaluates the Company’s financial performance. A reconciliation of each non-GAAP measure to the most comparable GAAP measure is included, as necessary, in the Non-GAAP Financial Measures section.
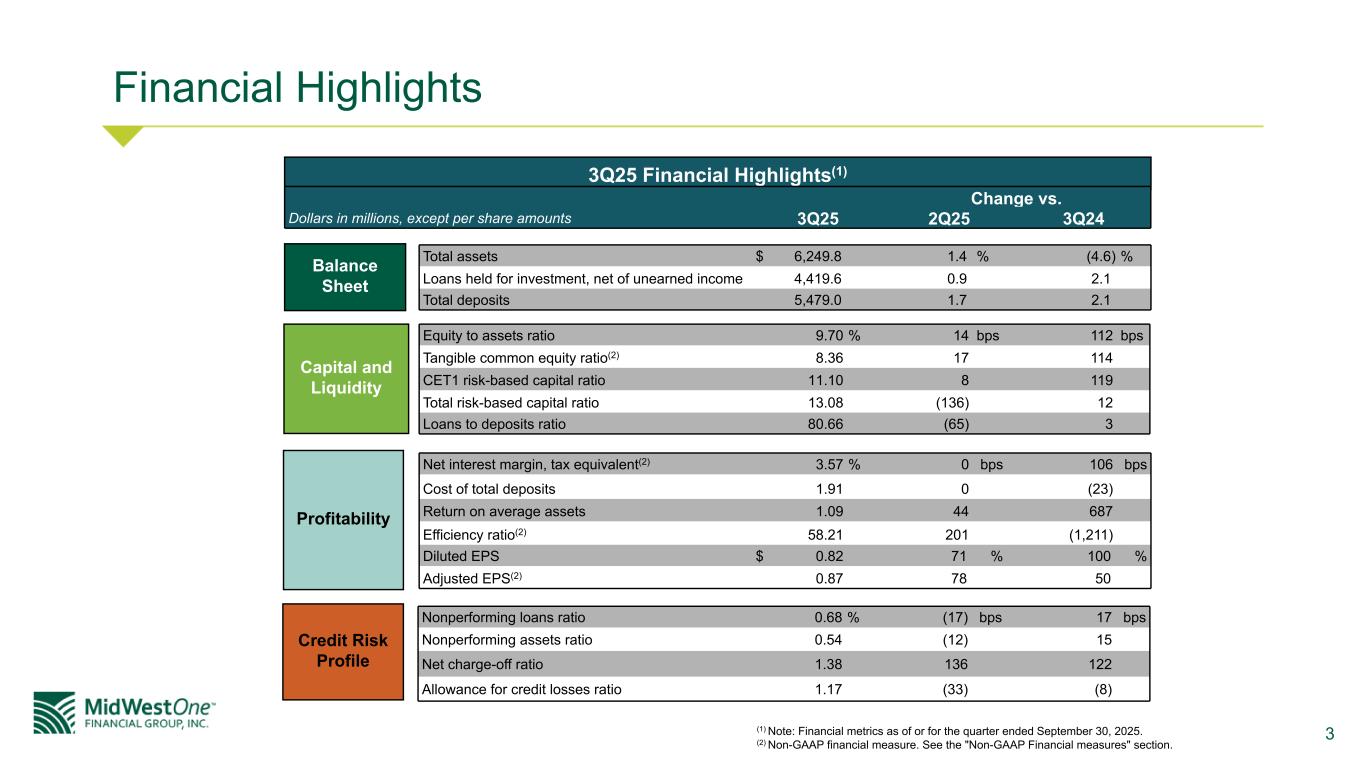
3 Financial Highlights Total assets $ 6,249.8 1.4 % (4.6) % Loans held for investment, net of unearned income 4,419.6 0.9 2.1 Total deposits 5,479.0 1.7 2.1 Balance Sheet Equity to assets ratio 9.70 % 14 bps 112 bps Tangible common equity ratio(2) 8.36 17 114 CET1 risk-based capital ratio 11.10 8 119 Total risk-based capital ratio 13.08 (136) 12 Loans to deposits ratio 80.66 (65) 3 Capital and Liquidity Net interest margin, tax equivalent(2) 3.57 % 0 bps 106 bps Cost of total deposits 1.91 0 (23) Return on average assets 1.09 44 687 Efficiency ratio(2) 58.21 201 (1,211) Diluted EPS $ 0.82 71 % 100 % Adjusted EPS(2) 0.87 78 50 Profitability Nonperforming loans ratio 0.68 % (17) bps 17 bps Nonperforming assets ratio 0.54 (12) 15 Net charge-off ratio 1.38 136 122 Allowance for credit losses ratio 1.17 (33) (8) Credit Risk Profile 3Q25 Financial Highlights(1) (1) Note: Financial metrics as of or for the quarter ended September 30, 2025. (2) Non-GAAP financial measure. See the "Non-GAAP Financial measures" section. Change vs. Dollars in millions, except per share amounts 3Q25 2Q25 3Q24
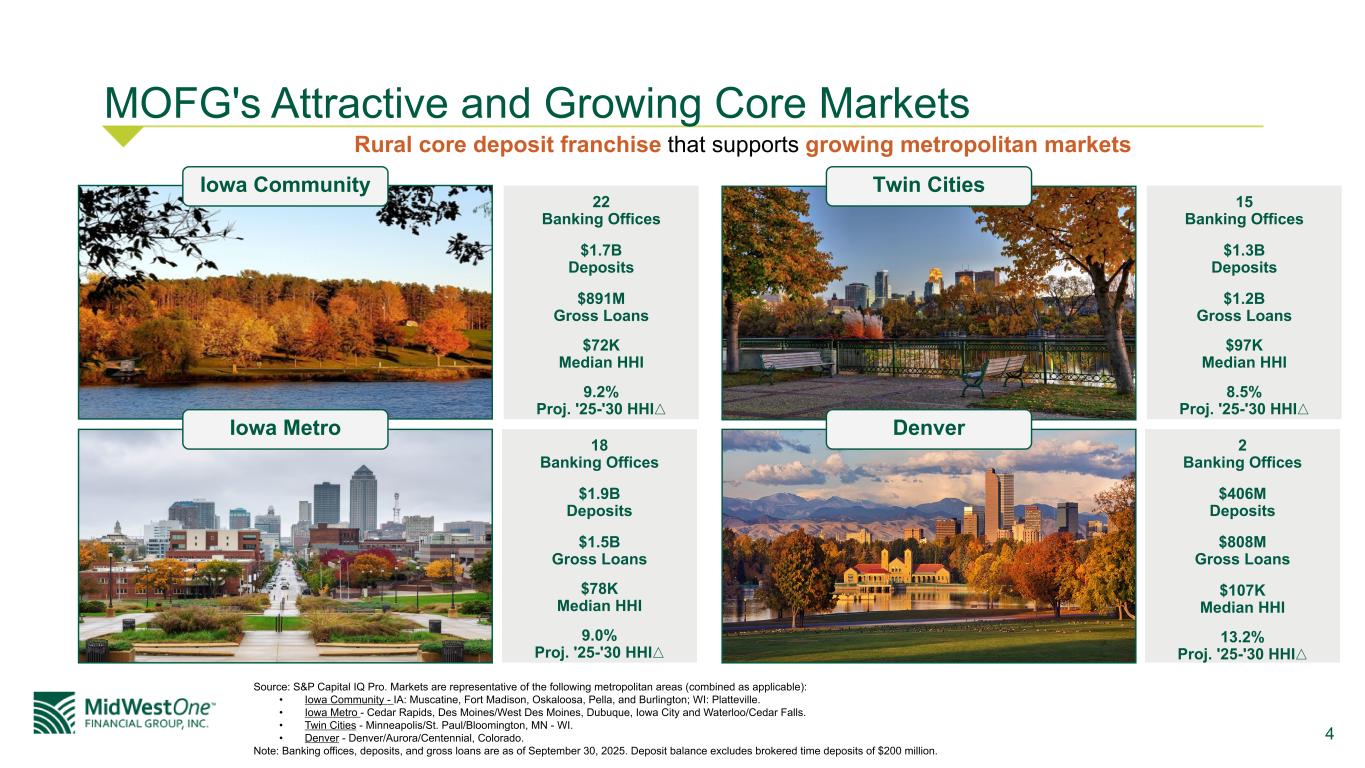
4 MOFG's Attractive and Growing Core Markets Rural core deposit franchise that supports growing metropolitan markets 22 Banking Offices $1.7B Deposits $891M Gross Loans $72K Median HHI 9.2% Proj. '25-'30 HHI△ 18 Banking Offices $1.9B Deposits $1.5B Gross Loans $78K Median HHI 9.0% Proj. '25-'30 HHI△ 15 Banking Offices $1.3B Deposits $1.2B Gross Loans $97K Median HHI 8.5% Proj. '25-'30 HHI△ 2 Banking Offices $406M Deposits $808M Gross Loans $107K Median HHI 13.2% Proj. '25-'30 HHI△ Source: S&P Capital IQ Pro. Markets are representative of the following metropolitan areas (combined as applicable): • Iowa Community - IA: Muscatine, Fort Madison, Oskaloosa, Pella, and Burlington; WI: Platteville. • Iowa Metro - Cedar Rapids, Des Moines/West Des Moines, Dubuque, Iowa City and Waterloo/Cedar Falls. • Twin Cities - Minneapolis/St. Paul/Bloomington, MN - WI. • Denver - Denver/Aurora/Centennial, Colorado. Note: Banking offices, deposits, and gross loans are as of September 30, 2025. Deposit balance excludes brokered time deposits of $200 million. Iowa Community Twin Cities Iowa Metro Denver
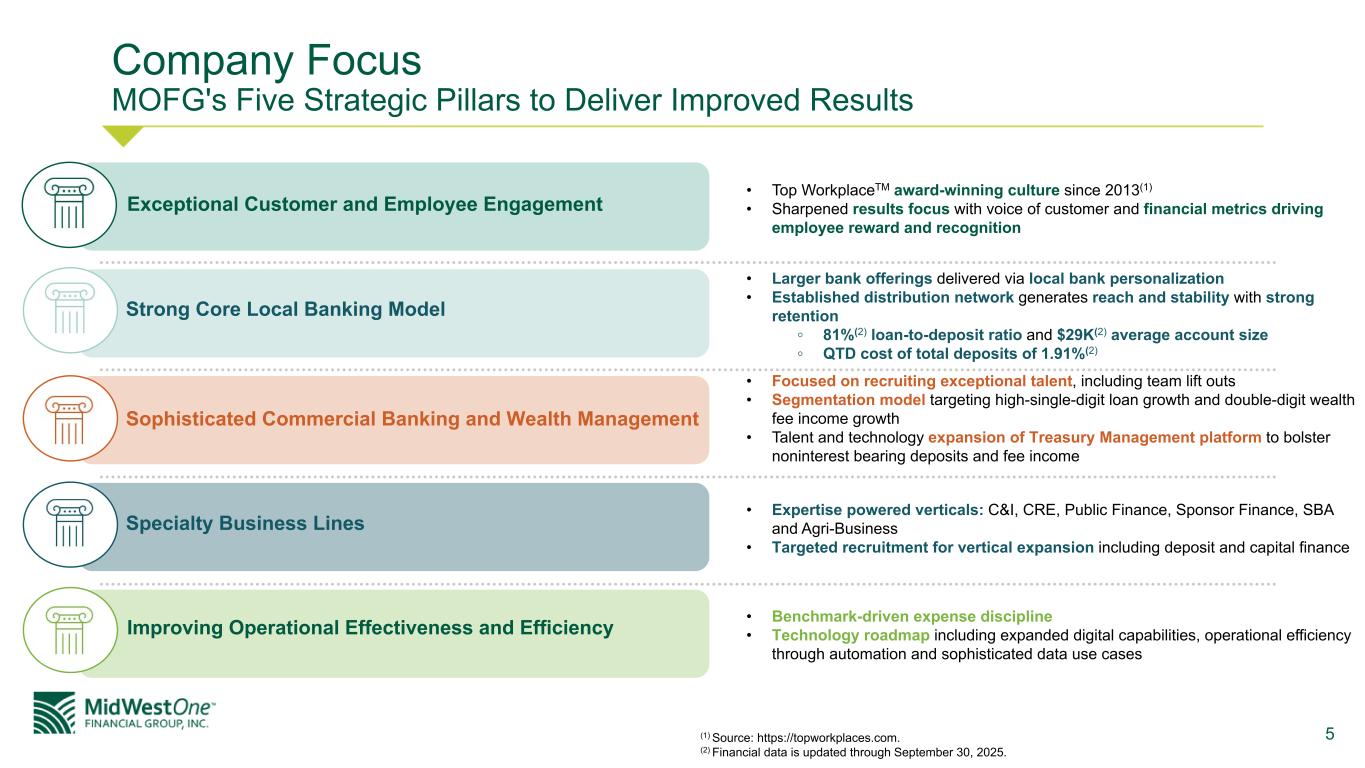
5 Company Focus MOFG's Five Strategic Pillars to Deliver Improved Results Exceptional Customer and Employee Engagement Strong Core Local Banking Model Sophisticated Commercial Banking and Wealth Management Specialty Business Lines Improving Operational Effectiveness and Efficiency • Top WorkplaceTM award-winning culture since 2013(1) • Sharpened results focus with voice of customer and financial metrics driving employee reward and recognition • Larger bank offerings delivered via local bank personalization • Established distribution network generates reach and stability with strong retention ◦ 81%(2) loan-to-deposit ratio and $29K(2) average account size ◦ QTD cost of total deposits of 1.91%(2) • Focused on recruiting exceptional talent, including team lift outs • Segmentation model targeting high-single-digit loan growth and double-digit wealth fee income growth • Talent and technology expansion of Treasury Management platform to bolster noninterest bearing deposits and fee income • Expertise powered verticals: C&I, CRE, Public Finance, Sponsor Finance, SBA and Agri-Business • Targeted recruitment for vertical expansion including deposit and capital finance • Benchmark-driven expense discipline • Technology roadmap including expanded digital capabilities, operational efficiency through automation and sophisticated data use cases (1) Source: https://topworkplaces.com. (2) Financial data is updated through September 30, 2025.
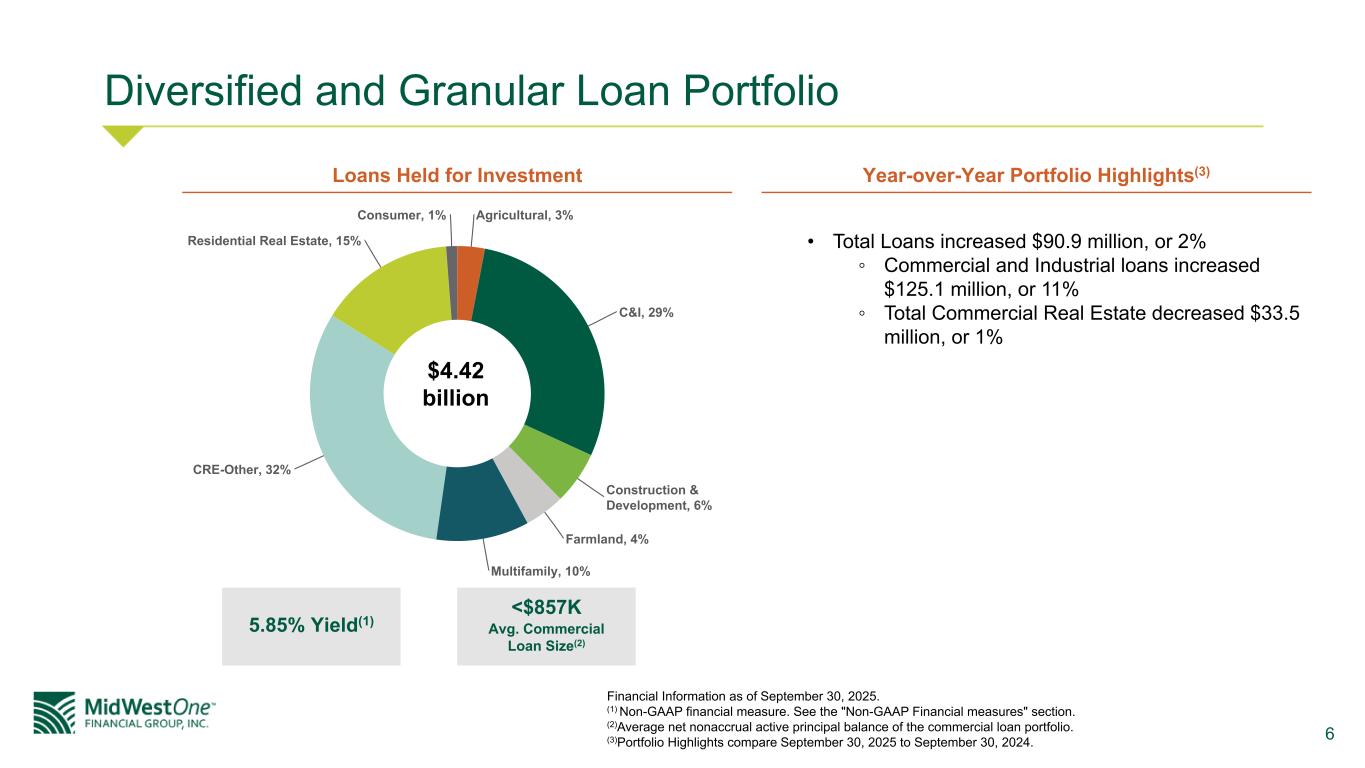
6 Diversified and Granular Loan Portfolio Loans Held for Investment Agricultural, 3% C&I, 29% Construction & Development, 6% Farmland, 4% Multifamily, 10% CRE-Other, 32% Residential Real Estate, 15% Consumer, 1% $4.42 billion 5.85% Yield(1) <$857K Avg. Commercial Loan Size(2) Financial Information as of September 30, 2025. (1) Non-GAAP financial measure. See the "Non-GAAP Financial measures" section. (2)Average net nonaccrual active principal balance of the commercial loan portfolio. (3)Portfolio Highlights compare September 30, 2025 to September 30, 2024. • Total Loans increased $90.9 million, or 2% ◦ Commercial and Industrial loans increased $125.1 million, or 11% ◦ Total Commercial Real Estate decreased $33.5 million, or 1% Year-over-Year Portfolio Highlights(3)
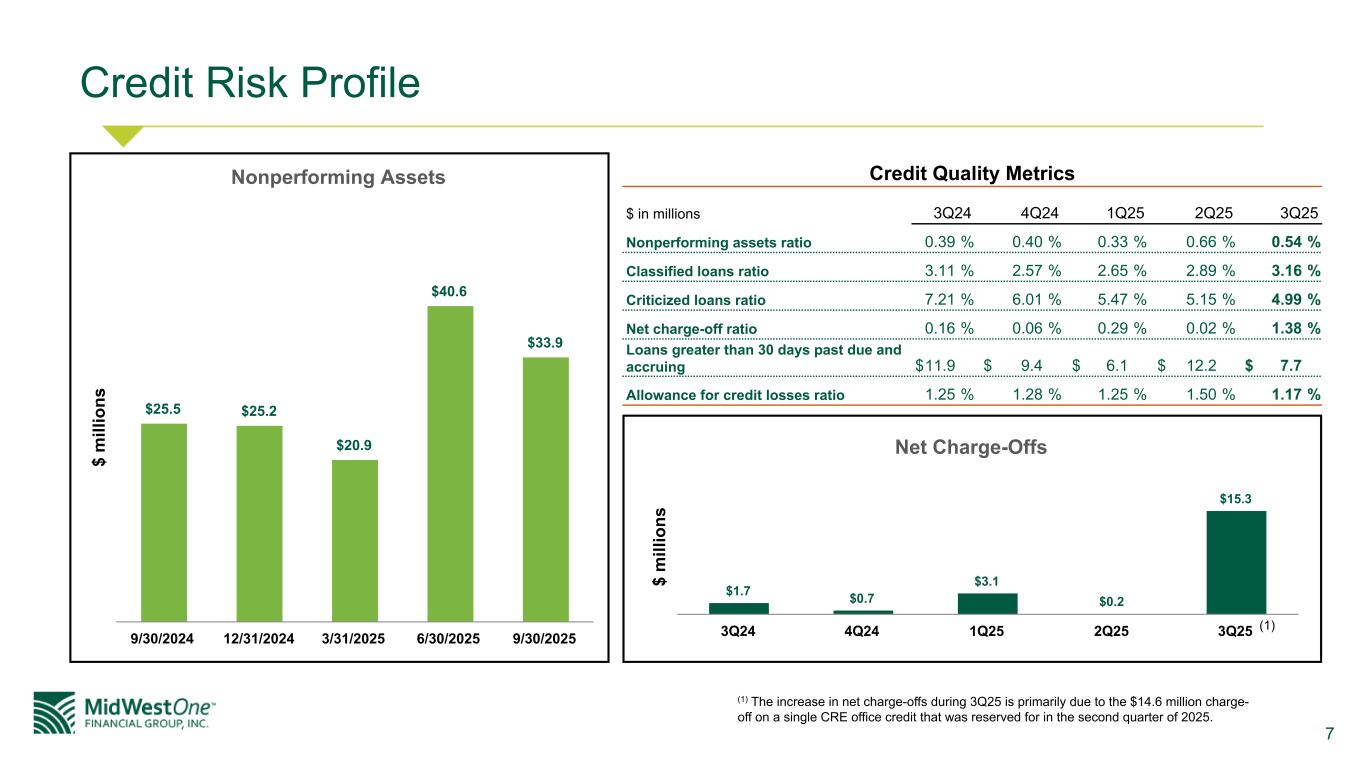
7 Credit Risk Profile $ m ill io ns Nonperforming Assets $25.5 $25.2 $20.9 $40.6 $33.9 9/30/2024 12/31/2024 3/31/2025 6/30/2025 9/30/2025 $ m ill io ns Net Charge-Offs $1.7 $0.7 $3.1 $0.2 $15.3 3Q24 4Q24 1Q25 2Q25 3Q25 Credit Quality Metrics $ in millions 3Q24 4Q24 1Q25 2Q25 3Q25 Nonperforming assets ratio 0.39 % 0.40 % 0.33 % 0.66 % 0.54 % Classified loans ratio 3.11 % 2.57 % 2.65 % 2.89 % 3.16 % Criticized loans ratio 7.21 % 6.01 % 5.47 % 5.15 % 4.99 % Net charge-off ratio 0.16 % 0.06 % 0.29 % 0.02 % 1.38 % Loans greater than 30 days past due and accruing $ 11.9 $ 9.4 $ 6.1 $ 12.2 $ 7.7 Allowance for credit losses ratio 1.25 % 1.28 % 1.25 % 1.50 % 1.17 % (1) (1) The increase in net charge-offs during 3Q25 is primarily due to the $14.6 million charge- off on a single CRE office credit that was reserved for in the second quarter of 2025.
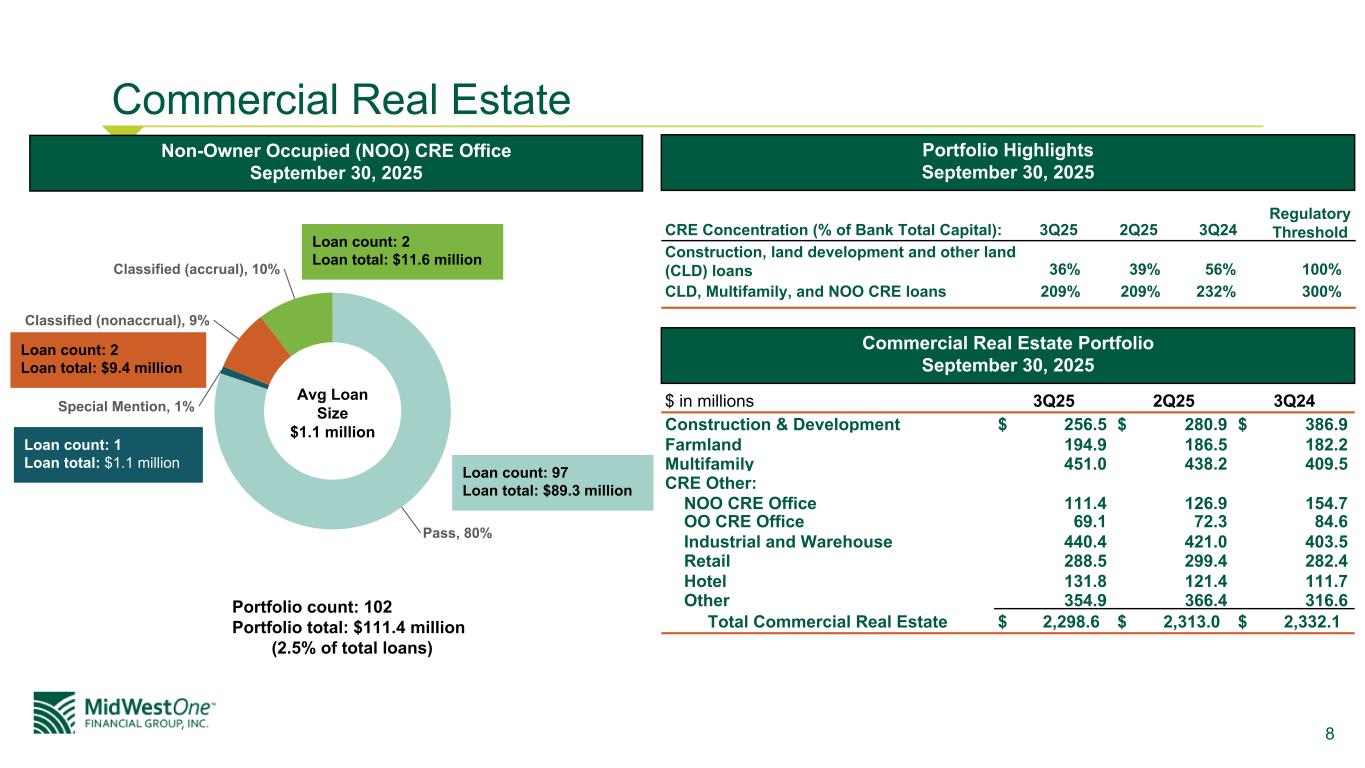
8 Commercial Real Estate Non-Owner Occupied (NOO) CRE Office September 30, 2025 $ in millions 3Q25 2Q25 3Q24 Construction & Development $ 256.5 $ 280.9 $ 386.9 Farmland 194.9 186.5 182.2 Multifamily 451.0 438.2 409.5 CRE Other: NOO CRE Office 111.4 126.9 154.7 OO CRE Office 69.1 72.3 84.6 Industrial and Warehouse 440.4 421.0 403.5 Retail 288.5 299.4 282.4 Hotel 131.8 121.4 111.7 Other 354.9 366.4 316.6 Total Commercial Real Estate $ 2,298.6 $ 2,313.0 $ 2,332.1 Commercial Real Estate Portfolio September 30, 2025 Portfolio Highlights September 30, 2025 CRE Concentration (% of Bank Total Capital): 3Q25 2Q25 3Q24 Regulatory Threshold Construction, land development and other land (CLD) loans 36 % 39 % 56 % 100 % CLD, Multifamily, and NOO CRE loans 209 % 209 % 232 % 300 % Pass, 80% Special Mention, 1% Classified (nonaccrual), 9% Classified (accrual), 10% Loan count: 2 Loan total: $9.4 million Loan count: 97 Loan total: $89.3 million Loan count: 1 Loan total: $1.1 million Avg Loan Size $1.1 million Portfolio count: 102 Portfolio total: $111.4 million (2.5% of total loans) Loan count: 2 Loan total: $11.6 million
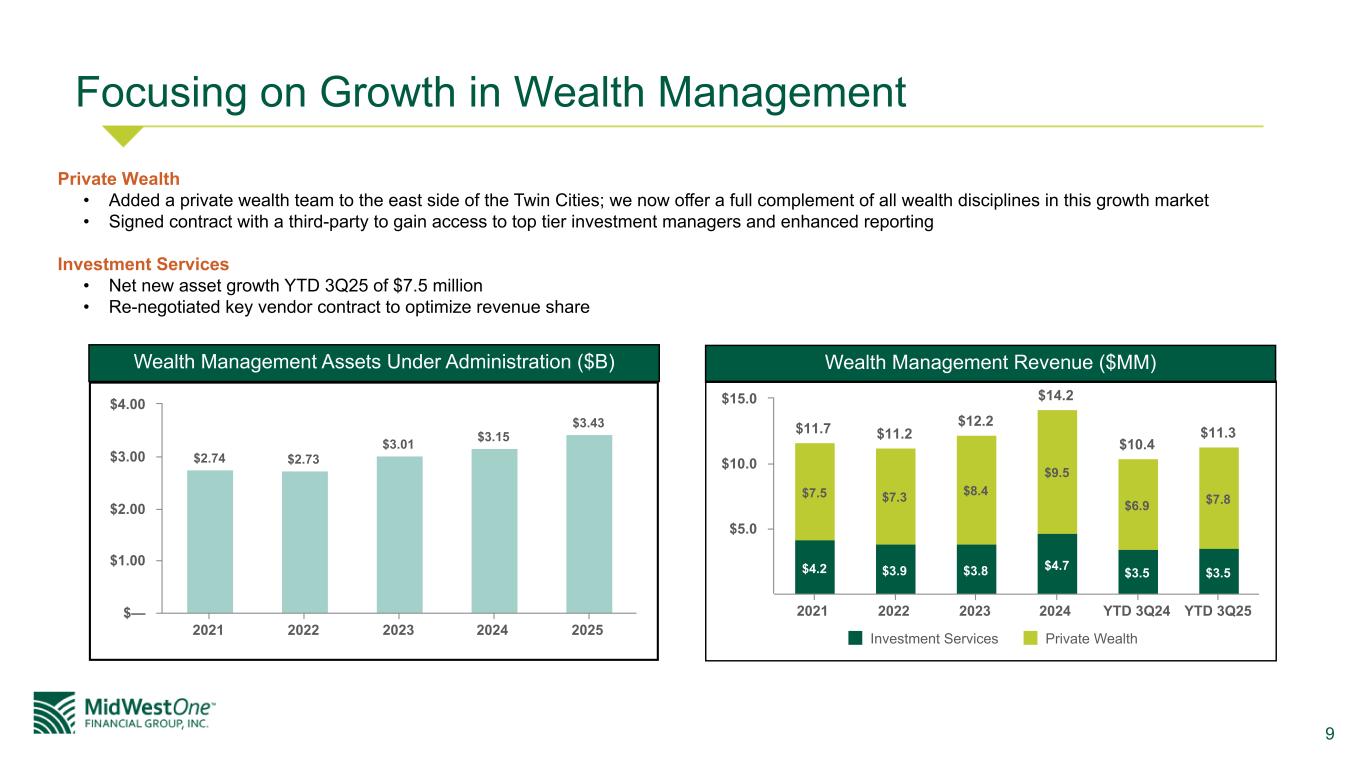
9 Focusing on Growth in Wealth Management $2.74 $2.73 $3.01 $3.15 $3.43 2021 2022 2023 2024 2025 $— $1.00 $2.00 $3.00 $4.00 Wealth Management Revenue ($MM)Wealth Management Assets Under Administration ($B) Private Wealth • Added a private wealth team to the east side of the Twin Cities; we now offer a full complement of all wealth disciplines in this growth market • Signed contract with a third-party to gain access to top tier investment managers and enhanced reporting Investment Services • Net new asset growth YTD 3Q25 of $7.5 million • Re-negotiated key vendor contract to optimize revenue share $11.7 $11.2 $12.2 $14.2 $10.4 $11.3 $4.2 $3.9 $3.8 $4.7 $3.5 $3.5 $7.5 $7.3 $8.4 $9.5 $6.9 $7.8 Investment Services Private Wealth 2021 2022 2023 2024 YTD 3Q24 YTD 3Q25 $5.0 $10.0 $15.0
10 Financial Performance
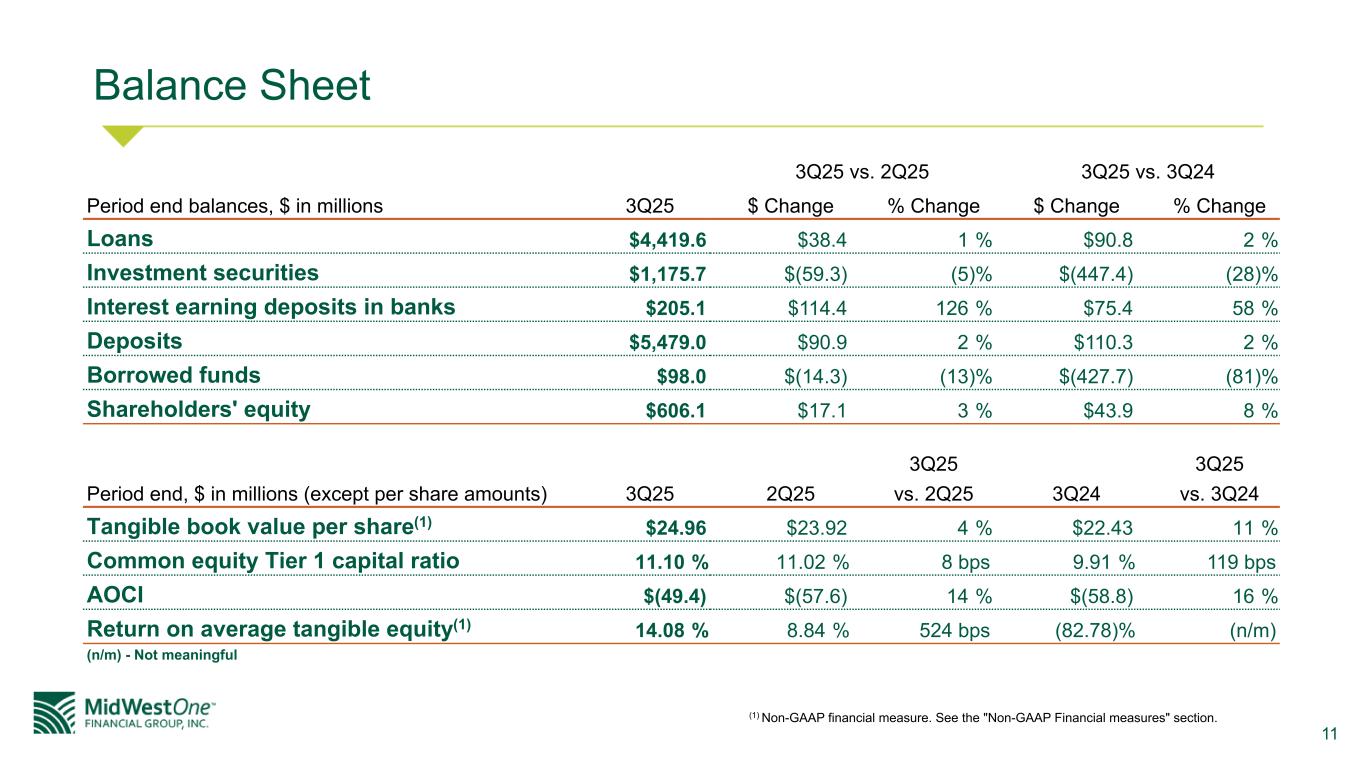
11 Balance Sheet 3Q25 vs. 2Q25 3Q25 vs. 3Q24 Period end balances, $ in millions 3Q25 $ Change % Change $ Change % Change Loans $4,419.6 $38.4 1 % $90.8 2 % Investment securities $1,175.7 $(59.3) (5) % $(447.4) (28) % Interest earning deposits in banks $205.1 $114.4 126 % $75.4 58 % Deposits $5,479.0 $90.9 2 % $110.3 2 % Borrowed funds $98.0 $(14.3) (13) % $(427.7) (81) % Shareholders' equity $606.1 $17.1 3 % $43.9 8 % 3Q25 3Q25 Period end, $ in millions (except per share amounts) 3Q25 2Q25 vs. 2Q25 3Q24 vs. 3Q24 Tangible book value per share(1) $24.96 $23.92 4 % $22.43 11 % Common equity Tier 1 capital ratio 11.10 % 11.02 % 8 bps 9.91 % 119 bps AOCI $(49.4) $(57.6) 14 % $(58.8) 16 % Return on average tangible equity(1) 14.08 % 8.84 % 524 bps (82.78) % (n/m) (n/m) - Not meaningful (1) Non-GAAP financial measure. See the "Non-GAAP Financial measures" section.
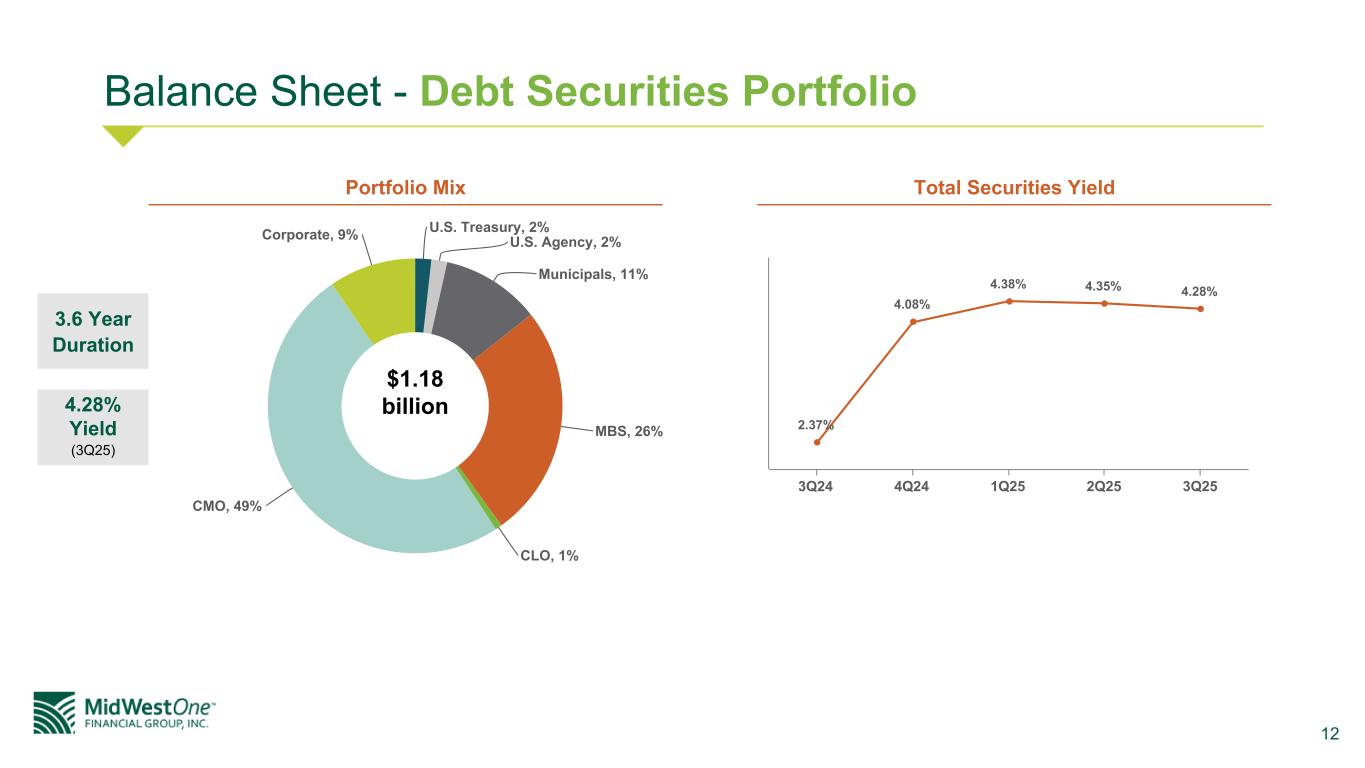
12 Balance Sheet - Debt Securities Portfolio Total Securities Yield 3.6 Year Duration 4.28% Yield (3Q25) U.S. Treasury, 2% U.S. Agency, 2% Municipals, 11% MBS, 26% CLO, 1% CMO, 49% Corporate, 9% $1.18 billion 2.37% 4.08% 4.38% 4.35% 4.28% 3Q24 4Q24 1Q25 2Q25 3Q25 Portfolio Mix
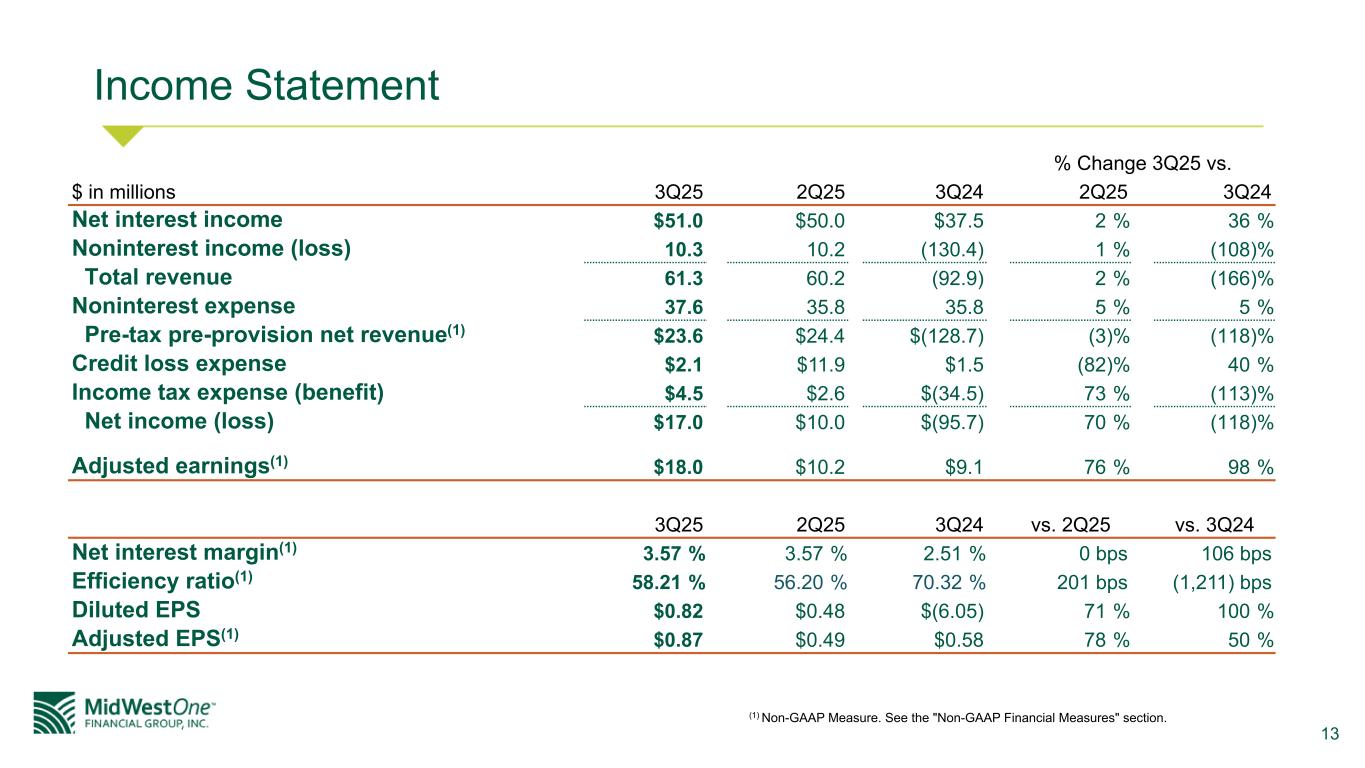
13 Income Statement % Change 3Q25 vs. $ in millions 3Q25 2Q25 3Q24 2Q25 3Q24 Net interest income $51.0 $50.0 $37.5 2 % 36 % Noninterest income (loss) 10.3 10.2 (130.4) 1 % (108) % Total revenue 61.3 60.2 (92.9) 2 % (166) % Noninterest expense 37.6 35.8 35.8 5 % 5 % Pre-tax pre-provision net revenue(1) $23.6 $24.4 $(128.7) (3) % (118) % Credit loss expense $2.1 $11.9 $1.5 (82) % 40 % Income tax expense (benefit) $4.5 $2.6 $(34.5) 73 % (113) % Net income (loss) $17.0 $10.0 $(95.7) 70 % (118) % Adjusted earnings(1) $18.0 $10.2 $9.1 76 % 98 % 3Q25 2Q25 3Q24 vs. 2Q25 vs. 3Q24 Net interest margin(1) 3.57 % 3.57 % 2.51 % 0 bps 106 bps Efficiency ratio(1) 58.21 % 56.20 % 70.32 % 201 bps (1,211) bps Diluted EPS $0.82 $0.48 $(6.05) 71 % 100 % Adjusted EPS(1) $0.87 $0.49 $0.58 78 % 50 % (1) Non-GAAP Measure. See the "Non-GAAP Financial Measures" section.
14 Non-GAAP Financial Measures
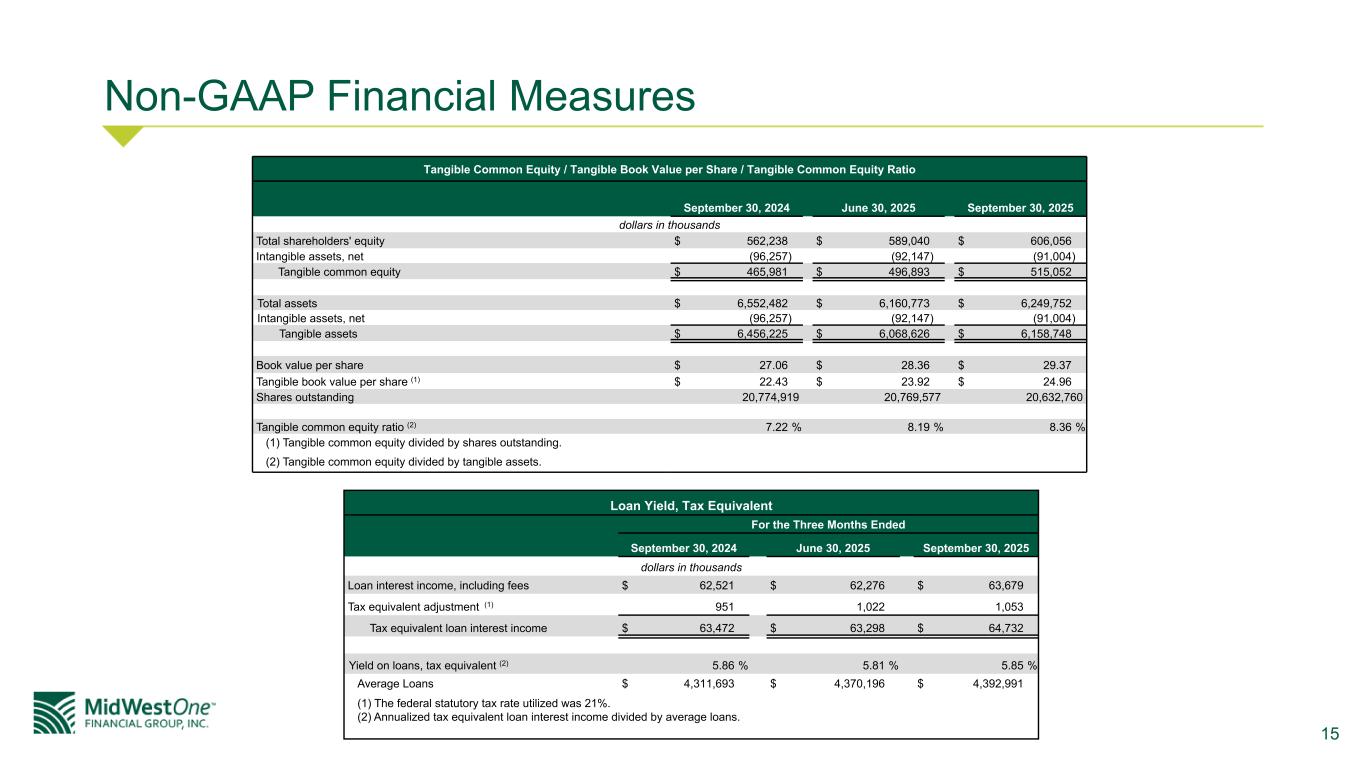
15 Non-GAAP Financial Measures Tangible Common Equity / Tangible Book Value per Share / Tangible Common Equity Ratio September 30, 2024 June 30, 2025 September 30, 2025 dollars in thousands Total shareholders' equity $ 562,238 $ 589,040 $ 606,056 Intangible assets, net (96,257) (92,147) (91,004) Tangible common equity $ 465,981 $ 496,893 $ 515,052 Total assets $ 6,552,482 $ 6,160,773 $ 6,249,752 Intangible assets, net (96,257) (92,147) (91,004) Tangible assets $ 6,456,225 $ 6,068,626 $ 6,158,748 Book value per share $ 27.06 $ 28.36 $ 29.37 Tangible book value per share (1) $ 22.43 $ 23.92 $ 24.96 Shares outstanding 20,774,919 20,769,577 20,632,760 Tangible common equity ratio (2) 7.22 % 8.19 % 8.36 % (1) Tangible common equity divided by shares outstanding. (2) Tangible common equity divided by tangible assets. Loan Yield, Tax Equivalent For the Three Months Ended September 30, 2024 June 30, 2025 September 30, 2025 dollars in thousands Loan interest income, including fees $ 62,521 $ 62,276 $ 63,679 Tax equivalent adjustment (1) 951 1,022 1,053 Tax equivalent loan interest income $ 63,472 $ 63,298 $ 64,732 Yield on loans, tax equivalent (2) 5.86 % 5.81 % 5.85 % Average Loans $ 4,311,693 $ 4,370,196 $ 4,392,991 (1) The federal statutory tax rate utilized was 21%. (2) Annualized tax equivalent loan interest income divided by average loans.
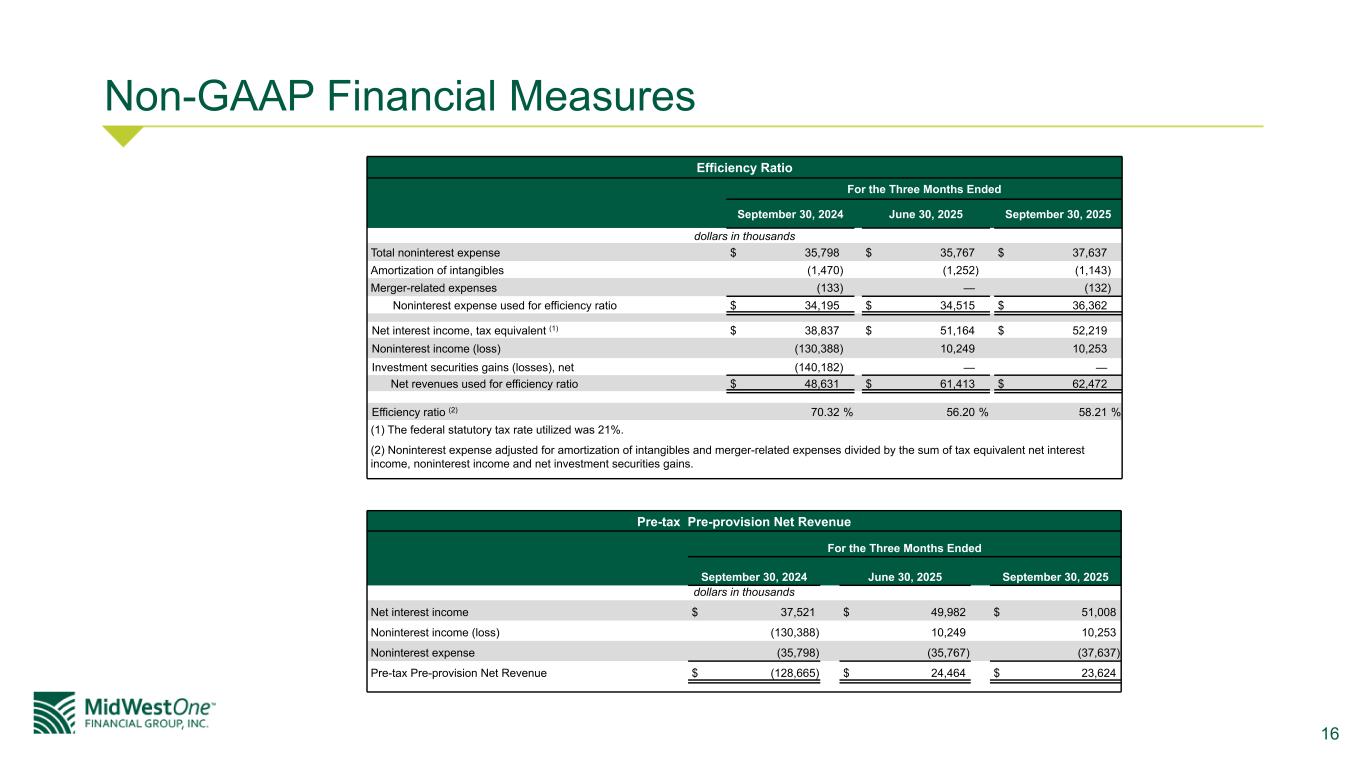
16 Non-GAAP Financial Measures Efficiency Ratio For the Three Months Ended September 30, 2024 June 30, 2025 September 30, 2025 dollars in thousands Total noninterest expense $ 35,798 $ 35,767 $ 37,637 Amortization of intangibles (1,470) (1,252) (1,143) Merger-related expenses (133) — (132) Noninterest expense used for efficiency ratio $ 34,195 $ 34,515 $ 36,362 Net interest income, tax equivalent (1) $ 38,837 $ 51,164 $ 52,219 Noninterest income (loss) (130,388) 10,249 10,253 Investment securities gains (losses), net (140,182) — — Net revenues used for efficiency ratio $ 48,631 $ 61,413 $ 62,472 Efficiency ratio (2) 70.32 % 56.20 % 58.21 % (1) The federal statutory tax rate utilized was 21%. (2) Noninterest expense adjusted for amortization of intangibles and merger-related expenses divided by the sum of tax equivalent net interest income, noninterest income and net investment securities gains. Pre-tax Pre-provision Net Revenue For the Three Months Ended September 30, 2024 June 30, 2025 September 30, 2025 dollars in thousands Net interest income $ 37,521 $ 49,982 $ 51,008 Noninterest income (loss) (130,388) 10,249 10,253 Noninterest expense (35,798) (35,767) (37,637) Pre-tax Pre-provision Net Revenue $ (128,665) $ 24,464 $ 23,624
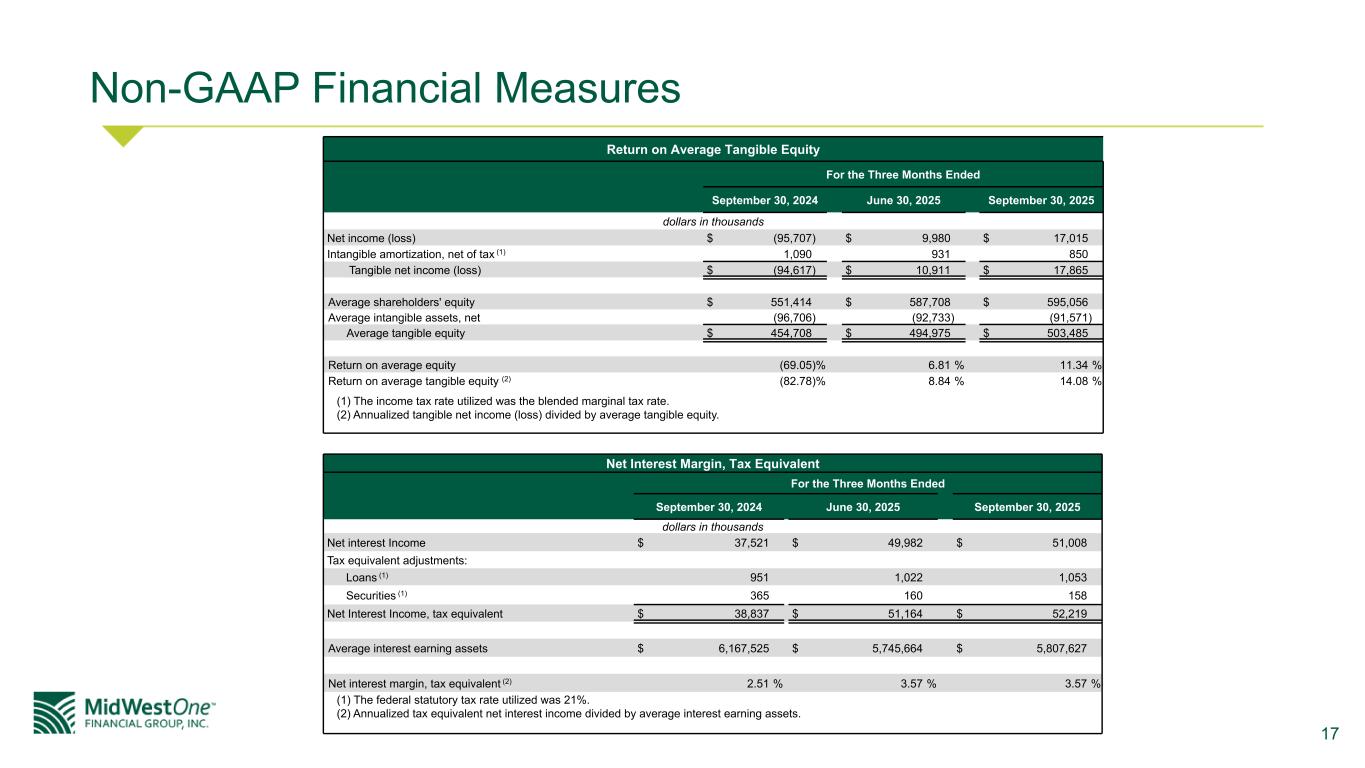
17 Non-GAAP Financial Measures Return on Average Tangible Equity For the Three Months Ended September 30, 2024 June 30, 2025 September 30, 2025 dollars in thousands Net income (loss) $ (95,707) $ 9,980 $ 17,015 Intangible amortization, net of tax (1) 1,090 931 850 Tangible net income (loss) $ (94,617) $ 10,911 $ 17,865 Average shareholders' equity $ 551,414 $ 587,708 $ 595,056 Average intangible assets, net (96,706) (92,733) (91,571) Average tangible equity $ 454,708 $ 494,975 $ 503,485 Return on average equity (69.05) % 6.81 % 11.34 % Return on average tangible equity (2) (82.78) % 8.84 % 14.08 % (1) The income tax rate utilized was the blended marginal tax rate. (2) Annualized tangible net income (loss) divided by average tangible equity. Net Interest Margin, Tax Equivalent For the Three Months Ended September 30, 2024 June 30, 2025 September 30, 2025 dollars in thousands Net interest Income $ 37,521 $ 49,982 $ 51,008 Tax equivalent adjustments: Loans (1) 951 1,022 1,053 Securities (1) 365 160 158 Net Interest Income, tax equivalent $ 38,837 $ 51,164 $ 52,219 Average interest earning assets $ 6,167,525 $ 5,745,664 $ 5,807,627 Net interest margin, tax equivalent (2) 2.51 % 3.57 % 3.57 % (1) The federal statutory tax rate utilized was 21%. (2) Annualized tax equivalent net interest income divided by average interest earning assets.
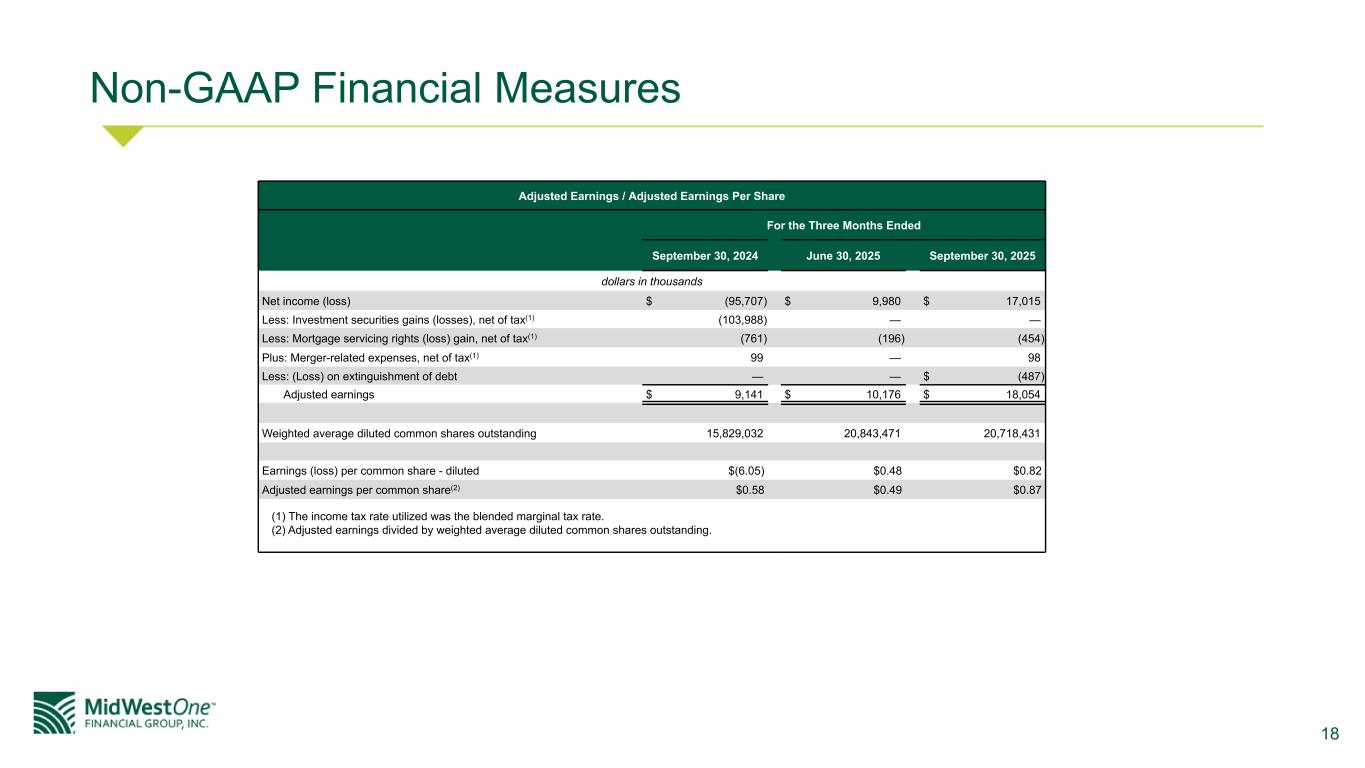
18 Non-GAAP Financial Measures Adjusted Earnings / Adjusted Earnings Per Share For the Three Months Ended September 30, 2024 June 30, 2025 September 30, 2025 dollars in thousands Net income (loss) $ (95,707) $ 9,980 $ 17,015 Less: Investment securities gains (losses), net of tax(1) (103,988) — — Less: Mortgage servicing rights (loss) gain, net of tax(1) (761) (196) (454) Plus: Merger-related expenses, net of tax(1) 99 — 98 Less: (Loss) on extinguishment of debt — — $ (487) Adjusted earnings $ 9,141 $ 10,176 $ 18,054 Weighted average diluted common shares outstanding 15,829,032 20,843,471 20,718,431 Earnings (loss) per common share - diluted $(6.05) $0.48 $0.82 Adjusted earnings per common share(2) $0.58 $0.49 $0.87 (1) The income tax rate utilized was the blended marginal tax rate. (2) Adjusted earnings divided by weighted average diluted common shares outstanding.