CREATING THE SOUTHWEST’S PREMIER BANKING FRANCHISE Unlocking Value via Strategic M&A October 27, 2025
2 Cautionary Note Regarding Forward - Looking Statements Statements included in this communication which are not historical in nature are intended to be, and hereby are identified as , “ forward - looking statements” within the meaning, and subject to the protections of Section 27A of the Securities Act of 1933, as amended, and Section 21E of the Secu rit ies Exchange Act of 1934, as amended. All statements other than statements of historical fact are forward - looking statements. Examples of forward - looking statements inclu de, but are not limited to, statements regarding the outlook, benefits and expectations of FirstSun and First Foundation with respect to the proposed merger, includ ing future financial and operating results (including the anticipated impact of the proposed merger on the combined company’s respective earnings and tangible book valu e), and the expected timing of the closing of the merger. These statements reflect management’s current expectations and are not guarantees of future performanc e. Words such as “may,” “will,” “believe,” “anticipate,” “expect,” “intend,” “opportunity,” “continue,” “should,” and “could” and variations of such words and similar e xpr essions are intended to identify such forward - looking statements. Forward - looking statements are subject to risks, uncertainties and assumptions that are difficult to predict with regard to timing, extent, likelihood and degree of occurrence, which could cause actual results to differ materially from anticipated results. Such ris ks, uncertainties and assumptions, include, among others, the following: • the failure to obtain necessary regulatory approvals when expected or at all (and the risk that such approvals may result in the imposition of conditions that could adversely affect the combined company or the expected benefits of the proposed transaction); • the failure of First Foundation or FirstSun to obtain the required stockholder approval, or the failure of either party to sa tis fy any of the other closing conditions on a timely basis or at all; • the occurrence of any event, change or other circumstances that could give rise to the right of one or both of the parties to te rminate the merger agreement; • the possibility that the proposed transaction, including the re - positioning strategy, will not be completed as planned, includin g the anticipated benefits of the proposed transaction, including the re - positioning strategy; • changes in global financial markets and economies and general market conditions, such as interest rates, foreign exchange rat es, or stock, commodity, credit or asset valuations or volatility; • diversion of management’s attention from ongoing business operations and opportunities; • potential adverse reactions or changes to business or employee relationships, including those resulting from the announcement or completion of the proposed transaction; • the outcome of any legal proceedings that may be instituted against FirstSun or First Foundation; • the risk that the cost savings and synergies expected from the proposed transaction may not be realized or may take longer th an anticipated to be realized; • the risk that integration of FirstSun’s and First Foundation’s respective businesses may be materially delayed or more costly or difficult than expected, including as a result of unexpected factors or events; • changes to tax legislation and their potential effects on the accounting for the merger; • the possibility of dilution to existing stockholders resulting from the issuance of additional shares in connection with the pro posed transaction; • the possibility that the combined company may be subject to additional regulatory requirements as a result of the merger or e xpa nsion of its business operations; • other factors that may affect future results of FirstSun or First Foundation including changes in asset quality and credit ri sk; the inability to sustain revenue and earnings growth; changes in interest rates and capital markets; inflation; customer borrowing, repayment, investment and deposit pract ice s; the impact, extent and timing of technological changes; capital management activities; and actions of the Federal Reserve Board and legislative and regulatory ac tions and reforms. Further information regarding additional factors that could affect the forward - looking statements can be found in the cautionary language included under the headings “Cautionary Note Regarding Forward - Looking Statements” (in the case of FirstSun), “Forward - Looking Statements” (in the case of F irst Foundation), and “Risk Factors” in FirstSun’s and First Foundation’s Annual Reports on Form 10 - K for the year ended December 31, 2024 (available at https://www.sec.gov/ix?doc=/Archives/edgar/data/0001709442/000170944225000008/fcb - 20241231.htm and https://www.sec.gov/ix?doc=/Archives/edgar/data/0001413837/000155837025003129/ffwm - 20241231x10k.htm, respectively), and other do cuments subsequently filed by FirstSun and First Foundation with the Securities and Exchange Commission (the “SEC”). FirstSun and First Foundation disclaim an y obligation to update or revise any forward - looking statements contained in this communication, which speak only as of the date hereof, whether as a result of new inform ati on, future events or otherwise, except as required by law. Disclaimer & Forward Looking Statements
3 Disclaimer & Forward Looking Statements (cont.) Additional Information About the Merger and Where to Find It This communication is being made in respect of the proposed transaction between FirstSun and First Foundation. In connection wit h the proposed transaction, FirstSun will file a registration statement on Form S - 4 with the SEC to register FirstSun’s shares that will be issued to First Foundation’s s tockholders in connection with the merger. The registration statement will include a joint proxy statement of FirstSun and First Foundation and a prospectus of FirstSun, as we ll as other relevant documents concerning the proposed transaction. When available, the joint proxy statement/prospectus will be sent to stockholders of FirstSun and First Fo undation in connection with the proposed transaction. INVESTORS ARE URGED TO READ THE REGISTRATION STATEMENT AND THE JOINT PROXY STATEMENT/PROSPECTUS REGARDING THE ME RGE R WHEN IT BECOMES AVAILABLE AND ANY OTHER RELEVANT DOCUMENTS FILED WITH THE SEC, AS WELL AS ANY OTHER RELEVANT DOCUMENTS FILED WITH THE SEC IN CON NECTION WITH THE TRANSACTION OR INCORPORATED BY REFERENCE INTO THE REGISTRATION STATEMENT ON FORM S - 4 AND THE JOINT PROXY STATEMENT/PROSPECTUS, B ECAUSE THEY WILL CONTAIN IMPORTANT INFORMATION REGARDING FIRSTSUN, FIRST FOUNDATION, THE TRANSACTION AND RELATED MATTERS. This communication does not constitute an offer to sell or the solicitation of an offer to buy any securities or a solicitati on of any vote or approval, nor shall there be any sale of securities in any jurisdiction in which such offer, solicitation or sale would be unlawful prior to registration or qualif ica tion under the securities laws of such jurisdiction. A free copy of the joint proxy statement/prospectus, when it becomes available, as well as other documents filed with the SEC by FirstSun or First Foundation may be obtained at the SEC’s Internet site at http://www.sec.gov. Investors and security holders may also obtain free copies of the doc uments filed with the SEC by (i) FirstSun on its website at https://ir.firstsuncb.com/overview/default.aspx under the Financials tab and then under the SEC Filings option, an d ( ii) First Foundation on its website at https://investor.ff - inc.com/investor - home/default.aspx under the Financials tab and then under the SEC Filings option. Participants in the Solicitation FirstSun, First Foundation and certain of their directors and executive officers may be deemed participants in the solicitati on of proxies from stockholders of FirstSun or First Foundation in connection with the proposed transaction. Information regarding the directors and executive officers of FirstSu n a nd First Foundation and other persons who may be deemed participants in the solicitation of the stockholders of FirstSun or First Foundation in connection with the pro pos ed transaction will be included in the joint proxy statement/prospectus, which will be filed by FirstSun with the SEC. Information about the directors and officers of Fir stS un and their ownership of FirstSun common stock can be found in FirstSun’s definitive proxy statement in connection with its 2025 annual meeting of stockholders, inclu din g under the headings “Director Experience”, “Biographical Information for Executive Officers”, “Certain Relationships and Related Party Transactions”, “Security Ownersh ip of Certain Beneficial Owners and Management”, “Executive Compensation”, and “Compensation of Directors for Fiscal Year 2024”, as filed with the SEC on March 2 1, 2025 and available at https://www.sec.gov/ix?doc=/Archives/edgar/data/0001709442/000170944225000020/fcb - 20250321.htm, and other documents subsequently filed by FirstSun with the SEC, including on Statements of Change in Ownership on Form 4 filed with the SEC, available at https://www.sec.gov/edgar/browse/?C IK= 1709442&owner=exclude. Information about the directors and officers of First Foundation and their ownership of First Foundation common stock can be fou nd in First Foundation’s definitive proxy statement in connection with its 2025 annual meeting of stockholders, including under the headings “Security Ownership of Cer tai n Beneficial Owners and Management”, “Election of Directors (Proposal No. 1)”, “Advisory Vote on the Compensation of the Company’s Named Executive Officers (Propo sal No. 4)”, “Compensation Committee Report”, and “Certain Relationships and Related Party Transactions” as filed with the SEC on April 17, 2025 and available at https://www.sec.gov/ix?doc=/Archives/edgar/data/0001413837/000110465925036041/tm252563 - 3_def14a.htm, and other documents subsequ ently filed by First Foundation with the SEC, including on Statements of Change in Ownership on Form 4 filed with the SEC, available at https://www.sec.gov/edgar/browse/?CIK=1413837&owner=exclude. Additional information regarding the interests of participants i n t he proxy solicitation and a description of their direct and indirect interests, by security holdings or otherwise, will be included in the joint proxy statement/pros pec tus and other relevant documents regarding the proposed merger filed with the SEC when they become available. You may obtain free copies of these documents through the webs ite maintained by the SEC at https://www.sec.gov.
4 Disclaimer & Forward Looking Statements (cont.) Pro Forma Forward - Looking Data Neither FirstSun's nor First Foundation's independent registered public accounting firms have studied, reviewed or performed any procedures with r espect to the pro forma forward - looking financial data for the purpose of inclusion in this presentation, and, accordingly, neither have expressed an op inion or provided any form of assurance with respect thereto for the purpose of this presentation. These pro forma forward - looking financial data are for illustrative purpos es only and should not be relied on as necessarily being indicative of future results. The assumptions and estimates underlying the pro forma forward - looking financial data are inherently uncertain and are subject to a wide variety of significant business, economic and competitive risks and uncertainties that could cause actual r esu lts to differ materially from those contained in the prospective financial information, including those in the “Cautionary Note Regarding Forward - Looking Statements” disclaim er on slide 2 of this presentation. Pro forma forward - looking financial data is inherently uncertain due to a number of factors outside of FirstSun's and First Foundati on's control. Accordingly, there can be no assurance that the prospective results are indicative of future performance of the combined company after the proposed acquis iti on or that actual results will not differ materially from those presented in the pro forma forward - looking financial data. Inclusion of pro forma financial data in this p resentation should not be regarded as a representation by any person that the results contained in the prospective financial information will be achieved. Non - GAAP Financial Measures This presentation contains certain non - GAAP financial measures. FirstSun and First Foundation use certain non - GAAP financial mea sures to provide meaningful, supplemental information regarding their operational results and to enhance investors' overall understanding of FirstSun's an d F irst Foundation's financial performance. The limitations associated with non - GAAP financial measures include the risk that persons might disagree as to the appropriateness o f items compromising these measures and that different companies might calculate these measures differently. These disclosures should not be considered an alternativ e t o FirstSun's and First Foundation's GAAP results. Market and Competitive Data Unless otherwise indicated, market data and certain forecast data used in this presentation were obtained from internal repor ts, where appropriate, as well as from third - party sources and other publicly available information. Information regarding the markets in which FirstSun and First Foundat ion operate, including their respective market positions and market shares within those markets, is inherently imprecise and subject to significant business, economic, and com petitive uncertainties beyond their control. In addition, assumptions and estimates regarding the future performance of FirstSun, First Foundation, or the banking industr y g enerally are necessarily subject to a high degree of uncertainty and risk due to a variety of factors. Actual results and future performance may differ materially from suc h assumptions and estimates.
5 = Neal E. Arnold Chief Executive Officer F irstSun Capital Bancorp (FSUN) & Sunflower Bank Robert A. Cafera Chief Financial Officer FirstSun Capital Bancorp (FSUN) & Sunflower Bank Thomas C. Shafer Chief Executive Officer First Foundation Inc. (FFWM) & First Foundation Bank Presenters Agenda Transaction Overview & Industrial Logic I . Key Financial Impacts & Model Review VI. Integration & Due Diligence VII. Appendix IX. Migration to a Higher Quality Business Mix & Growth Potential IV. Re - Positioning Plan: Unlocking the Core Franchise II. SoCal: A Highly Attractive Market Opportunity III. Accelerating Stockholder Value Creation V. Conclusion VIII.
6 = I. Transaction Overview & Industrial Logic
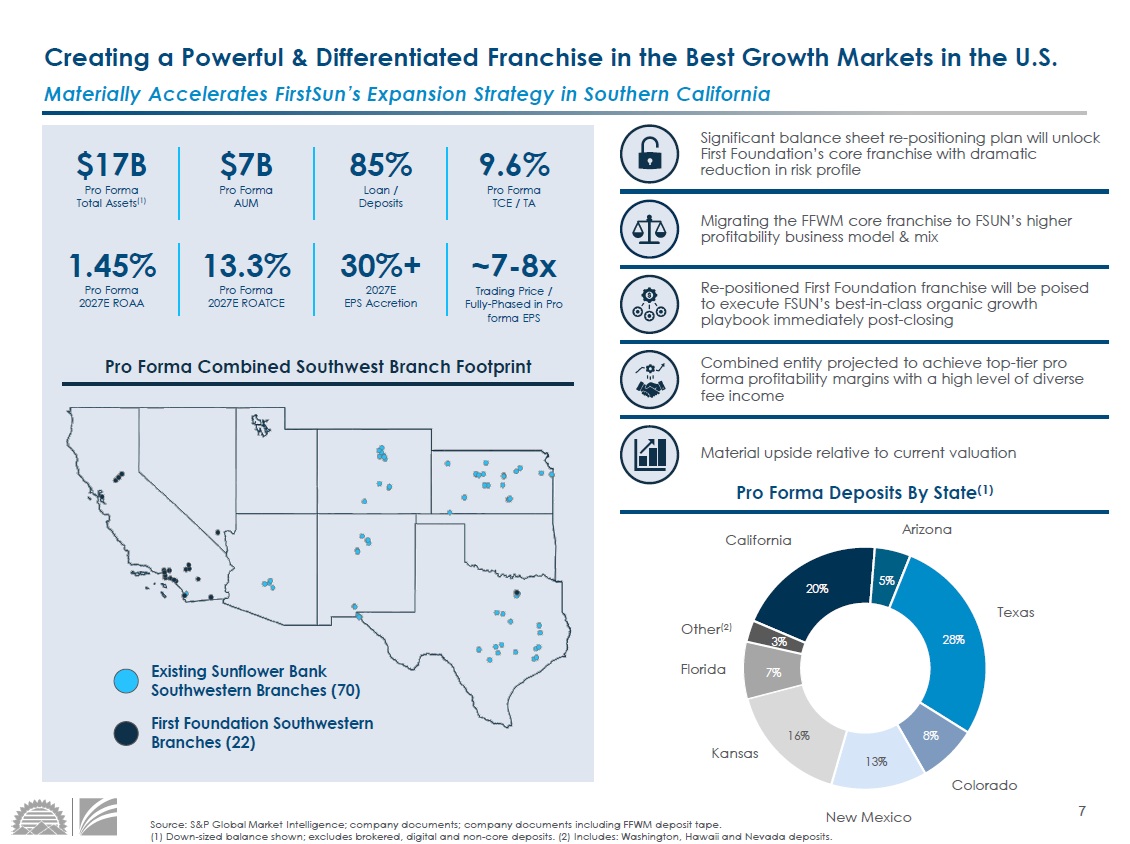
7 Significant balance sheet re - positioning plan will unlock First Foundation’s core franchise with dramatic reduction in risk profile 20% 5% 28% 8% 13% 16% 7% 3% Source: S&P Global Market Intelligence; company documents; company documents including FFWM deposit tape. (1) Down - sized balance shown; excludes brokered, digital and non - core deposits. (2) Includes: Washington, Hawaii and Nevada depo sits. 13.3% Pro Forma 2027E ROATCE $17B Pro Forma Total Assets (1) $7B Pro Forma AUM 85% Loan / Deposits 30%+ 2027E EPS Accretion ~7 - 8x Trading Price / Fully - Phased in Pro forma EPS 9.6% Pro Forma TCE / TA 1.45% Pro Forma 2027E ROAA Existing Sunflower Bank Southwestern Branches (70) First Foundation Southwestern Branches (22) Pro Forma Deposits By State (1) Migrating the FFWM core franchise to FSUN’s higher profitability business model & mix Material upside relative to current valuation Combined entity projected to achieve top - tier pro forma profitability margins with a high level of diverse fee income Re - positioned First Foundation franchise will be poised to execute FSUN’s best - in - class organic growth playbook immediately post - closing Pro Forma Combined Southwest Branch Footprint Creating a Powerful & Differentiated Franchise in the Best Growth Markets in the U.S. Materially Accelerates FirstSun’s Expansion Strategy in Southern California Florida Arizona Kansas Colorado Other (2) Texas New Mexico California
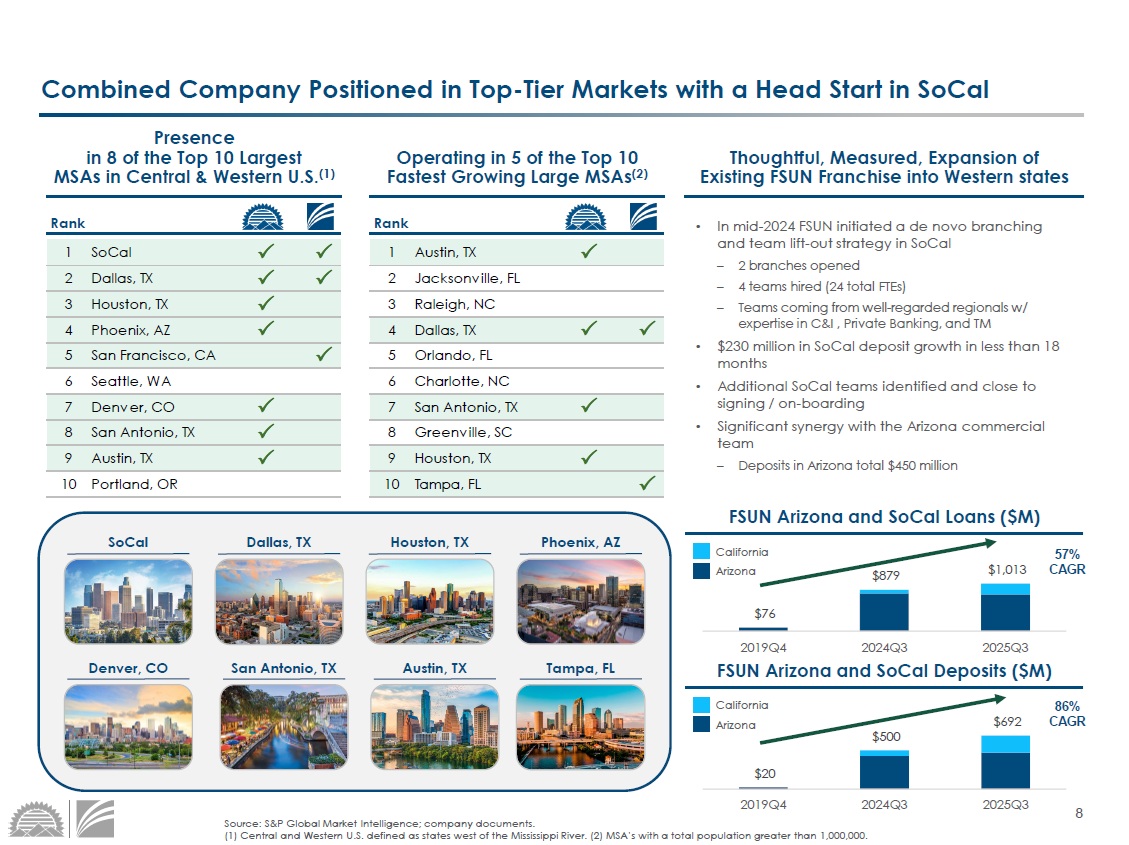
8 $20 $500 $692 2019Q4 2024Q3 2025Q3 $76 $879 $1,013 2019Q4 2024Q3 2025Q3 Rank 1 SoCal P P 2 Dallas, TX P P 3 Houston, TX P 4 Phoenix, AZ P 5 San Francisco, CA P 6 Seattle, WA 7 Denver, CO P 8 San Antonio, TX P 9 Austin, TX P 10 Portland, OR Source: S&P Global Market Intelligence; company documents. (1) Central and Western U.S. defined as states west of the Mississippi River. (2) MSA’s with a total population greater than 1,0 00,000. Combined Company Positioned in Top - Tier Markets with a Head Start in SoCal Thoughtful, Measured, Expansion of Existing FSUN Franchise into Western states • In mid - 2024 FSUN initiated a de novo branching and team lift - out strategy in SoCal – 2 branches opened – 4 teams hired (24 total FTEs) – Teams coming from well - regarded regionals w/ expertise in C&I , Private Banking, and TM • $230 million in SoCal deposit growth in less than 18 months • Additional SoCal teams identified and close to signing / on - boarding • Significant synergy with the Arizona commercial team – Deposits in Arizona total $450 million SoCal Dallas, TX Houston, TX Phoenix, AZ Rank 1 Austin, TX P 2 Jacksonville, FL 3 Raleigh, NC 4 Dallas, TX P P 5 Orlando, FL 6 Charlotte, NC 7 San Antonio, TX P 8 Greenville, SC 9 Houston, TX P 10 Tampa, FL P Denver, CO San Antonio, TX Austin, TX Presence in 8 of the Top 10 Largest MSAs in Central & Western U.S. (1) Operating in 5 of the Top 10 Fastest Growing Large MSAs (2) FSUN Arizona and SoCal Loans ($M) FSUN Arizona and SoCal Deposits ($M) California Arizona California Arizona 57% CAGR 86% CAGR Tampa, FL
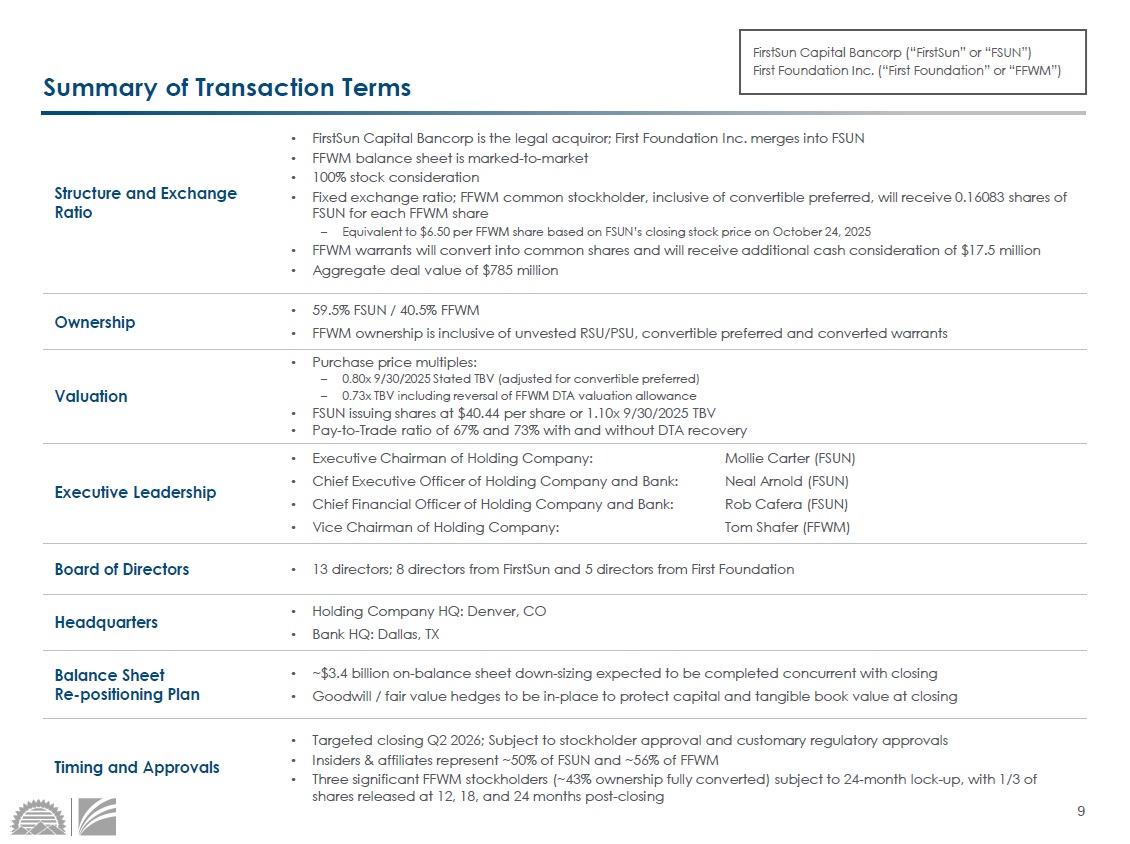
9 Structure and Exchange Ratio • FirstSun Capital Bancorp is the legal acquiror; First Foundation Inc. merges into FSUN • FFWM balance sheet is marked - to - market • 100% stock consideration • Fixed exchange ratio; FFWM common stockholder, inclusive of convertible preferred, will receive 0.16083 shares of FSUN for each FFWM share – Equivalent to $6.50 per FFWM share based on FSUN’s closing stock price on October 24, 2025 • FFWM warrants will convert into common shares and will receive additional cash consideration of $17.5 million • Aggregate deal value of $785 million Executive Leadership • Executive Chairman of Holding Company: Mollie Carter (FSUN) • Chief Executive Officer of Holding Company and Bank: Neal Arnold (FSUN) • Chief Financial Officer of Holding Company and Bank: Rob Cafera (FSUN) • Vice Chairman of Holding Company: Tom Shafer (FFWM) Board of Directors • 13 directors; 8 directors from FirstSun and 5 directors from First Foundation Ownership • 59.5% FSUN / 40.5% FFWM • FFWM ownership is inclusive of unvested RSU/PSU, convertible preferred and converted warrants Headquarters • Holding Company HQ: Denver, CO • Bank HQ: Dallas, TX Balance Sheet Re - positioning Plan • ~$3.4 billion on - balance sheet down - sizing expected to be completed concurrent with closing • Goodwill / fair value hedges to be in - place to protect capital and tangible book value at closing Timing and Approvals • Targeted closing Q2 2026; Subject to stockholder approval and customary regulatory approvals • Insiders & affiliates represent ~50% of FSUN and ~56% of FFWM • Three significant FFWM stockholders (~43% ownership fully converted) subject to 24 - month lock - up, with 1/3 of shares released at 12, 18, and 24 months post - closing Valuation • Purchase price multiples: – 0.80x 9/30/2025 Stated TBV (adjusted for convertible preferred) – 0.73x TBV including reversal of FFWM DTA valuation allowance • FSUN issuing shares at $40.44 per share or 1.10x 9/30/2025 TBV • Pay - to - Trade ratio of 67% and 73% with and without DTA recovery Summary of Transaction Terms FirstSun Capital Bancorp (“FirstSun” or “FSUN”) First Foundation Inc. (“First Foundation” or “FFWM”)
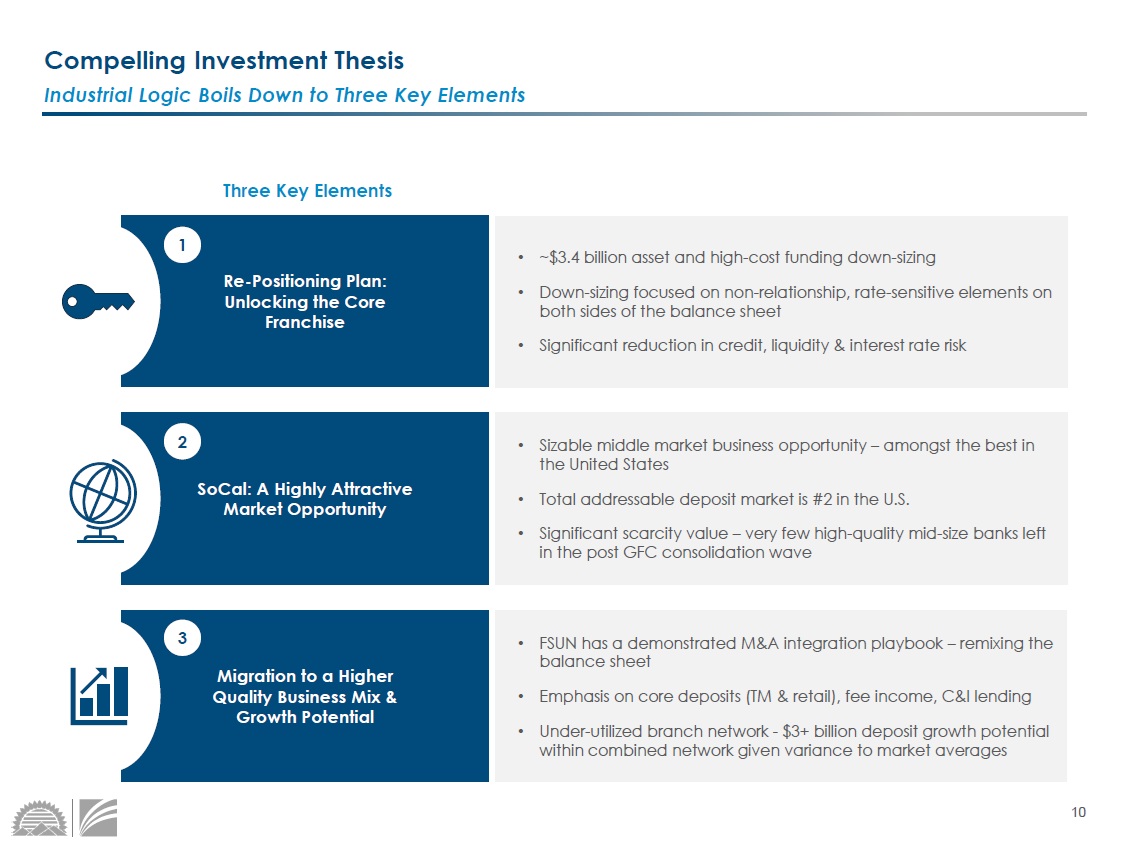
10 Re - Positioning Plan: Unlocking the Core Franchise • ~$3.4 billion asset and high - cost funding down - sizing • Down - sizing focused on non - relationship, rate - sensitive elements on both sides of the balance sheet • Significant reduction in credit, liquidity & interest rate risk Three Key Elements SoCal: A Highly Attractive Market Opportunity Migration to a Higher Quality Business Mix & Growth Potential 1 2 3 Compelling Investment Thesis Industrial Logic Boils Down to Three Key Elements • Sizable middle market business opportunity – amongst the best in the United States • Total addressable deposit market is #2 in the U.S. • Significant scarcity value – very few high - quality mid - size banks left in the post GFC consolidation wave • FSUN has a demonstrated M&A integration playbook – remixing the balance sheet • Emphasis on core deposits (TM & retail), fee income, C&I lending • Under - utilized branch network - $3+ billion deposit growth potential within combined network given variance to market averages
11 = II. Re - Positioning Plan: Unlocking the Core Franchise
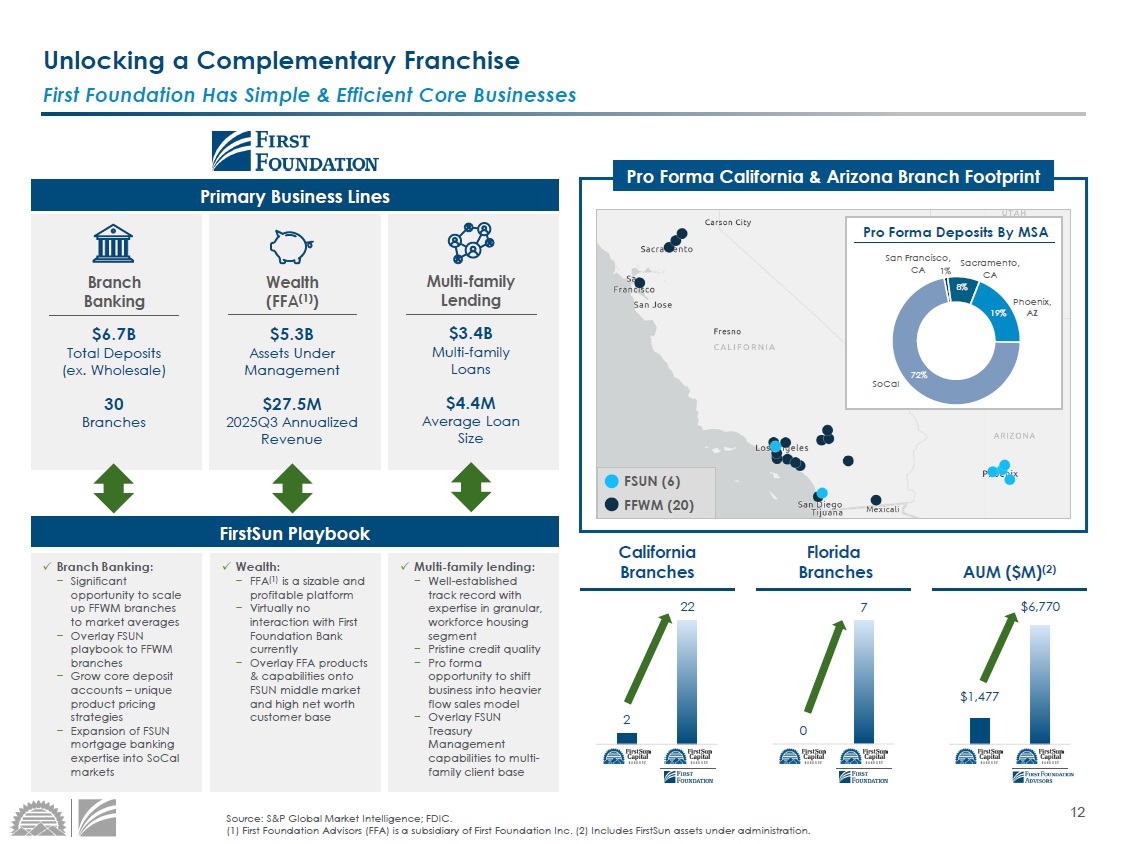
12 Source: S&P Global Market Intelligence; FDIC. (1) First Foundation Advisors (FFA) is a subsidiary of First Foundation Inc. (2) Includes FirstSun assets under administratio n. Pro Forma California & Arizona Branch Footprint FSUN (6) FFWM (20) x Branch Banking: − Significant opportunity to scale up FFWM branches to market averages − Overlay FSUN playbook to FFWM branches − Grow core deposit accounts – unique product pricing strategies − Expansion of FSUN mortgage banking expertise into SoCal markets Branch Banking 30 Branches $6.7B Total Deposits (ex. Wholesale) x Wealth: − FFA (1) is a sizable and profitable platform − Virtually no interaction with First Foundation Bank currently − Overlay FFA products & capabilities onto FSUN middle market and high net worth customer base Wealth (FFA (1) ) $5.3B Assets Under Management $27.5M 2025Q3 Annualized Revenue Primary Business Lines x Multi - family lending: − Well - established track record with expertise in granular, workforce housing segment − Pristine credit quality − Pro forma opportunity to shift business into heavier flow sales model − Overlay FSUN Treasury Management capabilities to multi - family client base Multi - family Lending $3.4B Multi - family Loans $4.4M Average Loan Size First Foundation Has Simple & Efficient Core Businesses Unlocking a Complementary Franchise FirstSun Playbook $1,477 $6,770 California Branches AUM ($M) (2) 1% 8% 19% 72% SoCal Phoenix, AZ San Francisco, CA Sacramento, CA Pro Forma Deposits By MSA Florida Branches 0 7 2 22
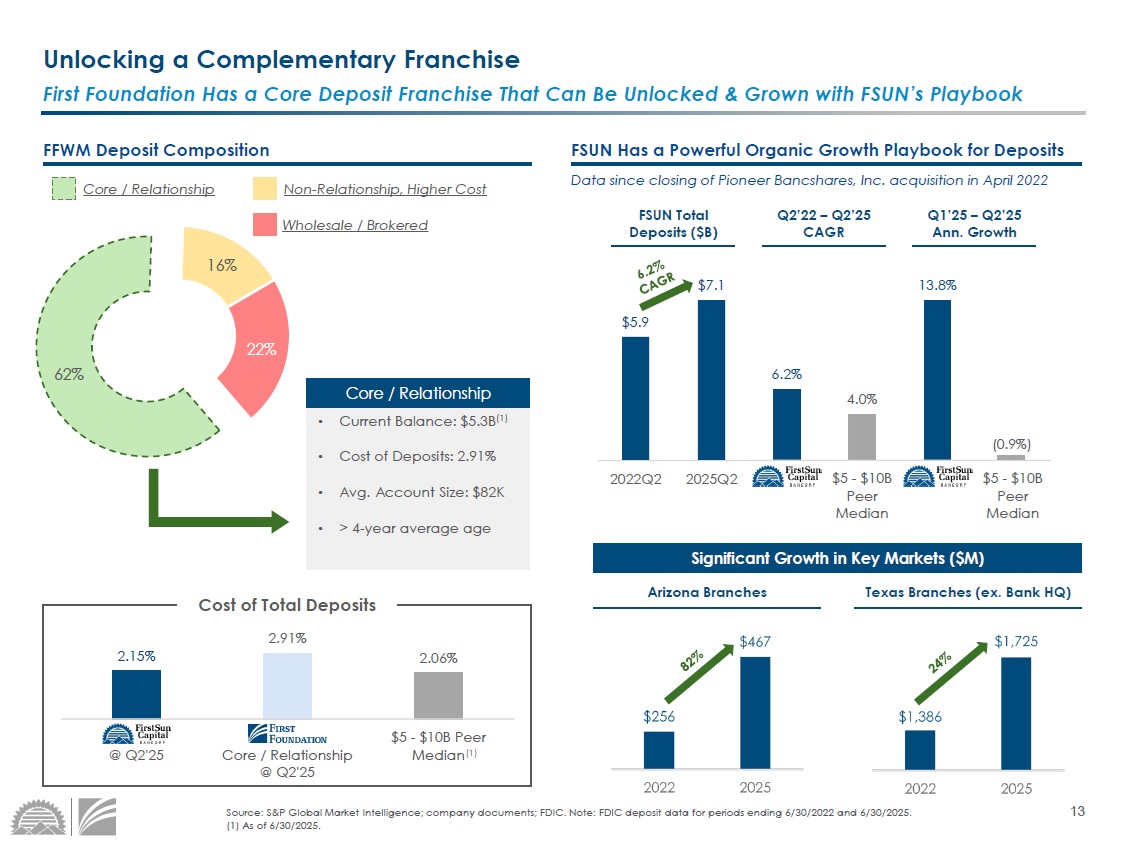
13 2.15% 2.91% 2.06% @ Q2'25 Core / Relationship @ Q2'25 $5 - $10B Peer Median 16% 22% 62% Source: S&P Global Market Intelligence; company documents; FDIC. Note: FDIC deposit data for periods ending 6/30/2022 and 6/3 0/2 025. (1) As of 6/30/2025. FFWM Deposit Composition Non - Relationship, Higher Cost Wholesale / Brokered Core / Relationship • Current Balance: $5.3B (1) • Cost of Deposits: 2.91% • Avg. Account Size: $82K • > 4 - year average age FSUN Has a Powerful Organic Growth Playbook for Deposits Data since closing of Pioneer Bancshares, Inc. acquisition in April 2022 First Foundation Has a Core Deposit Franchise That Can Be Unlocked & Grown with FSUN’s Playbook Unlocking a Complementary Franchise Core / Relationship Cost of Total Deposits (1) 6.2% 4.0% 13.8% $5 - $10B Peer Median $5 - $10B Peer Median $5.9 $7.1 2022Q2 2025Q2 Q1’25 – Q2’25 Ann. Growth Q2’22 – Q2’25 CAGR FSUN Total Deposits ($B) (0.9%) Significant Growth in Key Markets ($M) Arizona Branches Texas Branches (ex. Bank HQ)
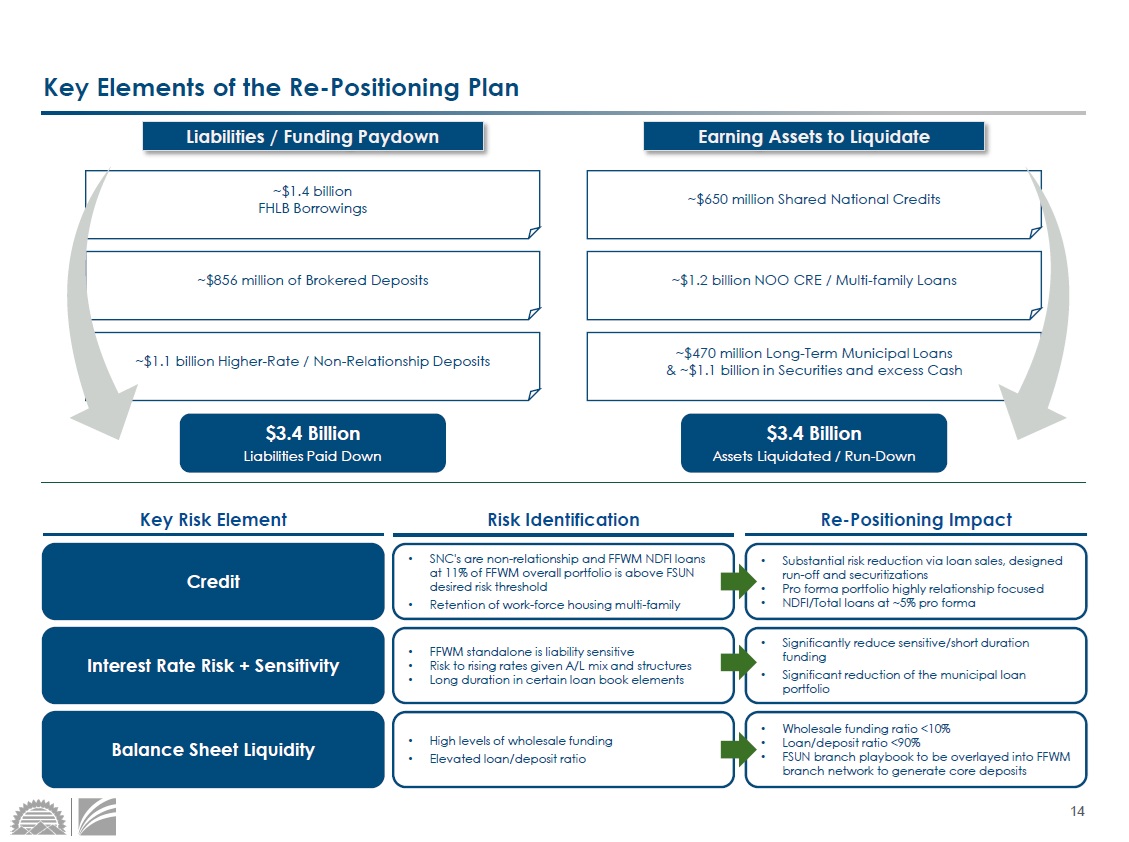
14 Key Elements of the Re - Positioning Plan Liabilities / Funding Paydown Earning Assets to Liquidate ~$856 million of Brokered Deposits ~$1.2 billion NOO CRE / Multi - family Loans ~$1.1 billion Higher - Rate / Non - Relationship Deposits ~$470 million Long - Term Municipal Loans & ~$1.1 billion in Securities and excess Cash ~$1.4 billion FHLB Borrowings ~$650 million Shared National Credits $3.4 Billion Liabilities Paid Down $3.4 Billion Assets Liquidated / Run - Down Key Risk Element Risk Identification Re - Positioning Impact Credit • SNC's are non - relationship and FFWM NDFI loans at 11% of FFWM overall portfolio is above FSUN desired risk threshold • Retention of work - force housing multi - family • Substantial risk reduction via loan sales, designed run - off and securitizations • Pro forma portfolio highly relationship focused • NDFI/Total loans at ~5% pro forma Interest Rate Risk + Sensitivity • FFWM standalone is liability sensitive • Risk to rising rates given A/L mix and structures • Long duration in certain loan book elements • Significantly reduce sensitive/short duration funding • Significant reduction of the municipal loan portfolio Balance Sheet Liquidity • High levels of wholesale funding • Elevated loan/deposit ratio • Wholesale funding ratio <10% • Loan/deposit ratio <90% • FSUN branch playbook to be overlayed into FFWM branch network to generate core deposits
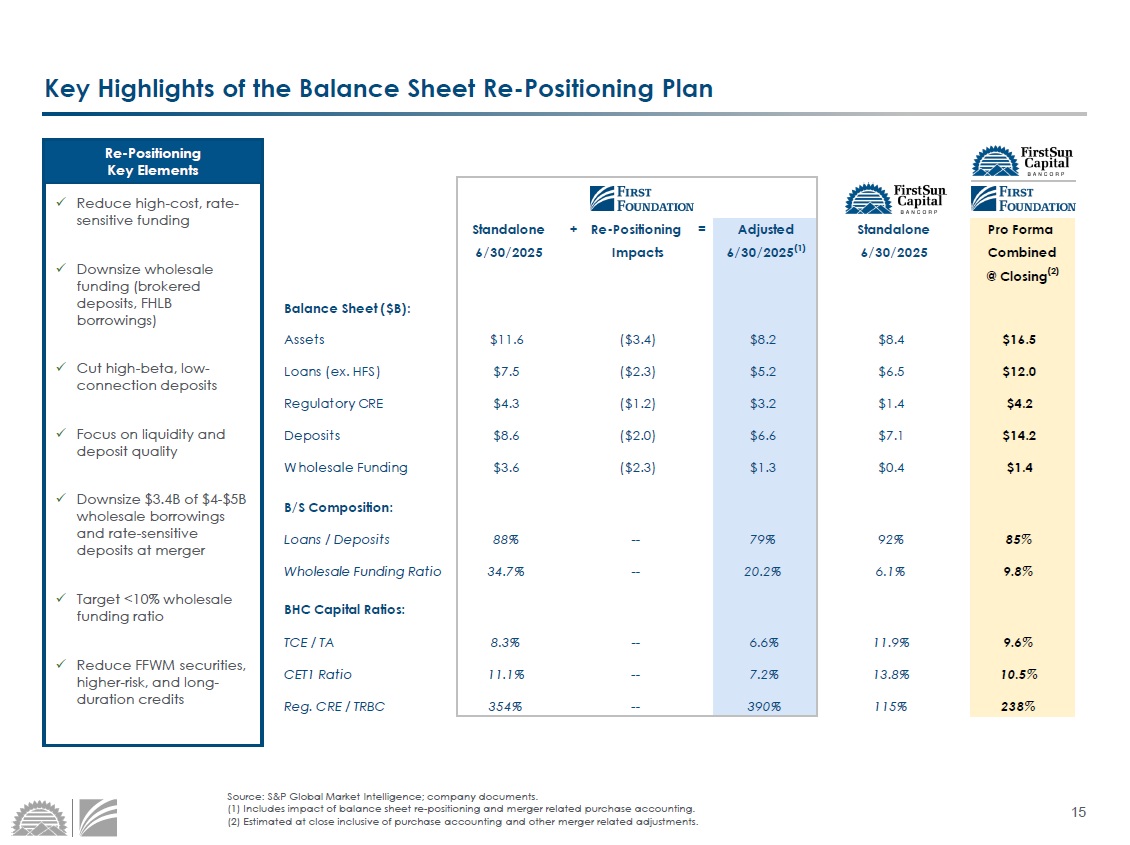
15 Standalone + Re-Positioning = Adjusted Standalone Pro Forma 6/30/2025 Impacts 6/30/2025 (1) 6/30/2025 Combined @ Closing (2) Balance Sheet ($B): Assets $11.6 ($3.4) $8.2 $8.4 $16.5 Loans (ex. HFS) $7.5 ($2.3) $5.2 $6.5 $12.0 Regulatory CRE $4.3 ($1.2) $3.2 $1.4 $4.2 Deposits $8.6 ($2.0) $6.6 $7.1 $14.2 Wholesale Funding $3.6 ($2.3) $1.3 $0.4 $1.4 B/S Composition: Loans / Deposits 88% -- 79% 92% 85% Wholesale Funding Ratio 34.7% -- 20.2% 6.1% 9.8% BHC Capital Ratios: TCE / TA 8.3% -- 6.6% 11.9% 9.6% CET1 Ratio 11.1% -- 7.2% 13.8% 10.5% Reg. CRE / TRBC 354% -- 390% 115% 238% Key Highlights of the Balance Sheet Re - Positioning Plan Source: S&P Global Market Intelligence; company documents. (1) Includes impact of balance sheet re - positioning and merger related purchase accounting. (2) Estimated at close inclusive of purchase accounting and other merger related adjustments. x Reduce high - cost, rate - sensitive funding x Downsize wholesale funding (brokered deposits, FHLB borrowings) x Cut high - beta, low - connection deposits x Focus on liquidity and deposit quality x Downsize $3.4B of $4 - $5B wholesale borrowings and rate - sensitive deposits at merger x Target <10% wholesale funding ratio x Reduce FFWM securities, higher - risk, and long - duration credits Re - Positioning Key Elements
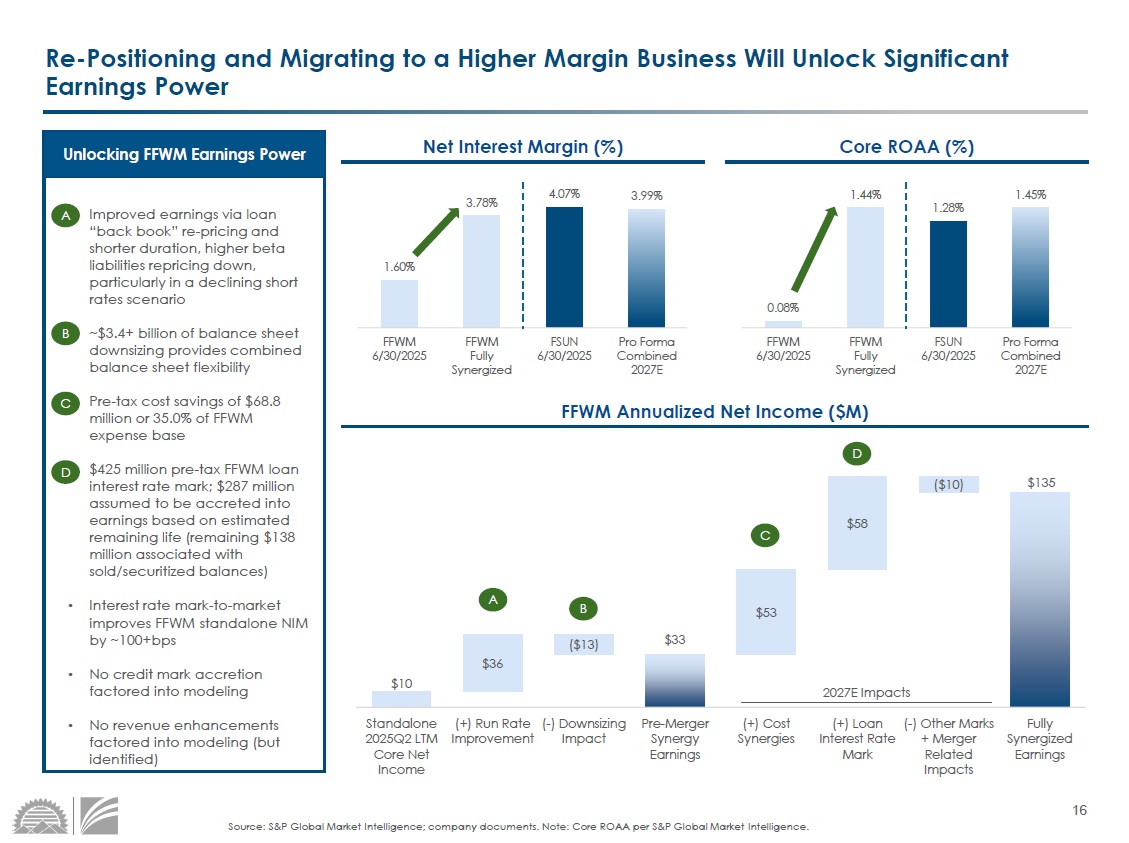
16 0.08% 1.44% 1.28% 1.45% FFWM 6/30/2025 FFWM Fully Synergized FSUN 6/30/2025 Pro Forma Combined 2027E 1.60% 3.78% 4.07% 3.99% FFWM 6/30/2025 FFWM Fully Synergized FSUN 6/30/2025 Pro Forma Combined 2027E Re - Positioning and Migrating to a Higher Margin Business Will Unlock Significant Earnings Power Source: S&P Global Market Intelligence; company documents. Note: Core ROAA per S&P Global Market Intelligence. • Improved earnings via loan “back book” re - pricing and shorter duration, higher beta liabilities repricing down, particularly in a declining short rates scenario • ~$3.4+ billion of balance sheet downsizing provides combined balance sheet flexibility • Pre - tax cost savings of $68.8 million or 35.0% of FFWM expense base • $425 million pre - tax FFWM loan interest rate mark; $287 million assumed to be accreted into earnings based on estimated remaining life (remaining $138 million associated with sold/securitized balances) • Interest rate mark - to - market improves FFWM standalone NIM by ~100+bps • No credit mark accretion factored into modeling • No revenue enhancements factored into modeling (but identified) Unlocking FFWM Earnings Power Net Interest Margin (%) Core ROAA (%) FFWM Annualized Net Income ($M) $10 $33 $135 $36 ($13) ($10) $53 $58 Standalone 2025Q2 LTM Core Net Income (+) Run Rate Improvement (-) Downsizing Impact Pre-Merger Synergy Earnings (+) Cost Synergies (+) Loan Interest Rate Mark (-) Other Marks + Merger Related Impacts Fully Synergized Earnings A A C C D D B B 2027E Impacts
17 = III. SoCal: A Highly Attractive Market Opportunity
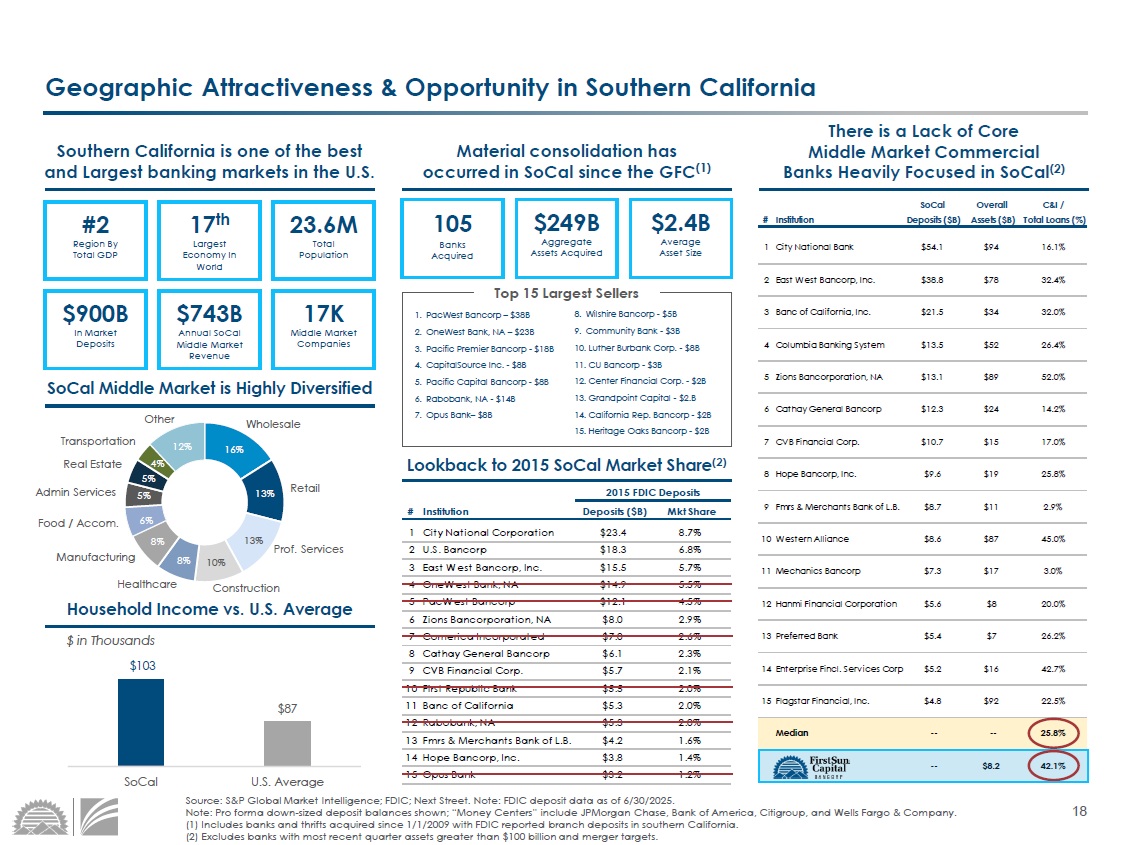
18 SoCal Overall C&I / # Institution Deposits ($B) Assets ($B) Total Loans (%) 1 City National Bank $54.1 $94 16.1% 2 East West Bancorp, Inc. $38.8 $78 32.4% 3 Banc of California, Inc. $21.5 $34 32.0% 4 Columbia Banking System $13.5 $52 26.4% 5 Zions Bancorporation, NA $13.1 $89 52.0% 6 Cathay General Bancorp $12.3 $24 14.2% 7 CVB Financial Corp. $10.7 $15 17.0% 8 Hope Bancorp, Inc. $9.6 $19 25.8% 9 Fmrs & Merchants Bank of L.B. $8.7 $11 2.9% 10Western Alliance $8.6 $87 45.0% 11Mechanics Bancorp $7.3 $17 3.0% 12Hanmi Financial Corporation $5.6 $8 20.0% 13Preferred Bank $5.4 $7 26.2% 14Enterprise Fincl. Services Corp $5.2 $16 42.7% 15Flagstar Financial, Inc. $4.8 $92 22.5% Median -- -- 25.8% -- $8.2 42.1% $103 $87 SoCal U.S. Average 16% 13% 13% 10% 8% 8% 6% 5% 5% 4% 12% Southern California is one of the best and Largest banking markets in the U.S. Material consolidation has occurred in SoCal since the GFC (1) There is a Lack of Core Middle Market Commercial Banks Heavily Focused in SoCal (2) 17 th Largest Economy In World #2 Region By Total GDP 23.6M Total Population Source: S&P Global Market Intelligence; FDIC; Next Street. Note: FDIC deposit data as of 6/30/2025. Note: Pro forma down - sized deposit balances shown; “Money Centers” include JPMorgan Chase, Bank of America, Citigroup, and Wells Fargo & Company. (1) Includes banks and thrifts acquired since 1/1/2009 with FDIC reported branch deposits in southern California. (2) Excludes banks with most recent quarter assets greater than $100 billion and merger targets. Household Income vs. U.S. Average 105 Banks Acquired 2015 FDIC Deposits # Institution Deposits ($B) Mkt Share 1 City National Corporation $23.4 8.7% 2 U.S. Bancorp $18.3 6.8% 3 East West Bancorp, Inc. $15.5 5.7% 4 OneWest Bank, NA $14.9 5.5% 5 PacWest Bancorp $12.1 4.5% 6 Zions Bancorporation, NA $8.0 2.9% 7 Comerica Incorporated $7.0 2.6% 8 Cathay General Bancorp $6.1 2.3% 9 CVB Financial Corp. $5.7 2.1% 10First Republic Bank $5.5 2.0% 11Banc of California $5.3 2.0% 12Rabobank, NA $5.3 2.0% 13Fmrs & Merchants Bank of L.B. $4.2 1.6% 14Hope Bancorp, Inc. $3.8 1.4% 15Opus Bank $3.2 1.2% $249B Aggregate Assets Acquired $2.4B Average Asset Size Lookback to 2015 SoCal Market Share (2) 1. PacWest Bancorp – $38B 2. OneWest Bank, NA – $23B 3. Pacific Premier Bancorp - $18B 4. CapitalSource Inc. - $8B 5. Pacific Capital Bancorp - $8B 6. Rabobank, NA - $14B 7. Opus Bank – $8B 8. Wilshire Bancorp - $5B 9. Community Bank - $3B 10. Luther Burbank Corp. - $8B 11. CU Bancorp - $3B 12. Center Financial Corp. - $2B 13. Grandpoint Capital - $2.B 14. California Rep. Bancorp - $2B 15. Heritage Oaks Bancorp - $2B Geographic Attractiveness & Opportunity in Southern California $743B Annual SoCal Middle Market Revenue $900B In Market Deposits 17K Middle Market Companies SoCal Middle Market is Highly Diversified $ in Thousands Top 15 Largest Sellers Prof. Services Retail Wholesale Healthcare Other Transportation Construction Manufacturing Food / Accom. Admin Services Real Estate
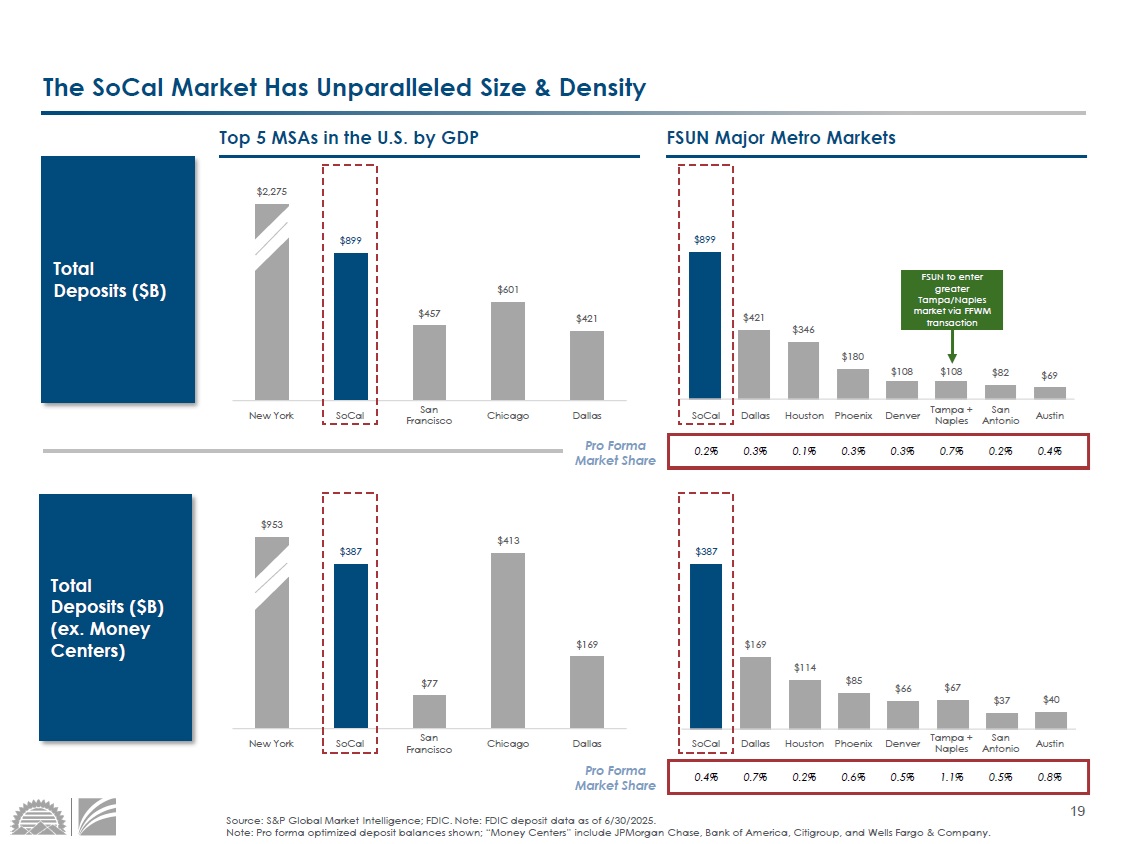
19 $899 $421 $346 $180 $108 $108 $82 $69 1 2 3 4 5 6 7 8 $387 $169 $114 $85 $66 $67 $37 $40 1 2 3 4 5 6 7 8 $2,275 $899 $457 $601 $421 1 2 3 4 5 $953 $387 $77 $413 $169 1 2 3 4 5 Source: S&P Global Market Intelligence; FDIC. Note: FDIC deposit data as of 6/30/2025. Note: Pro forma optimized deposit balances shown; “Money Centers” include JPMorgan Chase, Bank of America, Citigroup, and Wel ls Fargo & Company. Total Deposits ($B) FSUN Major Metro Markets Total Deposits ($B) (ex. Money Centers) Top 5 MSAs in the U.S. by GDP New York SoCal Dallas Chicago San Francisco SoCal Dallas Phoenix Denver Tampa + Naples San Antonio Austin Houston Pro Forma Market Share SoCal Dallas Phoenix Denver Tampa + Naples San Antonio Austin Houston The SoCal Market Has Unparalleled Size & Density Pro Forma Market Share New York SoCal Dallas Chicago San Francisco 0.2% 0.3% 0.1% 0.3% 0.7% 0.2% 0.4% 0.3% 0.4% 0.7% 0.2% 0.6% 1.1% 0.5% 0.8% 0.5% FSUN to enter greater Tampa/Naples market via FFWM transaction
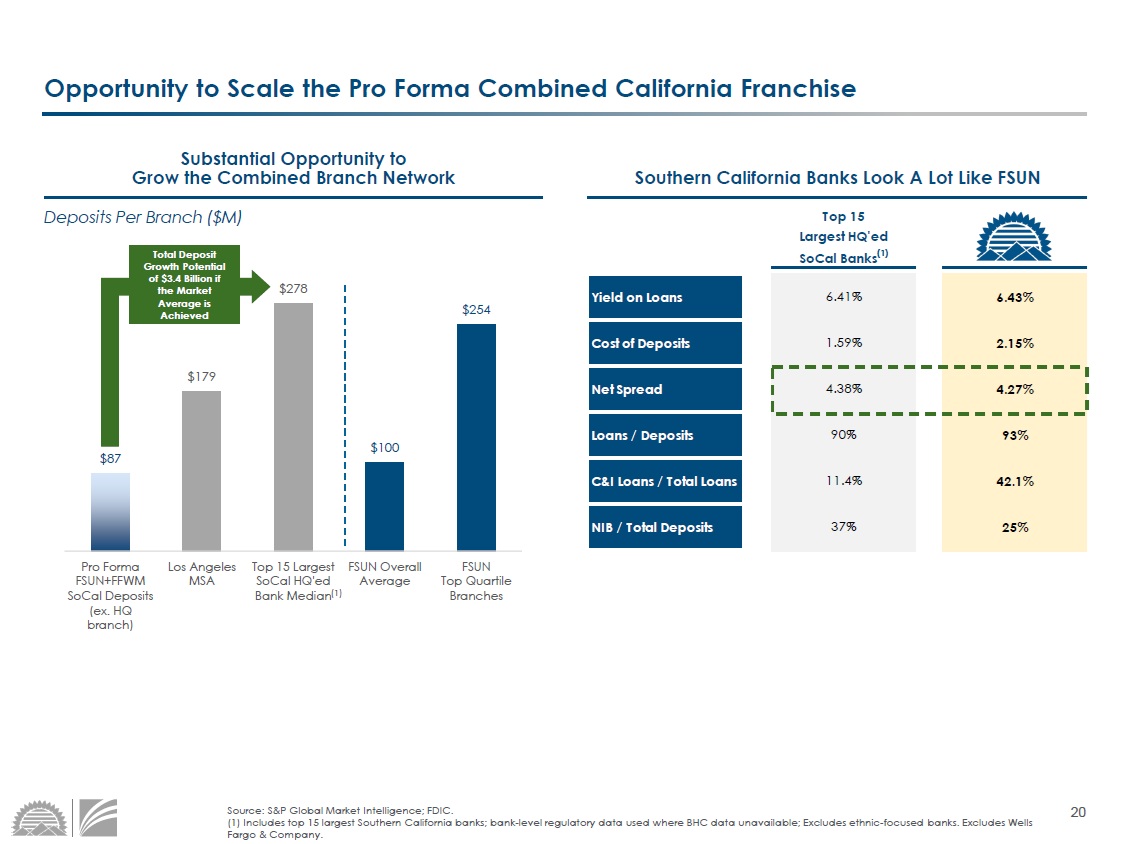
20 $87 $179 $278 $100 $254 Pro Forma FSUN+FFWM SoCal Deposits (ex. HQ branch) Los Angeles MSA Top 15 Largest SoCal HQ'ed Bank Median FSUN Overall Average FSUN Top Quartile Branches Source: S&P Global Market Intelligence; FDIC. (1) Includes top 15 largest Southern California banks; bank - level regulatory data used where BHC data unavailable; Excludes ethn ic - focused banks. Excludes Wells Fargo & Company. Substantial Opportunity to Grow the Combined Branch Network Southern California Banks Look A Lot Like FSUN Top 15 Largest HQ'ed SoCal Banks (1) Yield on Loans 6.41% 6.43% Cost of Deposits 1.59% 2.15% Net Spread 4.38% 4.27% Loans / Deposits 90% 93% C&I Loans / Total Loans 11.4% 42.1% NIB / Total Deposits 37% 25% (1) Opportunity to Scale the Pro Forma Combined California Franchise Deposits Per Branch ($M) Total Deposit Growth Potential of $3.4 Billion if the Market Average is Achieved
21 = IV. Migration to a Higher Quality Business Mix & Growth Potential
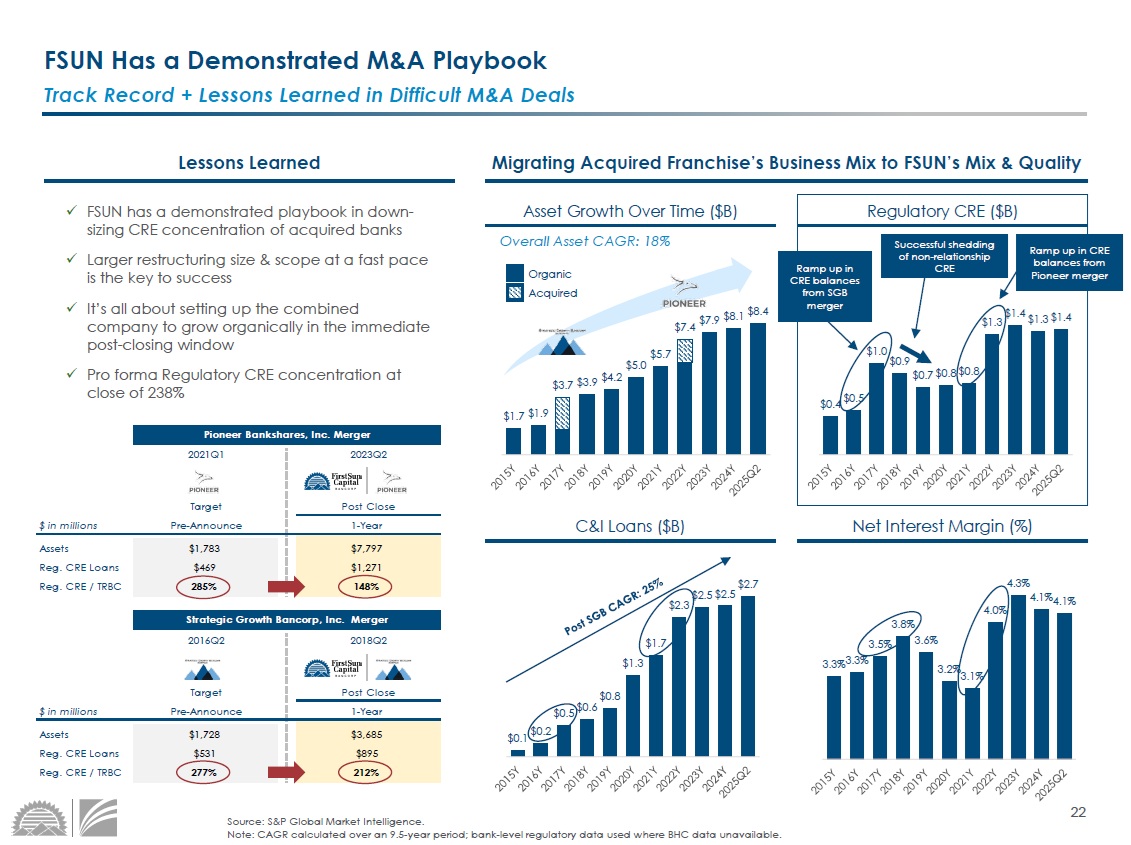
22 Pioneer Bankshares, Inc. Merger First Foundation Inc. Merger (1) 2021Q1 2023Q2 Target Post Close $ in millions Pre-Announce 1-Year Assets $1,783 $7,797 Reg. CRE Loans $469 $1,271 Reg. CRE / TRBC 285% 148% 3.3% 3.3% 3.5% 3.8% 3.6% 3.2% 3.1% 4.0% 4.3% 4.1% 4.1% $1.7 $1.9 $3.7 $3.9 $4.2 $5.0 $5.7 $7.4 $7.9 $8.1 $8.4 $0.4 $0.5 $1.0 $0.9 $0.7 $0.8 $0.8 $1.3 $1.4 $1.3 $1.4 $0.1 $0.2 $0.5 $0.6 $0.8 $1.3 $1.7 $2.3 $2.5 $2.5 $2.7 Migrating Acquired Franchise’s Business Mix to FSUN’s Mix & Quality Overall Asset CAGR: 18% Strategic Growth Bancorp, Inc. Merger Pioneer Bankshares, Inc. Merger 2016Q2 2018Q2 Target Post Close $ in millions Pre-Announce 1-Year Assets $1,728 $3,685 Reg. CRE Loans $531 $895 Reg. CRE / TRBC 277% 212% Ramp up in CRE balances from SGB merger Source: S&P Global Market Intelligence. Note: CAGR calculated over an 9.5 - year period; bank - level regulatory data used where BHC data unavailable. Asset Growth Over Time ($B) x FSUN has a demonstrated playbook in down - sizing CRE concentration of acquired banks x Larger restructuring size & scope at a fast pace is the key to success x It’s all about setting up the combined company to grow organically in the immediate post - closing window x Pro forma Regulatory CRE concentration at close of 238% Lessons Learned Regulatory CRE ($B) Organic Acquired Successful shedding of non - relationship CRE Ramp up in CRE balances from Pioneer merger Net Interest Margin (%) C&I Loans ($B) Track Record + Lessons Learned in Difficult M&A Deals FSUN Has a Demonstrated M&A Playbook
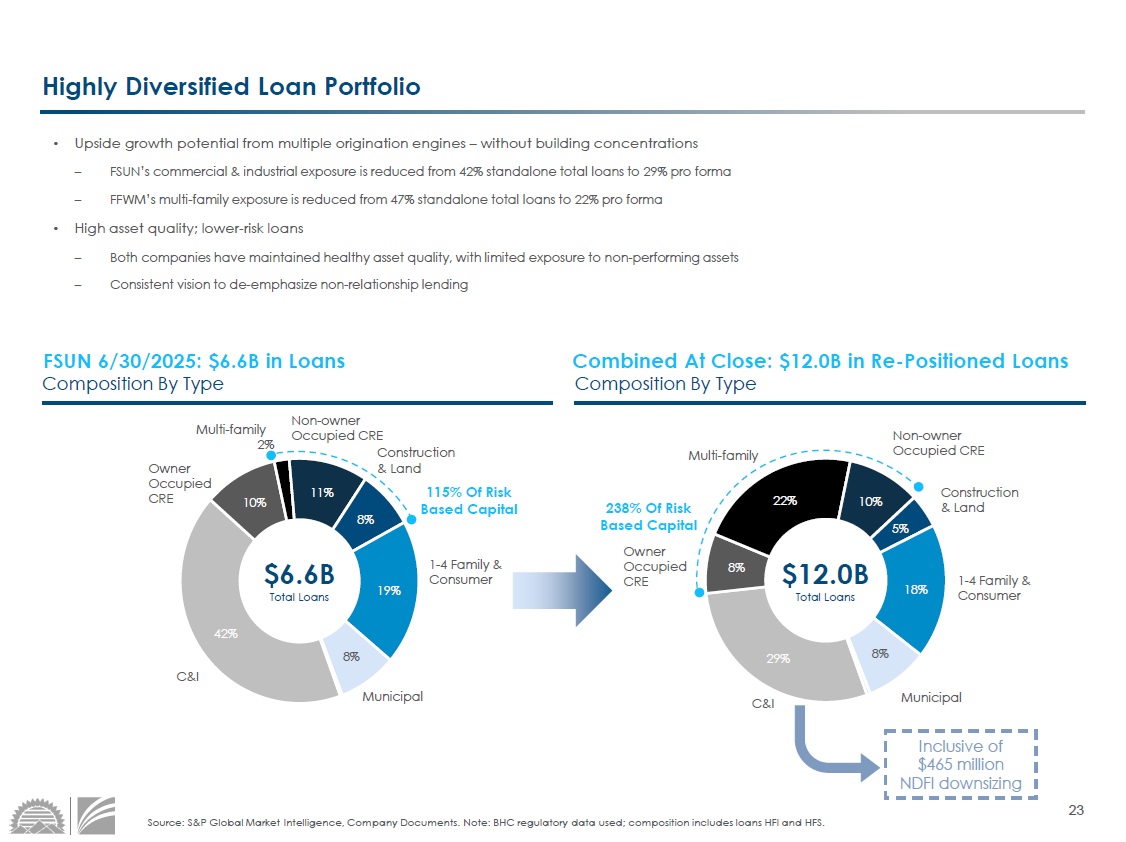
23 Source: S&P Global Market Intelligence, Company Documents. Note: BHC regulatory data used; composition includes loans HFI and HF S. Highly Diversified Loan Portfolio • Upside growth potential from multiple origination engines – without building concentrations – FSUN’s commercial & industrial exposure is reduced from 42% standalone total loans to 29% pro forma – FFWM’s multi - family exposure is reduced from 47% standalone total loans to 22% pro forma • High asset quality; lower - risk loans – Both companies have maintained healthy asset quality, with limited exposure to non - performing assets – Consistent vision to de - emphasize non - relationship lending Combined At Close: $12.0B in Re - Positioned Loans FSUN 6/30/2025: $6.6B in Loans 42% 10% 2% 11% 8% 19% 8% Composition By Type Composition By Type 29% 8% 22% 10% 5% 18% 8% Owner Occupied CRE Multi - family Non - owner Occupied CRE Construction & Land 1 - 4 Family & Consumer C&I Owner Occupied CRE 115% Of Risk Based Capital 238% Of Risk Based Capital $6.6B Total Loans $12.0B Total Loans Municipal Multi - family Non - owner Occupied CRE C&I Construction & Land 1 - 4 Family & Consumer Municipal Inclusive of $465 million NDFI downsizing
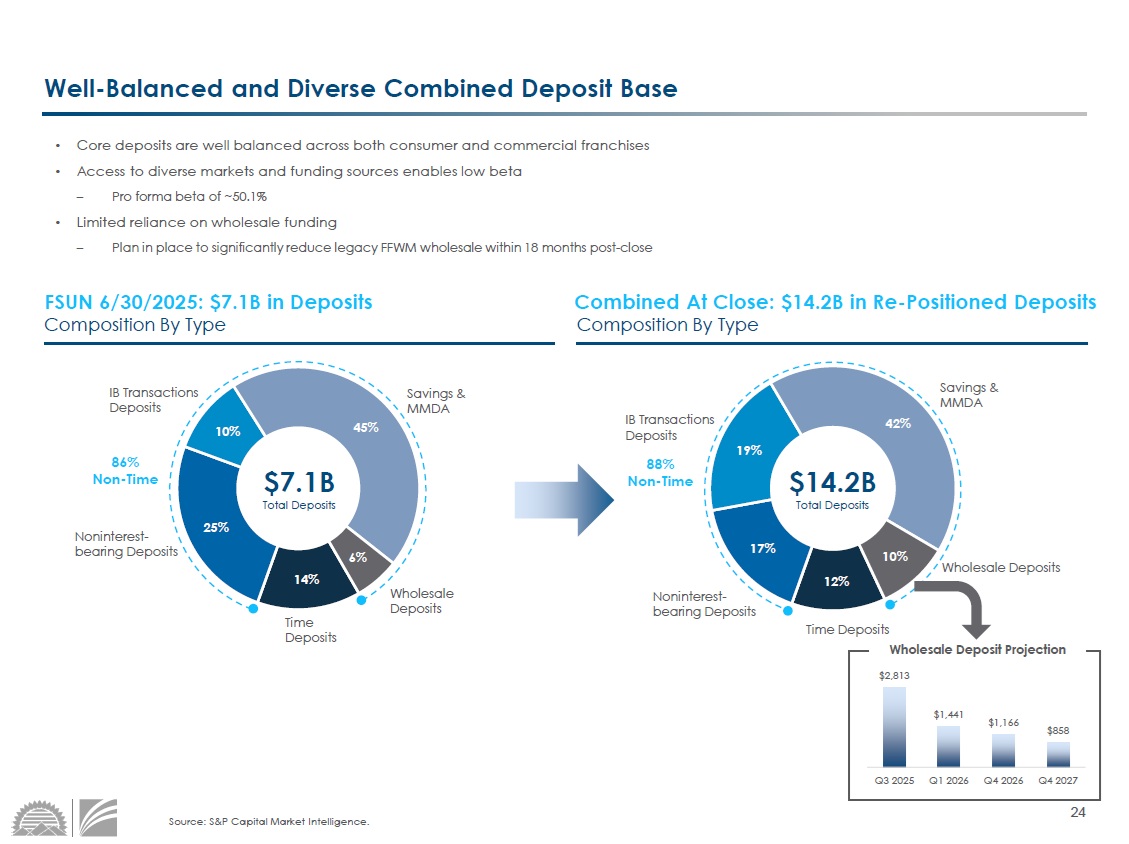
24 12% 17% 19% 42% 10% 14% 25% 10% 45% 6% Well - Balanced and Diverse Combined Deposit Base • Core deposits are well balanced across both consumer and commercial franchises • Access to diverse markets and funding sources enables low beta – Pro forma beta of ~50.1% • Limited reliance on wholesale funding – Plan in place to significantly reduce legacy FFWM wholesale within 18 months post - close Combined At Close: $14.2B in Re - Positioned Deposits Composition By Type Composition By Type Source: S&P Capital Market Intelligence. Noninterest - bearing Deposits Time Deposits IB Transactions Deposits $7.1B Total Deposits $14.2B Total Deposits FSUN 6/30/2025: $ 7 .1B in Deposits Savings & MMDA Wholesale Deposits Noninterest - bearing Deposits IB Transactions Deposits Savings & MMDA $2,813 $1,441 $1,166 $858 Q3 2025 Q1 2026 Q4 2026 Q4 2027 Time Deposits 86% Non - Time 88% Non - Time Wholesale Deposit Projection Wholesale Deposits
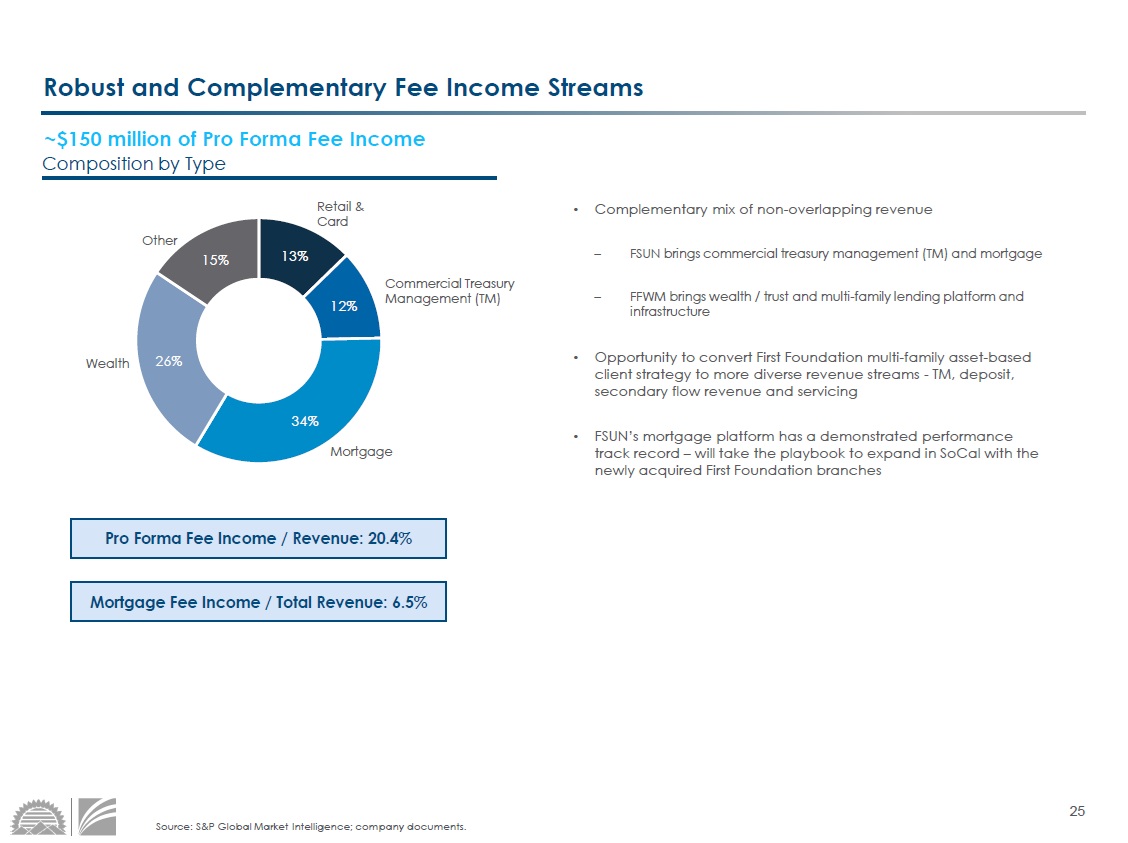
25 Robust and Complementary Fee Income Streams ~$150 million of Pro Forma Fee Income Composition by Type 13% 12% 34% 26% 15% Mortgage Commercial Treasury Management (TM) Retail & Card Other Wealth Source: S&P Global Market Intelligence; company documents. • Complementary mix of non - overlapping revenue – FSUN brings commercial treasury management (TM) and mortgage – FFWM brings wealth / trust and multi - family lending platform and infrastructure • Opportunity to convert First Foundation multi - family asset - based client strategy to more diverse revenue streams - TM, deposit, secondary flow revenue and servicing • FSUN’s mortgage platform has a demonstrated performance track record – will take the playbook to expand in SoCal with the newly acquired First Foundation branches Pro Forma Fee Income / Revenue: 20.4% Mortgage Fee Income / Total Revenue: 6.5%
26 V. Accelerating Stockholder Value Creation
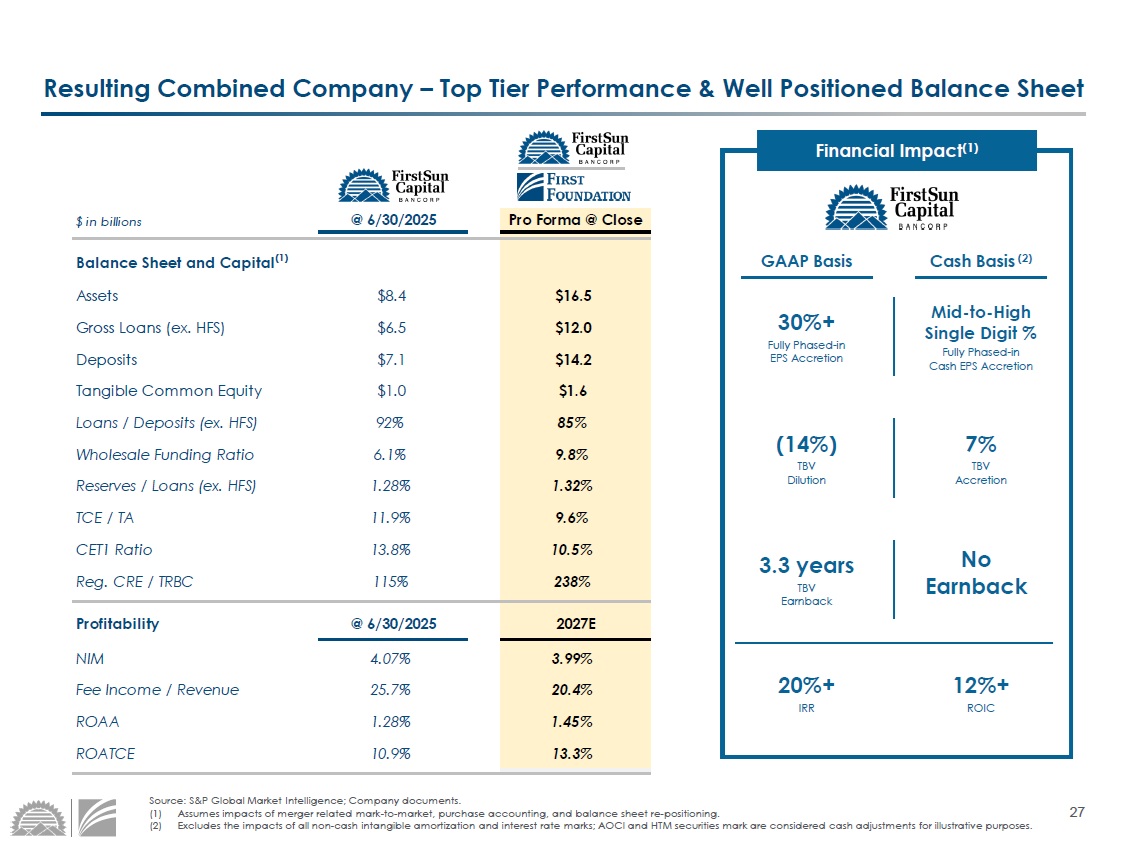
27 Resulting Combined Company – Top Tier Performance & Well Positioned Balance Sheet Source: S&P Global Market Intelligence; Company documents. (1) Assumes impacts of merger related mark - to - market, purchase accounting, and balance sheet re - positioning. (2) Excludes the impacts of all non - cash intangible amortization and interest rate marks; AOCI and HTM securities mark are considere d cash adjustments for illustrative purposes. Financial Impact (1) GAAP Basis Cash Basis (2) 30%+ Fully Phased - in EPS Accretion Mid - to - High Single Digit % Fully Phased - in Cash EPS Accretion (14%) TBV Dilution 7 % TBV Accretion 3.3 years TBV Earnback No Earnback 20 %+ IRR 12 %+ ROIC $ in billions @ 6/30/2025 Pro Forma @ Close Balance Sheet and Capital (1) Assets $8.4 $16.5 Gross Loans (ex. HFS) $6.5 $12.0 Deposits $7.1 $14.2 Tangible Common Equity $1.0 $1.6 Loans / Deposits (ex. HFS) 92% 85% Wholesale Funding Ratio 6.1% 9.8% Reserves / Loans (ex. HFS) 1.28% 1.32% TCE / TA 11.9% 9.6% CET1 Ratio 13.8% 10.5% Reg. CRE / TRBC 115% 238% Profitability @ 6/30/2025 2027E NIM 4.07% 3.99% Fee Income / Revenue 25.7% 20.4% ROAA 1.28% 1.45% ROATCE 10.9% 13.3%
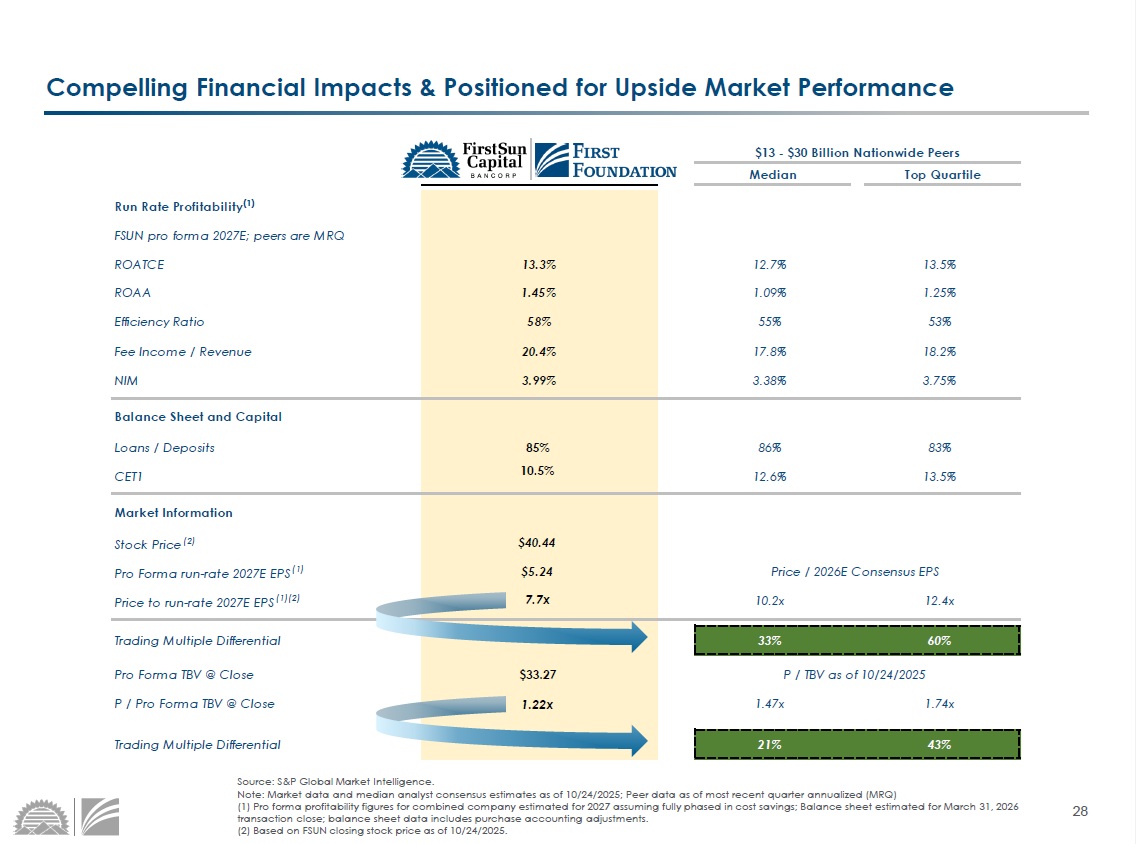
28 Compelling Financial Impacts & Positioned for Upside Market Performance Source: S&P Global Market Intelligence. Note: Market data and median analyst consensus estimates as of 10/24/2025; Peer data as of most recent quarter annualized (MR Q) (1) Pro forma profitability figures for combined company estimated for 2027 assuming fully phased in cost savings; Balance sh eet estimated for March 31, 2026 transaction close; balance sheet data includes purchase accounting adjustments. (2) Based on FSUN closing stock price as of 10/24/2025. $13 - $30 Billion Nationwide Peers Median Top Quartile Run Rate Profitability (1) FSUN pro forma 2027E; peers are MRQ ROATCE 13.3% 12.7% 13.5% ROAA 1.45% 1.09% 1.25% Efficiency Ratio 58% 55% 53% Fee Income / Revenue 20.4% 17.8% 18.2% NIM 3.99% 3.38% 3.75% Balance Sheet and Capital Loans / Deposits 85% 86% 83% CET1 10.5% 12.6% 13.5% Market Information Stock Price (2) $40.44 Pro Forma run-rate 2027E EPS (1) $5.24 Price / 2026E Consensus EPS Price to run-rate 2027E EPS (1)(2) 7.7x 10.2x 12.4x Trading Multiple Differential 33% 60% Pro Forma TBV @ Close $33.27 P / TBV as of 10/24/2025 P / Pro Forma TBV @ Close 1.22x 1.47x 1.74x Trading Multiple Differential 21% 43% 1.22x 7.7x
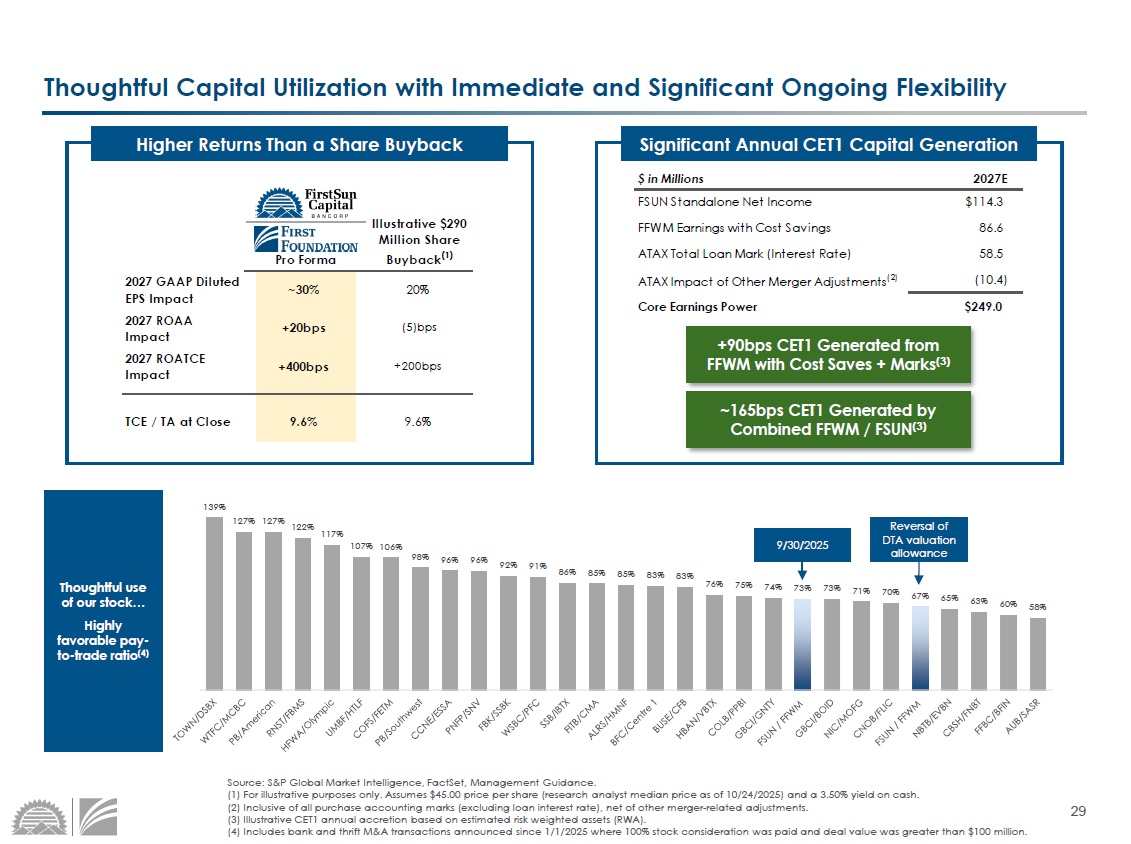
29 139% 127% 127% 122% 117% 107% 106% 98% 96% 96% 92% 91% 86% 85% 85% 83% 83% 76% 75% 74% 73% 73% 71% 70% 67% 65% 63% 60% 58% Source: S&P Global Market Intelligence, FactSet, Management Guidance. (1) For illustrative purposes only. Assumes $45.00 price per share (research analyst median price as of 10/24/2025) and a 3.5 0% yield on cash. (2) Inclusive of all purchase accounting marks (excluding loan interest rate), net of other merger - related adjustments. (3) Illustrative CET1 annual accretion based on estimated risk weighted assets (RWA). (4) Includes bank and thrift M&A transactions announced since 1/1/2025 where 100% stock consideration was paid and deal value wa s greater than $100 million. Thoughtful Capital Utilization with Immediate and Significant Ongoing Flexibility Pro Forma Illustrative $290 Million Share Buyback (1) 2027 GAAP Diluted EPS Impact ~30% 20% 2027 ROAA Impact +20bps (5)bps 2027 ROATCE Impact +400bps +200bps TCE / TA at Close 9.6% 9.6% Higher Returns Than a Share Buyback $ in Millions 2027E FSUN Standalone Net Income $114.3 FFWM Earnings with Cost Savings 86.6 ATAX Total Loan Mark (Interest Rate) 58.5 ATAX Impact of Other Merger Adjustments (2) (10.4) Core Earnings Power $249.0 Significant Annual CET1 Capital Generation +90 bps CET1 Generated from FFWM with Cost Saves + Marks (3) ~165bps CET1 Generated by Combined FFWM / FSUN (3) Reversal of DTA valuation allowance 9/30/2025 Thoughtful use of our stock… Highly favorable pay - to - trade ratio (4)
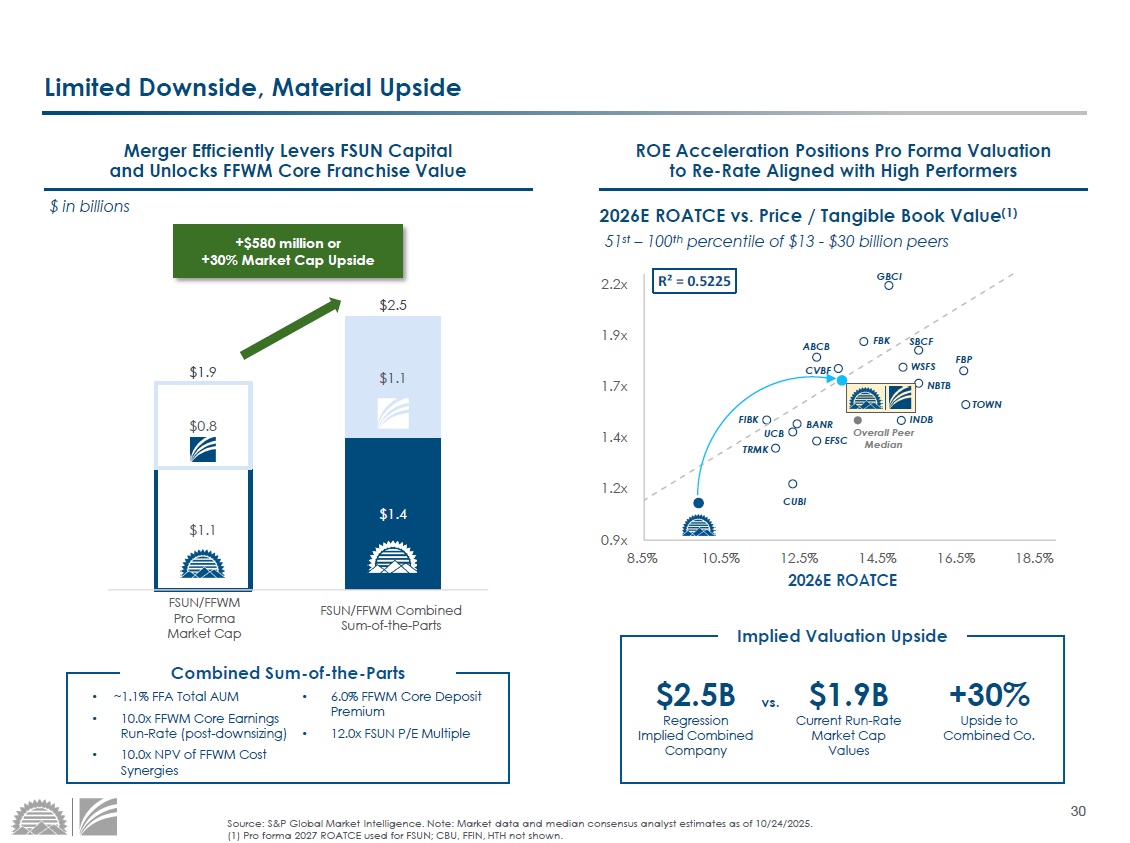
30 ABCB SBCF GBCI FBP EFSC TRMK CUBI WSFS FBK FIBK BANR NBTB UCB TOWN CVBF INDB Overall Peer Median R² = 0.5225 0.9x 1.2x 1.4x 1.7x 1.9x 2.2x 8.5% 10.5% 12.5% 14.5% 16.5% 18.5% Source: S&P Global Market Intelligence. Note: Market data and median consensus analyst estimates as of 10/24/2025. (1) Pro forma 2027 ROATCE used for FSUN; CBU, FFIN, HTH not shown. Limited Downside, Material Upside 2026E ROATCE vs. Price / Tangible Book Value (1) 51 st – 100 th percentile of $13 - $30 billion peers ROE Acceleration Positions Pro Forma Valuation to Re - Rate Aligned with High Performers 2026E ROATCE $1.1 $1.4 $0.8 $1.1 $1.9 $2.5 1 3 Implied Valuation Upside $2.5B Regression Implied Combined Company $1.9B Current Run - Rate Market Cap Values +30% Upside to Combined Co. vs. Merger Efficiently Levers FSUN Capital and Unlocks FFWM Core Franchise Value +$580 million or +30% Market Cap Upside FSUN/FFWM Combined Sum - of - the - Parts FSUN/FFWM Pro Forma Market Cap Combined Sum - of - the - Parts • ~1.1% FFA Total AUM • 10.0x FFWM Core Earnings Run - Rate (post - downsizing) • 10.0x NPV of FFWM Cost Synergies • 6.0% FFWM Core Deposit Premium • 12.0x FSUN P/E Multiple $ in billions
31 = VI. Key Financial Impacts & Model Review
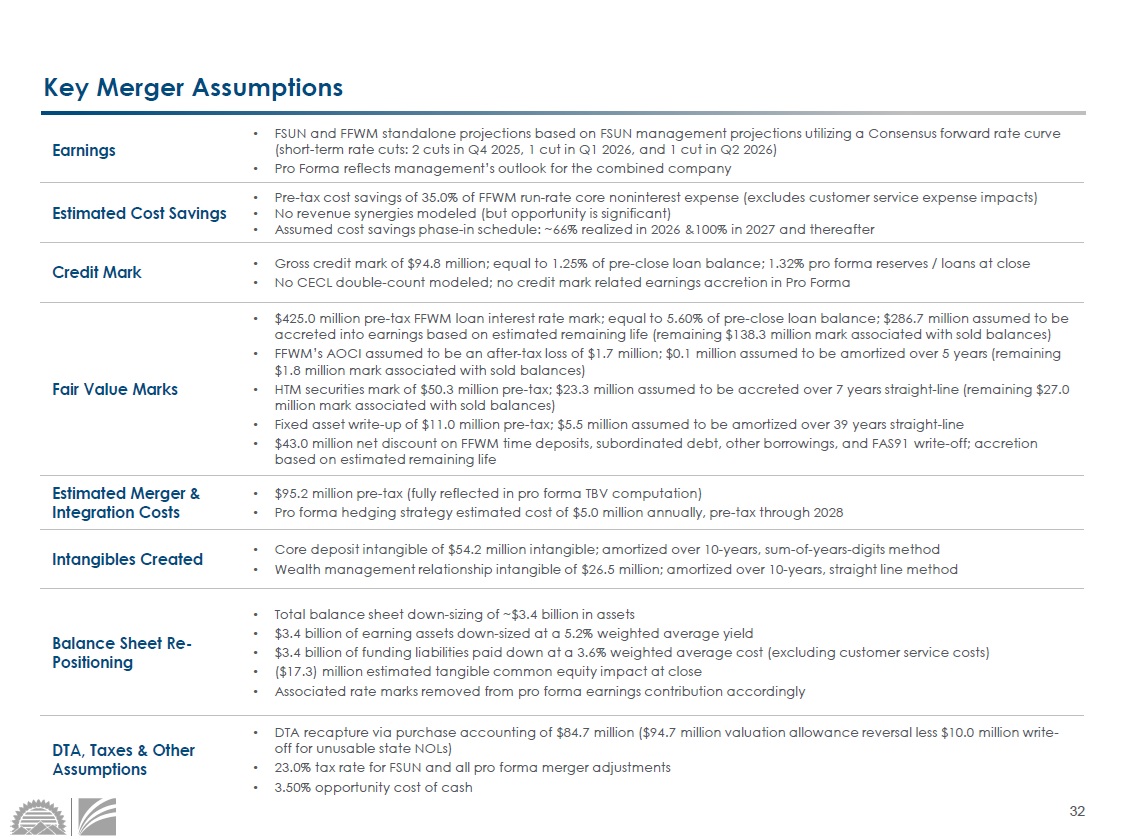
32 DTA, Taxes & Other Assumptions • DTA recapture via purchase accounting of $84.7 million ($94.7 million valuation allowance reversal less $10.0 million write - off for unusable state NOLs) • 23.0% tax rate for FSUN and all pro forma merger adjustments • 3.50% opportunity cost of cash Key Merger Assumptions Earnings • FSUN and FFWM standalone projections based on FSUN management projections utilizing a Consensus forward rate curve (short - term rate cuts: 2 cuts in Q4 2025, 1 cut in Q1 2026, and 1 cut in Q2 2026) • Pro Forma reflects management’s outlook for the combined company Estimated Cost Savings • Pre - tax cost savings of 35.0% of FFWM run - rate core noninterest expense (excludes customer service expense impacts) • No revenue synergies modeled (but opportunity is significant) • Assumed cost savings phase - in schedule: ~66% realized in 2026 &100% in 2027 and thereafter Fair Value Marks • $425.0 million pre - tax FFWM loan interest rate mark; equal to 5.60% of pre - close loan balance; $286.7 million assumed to be accreted into earnings based on estimated remaining life (remaining $138.3 million mark associated with sold balances) • FFWM’s AOCI assumed to be an after - tax loss of $1.7 million; $0.1 million assumed to be amortized over 5 years (remaining $1.8 million mark associated with sold balances) • HTM securities mark of $50.3 million pre - tax; $23.3 million assumed to be accreted over 7 years straight - line (remaining $27.0 million mark associated with sold balances) • Fixed asset write - up of $11.0 million pre - tax; $5.5 million assumed to be amortized over 39 years straight - line • $43.0 million net discount on FFWM time deposits, subordinated debt, other borrowings, and FAS91 write - off; accretion based on estimated remaining life Credit Mark • Gross credit mark of $94.8 million; equal to 1.25% of pre - close loan balance; 1.32% pro forma reserves / loans at close • No CECL double - count modeled; no credit mark related earnings accretion in Pro Forma Estimated Merger & Integration Costs • $95.2 million pre - tax (fully reflected in pro forma TBV computation) • Pro forma hedging strategy estimated cost of $5.0 million annually, pre - tax through 2028 Balance Sheet Re - Positioning • Total balance sheet down - sizing of ~$3.4 billion in assets • $3.4 billion of earning assets down - sized at a 5.2% weighted average yield • $3.4 billion of funding liabilities paid down at a 3.6% weighted average cost (excluding customer service costs) • ($17.3) million estimated tangible common equity impact at close • Associated rate marks removed from pro forma earnings contribution accordingly Intangibles Created • Core deposit intangible of $54.2 million intangible; amortized over 10 - years, sum - of - years - digits method • Wealth management relationship intangible of $26.5 million; amortized over 10 - years, straight line method
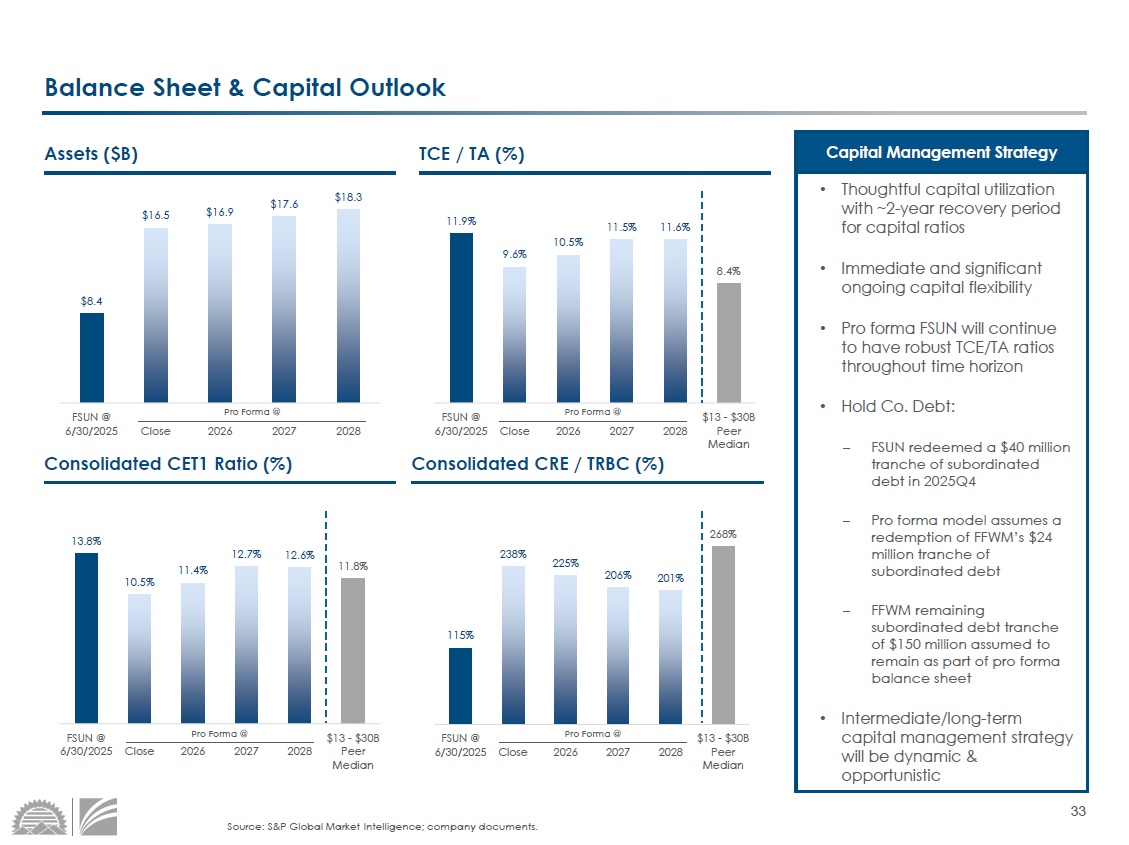
33 115% 238% 225% 206% 201% 268% FSUN @ 6/30/2025 Close 2026 2027 2028 $13 - $30B Peer Median 11.9% 9.6% 10.5% 11.5% 11.6% 8.4% FSUN @ 6/30/2025 Close 2026 2027 2028 $13 - $30B Peer Median $8.4 $16.5 $16.9 $17.6 $18.3 FSUN @ 6/30/2025 Close 2026 2027 2028 Assets ($B) TCE / TA (%) Consolidated CET1 Ratio (%) Consolidated CRE / TRBC (%) Source: S&P Global Market Intelligence; company documents. Balance Sheet & Capital Outlook Pro Forma @ Pro Forma @ • Thoughtful capital utilization with ~2 - year recovery period for capital ratios • Immediate and significant ongoing capital flexibility • Pro forma FSUN will continue to have robust TCE/TA ratios throughout time horizon • Hold Co. Debt: – FSUN redeemed a $40 million tranche of subordinated debt in 2025Q4 – Pro forma model assumes a redemption of FFWM’s $24 million tranche of subordinated debt – FFWM remaining subordinated debt tranche of $150 million assumed to remain as part of pro forma balance sheet • Intermediate/long - term capital management strategy will be dynamic & opportunistic Capital Management Strategy Pro Forma @ Pro Forma @ 13.8% 10.5% 11.4% 12.7% 12.6% 11.8% FSUN @ 6/30/2025 Close 2026 2027 2028 $13 - $30B Peer Median
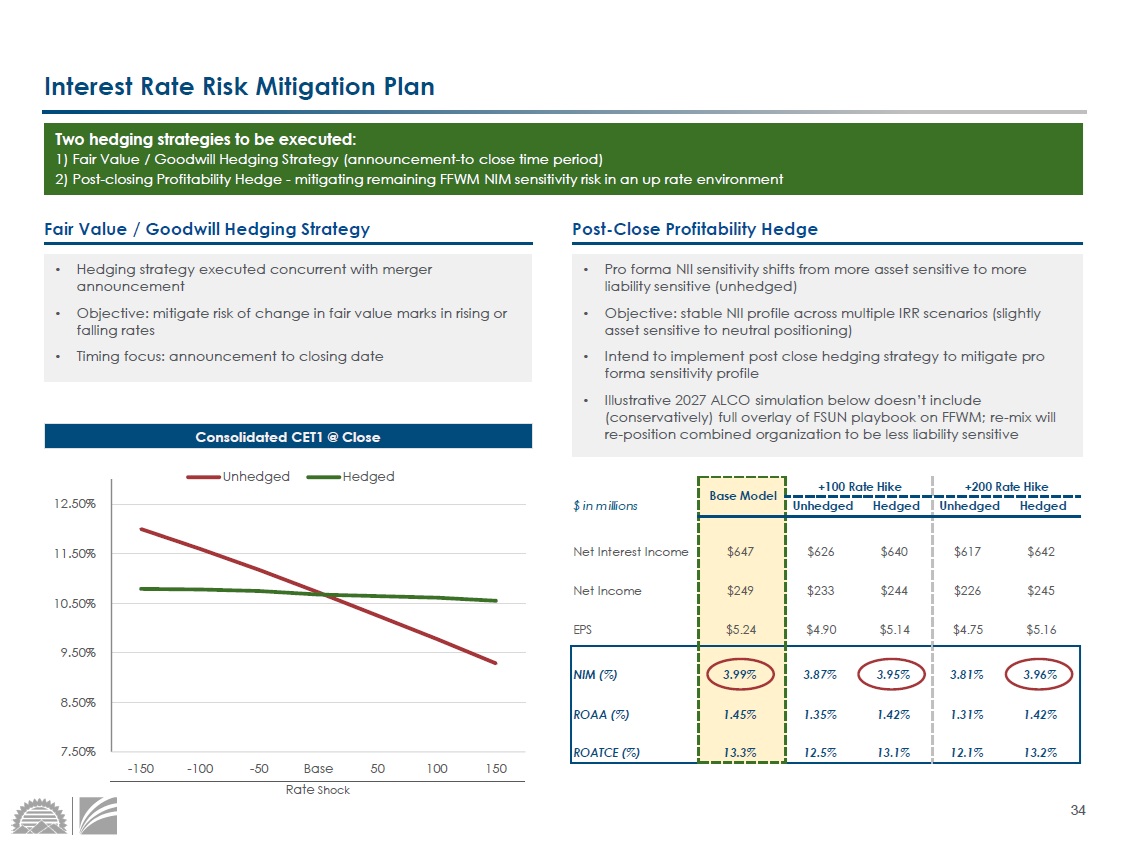
34 Interest Rate Risk Mitigation Plan Fair Value / Goodwill Hedging Strategy Post - Close Profitability Hedge • Pro forma NII sensitivity shifts from more asset sensitive to more liability sensitive (unhedged) • Objective: stable NII profile across multiple IRR scenarios (slightly asset sensitive to neutral positioning) • Intend to implement post close hedging strategy to mitigate pro forma sensitivity profile • Illustrative 2027 ALCO simulation below doesn’t include (conservatively) full overlay of FSUN playbook on FFWM; re - mix will re - position combined organization to be less liability sensitive • Hedging strategy executed concurrent with merger announcement • Objective: mitigate risk of change in fair value marks in rising or falling rates • Timing focus: announcement to closing date Consolidated CET1 @ Close 7.50% 8.50% 9.50% 10.50% 11.50% 12.50% -150 -100 -50 Base 50 100 150 Unhedged Hedged Rate Shock +100 Rate Hike +200 Rate Hike $ in millions Unhedged Hedged Unhedged Hedged Net Interest Income $647 $626 $640 $617 $642 Net Income $249 $233 $244 $226 $245 EPS $5.24 $4.90 $5.14 $4.75 $5.16 NIM (%) 3.99% 3.87% 3.95% 3.81% 3.96% ROAA (%) 1.45% 1.35% 1.42% 1.31% 1.42% ROATCE (%) 13.3% 12.5% 13.1% 12.1% 13.2% Base Model Two hedging strategies to be executed: 1) Fair Value / Goodwill Hedging Strategy (announcement - to close time period) 2) Post - closing Profitability Hedge - mitigating remaining FFWM NIM sensitivity risk in an up rate environment
35 = VII. Integration & Due Diligence
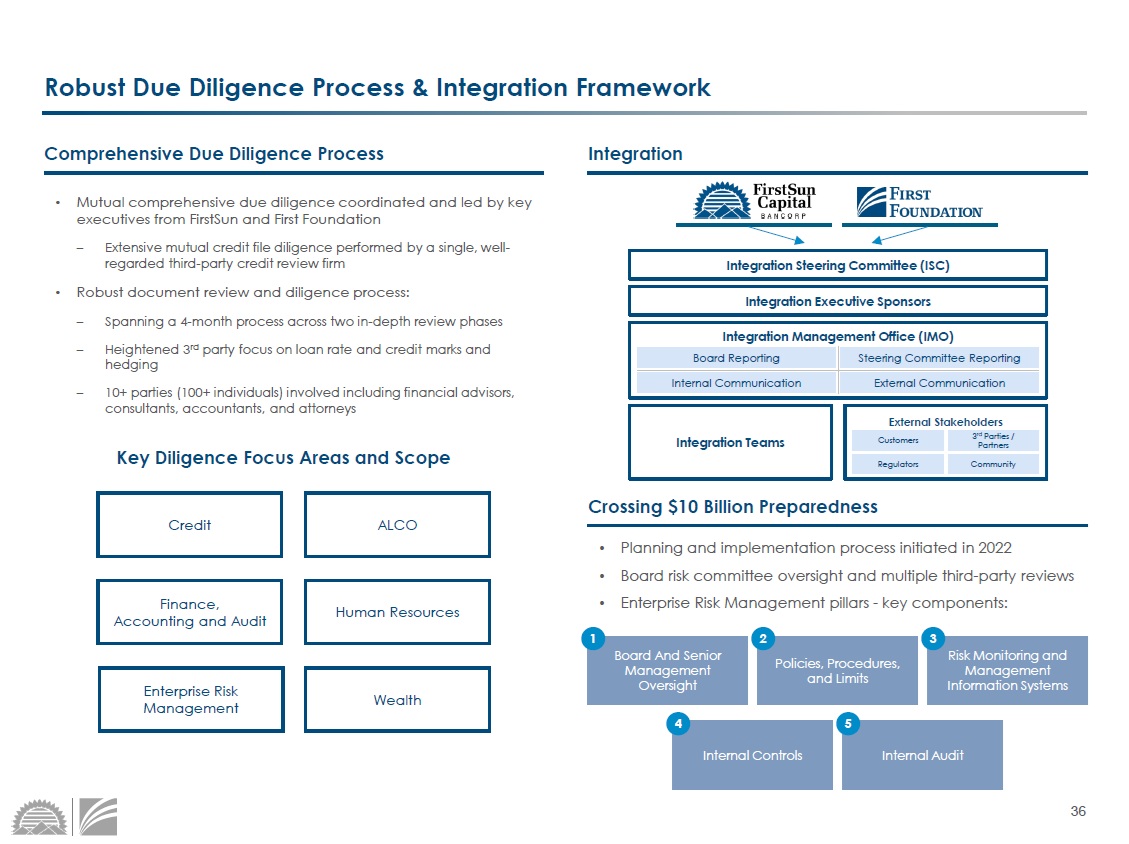
36 Robust Due Diligence Process & Integration Framework Comprehensive Due Diligence Process • Mutual comprehensive due diligence coordinated and led by key executives from FirstSun and First Foundation – Extensive mutual credit file diligence performed by a single, well - regarded third - party credit review firm • Robust document review and diligence process: – Spanning a 4 - month process across two in - depth review phases – Heightened 3 rd party focus on loan rate and credit marks and hedging – 10+ parties (100+ individuals) involved including financial advisors, consultants, accountants, and attorneys • Planning and implementation process initiated in 2022 • Board risk committee oversight and multiple third - party reviews • Enterprise Risk Management pillars - key components: Crossing $10 Billion Preparedness Board And Senior Management Oversight Policies, Procedures, and Limits Risk Monitoring and Management Information Systems Internal Controls Internal Audit Integration Integration Steering Committee (ISC) Integration Management Office (IMO) Internal Communication Board Reporting Steering Committee Reporting External Communication Integration Executive Sponsors 1 2 3 5 4 Key Diligence Focus Areas and Scope Credit ALCO Enterprise Risk Management Finance, Accounting and Audit Human Resources Wealth Integration Teams External Stakeholders Regulators Community Customers 3 rd Parties / Partners
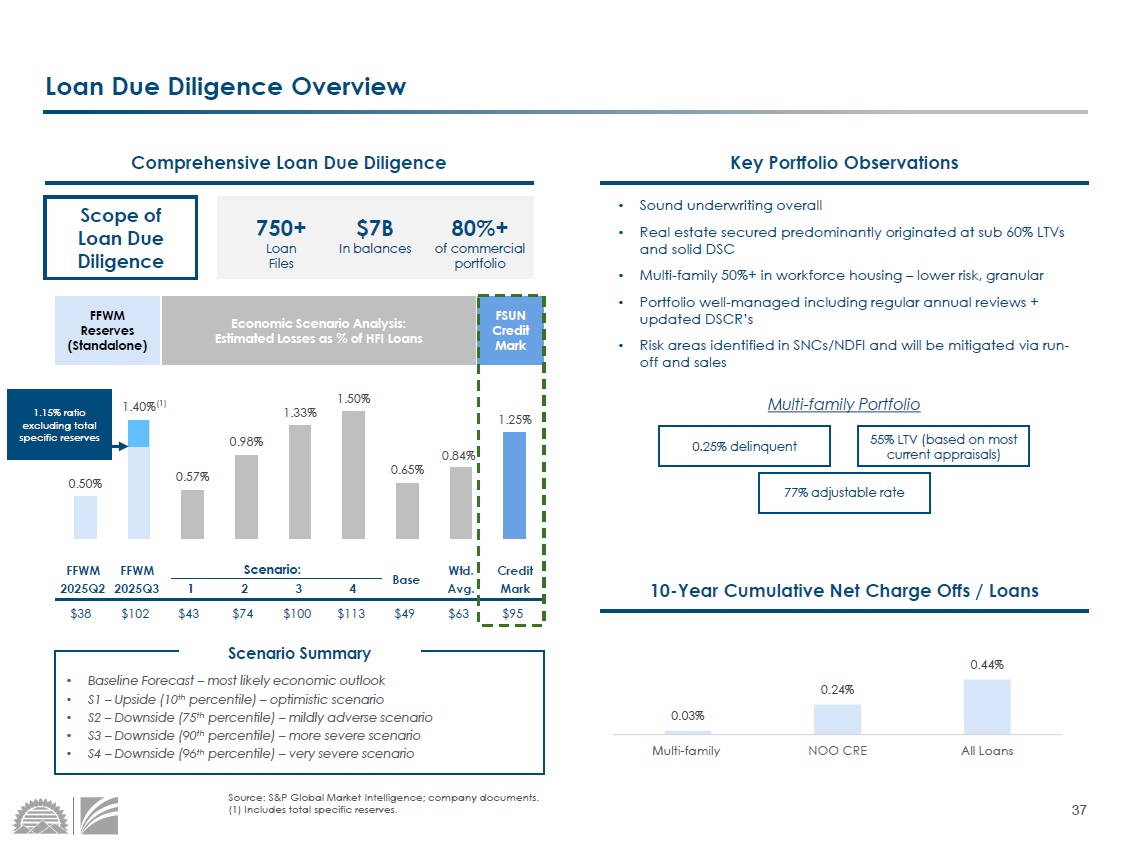
37 0.03% 0.24% 0.44% Multi-family NOO CRE All Loans Source: S&P Global Market Intelligence; company documents. (1) Includes total specific reserves. Loan Due Diligence Overview Multi - family Portfolio Scope of Loan Due Diligence • Sound underwriting overall • Real estate secured predominantly originated at sub 60% LTVs and solid DSC • Multi - family 50%+ in workforce housing – lower risk, granular • Portfolio well - managed including regular annual reviews + updated DSCR’s • Risk areas identified in SNCs/NDFI and will be mitigated via run - off and sales Comprehensive Loan Due Diligence 10 - Year Cumulative Net Charge Offs / Loans Key Portfolio Observations 0.25% delinquent 55% LTV (based on most current appraisals) 77% adjustable rate FFWM Reserves (Standalone) Economic Scenario Analysis: Estimated Losses as % of HFI Loans FSUN Credit Mark FFWM 2025Q2 FFWM 2025Q3 1 2 3 4 Base Wtd. Avg. Credit Mark $38 $102 $43 $74 $100 $113 $49 $63 $95 0.50% 1.40% 0.57% 0.98% 1.33% 1.50% 0.65% 0.84% 1.25% Scenario: 750+ Loan Files $7B In balances 80%+ of commercial portfolio (1) • Baseline Forecast – most likely economic outlook • S1 – Upside (10 th percentile) – optimistic scenario • S2 – Downside (75 th percentile) – mildly adverse scenario • S3 – Downside (90 th percentile) – more severe scenario • S4 – Downside (96 th percentile) – very severe scenario Scenario Summary 1.15% ratio excluding total specific reserves
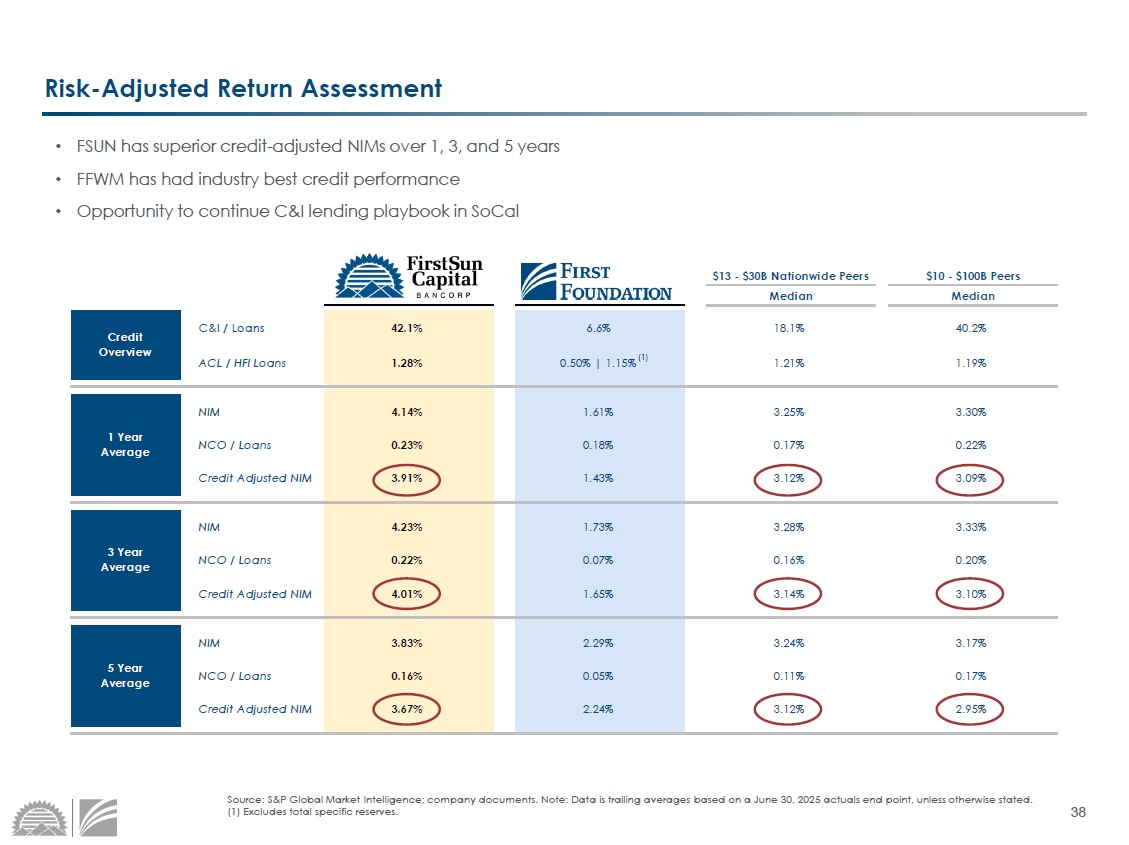
38 $13 - $30B Nationwide Peers $10 - $100B Peers Median Median C&I / Loans 42.1% 6.6% 18.1% 40.2% ACL / HFI Loans 1.28% 0.50% | 1.15% 1.21% 1.19% NIM 4.14% 1.61% 3.25% 3.30% NCO / Loans 0.23% 0.18% 0.17% 0.22% Credit Adjusted NIM 3.91% 1.43% 3.12% 3.09% NIM 4.23% 1.73% 3.28% 3.33% NCO / Loans 0.22% 0.07% 0.16% 0.20% Credit Adjusted NIM 4.01% 1.65% 3.14% 3.10% NIM 3.83% 2.29% 3.24% 3.17% NCO / Loans 0.16% 0.05% 0.11% 0.17% Credit Adjusted NIM 3.67% 2.24% 3.12% 2.95% Credit Overview 1 Year Average 3 Year Average 5 Year Average Source: S&P Global Market Intelligence; company documents. Note: Data is trailing averages based on a June 30, 2025 actuals e nd point, unless otherwise stated. (1) Excludes total specific reserves. Risk - Adjusted Return Assessment • FSUN has superior credit - adjusted NIMs over 1, 3, and 5 years • FFWM has had industry best credit performance • Opportunity to continue C&I lending playbook in SoCal (1)

39 = VIII. Conclusion
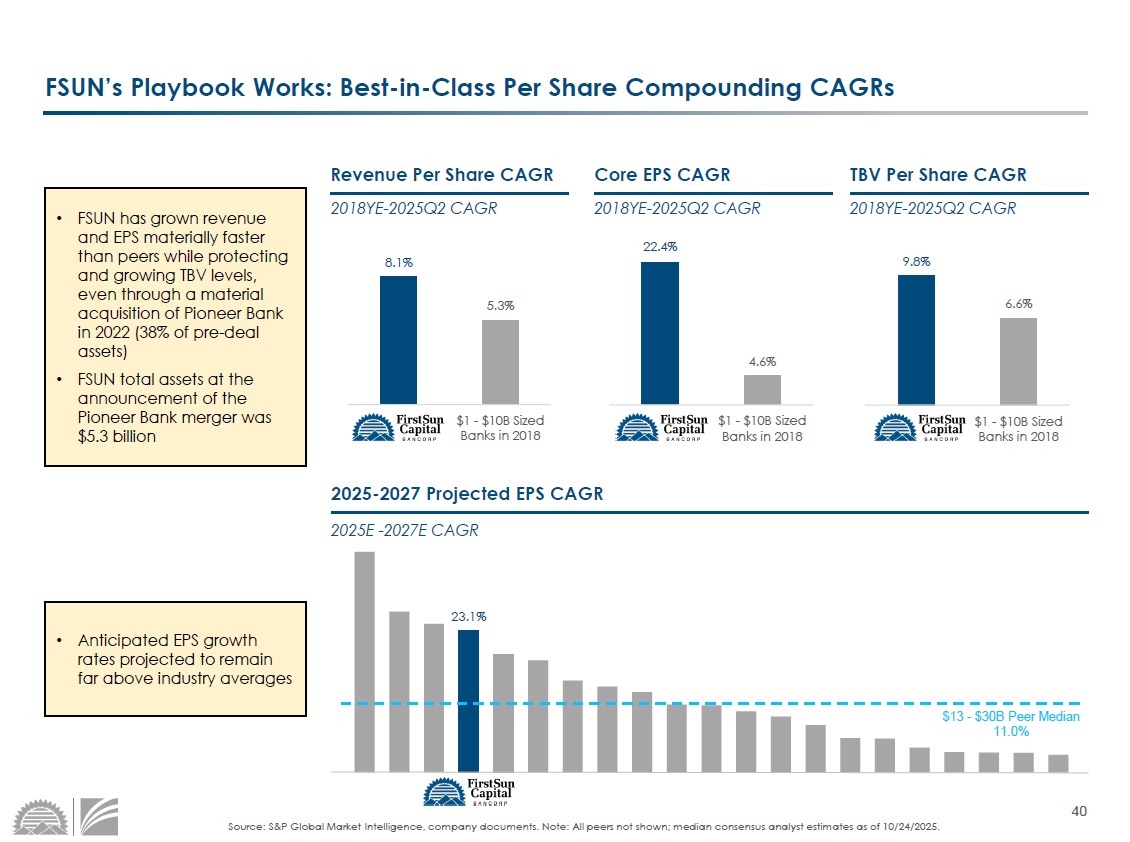
40 8.1% 5.3% $1 - $10B Sized Banks in 2018 9.8% 6.6% $1 - $10B Sized Banks in 2018 22.4% 4.6% $1 - $10B Sized Banks in 2018 TBV Per Share CAGR Source: S&P Global Market Intelligence, company documents. Note: All peers not shown; median consensus analyst estimates as o f 1 0/24/2025. Revenue Per Share CAGR 23.1% Core EPS CAGR FSUN’s Playbook Works: Best - in - Class Per Share Compounding CAGRs • FSUN has grown revenue and EPS materially faster than peers while protecting and growing TBV levels, even through a material acquisition of Pioneer Bank in 2022 (38% of pre - deal assets) • FSUN total assets at the announcement of the Pioneer Bank merger was $5.3 billion • Anticipated EPS growth rates projected to remain far above industry averages 2018YE - 2025Q2 CAGR 2018YE - 2025Q2 CAGR 2018YE - 2025Q2 CAGR 2025 - 2027 Projected EPS CAGR $13 - $30B Peer Median 11.0% 2025E - 2027E CAGR
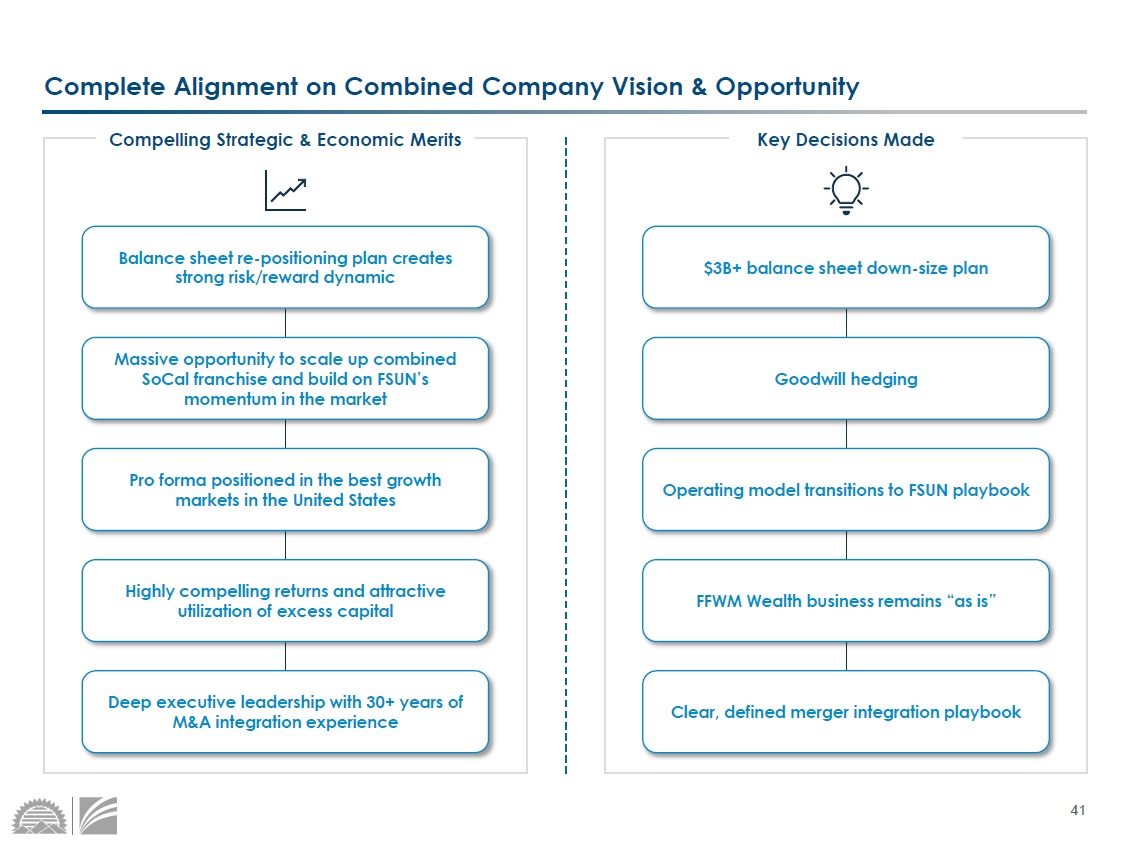
41 Complete Alignment on Combined Company Vision & Opportunity Compelling Strategic & Economic Merits Key Decisions Made $3B+ balance sheet down - size plan Goodwill hedging Operating model transitions to FSUN playbook FFWM Wealth business remains “as is” Clear, defined merger integration playbook Balance sheet re - positioning plan creates strong risk/reward dynamic Massive opportunity to scale up combined SoCal franchise and build on FSUN’s momentum in the market Pro forma positioned in the best growth markets in the United States Highly compelling returns and attractive utilization of excess capital Deep executive leadership with 30+ years of M&A integration experience

42 = Appendix IX.
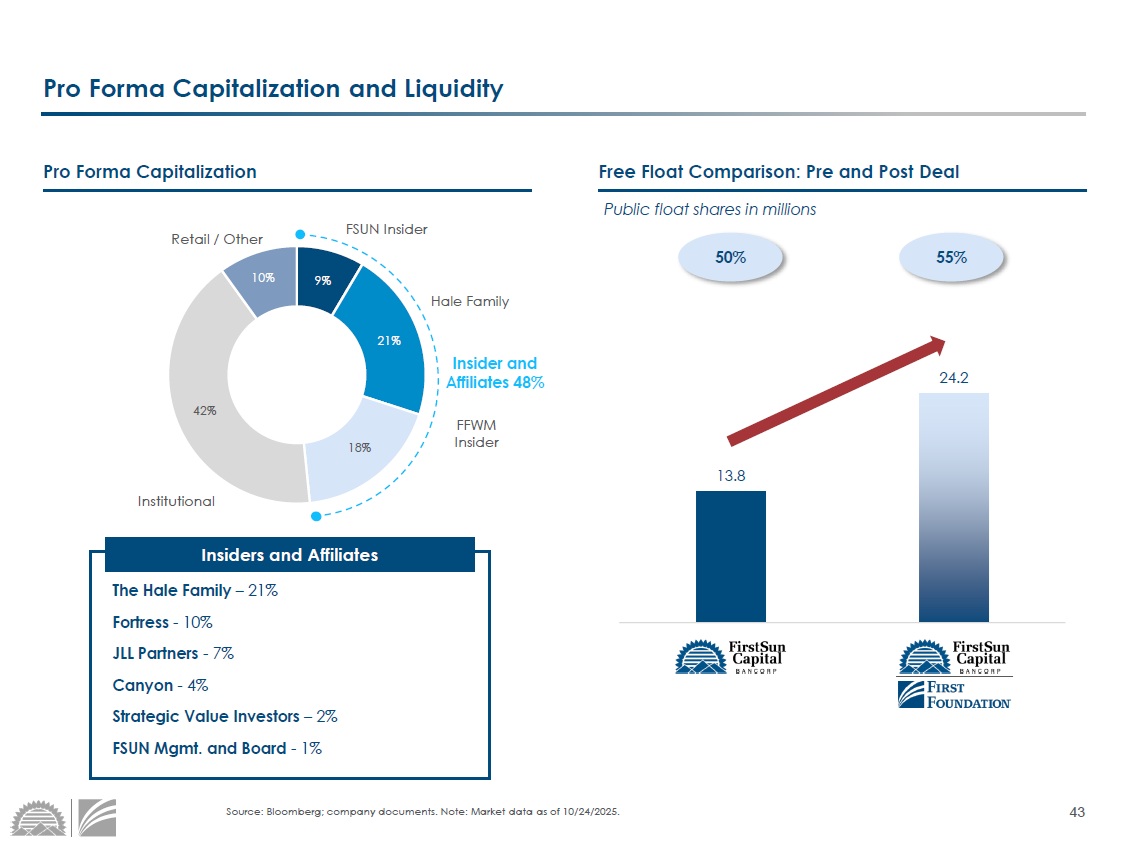
43 Source: Bloomberg; company documents. Note: Market data as of 10/24/2025. Pro Forma Capitalization and Liquidity Pro Forma Capitalization Free Float Comparison: Pre and Post Deal 13.8 24.2 Public Float Pro Forma Public Float Public float shares in millions 9% 21% 18% 42% 10% Retail / Other Institutional FFWM Insider FSUN Insider Insiders and Affiliates Insider and Affiliates 48% Hale Family The Hale Family – 21% Fortress - 10% JLL Partners - 7% Canyon - 4% Strategic Value Investors – 2% FSUN Mgmt. and Board - 1% 50% 55%
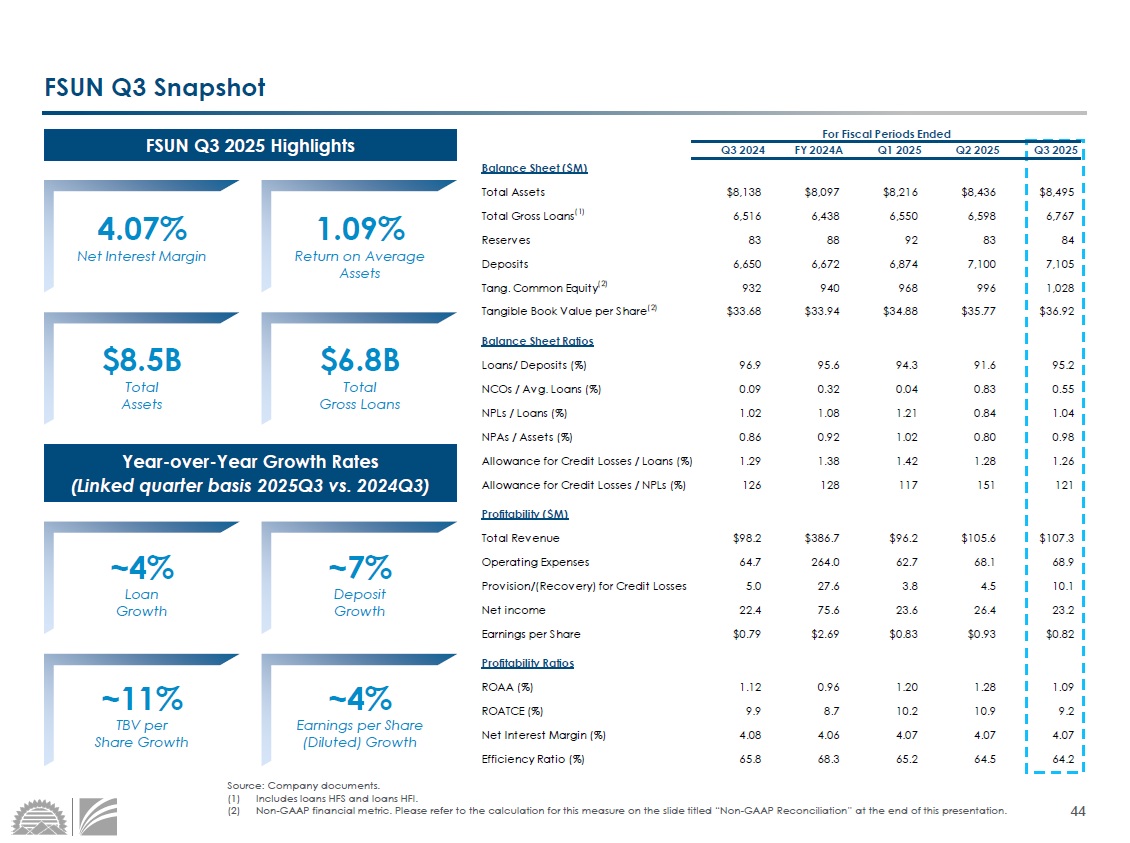
44 Source: Company documents. (1) Includes loans HFS and loans HFI. (2) Non - GAAP financial metric. Please refer to the calculation for this measure on the slide titled “Non - GAAP Reconciliation” at the end of this presentation. FSUN Q3 2025 Highlights 1.09% Return on Average Assets $ 8.5 B Total Assets $6.8B Total Gross Loans 4.07% Net Interest Margin Year - over - Year Growth Rates (Linked quarter basis 2025Q3 vs. 2024Q3) ~4% Loan Growth ~11% TBV per Share Growth ~7% Deposit Growth ~4% Earnings per Share (Diluted) Growth For Fiscal Periods Ended Q3 2024 FY 2024A Q1 2025 Q2 2025 Q3 2025 Balance Sheet ($M) Total Assets $8,138 $8,097 $8,216 $8,436 $8,495 Total Gross Loans (1) 6,516 6,438 6,550 6,598 6,767 Reserves 83 88 92 83 84 Deposits 6,650 6,672 6,874 7,100 7,105 Tang. Common Equity (2) 932 940 968 996 1,028 Tangible Book Value per Share (2) $33.68 $33.94 $34.88 $35.77 $36.92 Balance Sheet Ratios Loans/ Deposits (%) 96.9 95.6 94.3 91.6 95.2 NCOs / Avg. Loans (%) 0.09 0.32 0.04 0.83 0.55 NPLs / Loans (%) 1.02 1.08 1.21 0.84 1.04 NPAs / Assets (%) 0.86 0.92 1.02 0.80 0.98 Allowance for Credit Losses / Loans (%) 1.29 1.38 1.42 1.28 1.26 Allowance for Credit Losses / NPLs (%) 126 128 117 151 121 Profitability ($M) Total Revenue $98.2 $386.7 $96.2 $105.6 $107.3 Operating Expenses 64.7 264.0 62.7 68.1 68.9 Provision/(Recovery) for Credit Losses 5.0 27.6 3.8 4.5 10.1 Net income 22.4 75.6 23.6 26.4 23.2 Earnings per Share $0.79 $2.69 $0.83 $0.93 $0.82 Profitability Ratios ROAA (%) 1.12 0.96 1.20 1.28 1.09 ROATCE (%) 9.9 8.7 10.2 10.9 9.2 Net Interest Margin (%) 4.08 4.06 4.07 4.07 4.07 Efficiency Ratio (%) 65.8 68.3 65.2 64.5 64.2 FSUN Q3 Snapshot
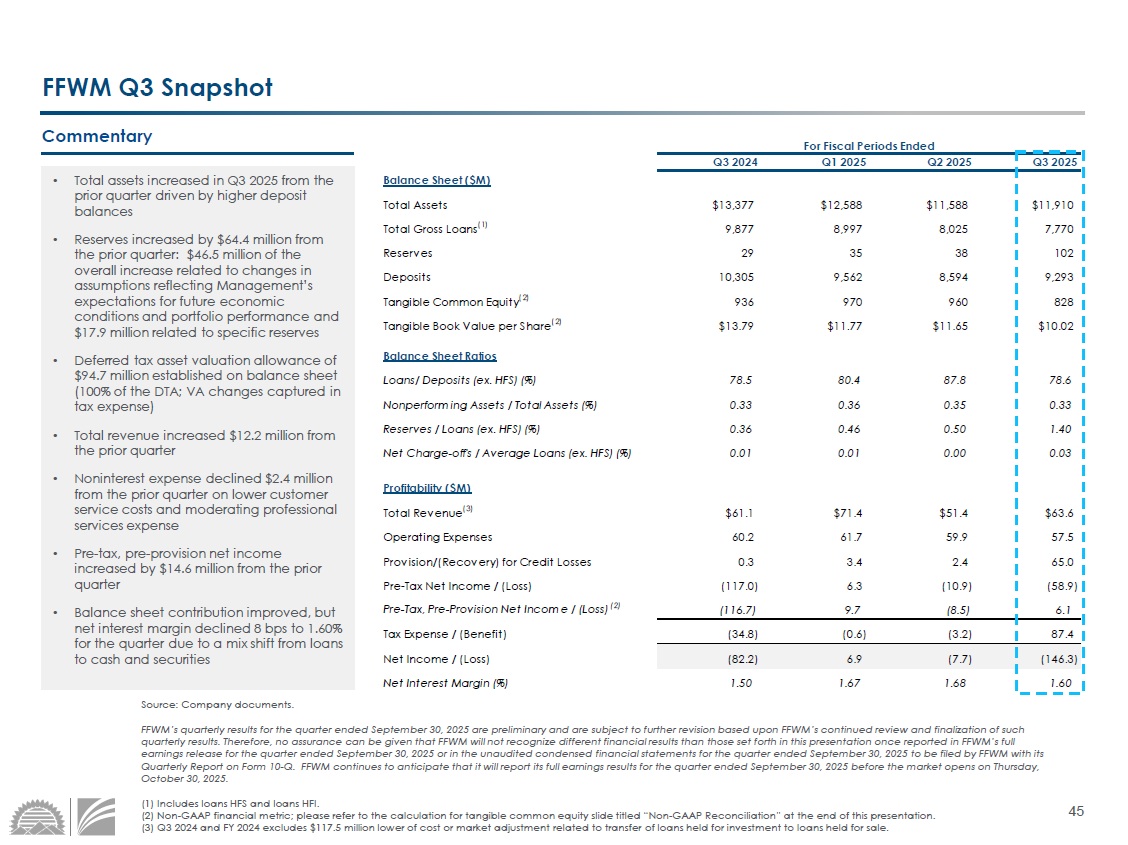
45 For Fiscal Periods Ended Q3 2024 Q1 2025 Q2 2025 Q3 2025 Balance Sheet ($M) Total Assets $13,377 $12,588 $11,588 $11,910 Total Gross Loans (1) 9,877 8,997 8,025 7,770 Reserves 29 35 38 102 Deposits 10,305 9,562 8,594 9,293 Tangible Common Equity (2) 936 970 960 828 Tangible Book Value per Share (2) $13.79 $11.77 $11.65 $10.02 Balance Sheet Ratios Loans/ Deposits (ex. HFS) (%) 78.5 80.4 87.8 78.6 Nonperforming Assets / Total Assets (%) 0.33 0.36 0.35 0.33 Reserves / Loans (ex. HFS) (%) 0.36 0.46 0.50 1.40 Net Charge-off's / Average Loans (ex. HFS) (%) 0.01 0.01 0.00 0.03 Profitability ($M) Total Revenue (3) $61.1 $71.4 $51.4 $63.6 Operating Expenses 60.2 61.7 59.9 57.5 Provision/(Recovery) for Credit Losses 0.3 3.4 2.4 65.0 Pre-Tax Net Income / (Loss) (117.0) 6.3 (10.9) (58.9) Pre-Tax, Pre-Provision Net Income / (Loss) (2) (116.7) 9.7 (8.5) 6.1 Tax Expense / (Benefit) (34.8) (0.6) (3.2) 87.4 Net Income / (Loss) (82.2) 6.9 (7.7) (146.3) Net Interest Margin (%) 1.50 1.67 1.68 1.60 Source: Company documents. FFWM’s quarterly results for the quarter ended September 30, 2025 are preliminary and are subject to further revision based u pon FFWM’s continued review and finalization of such quarterly results. Therefore, no assurance can be given that FFWM will not recognize different financial results than those s et forth in this presentation once reported in FFWM’s full earnings release for the quarter ended September 30, 2025 or in the unaudited condensed financial statements for the quarter end ed September 30, 2025 to be filed by FFWM with its Quarterly Report on Form 10 - Q. FFWM continues to anticipate that it will report its full earnings results for the quarter ended September 30, 2025 before the market opens on Thursday, October 30, 2025. (1) Includes loans HFS and loans HFI. (2) Non - GAAP financial metric; please refer to the calculation for tangible common equity slide titled “Non - GAAP Reconciliation” at the end of this presentation. (3) Q3 2024 and FY 2024 excludes $117.5 million lower of cost or market adjustment related to transfer of loans held for inve stm ent to loans held for sale. FFWM Q3 Snapshot • Total assets increased in Q3 2025 from the prior quarter driven by higher deposit balances • Reserves increased by $64.4 million from the prior quarter: $46.5 million of the overall increase related to changes in assumptions reflecting Management’s expectations for future economic conditions and portfolio performance and $17.9 million related to specific reserves • Deferred tax asset valuation allowance of $94.7 million established on balance sheet (100% of the DTA; VA changes captured in tax expense) • Total revenue increased $12.2 million from the prior quarter • Noninterest expense declined $2.4 million from the prior quarter on lower customer service costs and moderating professional services expense • Pre - tax, pre - provision net income increased by $14.6 million from the prior quarter • Balance sheet contribution improved, but net interest margin declined 8 bps to 1.60% for the quarter due to a mix shift from loans to cash and securities Commentary
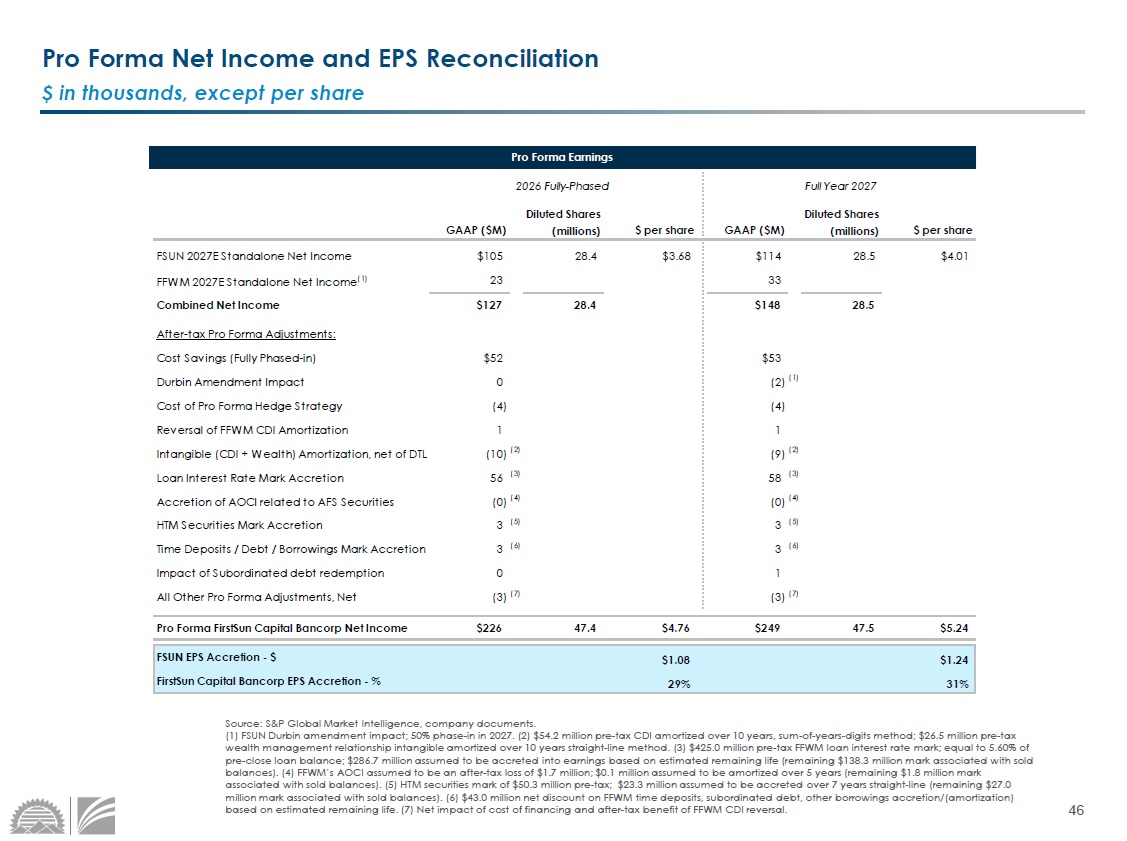
46 Source: S&P Global Market Intelligence, company documents. (1) FSUN Durbin amendment impact; 50% phase - in in 2027. (2) $54.2 million pre - tax CDI amortized over 10 years, sum - of - years - digi ts method; $26.5 million pre - tax wealth management relationship intangible amortized over 10 years straight - line method. (3) $425.0 million pre - tax FFWM loan int erest rate mark; equal to 5.60% of pre - close loan balance; $286.7 million assumed to be accreted into earnings based on estimated remaining life (remaining $138.3 million mark associated with sold balances). (4) FFWM’s AOCI assumed to be an after - tax loss of $1.7 million; $0.1 million assumed to be amortized over 5 years (r emaining $1.8 million mark associated with sold balances). (5) HTM securities mark of $50.3 million pre - tax; $23.3 million assumed to be accreted over 7 y ears straight - line (remaining $27.0 million mark associated with sold balances). (6) $43.0 million net discount on FFWM time deposits, subordinated debt, other b orr owings accretion/(amortization) based on estimated remaining life. (7) Net impact of cost of financing and after - tax benefit of FFWM CDI reversal. $ in thousands, except per share Pro Forma Net Income and EPS Reconciliation Pro Forma Earnings 2026 Fully-Phased Full Year 2027 GAAP ($M) $ per share GAAP ($M) $ per share FSUN 2027E Standalone Net Income $105 28.4 $3.68 $114 28.5 $4.01 FFWM 2027E Standalone Net Income (1) 23 33 Combined Net Income $127 28.4 $148 28.5 After-tax Pro Forma Adjustments: Cost Savings (Fully Phased-in) $52 $53 Durbin Amendment Impact 0 (2) (1) Cost of Pro Forma Hedge Strategy (4) (4) Reversal of FFWM CDI Amortization 1 1 Intangible (CDI + Wealth) Amortization, net of DTL (10) (2) (9) (2) Loan Interest Rate Mark Accretion 56 (3) 58 (3) Accretion of AOCI related to AFS Securities (0) (4) (0) (4) HTM Securities Mark Accretion 3 (5) 3 (5) Time Deposits / Debt / Borrowings Mark Accretion 3 (6) 3 (6) Impact of Subordinated debt redemption 0 1 All Other Pro Forma Adjustments, Net (3) (7) (3) (7) Pro Forma FirstSun Capital Bancorp Net Income $226 47.4 $4.76 $249 47.5 $5.24 FSUN EPS Accretion - $ $1.08 $1.24 FirstSun Capital Bancorp EPS Accretion - % 29% 31% Diluted Shares (millions) Diluted Shares (millions)
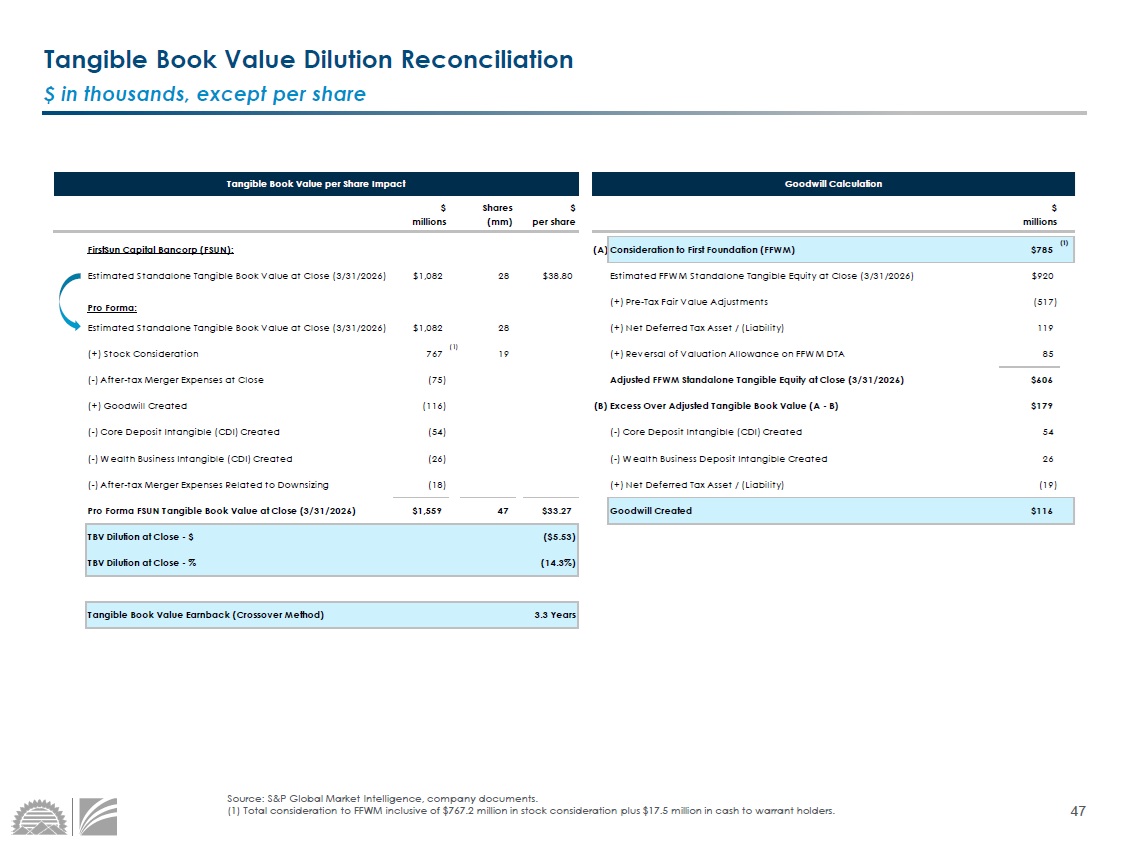
47 Source: S&P Global Market Intelligence, company documents. (1) Total consideration to FFWM inclusive of $767.2 million in stock consideration plus $17.5 million in cash to warrant hold ers . $ in thousands, except per share Tangible Book Value Dilution Reconciliation Tangible Book Value per Share Impact Goodwill Calculation $ millions Shares (mm) $ per share $ millions FirstSun Capital Bancorp (FSUN): (A)Consideration to First Foundation (FFWM) $785 (1) Estimated Standalone Tangible Book Value at Close (3/31/2026) $1,082 28 $38.80 Estimated FFWM Standalone Tangible Equity at Close (3/31/2026) $920 Pro Forma: (+) Pre-Tax Fair Value Adjustments (517) Estimated Standalone Tangible Book Value at Close (3/31/2026) $1,082 28 (+) Net Deferred Tax Asset / (Liability) 119 (+) Stock Consideration 767 (1) 19 (+) Reversal of Valuation Allowance on FFWM DTA 85 (-) After-tax Merger Expenses at Close (75) Adjusted FFWM Standalone Tangible Equity at Close (3/31/2026) $606 (+) Goodwill Created (116) (B)Excess Over Adjusted Tangible Book Value (A - B) $179 (-) Core Deposit Intangible (CDI) Created (54) (-) Core Deposit Intangible (CDI) Created 54 (-) Wealth Business Intangible (CDI) Created (26) (-) Wealth Business Deposit Intangible Created 26 (-) After-tax Merger Expenses Related to Downsizing (18) (+) Net Deferred Tax Asset / (Liability) (19) Pro Forma FSUN Tangible Book Value at Close (3/31/2026) $1,559 47 $33.27 Goodwill Created $116 TBV Dilution at Close - $ ($5.53) TBV Dilution at Close - % (14.3%) Tangible Book Value Earnback (Crossover Method) 3.3 Years
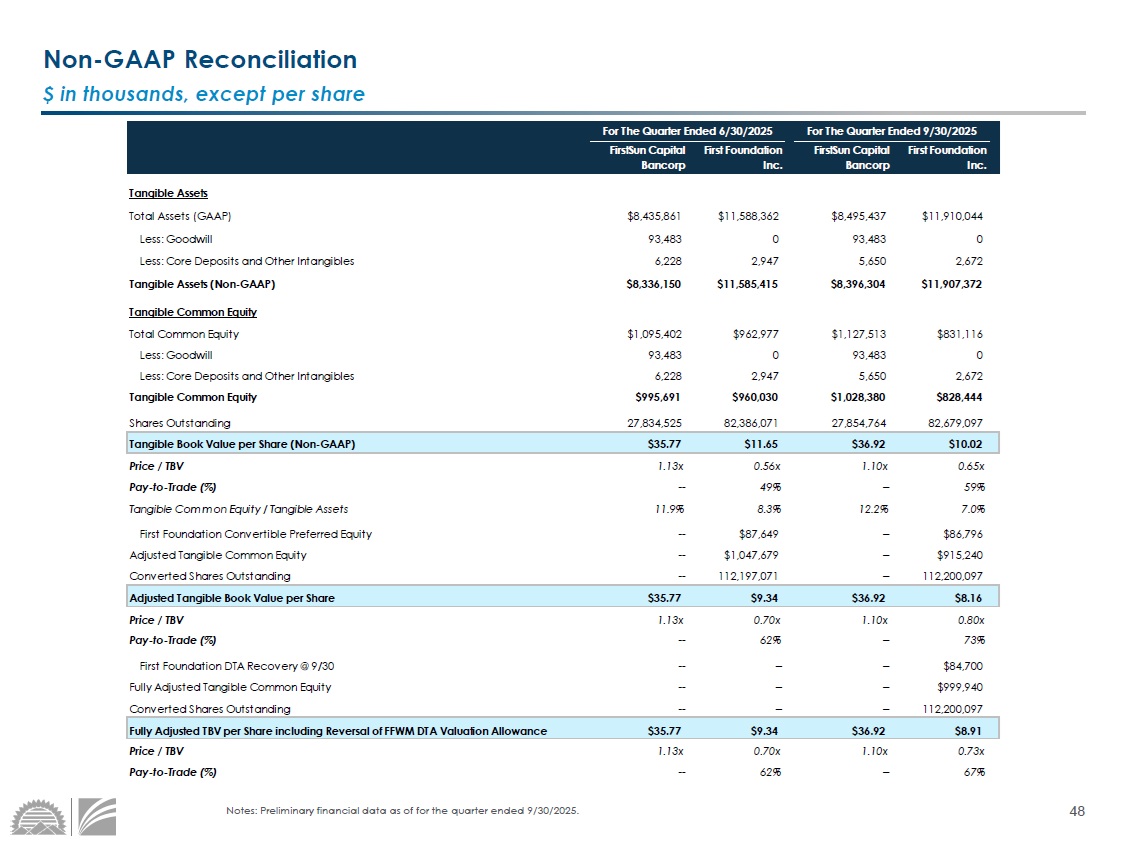
48 Notes: Preliminary financial data as of for the quarter ended 9/30/2025. $ in thousands, except per share Non - GAAP Reconciliation For The Quarter Ended 6/30/2025 For The Quarter Ended 9/30/2025 FirstSun Capital Bancorp First Foundation Inc. FirstSun Capital Bancorp First Foundation Inc. Tangible Assets Total Assets (GAAP) $8,435,861 $11,588,362 $8,495,437 $11,910,044 Less: Goodwill 93,483 0 93,483 0 Less: Core Deposits and Other Intangibles 6,228 2,947 5,650 2,672 Tangible Assets (Non-GAAP) $8,336,150 $11,585,415 $8,396,304 $11,907,372 Tangible Common Equity Total Common Equity $1,095,402 $962,977 $1,127,513 $831,116 Less: Goodwill 93,483 0 93,483 0 Less: Core Deposits and Other Intangibles 6,228 2,947 5,650 2,672 Tangible Common Equity $995,691 $960,030 $1,028,380 $828,444 Shares Outstanding 27,834,525 82,386,071 27,854,764 82,679,097 Tangible Book Value per Share (Non-GAAP) $35.77 $11.65 $36.92 $10.02 Price / TBV 1.13x 0.56x 1.10x 0.65x Pay-to-Trade (%) -- 49% -- 59% Tangible Common Equity / Tangible Assets 11.9% 8.3% 12.2% 7.0% First Foundation Convertible Preferred Equity -- $87,649 -- $86,796 Adjusted Tangible Common Equity -- $1,047,679 -- $915,240 Converted Shares Outstanding -- 112,197,071 -- 112,200,097 Adjusted Tangible Book Value per Share $35.77 $9.34 $36.92 $8.16 Price / TBV 1.13x 0.70x 1.10x 0.80x Pay-to-Trade (%) -- 62% -- 73% First Foundation DTA Recovery @ 9/30 -- -- -- $84,700 Fully Adjusted Tangible Common Equity -- -- -- $999,940 Converted Shares Outstanding -- -- -- 112,200,097 Fully Adjusted TBV per Share including Reversal of FFWM DTA Valuation Allowance $35.77 $9.34 $36.92 $8.91 Price / TBV 1.13x 0.70x 1.10x 0.73x Pay-to-Trade (%) -- 62% -- 67%
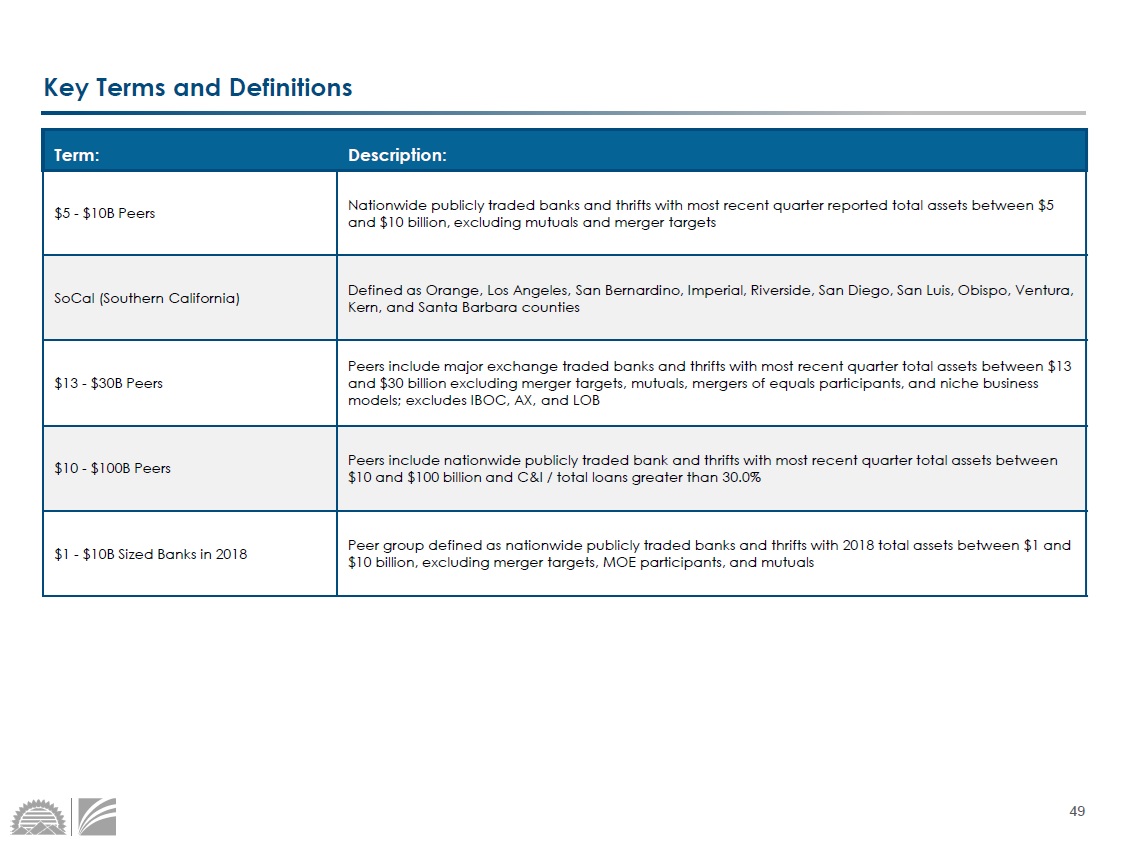
49 Key Terms and Definitions Description: Term: Nationwide publicly traded banks and thrifts with most recent quarter reported total assets between $5 and $10 billion, excluding mutuals and merger targets $5 - $10B Peers Defined as Orange, Los Angeles, San Bernardino, Imperial, Riverside, San Diego, San Luis, Obispo, Ventura, Kern, and Santa Barbara counties SoCal (Southern California) Peers include major exchange traded banks and thrifts with most recent quarter total assets between $13 and $30 billion excluding merger targets, mutuals, mergers of equals participants, and niche business models; excludes IBOC, AX, and LOB $13 - $30B Peers Peers include nationwide publicly traded bank and thrifts with most recent quarter total assets between $10 and $100 billion and C&I / total loans greater than 30.0% $10 - $100B Peers Peer group defined as nationwide publicly traded banks and thrifts with 2018 total assets between $1 and $10 billion, excluding merger targets, MOE participants, and mutuals $1 - $10B Sized Banks in 2018