.2

NASDAQ: Earnings Presentation OCSL First Quarter 2026
.2
NASDAQ: Earnings Presentation OCSL First Quarter 2026
Forward Looking Statements & Legal Disclosures Some of the statements in this presentation constitute forward-looking statements because they relate to future events or our future performance or financial condition. The forward-looking statements contained in this presentation may include statements as to: our future operating results and distribution projections; the ability of Oaktree Fund Advisors, LLC (together with its affiliates, “Oaktree”) to implement Oaktree’s future plans with respect to our business and to achieve our investment objective; the ability of Oaktree and its affiliates to attract and retain highly talented professionals; our business prospects and the prospects of our portfolio companies; the impact of the investments that we expect to make; the ability of our portfolio companies to achieve their objectives; our expected financings and investments and additional leverage we may seek to incur in the future; the adequacy of our cash resources and working capital; the timing of cash flows, if any, from the operations of our portfolio companies; the cost or potential outcome of any litigation to which we may be a party; and the impact of current global economic conditions, including those caused by inflation, an elevated (but decreasing) interest rate environment and geopolitical events or all of the foregoing. In addition, words such as “anticipate,” “believe,” “expect,” “seek,” “plan,” “should,” “estimate,” “project” and “intend” indicate forward-looking statements, although not all forward-looking statements include these words. The forward-looking statements contained in this presentation involve risks and uncertainties. Our actual results could differ materially from those implied or expressed in the forward-looking statements for any reason, including the factors set forth in “Risk Factors” and elsewhere in our annual report on Form 10-K for the fiscal year ended September 30, 2025 and our quarterly report on Form 10-Q for the quarter ended December 31, 2025. Other factors that could cause actual results to differ materially include: changes or potential disruptions in our operations, the economy, financial markets and political environment, including those caused by tariffs and trade disputes with other countries, inflation and an elevated interest rate environment; risks associated with possible disruption in our operations, the operations of our portfolio companies or the economy generally due to terrorism, war or other geopolitical conflict, natural disasters, pandemics or cybersecurity incidents; future changes in laws or regulations (including the interpretation of these laws and regulations by regulatory authorities) and conditions in our operating areas, particularly with respect to business development companies or regulated investment companies; and other considerations disclosed from time to time in our publicly disseminated documents and filings. We have based the forward-looking statements included in this presentation on information available to us on the date of this presentation, and we assume no obligation to update any such forward-looking statements. Although we undertake no obligation to revise or update any forward-looking statements, whether as a result of new information, future events or otherwise, you are advised to consult any additional disclosures that we may make directly to you or through reports that we in the future may file with the SEC, including annual reports on Form 10-K, quarterly reports on Form 10-Q and current reports on Form 8-K. Calculation of Assets Under Management References to total “assets under management” or “AUM” represent assets managed by Oaktree, a proportionate amount of the AUM reported by DoubleLine Capital LP (“DoubleLine Capital”), and other minority corporate investments. Oaktree’s methodology for calculating AUM includes (i) the net asset value (NAV) of assets managed directly by Oaktree, (ii) the leverage on which management fees are charged, (iii) undrawn capital that Oaktree is entitled to call from investors in Oaktree funds pursuant to their capital commitments, (iv) for collateralized loan obligation vehicles (“CLOs”), the aggregate par value of collateral assets and principal cash, (v) for publicly-traded business development companies, gross assets (including assets acquired with leverage), net of cash, and (vi) Oaktree’s pro rata portion (20%) of the AUM reported by DoubleLine Capital and other minority corporate investments. This calculation of AUM is not based on the definitions of AUM that may be set forth in agreements governing the investment funds, vehicles or accounts managed and is not calculated pursuant to regulatory definitions. Unless otherwise indicated, data provided herein are as of December 31, 2025. First Quarter 2026 Earnings Presentation NASDAQ: OCSL
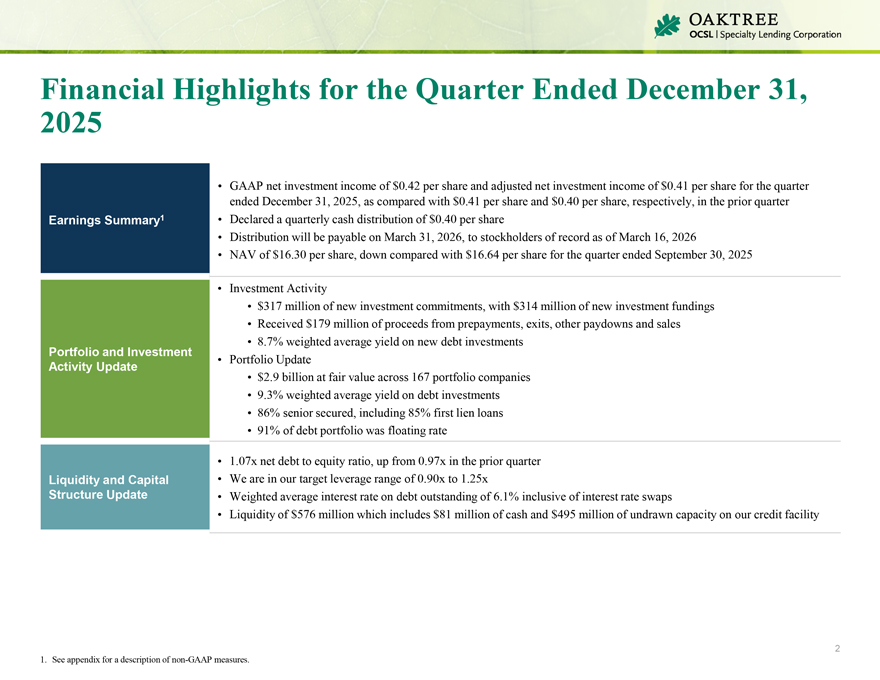
Financial 2025 Highlights for the Quarter Ended December 31, • GAAP net investment income of $0.42 per share and adjusted net investment income of $0.41 per share for the quarter ended December 31, 2025, as compared with $0.41 per share and $0.40 per share, respectively, in the prior quarter Earnings Summary1 • Declared a quarterly cash distribution of $0.40 per share • Distribution will be payable on March 31, 2026, to stockholders of record as of March 16, 2026 • NAV of $16.30 per share, down compared with $16.64 per share for the quarter ended September 30, 2025 • Investment Activity • $317 million of new investment commitments, with $314 million of new investment fundings • Received $179 million of proceeds from prepayments, exits, other paydowns and sales • 8.7% weighted average yield on new debt investments Portfolio and Investment • Portfolio Update Activity Update • $2.9 billion at fair value across 167 portfolio companies • 9.3% weighted average yield on debt investments • 86% senior secured, including 85% first lien loans • 91% of debt portfolio was floating rate • 1.07x net debt to equity ratio, up from 0.97x in the prior quarter Liquidity and Capital • We are in our target leverage range of 0.90x to 1.25x Structure Update • Weighted average interest rate on debt outstanding of 6.1% inclusive of interest rate swaps • Liquidity of $576 million which includes $81 million of cash and $495 million of undrawn capacity on our credit facility 2 1. See appendix for a description of non-GAAP measures.
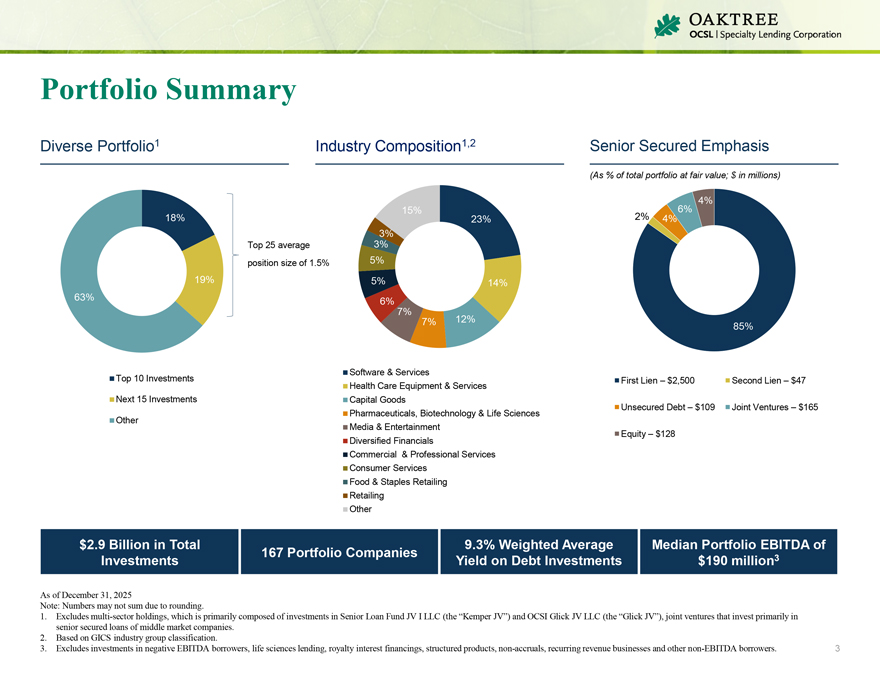
Portfolio Summary Diverse Portfolio1 Industry Composition1,2 Senior Secured Emphasis (As % of total portfolio at fair value; $ in millions) 4% 15% 6% 18% 23% 2% 4% 3% 3% Top 25 average position size of 1.5% 5% 19% 5% 14% 63% 6% 7% 7% 12% 85% Software & Services Top 10 Investments First Lien – $2,500 Second Lien – $47 Health Care Equipment & Services Next 15 Investments Capital Goods Unsecured Debt – $109 Joint Ventures – $165 Pharmaceuticals, Biotechnology & Life Sciences Other Media & Entertainment Equity – $128 Diversified Financials Commercial & Professional Services Consumer Services Food & Staples Retailing Retailing Other $2.9 Billion in Total 9.3% Weighted Average Median Portfolio EBITDA of 167 Portfolio Companies 3 Investments Yield on Debt Investments $190 million As of December 31, 2025 Note: Numbers may not sum due to rounding. 1. Excludes multi-sector holdings, which is primarily composed of investments in Senior Loan Fund JV I LLC (the “Kemper JV”) and OCSI Glick JV LLC (the “Glick JV”), joint ventures that invest primarily in senior secured loans of middle market companies. 2. Based on GICS industry group classification. 3. Excludes investments in negative EBITDA borrowers, life sciences lending, royalty interest financings, structured products, non-accruals, recurring revenue businesses and other non-EBITDA borrowers. 3
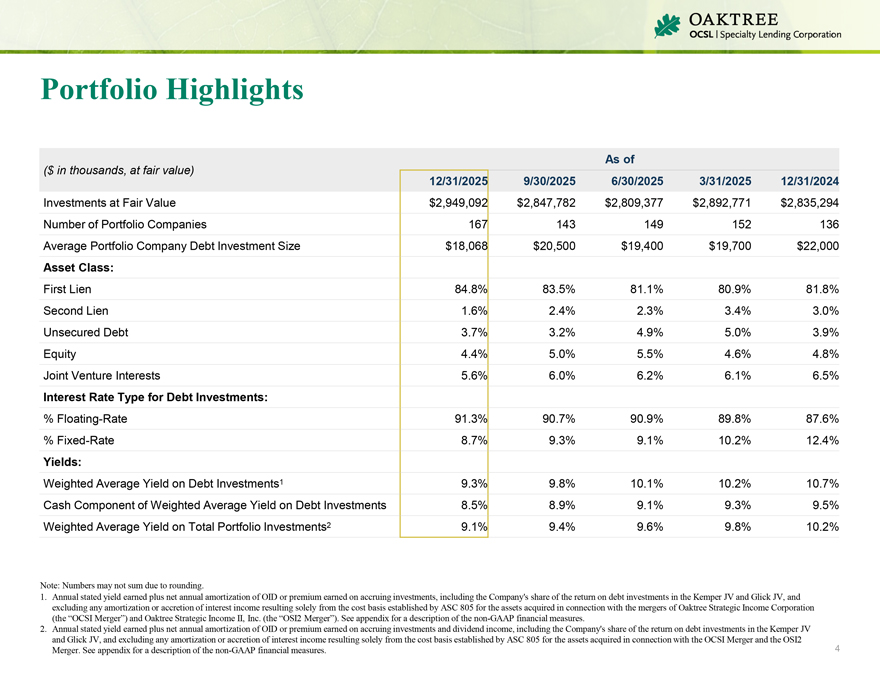
Portfolio Highlights As of ($ in thousands, at fair value) 12/31/2025 9/30/2025 6/30/2025 3/31/2025 12/31/2024 Investments at Fair Value $2,949,092 $2,847,782 $2,809,377 $2,892,771 $2,835,294 Number of Portfolio Companies 167 143 149 152 136 Average Portfolio Company Debt Investment Size $18,068 $20,500 $19,400 $19,700 $22,000 Asset Class: First Lien 84.8% 83.5% 81.1% 80.9% 81.8% Second Lien 1.6% 2.4% 2.3% 3.4% 3.0% Unsecured Debt 3.7% 3.2% 4.9% 5.0% 3.9% Equity 4.4% 5.0% 5.5% 4.6% 4.8% Joint Venture Interests 5.6% 6.0% 6.2% 6.1% 6.5% Interest Rate Type for Debt Investments: % Floating-Rate 91.3% 90.7% 90.9% 89.8% 87.6% % Fixed-Rate 8.7% 9.3% 9.1% 10.2% 12.4% Yields: Weighted Average Yield on Debt Investments1 9.3% 9.8% 10.1% 10.2% 10.7% Cash Component of Weighted Average Yield on Debt Investments 8.5% 8.9% 9.1% 9.3% 9.5% Weighted Average Yield on Total Portfolio Investments2 9.1% 9.4% 9.6% 9.8% 10.2% Note: Numbers may not sum due to rounding. 1. Annual stated yield earned plus net annual amortization of OID or premium earned on accruing investments, including the Company’s share of the return on debt investments in the Kemper JV and Glick JV, and excluding any amortization or accretion of interest income resulting solely from the cost basis established by ASC 805 for the assets acquired in connection with the mergers of Oaktree Strategic Income Corporation (the “OCSI Merger”) and Oaktree Strategic Income II, Inc. (the “OSI2 Merger”). See appendix for a description of the non-GAAP financial measures. 2. Annual stated yield earned plus net annual amortization of OID or premium earned on accruing investments and dividend income, including the Company’s share of the return on debt investments in the Kemper JV and Glick JV, and excluding any amortization or accretion of interest income resulting solely from the cost basis established by ASC 805 for the assets acquired in connection with the OCSI Merger and the OSI2 4 Merger. See appendix for a description of the non-GAAP financial measures.
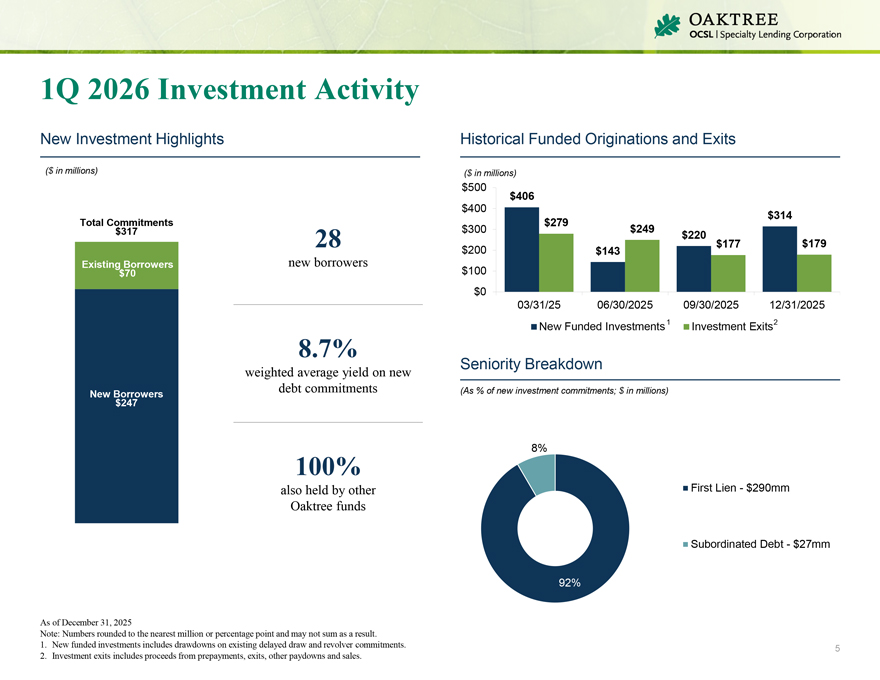
1Q 2026 Investment Activity New Investment Highlights Historical Funded Originations and Exits ($ in millions) ($ in millions) $500 $406 $400 $314 Total Commitments $279 $317 $300 $249 $220 28 $177 $179 $200 $143 Existing Borrowers new borrowers $70 $100 $0 03/31/25 06/30/2025 09/30/2025 12/31/2025 New Funded Investments1 Investment Exits2 8.7% Seniority Breakdown weighted average yield on new New Borrowers debt commitments (As % of new investment commitments; $ in millions) $247 8% 100% also held by other First Lien - $290mm Oaktree funds Subordinated Debt - $27mm 92% As of December 31, 2025 Note: Numbers rounded to the nearest million or percentage point and may not sum as a result. 1. New funded investments includes drawdowns on existing delayed draw and revolver commitments. 5 2. Investment exits includes proceeds from prepayments, exits, other paydowns and sales.
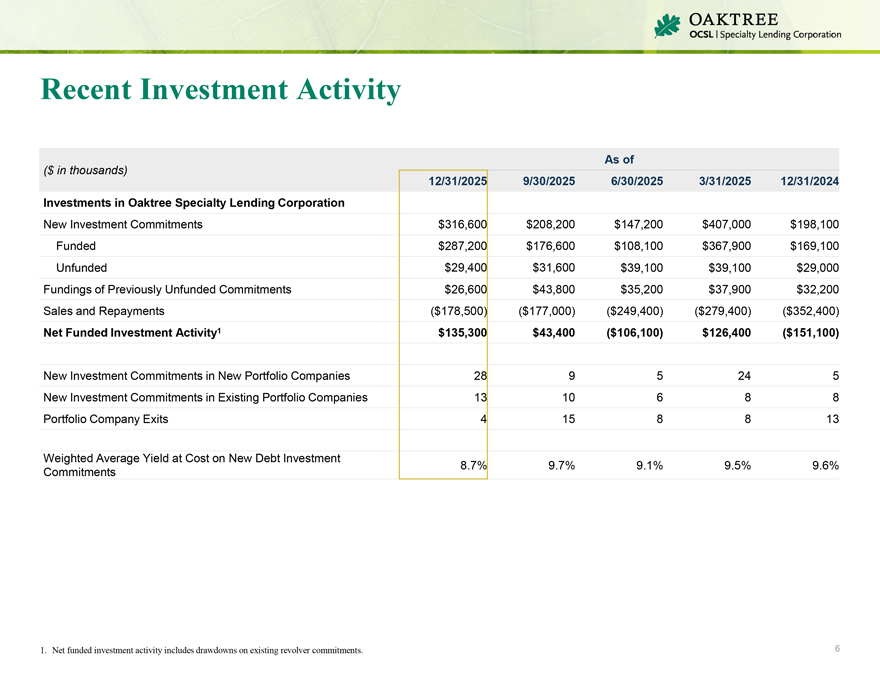
Recent Investment Activity As of ($ in thousands) 12/31/2025 9/30/2025 6/30/2025 3/31/2025 12/31/2024 Investments in Oaktree Specialty Lending Corporation New Investment Commitments $316,600 $208,200 $147,200 $407,000 $198,100 Funded $287,200 $176,600 $108,100 $367,900 $169,100 Unfunded $29,400 $31,600 $39,100 $39,100 $29,000 Fundings of Previously Unfunded Commitments $26,600 $43,800 $35,200 $37,900 $32,200 Sales and Repayments ($178,500) ($177,000) ($249,400) ($279,400) ($352,400) Net Funded Investment Activity1 $135,300 $43,400 ($106,100) $126,400 ($151,100) New Investment Commitments in New Portfolio Companies 28 9 5 24 5 New Investment Commitments in Existing Portfolio Companies 13 10 6 8 8 Portfolio Company Exits 4 15 8 8 13 Weighted Average Yield at Cost on New Debt Investment 8.7% 9.7% 9.1% 9.5% 9.6% Commitments 1. Net funded investment activity includes drawdowns on existing revolver commitments. 6
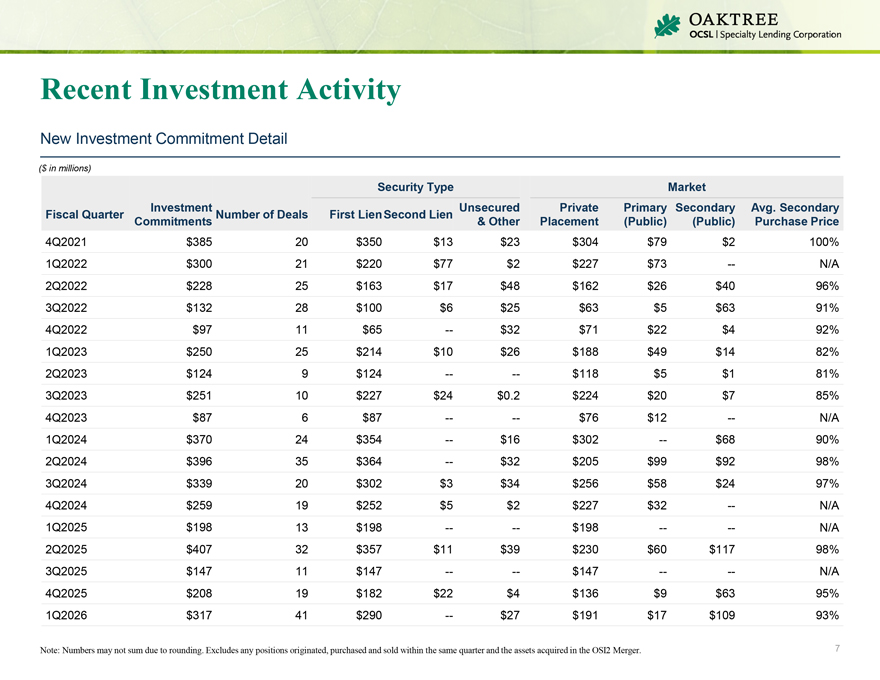
Recent Investment Activity New Investment Commitment Detail ($ in millions) Security Type Market Investment Unsecured Private Primary Secondary Avg. Secondary Fiscal Quarter Number of Deals First LienSecond Lien Commitments & Other Placement (Public) (Public) Purchase Price 4Q2021 $385 20 $350 $13 $23 $304 $79 $2 100% 1Q2022 $300 21 $220 $77 $2 $227 $73 — N/A 2Q2022 $228 25 $163 $17 $48 $162 $26 $40 96% 3Q2022 $132 28 $100 $6 $25 $63 $5 $63 91% 4Q2022 $97 11 $65 — $32 $71 $22 $4 92% 1Q2023 $250 25 $214 $10 $26 $188 $49 $14 82% 2Q2023 $124 9 $124 — — $118 $5 $1 81% 3Q2023 $251 10 $227 $24 $0.2 $224 $20 $7 85% 4Q2023 $87 6 $87 — — $76 $12 — N/A 1Q2024 $370 24 $354 — $16 $302 — $68 90% 2Q2024 $396 35 $364 — $32 $205 $99 $92 98% 3Q2024 $339 20 $302 $3 $34 $256 $58 $24 97% 4Q2024 $259 19 $252 $5 $2 $227 $32 — N/A 1Q2025 $198 13 $198 — — $198 — — N/A 2Q2025 $407 32 $357 $11 $39 $230 $60 $117 98% 3Q2025 $147 11 $147 — — $147 — — N/A 4Q2025 $208 19 $182 $22 $4 $136 $9 $63 95% 1Q2026 $317 41 $290 — $27 $191 $17 $109 93% Note: Numbers may not sum due to rounding. Excludes any positions originated, purchased and sold within the same quarter and the assets acquired in the OSI2 Merger. 7
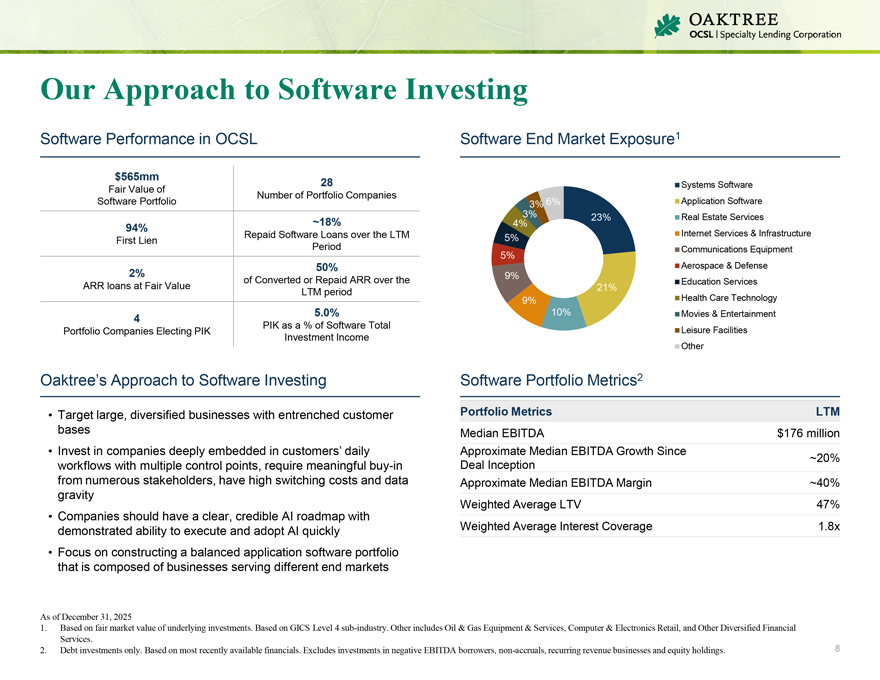
Our Approach to Software Investing Software Performance in OCSL Software End Market Exposure1 $565mm 28 Systems Software Fair Value of Number of Portfolio Companies Software Portfolio 3% 6% Application Software 3% 23% Real Estate Services ~18% 4% 94% Internet Services & Infrastructure Repaid Software Loans over the LTM 5% First Lien Period Communications Equipment 50% 5% Aerospace & Defense 2% 9% of Converted or Repaid ARR over the Education Services ARR loans at Fair Value 21% LTM period 9% Health Care Technology 5.0% 10% Movies & Entertainment 4 PIK as a % of Software Total Leisure Facilities Portfolio Companies Electing PIK Investment Income Other Oaktree’s Approach to Software Investing Software Portfolio Metrics2 • Target large, diversified businesses with entrenched customer Portfolio Metrics LTM bases Median EBITDA $176 million • Invest in companies deeply embedded in customers’ daily Approximate Median EBITDA Growth Since ~20% workflows with multiple control points, require meaningful buy-in Deal Inception from numerous stakeholders, have high switching costs and data Approximate Median EBITDA Margin ~40% gravity Weighted Average LTV 47% • Companies should have a clear, credible AI roadmap with demonstrated ability to execute and adopt AI quickly Weighted Average Interest Coverage 1.8x • Focus on constructing a balanced application software portfolio that is composed of businesses serving different end markets As of December 31, 2025 1. Based on fair market value of underlying investments. Based on GICS Level 4 sub-industry. Other includes Oil & Gas Equipment & Services, Computer & Electronics Retail, and Other Diversified Financial Services. 8 2. Debt investments only. Based on most recently available financials. Excludes investments in negative EBITDA borrowers, non-accruals, recurring revenue businesses and equity holdings.
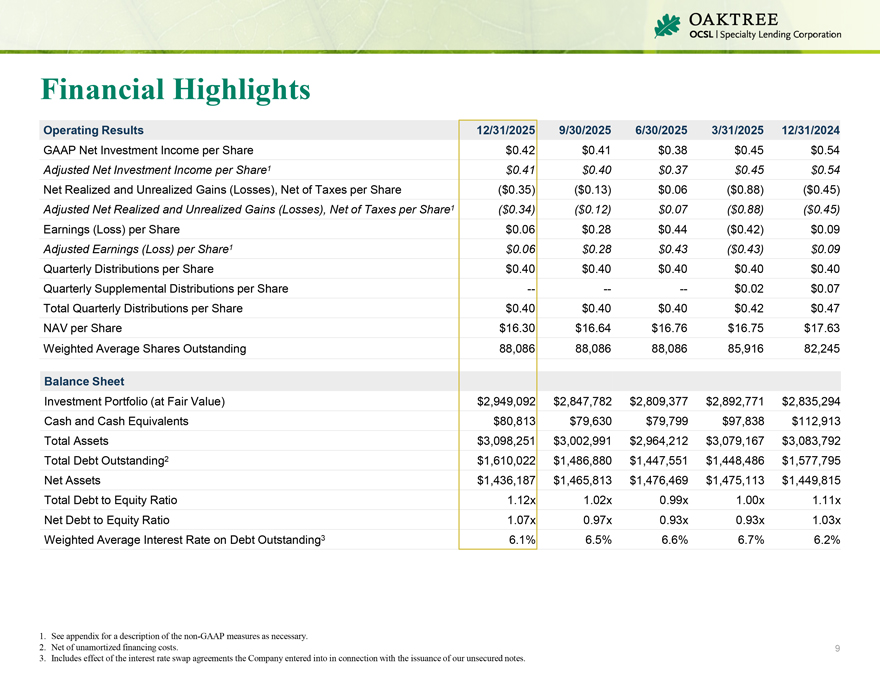
Financial Highlights Operating Results 12/31/2025 9/30/2025 6/30/2025 3/31/2025 12/31/2024 GAAP Net Investment Income per Share $0.42 $0.41 $0.38 $0.45 $0.54 Adjusted Net Investment Income per Share1 $0.41 $0.40 $0.37 $0.45 $0.54 Net Realized and Unrealized Gains (Losses), Net of Taxes per Share ($0.35) ($0.13) $0.06 ($0.88) ($0.45) Adjusted Net Realized and Unrealized Gains (Losses), Net of Taxes per Share1 ($0.34) ($0.12) $0.07 ($0.88) ($0.45) Earnings (Loss) per Share $0.06 $0.28 $0.44 ($0.42) $0.09 Adjusted Earnings (Loss) per Share1 $0.06 $0.28 $0.43 ($0.43) $0.09 Quarterly Distributions per Share $0.40 $0.40 $0.40 $0.40 $0.40 Quarterly Supplemental Distributions per Share — — — $0.02 $0.07 Total Quarterly Distributions per Share $0.40 $0.40 $0.40 $0.42 $0.47 NAV per Share $16.30 $16.64 $16.76 $16.75 $17.63 Weighted Average Shares Outstanding 88,086 88,086 88,086 85,916 82,245 Balance Sheet Investment Portfolio (at Fair Value) $2,949,092 $2,847,782 $2,809,377 $2,892,771 $2,835,294 Cash and Cash Equivalents $80,813 $79,630 $79,799 $97,838 $112,913 Total Assets $3,098,251 $3,002,991 $2,964,212 $3,079,167 $3,083,792 Total Debt Outstanding2 $1,610,022 $1,486,880 $1,447,551 $1,448,486 $1,577,795 Net Assets $1,436,187 $1,465,813 $1,476,469 $1,475,113 $1,449,815 Total Debt to Equity Ratio 1.12x 1.02x 0.99x 1.00x 1.11x Net Debt to Equity Ratio 1.07x 0.97x 0.93x 0.93x 1.03x Weighted Average Interest Rate on Debt Outstanding3 6.1% 6.5% 6.6% 6.7% 6.2% 1. See appendix for a description of the non-GAAP measures as necessary. 2. Net of unamortized financing costs. 9 3. Includes effect of the interest rate swap agreements the Company entered into in connection with the issuance of our unsecured notes.
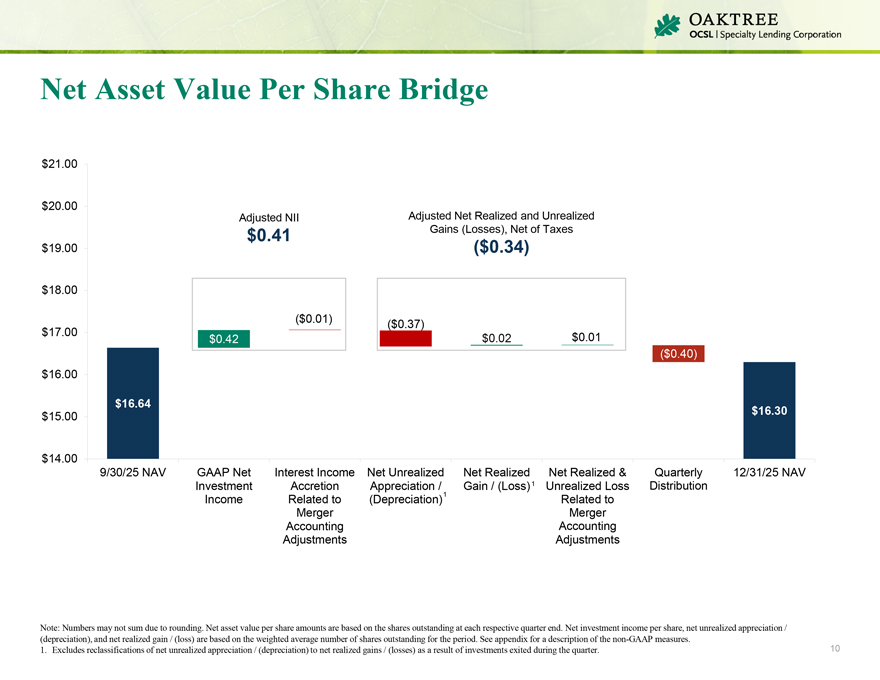
Net Asset Value Per Share Bridge $21.00 $20.00 Adjusted NII Adjusted Net Realized and Unrealized $0.41 Gains (Losses), Net of Taxes $19.00 ($0.34) $18.00 ($0.01) ($0.37) $17.00 $0.01 $0.42 $0.02 ($0.40) $16.00 $16.64 $15.00 $16.30 $14.00 9/30/25 NAV GAAP Net Interest Income Net Unrealized Net Realized Net Realized & Quarterly 12/31/25 NAV Investment Accretion Appreciation / Gain / (Loss)1 Unrealized Loss Distribution Income Related to (Depreciation)1 Related to Merger Merger Accounting Accounting Adjustments Adjustments Note: Numbers may not sum due to rounding. Net asset value per share amounts are based on the shares outstanding at each respective quarter end. Net investment income per share, net unrealized appreciation / (depreciation), and net realized gain / (loss) are based on the weighted average number of shares outstanding for the period. See appendix for a description of the non-GAAP measures. 10 1. Excludes reclassifications of net unrealized appreciation / (depreciation) to net realized gains / (losses) as a result of investments exited during the quarter.
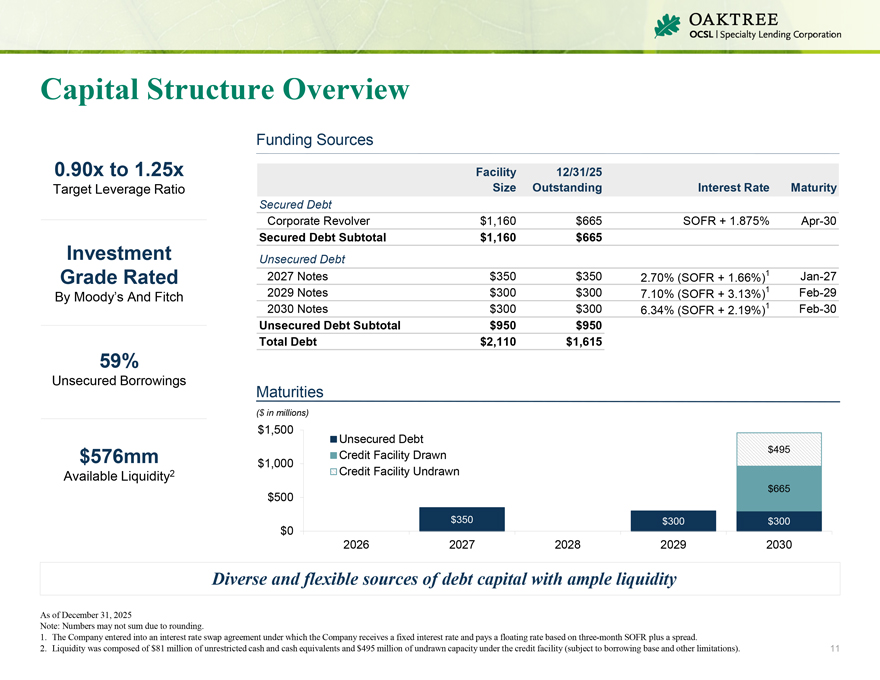
Capital Structure Overview Funding Sources 0.90x to 1.25x Facility 12/31/25 Target Leverage Ratio Size Outstanding Interest Rate Maturity Secured Debt Corporate Revolver $1,160 $665 SOFR + 1.875% Apr-30 Secured Debt Subtotal $1,160 $665 Investment Unsecured Debt Grade Rated 2027 Notes $350 $350 2.70% (SOFR + 1.66%)1 Jan-27 By Moody’s And Fitch 2029 Notes $300 $300 7.10% (SOFR + 3.13%)1 Feb-29 2030 Notes $300 $300 6.34% (SOFR + 2.19%)1 Feb-30 Unsecured Debt Subtotal $950 $950 Total Debt $2,110 $1,615 59% Unsecured Borrowings Maturities ($ in millions) $1,500 Unsecured Debt $495 $576mm Credit Facility Drawn $1,000 Available Liquidity2 Credit Facility Undrawn $665 $500 $0 $350 $300 $300 2026 2027 2028 2029 2030 Diverse and flexible sources of debt capital with ample liquidity As of December 31, 2025 Note: Numbers may not sum due to rounding. 1. The Company entered into an interest rate swap agreement under which the Company receives a fixed interest rate and pays a floating rate based on three-month SOFR plus a spread. 2. Liquidity was composed of $81 million of unrestricted cash and cash equivalents and $495 million of undrawn capacity under the credit facility (subject to borrowing base and other limitations). 11
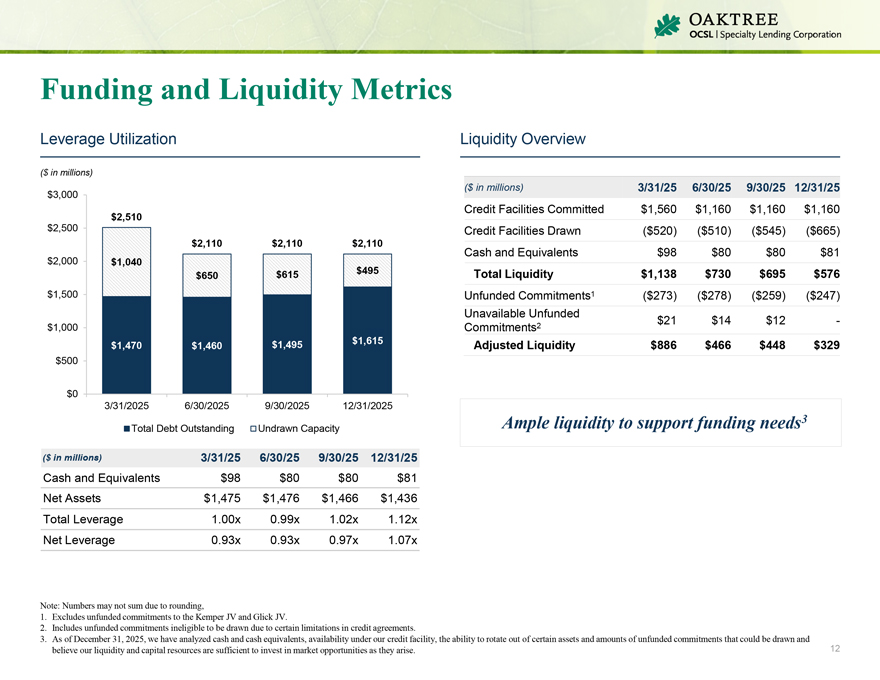
Funding and Liquidity Metrics Leverage Utilization Liquidity Overview ($ in millions) ($ in millions) 3/31/25 6/30/25 9/30/25 12/31/25 $3,000 Credit Facilities Committed $1,560 $1,160 $1,160 $1,160 $2,510 $2,500 Credit Facilities Drawn ($520) ($510) ($545) ($665) $2,110 $2,110 $2,110 Cash and Equivalents $98 $80 $80 $81 $2,000 $1,040 $650 $615 $495 Total Liquidity $1,138 $730 $695 $576 $1,500 Unfunded Commitments1 ($273) ($278) ($259) ($247) Unavailable Unfunded 2 $21 $14 $12 -$1,000 Commitments $1,470 $1,460 $1,495 $1,615 Adjusted Liquidity $886 $466 $448 $329 $500 $0 3/31/2025 6/30/2025 9/30/2025 12/31/2025 Ample liquidity to support funding needs3 Total Debt Outstanding Undrawn Capacity ($ in millions) 3/31/25 6/30/25 9/30/25 12/31/25 Cash and Equivalents $98 $80 $80 $81 Net Assets $1,475 $1,476 $1,466 $1,436 Total Leverage 1.00x 0.99x 1.02x 1.12x Net Leverage 0.93x 0.93x 0.97x 1.07x Note: Numbers may not sum due to rounding, 1. Excludes unfunded commitments to the Kemper JV and Glick JV. 2. Includes unfunded commitments ineligible to be drawn due to certain limitations in credit agreements. 3. As of December 31, 2025, we have analyzed cash and cash equivalents, availability under our credit facility, the ability to rotate out of certain assets and amounts of unfunded commitments that could be drawn and 12 believe our liquidity and capital resources are sufficient to invest in market opportunities as they arise.
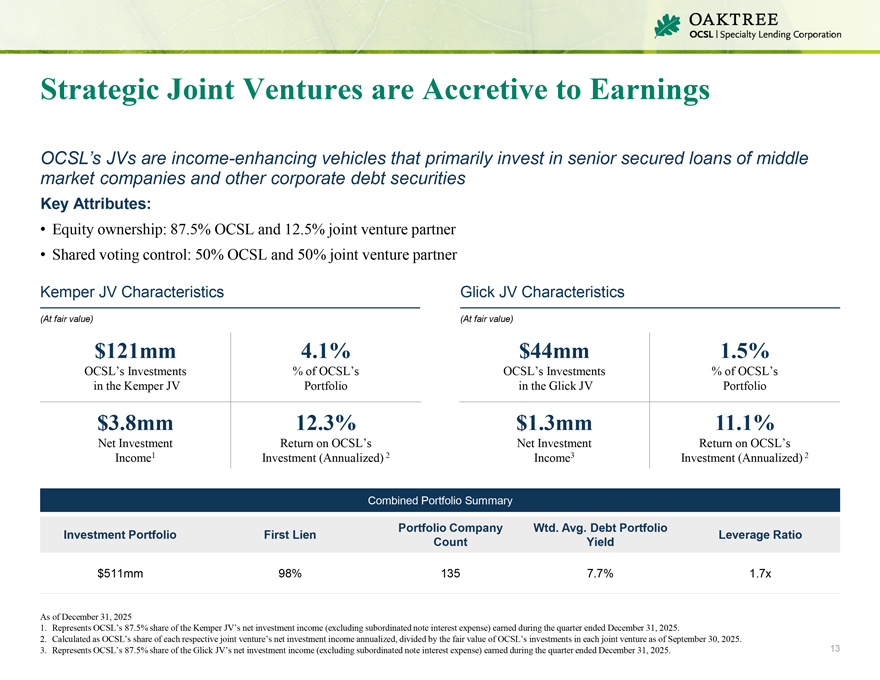
Strategic Joint Ventures are Accretive to Earnings OCSL’s JVs are income-enhancing vehicles that primarily invest in senior secured loans of middle market companies and other corporate debt securities Key Attributes: • Equity ownership: 87.5% OCSL and 12.5% joint venture partner • Shared voting control: 50% OCSL and 50% joint venture partner Kemper JV Characteristics Glick JV Characteristics (At fair value) (At fair value) $121mm 4.1% $44mm 1.5% OCSL’s Investments % of OCSL’s OCSL’s Investments % of OCSL’s in the Kemper JV Portfolio in the Glick JV Portfolio $3.8mm 12.3% $1.3mm 11.1% Net Investment Return on OCSL’s Net Investment Return on OCSL’s Income1 Investment (Annualized) 2 Income3 Investment (Annualized) 2 Combined Portfolio Summary Portfolio Company Wtd. Avg. Debt Portfolio Investment Portfolio First Lien Leverage Ratio Count Yield $511mm 98% 135 7.7% 1.7x As of December 31, 2025 1. Represents OCSL’s 87.5% share of the Kemper JV’s net investment income (excluding subordinated note interest expense) earned during the quarter ended December 31, 2025. 2. Calculated as OCSL’s share of each respective joint venture’s net investment income annualized, divided by the fair value of OCSL’s investments in each joint venture as of September 30, 2025. 13 3. Represents OCSL’s 87.5% share of the Glick JV’s net investment income (excluding subordinated note interest expense) earned during the quarter ended December 31, 2025.

Appendix
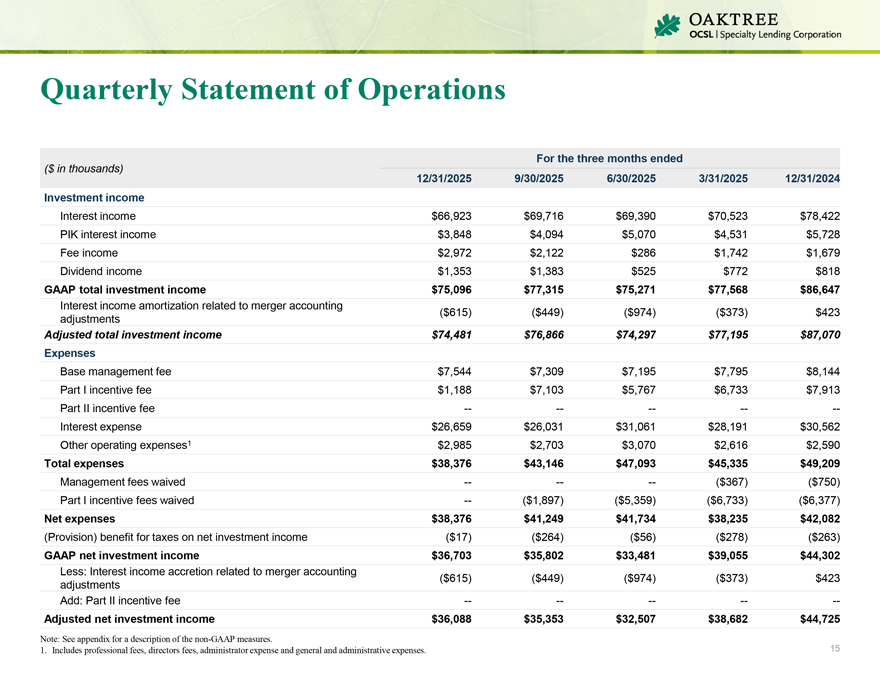
Quarterly Statement of Operations For the three months ended ($ in thousands) 12/31/2025 9/30/2025 6/30/2025 3/31/2025 12/31/2024 Investment income Interest income $66,923 $69,716 $69,390 $70,523 $78,422 PIK interest income $3,848 $4,094 $5,070 $4,531 $5,728 Fee income $2,972 $2,122 $286 $1,742 $1,679 Dividend income $1,353 $1,383 $525 $772 $818 GAAP total investment income $75,096 $77,315 $75,271 $77,568 $86,647 Interest income amortization related to merger accounting ($615) ($449) ($974) ($373) $423 adjustments Adjusted total investment income $74,481 $76,866 $74,297 $77,195 $87,070 Expenses Base management fee $7,544 $7,309 $7,195 $7,795 $8,144 Part I incentive fee $1,188 $7,103 $5,767 $6,733 $7,913 Part II incentive fee — — — — —Interest expense $26,659 $26,031 $31,061 $28,191 $30,562 Other operating expenses1 $2,985 $2,703 $3,070 $2,616 $2,590 Total expenses $38,376 $43,146 $47,093 $45,335 $49,209 Management fees waived — — — ($367) ($750) Part I incentive fees waived — ($1,897) ($5,359) ($6,733) ($6,377) Net expenses $38,376 $41,249 $41,734 $38,235 $42,082 (Provision) benefit for taxes on net investment income ($17) ($264) ($56) ($278) ($263) GAAP net investment income $36,703 $35,802 $33,481 $39,055 $44,302 Less: Interest income accretion related to merger accounting ($615) ($449) ($974) ($373) $423 adjustments Add: Part II incentive fee — — — — — Adjusted net investment income $36,088 $35,353 $32,507 $38,682 $44,725 Note: See appendix for a description of the non-GAAP measures. 15 1. Includes professional fees, directors fees, administrator expense and general and administrative expenses.
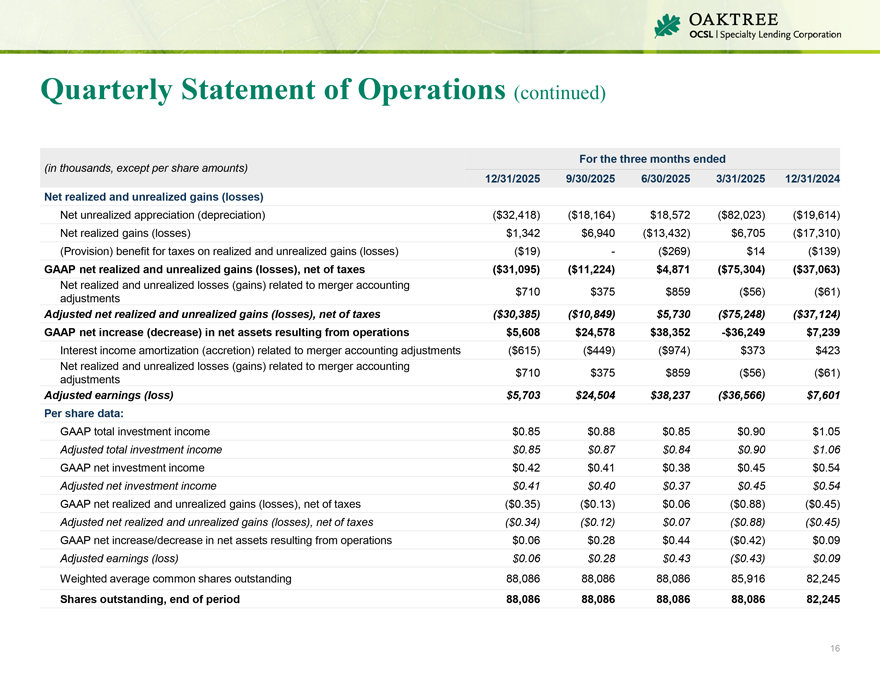
Quarterly Statement of Operations (continued) For the three months ended (in thousands, except per share amounts) 12/31/2025 9/30/2025 6/30/2025 3/31/2025 12/31/2024 Net realized and unrealized gains (losses) Net unrealized appreciation (depreciation) ($32,418) ($18,164) $18,572 ($82,023) ($19,614) Net realized gains (losses) $1,342 $6,940 ($13,432) $6,705 ($17,310) (Provision) benefit for taxes on realized and unrealized gains (losses) ($19) - ($269) $14 ($139) GAAP net realized and unrealized gains (losses), net of taxes ($31,095) ($11,224) $4,871 ($75,304) ($37,063) Net realized and unrealized losses (gains) related to merger accounting $710 $375 $859 ($56) ($61) adjustments Adjusted net realized and unrealized gains (losses), net of taxes ($30,385) ($10,849) $5,730 ($75,248) ($37,124) GAAP net increase (decrease) in net assets resulting from operations $5,608 $24,578 $38,352 -$36,249 $7,239 Interest income amortization (accretion) related to merger accounting adjustments ($615) ($449) ($974) $373 $423 Net realized and unrealized losses (gains) related to merger accounting $710 $375 $859 ($56) ($61) adjustments Adjusted earnings (loss) $5,703 $24,504 $38,237 ($36,566) $7,601 Per share data: GAAP total investment income $0.85 $0.88 $0.85 $0.90 $1.05 Adjusted total investment income $0.85 $0.87 $0.84 $0.90 $1.06 GAAP net investment income $0.42 $0.41 $0.38 $0.45 $0.54 Adjusted net investment income $0.41 $0.40 $0.37 $0.45 $0.54 GAAP net realized and unrealized gains (losses), net of taxes ($0.35) ($0.13) $0.06 ($0.88) ($0.45) Adjusted net realized and unrealized gains (losses), net of taxes ($0.34) ($0.12) $0.07 ($0.88) ($0.45) GAAP net increase/decrease in net assets resulting from operations $0.06 $0.28 $0.44 ($0.42) $0.09 Adjusted earnings (loss) $0.06 $0.28 $0.43 ($0.43) $0.09 Weighted average common shares outstanding 88,086 88,086 88,086 85,916 82,245 Shares outstanding, end of period 88,086 88,086 88,086 88,086 82,245 16
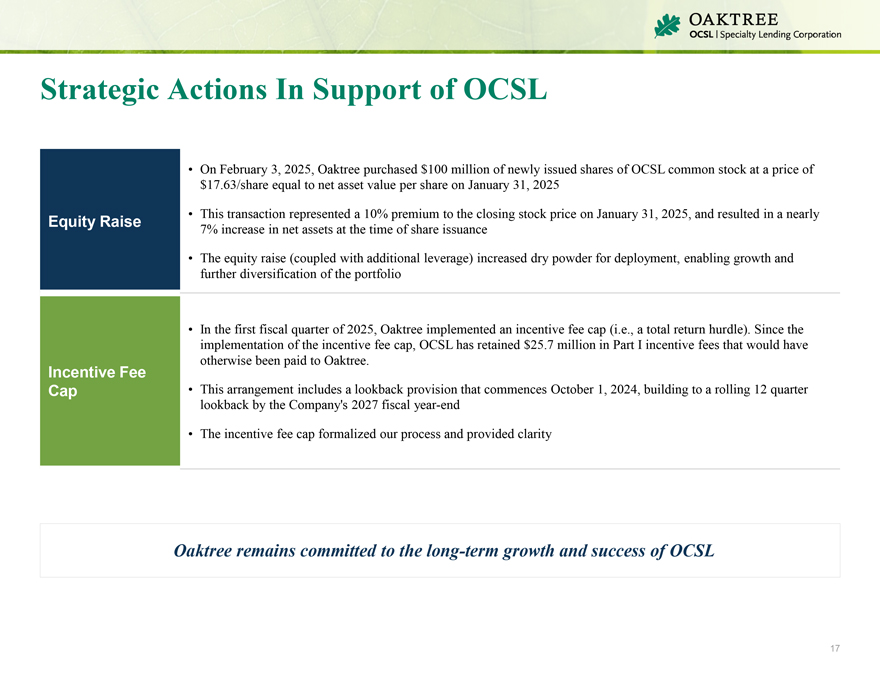
Strategic Actions In Support of OCSL • On February 3, 2025, Oaktree purchased $100 million of newly issued shares of OCSL common stock at a price of $17.63/share equal to net asset value per share on January 31, 2025 Equity Raise • This transaction represented a 10% premium to the closing stock price on January 31, 2025, and resulted in a nearly 7% increase in net assets at the time of share issuance • The equity raise (coupled with additional leverage) increased dry powder for deployment, enabling growth and further diversification of the portfolio • In the first fiscal quarter of 2025, Oaktree implemented an incentive fee cap (i.e., a total return hurdle). Since the implementation of the incentive fee cap, OCSL has retained $25.7 million in Part I incentive fees that would have otherwise been paid to Oaktree. Incentive Fee Cap • This arrangement includes a lookback provision that commences October 1, 2024, building to a rolling 12 quarter lookback by the Company’s 2027 fiscal year-end • The incentive fee cap formalized our process and provided clarity Oaktree remains committed to the long-term growth and success of OCSL 17
Non-GAAP Disclosures The OCSI Merger and the OSI2 Merger (the “Mergers”) were accounted for as asset acquisitions in accordance with the asset acquisition method of accounting as detailed in ASC 805-50, Business Combinations—Related Issues (“ASC 805”). The consideration paid to each of the stockholders of OCSI and OSI2 were allocated to the individual assets acquired and liabilities assumed based on the relative fair values of the net identifiable assets acquired other than “non-qualifying” assets, which established a new cost basis for the acquired investments under ASC 805 that, in aggregate, was different than the historical cost basis of the acquired investments prior to the OCSI Merger or OSI2 Merger, as applicable. Additionally, immediately following the completion of the Mergers, the acquired investments were marked to their respective fair values under ASC 820, Fair Value Measurements, which resulted in unrealized appreciation / depreciation. The new cost basis established by ASC 805 on debt investments acquired will accrete / amortize over the life of each respective debt investment through interest income, with a corresponding adjustment recorded to unrealized appreciation / depreciation on such investment acquired through its ultimate disposition. The new cost basis established by ASC 805 on equity investments acquired will not accrete / amortize over the life of such investments through interest income and, assuming no subsequent change to the fair value of the equity investments acquired and disposition of such equity investments at fair value, the Company will recognize a realized gain / loss with a corresponding reversal of the unrealized appreciation / depreciation on disposition of such equity investments acquired. The Company’s management uses the non-GAAP financial measures described above internally to analyze and evaluate financial results and performance and to compare its financial results with those of other business development companies that have not adjusted the cost basis of certain investments pursuant to ASC 805. The Company’s management believes “Adjusted Total Investment Income”, “Adjusted Total Investment Income Per Share”, “Adjusted Net Investment Income” and “Adjusted Net Investment Income Per Share” are useful to investors as an additional tool to evaluate ongoing results and trends for the Company without giving effect to the accretion income resulting from the new cost basis of the investments acquired in the Mergers because these amounts do not impact the fees payable to Oaktree under its fourth amended and restated investment advisory agreement (the “A&R Advisory Agreement”), and specifically as its relates to “Adjusted Net Investment Income” and “Adjusted Net Investment Income Per Share”, without giving effect to Part II incentive fees. In addition, the Company’s management believes that “Adjusted Net Realized and Unrealized Gains (Losses), Net of Taxes”, “Adjusted Net Realized and Unrealized Gains (Losses), Net of Taxes Per Share”, “Adjusted Earnings (Loss)” and “Adjusted Earnings (Loss) Per Share” are useful to investors as they exclude the non-cash income/gain resulting from the Mergers and used by management to evaluate the economic earnings of its investment portfolio. Moreover, these metrics align the Company’s key financial measures with the calculation of incentive fees payable to Oaktree under with the A&R Advisory Agreement (i.e., excluding amounts resulting solely from the lower cost basis of the acquired investments established by ASC 805 that would have been to the benefit of Oaktree absent such exclusion). 18

oaktreespecialtylending.com