Please wait
UNITED STATES
SECURITIES AND EXCHANGE COMMISSION
WASHINGTON, D.C. 20549
___________________________________________________________
FORM 6-K
___________________________________________________________
Report of Foreign Private Issuer
Pursuant to Rule 13a-16 or 15d-16 under
the Securities Exchange Act of 1934
For the quarterly period ended March 31, 2026
Commission file number 1-33867
___________________________________________________________
TEEKAY TANKERS LTD.
(Exact name of Registrant as specified in its charter)
___________________________________________________________
2nd Floor, Swan Building, 26 Victoria Street, Hamilton, HM 12, Bermuda
(Address of principal executive office)
___________________________________________________________
Indicate by check mark whether the registrant files or will file annual reports under cover of Form 20-F or Form 40-F.
Form 20-F ý Form 40-F ¨
TEEKAY TANKERS LTD.
REPORT ON FORM 6-K FOR THE QUARTERLY PERIOD ENDED MARCH 31, 2026
INDEX
PART I – FINANCIAL INFORMATION
ITEM 1 – FINANCIAL STATEMENTS
TEEKAY TANKERS LTD. AND SUBSIDIARIES
UNAUDITED CONSOLIDATED STATEMENTS OF INCOME (note 1)
(in thousands of U.S. Dollars, except share and per share amounts)
| | | | | | | | | | | | | | | | | | |
| | Three months ended March 31, | | |
| | 2026 | | 2025 | | | | |
| | $ | | $ | | | | |
| | | | | | | | |
Voyage charter revenues (note 3) | | 231,093 | | 192,643 | | | | |
Time-charter revenues (note 3) | | 13,755 | | 6,314 | | | | |
Bareboat-charter revenues (note 3) | | 2,877 | | — | | | | |
Other revenues (note 3) | | 38,369 | | 32,682 | | | | |
| Total revenues | | 286,094 | | 231,639 | | | | |
| | | | | | | | |
Voyage expenses (note 6) | | (57,615) | | (86,867) | | | | |
Vessel operating expenses | | (61,217) | | (61,168) | | | | |
Charter hire expenses (note 8) | | (9,678) | | (14,409) | | | | |
| Depreciation and amortization | | (22,188) | | (23,240) | | | | |
| General and administrative expenses | | (10,380) | | (9,712) | | | | |
Gain on sale and write-down of assets (note 12) | | 22,656 | | 38,163 | | | | |
| | | | | | | | |
| Income from operations | | 147,672 | | 74,406 | | | | |
| | | | | | | | |
| Interest income | | 8,046 | | 5,857 | | | | |
| Interest expense | | (489) | | (773) | | | | |
| | | | | | | | |
Gain on distribution and equity income from equity-accounted investment (note 13) | | 1,500 | | 230 | | | | |
Other income (expense) (note 14) | | 821 | | (4,158) | | | | |
| Net income before income tax | | 157,550 | | 75,562 | | | | |
Income tax (expense) recovery (note 15) | | (3,999) | | 470 | | | | |
| Net income | | 153,551 | | 76,032 | | | | |
| | | | | | | | |
| | | | | | | | |
Per common share amounts (note 16) | | | | | | | | |
| - Basic earnings per share | | $4.42 | | $2.20 | | | | |
| - Diluted earnings per share | | $4.40 | | $2.19 | | | | |
| - Cash dividends declared | | $0.25 | | $0.25 | | | | |
| | | | | | | | |
Weighted-average number of Class A and Class B common shares outstanding (note 16) | | | | | | | | |
| - Basic | | 34,758,582 | | 34,482,849 | | | | |
| - Diluted | | 34,909,856 | | 34,666,717 | | | | |
| | | | | | | | |
Related party transactions (note 11) | | | | | | | | |
The accompanying notes are an integral part of the unaudited consolidated financial statements.
TEEKAY TANKERS LTD. AND SUBSIDIARIES
UNAUDITED CONSOLIDATED BALANCE SHEETS (note 1)
(in thousands of U.S. Dollars)
| | | | | | | | | | | | | | |
| | As at | | As at |
| | March 31, 2026 | | December 31, 2025 |
| | $ | | $ |
| ASSETS | | | | |
| Current | | | | |
| Cash and cash equivalents | | 722,009 | | 830,569 |
Short-term investments (note 9) | | 274,142 | | 22,000 |
Restricted cash – current (note 17) | | — | | 692 |
| | | |
| Accounts receivable, net of allowance of $4.8 million (2025 - $4.4 million) | | 113,001 | | 82,781 |
Assets held for sale (note 12) | | 61,036 | | 26,834 |
Due from affiliates (note 11) | | 3,642 | | 2,804 |
| Bunker and lube oil inventory | | 28,719 | | 29,409 |
| Prepaid expenses | | 17,195 | | 17,013 |
| | | | |
| Accrued revenue | | 36,168 | | 52,005 |
Other current assets (note 5) | | 14,288 | | 15,351 |
| Total current assets | | 1,270,200 | | 1,079,458 |
| | | | |
| Vessels and equipment | | | | |
At cost, less accumulated depreciation of $494.3 million (2025 - $487.7 million) (notes 3, 5, 7 and 12) | | 1,053,098 | | 1,000,483 |
| | | | |
Operating lease right-of-use assets (note 8) | | 32,998 | | 38,161 |
| Total vessels and equipment | | 1,086,096 | | 1,038,644 |
| | | | |
| | | | |
Goodwill and intangible assets (note 5) | | 10,481 | | 2,426 |
Other non-current assets (note 5) | | 23,742 | | 121,146 |
| | | | |
| Total assets | | 2,390,519 | | 2,241,674 |
| LIABILITIES AND EQUITY | | | | |
| Current | | | | |
| Accounts payable | | 28,085 | | 19,926 |
Accrued liabilities (note 6) | | 75,365 | | 84,724 |
| | | | |
| | | | |
| | | | |
| | | | |
Current portion of operating lease liabilities (note 8) | | 19,422 | | 21,107 |
Due to affiliates (note 11) | | 410 | | 595 |
Other current liabilities (note 3) | | 11,868 | | 8,938 |
| Total current liabilities | | 135,150 | | 135,290 |
| | | | |
| | | | |
Long-term operating lease liabilities (note 8) | | 13,577 | | 17,054 |
| | | | |
Other long-term liabilities (note 6) | | 51,880 | | 45,714 |
| Total liabilities | | 200,607 | | 198,058 |
Commitments and contingencies (notes 7, 8, 9 and 18) | | | | |
| Equity | | | | |
Common shares and additional paid-in capital (585.0 million shares authorized, 30.0 million Class A and 4.6 million Class B shares issued and outstanding as of March 31, 2026, and 585.0 million shares authorized, 29.9 million Class A and 4.6 million Class B shares issued and outstanding as at December 31, 2025) (note 10) | | 1,316,092 | | 1,314,640 |
| Accumulated surplus | | 873,820 | | 728,976 |
| Total equity | | 2,189,912 | | 2,043,616 |
| Total liabilities and equity | | 2,390,519 | | 2,241,674 |
Subsequent events (note 19)
The accompanying notes are an integral part of the unaudited consolidated financial statements.
TEEKAY TANKERS LTD. AND SUBSIDIARIES
UNAUDITED CONSOLIDATED STATEMENTS OF CASH FLOWS (note 1)
(in thousands of U.S. Dollars)
| | | | | | | | | | | | | | |
| | Three Months Ended March 31, |
| | 2026 | | 2025 |
| | $ | | $ |
| Cash, cash equivalents and restricted cash provided by (used for) | | | | |
| OPERATING ACTIVITIES | | | | |
| Net income | | 153,551 | | 76,032 |
| Non-cash items: | | | | |
| Depreciation and amortization | | 22,188 | | 23,240 |
Gain on sale and write-down of assets (note 12) | | (22,656) | | (38,163) |
| | | | |
Gain on distribution and equity income from equity-accounted investment (note 13) | | (1,500) | | (230) |
| Provision (recovery) for uncertain tax position | | 260 | | (2,221) |
| | | | |
| Other | | (388) | | 5,652 |
| Change in operating assets and liabilities | | (29,158) | | (6,019) |
| Expenditures for dry docking | | (2,691) | | (667) |
| Net operating cash flow | | 119,606 | | 57,624 |
| | | | |
| FINANCING ACTIVITIES | | | | |
| | | | |
| | | | |
| | | | |
| | | | |
| | | | |
| | | | |
| | | | |
| | | | |
| | | | |
| Issuance of common shares upon exercise of stock options | | 1,072 | | 872 |
| | | |
| Cash dividends paid | | (8,661) | | (8,596) |
| Other | | — | | (803) |
| Net financing cash flow | | (7,589) | | (8,527) |
| | | | |
| INVESTING ACTIVITIES | | | | |
Proceeds from sale of vessels (note 12) | | 72,332 | | 120,834 |
Distribution from equity-accounted joint venture (note 13) | | 1,500 | | — |
| Expenditures for vessels and equipment | | (510) | | (306) |
| | | | |
| Purchase of short-term investments | | (274,142) | | — |
| Proceeds from short-term investments | | 22,000 | | — |
| Vessel acquisitions | | (42,449) | | — |
| Purchase of marketable securities | | — | | (2,348) |
| | | | |
| Deposit for vessel purchase | | — | | (6,300) |
| Net investing cash flow | | (221,269) | | 111,880 |
| | | | |
| (Decrease) increase in cash, cash equivalents and restricted cash | | (109,252) | | 160,977 |
| Cash, cash equivalents and restricted cash, beginning of the period | | 831,261 | | 515,561 |
| Cash, cash equivalents and restricted cash, end of the period | | 722,009 | | 676,538 |
Supplemental cash flow information (note 17)
The accompanying notes are an integral part of the unaudited consolidated financial statements.
TEEKAY TANKERS LTD. AND SUBSIDIARIES
UNAUDITED CONSOLIDATED STATEMENTS OF CHANGES IN EQUITY (note 1)
(in thousands of U.S. Dollars, except share amounts)
| | | | | | | | | | | | | | | | | | | | | | | | | | | | | | | | | | |
| | | | Common Shares and Additional
Paid-in Capital | | | | |
| | | | | Thousands of Common Shares # | | Class A Common Shares $ | | Class B Common Shares $ | | Accumulated Surplus
$ | | Total $ |
| Balance as at December 31, 2025 | | | | 34,548 | | 1,226,108 | | 88,532 | | 728,976 | | 2,043,616 |
| Net income | | | | — | | — | | — | | 153,551 | | 153,551 |
| Dividends declared | | | | — | | — | | — | | (8,707) | | (8,707) |
Equity-based compensation (note 10) | | | | 96 | | 1,452 | | — | | — | | 1,452 |
| Balance as at March 31, 2026 | | | | 34,644 | | 1,227,560 | | 88,532 | | 873,820 | | 2,189,912 |
| | | | | | | | | | | | |
| | | | | | | | | | | | |
| | | | | | | | | | | | |
| | | | | | | | | | | | |
| | | | | | | | | | | | |
| | | | | | | | | | | | |
| | | | | | | | | | | | |
| | | | | | | | | | | | |
| | | | | | | | | | | | | | | | | | | | | | | | | | | | | | | | | | |
| | | | | Common Shares and Additional
Paid-in Capital | | | | |
| | | | | Thousands of Common Shares # | | Class A Common Shares $ | | Class B Common Shares $ | | Accumulated
Surplus
$ | | Total $ |
| Balance as at December 31, 2024 | | | | 34,361 | | 1,220,963 | | 88,532 | | 447,055 | | 1,756,550 |
| Net income | | | | — | | — | | — | | 76,032 | | 76,032 |
| Dividends declared | | | | — | | — | | — | | (8,626) | | (8,626) |
Equity-based compensation (note 10) | | | | 72 | | 263 | | — | | — | | 263 |
| Balance as at March 31, 2025 | | | | 34,433 | | 1,221,226 | | 88,532 | | 514,461 | | 1,824,219 |
| | | | | | | | | | | | |
| | | | | | | | | | | | |
| | | | | | | | | | | | |
| | | | | | | | | | | | |
| | | | | | | | | | | | |
| | | | | | | | | | | | |
| | | | | | | | | | | | |
| | | | | | | | | | | | |
| | | | | | | | | | | | |
| | | | | | | | | | | | |
| | | | | | | | | | | | |
The accompanying notes are an integral part of the unaudited consolidated financial statements.
TEEKAY TANKERS LTD. AND SUBSIDIARIES
NOTES TO THE UNAUDITED CONSOLIDATED FINANCIAL STATEMENTS
(all tabular amounts stated in thousands of U.S. Dollars, other than share or per share data)
1.Basis of Presentation
The unaudited interim consolidated financial statements (or unaudited consolidated financial statements) have been prepared in accordance with United States generally accepted accounting principles (or GAAP). These unaudited consolidated financial statements include the accounts of Teekay Tankers Ltd. (or Teekay Tankers), which is incorporated under the laws of Bermuda, its wholly-owned subsidiaries and equity-accounted joint venture (collectively, the Company).
Certain information and footnote disclosures required by GAAP for complete annual financial statements have been omitted and, therefore, these unaudited consolidated financial statements should be read in conjunction with the Company’s audited consolidated financial statements for the year ended December 31, 2025, filed on Form 20-F with the U.S. Securities and Exchange Commission (or the SEC) on March 13, 2026. In the opinion of management, these unaudited consolidated financial statements reflect all normal recurring adjustments necessary to present fairly, in all material respects, the Company’s unaudited consolidated financial position, results of operations, cash flows and changes in equity for the interim periods presented. The results of operations for the interim periods presented are not necessarily indicative of those for a full fiscal year. Intercompany balances and transactions have been eliminated upon consolidation. The preparation of financial statements in conformity with GAAP requires management to make estimates and assumptions that affect the amounts reported in the unaudited consolidated financial statements and accompanying notes. Actual results could differ from those estimates.
2. Recent Accounting Pronouncements
In November 2024, the Financial Accounting Standards Board (or FASB) issued Accounting Standards Update (or ASU) 2024-03, Income Statement—Reporting Comprehensive Income—Expense Disaggregation Disclosures (Subtopic 220-40) Disaggregation of Income Statement Expenses, which requires disclosure, in the notes to financial statements, of specified information about certain costs and expenses. The amendments require that, for each interim and annual reporting period, an entity:
•Disclose the amounts of (a) purchases of inventory, (b) employee compensation, (c) depreciation, and (d) intangible asset amortization included in each relevant expense caption on the face of the income statement within continuing operations;
•Include certain amounts that are already required to be disclosed under current GAAP in the same disclosure as the other disaggregation requirements;
•Disclose a qualitative description of the amounts remaining in relevant expense captions that are not separately disaggregated quantitatively; and
•Disclose the total amount of selling expenses and, in annual reporting periods, an entity’s definition of selling expenses.
The amendments in the standard are effective for annual periods beginning after December 15, 2026 and for interim reporting periods beginning after December 15, 2027. Early adoption is permitted and should be applied prospectively, with retrospective application permitted. The Company expects to adopt this standard in its annual period beginning January 1, 2027. The Company is evaluating the impact of this standard on its consolidated financial statements.
3. Revenues
The Company’s primary source of revenue is from chartering its vessels (Suezmax tankers, Aframax tankers, Long Range 2 (or LR2) tankers and a Very Large Crude Carrier (or VLCC) tanker) to its customers and providing operational and maintenance marine services through its Australian operations. The Company utilizes two primary forms of contracts, consisting of voyage charters and time charters, and to a lesser extent bareboat charters from time to time.
The extent to which the Company employs its vessels on voyage charters versus time charters and bareboat charters is dependent upon the Company’s chartering strategy and the availability of time charters and bareboat charters. Spot market rates for voyage charters are volatile from period to period, whereas time charters provide a stable source of monthly revenue. During 2026, the Company has three vessels on short-term bareboat contracts that relate to the acquisitions of such vessels completed in January 2026. These bareboat charters are charters under which the customer pays a fixed daily rate for a fixed period of time for use of the vessel, and the customer also pays for all costs of operating the vessel, including voyage and vessel operating expenses. The Company also provides ship-to-ship (or STS) support services, which include managing the process of transferring cargo between seagoing ships positioned alongside each other, as well as management services to third-party owners of vessels. For descriptions of voyage charters and time charters, see "Item 18 – Financial Statements: Note 4" in the Company’s audited consolidated financial statements filed with its Annual Report on Form 20-F for the year ended December 31, 2025.
TEEKAY TANKERS LTD. AND SUBSIDIARIES
NOTES TO THE UNAUDITED CONSOLIDATED FINANCIAL STATEMENTS
(all tabular amounts stated in thousands of U.S. Dollars, other than share or per share data)
The following tables contain a breakdown of the Company's revenue by segment and contract type for the three months ended March 31, 2026 and March 31, 2025. The Company’s lease income consists of the revenue from its voyage charters, time charters and bareboat charters.
| | | | | | | | | | | | | | | | | | | | | | | |
| Three Months Ended March 31, 2026 | | Three Months Ended March 31, 2025 |
| Tankers | Marine
Services and
Other | Total | | Tankers | Marine
Services and
Other | Total |
| $ | $ | $ | | $ | $ | $ |
| Voyage charter revenues | | | | | | | |
| Suezmax | 114,172 | — | 114,172 | | 108,765 | — | 108,765 |
| Aframax / LR2 | 109,952 | — | 109,952 | | 83,878 | — | 83,878 |
VLCC (1) | 6,969 | — | 6,969 | | — | — | — |
| Total | 231,093 | — | 231,093 | | 192,643 | — | 192,643 |
| | | | | | | |
| Time-charter revenues | | | | | | | |
| Suezmax | 6,092 | — | 6,092 | | — | — | — |
| Aframax / LR2 | 5,439 | — | 5,439 | | 4,478 | — | 4,478 |
Bunker tanker (2) | — | 2,224 | 2,224 | | — | 1,836 | 1,836 |
| Total | 11,531 | 2,224 | 13,755 | | 4,478 | 1,836 | 6,314 |
| | | | | | | |
| Bareboat-charter revenues | | | | | | | |
| Aframax / LR2 | 2,877 | — | 2,877 | | — | — | — |
| Total | 2,877 | — | 2,877 | | — | — | — |
| | | | | | | |
Other revenues (3) | | | | | | | |
| Vessel operational and maintenance services | 486 | 29,493 | 29,979 | | 501 | 26,587 | 27,088 |
| Ship-to-ship support services | 2,411 | — | 2,411 | | 4,882 | — | 4,882 |
Management fees and other (4) | 5,473 | 506 | 5,979 | | — | 712 | 712 |
| Total | 8,370 | 29,999 | 38,369 | | 5,383 | 27,299 | 32,682 |
| | | | | | | |
| Total revenues | 253,871 | 32,223 | 286,094 | | 202,504 | 29,135 | 231,639 |
(1)Includes one VLCC tanker, which was acquired by the Company from its 50/50 joint venture in August 2025 and is trading in a pooling arrangement managed by a third-party.
(2)Includes variable lease payments of $nil and $1.0 million for the three months ended March 31, 2026 and 2025, respectively, related to the reimbursement for certain operating expenditures received from the Company's customer relating to such costs incurred by the Company to operate the vessel.
(3)Relates to non-lease revenues.
(4)Tankers segment includes in-process revenue related to the acquisitions of three 2016-built Aframax / LR2 tankers that were completed in January 2026. For more details, see "In-process Revenue" subsection of this Note 4 below.
Charters-out
As at March 31, 2026, six (December 31, 2025 - four) of the Company’s vessels operated under fixed-rate time-charter contracts, which are scheduled to expire between September 2026 and May 2029. As at March 31, 2026, the minimum scheduled future revenues to be received by the Company under time charters then in place were approximately $64.9 million (remainder of 2026), $10.8 million (2027), $8.0 million (2028), and $2.7 million (2029). The hire payments should not be construed to reflect a forecast of total charter hire revenue for any of the periods. Future hire payments do not include any hire payments generated from new contracts entered into after March 31, 2026 or from variable consideration, if any, under contracts. In addition, future hire payments presented above have been reduced by estimated off-hire time for required periodic maintenance and do not reflect the impact of any applicable revenue sharing
TEEKAY TANKERS LTD. AND SUBSIDIARIES
NOTES TO THE UNAUDITED CONSOLIDATED FINANCIAL STATEMENTS
(all tabular amounts stated in thousands of U.S. Dollars, other than share or per share data)
arrangements whereby time-charter revenues are shared with other revenue sharing arrangement participants. Actual amounts may vary given future events such as unplanned vessel maintenance.
Bareboat Charters-out
As at March 31, 2026, three (December 31, 2025 - none) of the Company’s vessels operated under fixed-rate bareboat-charter contracts, which are scheduled to expire between May 2026 and July 2026. As at March 31, 2026, the minimum scheduled future revenues to be received by the Company under bareboat charters then in place were approximately $2.5 million (remainder of 2026). The hire payments should not be construed to reflect a forecast of total charter hire revenue for such periods. Future hire payments do not include any hire payments generated from new contracts entered into after March 31, 2026 or from variable consideration, if any, under contracts.
Contract Liabilities
As at March 31, 2026, the Company had $3.6 million (December 31, 2025 - $5.8 million) of advanced payments recognized as contract liabilities that are expected to be recognized as time-charter revenues or voyage charter revenues in subsequent periods and which are included in other current liabilities in the Company's unaudited consolidated balance sheets.
In-process Revenue
In January 2026, the Company completed the acquisitions of three 2016-built Aframax / LR2 tankers. As part of the Company’s acquisitions of these tankers, the Company bareboat chartered out each tanker to the seller for a short-term period with rates that are less favorable than prevailing market rates; as a result, the Company paid a purchase price that is less than the estimated fair value of each vessel. As at March 31, 2026, the Company has recorded both an asset and a liability based on the difference between the fair value and the purchase price for each of the vessels. The Company is amortizing the assets, which are included as part of vessels and equipment in the Company's unaudited consolidated balance sheets, over each vessel’s estimated remaining useful life, and the Company is amortizing the liabilities, which are included as part of other current liabilities in the Company's unaudited consolidated balance sheets, over the estimated remaining term of the short-term bareboat contracts, which are expected to expire prior to the end of the third quarter of 2026.
For the three months ended March 31, 2026, amortization of the liabilities was $5.5 million (2025 - $nil), which is classified as in-process revenue and included as part of other revenues in the Company's unaudited consolidated statements of income. The liabilities are expected to be fully amortized by the end of the third quarter of 2026.
4. Segment Reporting
The Company allocates capital and assesses performance from the perspective of the Company's lines of business. The Company has two primary lines of business: 1) tankers and 2) marine services. The primary focus of the Company’s organizational structure, internal reporting and allocation of resources by the chief operating decision maker (or CODM) is based on the two lines of business, and its segments are presented accordingly on this basis. The CODM is the President and Chief Executive Officer of the Company. The CODM uses income from operations to assess the performance of each segment and to make decisions about allocating resources. The CODM does not assess the performance of each segment by geographic regions.
The Company's two operating segments include: 1) tankers, which consists of the operation of all of the Company's tankers (including the operations from those tankers employed on full service lightering contracts), and the Company's U.S. based ship-to-ship support service operations (including its lightering support services provided as part of full service lightering operations); and 2) marine services, which consists of operational and maintenance marine services provided to the Australian government, Australian energy companies and other third parties.
The accounting policies of the two segments are the same as those described in the summary of significant accounting policies. For more details, see "Item 18 – Financial Statements: Note 1" in the Company’s audited consolidated financial statements filed with its Annual Report on Form 20-F for the year ended December 31, 2025. The measure of segment assets is reported on the balance sheet as total consolidated assets.
TEEKAY TANKERS LTD. AND SUBSIDIARIES
NOTES TO THE UNAUDITED CONSOLIDATED FINANCIAL STATEMENTS
(all tabular amounts stated in thousands of U.S. Dollars, other than share or per share data)
The following tables include the Company’s revenues, expenses, other segment items, income from operations, and gain on distribution and equity income from equity-accounted investment by segment, and reconciles such amounts to the Company’s consolidated net income before income tax for the periods presented in these financial statements:
| | | | | | | | | | | | | | | | | | | | | | |
| Three Months Ended March 31, 2026 | | | |
| Tankers
$ | | Marine
Services and Other
$ | | | | Total
$ | | |
| Revenues | 253,871 | | 32,223 | | | | 286,094 | | | |
| Voyage expenses | (57,615) | | — | | | | (57,615) | | | |
| Vessel operating expenses | (31,013) | | (30,204) | | | | (61,217) | | | |
| Charter hire expenses | (9,058) | | (620) | | | | (9,678) | | | |
| Depreciation and amortization | (22,188) | | — | | | | (22,188) | | | |
| General and administrative expenses | (10,380) | | — | | | | (10,380) | | | |
| Gain on sale of vessels | 22,656 | | — | | | | 22,656 | | | |
| | | | | | | | | | |
| Income from operations | 146,273 | | 1,399 | | | | 147,672 | | | |
| | | | | | | | | | |
| Gain on distribution from equity-accounted investment | 1,500 | | — | | | | 1,500 | | | |
| Non-segment reconciling items: | | | | | | | | | | |
| Interest income | | | | | | | 8,046 | | | |
| Interest expense | | | | | | | (489) | | | |
| | | | | | | | | | |
| Other income | | | | | | | 821 | | | |
| Net income before income tax | | | | | | | 157,550 | | | |
| | | | | | | | | | | | | | | | | | | | | | |
| Three Months Ended March 31, 2025 | | | |
| Tankers
$ | | Marine
Services and Other
$ | | | | Total
$ | | |
| Revenues | 202,504 | | 29,135 | | | | 231,639 | | | |
| Voyage expenses | (86,867) | | — | | | | (86,867) | | | |
| Vessel operating expenses | (35,747) | | (25,421) | | | | (61,168) | | | |
| Charter hire expenses | (13,789) | | (620) | | | | (14,409) | | | |
| Depreciation and amortization | (23,240) | | — | | | | (23,240) | | | |
| General and administrative expenses | (9,712) | | — | | | | (9,712) | | | |
| Gain on sale and write-down of assets | 38,163 | | — | | | | 38,163 | | | |
| | | | | | | | | | |
| Income from operations | 71,312 | | 3,094 | | | | 74,406 | | | |
| | | | | | | | | | |
| Equity income | 230 | | — | | | | 230 | | | |
| Non-segment reconciling items: | | | | | | | | | | |
| Interest income | | | | | | | 5,857 | | | |
| Interest expense | | | | | | | (773) | | | |
| | | | | | | | | | |
| Other expense | | | | | | | (4,158) | | | |
| Net income before income tax | | | | | | | 75,562 | | | |
TEEKAY TANKERS LTD. AND SUBSIDIARIES
NOTES TO THE UNAUDITED CONSOLIDATED FINANCIAL STATEMENTS
(all tabular amounts stated in thousands of U.S. Dollars, other than share or per share data)
A reconciliation of total segment assets to total assets, presented in the accompanying unaudited consolidated balance sheets is as follows:
| | | | | | | | | | | | | | |
| March 31, 2026 (1) | | December 31, 2025 (1) | | | |
| $ | | $ | | |
| Tankers | 1,347,310 | | | 1,341,547 | | | | |
| Marine Services and Other | 43,416 | | | 44,754 | | | | |
| Due from affiliates | 3,642 | | | 2,804 | | | | |
| Cash and cash equivalents | 722,009 | | | 830,569 | | | | |
| Short-term investments | 274,142 | | | 22,000 | | | | |
| Total assets | 2,390,519 | | | 2,241,674 | | | | |
(1)There are no differences between the measurements of the segment assets and the Company’s consolidated total assets.
5. Intangible Assets and Other Non-Current Assets
Intangible Assets
Intangible assets are included in goodwill and intangible assets on the Company's unaudited consolidated balance sheets.
As part of the European Union Emissions Trading System (or EU ETS) requirements, as at March 31, 2026, the Company had a balance of European Union allowances (or EUAs) totaling $19.1 million (December 31, 2025 - $11.6 million), which was recorded as indefinite-lived intangible assets. As at March 31, 2026, $11.0 million (December 31, 2025 - $11.6 million) of these intangible assets are presented as other current assets in the unaudited consolidated balance sheets as these EUAs are related to the Company's 2025 emissions levels and will be surrendered within one year from the balance sheet date, and the remaining $8.1 million (December 31, 2025 - $nil) of EUAs are related to the Company's 2026 emissions levels and will be surrendered more than one year from the balance sheet date.
The carrying amount of intangible assets, excluding EUAs classified as other current assets, is as follows:
| | | | | | | | | | | |
| As at |
| March 31, 2026 | | December 31, 2025 |
| $ | | $ |
| EUAs, at cost | 8,055 | | — |
| | | |
| 8,055 | | — |
Other Non-Current Assets
In December 2025, the Company signed agreements to acquire three 2016-built Aframax / LR2 tankers for a total purchase price of $141.5 million. The full purchase price of $94.3 million related to two of the tankers and a deposit of $4.7 million related to the remaining tanker were placed in an escrow account, which was recorded in other non-current assets in the Company's unaudited consolidated balance sheet as at December 31, 2025. The acquisition of the three tankers was completed during the first quarter of 2026, and the total payment of $99.0 million, which was previously recorded in other non-current assets, is included as part of vessels and equipment in the Company's unaudited consolidated balance sheet as at March 31, 2026.
TEEKAY TANKERS LTD. AND SUBSIDIARIES
NOTES TO THE UNAUDITED CONSOLIDATED FINANCIAL STATEMENTS
(all tabular amounts stated in thousands of U.S. Dollars, other than share or per share data)
6. Accrued Liabilities and Other Long-Term Liabilities
The following tables present the components of accrued liabilities and other long-term liabilities on the Company's unaudited consolidated balance sheets.
| | | | | | | | | | | |
Accrued Liabilities | As at |
| March 31, 2026 | | December 31, 2025 |
| $ | | $ |
| Voyage and vessel | 38,584 | | 41,020 |
| Payroll and benefits | 23,546 | | 30,750 |
| Obligation related to EU ETS | 11,020 | | 11,020 |
| | | |
| Other accrued liabilities | 2,215 | | 1,934 |
| Accrued liabilities | 75,365 | | 84,724 |
Obligation Related to EU ETS
As at March 31, 2026, the Company has recorded an obligation of $15.6 million (December 31, 2025 - $11.0 million) related to its emissions levels, of which $11.0 million (December 31, 2025 - $11.0 million) is related to the Company's 2025 emissions levels and was included as part of accrued liabilities and the remaining $4.6 million (December 31, 2025 - $nil) is related to the Company's 2026 emissions levels and is included as part of other-long term liabilities in the unaudited consolidated balance sheets. During the three months ended March 31, 2026, the Company also recognized expenses related to EU ETS of $4.6 million (2025 - $2.7 million) as part of voyage expenses in the unaudited consolidated statements of income.
| | | | | | | | | | | |
Other Long-Term Liabilities | As at |
| March 31, 2026 | | December 31, 2025 |
| $ | | $ |
Freight tax provision (note 15) | 31,423 | | 31,073 |
| Office lease liability - long term | 10,267 | | 8,216 |
Obligation related to EU ETS | 4,555 | | — |
| | | |
| Defined contribution pension liability | 3,980 | | 4,818 |
| Other | 1,655 | | 1,607 |
| Other long-term liabilities | 51,880 | | 45,714 |
7. Long-Term Debt
As at March 31, 2026, the Company had one revolving credit facility (or the 2023 Revolver), which, as at such date, provided for aggregate borrowings of up to $171.7 million (December 31, 2025 - $171.7 million), of which $171.7 million (December 31, 2025 - $171.7 million) was undrawn. The 2023 Revolver matures in May 2029, and interest payments are based on the Secured Overnight Financing Rate (or SOFR) plus a margin of 2.00%, which, if the 2023 Revolver had been drawn, would have resulted in an interest rate of 5.7% as of March 31, 2026 (December 31, 2025 - 5.7%). The Company is required to pay a commitment fee which is calculated based on 0.7% of the undrawn portion of the 2023 Revolver. During the three months ended March 31, 2026, total commitment fees paid were $0.3 million (2025 - $0.4 million), which is recorded as part of interest expense in the Company's unaudited consolidated statements of income. As of March 31, 2026, the total amount available under the 2023 Revolver was scheduled to decrease by $57.2 million (remainder of 2026), $49.7 million (2027), $43.3 million (2028), $21.5 million (2029). As of March 31, 2026, the 2023 Revolver was collateralized by 17 of the Company's vessels, together with other related security (note 19).
The 2023 Revolver requires the Company to maintain a minimum hull coverage ratio of 125% of the total outstanding drawn balance for the facility. This requirement is assessed on a semi-annual basis with reference to vessel valuations compiled by two or more agreed upon third parties. Should this ratio drop below the required amount, the lenders may request that the Company either prepay a portion of the loan in the amount of the shortfall or provide additional collateral in the amount of the shortfall, at the Company's option. As at March 31, 2026, the hull coverage ratio for the 2023 Revolver was not applicable due to no balance being drawn. In addition, the Company is required to maintain a minimum liquidity (cash, cash equivalents and undrawn committed revolving credit lines with at least six months to maturity) of the greater of $35.0 million and at least 5% of the Company's total consolidated debt. As at March 31, 2026, the Company was in compliance with all covenants in respect of the 2023 Revolver.
TEEKAY TANKERS LTD. AND SUBSIDIARIES
NOTES TO THE UNAUDITED CONSOLIDATED FINANCIAL STATEMENTS
(all tabular amounts stated in thousands of U.S. Dollars, other than share or per share data)
8. Operating Leases
The Company charters-in vessels from other vessel owners on time charter-in contracts, whereby the vessel owner provides use and technical operation of the vessel for the Company, and also on bareboat-in contracts, whereby the registered owner provides the vessel to the Company during which the Company is entirely responsible for the operation of the vessel, including technical services and the crew required for operation. Time charter-in contracts and bareboat-in contracts are typically for a fixed period of time, although in certain cases the Company may have the option to extend the charter. The Company typically pays the owner a daily hire rate that is fixed over the duration of the charter. Under time charter-in contracts, the Company is generally not required to pay the daily hire rate during periods the vessel is not able to operate, whereas this does not generally apply to bareboat-in contracts.
As at March 31, 2026, minimum commitments to be incurred by the Company under time charter-in contracts and bareboat-in contracts were approximately $27.3 million (remainder of 2026), $15.3 million (2027), $8.5 million (2028), and $7.4 million (2029).
9. Fair Value Measurements
For a description of how the Company estimates fair value and for a description of the fair value hierarchy levels, see "Item 18 – Financial Statements: Note 12" to the Company’s audited consolidated financial statements filed with its Annual Report on Form 20-F for the year ended December 31, 2025.
The following table includes the estimated fair value, carrying value and categorization using the fair value hierarchy of those assets and liabilities that are measured at their estimated fair value on a recurring and non-recurring basis, as well as certain financial instruments that are not measured at fair value on a recurring basis.
| | | | | | | | | | | | | | | | | | | | | | | | | | | | | | | | |
| | | | | March 31, 2026 | | December 31, 2025 |
| | | Fair Value Hierarchy Level | | Carrying
Amount
Asset / (Liability)
$ | | Fair
Value
Asset / (Liability)
$ | | Carrying Amount Asset / (Liability) $ | | Fair Value Asset / (Liability) $ |
| Recurring: | | | | | | | | | | |
Cash, cash equivalents and restricted cash (note 17) | | Level 1 | | 722,009 | | 722,009 | | 831,261 | | 831,261 |
Short-term investments | | Level 1 | | 274,142 | | 274,142 | | 22,000 | | 22,000 |
| | | | | | | | | |
Obligation related to EU ETS (note 6) (1) | | Level 1 | | (15,575) | | Note (1) | | (11,020) | | Note (1) |
| | | | | | | | | | |
| | | | | | | | | | |
| | | | | | | | | | |
| | | | | | | | | | |
| | | | | | | | | | |
| | | | | | | | | | |
| | | | | | | | | | |
| | | | | | | | | | |
| | | | | | | | | | |
| | | | | | | | | | |
| | | | | | | | | | |
| | | | | | | | | | |
| | | | | | | | | | |
| | | | | | | | | | |
| | | | | | | | | | |
| | | | | | | | | | |
| | | | | | | | | | |
(1)As at March 31, 2026, the Company has recorded an obligation related to EU ETS for $15.6 million, of which $11.0 million (December 31, 2025 - $11.0 million) was included as part of accrued liabilities and the remaining balance of $4.6 million (December 31, 2025 - $nil) was included as part of other-long term liabilities in the unaudited consolidated balance sheets. This amount can include an accrual representing the difference between the total emissions liability and the carrying value of the EUAs held as at the end of the reporting period. The fair value of the accrual is estimated using the fair market value of an EUA that is traded on a regulated energy exchange at the end of the reporting period. As at March 31, 2026, no such accrual was made as the total emissions liability was less than the carrying value of the EUAs held (December 31, 2025 - $nil).
The Company is exposed to credit loss in the event of non-performance by the financial institutions and the U.S. Government where its cash, cash equivalents and short-term investments are held. In order to minimize credit risk, the Company only places deposits and short-term investments with counterparties that are rated A- or better by Standard & Poor’s or A3 or better by Moody’s at the time of the transaction. In addition, to the extent practical, cash deposits and short-term investments are held by and entered into with different counterparties to reduce concentration risk.
10. Share Capital and Equity-Based Compensation
The authorized share capital of the Company at March 31, 2026 and December 31, 2025 was 100.0 million preference shares, with a par value of $0.01 per share, 485.0 million Class A common shares, with a par value of $0.01 per share, and 100.0 million Class B common shares, with a par value of $0.01 per share. A Class A common share entitles the holder to one vote per share while a Class B common share entitles the holder to five votes per share, subject to a 49% aggregate Class B common share voting power maximum. As of March 31, 2026, the Company had 30,017,861 Class A common shares (December 31, 2025 – 29,921,732), 4,625,997 Class B common shares (December 31, 2025 – 4,625,997) and no preference shares (December 31, 2025 – nil) issued and outstanding.
During the three months ended March 31, 2026 and 2025, the Company recognized $0.3 million and $0.2 million, respectively, of expenses related to restricted stock units in general and administrative expenses. During the three months ended March 31, 2025, a total of 2,905 restricted stock units with a market value of $0.1 million vested and 1,272 shares of Class A common stock, net of withholding taxes, were concurrently issued to the grantees.
TEEKAY TANKERS LTD. AND SUBSIDIARIES
NOTES TO THE UNAUDITED CONSOLIDATED FINANCIAL STATEMENTS
(all tabular amounts stated in thousands of U.S. Dollars, other than share or per share data)
11. Related Party Transactions
a.The Company and its subsidiaries have entered into management services agreements with Teekay and its affiliates (other than Teekay Tankers Ltd. and its subsidiaries) pursuant to which the Company provides services to Teekay and its affiliates in return for a management fee paid to the Company by Teekay. Amounts (paid) received by the Company for related party transactions for the periods indicated below were as follows:
| | | | | | | | | | | | | | | |
| | Three Months Ended March 31, | | |
| | 2026 | | 2025 | | | | |
| $ | | $ | | | | |
Transaction fee related to the sale of certain vessels (i) | (400) | | (700) | | | | |
Management fee revenues (ii) | 274 | | 489 | | | | |
| | | | | | | |
| | | | | | | |
| | | | | | | |
| | | | | | | |
| | | | | | | |
| | | | | | | |
| | | | | | | |
| | | | | | | |
| | | | | | | |
| | | | | | | |
| | | | | | | |
| | | | | | | |
| | | | | | | |
| | | | | | | |
(i)The Company pays a transaction fee to Teekay upon the sale of vessels that were previously owned by Tanker Investments Ltd., which the Company acquired in 2017. This fee is equal to 1.0% of the aggregate consideration payable to the Company pursuant to a sale contract. During the three months ended March 31, 2026, this fee was related to the sale of one vessel (2025 - two vessels).
(ii)The Company receives management fees from Teekay for time spent on Teekay matters by employees of the Company.
b.Teekay and its subsidiaries (other than Teekay Tankers Ltd. and its subsidiaries) may collect certain cash receipts and remit payments for certain expenses incurred by the Company. Such amounts, which are presented on the Company's unaudited consolidated balance sheets in "due from affiliates" or "due to affiliates", as applicable, are without interest or stated terms of repayment.
12. Vessel Sales and Write-down of Assets
During the three months ended March 31, 2026, the Company completed the sales of two Suezmax tankers for a total price of $73.0 million, with the Company recognizing an aggregate gain on sales of $22.7 million. One of the tankers as well as its related bunker and lube oil inventories were classified as held for sale as at December 31, 2025.
During the three months ended March 31, 2026, the Company agreed to sell one VLCC tanker for a price of $84.5 million, and the tanker as well as its related lube oil inventory were classified as held for sale as at March 31, 2026.
During the three months ended March 31, 2025, the Company completed the sales of two Aframax / LR2 tankers and two Suezmax tankers for a total price of for $120.5 million, with the Company recognizing an aggregate gain on sales of $39.0 million.
During the three months ended March 31, 2025, the Company recorded a write-down of $0.8 million on its operating lease right-of-use assets, which were written-down to their estimated fair values based on prevailing charter rates for comparable periods, due to a reduction in these charter rates.
13. Gain on Distribution and Equity Income from Equity-Accounted Investment
The Company has a 50% economic interest in a joint venture arrangement (or High-Q joint venture), which is jointly controlled by the Company and Wah Kwong Maritime Transport Holdings Limited. As at March 31, 2026, the High-Q joint venture no longer had any operational activities and is expected to be unwound during 2026.
During the three months ended March 31, 2026, the Company received a cash distribution from the High-Q joint venture in the amount of $1.5 million (2025 - $nil), which was recognized as part of gain on distribution and equity income from equity-accounted investment in the Company's unaudited consolidated statements of income. The Company does not have a contractual obligation to return any of the distribution received or provide additional financial support to the High-Q joint venture.
For the three months ended March 31, 2026, the Company recorded equity income of $nil (2025 - $0.2 million) which comprises its share of net income from the High-Q joint venture.
TEEKAY TANKERS LTD. AND SUBSIDIARIES
NOTES TO THE UNAUDITED CONSOLIDATED FINANCIAL STATEMENTS
(all tabular amounts stated in thousands of U.S. Dollars, other than share or per share data)
14. Other Income (Expense)
The components of other income (expense) are as follows:
| | | | | | | | | | | | | | | |
| Three Months Ended March 31, | | |
| 2026 | | 2025 | | | | |
| $ | | $ | | | | |
| Foreign exchange gain | 1,126 | | 431 | | | | |
Unrealized loss on marketable securities (1) | — | | (4,721) | | | | |
| | | | | | | |
| Other (expense) income | (305) | | 132 | | | | |
| Total | 821 | | (4,158) | | | | |
(1)The Company sold its entire investment in marketable securities during the fourth quarter of 2025.
15. Income Tax (Expense) Recovery
The components of the provision for income tax (expense) recovery are as follows:
| | | | | | | | | | | | | | | |
| Three Months Ended March 31, | | |
| 2026 | | 2025 | | | | |
| $ | | $ | | | | |
Current | (2,680) | | 424 | | | | |
Deferred | (1,319) | | 46 | | | | |
Income tax (expense) recovery | (3,999) | | 470 | | | | |
The following table reflects changes in uncertain tax positions relating to freight tax liabilities, which are recorded in other long-term liabilities in the Company's unaudited consolidated balance sheets:
| | | | | | | | | | | |
| Three Months Ended March 31, |
| 2026
$ | | 2025
$ |
| Balance as at January 1 | 31,073 | | 41,404 |
| Increases for positions related to the current year | 828 | | 170 |
| Increases for positions related to prior years | 927 | | 1,452 |
| | | |
| | | |
| Decreases related to expiry of limitation period | (1,494) | | (3,843) |
| Foreign exchange loss | 89 | | 1 |
| Balance as at March 31 | 31,423 | | 39,184 |
Included in the Company's current income tax (expense) recovery are provisions for uncertain tax positions relating to freight taxes. Positions relating to freight taxes can vary each period depending on the trading patterns of the Company's vessels.
The Company reviews its freight tax obligations on a regular basis and may update its assessment of its tax positions based on available information at that time. Such information may include legal advice as to the applicability of freight taxes in relevant jurisdictions. Freight tax regulations are subject to change and interpretation; therefore, the amounts recorded by the Company may change accordingly.
TEEKAY TANKERS LTD. AND SUBSIDIARIES
NOTES TO THE UNAUDITED CONSOLIDATED FINANCIAL STATEMENTS
(all tabular amounts stated in thousands of U.S. Dollars, other than share or per share data)
16. Earnings Per Share
The net income available for common shareholders and earnings per common share are presented in the table below:
| | | | | | | | | | | | | | | |
| | Three Months Ended March 31, | | |
| | 2026 | | 2025 | | | | |
| $ | | $ | | | | |
| Net income | 153,551 | | 76,032 | | | | |
| | | | | | | |
Weighted average number of common shares - basic (1) | 34,758,582 | | 34,482,849 | | | | |
| Dilutive effect of stock-based awards | 151,274 | | 183,868 | | | | |
| Weighted average number of common shares - diluted | 34,909,856 | | 34,666,717 | | | | |
| | | | | | | |
| Earnings per common share: | | | | | | | |
| – Basic | 4.42 | | 2.20 | | | | |
| – Diluted | 4.40 | | 2.19 | | | | |
(1) Includes unissued common shares related to non-forfeitable stock-based compensation.
Stock-based awards that have an anti-dilutive effect on the calculation of diluted earnings per common share are excluded from this calculation. In the periods where a loss attributable to shareholders has been incurred, all stock-based awards are anti-dilutive. For the three months ended March 31, 2026 and 2025, a total of 75,000 and 4,920 restricted stock units, respectively, had anti-dilutive effects on the calculation of diluted earnings per common share. For the three months ended March 31, 2026 and 2025, there were no options that had an anti-dilutive effect on the calculation of diluted earnings per common share.
17. Supplemental Cash Flow Information
Total cash and cash equivalents and restricted cash are as follows:
| | | | | | | | | | | | | | | | | | | | | | | |
| As at | | As at | | As at | | As at |
| March 31, 2026 | | December 31, 2025 | | March 31, 2025 | | December 31, 2024 |
| $ | | $ | | $ | | $ |
Cash and cash equivalents | 722,009 | | 830,569 | | 675,420 | | 511,888 |
Restricted cash – current (1) | — | | 692 | | 1,118 | | 3,673 |
| | | | | | | |
| | | | | | | |
| | | | | | | |
| 722,009 | | 831,261 | | 676,538 | | 515,561 |
(1) The Company maintained restricted cash deposits for the purpose of acquiring EUAs (note 5) and for the purpose of entering into forward freight agreements (or FFAs). As at December 31, 2025, the Company no longer maintained restricted cash deposits relating to FFAs.
The Company entered into new operating leases or extended existing operating leases for office premises and in-chartered vessels which resulted in the recognition of additional operating lease right-of-use assets and operating lease liabilities each in the amount of $3.5 million during the three months ended March 31, 2026 (2025 - $0.3 million). The increases to these balances had no cash impact.
18. Commitments and Contingencies
a)Liquidity
Management is required to assess if the Company will have sufficient liquidity to continue as a going concern for the one-year period following the issuance of these unaudited consolidated financial statements. Based on the Company's liquidity as at the date these unaudited consolidated financial statements were issued, and from the expected cash flows from the Company's operations over the following year, the Company estimates that it will have sufficient liquidity to meet its minimum liquidity requirements under its financial covenants and to continue as a going concern for at least a one-year period following the issuance of these unaudited consolidated financial statements.
b)Legal Proceedings and Claims
The Company may, from time to time, be involved in legal proceedings and claims that arise in the ordinary course of business. The Company believes that any adverse outcome of existing claims, individually or in the aggregate, would not have a material effect on its financial position, results of operations or cash flows, when taking into account its insurance coverage and indemnifications from charterers.
TEEKAY TANKERS LTD. AND SUBSIDIARIES
NOTES TO THE UNAUDITED CONSOLIDATED FINANCIAL STATEMENTS
(all tabular amounts stated in thousands of U.S. Dollars, other than share or per share data)
c)Other
The Company enters into indemnification agreements with certain officers and directors. In addition, the Company enters into other indemnification agreements in the ordinary course of business. The maximum potential amount of future payments required under these indemnification agreements is unlimited. However, the Company maintains what it believes is appropriate liability insurance that reduces its exposure and, subject to policy terms, would enable the Company to recover future amounts paid up to the maximum amount of the insurance coverage, less any deductible amounts pursuant to the terms of the respective policies, the amounts of which are not considered material.
19. Subsequent Events
a.In April 2026, eight tankers were released from collateral securing obligations under the 2023 Revolver, and the aggregate amount of borrowings available under the 2023 Revolver has been reduced by $60.5 million to $111.2 million (note 7).
b.In April 2026, the Company entered into an agreement to sell one 2009-built Suezmax tanker for $53.5 million. The tanker was delivered to its purchaser in May 2026.
c.In April 2026, the Company agreed to acquire two resale Suezmax tanker shipbuilding contracts for a total cost of $190.0 million. The vessels are being built at a South Korean shipyard and are expected to be delivered in 2027. The transaction will be completed upon the successful novation of the shipbuilding contracts and refund guarantees, which is expected to occur in May or June 2026.
d.In May 2026, the Company's Board of Directors declared a fixed quarterly cash dividend in the amount of $0.25 per outstanding common share for the quarter ended March 31, 2026. In addition, the Board of Directors declared a special cash dividend of $1.00 per common share. These dividends are payable on June 2, 2026 to all of Teekay Tankers Ltd.'s shareholders of record on May 26, 2026.
TEEKAY TANKERS LTD. AND SUBSIDIARIES
March 31, 2026
PART I - FINANCIAL INFORMATION
ITEM 2 – MANAGEMENT’S DISCUSSION AND ANALYSIS OF FINANCIAL CONDITION AND RESULTS OF OPERATIONS
The following Management’s Discussion and Analysis of Financial Condition and Results of Operations should be read in conjunction with the unaudited consolidated financial statements and accompanying notes contained in "Item 1 – Financial Statements" of this Report on Form 6-K and with our audited consolidated financial statements contained in "Item 18 – Financial Statements" and "Management’s Discussion and Analysis of Financial Condition and Results of Operations" in "Item 5 – Operating and Financial Review and Prospects" of our Annual Report on Form 20-F for the year ended December 31, 2025.
OVERVIEW
Our primary business is to own and operate crude oil and product tankers, and we employ a chartering strategy that seeks to capture upside opportunities in the tanker spot market while using fixed-rate charters and full service lightering (or FSL) contracts to reduce potential downside risks. Our mix of vessels trading in the spot market or subject to fixed-term charters will change from time to time. In addition to our core business, we also provide operational and maintenance marine services and ship-to-ship (or STS) support services, along with our tanker commercial management and technical management operations. As at March 31, 2026, our fleet consisted of 39 vessels, including five chartered-in vessels. The following table summarizes our fleet as at March 31, 2026:
| | | | | | | | | | | |
| Owned
Vessels | Chartered-in Vessels | Total |
|
| Fixed-rate: | | | |
| Suezmax Tankers | 3 | — | 3 |
Aframax Tankers / LR2 Product Tankers (1) | 5 | — | 5 |
| Total Fixed-Rate Fleet | 8 | — | 8 |
| | | |
| Spot-rate: | | | |
Suezmax Tankers (2)(3) | 12 | 1 | 13 |
Aframax Tankers / LR2 Product Tankers (4)(5) | 13 | 2 | 15 |
Very Large Crude Carrier (or VLCC) Tanker (6) | 1 | — | 1 |
Total Spot Fleet (7) | 26 | 3 | 29 |
STS Support and Bunker Tanker Vessels (8) | — | 2 | 2 |
| Total Teekay Tankers Fleet | 34 | 5 | 39 |
(1)Includes three Aframax tankers subject to bareboat charter-out contracts that are scheduled to expire during the second and third quarters of 2026. In May 2026, one of the tankers was redelivered to us following the expiry of its bareboat charter-out contract.
(2)Includes one owned Suezmax tanker for which an agreement was put in place in April 2026 to sell the vessel. The tanker was delivered to its purchaser in May 2026.
(3)One Suezmax tanker is time chartered-in for a period of 54 months expiring in June 2027 with an option to extend for one year.
(4)One Aframax / LR2 tanker is time chartered-in for a period expiring in February 2027 with no option to extend. One 2023-built Aframax / LR2 tanker is time chartered-in for a period expiring in January 2030 with three one-year extension option periods and a purchase option at the end of the second extension option period.
(5)Includes one owned Aframax / LR2 tanker for which a time charter-out contract was entered into us in May 2026 and which is scheduled to commence in late May 2026.
(6)Includes one owned VLCC tanker for which an agreement was put in place in February 2026 to sell the vessel. The tanker is trading on spot voyage charters in a pooling arrangement managed by a third party and is expected to be delivered to its purchaser in June 2026. The tanker is classified as held for sale as at March 31, 2026.
(7)As at March 31, 2026, a total of 28 of our owned and chartered-in vessels, as well as two vessels not in our fleet and owned by third parties, were subject to revenue sharing agreements (or RSAs).
(8)Includes one bunker tanker which we chartered-in for a period expiring in May 2029. This bunker tanker is also chartered-out by us for the same corresponding period.
ITEMS YOU SHOULD CONSIDER WHEN EVALUATING OUR RESULTS
There are a number of factors that should be considered when evaluating our historical financial performance and assessing our future prospects, and we use a variety of financial and operational terms and concepts when analyzing our results of operations. These items can be found in "Item 5 – Operating and Financial Review and Prospects" in our Annual Report on Form 20-F for the year ended December 31, 2025.
SIGNIFICANT DEVELOPMENTS IN 2026
Global Tariffs and Trade
During 2025 and 2026, the U.S. administration and other governments have announced or taken actions to implement new or increased tariffs on foreign imports and port fees. These actions have resulted and may result in additional retaliatory tariffs being levied on various goods and commodities, which may trigger trade wars. Additionally, in early 2026, the U.S. Supreme Court struck certain of the tariffs implemented by the U.S. administration, who thereafter reimplemented certain tariffs in response, which may cause additional uncertainty and increase geopolitical tensions. These activities have disrupted global markets, resulting in an increase in general global economic uncertainty, including an increased risk of economic recessions. In 2025, the U.S. and China announced new port fees that would apply to port calls of certain Chinese and U.S.-related tankers, respectively, which could be disruptive to our industry. These port fees subsequently have been suspended until October 2026. As a result of the rapidly changing and unpredictable geopolitical climate, the shipping industry is experiencing uncertainty as to future vessel demand, trade routes, rates and operating costs.
Geopolitical Conflicts
Geopolitical conflicts and related sanctions, export controls, and price caps have significantly affected us and our industry, including by disrupting energy supply chains and trading patterns, and causing instability and volatility in the global economy. These conflicts include, among others, Russia’s ongoing invasion of Ukraine, Houthi rebel attacks on vessels in the Red Sea area, U.S. action in Venezuela and the subsequent shift in trade towards the compliant fleet of tankers, and the recent U.S.-Israel war with Iran which has led to the effective closure of the Strait of Hormuz and a U.S. blockade of ships calling at Iranian ports. The latter conflict is particularly impactful for global oil and tanker markets as it has led to a virtual stoppage of tanker transits through the Strait of Hormuz and a significant decline in crude oil and refined product exports from the Middle East Gulf region. Resultant trading inefficiencies in the first two months of the conflict have supported spot tanker rates. However, a prolonged closure of the Strait of Hormuz could lead to a sustained shortage of global oil supply relative to demand, leading to high crude oil prices, oil demand destruction, and lower crude oil tanker demand. The escalation and expansion of hostilities in the Middle East and the possibility of continuing instability or further escalation in Ukraine, Venezuela or elsewhere could continue to affect the price of crude oil and the oil industry, the tanker industry and demand for our services.
Vessel Sales
During the first quarter of 2026, we sold two Suezmax tankers for a total price of $73.0 million, which resulted in an aggregate gain on sales of $22.7 million during the three months ended March 31, 2026. Both tankers were delivered to their purchasers during the first quarter of 2026.
In February 2026 and April 2026, we entered into agreements to sell one 2013-built VLCC tanker and one 2009-built Suezmax tanker, respectively, for a combined sales price of $138.0 million. The Suezmax tanker was delivered to its purchaser during the second quarter of 2026, and the VLCC tanker is expected to be delivered to its purchaser in June 2026.
Vessel Acquisitions
In January 2026, we completed the acquisitions of three 2016-bulit Aframax / LR2 tankers for a total purchase price of $141.5 million. Upon the completion of these purchases, we bareboat chartered out each tanker to the seller for periods between four months and eight months, after which we will assume commercial and technical management of the vessels. In May 2026, one of the tankers was redelivered to us following the expiry of its bareboat charter-out contract.
In April 2026, we agreed to acquire two resale Suezmax tanker shipbuilding contracts for a total cost of $190.0 million. The vessels are being built at a South Korean shipyard and are expected to be delivered in 2027. The transaction will be completed upon the successful novation of the shipbuilding contracts and refund guarantees, which is expected to occur in May or June 2026.
Time Chartered-in Vessel
During the first quarter of 2026, one chartered-in lightering support vessel was redelivered to its owner following the expiry of its time chartered-in contract.
Time Chartered-out Vessels
During the first and second quarters of 2026, we entered into time charter-out contracts for two Suezmax tankers and one Aframax / LR2 tanker for terms between 10 months and 12 months at an average rate of $64,000 per day, two of which charters commenced in the first quarter of 2026, while the remaining charter is scheduled to commence in the second quarter of 2026.
Special Cash Dividend Declaration
In May 2026, our Board of Directors declared a special cash dividend of $1.00 per common share. This dividend is payable on June 2, 2026 to all of Teekay Tankers Ltd.'s shareholders of record on May 26, 2026.
Revolving Credit Facility
In April 2026, eight tankers were released from collateral securing obligations under the 2023 Revolver, and the aggregate amount of borrowings available under the 2023 Revolver has been reduced by $60.5 million to $111.2 million.
RESULTS OF OPERATIONS
In accordance with GAAP, we report gross revenues in our unaudited consolidated statements of income and include voyage expenses among our operating expenses. However, ship-owners base economic decisions regarding the deployment of their vessels upon anticipated time-charter equivalent (or TCE) rates, which represent net revenues (or income or loss from operations before vessel operating expenses, charter hire expenses, depreciation and amortization, general and administrative expenses, and gain or loss on sale and write-down of assets), which includes voyage expenses, divided by revenue days; in addition, industry analysts typically measure bulk shipping freight and hire rates in terms of TCE rates. This is because under time charter-out and bareboat charter-out contracts, the customer usually pays the voyage expenses, while under voyage charters the ship-owner usually pays the voyage expenses, which typically are added to the hire rate at an approximate cost. Accordingly, the discussion of revenue below focuses on net revenues and TCE rates (both of which are non-GAAP financial measures) where applicable.
The results of operations that follow have been divided into (a) tankers, which consists of the operation of all of our Suezmax, Aframax / LR2 and VLCC tankers (including the operations from those of our tankers employed on full service lightering contracts), and our U.S. based ship-to-ship support service operations (including our lightering support services provided as part of full service lightering operations); and (b) marine services and other, which consists of operational and maintenance marine services provided to the Australian government, Australian energy companies and other third parties, as well as management services provided to Teekay and third parties.
Summary
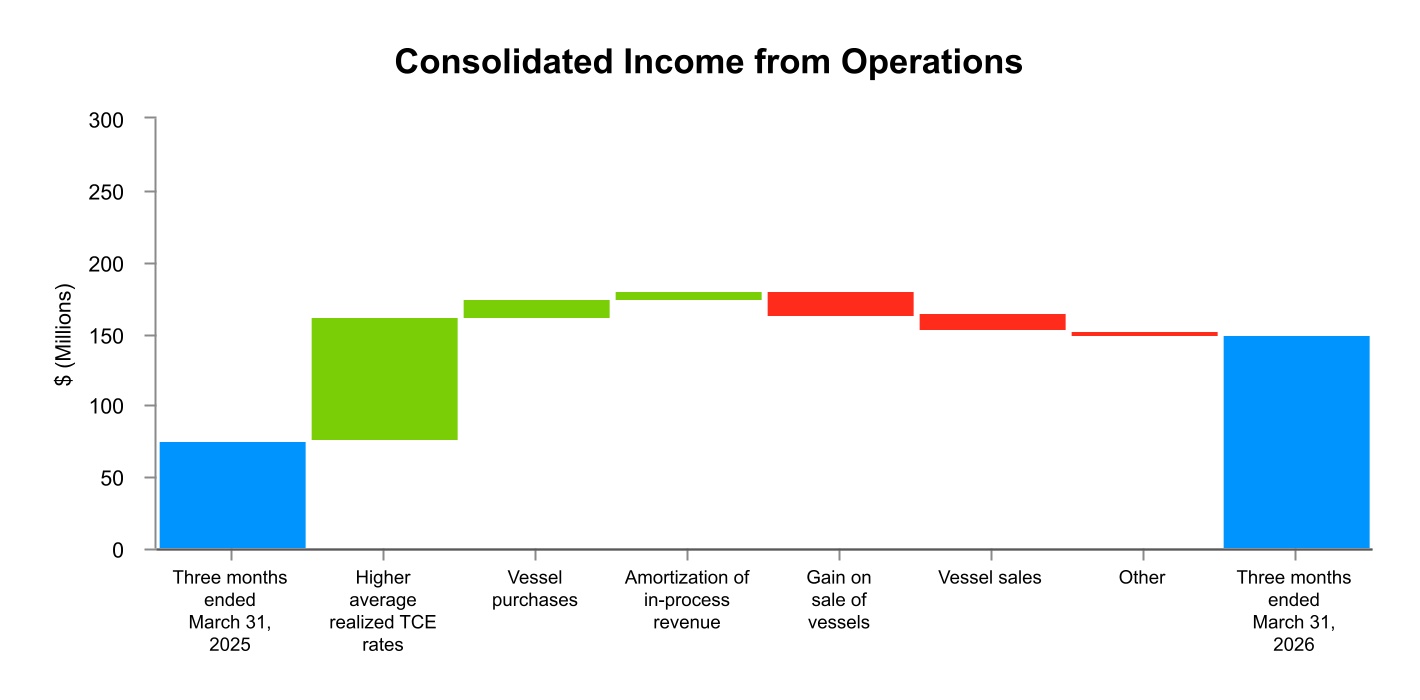
Our consolidated income from operations was $147.7 million for the three months ended March 31, 2026, compared to $74.4 million in the same period last year. The primary reasons for this increase in income are as follows:
•an increase of $85.8 million as a result of higher overall average realized spot TCE rates earned by our Suezmax tankers and Aframax / LR2 tankers in the first quarter of 2026 compared to the same period in the prior year;
•an increase of $13.2 million due to the acquisitions of four Aframax / LR2 tankers, one Suezmax tanker, and one VLCC tanker between the start of the second quarter of 2025 and the end of the first quarter of 2026; and
•an increase of $5.5 million due to the amortization of in-process revenue related to the acquisition of the three Aframax / LR2 tankers in the first quarter of 2026;
partially offset by:
•a decrease of $16.3 million due to the gain on sales of two Suezmax tankers in the first quarter of 2026 compared to the gain on sales of two Aframax / LR2 tankers and two Suezmax tankers in the first quarter of 2025; and
•a decrease of $11.5 million due to the sales of 10 Suezmax tankers and three Aframax / LR2 tankers between the start of the first quarter of 2025 and the end of first quarter of 2026.
Details of the changes to our results of operations for the three months ended March 31, 2026, compared to the three months ended March 31, 2025, are provided below.
Three Months Ended March 31, 2026 versus Three Months Ended March 31, 2025
Tankers - Operating Results
We own and operate crude oil and product tankers that (i) are subject to long-term, fixed-rate time-charter contracts (which have an original term of one year or more), (ii) operate in the spot tanker market, (iii) are subject to time charters that are priced on a spot market basis or are short-term, fixed-rate contracts (which have original terms of less than one year), including those employed on FSL contracts, or (iv) are subject to short-term bareboat charter contracts. In addition, we provide STS support services, along with our tanker commercial management and technical management services.
The following table presents the Tankers' operating results for the three months ended March 31, 2026 and 2025, and includes a comparison of net revenues(1), a non-GAAP financial measure, for those periods to income from operations, the most directly comparable GAAP financial measure:
| | | | | | | | | | | | | | | | | | | | | | | |
| Three Months Ended March 31, | | |
| (in thousands of U.S. Dollars, except percentage changes) | 2026 | | 2025 | | % Change | | | | | | |
| Revenues | 253,871 | | | 202,504 | | | 25.4 | % | | | | | | |
| Voyage expenses | (57,615) | | | (86,867) | | | (33.7) | % | | | | | | |
Net revenues(1) | 196,256 | | | 115,637 | | | 69.7 | % | | | | | | |
| | | | | | | | | | | |
| Vessel operating expenses | (31,013) | | | (35,747) | | | (13.2) | % | | | | | | |
| Charter hire expenses | (9,058) | | | (13,789) | | | (34.3) | % | | | | | | |
| Depreciation and amortization | (22,188) | | | (23,240) | | | (4.5) | % | | | | | | |
| General and administrative expenses | (10,380) | | | (9,712) | | | 6.9 | % | | | | | | |
| Gain on sale and write down of assets | 22,656 | | | 38,163 | | | (40.6) | % | | | | | | |
| | | | | | | | | | | |
| Income from operations | 146,273 | | | 71,312 | | | 105.1 | % | | | | | | |
| | | | | | | | | | | |
| | | | | | | | | | | |
| | | | | | | | | | | |
| Gain on distribution and equity income from equity-accounted investment | 1,500 | | | 230 | | | 552.2 | % | | | | | | |
| | | | | | | | | | | |
| | | | | | | | | | | |
| | | | | | | | | | | |
| | | | | | | | | | | |
(1)This is a non-GAAP financial measure. Please refer to "Item 2 – Management's Discussion and Analysis of Financial Condition and Results of Operations - Non-GAAP Financial Measure" for a definition and reconciliation of this non-GAAP financial measure to the most directly comparable financial measure calculated and presented in accordance with GAAP.
Net Revenues. Net revenues were $196.3 million for the three months ended March 31, 2026, compared to $115.6 million for the same period in the prior year.
The net increase for the three months ended March 31, 2026 compared to the same period in the prior year was primarily the result of:
•an increase of $85.8 million for the three months ended March 31, 2026 due to higher overall average realized spot TCE rates earned by our Suezmax tankers and Aframax / LR2 tankers compared to the same period in the prior year;
•an increase of $5.5 million for the three months ended March 31, 2026 due to the amortization of in-process revenue related to the acquisition of the three Aframax / LR2 tankers in the first quarter of 2026; and
•an increase of $2.7 million for the three months ended March 31, 2026 primarily due to certain vessels commencing on time charter-out contracts at various times and earning a higher average rate compared to the rate from the comparative period;
partially offset by:
•a net decrease of $10.0 million for the three months ended March 31, 2026 due to the sales of 10 Suezmax tankers and three Aframax / LR2 tankers between the start of the first quarter of 2025 and the end of first quarter of 2026, as well as the redeliveries of two chartered-in tankers to their owners between the start of the first quarter of 2025 and the end of the third quarter of 2025, partially offset by the acquisitions of four Aframax / LR2 tankers, one Suezmax tanker, and one VLCC tanker between the start of the second quarter of 2025 and the end of the first quarter of 2026;
•a decrease of $2.5 million for the three months ended March 31, 2026 due to lower revenues related to certain STS support service activities compared to the same period in the prior year; and
•a decrease of $0.8 million for the three months ended March 31, 2026 due to more dry-docking related off-hire days and higher off-hire bunker expenses related to the timing of dry dockings compared to the same period in the prior year.
Vessel Operating Expenses. Vessel operating expenses were $31.0 million for the three months ended March 31, 2026, compared to $35.7 million for the same period in the prior year.
The net decrease for the three months ended March 31, 2026 compared to the same period in the prior year was primarily the result of:
•a net decrease of $4.7 million resulting from the sales of ten Suezmax tankers and three Aframax / LR2 tankers between the start of the first quarter of 2025 and the end of the first quarter of 2026, partially offset by the acquisition of one Aframax / LR2 tanker, one Suezmax tanker and one VLCC tanker between the start of the second quarter of 2025 and the end of the third quarter of 2025; and
•a decrease of $0.5 million resulting from lower expenditures related to certain STS support service activities during the first quarter of 2026;
partially offset by:
•an increase of $0.6 million resulting from higher repair and maintenance related expenditures during the first quarter of 2026.
Charter Hire Expenses. Charter hire expenses were $9.1 million for the three months ended March 31, 2026, compared to $13.8 million for the same period in the prior year. The decrease was primarily due to the redeliveries of two chartered-in tankers to their owners between the start of the first quarter of 2025 and the end of the third quarter of 2025.
Depreciation and Amortization. Depreciation and amortization was $22.2 million for the three months ended March 31, 2026, compared to $23.2 million for the same period in the prior year. The net decrease was primarily due to the sales of ten Suezmax tankers and three Aframax / LR2 tankers between the start of the first quarter of 2025 and the end of the first quarter of 2026, partially offset by the acquisitions of four Aframax / LR2 tankers, one Suezmax tanker and one VLCC tanker between the start of the second quarter of 2025 and the end of the first quarter of 2026, as well as the dry docks of certain vessels that are subject to a shorter amortization period compared to the previous dry docks.
General and Administrative Expenses. General and administrative expenses were $10.4 million for the three months ended March 31, 2026, compared to $9.7 million for the same period in the prior year. The increase was primarily due to higher costs related to compensation and benefits, partially offset by lower general corporate expenditures.
Gain on Sale and Write-Down of Assets. The gain on sale of assets of $22.7 million for the three months ended March 31, 2026 was related to the sales of two Suezmax tankers.
The gain on sale and write-down of assets of $38.2 million for the three months ended March 31, 2025 was related to:
•the sales of two Aframax / LR2 tankers and two Suezmax tankers, which resulted in an aggregate gain on sales of $39.0 million during the first quarter of 2025;
partially offset by:
•the impairment recorded for two of our operating lease right-of-use assets resulting from a decline in the prevailing short-term time-charter rates, which resulted in a write-down of $0.8 million during the first quarter of 2025.
Gain on Distribution and Equity Income from Equity-accounted Investment. Gain on distribution from equity-accounted investment was $1.5 million for the three months ended March 31, 2026, compared to equity income of $0.2 million for the same period in the prior year. The increase was primarily due to a $1.5 million gain recognized on the receipt of a cash distribution from the equity-accounted joint venture in the first quarter of 2026.
Tanker Market
The effective closure of the Strait of Hormuz due to conflict in the Middle East has led to unprecedented disruption to global oil and tanker markets. As a result, mid-size crude tanker spot rates rose to the second highest level for a first quarter on record during the first quarter of 2026, with rates increasing further to all-time highs at the start of the second quarter of 2026.
Prior to the conflict in the Middle East, mid-size crude tanker spot rates were already at very firm levels due to a combination of rising seaborne oil trade volumes, a tightening of sanctions against Russia, Iran, and Venezuela (which pushed more trade volumes away from the “dark fleet” towards the compliant fleet of tankers), and the impact of fleet consolidation in the VLCC sector. This was further amplified at the start of 2026 with the removal of Venezuelan President Nicolás Maduro by the United States and the subsequent freeing up of Venezuelan crude oil exports to move on compliant tonnage to destinations such as the U.S. Gulf, Europe, and India, to the benefit of mid-size crude tanker demand.
However, it is the recent events in the Middle East which have propelled spot tanker rates to new highs. Following the commencement on February 28, 2026 of attacks by the United States and Israel against Iran, Iran has responded by attacking a range of military and civilian assets across the Middle East region, including vessels transiting the Strait of Hormuz. The U.S. has also imposed a blockade on the strait. This has led to a significant drop in vessel traffic through the Strait of Hormuz due to safety concerns, which in turn has led to a sharp decline in Middle East oil production and exports. While Saudi Arabia and the UAE have been able to divert some of their export volumes to ports outside of the Middle East Gulf, total crude oil exports from the region have fallen by approximately 10 million barrels per day (mb/d) compared to pre-war levels.
Ordinarily, an oil supply loss of this magnitude would likely be negative for tanker demand due to the steep drop in cargo supply. However, a series of trading inefficiencies have coincided to boost spot tanker rates in the weeks following the start of the conflict.
Firstly, a number of vessels are trapped and unable to exit the Middle East Gulf via the Strait of Hormuz, which has reduced effective fleet supply, most notably in the VLCC sector where approximately 8% of the non-sanctioned fleet is currently idled.
Secondly, the rush to find replacement barrels, particularly by Asian refiners which have been most impacted by the loss of Middle East oil, has led to a sharp upturn in Atlantic basin crude oil exports, with volumes increasing by almost 4 mb/d between January 2026 and April 2026. This has been most evident in the U.S. Gulf, where crude oil exports reached a record high of 5.5 mb/d in April 2026, boosted by the release of oil from the U.S. Strategic Petroleum Reserve.
Finally, average voyage distances have increased substantially due to an increase in vessels ballasting long-haul from the Pacific to Atlantic basin, with a large proportion of these vessels sailing back to Asia once loaded in order to meet Asian refinery demand.
As of the date of this release, the two sides in the conflict continue to be in a stand-off and the Strait of Hormuz remains effectively closed. Until this is resolved, we anticipate that oil and tanker markets will exhibit high levels of volatility and unpredictability. The ultimate impact on the global economy, oil supply / demand, and spot tanker rates, will depend on the duration of the conflict and the manner in which it is resolved.
Tankers - Fleet and TCE Rates
As at March 31, 2026, we owned 34 double-hulled oil and product tankers and time chartered-in two Aframax / LR2 tankers, one Suezmax tanker, one bunker tanker and one STS support vessel.
The following tables highlight the operating performance of our spot vessels (including those trading on voyage charters, in RSAs and in FSL) and our time charter-out and bareboat charter-out vessels, measured in TCE rates, or net voyage per revenue day before costs to commercially manage our vessels, and off-hire bunker expenses:
| | | | | | | | | | | | | | | | | | | | |
| Three Months Ended March 31, 2026 |
| Revenues (1) | Voyage Expenses (2) | Adjustments (3) | TCE Revenues | Revenue Days | Average TCE per Revenue Day (3) |
| (in thousands) | (in thousands) | (in thousands) | (in thousands) | | |
| | | | | | |
| Voyage-charter contracts - Suezmax | $ | 114,172 | | $ | (30,276) | | $ | 231 | | $ | 84,127 | | 1,354 | | $ | 62,124 | |
Voyage-charter contracts - Aframax / LR2 (4) | $ | 109,952 | | $ | (29,207) | | $ | 111 | | $ | 80,856 | | 1,349 | | $ | 59,934 | |
Voyage-charter contracts - VLCC (5) | $ | 6,969 | | $ | 699 | | $ | 167 | | $ | 7,835 | | 89 | | $ | 87,974 | |
| Time charter-out contracts - Suezmax | $ | 6,092 | | $ | (498) | | $ | — | | $ | 5,594 | | 125 | | $ | 44,755 | |
| Time charter-out contracts - Aframax / LR2 | $ | 5,439 | | $ | (188) | | $ | 79 | | $ | 5,330 | | 164 | | $ | 32,507 | |
| Bareboat charter-out contracts - Aframax / LR2 | $ | 2,877 | | $ | (20) | | $ | 20 | | $ | 2,877 | | 243 | | $ | 11,850 | |
| Total | $ | 245,501 | | $ | (59,490) | | $ | 608 | | $ | 186,619 | | 3,324 | | $ | 56,142 | |
(1)Excludes $5.5 million of in-process revenue amortization related to our bareboat charter-out contracts for the three Aframax vessels that we acquired in January 2026, $2.4 million of revenues related to our STS support services operations, $0.3 million of revenue earned from our responsibilities in employing the vessels subject to the RSAs, and $0.2 million of revenues related to certain bunker related activities.
(2)Includes $1.9 million of operating expenses related to providing lightering support services to our FSL operations.
(3)Adjustments primarily include off-hire bunker expenses, which are excluded from Average TCE per Revenue Day.
(4)Includes $33.0 million of revenues and $9.0 million of voyage expenses related to our Aframax / LR2 FSL operations.
(5)Includes one VLCC tanker, which was acquired by us from our 50/50 joint venture in August 2025 and is trading in a pooling arrangement managed by a third-party.
| | | | | | | | | | | | | | | | | | | | |
| Three Months Ended March 31, 2025 |
| Revenues (1) | Voyage Expenses (2) | Adjustments (3) | TCE Revenues | Revenue Days | Average TCE per Revenue Day (3) |
| (in thousands) | (in thousands) | (in thousands) | (in thousands) | | |
| | | | | | |
Voyage-charter contracts - Suezmax (4) | $ | 108,765 | | $ | (51,532) | | $ | 256 | | $ | 57,489 | | 2,148 | | $ | 26,765 | |
Voyage-charter contracts - Aframax / LR2 (4) | $ | 83,878 | | $ | (36,698) | | $ | (19) | | $ | 47,161 | | 1,694 | | $ | 27,846 | |
| | | | | | |
| Time charter-out contracts - Aframax / LR2 | $ | 4,478 | | $ | (58) | | $ | 3 | | $ | 4,423 | | 90 | | $ | 49,149 | |
| Total | $ | 197,121 | | $ | (88,288) | | $ | 240 | | $ | 109,073 | | 3,932 | | $ | 27,743 | |
(1)Excludes $4.9 million of revenues related to our STS support services operations, $0.3 million of revenues related to certain bunker related activities, and $0.3 million of revenue earned from our responsibilities in employing the vessels subject to the RSAs.
(2)Includes $1.4 million of operating expenses related to providing lightering support services to our FSL operations.
(3)Adjustments primarily include off-hire bunker expenses, which are excluded from Average TCE per Revenue Day.
(4)Includes $8.7 million of revenues and $5.6 million of voyage expenses related to our Suezmax FSL operations, and $5.8 million of revenues and $2.5 million of voyage expenses related to our Aframax / LR2 FSL operations.
Marine Services and Other - Operating Results
As part of our Australian operations, we provide marine services to the Australian government, energy companies and other third parties. Our marine services business in Australia provides operations, supply, maintenance and engineering support, as well as crewing and training services, primarily under long-term contracts with the Commonwealth of Australia, for 12 Australian government-owned vessels. In addition, we provide technical and crewing management services for two patrol boats; we also bareboat charter-in a bunker tanker which we have time chartered-out to a third party. Marine Services and Other also consists of management services provided to Teekay and third parties.
The following table presents the Marine Services and Other operating results for the three months ended March 31, 2026 and 2025:
| | | | | | | | | | | | | | | | | | | | | | | |
| Three Months Ended March 31, | | |
| (in thousands of U.S. Dollars, except percentage changes) | 2026 | | 2025 | | % Change | | | | | | |
| Revenues | 32,223 | | | 29,135 | | | 10.6% | | | | | | |
| Vessel operating expenses | (30,204) | | | (25,421) | | | 18.8% | | | | | | |
| Charter hire expenses | (620) | | | (620) | | | —% | | | | | | |
| | | | | | | | | | | |
| | | | | | | | | | | |
| Income from operations | 1,399 | | | 3,094 | | | (54.8)% | | | | | | |
Income from operations for Marine Services and Other was $1.4 million for the three months ended March 31, 2026, compared to $3.1 million for the same period in the prior year. The decrease was primarily due to lower results from our operational and maintenance marine services in Australia related to higher compensation and crewing-related expenditures, partially offset by providing additional technical and crewing management services that commenced between the start of the fourth quarter of 2025 and the end of the first quarter of 2026.
Other Consolidated Operating Results
The following table compares our other consolidated operating results for the three months ended March 31, 2026 and 2025:
| | | | | | | | | | | | | | | | | | | | | | | |
| Three Months Ended March 31, | | |
| (in thousands of U.S. Dollars, except percentage changes) | 2026 | | 2025 | | % Change | | | | | | |
| Interest income | 8,046 | | | 5,857 | | | 37.4 | % | | | | | | |
| Interest expense | (489) | | | (773) | | | (36.7) | % | | | | | | |
| Other income (expense) | 821 | | | (4,158) | | | (119.7) | % | | | | | | |
| Income tax (expense) recovery | (3,999) | | | 470 | | | (950.9) | % | | | | | | |
Interest Income. Interest income was $8.0 million for the three months ended March 31, 2026, compared to $5.9 million for the same period in the prior year. The net increase was primarily due to higher average balances for cash and short-term investments, partially offset by a lower average interest rate.
Interest Expense. Interest expense was $0.5 million for the three months ended March 31, 2026, compared to $0.8 million for the same period in the prior year. The decrease was primarily due to lower fees related to our 2023 Revolver.
Other Income (Expense). Other income was $0.8 million for the three months ended March 31, 2026, compared to other expense of $4.2 million for the same period in the prior year. The change was primarily due to an unrealized loss recognized in the first quarter of 2025 on our investment in marketable securities, all of which were sold during the fourth quarter of 2025, as well as changes in foreign currency exchange rates related to our accrued tax and working capital balances.
Income Tax (Expense) Recovery. Income tax expense was $4.0 million for the three months ended March 31, 2026, compared to income tax recovery of $0.5 million for the same period in the prior year. The change was primarily due to lower recoveries during the first quarter of 2026 related to the expiry of the tax limitation period in certain jurisdiction, changes in vessel trading activities, as well as fluctuations in current income taxes and deferred income tax balances related to certain jurisdictions. For additional information, please read "Item 1 – Financial Statements: Note 15 - Income Tax (Expense) Recovery" of this report.
LIQUIDITY AND CAPITAL RESOURCES
Sources and Uses of Capital
We generate cash flows primarily from chartering out our vessels, from managing vessels for the Australian government and from providing management services to Teekay and certain third parties. We employ a chartering strategy for our tanker segment that seeks to capture upside opportunities in the tanker spot market while using fixed-rate charters to reduce potential downside risks. Our short-term charters and spot market tanker operations contribute to the volatility of our net operating cash flow, and thus may impact our ability to generate sufficient cash flows to meet our short-term liquidity needs. Historically, the tanker industry has been cyclical, experiencing volatility in profitability and asset values resulting from changes in the supply of, and demand for, vessel capacity. In addition, tanker spot markets historically have exhibited seasonal variations in charter rates. Tanker spot markets are typically stronger in the winter months as a result of increased oil consumption in the northern hemisphere and unpredictable weather patterns that tend to disrupt vessel scheduling. However, there can be other factors that override typical seasonality, such as geopolitical events, sanctions and other factors which influence oil trade routes and tonne-mile supply and demand. While exposure to the volatile spot market is the largest potential cause for changes in our net operating cash flow from period to period, variability in our net operating cash flow also reflects changes in interest rates, fluctuations in working capital balances, the timing and the amount of dry-docking expenditures, repairs and maintenance activities, the average number of vessels in service, including chartered-in vessels, and vessel acquisitions or vessel dispositions, among other factors. The number of vessel dry dockings varies each period depending on vessel maintenance schedules.
Our other primary sources of cash are interest income from short-term investments, long-term bank borrowings, lease or equity financings, and proceeds from the sales of older vessels.
As of March 31, 2026, we have one credit facility, our 2023 Revolver, with no balance drawn, and we had no vessels subject to finance leases. Our 2023 Revolver is described in "Item 1 – Financial Statements: Note 7 - Long-Term Debt" of this report. Our 2023 Revolver contains covenants and other restrictions that we believe are typical of debt financing collateralized by vessels, including those that restrict the relevant subsidiaries from: incurring or guaranteeing additional indebtedness; making certain negative pledges or granting certain liens; and selling, transferring, assigning or conveying assets. Our 2023 Revolver requires us to maintain certain financial covenants. The terms of and compliance with these financial covenants are described in further detail in "Item 1 – Financial Statements: Note 7 - Long-Term Debt" of this report. If we do not meet these financial or other covenants, the lenders may declare our obligations under the agreement immediately due and payable and terminate any further loan commitments, which depending upon our other liquidity at the time, could significantly affect our short-term liquidity requirements. As at March 31, 2026, we were in compliance with all covenants under our 2023 Revolver. Our 2023 Revolver requires us to make interest payments based on SOFR plus a margin. Depending upon the amount of our floating-rate credit facility and balance from time to time, significant increases in interest rates could adversely affect our results of operations and our ability to service our debt. From time to time, we use interest rate swaps to reduce our exposure to market risk from changes in interest rates. As at March 31, 2026, we were not committed to any interest rate swap agreements.
Our primary uses of cash include the payment of operating expenses, dry-docking expenditures, costs associated with modifications to our vessels, funding our other working capital requirements, dividend payments on our common shares, repurchase of our Class A common shares under our share repurchase program, debt servicing costs, as well as scheduled repayments of long-term debt. In addition, we may use cash to acquire new or second-hand vessels. The timing of the acquisition of vessels depends on a number of factors, including newbuilding prices, second-hand vessel values, the age, condition and size of our existing fleet, the commercial outlook for our vessels and other considerations. As such, vessel acquisition activity may vary significantly from year-to-year.
Cash Flows
The following table summarizes our consolidated cash and cash equivalents provided by (used for) operating, financing and investing activities for the periods presented:
| | | | | | | | | | | | | | |
| | | Three Months Ended March 31, |
| | 2026 | | 2025 |
| (in thousands of U.S. Dollars) | | $ | | $ |
| Net cash flow provided by operating activities | | 119,606 | | 57,624 |
| Net cash flow used for financing activities | | (7,589) | | (8,527) |
| Net cash flow (used for) provided by investing activities | | (221,269) | | 111,880 |
Net Operating Cash Flow
The $62.0 million increase in net operating cash flow for the three months ended March 31, 2026, compared to the same period in 2025 was primarily due to:
•a net increase of $87.1 million in cash inflows primarily due to higher operating earnings during the first quarter of 2026 resulting from higher average realized spot tanker rates, as well as the acquisitions of four Aframax / LR2 tankers, one Suezmax tanker and one VLCC tanker between the start of the second quarter of 2025 and the end of the first quarter of 2026, partially offset by the sales of 10 Suezmax tankers and three Aframax / LR2 tankers between the start of the first quarter of 2025 and the end of the first quarter of 2026;
partially offset by:
•a decrease of $23.1 million in cash inflows related to changes in net working capital during the first quarter of 2026 compared to the same period of the prior year; and
•an increase of $2.0 million in cash outflows related to expenditures for dry-docking activities during the first quarter of 2026 compared to the same period of the prior year.
Net Financing Cash Flow
The $0.9 million decrease in net cash flow used for financing activities for the three months ended March 31, 2026, compared to the same period in 2025, was primarily due to a decrease in cash outflows resulting from activities related to equity-based compensation during the first quarter of 2026 compared to the same period in the prior year.
Net Investing Cash Flow
Net cash flow used for investing activities was $221.3 million for the three months ended March 31, 2026 compared with net cash flow provided by investing activities of $111.9 million for the three months ended March 31, 2025. The $333.1 million change between these periods was primarily due to:
•an increase of $252.1 million in cash outflows resulting from a net increase in our short-term investments during the first quarter of 2026;
•a decrease of $48.5 million in cash inflows resulting from lower net proceeds received from the sales of two Suezmax tankers during the first quarter of 2026 compared to net proceeds received from the sales of two Aframax / LR2 tankers and two Suezmax tankers in the same period of the prior year;
•an increase of $42.4 million in cash outflows resulting from the payment of the remaining balance for the acquisition of three Aframax / LR2 tankers during the first quarter of 2026; and
•an increase of $1.5 million in cash inflows resulting from a distribution from our equity-accounted joint venture during the first quarter of 2026;
partially offset by:
•a decrease of $6.3 million in cash outflows resulting from a deposit paid for the purchase of an Aframax / LR2 tanker during the first quarter of 2025; and
•a decrease of $2.3 million in cash outflows resulting from an investment in marketable securities during the first quarter of 2025.
Liquidity
Our primary sources of liquidity are cash and cash equivalents, short-term investments, net operating cash flow, our undrawn credit facility, and capital raised through financing transactions. The primary objectives of our cash management policy are to preserve capital, to ensure that cash investments can be sold readily and efficiently, and to provide an appropriate return. The nature and extent of amounts that can be borrowed under our 2023 Revolver are described in "Item 1 – Financial Statements: Note 7- Long-Term Debt" of this report. In April 2026, eight tankers were released from collateral securing obligations under the 2023 Revolver, and the aggregate amount of borrowings available under the 2023 Revolver has been reduced by $60.5 million to $111.2 million.
For information on our dividend policy and share repurchase program, please see "Management’s Discussion and Analysis of Financial Condition and Results of Operations - Liquidity and Capital Resources" in "Item 5 – Operating and Financial Review and Prospects" in our Annual Report on Form 20-F for the year ended December 31, 2025.
Our total consolidated liquidity, including cash, cash equivalents, short-term investments and undrawn credit facility, increased by $143.6 million during the three months ended March 31, 2026 from $1.0 billion as at December 31, 2025 to $1.2 billion as at March 31, 2026. The net increase during the three months ended March 31, 2026 was primarily a result of the following events or changes: $119.6 million of net operating cash inflow during the first quarter of 2026; $72.3 million received from the sale of two Suezmax tankers; a $1.5 million distribution received from our equity-accounted joint venture; and $1.1 million of proceeds received upon the exercise of stock options; partially offset by $42.4 million paid towards the purchase of three Aframax / LR2 tankers; and $8.7 million of cash dividends paid on our common shares.
We anticipate that our liquidity at March 31, 2026, combined with cash we expect to generate during the 12 months following the date of this report, will be sufficient to meet our cash requirements for at least the one-year period following the date of this report.
Our 2023 Revolver matures in May 2029, and there was no amount outstanding under the facility as at March 31, 2026. Our ability to refinance our 2023 Revolver will depend upon, among other things, the estimated market value of our vessels, our financial condition and the condition of credit markets at such time. In April 2026, we agreed to acquire two resale Suezmax tanker shipbuilding contracts for a total cost of $190.0 million. The vessels are being built at a South Korean shipyard and are expected to be delivered in 2027. The transaction will be completed upon the successful novation of the shipbuilding contracts and refund guarantees, which is expected to occur in May or June 2026. In May 2026, an installment of $33.4 million related to these vessel acquisitions was paid and placed in an escrow account, and we will pay the remaining balance of $156.6 million in installments which are due at various dates up to the delivery of the vessels in 2027. Approximately 65% of our fleet is currently aged 15 years and older, and we intend to continue the process of fleet renewal in the coming years. We expect that any fleet renewal expenditures will be funded using cash on hand, short-term investments, the undrawn revolving credit facility and new financing arrangements, including bank borrowings, finance leases and, potentially, the issuance of debt and equity securities.
The following table summarizes our other contractual obligations as at March 31, 2026:
| | | | | | | | | | | | | | | | | | |
| | | | | | |
| (in millions of U.S. Dollars) | Total | 12 Months Following March 31, 2026 | Remainder of 2027 | 2028 | 2029 | |
| U.S. Dollar-Denominated Obligations | | | | | | |
| | | | | | |
| | | | | | |
| | | | | | |
Chartered-in vessels (operating leases) (1) | 58.5 | 33.5 | 9.1 | 8.5 | 7.4 | |
| Total | 58.5 | 33.5 | 9.1 | 8.5 | 7.4 | |
(1)Excludes payments required if we exercise options to extend the terms of chartered-in leases signed as of March 31, 2026.
Other risks and uncertainties related to our liquidity include changes to income tax legislation or the resolution of uncertain tax positions relating to freight tax liabilities as described in "Item 1 – Financial Statements: Note 15 - Income Tax (Expense) Recovery" of this report, which could have a significant financial impact on our business, which we cannot predict with certainty at this time. In addition, existing or future climate control legislation or other regulatory initiatives that restrict emissions of greenhouse gases could have a significant financial and operational impact on our business, which we cannot predict with certainty at this time. Such regulatory measures could increase our costs related to operating and maintaining our vessels and require us to install new emission controls, acquire allowances or pay taxes or penalties related to our greenhouse gas emissions, or administer and manage a greenhouse gas emissions program. The inclusion of the maritime industry in the EU ETS as of January 1, 2024, requires us to acquire allowances related to our greenhouse gas emissions as outlined in, “Item 1 – Financial Statements: Note 5 – Intangible Assets and Other Non-Current Assets” and “Item 1 – Financial Statements: Note 6 – Accrued Liabilities and Other Long-Term Liabilities” of this report. In addition to the EU ETS, the inclusion of the FuelEU Maritime regulation by the European Union as of January 1, 2025, requires us to pay financial penalties in relation to certain voyages when not using low emission intensity fuels. Increased regulation of greenhouse gases may, in the long-term, lead to reduced demand for oil and reduced demand for our services. In addition, geopolitical conflicts, governmental sanctions and tariffs, and U.S. and Chinese port fee measures (that
took effect in October 2025 but have been mutually agreed to be suspended until October 2026) could have significant financial and other impacts on our industry and business, which we are cannot predict with certainty at this time.
CRITICAL ACCOUNTING ESTIMATES
We prepare our consolidated financial statements in accordance with GAAP, which require us to make estimates in the application of our accounting policies based on our best assumptions, judgments and opinions. On a regular basis, management reviews the accounting policies, assumptions, estimates and judgments to ensure that our consolidated financial statements are presented fairly and in accordance with GAAP. However, because future events and their effects cannot be determined with certainty, actual results could differ from our assumptions and estimates, and such differences could be material. Accounting estimates and assumptions that we consider to be the most critical to an understanding of our financial statements because they inherently involve significant judgments and uncertainties are discussed in "Item 5 – Operating and Financial Review and Prospects" in our Annual Report on Form 20-F for the year ended December 31, 2025. There have been no significant changes to these estimates and assumptions for the three months ended March 31, 2026.
NON-GAAP FINANCIAL MEASURE
Net Revenues - Tankers
Net revenues is a non-GAAP financial measure. Consistent with general practice in the shipping industry, we use “net revenues” (defined as income or loss from operations before vessel operating expenses, charter hire expenses, depreciation and amortization, general and administrative expenses, and gain or loss on sale and write-down of assets) as a measure of equating revenues generated from voyage charters to revenues generated from time charters, which assists us in making operating decisions about the deployment of our vessels and their performance. Since under time charters and bareboat charters the charterer pays the voyage expenses, whereas under voyage charters, the ship-owner pays these expenses, we include voyage expenses in net revenues. Some voyage expenses are fixed, and the remainder can be estimated. If we, as the ship owner, pay the voyage expenses, we typically pass the approximate amount of these expenses on to our customers by charging higher rates to them. As a result, although revenues from different types of contracts may vary, the net revenues are comparable across the different types of contracts. We principally use net revenues because it provides more meaningful information to us than income from operations, the most directly comparable GAAP financial measure. Net revenues is also widely used by investors and analysts in the shipping industry for comparing financial performance between companies and to industry averages. The following table reconciles net revenues with income from operations.
| | | | | | | | | | | | | | | |
| Three Months Ended March 31, | | |
| (in thousands of U.S. Dollars) | 2026 | | 2025 | | | | |
| Tankers | | | | | | | |
| Income from operations | 146,273 | | 71,312 | | | | |
| Add (subtract) specific items affecting income from operations: | | | | | | | |
| Vessel operating expenses | 31,013 | | 35,747 | | | | |
| Charter hire expenses | 9,058 | | 13,789 | | | | |
| Depreciation and amortization | 22,188 | | 23,240 | | | | |
| General and administrative expenses | 10,380 | | 9,712 | | | | |
| Gain on sale and write-down of assets | (22,656) | | (38,163) | | | | |
| | | | | | | |
| Net revenues | 196,256 | | 115,637 | | | | |
FORWARD-LOOKING STATEMENTS
This Report on Form 6-K for the three months ended March 31, 2026 contains certain forward-looking statements (as such term is defined in Section 27A of the Securities Act of 1933, as amended, and Section 21E of the Securities Exchange Act of 1934, as amended) concerning future events and our operations, performance and financial condition, including, in particular, statements regarding:
•the crude oil and refined product tanker market fundamentals, including the balance of supply and demand in the oil and tanker markets and the volatility of such markets;
•forecasts of worldwide tanker fleet growth or contraction;
•estimated changes in global or regional oil demand and supply;
•future tanker rates;
•the effectiveness of our chartering strategy in capturing upside opportunities and reducing downside risks;
•timing of and our expectations regarding vessel acquisitions and deliveries, vessel refinancing, tanker contracts and potential fleet renewal;
•general domestic and international political conditions and geopolitical conflicts;
•the impact of conflict in the Middle East (including the U.S.-Israel war with Iran, the effective closure and the U.S. blockade of the Strait of Hormuz, the Israel-Hamas conflict, and attacks on vessels in the Red Sea areas), the Russia-Ukraine war, and/or the U.S. actions in Venezuela on the global economy, our industry and our business, including as the result of sanctions, import restrictions and other related actions, and the persistence of altered trade patterns;
•the impact of global tariffs, port fees, sanctions, export controls, price caps and potential trade wars;
•the effect on us and our industry of additional (although currently suspended) port docking fees applicable to (a) Chinese-built vessels docking at U.S. ports starting in October 2025 and (b) vessels owned, operated and/or built by entities or individuals having specified relationships with the U.S. that dock at Chinese ports;
•the effect of typical seasonal variations on tanker rates;
•the impact on us and the shipping industry of environmental regulations, liabilities and developments, including climate change;
•our liquidity needs for the upcoming 12 months, including anticipated funds and sources of financing for liquidity and capital expenditure needs, and the sufficiency of cash flows and other sources of liquidity;
•the sufficiency of our liability insurance coverage;
•the timing of payment of cash dividends;
•our expectations regarding the reference rates and the covenants in our financing agreements, including the potential effects of financial covenants or restrictions;
•the impact of recent accounting pronouncements on our consolidated financial statements and related disclosures;
•the impact on our payment obligations if we exercise options to extend chartered-in leases.
Forward-looking statements include, without limitation, any statement that may predict, forecast, indicate or imply future results, performance or achievements, and may contain the words “believe”, “anticipate”, “expect”, “estimate”, “project”, “will be”, “will continue”, “will likely result”, "should" or words or phrases of similar meanings. These statements involve known and unknown risks and are based upon a number of assumptions and estimates that are inherently subject to significant uncertainties and contingencies, many of which are beyond our control. Actual results may differ materially from those expressed or implied by such forward-looking statements, which involve risks and uncertainties. Important factors that could cause actual results to differ materially include, but are not limited to: spot tanker market rate fluctuations; changes in vessel values; changes in the price, production of or demand for oil or refined products; changes in trading patterns significantly affecting overall vessel tonnage requirements; greater or lower than expected levels of tanker scrapping; changes in applicable industry laws and regulations and the timing of implementation of new laws and regulations, including those that may further regulate greenhouse gas emissions, including the inclusion of the maritime industry in the EU ETS and the effectiveness of the EU FuelEU Maritime regulation; the interpretation and enforcement of U.S. and China port fee regulations and any changes to their current suspension; the potential for early termination of charter contracts and our potential inability to renew or replace charter contracts; competitive factors in the markets in which we operate; loss of any customer, time-charter or vessel; our potential inability to meet our liquidity needs; our future capital expenditure requirements; changes to our dividend policy; changes in interest rates and the capital markets; changes in our costs, such as the cost of crews, dry-docking expenses and associated off-hire days; dry-docking delays; the impact of geopolitical tensions and conflicts, including the U.S.-Israel war with Iran, the effective closure of the Strait of Hormuz, the Israel and Hamas war, attacks on tankers in the Red Sea, the Russia-Ukraine war, U.S. action relating to Venezuela, and related sanctions, tariffs and import and other restrictions; changes in global economic conditions; our levels of available cash and cash reserves and the declaration of any future dividends by our Board of Directors; and other factors detailed from time to time in our periodic reports filed with the SEC, including our Annual Report on Form 20-F for the year ended December 31, 2025. We do not intend to release publicly any updates or revisions to any forward-looking statements contained herein to reflect any change in our expectations with respect thereto or any change in events, conditions or circumstances on which any such statement is based.
TEEKAY TANKERS LTD. AND SUBSIDIARIES
March 31, 2026
PART II – OTHER INFORMATION
Item 1 – Legal Proceedings
None.
Item 1A – Risk Factors
In addition to the other information set forth in this Report on Form 6-K, including below in this Item 1A, you should carefully consider the risk factors discussed in Part I, “Item 3 – Key Information - Risk Factors” in our Annual Report on Form 20-F for the year ended December 31, 2025, which could materially affect our business, financial condition or results of operations, the price and value of our securities and our ability to pay dividends on our common shares.
The escalation of hostilities in and around the Strait of Hormuz could lead to further global economic instability, disrupt our operations and the industry in which we operate, increase costs, and adversely impact our business.
Typically, approximately 20% of the petroleum consumed worldwide is transported through the Strait of Hormuz. However, the recent U.S.-Israel war with Iran has led to the effective closure of the Strait of Hormuz, a U.S. blockade of ships calling at and departing from Iranian ports and damage to the energy infrastructure in the Middle East Gulf region, all of which have impacted global oil and tanker markets. The current effective cessation of tanker transits through the Strait of Hormuz has significantly reduced crude oil and refined product exports from the Middle East Gulf region. Trading inefficiencies since the commencement of the conflict have supported spot tanker rates but have also increased certain operating costs, including bunker fuel and insurance premiums. A prolonged closure of the Strait of Hormuz could lead to a sustained shortage of global oil supply relative to demand and to high crude oil prices, which in turn could significantly reduce oil demand and crude oil tanker demand over time. Until the conflict is resolved, oil and tanker markets likely will continue to exhibit high levels of volatility and unpredictability. Although we are unable to predict the ultimate impact of the current conflict on the global economy, oil supply and demand, spot tanker rates, and the distribution, production and transportation of oil, we realize that the conflict could adversely impact our business, results of operations, financial condition, and cash flows.
Item 2 – Unregistered Sales of Equity Securities and Use of Proceeds
None.
Item 3 – Defaults Upon Senior Securities
None.
Item 4 – Mine Safety Disclosures
N/A.
Item 5 – Other Information
N/A.
Item 6 – Exhibits
N/A.
THIS REPORT ON FORM 6-K IS HEREBY INCORPORATED BY REFERENCE INTO THE FOLLOWING REGISTRATION STATEMENT OF THE COMPANY:
•REGISTRATION STATEMENT ON FORM S-8 (FILE NO. 333-282449) FILED WITH THE SEC ON OCTOBER 1, 2024.
SIGNATURE
Pursuant to the requirements of the Securities Exchange Act of 1934, the registrant has duly caused this report to be signed on its behalf by the undersigned, thereunto duly authorized.
| | | | | | | | | | | | | | | | | |
| | | | TEEKAY TANKERS LTD. |
| | | |
| Date: | May 15, 2026 | | | By: | /s/ Brody Speers |
| | | | | Brody Speers
Chief Financial Officer
(Principal Financial and Accounting Officer) |