|
|
Project Pony
Prepared for Board of Directors
October 27, 2016
|
|
Key Terms and Conditions
Consideration:
$17.00/unit ? US$915 million transaction value
Distribution maintained at current $0.1975/quarter until closing
Pro-rated distribution if closing occurs mid-quarter
Mutual closing conditions:
1. Shareholder approval: 10 – 15 weeks
2. HSR approval (may be required): 5 – 7 weeks
| 2 |
|
TransCanada Date: October 27, 2016 |
|
|
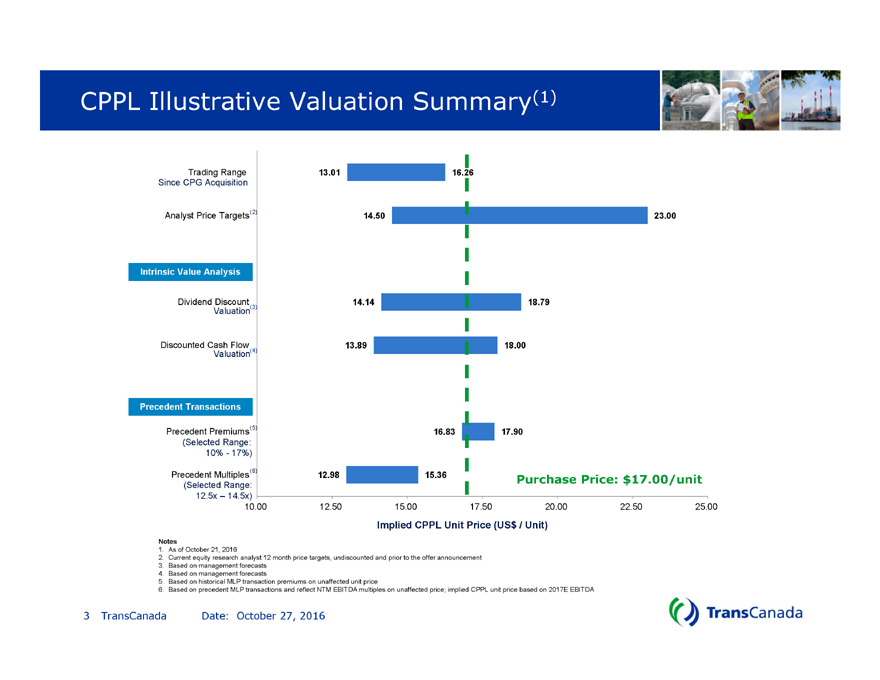
CPPL Illustrative Valuation Summary(1)
13.01
14.50
14.14
13.89
16.83
12.98
16.26
23.00
18.79
18.00
17.90
15.36
10.00 12.50 15.00 17.50 20.00 22.50 25.00
Trading Range
Analyst Price Targets
Dividend Discount
Discounted Cash Flow
Precedent Premiums
Precedent Multiples
Implied CPPL Unit Price (US$ / Unit)
Since CPG Acquisition
(Selected Range:
10%—17%)
(Selected Range:
12.5x – 14.5x)
| (6) |
|
Intrinsic Value Analysis
Precedent Transactions
| (5) |
|
| (4) |
|
| (3) |
|
| (2) |
|
Valuation
Valuation
Notes
1. As of October 21, 2016
2. Current equity research analyst 12 month price targets, undiscounted and prior to the offer announcement
3. Based on management forecasts
4. Based on management forecasts
5. Based on historical MLP transaction premiums on unaffected unit price
6. Based on precedent MLP transactions and reflect NTM EBITDA multiples on unaffected price; implied CPPL unit price based on 2017E EBITDA
Purchase Price: $17.00/unit
| 3 |
|
TransCanada Date: October 27, 2016 |
|
|
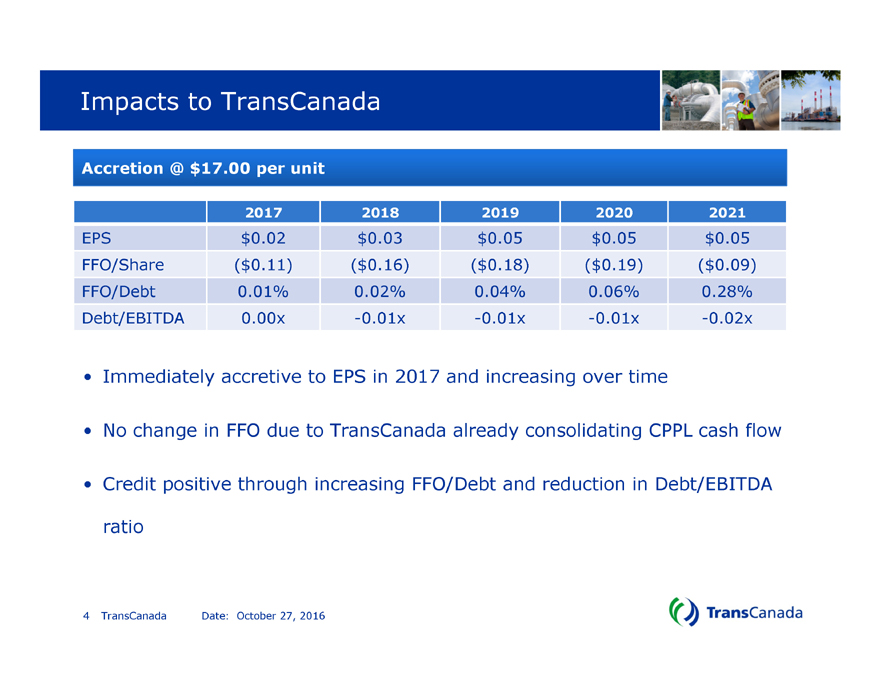
Impacts to TransCanada
Immediately accretive to EPS in 2017 and increasing over time
No change in FFO due to TransCanada already consolidating CPPL cash flow
Credit positive through increasing FFO/Debt and reduction in Debt/EBITDA
ratio
2017 2018 2019 2020 2021
EPS $0.02 $0.03 $0.05 $0.05 $0.05
FFO/Share ($0.11) ($0.16) ($0.18) ($0.19) ($0.09)
FFO/Debt 0.01% 0.02% 0.04% 0.06% 0.28%
Debt/EBITDA 0.00x -0.01x -0.01x -0.01x -0.02x
Accretion @ $17.00 per unit
| 4 |
|
TransCanada Date: October 27, 2016 |
|
|
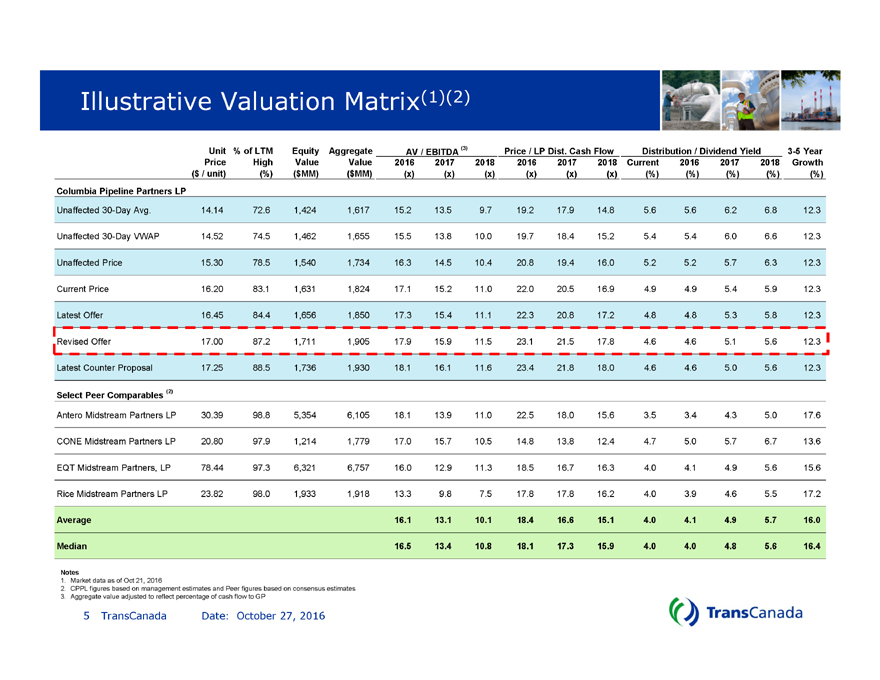
Illustrative Valuation Matrix(1)(2)
Notes
1. Market data as of Oct 21, 2016
2. CPPL figures based on management estimates and Peer figures based on consensus estimates
3. Aggregate value adjusted to reflect percentage of cash flow to GP
Unit % of LTM Equity Aggregate AV / EBITDA (3) Price / LP Dist. Cash Flow Distribution / Dividend Yield 3-5 Year
Price High Value Value 2016 2017 2018 2016 2017 2018 Current 2016 2017 2018 Growth
($ / unit) (%) ($MM) ($MM) (x) (x) (x) (x) (x) (x) (%) (%) (%) (%) (%)
Columbia Pipeline Partners LP
Unaffected 30-Day Avg. 14.14 72.6 1,424 1,617 15.2 13.5 9.7 19.2 17.9 14.8 5.6 5.6 6.2 6.8 12.3
Unaffected 30-Day VWAP 14.52 74.5 1,462 1,655 15.5 13.8 10.0 19.7 18.4 15.2 5.4 5.4 6.0 6.6 12.3
Unaffected Price 15.30 78.5 1,540 1,734 16.3 14.5 10.4 20.8 19.4 16.0 5.2 5.2 5.7 6.3 12.3
Current Price 16.20 83.1 1,631 1,824 17.1 15.2 11.0 22.0 20.5 16.9 4.9 4.9 5.4 5.9 12.3
Latest Offer 16.45 84.4 1,656 1,850 17.3 15.4 11.1 22.3 20.8 17.2 4.8 4.8 5.3 5.8 12.3
Revised Offer 17.00 87.2 1,711 1,905 17.9 15.9 11.5 23.1 21.5 17.8 4.6 4.6 5.1 5.6 12.3
Latest Counter Proposal 17.25 88.5 1,736 1,930 18.1 16.1 11.6 23.4 21.8 18.0 4.6 4.6 5.0 5.6 12.3
Select Peer Comparables (2)
Antero Midstream Partners LP 30.39 98.8 5,354 6,105 18.1 13.9 11.0 22.5 18.0 15.6 3.5 3.4 4.3 5.0 17.6
CONE Midstream Partners LP 20.80 97.9 1,214 1,779 17.0 15.7 10.5 14.8 13.8 12.4 4.7 5.0 5.7 6.7 13.6
EQT Midstream Partners, LP 78.44 97.3 6,321 6,757 16.0 12.9 11.3 18.5 16.7 16.3 4.0 4.1 4.9 5.6 15.6
Rice Midstream Partners LP 23.82 98.0 1,933 1,918 13.3 9.8 7.5 17.8 17.8 16.2 4.0 3.9 4.6 5.5 17.2
Average 16.1 13.1 10.1 18.4 16.6 15.1 4.0 4.1 4.9 5.7 16.0
Median 16.5 13.4 10.8 18.1 17.3 15.9 4.0 4.0 4.8 5.6 16.4
| 5 |
|
TransCanada Date: October 27, 2016 |