|
|
Exhibit (c)(3)
Preliminary Draft Analysis Strictly Confidential
Update to the Conflicts Committee of the Board of Directors of
CPP GP LLC
October 15, 2016 / Confidential
Jefferies LLC
Member SIPC
|
|
Discounted Cash Flow Comparison
Strictly Confidential
Key Points
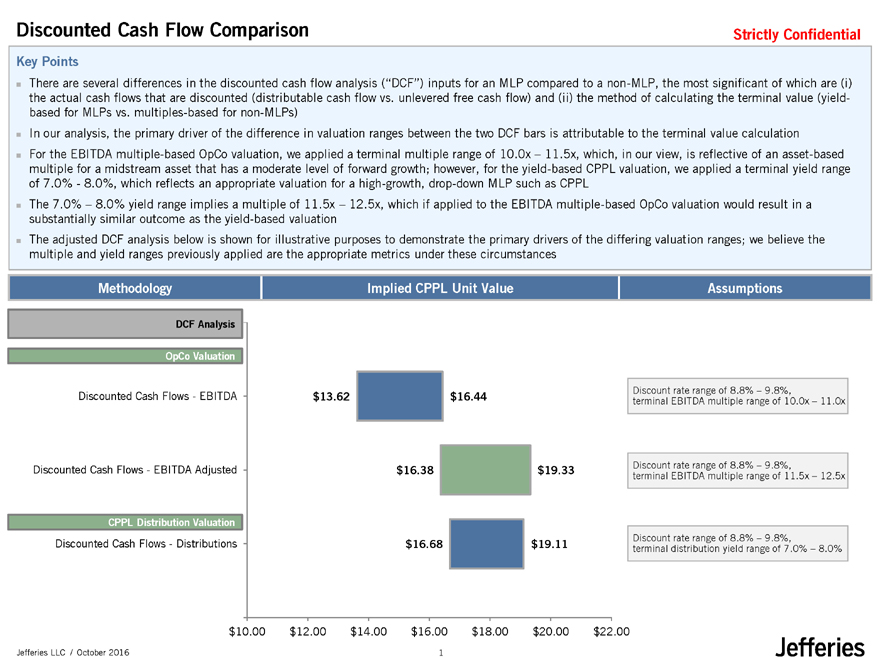
There are several differences in the discounted cash flow analysis (“DCF”) inputs for an MLP compared to a non-MLP, the most significant of which are (i) the actual cash flows that are discounted (distributable cash flow vs. unlevered free cash flow) and (ii) the method of calculating the terminal value (yield-based for MLPs vs. multiples-based for non-MLPs) ? In our analysis, the primary driver of the difference in valuation ranges between the two DCF bars is attributable to the terminal value calculation ? For the EBITDA multiple-based OpCo valuation, we applied a terminal multiple range of 10.0x – 11.5x, which, in our view, is reflective of an asset-based multiple for a midstream asset that has a moderate level of forward growth; however, for the yield-based CPPL valuation, we applied a terminal yield range of 7.0%—8.0%, which reflects an appropriate valuation for a high-growth, drop-down MLP such as CPPL
The 7.0% – 8.0% yield range implies a multiple of 11.5x – 12.5x, which if applied to the EBITDA multiple-based OpCo valuation would result in a substantially similar outcome as the yield-based valuation ? The adjusted DCF analysis below is shown for illustrative purposes to demonstrate the primary drivers of the differing valuation ranges; we believe the multiple and yield ranges previously applied are the appropriate metrics under these circumstances
Methodology
DCF Analysis
OpCo Valuation
Discounted Cash Flows—EBITDA
Discounted Cash Flows—EBITDA Adjusted
CPPL Distribution Valuation
Discounted Cash Flows—Distributions
Implied CPPL Unit Value
$13.62 $16.44
$16.38 $19.33
$16.68 $19.11
$10.00 $12.00 $14.00 $16.00 $18.00 $20.00 $22.00
Assumptions
Discount rate range of 8.8% – 9.8%, terminal EBITDA multiple range of 10.0x – 11.0x
Discount rate range of 8.8% – 9.8%, terminal EBITDA multiple range of 11.5x – 12.5x
Discount rate range of 8.8% – 9.8%, terminal distribution yield range of 7.0% – 8.0%
Jefferies LLC / October 2016 1