|
|
Exhibit (c)(7)
Project Pony – Pre-Read Materials
July 27, 2016
|
|
Table of Contents
Section 1 Situation Overview
Section 2 MLP Market Update
Section 3 MLP: Two, One or None?
Appendix Supplemental Materials
All Figures in USD, Unless Otherwise Noted
2 TransCanada Date: July 27, 2016
|
|
Section 1: Situation Overview
3 TransCanada
|
|
Executive Summary
Objective of this Book
• The objective of the materials is to evaluate the merits of TransCanada having an MLP vehicle
• We have explored three key questions to determine whether or not an MLP is of net benefit:
1. Valuation: Does an MLP vehicle contribute to an improved valuation multiple for TransCanada?
2. Financing: Does an MLP provide increased access to new capital at comparable cost to the alternatives?
3. Growth: Does an MLP help to support TransCanada’s growth and M&A objectives?
Summary Conclusions: Preferred Outcome is to Retain One MLP Vehicle
• The benefits of continuing to have an MLP outweigh the potential drawbacks
– An MLP provides potential benefits to TransCanada’s valuation, ability to finance its capital program and provides incremental smaller-scale M&A optionality
– A structure with a single MLP vehicle outstanding is well understood by the market and has been accepted by TransCanada shareholders over a long period of time
• However, if TransCanada decides to keep an MLP outstanding, it will be critical to communicate clearly to the market what the go-forward drop-down strategy and positioning for the vehicle will be, in order to maximize the value TransCanada is able to realize from having an MLP
Keeping Two Similar MLP Vehicles Adds Complexity and Provides Limited Incremental Benefit
• The majority of the benefits of having an MLP can be captured through a single vehicle
• Two MLPs increases the complexity of the corporate structure while also creating potential for confusion amongst the target investor bases, particularly given the fact that both are engaged in the same line of business (FERC regulated natural gas transportation)
• In most previous situations where companies have had two MLPs outstanding for a period of time in a similar sector, the MLPs have ultimately been collapsed into a single vehicle
4 TransCanada Date: July 27, 2016
|
|
Situation Overview
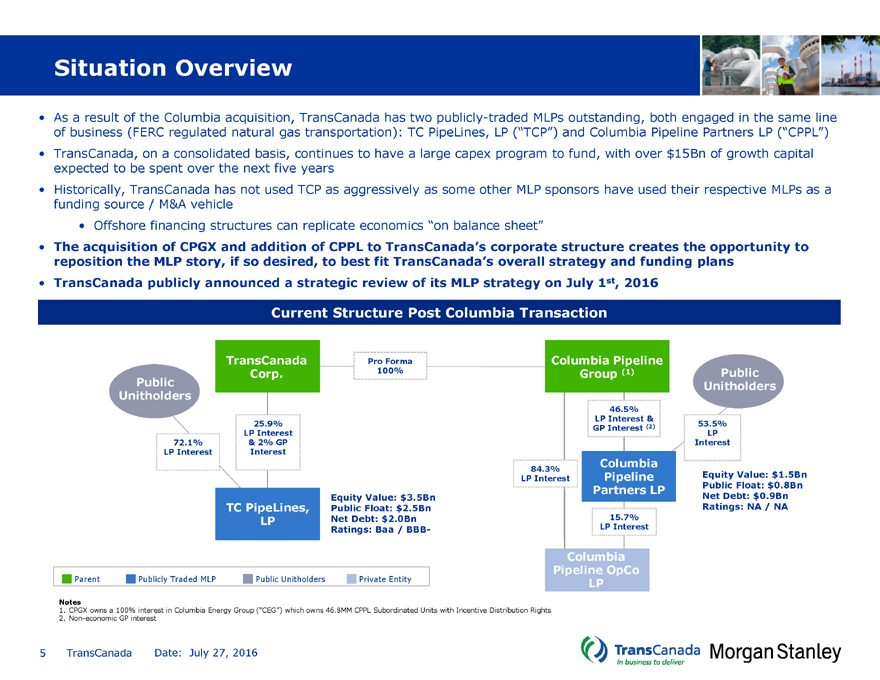
• As a result of the Columbia acquisition, TransCanada has two publicly-traded MLPs outstanding, both engaged in the same line of business (FERC regulated natural gas transportation): TC PipeLines, LP (“TCP”) and Columbia Pipeline Partners LP (“CPPL”)
• TransCanada, on a consolidated basis, continues to have a large capex program to fund, with over $15Bn of growth capital expected to be spent over the next five years
• Historically, TransCanada has not used TCP as aggressively as some other MLP sponsors have used their respective MLPs as a funding source / M&A vehicle
• Offshore financing structures can replicate economics “on balance sheet”
• The acquisition of CPGX and addition of CPPL to TransCanada’s corporate structure creates the opportunity to reposition the MLP story, if so desired, to best fit TransCanada’s overall strategy and funding plans
• TransCanada publicly announced a strategic review of its MLP strategy on July 1st, 2016
Current Structure Post Columbia Transaction
TransCanadaPro FormaColumbia Pipeline
Corp.100%Group (1)Public
Public Unitholders
Unitholders
46.5%
LP Interest &
25.9%53.5%
GP Interest (2)
LP InterestLP
72.1% & 2% GPInterest
LP Interest Interest
84.3%Columbia
LP InterestPipelineEquity Value: $1.5Bn
Partners LPPublic Float: $0.8Bn
Equity Value: $3.5BnNet Debt: $0.9Bn
TC PipeLines,Public Float: $2.5BnRatings: NA / NA
LPNet Debt: $2.0Bn15.7%
Ratings: Baa / BBB-LP Interest
Columbia
Pipeline OpCo
Parent Publicly Traded MLP Public UnitholdersPrivate EntityLP
Notes
1.
CPGX owns a 100% interest in Columbia Energy Group (“CEG”) which owns 46.8MM CPPL Subordinated Units with Incentive Distribution Rights
2.
Non-economic GP interest
5 TransCanada Date: July 27, 2016
|
|
TransCanada, TCP and CPPL Market Data (1)
Ticker TRP TCPCPPL
Valuation (USMM)$
CPPL’s public float is
Equity Value 37,084 3,613significantly smaller1,545
than TCP’s, reducing
Public Float 37,084 2,514funding capacity but827
Plus: Net Debt 32,274 2,025increasing flexibility163
to buy-in public float
Plus: Pref. Equity 2,312 95-
Plus: Minority Interest 1,267 --
Aggregate Value 72,937 5,7331,708
Trading Metrics
Adj. AV / 2016E EBITDA (x) (2) 13.1x TransCanada13.9xTCP is >3x the size15.5x
currentlyof CPPL today,
Adj. AV / 2017E EBITDA (x) (2) 12.0x trades at11.4xwith larger14.1x
lowerassociated
P / 2016E DCFPS (x) 11.8x multiples13.1xfinancing and18.4x
than the twodrop-down
P / 2017E DCFPS (x) 9.4x MLPs11.5xcapacity as a12.8x
result
Current Yield (%) 3.8% 6.6%4.9%
Payout Ratio (%) 43.6% 89.4%85.2%
Total Return (%) (3) 13.3% 12.3%25.9%
2017E Capital Expenditure (USMM) 6,894$ 14 429
Credit Metrics
Credit Ratings (4) A3 / A- Baa2 / BBB-NR / NR
Net Debt / ‘16E EBITDA 6.6x 4.9x1.5x
Notes
1. All market data as of July 7, 2016; forecasts based on equity research consensus estimates
2. Equity value is adjusted for GP value by grossing up by cash flow attributable to the GP
3. Implied total return defined as the addition of current yield and expected average annual per-share / unit distribution growth
4. Reflects TCPL’s current rating
6 TransCanada Date: July 27, 2016
|
|
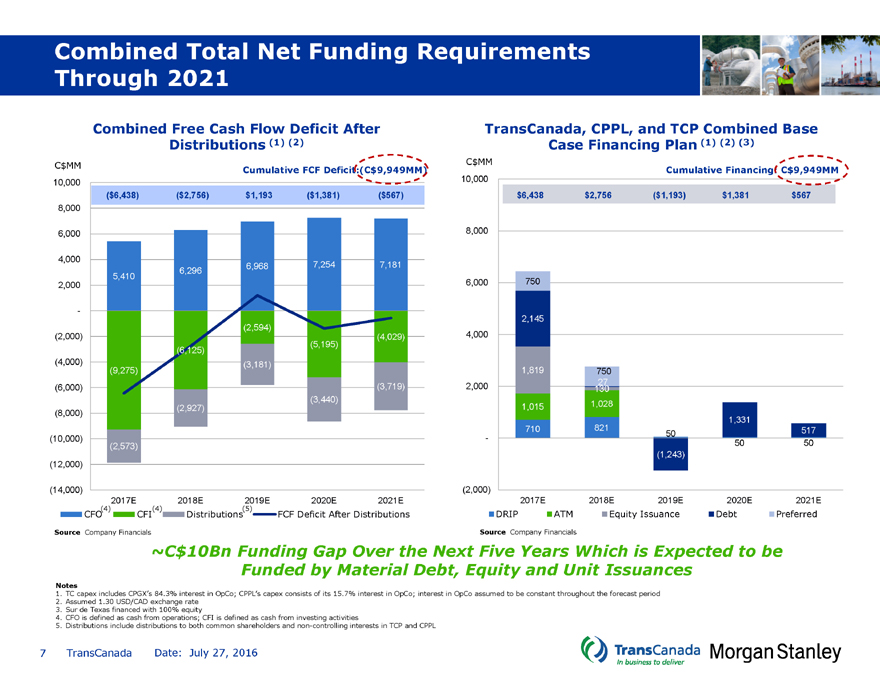
Combined Total Net Funding Requirements Through 2021
Combined Free Cash Flow Deficit After TransCanada, CPPL, and TCP Combined Base Distributions (1) (2) Case Financing Plan (1) (2) (3)
C$MM C$MM
Cumulative FCF Deficit:(C$9,949MM)Cumulative Financing: C$9,949MM
10,000 10,000
($6,438) ($2,756) $1,193($1,381)($567)$6,438$2,756($1,193)$1,381$567
8,000
6,000 8,000
4,000
5,410 6,2966,9687,2547,181
2,000 6,000750
-
2,145
(2,594)
(2,000) (4,029)4,000
(6,125)(5,195)
(4,000) (3,181)
(9,275) 1,819750
(6,000) (3,719)2,000130 27
(3,440)
(8,000) (2,927)1,0151,028
1,331
71082150517
(10,000) -
(2,573) 5050
(1,243)
(12,000)
(14,000) (2,000)
2017E 2018E2019E2020E2021E2017E2018E2019E2020E2021E
CFO(4) CFI(4) Distributions(5)FCF Deficit After DistributionsDRIPATMEquity IssuanceDebtPreferred
Source Company Financials Source Company Financials
~C$10Bn Funding Gap Over the Next Five Years Which is Expected to be Funded by Material Debt, Equity and Unit Issuances
Notes
1. TC capex includes CPGX’s 84.3% interest in OpCo; CPPL’s capex consists of its 15.7% interest in OpCo; interest in OpCo assumed to be constant throughout the forecast period
2. Assumed 1.30 USD/CAD exchange rate
3. Sur de Texas financed with 100% equity
4. CFO is defined as cash from operations; CFI is defined as cash from investing activities
5. Distributions include distributions to both common shareholders and non-controlling interests in TCP and CPPL
7 TransCanada Date: July 27, 2016
|
|
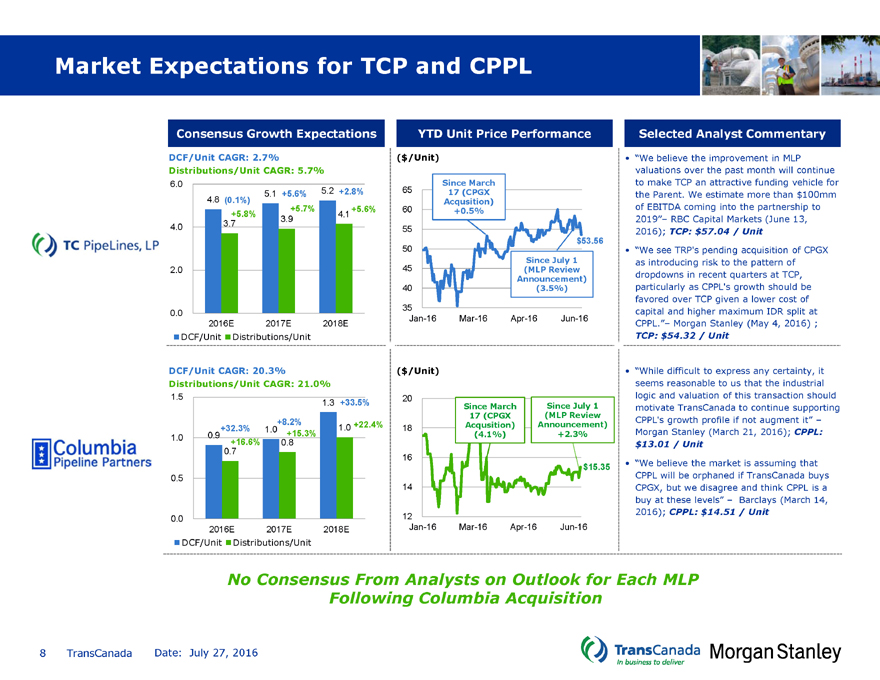
Market Expectations for TCP and CPPL
Consensus Growth Expectations YTD Unit Price Performance Selected Analyst Commentary
DCF/Unit CAGR: 2.7% ($/Unit)• “We believe the improvement in MLP
Distributions/Unit CAGR: 5.7% valuations over the past month will continue
6.0 Since Marchto make TCP an attractive funding vehicle for
5.1 +5.6%5.2 +2.8%6517 (CPGXthe Parent. We estimate more than $100mm
4.8 (0.1%) Acqusition)
+5.8% +5.7%4.1 +5.6%60+0.5%of EBITDA coming into the partnership to
3.7 3.92019”– RBC Capital Markets (June 13,
4.0 552016); TCP: $57.04 / Unit
$53.56
50• “We see TRP’s pending acquisition of CPGX
Since July 1as introducing risk to the pattern of
2.0 45(MLP Reviewdropdowns in recent quarters at TCP,
Announcement)
40(3.5%)particularly as CPPL’s growth should be
favored over TCP given a lower cost of
0.0 35capital and higher maximum IDR split at
Jan-16Mar-16Apr-16Jun-16
2016E 2017E2018ECPPL.”– Morgan Stanley (May 4, 2016) ;
DCF/Unit Distributions/Unit TCP: $54.32 / Unit
DCF/Unit CAGR: 20.3% ($/Unit)• “While difficult to express any certainty, it
Distributions/Unit CAGR: 21.0% seems reasonable to us that the industrial
1.5 20logic and valuation of this transaction should
1.3 +33.5%Since MarchSince July 1motivate TransCanada to continue supporting
+8.2%+22.4%17 (CPGXAnnouncement) (MLP ReviewCPPL’s growth profile if not augment it” –
1.0 0.9 +32.3% 1.0 +15.3%1.018Acqusition) (4.1%)+2.3%Morgan Stanley (March 21, 2016); CPPL:
+16.6% 0.8$13.01 / Unit
0.7
16
$15.35• “We believe the market is assuming that
0.5 CPPL will be orphaned if TransCanada buys
14CPGX, but we disagree and think CPPL is a
buy at these levels” – Barclays (March 14,
0.0 122016); CPPL: $14.51 / Unit
2016E 2017E2018EJan-16Mar-16Apr-16Jun-16
DCF/Unit Distributions/Unit
No Consensus From Analysts on Outlook for Each MLP
Following Columbia Acquisition
8 TransCanada Date: July 27, 2016
|
|
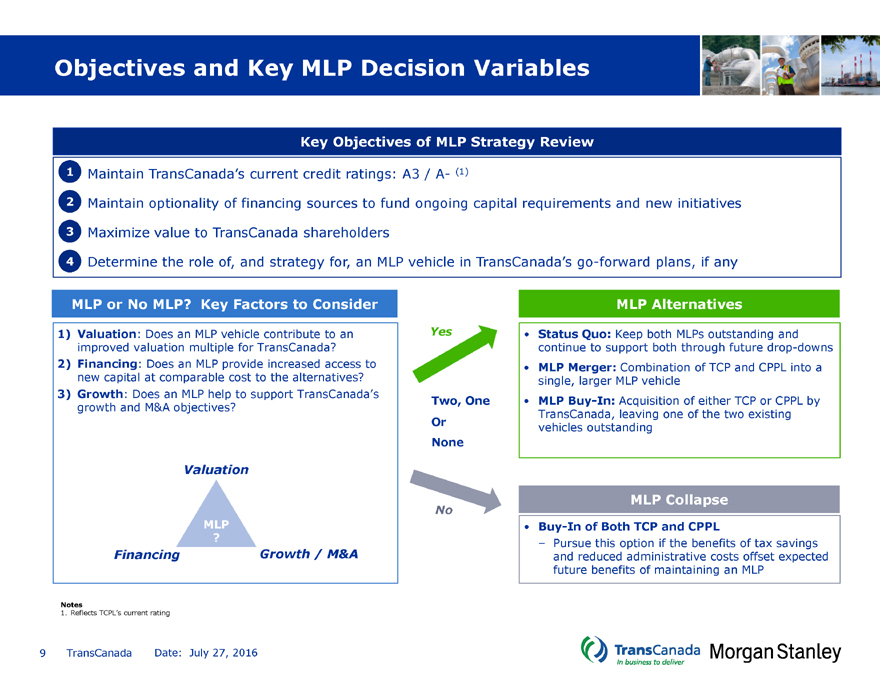
Objectives and Key MLP Decision Variables
Key Objectives of MLP Strategy Review
1 Maintain TransCanada’s current credit ratings: A3 / A- (1)
2 Maintain optionality of financing sources to fund ongoing capital requirements and new initiatives
3 Maximize value to TransCanada shareholders
4 Determine the role of, and strategy for, an MLP vehicle in TransCanada’s go-forward plans, if any
MLP or No MLP? Key Factors to Consider MLP Alternatives
1) Valuation: Does an MLP vehicle contribute to an Yes• Status Quo: Keep both MLPs outstanding and
improved valuation multiple for TransCanada? continue to support both through future drop-downs
2) Financing: Does an MLP provide increased access to • MLP Merger: Combination of TCP and CPPL into a
new capital at comparable cost to the alternatives? single, larger MLP vehicle
3) Growth: Does an MLP help to support TransCanada’s
growth and M&A objectives? Two, One• MLP Buy-In: Acquisition of either TCP or CPPL by
TransCanada, leaving one of the two existing
Orvehicles outstanding
None
Valuation
MLP Collapse
No
MLP• Buy-In of Both TCP and CPPL
?– Pursue this option if the benefits of tax savings
Financing Growth / M&Aand reduced administrative costs offset expected
future benefits of maintaining an MLP
Notes
1. Reflects TCPL’s current rating
9 TransCanada Date: July 27, 2016
|
|
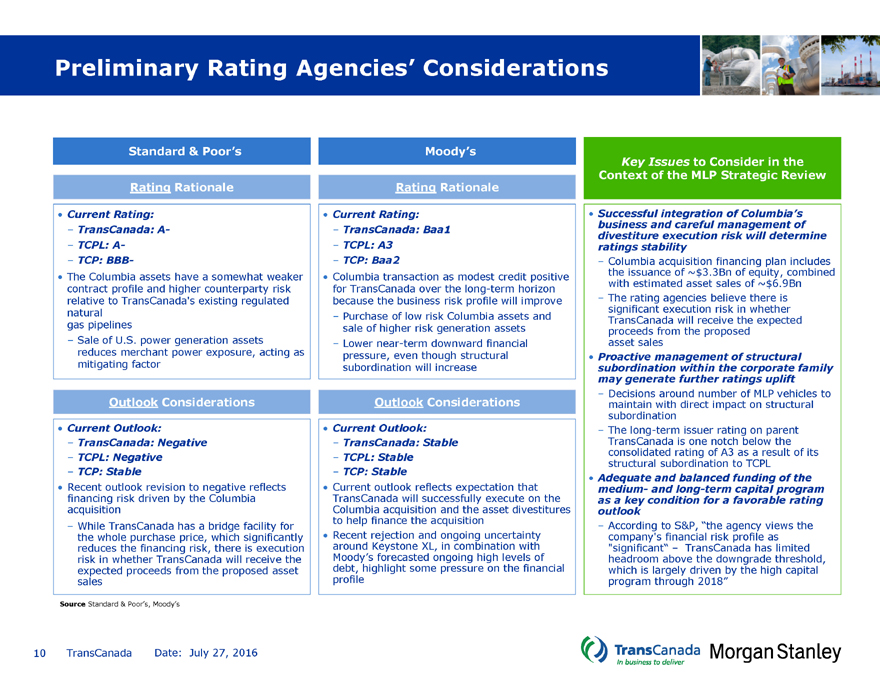
Preliminary Rating Agencies’ Considerations
Standard & Poor’s Moody’s
Key Issues to Consider in the
Context of the MLP Strategic Review
Rating Rationale Rating Rationale
Current Rating: • Current Rating:• Successful integration of Columbia’s
– TransCanada: A- –TransCanada: Baa1business and careful management of
divestiture execution risk will determine
– TCPL: A- –TCPL: A3ratings stability
– TCP: BBB- –TCP: Baa2–Columbia acquisition financing plan includes
• The Columbia assets have a somewhat weaker • Columbia transaction as modest credit positive the issuance of ~$3.3Bn of equity, combined
contract profile and higher counterparty risk for TransCanada over the long-term horizon with estimated asset sales of ~$6.9Bn
relative to TransCanada’s existing regulated because the business risk profile will improve –The rating agencies believe there is
natural – Purchase of low risk Columbia assets andsignificant execution risk in whether
gas pipelines sale of higher risk generation assetsproceeds TransCanada from will the receive proposed the expected
– Sale of U.S. power generation assets –Lower near-term downward financialasset sales
reduces merchant power exposure, acting as pressure, even though structural• Proactive management of structural
mitigating factor subordination will increasesubordination within the corporate family
may generate further ratings uplift
–Decisions around number of MLP vehicles to
Outlook Considerations Outlook Considerationsmaintain with direct impact on structural
subordination
Current Outlook: • Current Outlook:–The long-term issuer rating on parent
– TransCanada: Negative –TransCanada: StableTransCanada is one notch below the
– TCPL: Negative –TCPL: Stableconsolidated rating of A3 as a result of its
structural subordination to TCPL
– TCP: Stable –TCP: Stable• Adequate and balanced funding of the
• Recent outlook revision to negative reflects • Current outlook reflects expectation that medium- and long-term capital program
financing risk driven by the Columbia TransCanada will successfully execute on the as a key condition for a favorable rating
acquisition Columbia acquisition and the asset divestitures outlook
to help finance the acquisition
– While TransCanada has a bridge facility for –According to S&P, “the agency views the
the whole purchase price, which significantly • Recent rejection and ongoing uncertaintycompany’s financial risk profile as
reduces the financing risk, there is execution around Keystone XL, in combination with“significant“ – TransCanada has limited
risk in whether TransCanada will receive the Moody’s forecasted ongoing high levels ofheadroom above the downgrade threshold,
expected proceeds from the proposed asset debt, highlight some pressure on the financialwhich is largely driven by the high capital
sales profileprogram through 2018”
Source Standard & Poor’s, Moody’s
10 TransCanada Date: July 27, 2016
|
|
Section 2: MLP Market Update
11 TransCanada
|
|
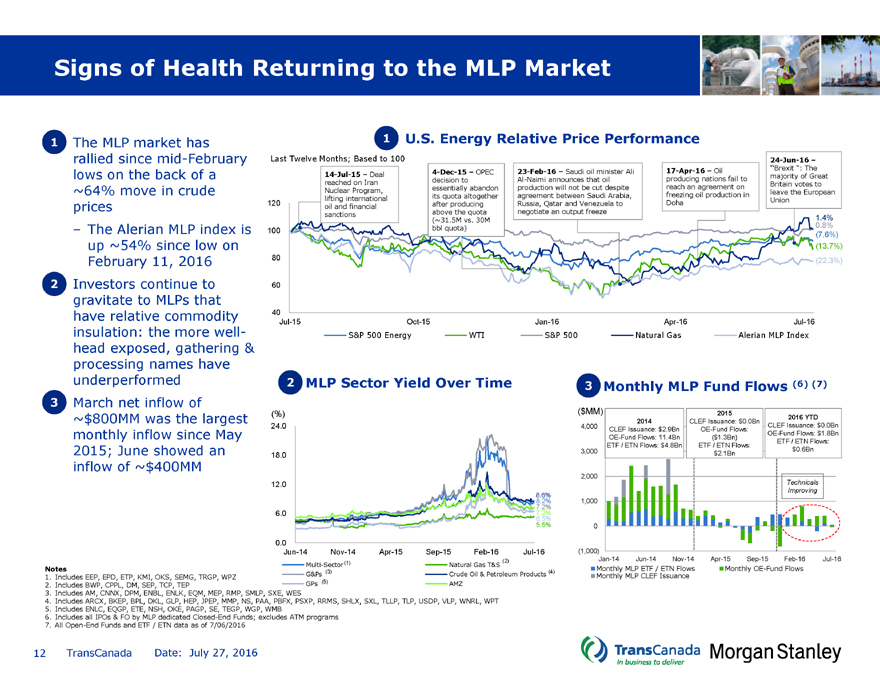
Signs of Health Returning to the MLP Market
1 The MLP market has rallied since mid-February lows on the back of a ~64% move in crude prices
– The Alerian MLP index is up ~54% since low on February 11, 2016
2 Investors continue to gravitate to MLPs that have relative commodity insulation: the more well-head exposed, gathering & processing names have underperformed
3 March net inflow of
~$800MM was the largest monthly inflow since May 2015; June showed an inflow of ~$400MM
1U.S. Energy Relative Price Performance
Last Twelve Months; Based to 100 24-Jun-16 –
4-Dec-15 – OPEC23-Feb-16 – Saudi oil minister Ali17-Apr-16 – Oil“Brexit “: The
14-Jul-15 – Deal decision toAl-Naimi announces that oilproducing nations fail tomajority of Great
reached on Iran essentially abandonproduction will not be cut despitereach an agreement onBritain votes to
Nuclear Program, its quota altogetheragreement between Saudi Arabia,freezing oil production inleave the European
120 lifting international after producingRussia, Qatar and Venezuela toDohaUnion
oil and financial
sanctions above the quotanegotiate an output freeze
(~31.5M vs. 30M1.4%
100 bbl quota)0.8%
(7.6%)
(13.7%)
80 (22.3%)
60
40
Jul-15 Oct-15Jan-16Apr-16Jul-16
S&P 500 Energy WTIS&P 500Natural GasAlerian MLP Index
2 MLP Sector Yield Over Time 3 Monthly MLP Fund Flows (6) (7)
(%) ($MM)2015
2014CLEF Issuance: $0.0Bn2016 YTD
24.0 4,000CLEF Issuance: $0.0Bn
CLEF Issuance: $2.9BnOE-Fund Flows:OE-Fund Flows: $1.8Bn
OE-Fund Flows: 11.4Bn($1.3Bn)ETF / ETN Flows:
ETF / ETN Flows: $4.8BnETF / ETN Flows:
3,000$0.6Bn
18.0 $2.1Bn
2,000
12.0 Technicals
Improving
8.6%
8.2%1,000
7.2%
6.0 7.2%
6.5%
5.5%0
0.0
Jun-14 Nov-14 Apr-15 Sep-15Feb-16Jul-16(1,000)
Multi-Sector (1) Natural Gas T&S (2)Jan-14Jun-14 Nov-14Apr-15 Sep-15 Feb-16 Jul-16
(4)Monthly MLP ETF / ETN FlowsMonthly OE-Fund Flows
G&Ps (3) Crude Oil & Petroleum ProductsMonthly MLP CLEF Issuance
GPs (5) AMZ
Multi-Sector (1)Natural Gas T&S (2)
Notes
1. Includes EEP, EPD, ETP, KMI, OKS, SEMG, TRGP, WPZ G&Ps (3)Crude Oil & Petroleum
2. Includes BWP, CPPL, DM, SEP, TCP, TEP GPs (5)AMZ
3. Includes AM, CNNX, DPM, ENBL, ENLK, EQM, MEP, RMP, SMLP, SXE, WES
4. Includes ARCX, BKEP, BPL, DKL, GLP, HEP, JPEP, MMP, NS, PAA, PBFX, PSXP, RRMS, SHLX, SXL, TLLP, TLP, USDP, VLP, WNRL, WPT
5. Includes ENLC, EQGP, ETE, NSH, OKE, PAGP, SE, TEGP, WGP, WMB
6. Includes all IPOs & FO by MLP dedicated Closed-End Funds; excludes ATM programs
7. All Open-End Funds and ETF / ETN data as of 7/06/2016
12 TransCanada Date: July 27, 2016
|
|
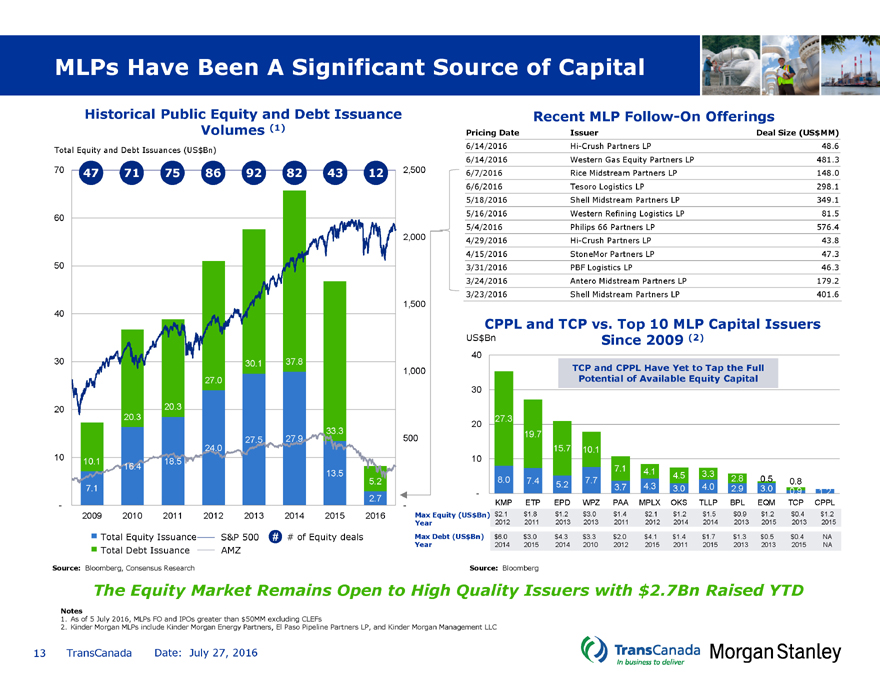
MLPs Have Been A Significant Source of Capital
Historical Public Equity and Debt Issuance Volumes (1)
Total Equity and Debt Issuances (US$Bn)
70 47 71758692824312
60
50
40
30 30.137.8
27.0
20 20.3
20.3
33.3
27.527.9
24.0
10 10.1 18.5
16.4
13.5
5.2
7.1
2.7
-
2009 2010201120122013201420152016
Total Equity Issuance S&P 500## of Equity deals
Total Debt Issuance AMZ
Source: Bloomberg, Consensus Research
Recent MLP Follow-On Offerings
Pricing Date IssuerDeal Size (US$MM)
6/14/2016 Hi-Crush Partners LP48.6
6/14/2016 Western Gas Equity Partners LP481.3
2,500 6/7/2016 Rice Midstream Partners LP148.0
6/6/2016 Tesoro Logistics LP298.1
5/18/2016 Shell Midstream Partners LP349.1
5/16/2016 Western Refining Logistics LP81.5
5/4/2016 Philips 66 Partners LP576.4
2,000 4/29/2016 Hi-Crush Partners LP43.8
4/15/2016 StoneMor Partners LP47.3
3/31/2016 PBF Logistics LP46.3
3/24/2016 Antero Midstream Partners LP179.2
3/23/2016 Shell Midstream Partners LP401.6
1,500
CPPL and TCP vs. Top 10 MLP Capital Issuers
$US Bn Since 2009 (2)
40
1,000 TCP and CPPL Have Yet to Tap the Full
Potential of Available Equity Capital
30
20 27.3
500 19.7
15.7 10.1
10
7.14.13.3
8.0 7.47.74.52.8 0.50.8
- 5.23.74.3 3.04.02.9 3.00.91.2
- KMP ETP EPD WPZ PAA MPLX OKS TLLP BPL EQM TCP CPPL
Max Equity (USBn)$$2.1 $1.8 $1.2 $3.0$1.4$2.1 $1.2$1.5$0.9 $1.2$0.4$1.2
Year 2012 20112013 201320112012 201420142013 201520132015
Max Debt (USBn)$$6.0 $3.0 $4.3 $3.3 $2.0$4.1 $1.4$1.7$1.3 $0.5$0.4NA
Year 2014 2015 2014 201020122015 2011 20152013 20132015NA
Source: Bloomberg
The Equity Market Remains Open to High Quality Issuers with $2.7Bn Raised YTD
Notes
1. As of 5 July 2016, MLPs FO and IPOs greater than $50MM excluding CLEFs
2. Kinder Morgan MLPs include Kinder Morgan Energy Partners, El Paso Pipeline Partners LP, and Kinder Morgan Management LLC
13 TransCanada Date: July 27, 2016
|
|
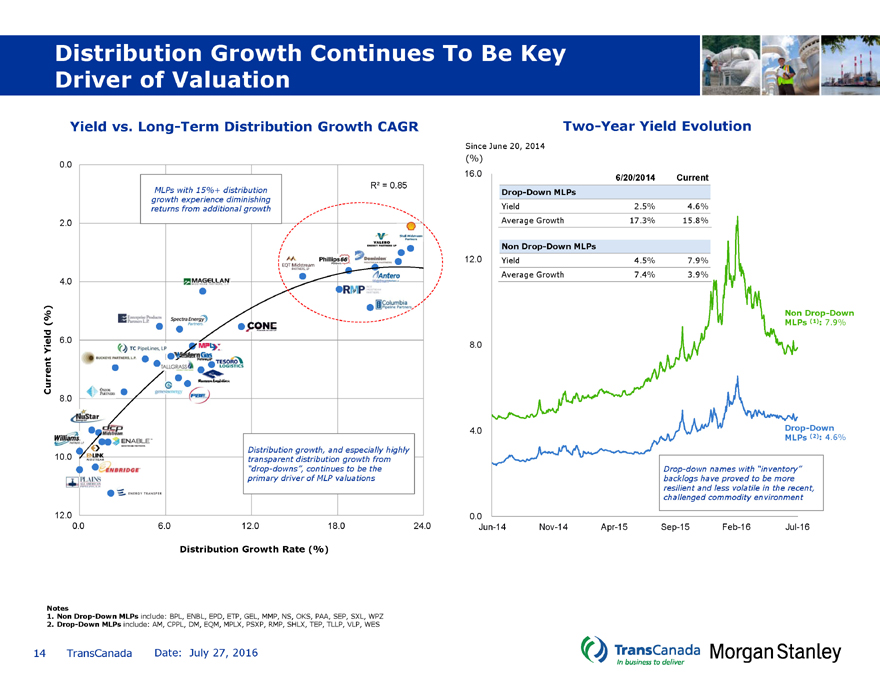
Distribution Growth Continues To Be Key Driver of Valuation
Yield vs. Long-Term Distribution Growth CAGR
Two-Year Yield Evolution
Since June 20, 2014
(%)
0.0
16.06/20/2014Current
R² = 0.85
MLPs with 15%+ distributionDrop-Down MLPs
growth experience diminishing
returns from additional growthYield2.5%4.6%
2.0 Average Growth17.3%15.8%
Non Drop-Down MLPs
12.0Yield4.5%7.9%
Average Growth7.4%3.9%
4.0
Non Drop-Down
(%) MLPs (1): 7.9%
Yield 6.0 8.0
Current
8.0
4.0Drop-Down
MLPs (2): 4.6%
Distribution growth, and especially highly
10.0 transparent distribution growth from
“drop-downs”, continues to be theDrop-down names with “inventory”
primary driver of MLP valuationsbacklogs have proved to be more
resilient and less volatile in the recent,
challenged commodity environment
12.0 0.0
0.0 6.012.018.024.0Jun-14Nov-14Apr-15Sep-15Feb-16Jul-16
Distribution Growth Rate (%)
Notes
1. Non Drop-Down MLPs include: BPL, ENBL, EPD, ETP, GEL, MMP, NS, OKS, PAA, SEP, SXL, WPZ
2. Drop-Down MLPs include: AM, CPPL, DM, EQM, MPLX, PSXP, RMP, SHLX, TEP, TLLP, VLP, WES
14 TransCanada Date: July 27, 2016
|
|
Section 3: MLP: Two, One, or None?
15 TransCanada Date: July 27, 2016
|
|
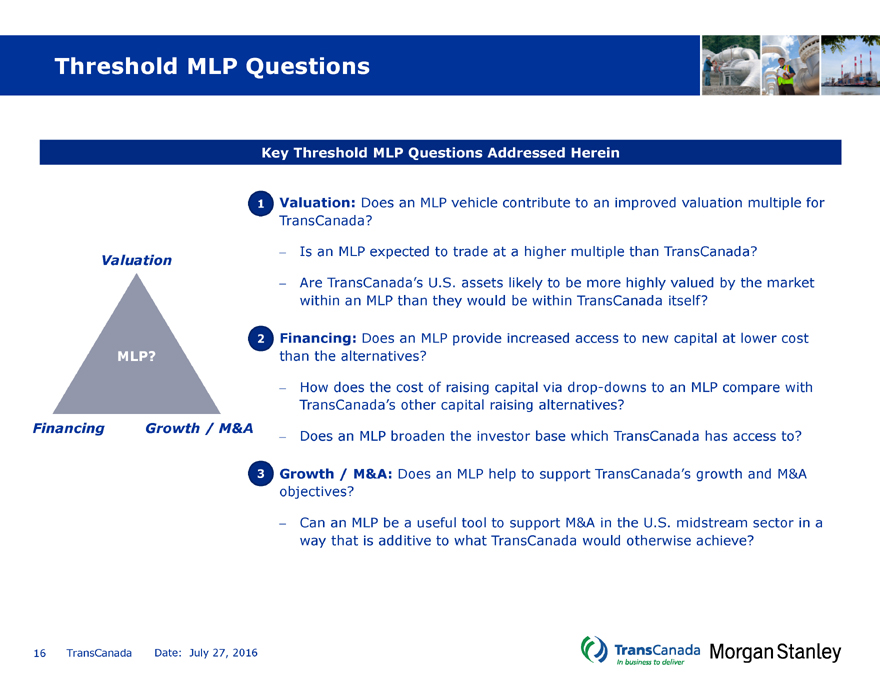
Threshold MLP Questions
Key Threshold MLP Questions Addressed Herein
1 Valuation: Does an MLP vehicle contribute to an improved valuation multiple for
TransCanada?
Valuation – Is an MLP expected to trade at a higher multiple than TransCanada?
– Are TransCanada’s U.S. assets likely to be more highly valued by the market
within an MLP than they would be within TransCanada itself?
2 Financing: Does an MLP provide increased access to new capital at lower cost
MLP? than the alternatives?
– How does the cost of raising capital via drop-downs to an MLP compare with
TransCanada’s other capital raising alternatives?
Financing Growth / M&A – Does an MLP broaden the investor base which TransCanada has access to?
3 Growth / M&A: Does an MLP help to support TransCanada’s growth and M&A
objectives?
– Can an MLP be a useful tool to support M&A in the U.S. midstream sector in a
way that is additive to what TransCanada would otherwise achieve?
16 TransCanada Date: July 27, 2016
|
|
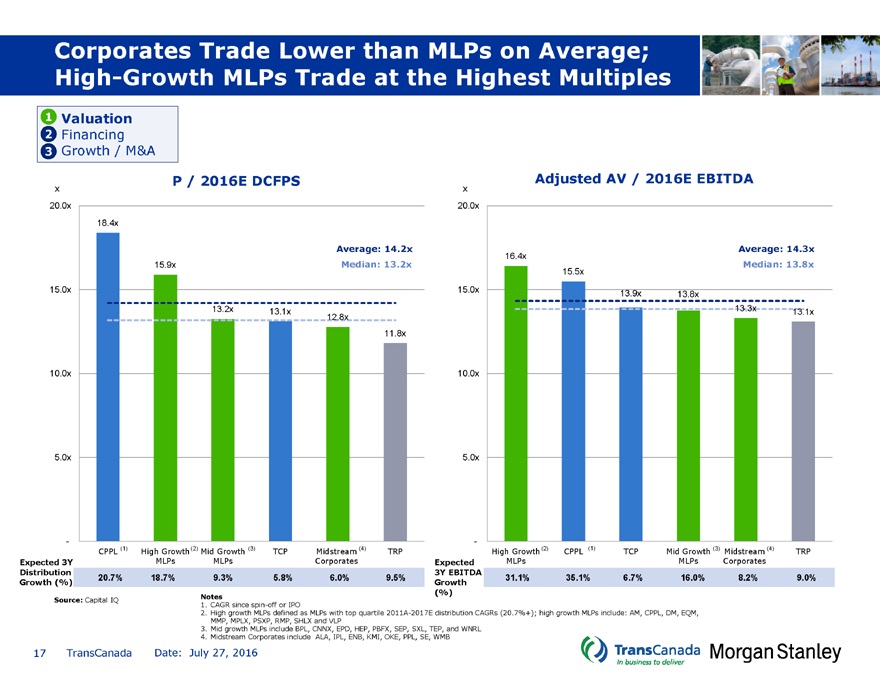
Corporates Trade Lower than MLPs on Average; High-Growth MLPs Trade at the Highest Multiples
1 Valuation
2 Financing
3 Growth / M&A
P / 2016E DCFPSAdjusted AV / 2016E EBITDA
x x
20.0x 20.0x
18.4x
Average: 14.2xAverage: 14.3x
16.4x
15.9xMedian: 13.2xMedian: 13.8x
15.5x
15.0x 15.0x13.9x13.8x
13.2x13.1x13.3x13.1x
12.8x
11.8x
10.0x 10.0x
5.0x 5.0x
- -
CPPL (1) High Growth (2) Mid Growth (3)TCPMidstream (4)TRPHigh Growth (2)CPPL (1)TCPMid Growth (3) Midstream (4)TRP
Expected 3Y MLPsMLPsCorporatesExpectedMLPsMLPsCorporates
Distribution 3Y EBITDA
20.7% 18.7%9.3%5.8%6.0%9.5%31.1%35.1%6.7%16.0%8.2%9.0%
Growth (%) Growth
Source: Capital IQ Notes
1. CAGR since spin-off or IPO
2. High growth MLPs defined as MLPs with top quartile 2011A-2017E distribution CAGRs (20.7%+); high growth MLPs include: AM, CPPL, DM, EQM, MMP, MPLX, PSXP, RMP, SHLX and VLP
3. Mid growth MLPs include BPL, CNNX, EPD, HEP, PBFX, SEP, SXL, TEP, and WNRL
4. Midstream Corporates include ALA, IPL, ENB, KMI, OKE, PPL, SE, WMB
17 TransCanada Date: July 27, 2016
|
|
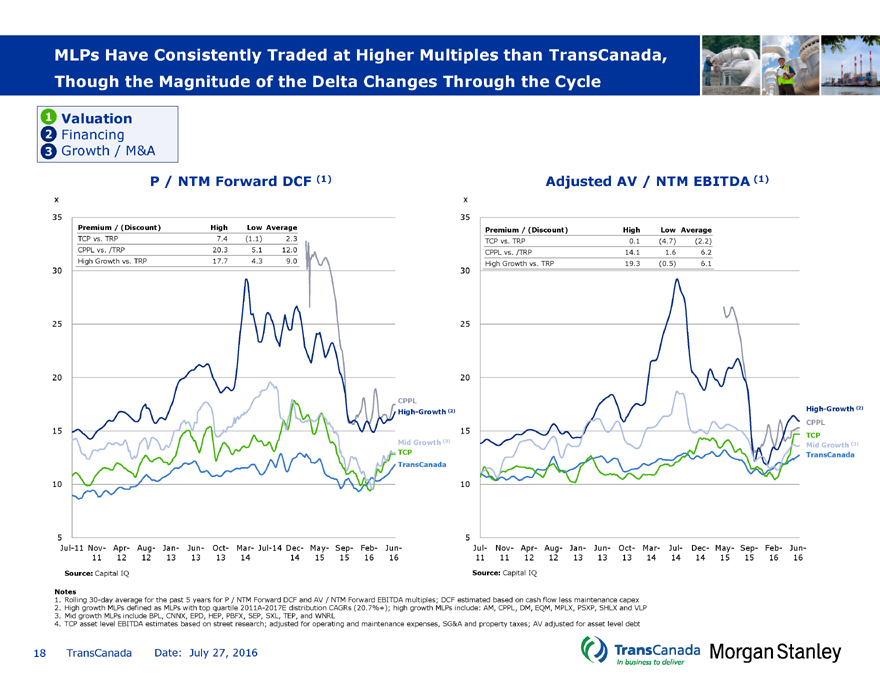
MLPs Have Consistently Traded at Higher Multiples than TransCanada, Though the Magnitude of the Delta Changes Through the Cycle
1 Valuation
2 Financing
3 Growth / M&A
P / NTM Forward DCF (1) Adjusted AV / NTM EBITDA (1)
x x
35 35
Premium / (Discount) HighLow AveragePremium / (Discount)HighLow Average
TCP vs. TRP 7.4(1.1)2.3TCP vs. TRP0.1(4.7)(2.2)
CPPL vs. /TRP 20.35.112.0CPPL vs. /TRP14.11.66.2
High Growth vs. TRP 17.74.39.0High Growth vs. TRP19.3(0.5)6.1
30 30
25 25
20 20
CPPL
High-Growth (2)High-Growth (2)
CPPL
15 15TCP
Mid Growth (3)Mid Growth (3)
TCPTransCanada
TransCanada
10 10
5 5
Jul-11 Nov- Apr- Aug- Jan- Jun- Oct- Mar- Jul-14 Dec- May- Sep- Feb- Jun- Jul- Nov- Apr- Aug- Jan- Jun-Oct- Mar- Jul- Dec- May- Sep- Feb- Jun-
11 12 12 13 13 131414 15 15 16 1611 11 12 12 13131314 1414 15 15 16 16
Source: Capital IQ Source: Capital IQ
Notes
1. Rolling 30-day average for the past 5 years for P / NTM Forward DCF and AV / NTM Forward EBITDA multiples; DCF estimated based on cash flow less maintenance capex
2. High growth MLPs defined as MLPs with top quartile 2011A-2017E distribution CAGRs (20.7%+); high growth MLPs include: AM, CPPL, DM, EQM, MPLX, PSXP, SHLX and VLP
3. Mid growth MLPs include BPL, CNNX, EPD, HEP, PBFX, SEP, SXL, TEP, and WNRL
4. TCP asset level EBITDA estimates based on street research; adjusted for operating and maintenance expenses, SG&A and property taxes; AV adjusted for asset level debt
18 TransCanada Date: July 27, 2016
|
|
U.S. Assets are Potentially More Highly Valued Inside of an MLP than within TransCanada
1 Valuation
2 Financing
3 Growth / M&A
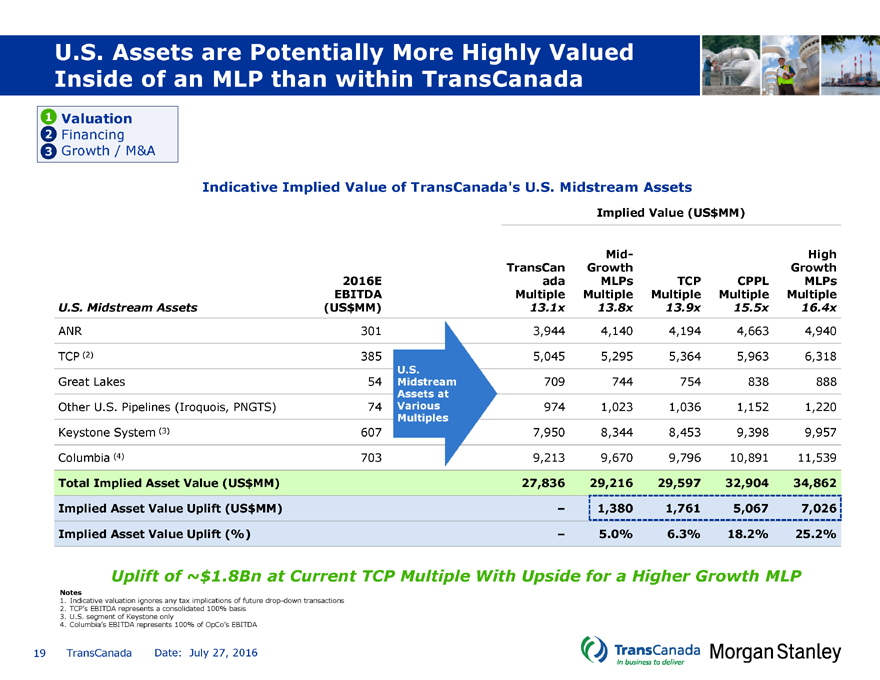
Indicative Implied Value of TransCanada’s U.S. Midstream Assets
$Implied Value(US MM)
Mid-High
TransCanGrowthGrowth
2016E adaMLPsTCPCPPLMLPs
EBITDA MultipleMultipleMultipleMultipleMultiple
U.S. Midstream Assets $(US MM) 13.1x13.8x13.9x15.5x16.4x
ANR 301 3,9444,1404,1944,6634,940
TCP (2) 385 5,0455,2955,3645,9636,318
U.S.
Great Lakes 54 Midstream709744754838888
Assets at
Other U.S. Pipelines (Iroquois, PNGTS) 74 Various9741,0231,0361,1521,220
Multiples
Keystone System (3) 607 7,9508,3448,4539,3989,957
Columbia (4) 703 9,2139,6709,79610,89111,539
Total Implied Asset Value (USMM)$ 27,836 29,21629,59732,90434,862
Implied Asset Value Uplift (USMM)$ – 1,3801,7615,0677,026
Implied Asset Value Uplift (%) –5.0%6.3%18.2%25.2%
Uplift of ~$1.8Bn at Current TCP Multiple With Upside for a Higher Growth MLP
Notes
1. Indicative valuation ignores any tax implications of future drop-down transactions
2. TCP’s EBITDA represents a consolidated 100% basis
3. U.S. segment of Keystone only
4. Columbia’s EBITDA represents 100% of OpCo’s EBITDA
19 TransCanada Date: July 27, 2016
|
|
Drop-Downs are Competitive with TransCanada’s Other Available Sources of Capital
1 Valuation
2 Financing
3 Growth / M&A
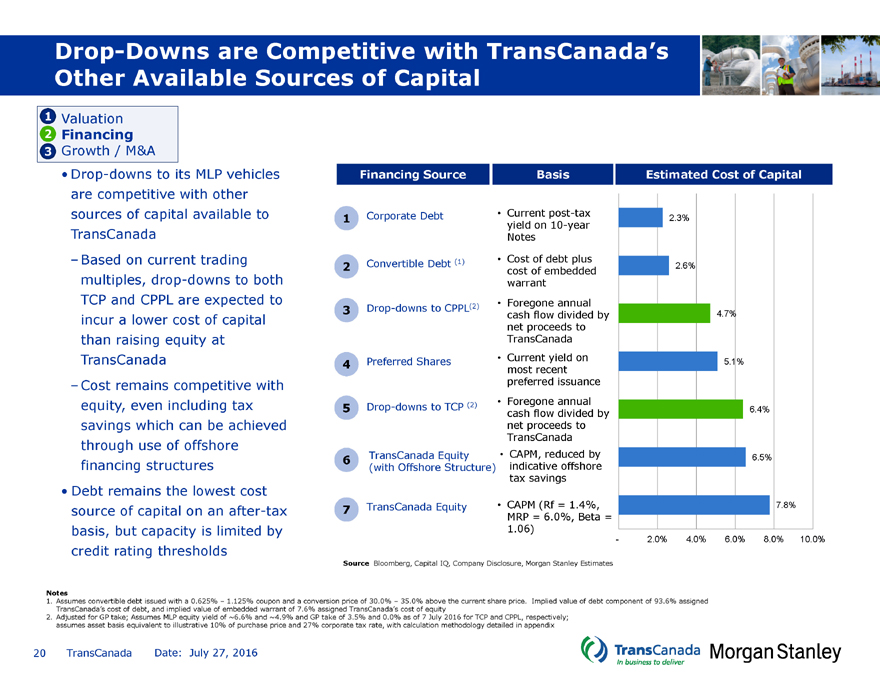
• Drop-downs to its MLP vehicles are competitive with other sources of capital available to TransCanada
–Based on current trading multiples, drop-downs to both TCP and CPPL are expected to incur a lower cost of capital than raising equity at TransCanada
–Cost remains competitive with equity, even including tax savings which can be achieved through use of offshore financing structures
• Debt remains the lowest cost source of capital on an after-tax basis, but capacity is limited by credit rating thresholds
Financing Source BasisEstimated Cost of Capital
1 Corporate Debt •Current post-tax2.3%
yield on 10-year
Notes
Convertible Debt (1) •Cost of debt plus
2 cost of embedded2.6%
warrant
3 Drop-downs to CPPL(2) •Foregone annual
cash flow divided by4.7%
net proceeds to
TransCanada
4 Preferred Shares •most Current recent yield on5.1%
preferred issuance
Drop-downs to TCP (2) •Foregone annual
5 cash flow divided by6.4%
net proceeds to
TransCanada
6 TransCanada Equity • CAPM, reduced by6.5%
(with Offshore Structure) indicative offshore
tax savings
7 TransCanada Equity •CAPM (Rf = 1.4%,7.8%
MRP = 6.0%, Beta =
1.06)
-2.0% 4.0%6.0%8.0% 10.0%
Source Bloomberg, Capital IQ, Company Disclosure, Morgan Stanley Estimates
Notes
1. Assumes convertible debt issued with a 0.625% – 1.125% coupon and a conversion price of 30.0% – 35.0% above the current share price. Implied value of debt component of 93.6% assigned TransCanada’s cost of debt, and implied value of embedded warrant of 7.6% assigned TransCanada’s cost of equity
2. Adjusted for GP take; Assumes MLP equity yield of ~6.6% and ~4.9% and GP take of 3.5% and 0.0% as of 7 July 2016 for TCP and CPPL, respectively; assumes asset basis equivalent to illustrative 10% of purchase price and 27% corporate tax rate, with calculation methodology detailed in appendix
20 TransCanada Date: July 27, 2016
|
|
TransCanada’s Historical Use of TCP has Been Inconsistent
1 Valuation
2 Financing
3 Growth / M&A
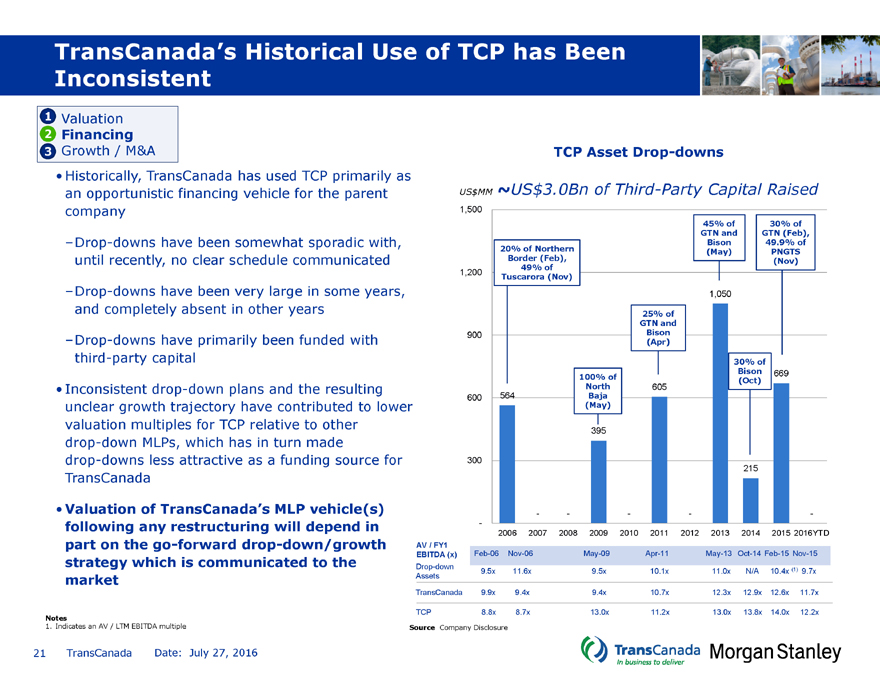
• Historically, TransCanada has used TCP primarily as an opportunistic financing vehicle for the parent company
–Drop-downs have been somewhat sporadic with, until recently, no clear schedule communicated
–Drop-downs have been very large in some years, and completely absent in other years
–Drop-downs have primarily been funded with third-party capital
• Inconsistent drop-down plans and the resulting unclear growth trajectory have contributed to lower valuation multiples for TCP relative to other drop-down MLPs, which has in turn made drop-downs less attractive as a funding source for TransCanada
• Valuation of TransCanada’s MLP vehicle(s) following any restructuring will depend in part on the go-forward drop-down/growth strategy which is communicated to the market
Notes
1. Indicates an AV / LTM EBITDA multiple
TCP Asset Drop-downs
$$USUS MM ~ 3.0Bn of Third-Party Capital Raised
1,500
45% of30% of
GTN andGTN (Feb),
Bison49.9% of
20% of Northern(May)PNGTS
Border (Feb),(Nov)
49% of
1,200 Tuscarora (Nov)
1,050
25% of
GTN and
900 Bison
(Apr)
30% of
100% ofBison669
North605(Oct)
600 564Baja
(May)
395
300
215
—---
-
2006 2007 20082009 20102011 2012201320142015 2016YTD
AV / FY1
EBITDA (x) Feb-06 Nov-06 May-09Apr-11May-13 Oct-14 Feb-15 Nov-15
Drop-down 9.5x 11.6x9.5x10.1x11.0x N/A10.4x (1) 9.7x
Assets
TransCanada 9.9x 9.4x9.4x10.7x12.3x 12.9x 12.6x 11.7x
TCP 8.8x 8.7x13.0x11.2x13.0x13.8x 14.0x 12.2x
Source Company Disclosure
21 TransCanada Date: July 27, 2016
|
|
TransCanada’s Current MLP Drop-down Pipeline
1 Valuation
2 Financing
3 Growth / M&A
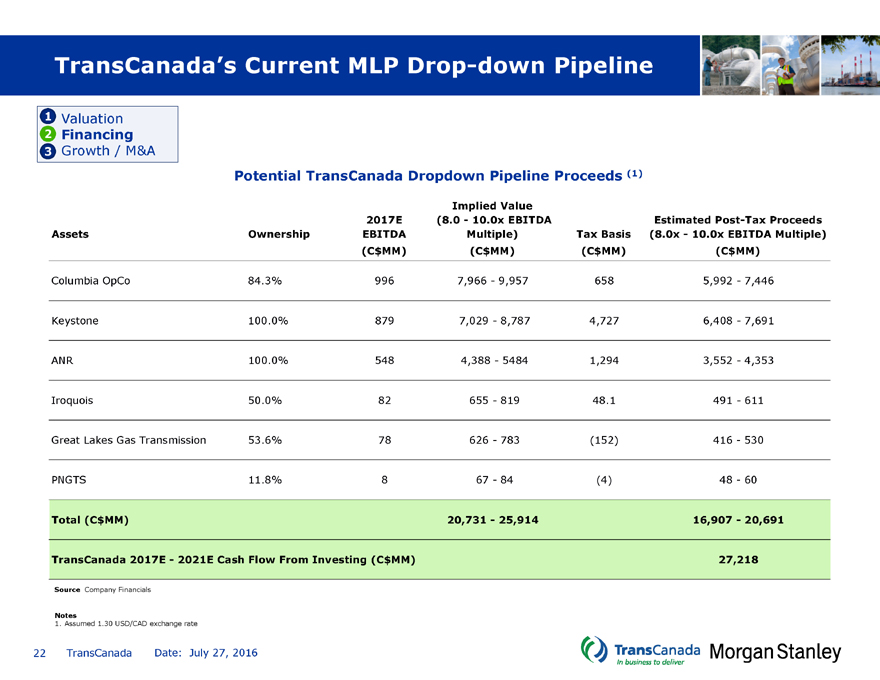
Potential TransCanada Dropdown Pipeline Proceeds (1)
Implied Value
2017E(8.0—10.0x EBITDAEstimated Post-Tax Proceeds
Assets Ownership EBITDAMultiple)Tax Basis(8.0x—10.0x EBITDA Multiple)
(C$MM)(C$MM)(C$MM)(C$MM)
Columbia OpCo 84.3% 9967,966—9,9576585,992- 7,446
Keystone 100.0% 8797,029-8,7874,7276,408- 7,691
ANR 100.0% 5484,388—54841,2943,552- 4,353
Iroquois 50.0% 82655-81948.1491- 611
Great Lakes Gas Transmission 53.6% 78626-783(152)416- 530
PNGTS 11.8% 867-84(4)48- 60
Total (C$MM) 20,731—25,91416,907—20,691
TransCanada 2017E—2021E Cash Flow From Investing (C$MM) 27,218
Source Company Financials
Notes
1. Assumed 1.30 USD/CAD exchange rate
22 TransCanada Date: July 27, 2016
|
|
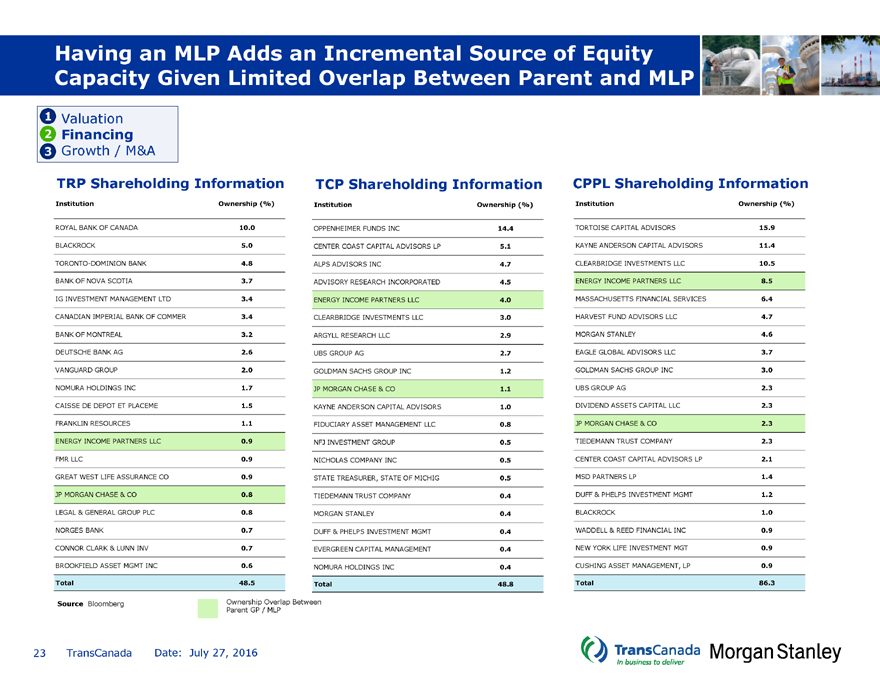
Having an MLP Adds an Incremental Source of Equity Capacity Given Limited Overlap Between Parent and MLP
1 Valuation
2 Financing
3 Growth / M&A
TRP Shareholding Information TCP Shareholding Information CPPL Shareholding Information
Institution Ownership (%) InstitutionOwnership (%)InstitutionOwnership (%)
ROYAL BANK OF CANADA 10.0 OPPENHEIMER FUNDS INC14.4TORTOISE CAPITAL ADVISORS15.9
BLACKROCK 5.0 CENTER COAST CAPITAL ADVISORS LP5.1KAYNE ANDERSON CAPITAL ADVISORS11.4
TORONTO-DOMINION BANK 4.8 ALPS ADVISORS INC4.7CLEARBRIDGE INVESTMENTS LLC10.5
BANK OF NOVA SCOTIA 3.7 ADVISORY RESEARCH INCORPORATED4.5ENERGY INCOME PARTNERS LLC8.5
IG INVESTMENT MANAGEMENT LTD 3.4 ENERGY INCOME PARTNERS LLC4.0MASSACHUSETTS FINANCIAL SERVICES6.4
CANADIAN IMPERIAL BANK OF COMMER 3.4 CLEARBRIDGE INVESTMENTS LLC3.0HARVEST FUND ADVISORS LLC4.7
BANK OF MONTREAL 3.2 ARGYLL RESEARCH LLC2.9MORGAN STANLEY4.6
DEUTSCHE BANK AG 2.6 UBS GROUP AG2.7EAGLE GLOBAL ADVISORS LLC3.7
VANGUARD GROUP 2.0 GOLDMAN SACHS GROUP INC1.2GOLDMAN SACHS GROUP INC3.0
NOMURA HOLDINGS INC 1.7 JP MORGAN CHASE & CO1.1UBS GROUP AG2.3
CAISSE DE DEPOT ET PLACEME 1.5 KAYNE ANDERSON CAPITAL ADVISORS1.0DIVIDEND ASSETS CAPITAL LLC2.3
FRANKLIN RESOURCES 1.1 FIDUCIARY ASSET MANAGEMENT LLC0.8JP MORGAN CHASE & CO2.3
ENERGY INCOME PARTNERS LLC 0.9 NFJ INVESTMENT GROUP0.5TIEDEMANN TRUST COMPANY2.3
FMR LLC 0.9 NICHOLAS COMPANY INC0.5CENTER COAST CAPITAL ADVISORS LP2.1
GREAT WEST LIFE ASSURANCE CO 0.9 STATE TREASURER, STATE OF MICHIG0.5MSD PARTNERS LP1.4
JP MORGAN CHASE & CO 0.8 TIEDEMANN TRUST COMPANY0.4DUFF & PHELPS INVESTMENT MGMT1.2
LEGAL & GENERAL GROUP PLC 0.8 MORGAN STANLEY0.4BLACKROCK1.0
NORGES BANK 0.7 DUFF & PHELPS INVESTMENT MGMT0.4WADDELL & REED FINANCIAL INC0.9
CONNOR CLARK & LUNN INV 0.7 EVERGREEN CAPITAL MANAGEMENT0.4NEW YORK LIFE INVESTMENT MGT0.9
BROOKFIELD ASSET MGMT INC 0.6 NOMURA HOLDINGS INC0.4CUSHING ASSET MANAGEMENT, LP0.9
Total 48.5 Total48.8Total86.3
Source Bloomberg Ownership Overlap Between
Parent GP / MLP
23 TransCanada Date: July 27, 2016
|
|
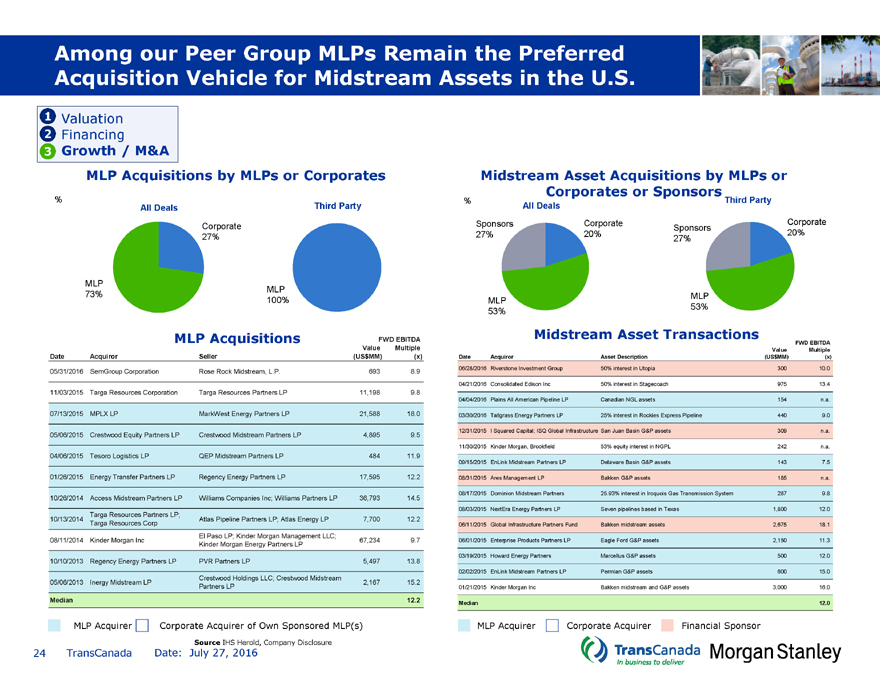
Among our Peer Group MLPs Remain the Preferred Acquisition Vehicle for Midstream Assets in the U.S.
1 Valuation
2 Financing
3 Growth / M&A
MLP Acquisitions by MLPs or Corporates Midstream Asset Acquisitions by MLPs or
Corporates or Sponsors
% %Third Party
All Deals Third PartyAll Deals
CorporateSponsorsCorporateSponsorsCorporate
27%27%20%27%20%
MLP MLP
73% MLP
100%MLP
53%53%
MLP AcquisitionsFWD EBITDAMidstream Asset TransactionsFWD EBITDA
Value MultipleValueMultiple
Date Acquiror Seller$(US$MM) (x) Date Acquiror Asset Description(US MM)(x)
05/31/2016 SemGroup Corporation Rose Rock Midstream, L.P.6938.906/28/2016Riverstone Investment Group50% interest in Utopia30010.0
04/21/2016Consolidated Edison Inc50% interest in Stagecoach97513.4
11/03/2015 Targa Resources Corporation Targa Resources Partners LP11,1989.8
04/04/2016Plains All American Pipeline LPCanadian NGL assets154n.a.
07/13/2015 MPLX LP MarkWest Energy Partners LP21,58818.003/30/2016Tallgrass Energy Partners LP25% interest in Rockies Express Pipeline4409.0
05/06/2015 Crestwood Equity Partners LP Crestwood Midstream Partners LP4,8959.512/31/2015I Squared Capital; ISQ Global Infrastructure San Juan Basin G&P assets309n.a.
11/30/2015Kinder Morgan, Brookfield53% equity interest in NGPL242n.a.
04/06/2015 Tesoro Logistics LP QEP Midstream Partners LP48411.9
09/15/2015EnLink Midstream Partners LPDelaware Basin G&P assets1437.5
01/26/2015 Energy Transfer Partners LP Regency Energy Partners LP17,59512.208/31/2015Ares Management LPBakken G&P assets185n.a.
08/17/2015Dominion Midstream Partners25.93% interest in Iroquois Gas Transmission System2879.8
10/26/2014 Access Midstream Partners LP Williams Companies Inc; Williams Partners LP36,79314.5
08/03/2015NextEra Energy Partners LPSeven pipelines based in Texas1,80012.0
Targa Resources Partners LP;
10/13/2014 Atlas Pipeline Partners LP; Atlas Energy LP7,70012.2
Targa Resources Corp 06/11/2015Global Infrastructure Partners FundBakken midstream assets2,67518.1
El Paso LP; Kinder Morgan Management LLC;
08/11/2014 Kinder Morgan Inc 67,2349.706/01/2015Enterprise Products Partners LPEagle Ford G&P assets2,15011.3
Kinder Morgan Energy Partners LP
03/19/2015Howard Energy PartnersMarcellus G&P assets50012.0
10/10/2013 Regency Energy Partners LP PVR Partners LP5,49713.8
02/02/2015EnLink Midstream Partners LPPermian G&P assets60015.0
Crestwood Holdings LLC; Crestwood Midstream
05/06/2013 Inergy Midstream LP 2,16715.2
Partners LP01/21/2015Kinder Morgan IncBakken midstream and G&P assets3,00016.0
Median 12.2Median12.0
MLP Acquirer Corporate Acquirer of Own Sponsored MLP(s) MLP AcquirerCorporate AcquirerFinancial Sponsor
Source IHS Herold, Company Disclosure
24 TransCanada Date: July 27, 2016
|
|
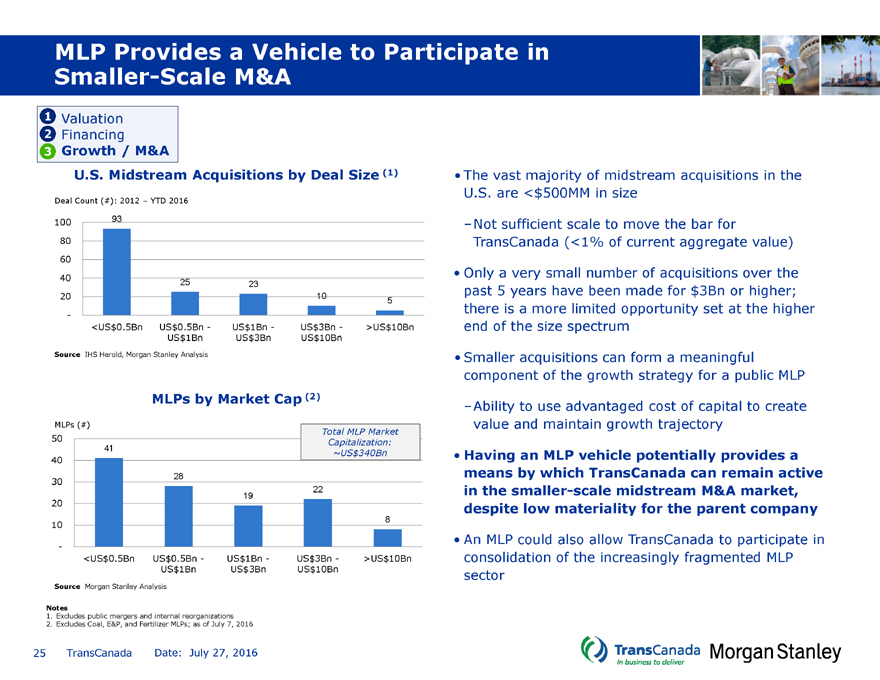
MLP Provides a Vehicle to Participate in Smaller-Scale M&A
1 Valuation
2 Financing
3 Growth / M&A
U.S. Midstream Acquisitions by Deal Size (1)
Deal Count (#): 2012 – YTD 2016
100 93
80
60
40 25 23
20 105
-
<US$0.5Bn US$0.5Bn - US$1Bn -US$3Bn ->US$10Bn
US$1Bn US$3BnUS$10Bn
Source IHS Herold, Morgan Stanley Analysis
MLPs by Market Cap (2)
MLPs (#)
Total MLP Market
50 Capitalization:
41 ~US$340Bn
40
30 28
22
19
20
10 8
-
<US$0.5Bn US$0.5Bn - US$1Bn -US$3Bn ->US$10Bn
US$1Bn US$3BnUS$10Bn
Source Morgan Stanley Analysis
Notes
1. Excludes public mergers and internal reorganizations
2. Excludes Coal, E&P, and Fertilizer MLPs; as of July 7, 2016
• The vast majority of midstream acquisitions in the U.S. are <$500MM in size
–Not sufficient scale to move the bar for TransCanada (<1% of current aggregate value)
• Only a very small number of acquisitions over the past 5 years have been made for $3Bn or higher; there is a more limited opportunity set at the higher end of the size spectrum
• Smaller acquisitions can form a meaningful component of the growth strategy for a public MLP
–Ability to use advantaged cost of capital to create value and maintain growth trajectory
• Having an MLP vehicle potentially provides a means by which TransCanada can remain active in the smaller-scale midstream M&A market, despite low materiality for the parent company
• An MLP could also allow TransCanada to participate in consolidation of the increasingly fragmented MLP sector
25 TransCanada Date: July 27, 2016
|
|
Pros and Cons of Potential MLP Outcomes
Two MLPs One MLPNo MLPs
• Same pros as one MLP • Maintain optionality through• Simplest corporate structure
• Broader set of financing vehicles diversity of financing sources• Opportunity to achieve a tax
available to TransCanada • Ability to achieve lower cost ofbasis step-up when buying in
capital through drop-downsexisting MLPs
relative to issuing equity• Retain previously distributed
• Market value uplift for assetscash flow
Pros held within an MLP• Remove of structural
• Tool to effect smaller-scale M&Asubordination of assets at MLP
in the U.S.has positive ratings implications
• Increasing cashflow benefit to
TransCanada over time through
GP splits
• Most complex corporate • More complex corporate• Loss of tax-efficient vehicle to
structure structurefinance U.S. growth projects
• Increased structural • Impact on credit ratings through• Heavier short-term burden to
subordination of debt structural subordination of debtTransCanada to finance both
• Investor confusion around held at the TCPL leveltransactions
strategy for each MLP, • Need to continue to feed MLP• Heavier long-term burden to
Cons particularly given both are active growth through on-going dropTransCanada to fund total capex
in the same sector downs – need clearlyprogram
• More challenging to balance articulated strategy• Potential emergence of sum-of-
growth stories for both MLPs the-parts discount over time
• Additional cost and management • Loss of MLP currency to facilitate
time required to manage two midstream consolidation
public subsidiaries
26 TransCanada Date: July 27, 2016
|
|
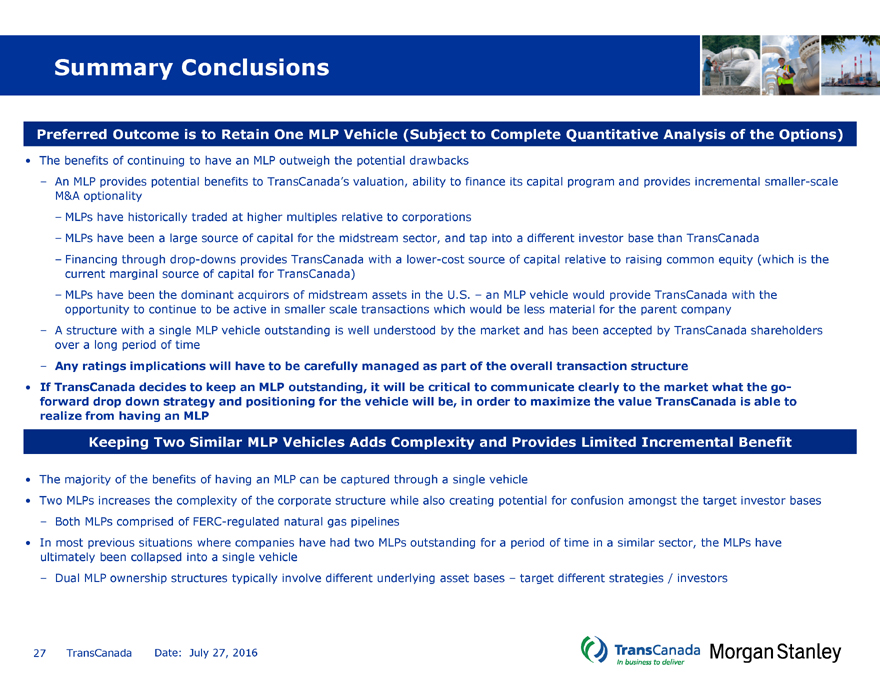
Summary Conclusions
Preferred Outcome is to Retain One MLP Vehicle (Subject to Complete Quantitative Analysis of the Options)
• The benefits of continuing to have an MLP outweigh the potential drawbacks
– An MLP provides potential benefits to TransCanada’s valuation, ability to finance its capital program and provides incremental smaller-scale M&A optionality
– MLPs have historically traded at higher multiples relative to corporations
– MLPs have been a large source of capital for the midstream sector, and tap into a different investor base than TransCanada
– Financing through drop-downs provides TransCanada with a lower-cost source of capital relative to raising common equity (which is the current marginal source of capital for TransCanada)
– MLPs have been the dominant acquirors of midstream assets in the U.S. – an MLP vehicle would provide TransCanada with the opportunity to continue to be active in smaller scale transactions which would be less material for the parent company
– A structure with a single MLP vehicle outstanding is well understood by the market and has been accepted by TransCanada shareholders over a long period of time
– Any ratings implications will have to be carefully managed as part of the overall transaction structure
• If TransCanada decides to keep an MLP outstanding, it will be critical to communicate clearly to the market what the go-forward drop down strategy and positioning for the vehicle will be, in order to maximize the value TransCanada is able to realize from having an MLP
Keeping Two Similar MLP Vehicles Adds Complexity and Provides Limited Incremental Benefit
• The majority of the benefits of having an MLP can be captured through a single vehicle
• Two MLPs increases the complexity of the corporate structure while also creating potential for confusion amongst the target investor bases
– Both MLPs comprised of FERC-regulated natural gas pipelines
• In most previous situations where companies have had two MLPs outstanding for a period of time in a similar sector, the MLPs have ultimately been collapsed into a single vehicle
– Dual MLP ownership structures typically involve different underlying asset bases – target different strategies / investors
27 TransCanada Date: July 27, 2016
|
|
Next Steps
Review of Potential Transaction Structures to Eliminate One of TransCanada’s MLPs
• The objective of getting back to a single MLP structure could be accomplished in one of several ways:
1. TransCanada buys in the public float of TCP
2. TransCanada buys in the public float of CPPL
3. TCP and CPPL merge to form a single MLP
• As the next step of this analysis, we will review each of these potential options to determine which is likely to be the most attractive to TransCanada, taking into account the following considerations, among others:
– Credit implications of the transaction
– Accretion/Dilution of earnings and cash flow per share to TransCanada shareholders
– Impact on TransCanada’s future funding requirements and ability to finance
– Valuation and strategic implications for the pro forma MLP vehicle
– Tax implications for both TransCanada and MLP unitholders
– Legal and structural issues relating to each potential transaction
• A full analysis of the implications of each potential transaction structure will be presented at the upcoming Board meeting on July 27th
28 TransCanada Date: July 27, 2016
|
|
Appendix: Supplemental Materials
29 TransCanada Date: July 27, 2016
|
|
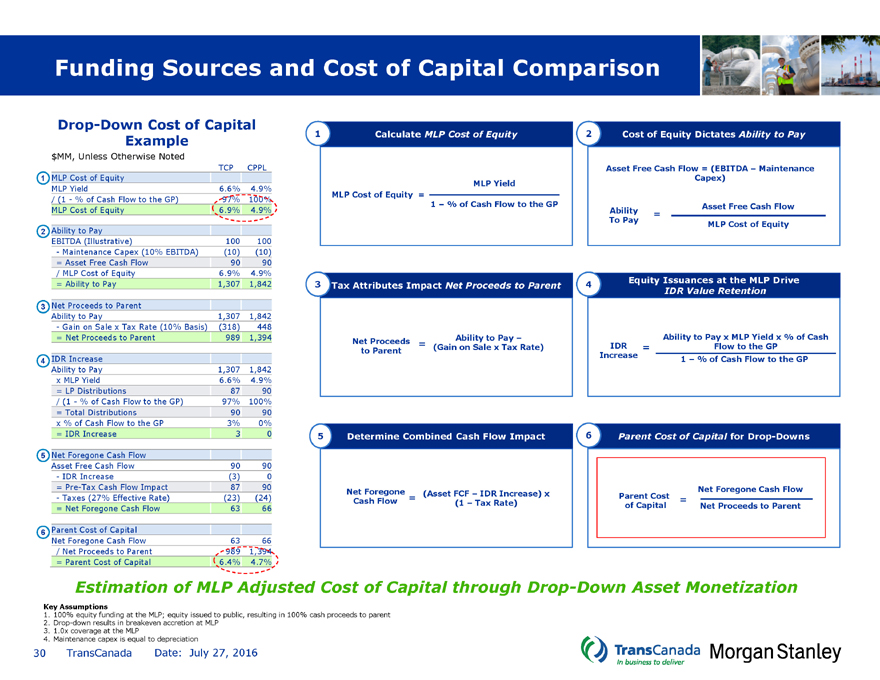
Funding Sources and Cost of Capital Comparison
Drop-Down Cost of Capital
Example
$MM, Unless Otherwise Noted
TCP CPPL
1
MLP Cost of Equity
MLP Yield
6.6%
4.9%
/ (1—% of Cash Flow to the GP)
97%
100%
MLP Cost of Equity
6.9%
4.9%
2
Ability to Pay
EBITDA (Illustrative)
100
100
- Maintenance Capex (10% EBITDA)
(10)
(10)
= Asset Free Cash Flow
90
90
/ MLP Cost of Equity
6.9%
4.9%
= Ability to Pay
1,307
1,842
3
Net Proceeds to Parent
Ability to Pay
1,307
1,842
- Gain on Sale x Tax Rate (10% Basis)
(318)
448
= Net Proceeds to Parent
989
1,394
4
IDR Increase
Ability to Pay
1,307
1,842
x MLP Yield
6.6%
4.9%
= LP Distributions
87
90
/ (1—% of Cash Flow to the GP)
97%
100%
= Total Distributions
90
90
x % of Cash Flow to the GP
3%
0%
= IDR Increase
3
0
5
Net Foregone Cash Flow
Asset Free Cash Flow
90
90
- IDR Increase
(3)
0
= Pre-Tax Cash Flow Impact
87 90 - Taxes (27% Effective Rate)
(23)
(24) = Net Foregone Cash Flow
63
66
6
Parent Cost of Capital Net Foregone Cash Flow 63 66
/ Net Proceeds to Parent
989 1,394
= Parent Cost of Capital 6.4% 4.7%
1 Calculate MLP Cost of Equity 2Cost of Equity Dictates Ability to Pay
Asset Free Cash Flow = (EBITDA – Maintenance
MLP YieldCapex)
MLP Cost of Equity =
1 – % of Cash Flow to the GPAsset Free Cash Flow
Ability =
To PayMLP Cost of Equity
3 Tax Attributes Impact Net Proceeds to Parent 4Equity Issuances at the MLP Drive
IDR Value Retention
Ability to Pay –Ability to Pay x MLP Yield x % of Cash
Net to Proceeds Parent = (Gain on Sale x Tax Rate)IDR =Flow to the GP
Increase1 – % of Cash Flow to the GP
5 Determine Combined Cash Flow Impact 6Parent Cost of Capital for Drop-Downs
Net Foregone = (Asset FCF – IDR Increase) xParent CostNet Foregone Cash Flow
Cash Flow (1 – Tax Rate)of Capital= Net Proceeds to Parent
Estimation of MLP Adjusted Cost of Capital through Drop-Down Asset Monetization
Key Assumptions
1. 100% equity funding at the MLP; equity issued to public, resulting in 100% cash proceeds to parent
2. Drop-down results in breakeven accretion at MLP
3. 1.0x coverage at the MLP
4. Maintenance capex is equal to depreciation
30 TransCanada Date: July 27, 2016
|
|
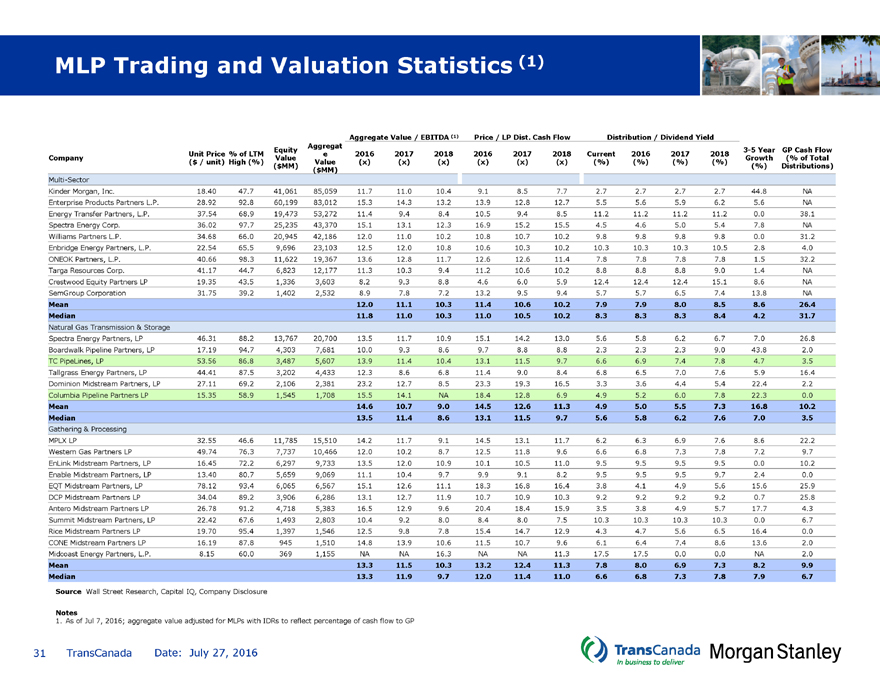
MLP Trading and Valuation Statistics (1)
Aggregate Value / EBITDA (1)Price / LP Dist. Cash FlowDistribution / Dividend Yield
Aggregat
Equity3-5 YearGP Cash Flow
Unit Price % of LTM e201620172018201620172018Current201620172018
Company ValueGrowth (% of Total
($ / unit) High (%) Value(x)(x)(x)(x)(x)(x)(%)(%)(%)(%)
($MM)(%)Distributions)
($MM)
Multi-Sector
Kinder Morgan, Inc. 18.40 47.741,06185,05911.711.010.49.18.57.72.72.72.72.744.8NA
Enterprise Products Partners L.P. 28.92 92.860,19983,01215.314.313.213.912.812.75.55.65.96.25.6NA
Energy Transfer Partners, L.P. 37.54 68.919,47353,27211.49.48.410.59.48.511.211.211.211.20.038.1
Spectra Energy Corp. 36.02 97.725,23543,37015.113.112.316.915.215.54.54.65.05.47.8NA
Williams Partners L.P. 34.68 66.020,94542,18612.011.010.210.810.710.29.89.89.89.80.031.2
Enbridge Energy Partners, L.P. 22.54 65.59,69623,10312.512.010.810.610.310.210.310.310.310.52.84.0
ONEOK Partners, L.P. 40.66 98.311,62219,36713.612.811.712.612.611.47.87.87.87.81.532.2
Targa Resources Corp. 41.17 44.76,82312,17711.310.39.411.210.610.28.88.88.89.01.4NA
Crestwood Equity Partners LP 19.35 43.51,3363,6038.29.38.84.66.05.912.412.412.415.18.6NA
SemGroup Corporation 31.75 39.21,4022,5328.97.87.213.29.59.45.75.76.57.413.8NA
Mean 12.011.110.311.410.610.27.97.98.08.58.626.4
Median 11.811.010.311.010.510.28.38.38.38.44.231.7
Natural Gas Transmission & Storage
Spectra Energy Partners, LP 46.31 88.213,76720,70013.511.710.915.114.213.05.65.86.26.77.026.8
Boardwalk Pipeline Partners, LP 17.19 94.74,3037,68110.09.38.69.78.88.82.32.32.39.043.82.0
TC PipeLines, LP 53.56 86.83,4875,60713.911.410.413.111.59.76.66.97.47.84.73.5
Tallgrass Energy Partners, LP 44.41 87.53,2024,43312.38.66.811.49.08.46.86.57.07.65.916.4
Dominion Midstream Partners, LP 27.11 69.22,1062,38123.212.78.523.319.316.53.33.64.45.422.42.2
Columbia Pipeline Partners LP 15.35 58.91,5451,70815.514.1NA18.412.86.94.95.26.07.822.30.0
Mean 14.610.79.014.512.611.34.95.05.57.316.810.2
Median 13.511.48.613.111.59.75.65.86.27.67.03.5
Gathering & Processing
MPLX LP 32.55 46.611,78515,51014.211.79.114.513.111.76.26.36.97.68.622.2
Western Gas Partners LP 49.74 76.37,73710,46612.010.28.712.511.89.66.66.87.37.87.29.7
EnLink Midstream Partners, LP 16.45 72.26,2979,73313.512.010.910.110.511.09.59.59.59.50.010.2
Enable Midstream Partners, LP 13.40 80.75,6599,06911.110.49.79.99.18.29.59.59.59.72.40.0
EQT Midstream Partners, LP 78.12 93.46,0656,56715.112.611.118.316.816.43.84.14.95.615.625.9
DCP Midstream Partners LP 34.04 89.23,9066,28613.112.711.910.710.910.39.29.29.29.20.725.8
Antero Midstream Partners LP 26.78 91.24,7185,38316.512.99.620.418.415.93.53.84.95.717.74.3
Summit Midstream Partners, LP 22.42 67.61,4932,80310.49.28.08.48.07.510.310.310.310.30.06.7
Rice Midstream Partners LP 19.70 95.41,3971,54612.59.87.815.414.712.94.34.75.66.516.40.0
CONE Midstream Partners LP 16.19 87.89451,51014.813.910.611.510.79.66.16.47.48.613.62.0
Midcoast Energy Partners, L.P. 8.15 60.03691,155NANA16.3NANA11.317.517.50.00.0NA2.0
Mean 13.311.510.313.212.411.37.88.06.97.38.29.9
Median 13.311.99.712.011.411.06.66.87.37.87.96.7
Source Wall Street Research, Capital IQ, Company Disclosure
Notes
1. As of Jul 7, 2016; aggregate value adjusted for MLPs with IDRs to reflect percentage of cash flow to GP
31 TransCanada Date: July 27, 2016
|
|
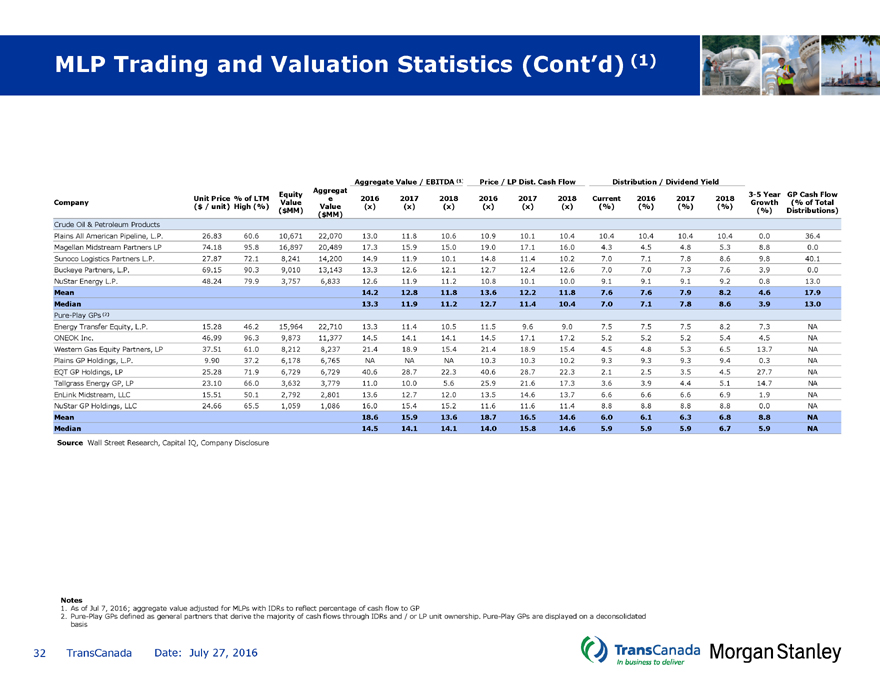
MLP Trading and Valuation Statistics (Cont’d) (1)
Aggregate Value / EBITDA (1)Price / LP Dist. Cash FlowDistribution / Dividend Yield
Aggregat
Equity3-5 YearGP Cash Flow
Unit Price % of LTM e201620172018201620172018Current201620172018
Company ValueGrowth (% of Total
($ / unit) High (%) Value(x)(x)(x)(x)(x)(x)(%)(%)(%)(%)
($MM)(%)Distributions)
($MM)
Crude Oil & Petroleum Products
Plains All American Pipeline, L.P. 26.83 60.610,67122,07013.011.810.610.910.110.410.410.410.410.40.036.4
Magellan Midstream Partners LP 74.18 95.816,89720,48917.315.915.019.017.116.04.34.54.85.38.80.0
Sunoco Logistics Partners L.P. 27.87 72.18,24114,20014.911.910.114.811.410.27.07.17.88.69.840.1
Buckeye Partners, L.P. 69.15 90.39,01013,14313.312.612.112.712.412.67.07.07.37.63.90.0
NuStar Energy L.P. 48.24 79.93,7576,83312.611.911.210.810.110.09.19.19.19.20.813.0
Mean 14.212.811.813.612.211.87.67.67.98.24.617.9
Median 13.311.911.212.711.410.47.07.17.88.63.913.0
Pure-Play GPs (2)
Energy Transfer Equity, L.P. 15.28 46.215,96422,71013.311.410.511.59.69.07.57.57.58.27.3NA
ONEOK Inc. 46.99 96.39,87311,37714.514.114.114.517.117.25.25.25.25.44.5NA
Western Gas Equity Partners, LP 37.51 61.08,2128,23721.418.915.421.418.915.44.54.85.36.513.7NA
Plains GP Holdings, L.P. 9.90 37.26,1786,765NANANA10.310.310.29.39.39.39.40.3NA
EQT GP Holdings, LP 25.28 71.96,7296,72940.628.722.340.628.722.32.12.53.54.527.7NA
Tallgrass Energy GP, LP 23.10 66.03,6323,77911.010.05.625.921.617.33.63.94.45.114.7NA
EnLink Midstream, LLC 15.51 50.12,7922,80113.612.712.013.514.613.76.66.66.66.91.9NA
NuStar GP Holdings, LLC 24.66 65.51,0591,08616.015.415.211.611.611.48.88.88.88.80.0NA
Mean 18.615.913.618.716.514.66.06.16.36.88.8NA
Median 14.514.114.114.015.814.65.95.95.96.75.9NA
Source Wall Street Research, Capital IQ, Company Disclosure
Notes
1. As of Jul 7, 2016; aggregate value adjusted for MLPs with IDRs to reflect percentage of cash flow to GP
2. Pure-Play GPs defined as general partners that derive the majority of cash flows through IDRs and / or LP unit ownership. Pure-Play GPs are displayed on a deconsolidated basis
32 TransCanada Date: July 27, 2016
|
|
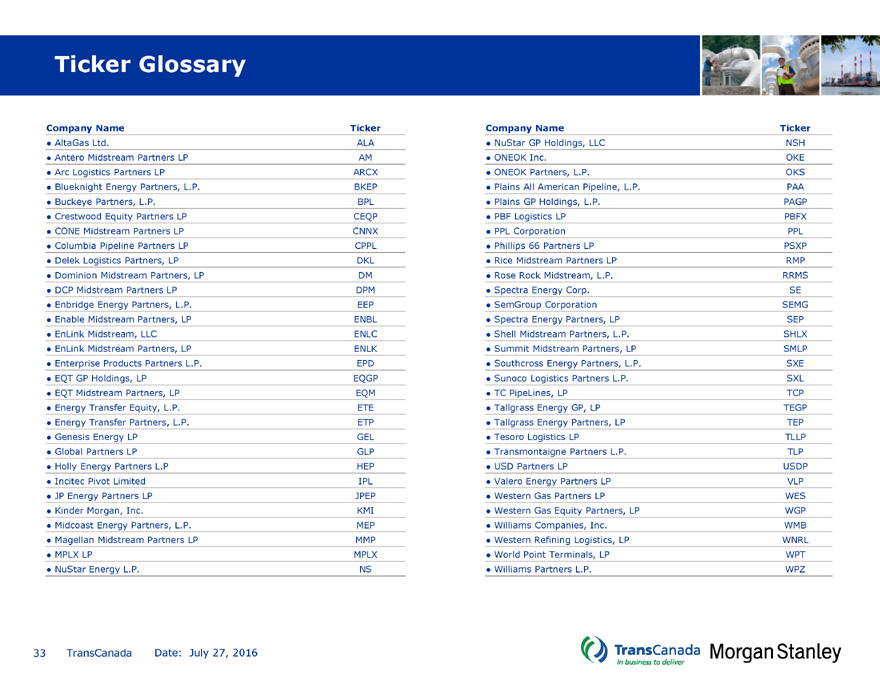
Ticker Glossary
Company Name
Ticker
Company Name
Ticker
• AltaGas Ltd.
ALA
• NuStar GP Holdings, LLC
NSH
• Antero Midstream Partners LP
AM
• ONEOK Inc.
OKE
• Arc Logistics Partners LP
ARCX
• ONEOK Partners, L.P.
OKS
• Blueknight Energy Partners, L.P.
BKEP
• Plains All American Pipeline, L.P.
PAA
• Buckeye Partners, L.P.
BPL
• Plains GP Holdings, L.P.
PAGP
• Crestwood Equity Partners LP
CEQP
• PBF Logistics LP
PBFX
• CONE Midstream Partners LP
CNNX
• PPL Corporation
PPL
• Columbia Pipeline Partners LP
CPPL
• Phillips 66 Partners LP
PSXP
• Delek Logistics Partners, LP
DKL
• Rice Midstream Partners LP
RMP
• Dominion Midstream Partners, LP
DM
• Rose Rock Midstream, L.P.
RRMS
• DCP Midstream Partners LP
DPM
• Spectra Energy Corp.
SE
• Enbridge Energy Partners, L.P.
EEP
• SemGroup Corporation
SEMG
• Enable Midstream Partners, LP
ENBL
• Spectra Energy Partners, LP
SEP
• EnLink Midstream, LLC
ENLC
• Shell Midstream Partners, L.P.
SHLX
• EnLink Midstream Partners, LP
ENLK
• Summit Midstream Partners, LP
SMLP
• Enterprise Products Partners L.P.
EPD
• Southcross Energy Partners, L.P.
SXE
• EQT GP Holdings, LP
EQGP
• Sunoco Logistics Partners L.P.
SXL
• EQT Midstream Partners, LP
EQM
• TC PipeLines, LP
TCP
• Energy Transfer Equity, L.P.
ETE
• Tallgrass Energy GP, LP
TEGP
• Energy Transfer Partners, L.P.
ETP
• Tallgrass Energy Partners, LP
TEP
• Genesis Energy LP
GEL
• Tesoro Logistics LP
TLLP
• Global Partners LP
GLP
• Transmontaigne Partners L.P.
TLP
• Holly Energy Partners L.P
HEP
• USD Partners LP
USDP
• Incitec Pivot Limited
IPL
• Valero Energy Partners LP
VLP
• JP Energy Partners LP
JPEP
• Western Gas Partners LP
WES
• Kinder Morgan, Inc.
KMI
• Western Gas Equity Partners, LP
WGP
• Midcoast Energy Partners, L.P.
MEP
• Williams Companies, Inc.
WMB
• Magellan Midstream Partners LP
MMP
• Western Refining Logistics, LP
WNRL
• MPLX LP
MPLX
• World Point Terminals, LP
WPT
• NuStar Energy L.P.
NS
• Williams Partners L.P.
WPZ
33 TransCanada Date: July 27, 2016