|
|
Exhibit (c)(6)
Strictly Confidential
Presentation to the Conflicts Committee of the Board of Directors of CPP
GP LLC
November 1, 2016 / Confidential
Jefferies LLC
Member SIPC
Disclaimer
Strictly Confidential
The following pages contain materials provided to the Conflicts Committee of the Board of Directors (the “Committee”) of
CPP GP LLC, the general partner of Columbia Pipeline Partners, LP (“CPPL”), by Jefferies LLC (“Jefferies”) in
connection with a transaction involving CPPL and Columbia Pipeline Group (“CPGX”).
These materials were prepared on a confidential basis in connection with an oral presentation to the Committee and not with a view toward complying with the disclosure standards under state or federal securities laws. These materials are for use of the Committee and may not be used for any other purpose or disclosed to any party without Jefferies’ prior written consent.
The information contained in this presentation is based solely on publicly available information or information furnished to Jefferies by CPGX management. Jefferies has relied, without independent investigation or verification, on the accuracy, completeness and fair presentation of all such information and the conclusions contained herein are conditioned upon such information (whether written or oral) being accurate, complete and fairly presented in all respects. These materials are necessarily based on economic, market and other conditions as they exist on, and information made available as of, the date hereof. None of Jefferies, its affiliates or its or their respective employees, directors, officers, contractors, advisors, members, successors or agents makes any representation or warranty in respect of the accuracy, completeness or fair presentation of any information or any conclusion contained herein.
Neither Jefferies nor any of its affiliates is an advisor as to legal, tax, accounting or regulatory matters in any jurisdiction. These materials are not and should not be construed as a fairness opinion.
Jefferies consents to the use of this presentation by CPPL for purposes of public disclosure in the Schedule 13E-3.
Jefferies LLC / November 2016
i
Jefferies
|
|
Table of Contents
Strictly Confidential
Transaction Overview 1
Market Update 5
Valuation Analysis 11
Appendix
Weighted Average Cost of Capital Analyses 25
Jefferies LLC / November 2016 ii
|
|
Strictly Confidential
Transaction Overview
Jefferies LLC / November 2016 1
|
|
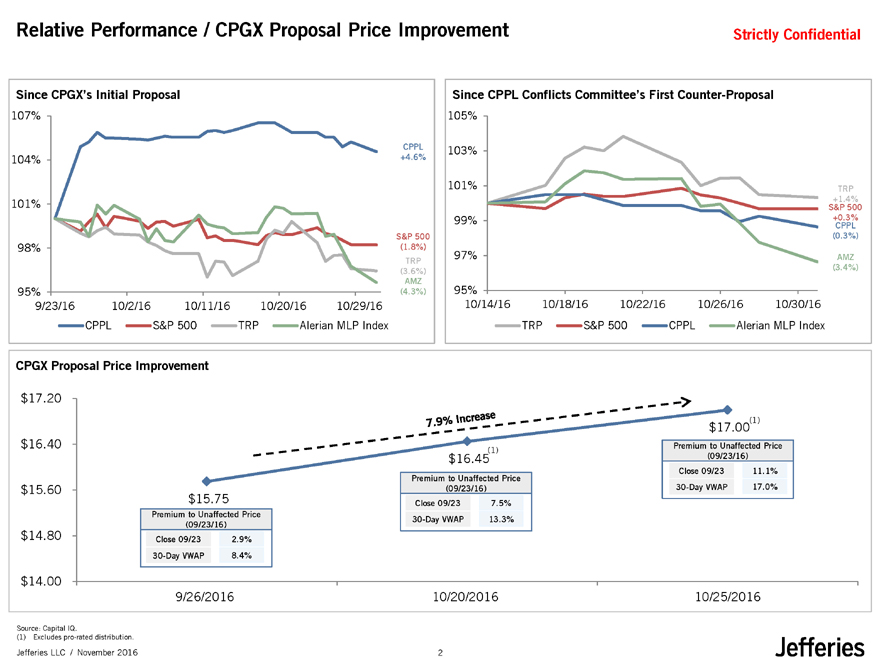
Relative Performance / CPGX Proposal Price Improvement
Strictly Confidential
Since CPGX’s Initial Proposal
107%
CPPL
104% +4.6%
101%
S&P 500
98% (1.8%)
TRP
(3.6%)
AMZ
95% (4.3%)
9/23/16 10/2/16 10/11/1610/20/1610/29/16
CPPL S&P 500TRPAlerian MLP Index
Since CPPL Conflicts Committee’s First Counter-Proposal
105%
103%
101% TRP
+1.4%
S&P 500
99% +0.3% CPPL
(0.3%)
97% AMZ
(3.4%)
95%
10/14/16 10/18/16 10/22/1610/26/1610/30/16
TRP S&P 500CPPLAlerian MLP Index
Source: Capital IQ.
(1) Excludes pro-rated distribution.
Jefferies LLC / November 2016 2
|
|
CPGX Purchase Price Analysis
($Millions, except per unit values)
Strictly Confidential
Transaction Overview
CPGX’s Purchase Price
Purchase Price Per CPPL Unit $17.00
CPPL Common Units Outstanding 53.8
Implied Common Unit Equity Purchase Price $915.3
Purchase Price
Purchase Price Analysis Metric Price$17.00
Premium / (Discount) to CPPL: Unaffected Price (as of 09/23/16) $15.3011.1%
10-Day VWAP (as of 09/23/16) 14.9213.9%
20-Day VWAP (as of 09/23/16) 14.6715.9%
30-Day VWAP (as of 09/23/16) 14.5217.0%
52-Week High 19.49(12.8%)
52-Week Low 11.7744.4%
Current Price (as of 10/31/16) 16.006.3%
Median Wall Street Consensus Price Target(1) 17.000.0%
IPO Price (as of 02/06/15) 23.00(26.1%)
Purchase Price $17.00
CPPL Fully Diluted Units Outstanding (MM) 100.7
Implied CPPL Transaction Equity Value $1,711.1
Plus: Implied GP Value(2) $8.9
Plus: CPPL Revolver(3) 53.8
Plus: OpCo Debt Attributable to CPPL(4) 179.1
Plus: Preferred(3) -
Plus: Non-Controlling Interest(3) -
Less: Cash & Cash Equivalents(4) 1.6
Implied CPPL Enterprise Value $1,951.4
Implied
Transaction
CPPL Statistics Statistic(3)Multiple
Implied Transaction Total Enterprise Value / 2017E EBITDA Attributable to CPPL $120.216.2x
Implied Transaction Total Enterprise Value / 2018E EBITDA Attributable to CPPL 166.811.7x
Source: Public filings, Capital IQ and Wall Street research. (1) See page 10.
(2) Implied value of GP interest based on 2016E GP distributions capitalized at current LP yield. (3) Per Q3 2016E Financial Summary provided by CPGX Management.
(4) CPPL’s pro rata share of OpCo’s consolidated net debt, per Q3 2016E Financial Summary provided by CPGX Management.
Jefferies LLC / November 2016 3
|
|
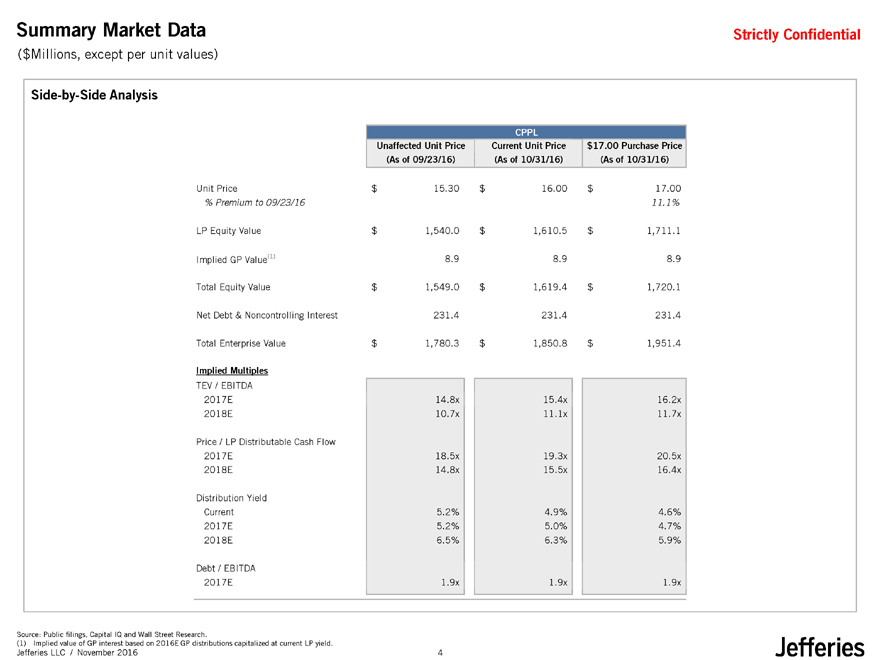
Summary Market Data
($Millions, except per unit values)
Strictly Confidential
Side-by-Side Analysis
CPPL
Unaffected Unit Price Current Unit Price$17.00 Purchase Price
(As of 09/23/16)(As of 10/31/16)(As of 10/31/16)
Unit Price $15.30$16.00$17.00
% Premium to 09/23/16 11.1%
LP Equity Value $1,540.0$1,610.5$1,711.1
Implied GP Value(1) 8.98.98.9
Total Equity Value $1,549.0$1,619.4$1,720.1
Net Debt & Noncontrolling Interest 231.4231.4231.4
Total Enterprise Value $1,780.3$1,850.8$1,951.4
Implied Multiples
TEV / EBITDA
2017E 14.8x15.4x16.2x
2018E 10.7x11.1x11.7x
Price / LP Distributable Cash Flow
2017E 18.5x19.3x20.5x
2018E 14.8x15.5x16.4x
Distribution Yield
Current 5.2%4.9%4.6%
2017E 5.2%5.0%4.7%
2018E 6.5%6.3%5.9%
Debt / EBITDA
2017E 1.9x1.9x1.9x
Source: Public filings, Capital IQ and Wall Street Research.
(1) Implied value of GP interest based on 2016E GP distributions capitalized at current LP yield.
Jefferies LLC / November 2016 4
|
|
Strictly Confidential
Market Update
Jefferies LLC / November 2016 5
|
|
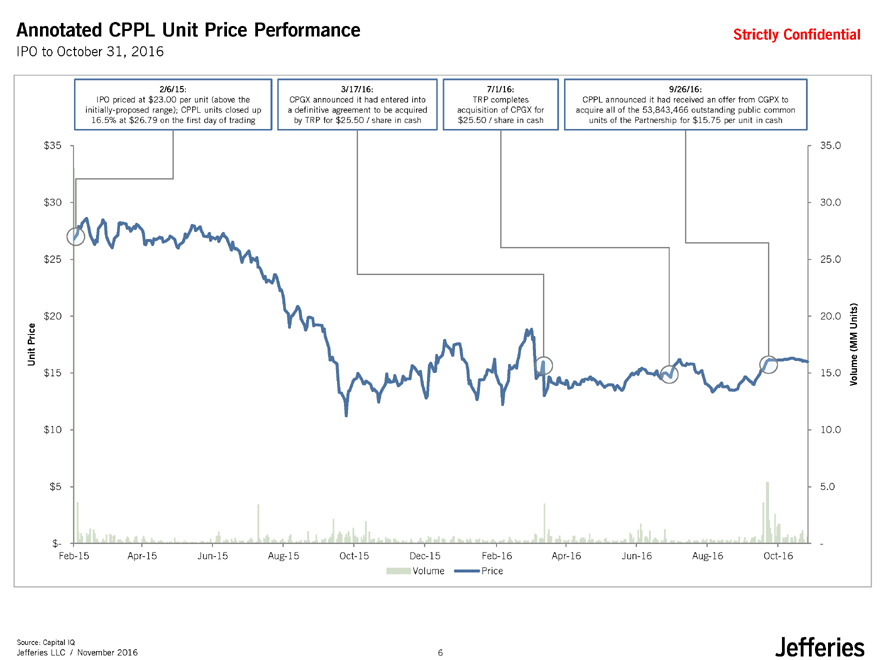
Annotated CPPL Unit Price Performance
IPO to October 31, 2016
Strictly Confidential
2/6/15:3/17/16:7/1/16:9/26/16:
IPO priced at $23.00 per unit (above theCPGX announced it had entered intoTRP completesCPPL announced it had received an offer from CGPX to
initially-proposed range); CPPL units closed up a definitive agreement to be acquiredacquisition of CPGX foracquire all of the 53,843,466 outstanding public common
16.5% at $26.79 on the first day of tradingby TRP for $25.50 / share in cash$25.50 / share in cashunits of the Partnership for $15.75 per unit in cash
$35 35.0
$30 30.0
$25 25.0
$20 20.0Units)
Price (MM
Unit
$15 15.0Volume
$10 10.0
$5 5.0
$- -
Feb-15 Apr-15Jun-15Aug-15Oct-15Dec-15Feb-16Apr-16Jun-16Aug-16Oct-16
VolumePrice
Source: Capital IQ
Jefferies LLC / November 2016 6
|
|
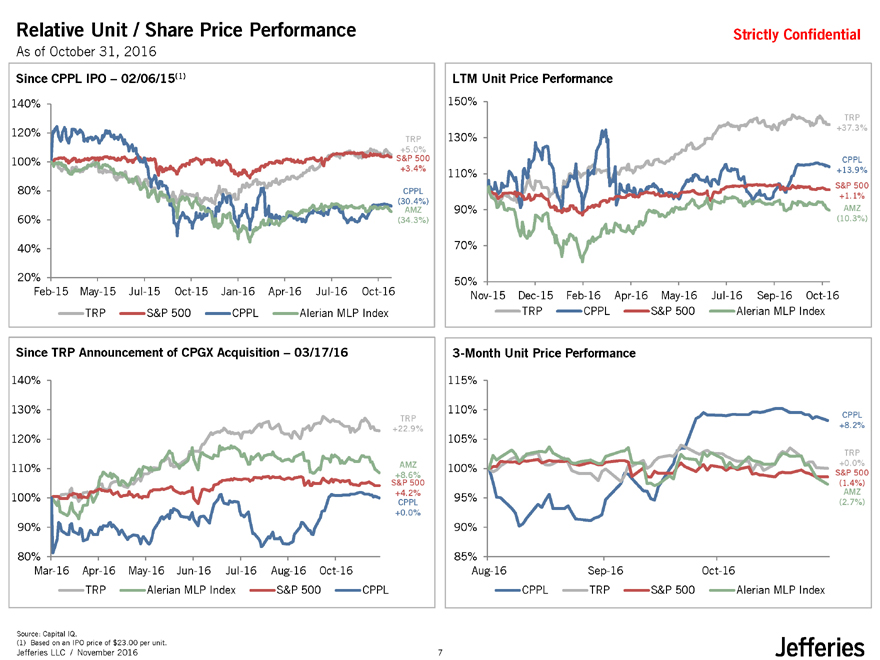
Relative Unit / Share Price Performance
As of October 31, 2016
Strictly Confidential
Since CPPL IPO – 02/06/15(1)
140%
120% TRP
+5.0%
100% S&P 500
+3.4%
80% CPPL
(30.4%)
AMZ
60% (34.3%)
40%
20%
Feb-15 May-15 Jul-15 Oct-15 Jan-16Apr-16 Jul-16 Oct-16
TRP S&P 500 CPPLAlerian MLP Index
LTM Unit Price Performance
150%
TRP
+37.3%
130%
CPPL
110% +13.9%
S&P 500
+1.1%
90% AMZ
(10.3%)
70%
50%
Nov-15 Dec-15 Feb-16 Apr-16 May-16Jul-16 Sep-16 Oct-16
TRP CPPL S&P 500Alerian MLP Index
Since TRP Announcement of CPGX Acquisition – 03/17/16
140%
130%
TRP
+22.9%
120%
110% AMZ
+8.6%
S&P 500
100% +4.2%
CPPL
+0.0%
90%
80%
Mar-16 Apr-16 May-16 Jun-16 Jul-16 Aug-16 Oct-16
TRP Alerian MLP Index S&P 500CPPL
3-Month Unit Price Performance
115%
110% CPPL
+8.2%
105%
TRP
+0.0%
100% S&P 500
(1.4%)
AMZ
95% (2.7%)
90%
85%
Aug-16 Sep-16 Oct-16
CPPL TRP S&P 500Alerian MLP Index
Source: Capital IQ.
(1) Based on an IPO price of $23.00 per unit.
Jefferies LLC / November 2016 7
|
|
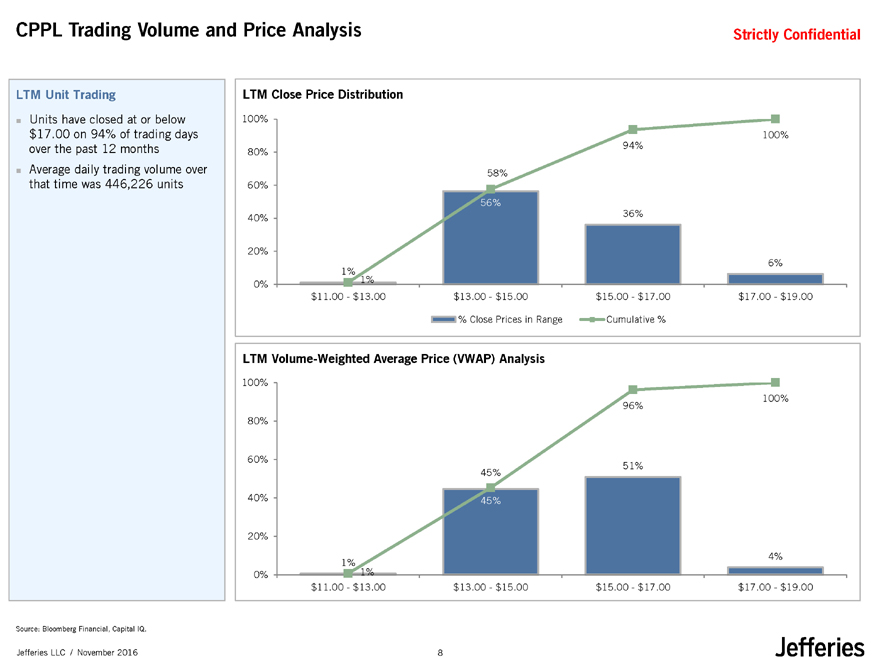
CPPL Trading Volume and Price Analysis
Strictly Confidential
LTM Unit Trading
Units have closed at or below $17.00 on 94% of trading days over the past 12 months Average daily trading volume over that time was 446,226 units
LTM Close Price Distribution
100%
100%
80% 94%
58%
60%
56%
40% 36%
20%
6%
1% 1%
0%
$11.00—$13.00 $13.00—$15.00 $15.00—$17.00$17.00—$19.00
% Close Prices in Range Cumulative %
LTM Volume-Weighted Average Price (VWAP) Analysis
100%
100%
96%
80%
60%
45%51%
40% 45%
20%
1% 4%
0% 1%
$11.00—$13.00 $13.00—$15.00$15.00—$17.00$17.00—$19.00
Source: Bloomberg Financial, Capital IQ.
Jefferies LLC / November 2016 8
|
|
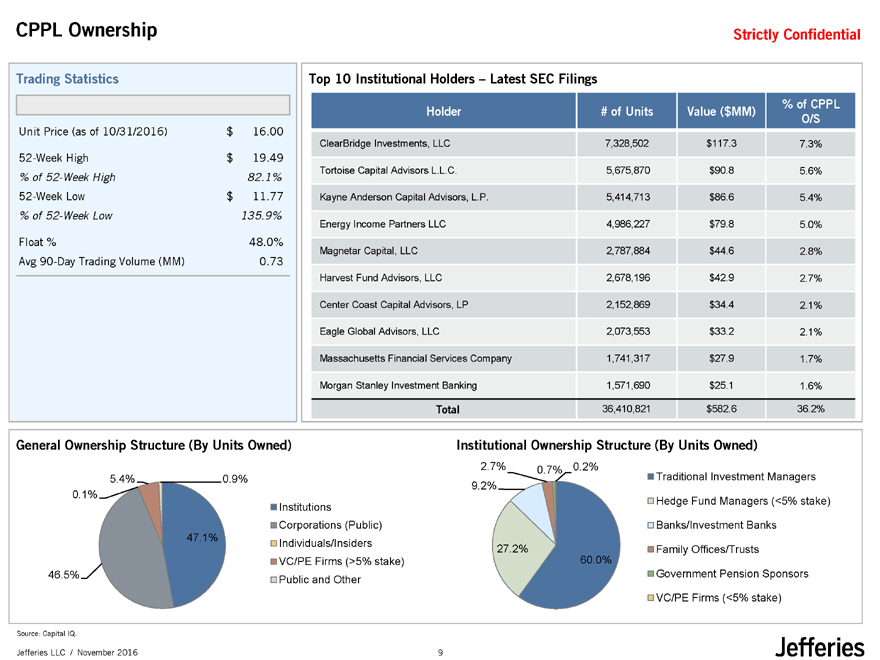
CPPL Ownership
Strictly Confidential
Trading Statistics
Unit Price (as of 10/31/2016) $16.00
52-Week High $19.49
% of 52-Week High 82.1%
52-Week Low $11.77
% of 52-Week Low 135.9%
Float % 48.0%
Avg 90-Day Trading Volume (MM) 0.73
Top 10 Institutional Holders – Latest SEC Filings
Holder # of Units Value ($MM)% of CPPL
O/S
ClearBridge Investments, LLC 7,328,502 $117.37.3%
Tortoise Capital Advisors L.L.C. 5,675,870 $90.85.6%
Kayne Anderson Capital Advisors, L.P. 5,414,713 $86.65.4%
Energy Income Partners LLC 4,986,227 $79.85.0%
Magnetar Capital, LLC 2,787,884 $44.62.8%
Harvest Fund Advisors, LLC 2,678,196 $42.92.7%
Center Coast Capital Advisors, LP 2,152,869 $34.42.1%
Eagle Global Advisors, LLC 2,073,553 $33.22.1%
Massachusetts Financial Services Company 1,741,317 $27.91.7%
Morgan Stanley Investment Banking 1,571,690 $25.11.6%
Total 36,410,821 $582.636.2%
General Ownership Structure (By Units Owned)
5.4% 0.9%
0.1%
Institutions
Corporations (Public)
47.1% Individuals/Insiders
VC/PE Firms (>5% stake)
46.5% Public and Other
Institutional Ownership Structure (By Units Owned)
2.7% 0.7% 0.2%
Traditional Investment Managers
9.2%
Hedge Fund Managers (<5% stake)
Banks/Investment Banks
27.2% Family Offices/Trusts
60.0%
Government Pension Sponsors
VC/PE Firms (<5% stake)
Source: Capital IQ.
Jefferies LLC / November 2016 9
|
|
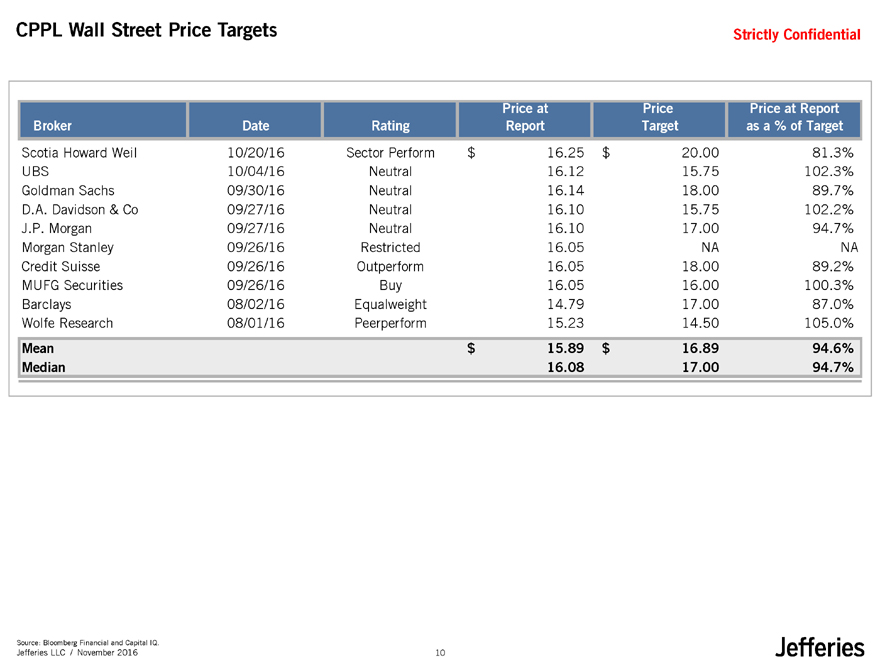
CPPL Wall Street Price Targets
Strictly Confidential
Price atPricePrice at Report
Broker Date RatingReportTargetas a % of Target
Scotia Howard Weil 10/20/16 Sector Perform$16.25$20.0081.3%
UBS 10/04/16 Neutral16.1215.75102.3%
Goldman Sachs 09/30/16 Neutral16.1418.0089.7%
D.A. Davidson & Co 09/27/16 Neutral16.1015.75102.2%
J.P. Morgan 09/27/16 Neutral16.1017.0094.7%
Morgan Stanley 09/26/16 Restricted16.05NANA
Credit Suisse 09/26/16 Outperform16.0518.0089.2%
MUFG Securities 09/26/16 Buy16.0516.00100.3%
Barclays 08/02/16 Equalweight14.7917.0087.0%
Wolfe Research 08/01/16 Peerperform15.2314.50105.0%
Mean $15.89$16.8994.6%
Median 16.0817.0094.7%
Source: Bloomberg Financial and Capital IQ.
Jefferies LLC / November 2016 10
|
|
Strictly Confidential
Valuation Analysis
Jefferies LLC / November 2016 11
|
|
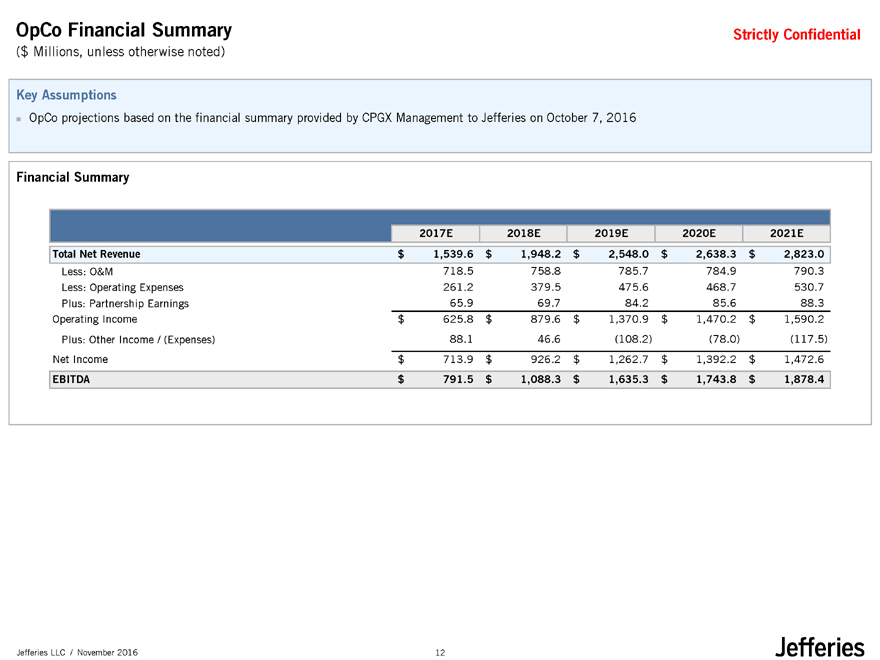
OpCo Financial Summary
($ Millions, unless otherwise noted)
Strictly Confidential
Key Assumptions
OpCo projections based on the financial summary provided by CPGX Management to Jefferies on October 7, 2016
Financial Summary
2017E 2018E2019E2020E2021E
Total Net Revenue $ 1,539.6 $1,948.2$2,548.0$2,638.3$2,823.0
Less: O&M 718.5 758.8785.7784.9790.3
Less: Operating Expenses 261.2 379.5475.6468.7530.7
Plus: Partnership Earnings 65.9 69.784.285.688.3
Operating Income $ 625.8 $879.6$1,370.9$1,470.2$1,590.2
Plus: Other Income / (Expenses) 88.1 46.6(108.2)(78.0)(117.5)
Net Income $ 713.9 $926.2$1,262.7$1,392.2$1,472.6
EBITDA $ 791.5 $1,088.3$1,635.3$1,743.8$1,878.4
Jefferies LLC / November 2016 12
|
|
CPPL Financial Summary
($ Millions, unless otherwise noted)
Strictly Confidential
Key Assumptions
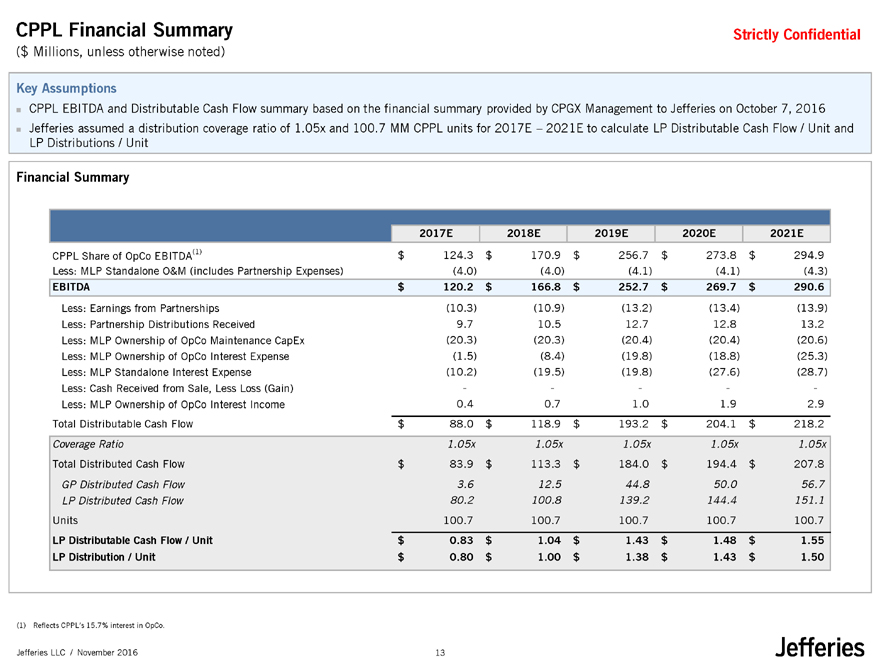
CPPL EBITDA and Distributable Cash Flow summary based on the financial summary provided by CPGX Management to Jefferies on October 7, 2016 Jefferies assumed a distribution coverage ratio of 1.05x and 100.7 MM CPPL units for 2017E – 2021E to calculate LP Distributable Cash Flow / Unit and LP Distributions / Unit
Financial Summary
2017E 2018E2019E2020E2021E
CPPL Share of OpCo EBITDA(1) $ 124.3 $170.9$256.7$273.8$294.9
Less: MLP Standalone O&M (includes Partnership Expenses) (4.0) (4.0)(4.1)(4.1)(4.3)
EBITDA $ 120.2 $166.8$252.7$269.7$290.6
Less: Earnings from Partnerships (10.3) (10.9)(13.2)(13.4)(13.9)
Less: Partnership Distributions Received 9.7 10.512.712.813.2
Less: MLP Ownership of OpCo Maintenance CapEx (20.3) (20.3)(20.4)(20.4)(20.6)
Less: MLP Ownership of OpCo Interest Expense (1.5) (8.4)(19.8)(18.8)(25.3)
Less: MLP Standalone Interest Expense (10.2) (19.5)(19.8)(27.6)(28.7)
Less: Cash Received from Sale, Less Loss (Gain) - ----
Less: MLP Ownership of OpCo Interest Income 0.4 0.71.01.92.9
Total Distributable Cash Flow $ 88.0 $118.9$193.2$204.1$218.2
Coverage Ratio 1.05x 1.05x1.05x1.05x1.05x
Total Distributed Cash Flow $ 83.9 $113.3$184.0$194.4$207.8
GP Distributed Cash Flow 3.6 12.544.850.056.7
LP Distributed Cash Flow 80.2 100.8139.2144.4151.1
Units 100.7 100.7100.7100.7100.7
LP Distributable Cash Flow / Unit $ 0.83 $1.04$1.43$1.48$1.55
LP Distribution / Unit $ 0.80 $1.00$1.38$1.43$1.50
(1) Reflects CPPL’s 15.7% interest in OpCo.
Jefferies LLC / November 2016 13
|
|
Summary of Valuation Methodologies
Strictly Confidential
Jefferies’ approach to analyzing valuation in connection with a transaction entails several standard and customary analyses,
including, but not limited to, the following:
— Selected Public Companies Analysis, a method of valuing an entity relative to publicly-traded partnerships or companies with
similar products or services, similar operating or financial characteristics or similar customers or markets
— Selected Precedent Transaction Analysis, a method of valuing an entity relative to precedent merger and acquisition (“M&A”)
transactions involving partnerships having similar products or services, similar operating or financial characteristics or similar
customers
— Discounted Cash Flow Analysis, a method of valuing an entity relative to the estimated present value of future cash flows
Jefferies did not attribute any particular weight to any analysis, methodology or factor considered, but rather made qualitative
judgments as to the significance and relevance of each analysis and factor; accordingly, Jefferies’ analyses must be considered as a
whole. Considering any portion of the analyses or the factors considered, without considering all analyses and factors, could create
a misleading or incomplete view of Jefferies’ analyses
Jefferies LLC / November 2016 14
|
|
Valuation Range – CPPL
($ in Millions)
Strictly Confidential
Methodology
Selected Public Companies Analysis
OpCo Valuation
TEV / 2017E EBITDA
TEV / 2018E EBITDA
CPPL Distribution Valuation
2017E Distribution Yield
2018E Distribution Yield
Selected Precedent Transactions Analysis
TEV / 2017E EBITDA
DCF Analysis
OpCo Valuation
Discounted Cash Flows—EBITDA
CPPL Distribution Valuation
Discounted Cash Flows—Distributions
Premiums Paid Analysis(2)
Affiliate MLP Mergers (Common Control)
Implied CPPL Unit Value
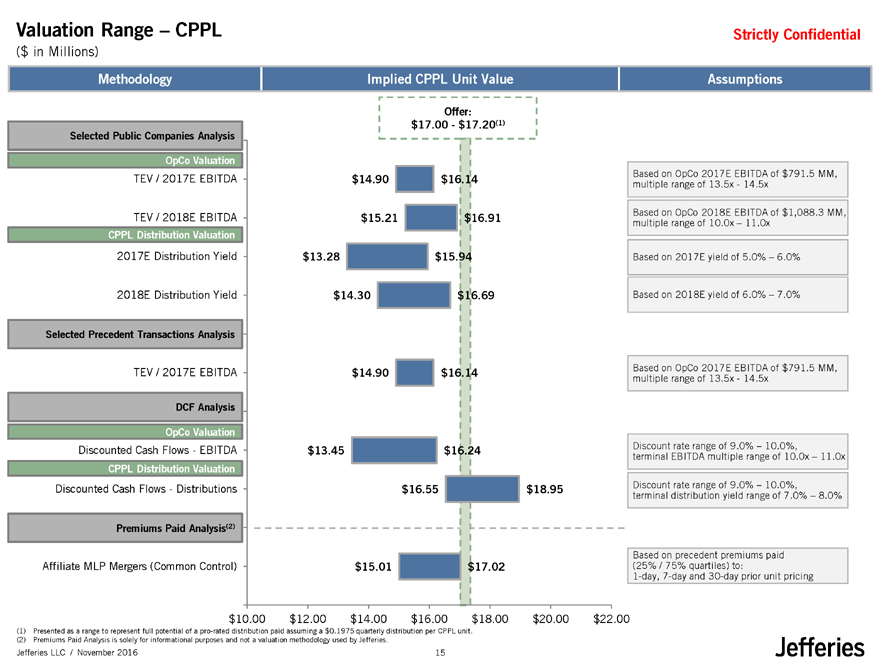
Offer:
$17.00—$17.20(1)
$14.90 $16.14
$15.21 $16.91
$13.28 $15.94
$14.30 $16.69
$14.90 $16.14
$13.45 $16.24
$16.55 $18.95
$15.01 $17.02
Assumptions
Based on OpCo 2017E EBITDA of $791.5 MM, multiple range of 13.5x—14.5x
Based on OpCo 2018E EBITDA of $1,088.3 MM, multiple range of 10.0x – 11.0x
Based on 2017E yield of 5.0% – 6.0%
Based on 2018E yield of 6.0% – 7.0%
Based on OpCo 2017E EBITDA of $791.5 MM, multiple range of 13.5x—14.5x
Discount rate range of 9.0% – 10.0%, terminal EBITDA multiple range of 10.0x – 11.0x
Discount rate range of 9.0% – 10.0%, terminal distribution yield range of 7.0% – 8.0%
Based on precedent premiums paid (25% / 75% quartiles) to: 1-day, 7-day and 30-day prior unit pricing
$10.00 $12.00 $14.00 $16.00 $18.00 $20.00 $22.00
(1) Presented as a range to represent full potential of a pro-rated distribution paid assuming a $0.1975 quarterly distribution per CPPL unit. (2) Premiums Paid Analysis is solely for informational purposes and not a valuation methodology used by Jefferies.
Jefferies LLC / November 2016 15
|
|
Selected Peer Comparables Analysis – Long-Haul Pipelines
($ Millions, unless otherwise noted)
Strictly Confidential
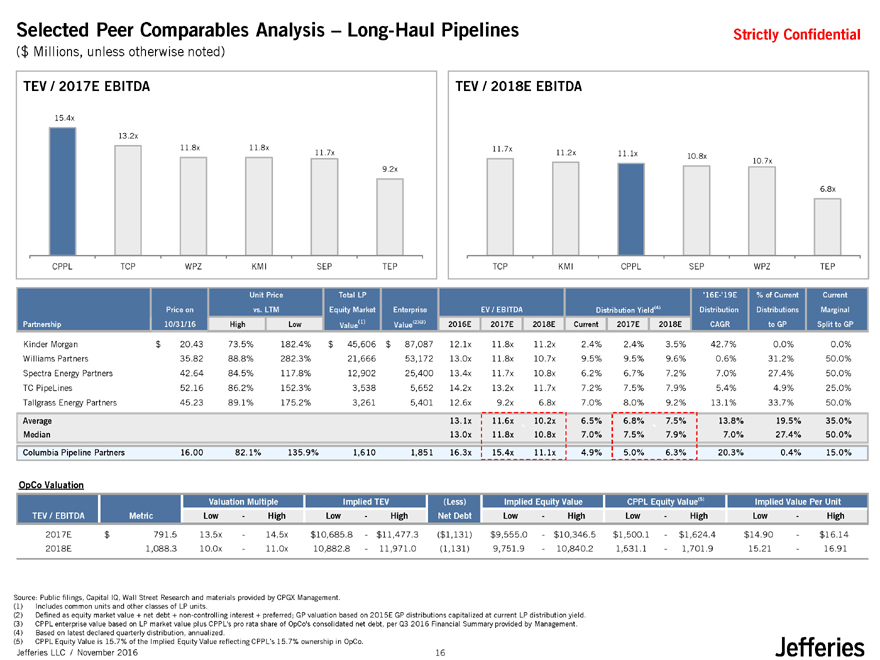
TEV / 2017E EBITDA
15.4x
13.2x
11.8x11.8x11.7x
9.2x
CPPL TCP WPZKMISEPTEP
TEV / 2018E EBITDA
11.7x 11.2x 11.1x10.8x
10.7x
6.8x
TCP KMI CPPLSEPWPZTEP
Unit PriceTotal LP’16E-‘19E% of CurrentCurrent
Price on vs. LTMEquity MarketEnterpriseEV / EBITDADistribution Yield(4)DistributionDistributionsMarginal
Partnership 10/31/16 HighLowValue(1)Value(2)(3)2016E2017E2018ECurrent2017E2018ECAGRto GPSplit to GP
Kinder Morgan $ 20.43 73.5%182.4%$ 45,606$87,08712.1x11.8x11.2x2.4%2.4%3.5%42.7%0.0%0.0%
Williams Partners 35.82 88.8%282.3%21,66653,17213.0x11.8x10.7x9.5%9.5%9.6%0.6%31.2%50.0%
Spectra Energy Partners 42.64 84.5%117.8%12,90225,40013.4x11.7x10.8x6.2%6.7%7.2%7.0%27.4%50.0%
TC PipeLines 52.16 86.2%152.3%3,5385,65214.2x13.2x11.7x7.2%7.5%7.9%5.4%4.9%25.0%
Tallgrass Energy Partners 45.23 89.1%175.2%3,2615,40112.6x9.2x6.8x7.0%8.0%9.2%13.1%33.7%50.0%
Average 13.1x11.6x10.2x6.5%6.8%7.5%13.8%19.5%35.0%
Median 13.0x11.8x`10.8x7.0%7.5%`7.9%7.0%27.4%50.0%
Columbia Pipeline Partners 16.00 82.1%135.9%1,6101,85116.3x15.4x11.1x4.9%5.0%6.3%20.3%0.4%15.0%
OpCo Valuation
Valuation MultipleImplied TEV(Less)Implied Equity ValueCPPL Equity Value(5)Implied Value Per Unit
TEV / EBITDA MetricLow- HighLow- HighNet DebtLow- HighLow-HighLow-High
2017E $791.513.5x- 14.5x$10,685.8- $11,477.3($1,131)$9,555.0- $10,346.5$1,500.1-$1,624.4$14.90-$16.14
2018E 1,088.310.0x- 11.0x10,882.8- 11,971.0(1,131)9,751.9- 10,840.21,531.1-1,701.915.21-16.91
Source: Public filings, Capital IQ, Wall Street Research and materials provided by CPGX Management. (1) Includes common units and other classes of LP units.
(2) Defined as equity market value + net debt + non-controlling interest + preferred; GP valuation based on 2015E GP distributions capitalized at current LP distribution yield. (3) CPPL enterprise value based on LP market value plus CPPL’s pro rata share of OpCo’s consolidated net debt, per Q3 2016 Financial Summary provided by Management. (4) Based on latest declared quarterly distribution, annualized.
(5) CPPL Equity Value is 15.7% of the Implied Equity Value reflecting CPPL’s 15.7% ownership in OpCo.
Jefferies LLC / November 2016 16
|
|
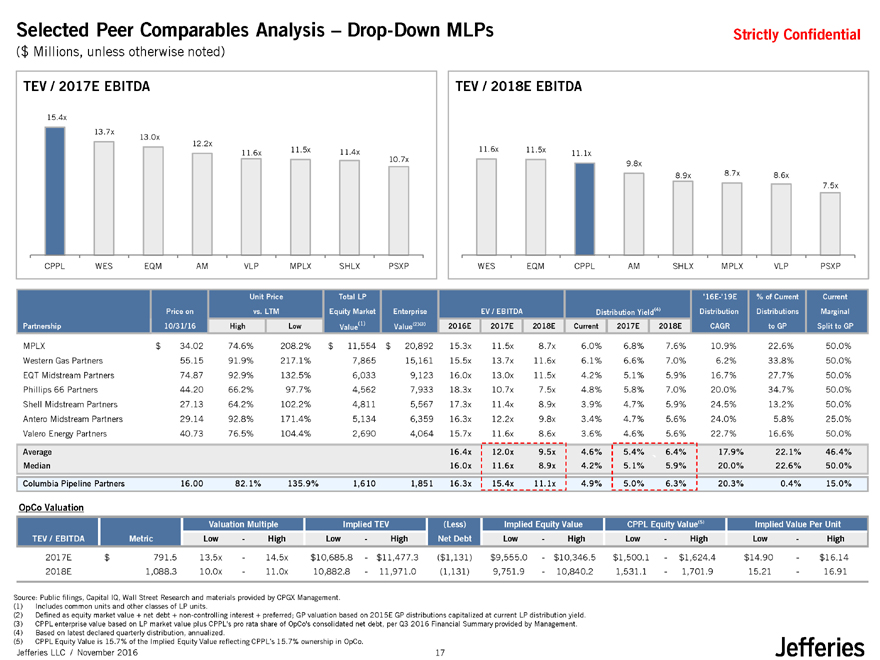
Selected Peer Comparables Analysis – Drop-Down MLPs
($ Millions, unless otherwise noted)
Strictly Confidential
TEV / 2017E EBITDA
15.4x
13.7x 13.0x
12.2x
11.6x11.5x11.4x
10.7x
CPPL WES EQMAMVLPMPLXSHLXPSXP
TEV / 2018E EBITDA
11.6x 11.5x 11.1x
9.8x
8.9x8.7x8.6x
7.5x
WES EQM CPPLAMSHLXMPLXVLPPSXP
Unit PriceTotal LP’16E-‘19E% of CurrentCurrent
Price on vs. LTMEquity MarketEnterpriseEV / EBITDADistribution Yield(4)DistributionDistributionsMarginal
Partnership 10/31/16 HighLowValue(1)Value(2)(3)2016E2017E2018ECurrent2017E2018ECAGRto GPSplit to GP
MPLX $ 34.02 74.6%208.2%$ 11,554$20,89215.3x11.5x8.7x6.0%6.8%7.6%10.9%22.6%50.0%
Western Gas Partners 55.15 91.9%217.1%7,86515,16115.5x13.7x11.6x6.1%6.6%7.0%6.2%33.8%50.0%
EQT Midstream Partners 74.87 92.9%132.5%6,0339,12316.0x13.0x11.5x4.2%5.1%5.9%16.7%27.7%50.0%
Phillips 66 Partners 44.20 66.2%97.7%4,5627,93318.3x10.7x7.5x4.8%5.8%7.0%20.0%34.7%50.0%
Shell Midstream Partners 27.13 64.2%102.2%4,8115,56717.3x11.4x8.9x3.9%4.7%5.9%24.5%13.2%50.0%
Antero Midstream Partners 29.14 92.8%171.4%5,1346,35916.3x12.2x9.8x3.4%4.7%5.6%24.0%5.8%25.0%
Valero Energy Partners 40.73 76.5%104.4%2,6904,06415.7x11.6x8.6x3.6%4.6%5.6%22.7%16.6%50.0%
Average 16.4x12.0x9.5x4.6%5.4%6.4%17.9%22.1%46.4%
Median 16.0x11.6x8.9x4.2%5.1%`5.9%20.0%22.6%50.0%
Columbia Pipeline Partners 16.00 82.1%135.9%1,6101,85116.3x15.4x11.1x4.9%5.0%6.3%20.3%0.4%15.0%
OpCo Valuation
Valuation MultipleImplied TEV(Less)Implied Equity ValueCPPL Equity Value(5)Implied Value Per Unit
TEV / EBITDA MetricLow- HighLow- HighNet DebtLow- HighLow-HighLow-High
2017E $791.513.5x- 14.5x$10,685.8- $11,477.3($1,131)$9,555.0- $10,346.5$1,500.1-$1,624.4$14.90-$16.14
2018E 1,088.310.0x- 11.0x10,882.8- 11,971.0(1,131)9,751.9- 10,840.21,531.1-1,701.915.21-16.91
Source: Public filings, Capital IQ, Wall Street Research and materials provided by CPGX Management.
(1) Includes common units and other classes of LP units.
(2) Defined as equity market value + net debt + non-controlling interest + preferred; GP valuation based on 2015E GP distributions capitalized at current LP distribution yield.
(3) CPPL enterprise value based on LP market value plus CPPL’s pro rata share of OpCo’s consolidated net debt, per Q3 2016 Financial Summary provided by Management.
(4) Based on latest declared quarterly distribution, annualized.
(5) CPPL Equity Value is 15.7% of the Implied Equity Value reflecting CPPL’s 15.7% ownership in OpCo.
Jefferies LLC / November 2016 17
|
|
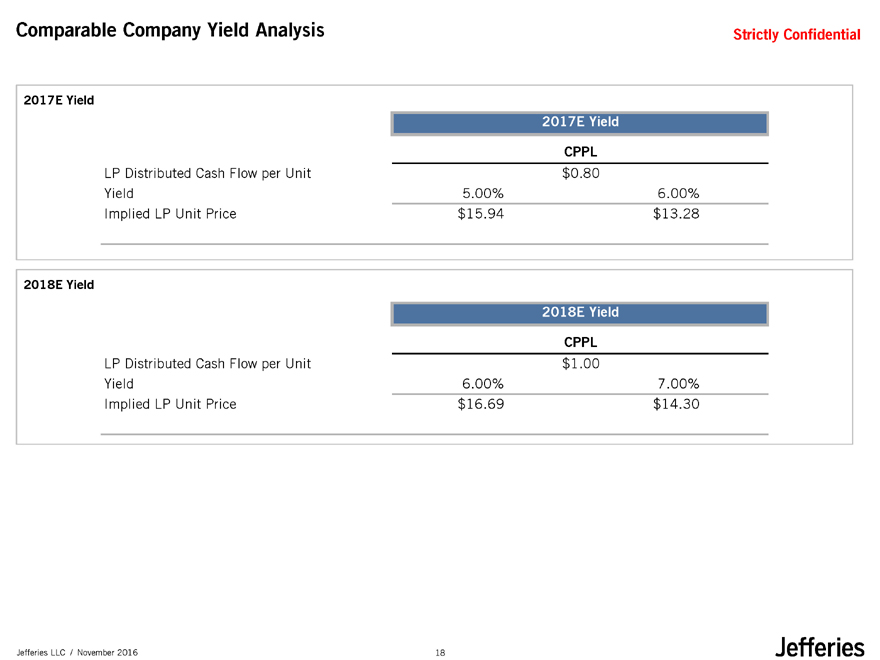
Comparable Company Yield Analysis
Strictly Confidential
2017E Yield
2017E Yield
CPPL
LP Distributed Cash Flow per Unit $0.80
Yield 5.00%6.00%
Implied LP Unit Price $15.94$13.28
2018E Yield
2018E Yield
CPPL
LP Distributed Cash Flow per Unit $1.00
Yield 6.00%7.00%
Implied LP Unit Price $16.69$14.30
Jefferies LLC / November 2016 18
|
|
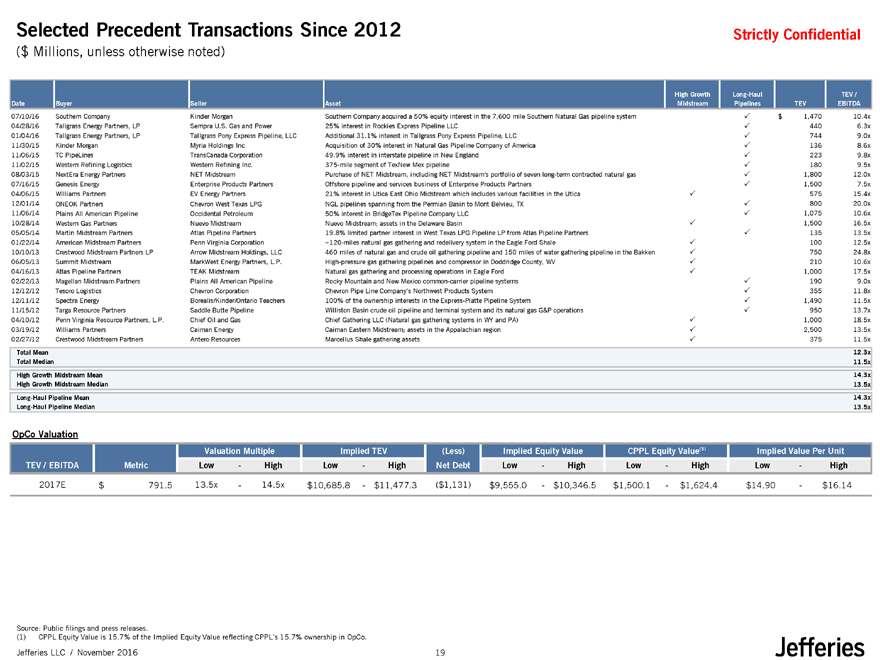
Selected Precedent Transactions Since 2012
($ Millions, unless otherwise noted)
Strictly Confidential
High GrowthLong-HaulTEV /
Date Buyer SellerAssetMidstreamPipelinesTEVEBITDA
07/10/16 Southern Company Kinder MorganSouthern Company acquired a 50% equity interest in the 7,600 mile Southern Natural Gas pipeline systemP$1,47010.4x
04/28/16 Tallgrass Energy Partners, LP Sempra U.S. Gas and Power25% interest in Rockies Express Pipeline LLCP4406.3x
01/04/16 Tallgrass Energy Partners, LP Tallgrass Pony Express Pipeline, LLCAdditional 31.1% interest in Tallgrass Pony Express Pipeline, LLCP7449.0x
11/30/15 Kinder Morgan Myria Holdings IncAcquisition of 30% interest in Natural Gas Pipeline Company of AmericaP1368.6x
11/06/15 TC PipeLines TransCanada Corporation49.9% interest in interstate pipeline in New EnglandP2239.8x
11/02/15 Western Refining Logistics Western Refining Inc.375-mile segment of TexNew Mex pipelineP1809.5x
08/03/15 NextEra Energy Partners NET MidstreamPurchase of NET Midstream, including NET Midstream’s portfolio of seven long-term contracted natural gasP1,80012.0x
07/16/15 Genesis Energy Enterprise Products PartnersOffshore pipeline and services business of Enterprise Products PartnersP1,5007.5x
04/06/15 Williams Partners EV Energy Partners21% interest in Utica East Ohio Midstream which includes various facilities in the UticaP57515.4x
12/01/14 ONEOK Partners Chevron West Texas LPGNGL pipelines spanning from the Permian Basin to Mont Belvieu, TXP80020.0x
11/06/14 Plains All American Pipeline Occidental Petroleum50% interest in BridgeTex Pipeline Company LLCP1,07510.6x
10/28/14 Western Gas Partners Nuevo MidstreamNuevo Midstream; assets in the Delaware BasinP1,50016.5x
05/05/14 Martin Midstream Partners Atlas Pipeline Partners19.8% limited partner interest in West Texas LPG Pipeline LP from Atlas Pipeline PartnersP13513.5x
01/22/14 American Midstream Partners Penn Virginia Corporation~120-miles natural gas gathering and redelivery system in the Eagle Ford ShaleP10012.5x
10/10/13 Crestwood Midstream Partners LP Arrow Midstream Holdings, LLC460 miles of natural gas and crude oil gathering pipeline and 150 miles of water gathering pipeline in the BakkenP75024.8x
06/05/13 Summit Midstream MarkWest Energy Partners, L.P.High-pressure gas gathering pipelines and compressor in Doddridge County, WVP21010.6x
04/16/13 Atlas Pipeline Partners TEAK MidstreamNatural gas gathering and processing operations in Eagle FordP1,00017.5x
02/22/13 Magellan Midstream Partners Plains All American PipelineRocky Mountain and New Mexico common-carrier pipeline systemsP1909.0x
12/12/12 Tesoro Logistics Chevron CorporationChevron Pipe Line Company’s Northwest Products SystemP35511.8x
12/11/12 Spectra Energy Borealis/Kinder/Ontario Teachers100% of the ownership interests in the Express-Platte Pipeline SystemP1,49011.5x
11/15/12 Targa Resource Partners Saddle Butte PipelineWilliston Basin crude oil pipeline and terminal system and its natural gas G&P operationsP95013.7x
04/10/12 Penn Virginia Resource Partners, L.P. Chief Oil and GasChief Gathering LLC (Natural gas gathering systems in WY and PA)P1,00018.5x
03/19/12 Williams Partners Caiman EnergyCaiman Eastern Midstream; assets in the Appalachian regionP2,50013.5x
02/27/12 Crestwood Midstream Partners Antero ResourcesMarcellus Shale gathering assetsP37511.5x
Total Mean 12.3x
Total Median 11.5x
High Growth Midstream Mean 14.3x
High Growth Midstream Median 13.5x
Long-Haul Pipeline Mean 14.3x
Long-Haul Pipeline Median 13.5x
OpCo Valuation
Valuation MultipleImplied TEV(Less)Implied Equity ValueCPPL Equity Value(5)Implied Value Per Unit
TEV / EBITDA MetricLow-HighLow- HighNet DebtLow- HighLow-HighLow-High
2017E $791.513.5x-14.5x$10,685.8- $11,477.3($1,131)$9,555.0- $10,346.5$1,500.1-$1,624.4$14.90-$16.14
Source: Public filings and press releases.
(1) CPPL Equity Value is 15.7% of the Implied Equity Value reflecting CPPL’s 15.7% ownership in OpCo.
Jefferies LLC / November 2016 19
|
|
Strictly Confidential
Jefferies LLC / November 2016
Implied Valuation Summary
DCF Sensitivity
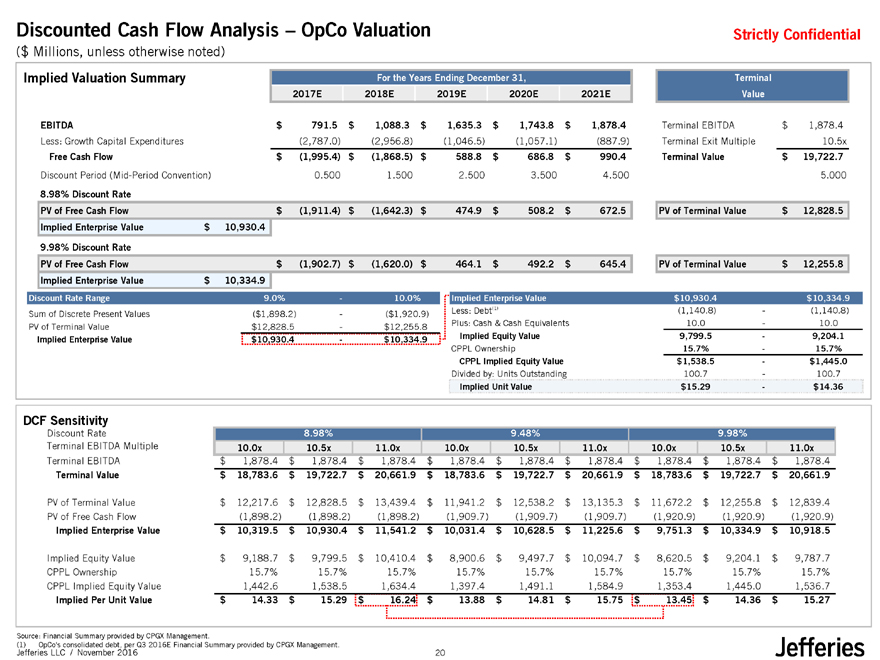
Discounted Cash Flow Analysis – OpCo Valuation
($ Millions, unless otherwise noted)
Source: Financial Summary provided by CPGX Management.
(1) OpCo’s consolidated debt, per Q3 2016E Financial Summary provided by CPGX Management.
For the Years Ending December 31, Terminal
2017E 2018E 2019E 2020E 2021E Value
EBITDA $ 791.5 $ 1,088.3 $ 1,635.3 $ 1,743.8 $ 1,878.4 Terminal EBITDA $ 1,878.4
Less: Growth Capital Expenditures (2,787.0) (2,956.8) (1,046.5) (1,057.1) (887.9) Terminal Exit Multiple 10.5x
Free Cash Flow $ (1,995.4) $ (1,868.5) $ 588.8 $ 686.8 $ 990.4 Terminal Value $ 19,722.7
Discount Period (Mid-Period Convention) 0.500 1.500 2.500 3.500 4.500 5.000
8.98% Discount Rate
PV of Free Cash Flow $ (1,911.4) $ (1,642.3) $ 474.9 $ 508.2 $ 672.5 PV of Terminal Value $ 12,828.5
Implied Enterprise Value $ 10,930.4
9.98% Discount Rate
PV of Free Cash Flow $ (1,902.7) $ (1,620.0) $ 464.1 $ 492.2 $ 645.4 PV of Terminal Value $ 12,255.8
Implied Enterprise Value $ 10,334.9
Discount Rate Range 9.0%—10.0%
Sum of Discrete Present Values ($1,898.2)—($1,920.9)
PV of Terminal Value $12,828.5—$12,255.8
Implied Enterprise Value $10,930.4—$10,334.9
Implied Enterprise Value $10,930.4 $10,334.9
Less: Debt(1) (1,140.8)—(1,140.8)
Plus: Cash & Cash Equivalents 10.0—10.0
Implied Equity Value 9,799.5—9,204.1
CPPL Ownership 15.7%—15.7%
CPPL Implied Equity Value $1,538.5—$1,445.0
Divided by: Units Outstanding 100.7—100.7
Implied Unit Value $15.29—$14.36
Discount Rate 8.98% 9.48% 9.98%
Terminal EBITDA Multiple 10.0x 10.5x 11.0x 10.0x 10.5x 11.0x 10.0x 10.5x 11.0x
Terminal EBITDA $ 1,878.4 $ 1,878.4 $ 1,878.4 $ 1,878.4 $ 1,878.4 $ 1,878.4 $ 1,878.4 $ 1,878.4 $ 1,878.4
Terminal Value $ 18,783.6 $ 19,722.7 $ 20,661.9 $ 18,783.6 $ 19,722.7 $ 20,661.9 $ 18,783.6 $ 19,722.7 $ 20,661.9
PV of Terminal Value $ 12,217.6 $ 12,828.5 $ 13,439.4 $ 11,941.2 $ 12,538.2 $ 13,135.3 $ 11,672.2 $ 12,255.8 $ 12,839.4
PV of Free Cash Flow (1,898.2) (1,898.2) (1,898.2) (1,909.7) (1,909.7) (1,909.7) (1,920.9) (1,920.9) (1,920.9)
Implied Enterprise Value $ 10,319.5 $ 10,930.4 $ 11,541.2 $ 10,031.4 $ 10,628.5 $ 11,225.6 $ 9,751.3 $ 10,334.9 $ 10,918.5
Implied Equity Value $ 9,188.7 $ 9,799.5 $ 10,410.4 $ 8,900.6 $ 9,497.7 $ 10,094.7 $ 8,620.5 $ 9,204.1 $ 9,787.7
CPPL Ownership 15.7% 15.7% 15.7% 15.7% 15.7% 15.7% 15.7% 15.7% 15.7%
CPPL Implied Equity Value 1 ,442.6 1 ,538.5 1 ,634.4 1 ,397.4 1 ,491.1 1 ,584.9 1 ,353.4 1 ,445.0 1 ,536.7
Implied Per Unit Value $ 1 4.33 $ 1 5.29 $ 1 6.24 $ 1 3.88 $ 1 4.81 $ 1 5.75 $ 1 3.45 $ 1 4.36 $ 1 5.27
20
|
|
Strictly Confidential
Jefferies LLC / November 2016
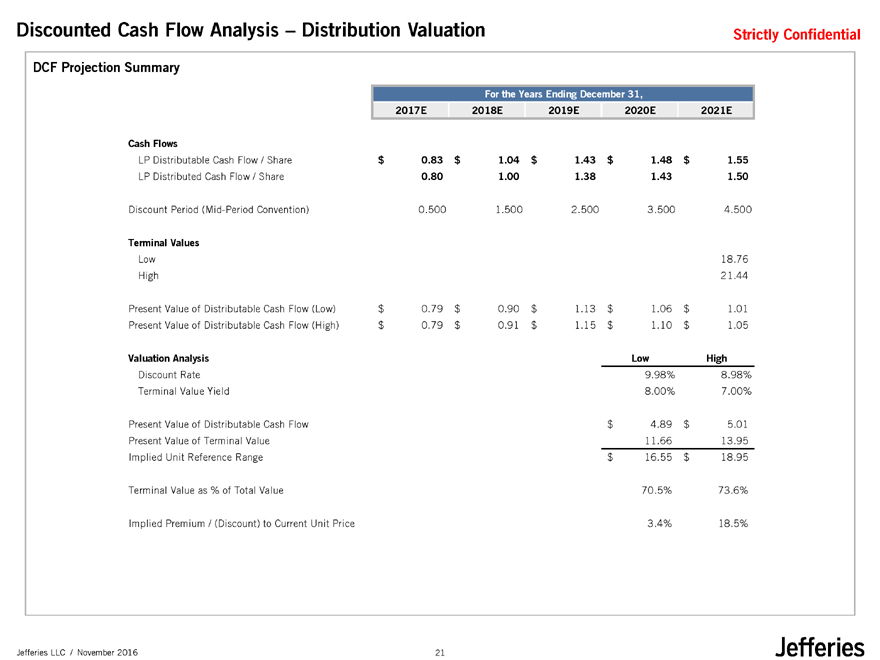
DCF Projection Summary
Discounted Cash Flow Analysis – Distribution Valuation
For the Years Ending December 31,
2017E 2018E 2019E 2020E 2021E
Cash Flows
LP Distributable Cash Flow / Share $ 0.83 $ 1.04 $ 1.43 $ 1.48 $ 1.55
LP Distributed Cash Flow / Share 0.80 1.00 1.38 1.43 1.50
Discount Period (Mid-Period Convention) 0.500 1.500 2.500 3.500 4.500
Terminal Values
Low 18.76
High 21.44
Present Value of Distributable Cash Flow (Low) $ 0.79 $ 0.90 $ 1.13 $ 1.06 $ 1.01
Present Value of Distributable Cash Flow (High) $ 0.79 $ 0.91 $ 1.15 $ 1.10 $ 1.05
Valuation Analysis Low High
Discount Rate 9.98% 8.98%
Terminal Value Yield 8.00% 7.00%
Present Value of Distributable Cash Flow $ 4.89 $ 5.01
Present Value of Terminal Value 11.66 13.95
Implied Unit Reference Range $ 16.55 $ 18.95
Terminal Value as % of Total Value 70.5% 73.6%
Implied Premium / (Discount) to Current Unit Price 3.4% 18.5%
21
|
|
Strictly Confidential
Jefferies LLC / November 2016
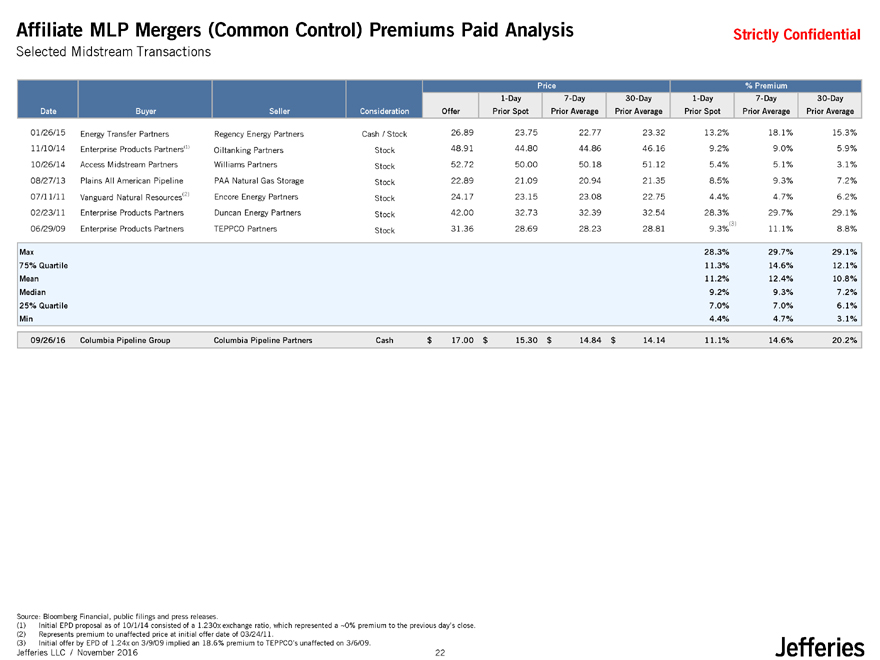
Affiliate MLP Mergers (Common Control) Premiums Paid Analysis
Selected Midstream Transactions
Source: Bloomberg Financial, public filings and press releases.
(1) Initial EPD proposal as of 10/1/14 consisted of a 1.230x exchange ratio, which represented a ~0% premium to the previous day’s close.
(2) Represents premium to unaffected price at initial offer date of 03/24/11.
(3) Initial offer by EPD of 1.24x on 3/9/09 implied an 18.6% premium to TEPPCO’s unaffected on 3/6/09.
(3)
Price % Premium
1-Day 7-Day 30-Day 1-Day 7-Day 30-Day
Date Buyer Seller Consideration Offer Prior Spot Prior Average Prior Average Prior Spot Prior Average Prior Average
01/26/15 Energy Transfer Partners Regency Energy Partners Cash / Stock 26.89 23.75 22.77 23.32 13.2% 18.1% 15.3%
11/10/14 Enterprise Products Partners(1) Oiltanking Partners Stock 48.91 44.80 44.86 46.16 9.2% 9.0% 5.9%
10/26/14 Access Midstream Partners Williams Partners Stock 52.72 50.00 50.18 51.12 5.4% 5.1% 3.1%
08/27/13 Plains All American Pipeline PAA Natural Gas Storage Stock 22.89 21.09 20.94 21.35 8.5% 9.3% 7.2%
07/11/11 Vanguard Natural Resources(2) Encore Energy Partners Stock 24.17 23.15 23.08 22.75 4.4% 4.7% 6.2%
02/23/11 Enterprise Products Partners Duncan Energy Partners Stock 42.00 32.73 32.39 32.54 28.3% 29.7% 29.1%
06/29/09 Enterprise Products Partners TEPPCO Partners Stock 31.36 28.69 28.23 28.81 9.3% 11.1% 8.8%
Max 28.3% 29.7% 29.1%
75% Quartile 11.3% 14.6% 12.1%
Mean 11.2% 12.4% 10.8%
Median 9.2% 9.3% 7.2%
25% Quartile 7.0% 7.0% 6.1%
Min 4.4% 4.7% 3.1%
09/26/16 Columbia Pipeline Group Columbia Pipeline Partners Cash $ 17.00 $ 15.30 $ 14.84 $ 14.14 11.1% 14.6% 20.2%
22
|
|
Strictly Confidential
Jefferies LLC / November 2016
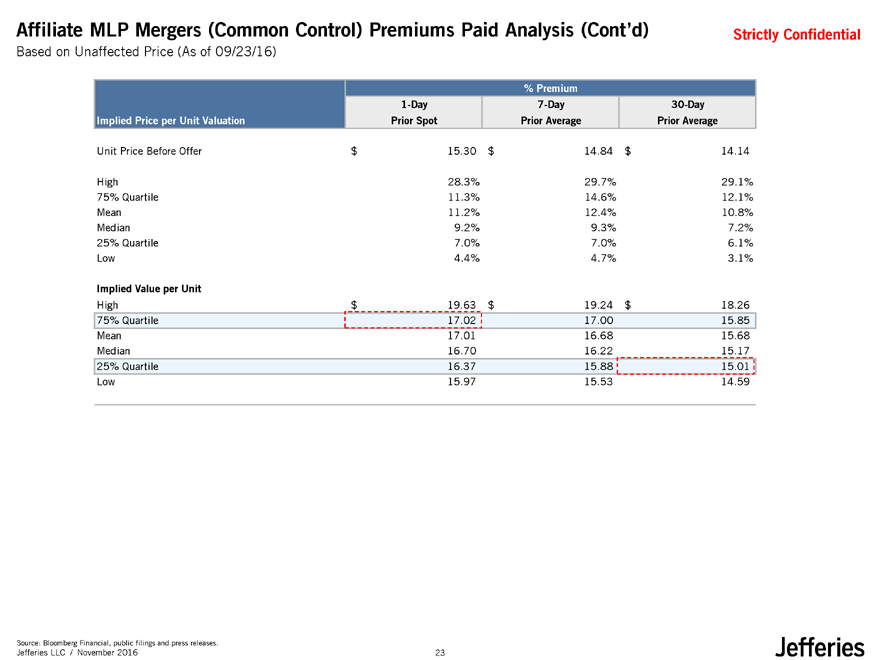
Affiliate MLP Mergers (Common Control) Premiums Paid Analysis (Cont’d)
Source: Bloomberg Financial, public filings and press releases.
Based on Unaffected Price (As of 09/23/16)
% Premium
1-Day 7-Day 30-Day
Implied Price per Unit Valuation Prior Spot Prior Average Prior Average
Unit Price Before Offer $ 15.30 $ 14.84 $ 14.14
High 28.3% 29.7% 29.1%
75% Quartile 11.3% 14.6% 12.1%
Mean 11.2% 12.4% 10.8%
Median 9.2% 9.3% 7.2%
25% Quartile 7.0% 7.0% 6.1%
Low 4.4% 4.7% 3.1%
Implied Value per Unit
High $ 19.63 $ 19.24 $ 18.26
75% Quartile 17.02 17.00 15.85
Mean 17.01 16.68 15.68
Median 16.70 16.22 15.17
25% Quartile 16.37 15.88 15.01
Low 15.97 15.53 14.59
23
|
|
Strictly Confidential
Jefferies LLC / November 2016
Appendix
24
|
|
Strictly Confidential
Jefferies LLC / November 2016
Weighted Average Cost of Capital Analyses
25
|
|
Strictly Confidential
Jefferies LLC / November 2016
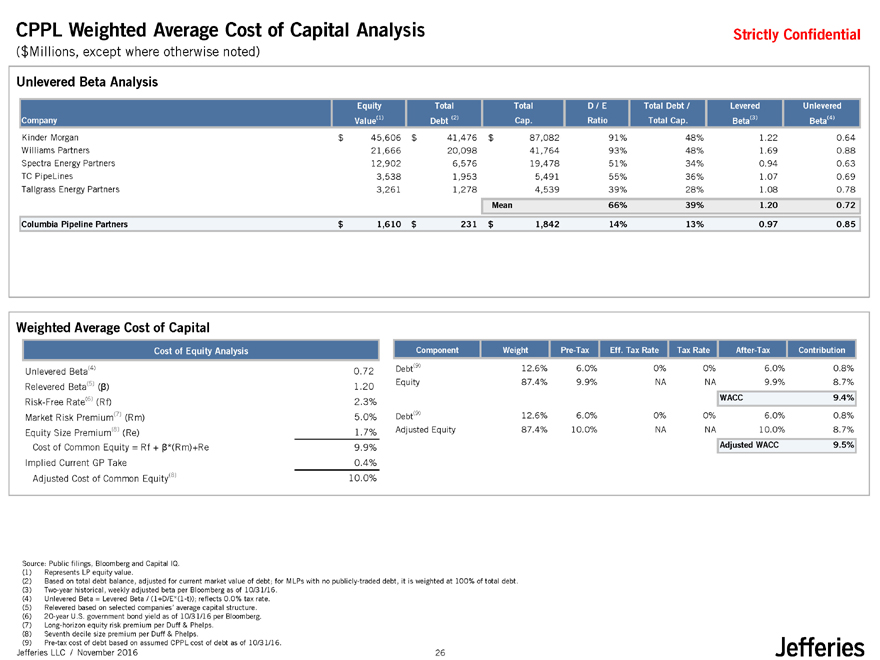
CPPL Weighted Average Cost of Capital Analysis
Source: Public filings, Bloomberg and Capital IQ.
(1) Represents LP equity value.
(2) Based on total debt balance, adjusted for current market value of debt; for MLPs with no publicly-traded debt, it is weighted at 100% of total debt.
(3) Two-year historical, weekly adjusted beta per Bloomberg as of 10/31/16.
(4) Unlevered Beta = Levered Beta / (1+D/E*(1-t)); reflects 0.0% tax rate.
(5) Relevered based on selected companies’ average capital structure.
(6) 20-year U.S. government bond yield as of 10/31/16 per Bloomberg.
(7) Long-horizon equity risk premium per Duff & Phelps.
(8) Seventh decile size premium per Duff & Phelps.
(9) Pre-tax cost of debt based on assumed CPPL cost of debt as of 10/31/16.
Unlevered Beta Analysis
Weighted Average Cost of Capital
($Millions, except where otherwise noted)
Equity Total Total D / E Total Debt / Levered Unlevered
Company Value(1) Debt (2) Cap. Ratio Total Cap. Beta(3) Beta(4)
Kinder Morgan $ 45,606 $ 41,476 $ 87,082 91% 48% 1.22 0.64
Williams Partners 21,666 20,098 41,764 93% 48% 1.69 0.88
Spectra Energy Partners 12,902 6,576 19,478 51% 34% 0.94 0.63
TC PipeLines 3,538 1,953 5,491 55% 36% 1.07 0.69
Tallgrass Energy Partners 3,261 1,278 4,539 39% 28% 1.08 0.78
Mean 66% 39% 1.20 0.72
Columbia Pipeline Partners $ 1,610 $ 231 $ 1,842 14% 13% 0.97 0.85
Cost of Equity Analysis
Unlevered Beta(4) 0.72
Relevered Beta(5) (?) 1.20
Risk-Free Rate(6) (Rf) 2.3%
Market Risk Premium(7) (Rm) 5.0%
Equity Size Premium(8) (Re) 1.7%
Cost of Common Equity = Rf + ?*(Rm)+Re 9.9%
Implied Current GP Take 0.4%
Adjusted Cost of Common Equity(8) 10.0%
Component Weight Pre-Tax Eff. Tax Rate Tax Rate After-Tax Contribution
Debt(9) 12.6% 6.0% 0% 0% 6.0% 0.8%
Equity 87.4% 9.9% NA NA 9.9% 8.7%
WACC 9.4%
Debt(9) 12.6% 6.0% 0% 0% 6.0% 0.8%
Adjusted Equity 87.4% 10.0% NA NA 10.0% 8.7%
Adjusted WACC 9.5%
26