| Section | Page |    | |||||||||
BROADSTONE NET LEASE, INC. | www.broadstone.com | © 2026 Broadstone Net Lease, LLC. All rights reserved. | 2 | |||||||
BROADSTONE NET LEASE, INC. | www.broadstone.com | © 2026 Broadstone Net Lease, LLC. All rights reserved. | 3 | |||||||
| Executive Team | Board of Directors | |||||||
John D. Moragne Chief Executive Officer and Member, Board of Directors Ryan M. Albano President and Chief Operating Officer Kevin M. Fennell Executive Vice President, Chief Financial Officer and Treasurer John D. Callan, Jr. Senior Vice President, General Counsel, and Secretary Michael B. Caruso Senior Vice President, Underwriting & Strategy Will D. Garner Senior Vice President, Acquisitions Jennie L. O’Brien Senior Vice President and Chief Accounting Officer Molly Kelly Wiegel Senior Vice President, Human Resources & Administration | Laurie A. Hawkes Chairman of the Board John D. Moragne Chief Executive Officer Michael A. Coke Jessica Duran Laura Felice Richard Imperiale David M. Jacobstein Joseph Saffire James H. Watters | |||||||
BROADSTONE NET LEASE, INC. | www.broadstone.com | © 2026 Broadstone Net Lease, LLC. All rights reserved. | 4 | |||||||
| Q4 2025 | Q3 2025 | Q2 2025 | Q1 2025 | Q4 2024 | ||||||||||||||||||||||||||||
| Financial Summary | ||||||||||||||||||||||||||||||||
| Investment in rental property | $ | 5,328,283 | $ | 5,147,649 | $ | 5,058,791 | $ | 5,032,276 | $ | 4,994,057 | ||||||||||||||||||||||
| Less accumulated depreciation | (772,589) | (745,326) | (721,195) | (694,990) | (672,478) | |||||||||||||||||||||||||||
| Property under development | 265,812 | 179,172 | 116,635 | 35,492 | 18,784 | |||||||||||||||||||||||||||
| Investment in rental property, net | 4,821,506 | 4,581,495 | 4,454,231 | 4,372,778 | 4,340,363 | |||||||||||||||||||||||||||
| Cash and cash equivalents | 30,540 | 81,966 | 20,784 | 9,605 | 14,845 | |||||||||||||||||||||||||||
| Restricted cash | 3,102 | 1,354 | 1,192 | 1,428 | 1,148 | |||||||||||||||||||||||||||
| Total assets | 5,717,267 | 5,519,271 | 5,326,679 | 5,237,186 | 5,216,417 | |||||||||||||||||||||||||||
| Unsecured revolving credit facility | 266,036 | 95,824 | 197,880 | 174,122 | 93,014 | |||||||||||||||||||||||||||
| Mortgages, net | 56,689 | 57,168 | 75,685 | 76,260 | 76,846 | |||||||||||||||||||||||||||
| Unsecured term loans, net | 994,219 | 994,550 | 994,028 | 893,505 | 897,201 | |||||||||||||||||||||||||||
| Senior unsecured notes, net | 1,190,738 | 1,190,315 | 846,441 | 846,252 | 846,064 | |||||||||||||||||||||||||||
| Total liabilities | 2,683,806 | 2,506,762 | 2,290,858 | 2,156,372 | 2,074,993 | |||||||||||||||||||||||||||
| Total Broadstone Net Lease, Inc. equity | 2,901,995 | 2,884,658 | 2,906,693 | 2,949,734 | 3,003,745 | |||||||||||||||||||||||||||
| Total equity (book value) | 3,033,461 | 3,012,509 | 3,035,821 | 3,080,814 | 3,141,424 | |||||||||||||||||||||||||||
| Revenues | 118,295 | 114,167 | 112,986 | 108,690 | 112,130 | |||||||||||||||||||||||||||
| General and administrative - other | 7,174 | 7,486 | 7,100 | 7,525 | 7,951 | |||||||||||||||||||||||||||
| Stock based compensation | 2,492 | 2,488 | 2,471 | 2,147 | 1,977 | |||||||||||||||||||||||||||
| General and administrative | 9,666 | 9,974 | 9,571 | 9,672 | 9,928 | |||||||||||||||||||||||||||
| Total operating expenses | 62,384 | 63,417 | 69,088 | 70,785 | 77,369 | |||||||||||||||||||||||||||
| Interest expense | 25,051 | 28,230 | 21,112 | 20,074 | 19,564 | |||||||||||||||||||||||||||
| Net income | 35,028 | 27,065 | 19,830 | 17,493 | 27,607 | |||||||||||||||||||||||||||
| Net earnings per common share, diluted | $ | 0.17 | $ | 0.14 | $ | 0.10 | $ | 0.09 | $ | 0.14 | ||||||||||||||||||||||
| FFO | 73,010 | 70,969 | 73,695 | 72,627 | 80,003 | |||||||||||||||||||||||||||
| FFO per share, diluted | 0.37 | 0.36 | $ | 0.37 | $ | 0.37 | $ | 0.41 | ||||||||||||||||||||||||
| Core FFO | 77,699 | 70,386 | 77,150 | 75,280 | 74,427 | |||||||||||||||||||||||||||
| Core FFO per share, diluted | $ | 0.39 | $ | 0.35 | $ | 0.39 | $ | 0.38 | $ | 0.38 | ||||||||||||||||||||||
| AFFO | 75,846 | 74,314 | 74,308 | 71,812 | 70,532 | |||||||||||||||||||||||||||
| AFFO per share, diluted | $ | 0.38 | $ | 0.37 | $ | 0.38 | $ | 0.36 | $ | 0.36 | ||||||||||||||||||||||
| Net cash provided by operating activities | 84,567 | 64,190 | 79,280 | 71,459 | 63,911 | |||||||||||||||||||||||||||
| Capital expenditures and improvements | 248 | 542 | 614 | 1,106 | 2,205 | |||||||||||||||||||||||||||
| Capital expenditures and improvements - revenue generating | 6,337 | 5,624 | 1,994 | 13,242 | 3,755 | |||||||||||||||||||||||||||
| Net cash (used in) provided by investing activities | (284,626) | (174,054) | (131,258) | (85,335) | 27,338 | |||||||||||||||||||||||||||
| Net cash provided by (used in) financing activities | 150,380 | 171,208 | 62,921 | 8,916 | (86,474) | |||||||||||||||||||||||||||
| Distributions declared | 57,919 | 57,284 | 57,284 | 58,874 | 57,209 | |||||||||||||||||||||||||||
| Distributions declared per diluted share | $ | 0.290 | $ | 0.290 | $ | 0.290 | $ | 0.290 | $ | 0.290 | ||||||||||||||||||||||
BROADSTONE NET LEASE, INC. | www.broadstone.com | © 2026 Broadstone Net Lease, LLC. All rights reserved. | 5 | |||||||
| December 31, 2025 | September 30, 2025 | June 30, 2025 | March 31, 2025 | December 31, 2024 | |||||||||||||||||||||||||
| Assets | |||||||||||||||||||||||||||||
| Accounted for using the operating method: | |||||||||||||||||||||||||||||
| Land | $ | 781,117 | $ | 778,177 | $ | 784,092 | $ | 780,817 | $ | 778,826 | |||||||||||||||||||
| Land improvements | 373,405 | 359,210 | 360,774 | 360,197 | 357,142 | ||||||||||||||||||||||||
| Buildings and improvements | 4,118,578 | 3,954,112 | 3,871,441 | 3,848,623 | 3,815,521 | ||||||||||||||||||||||||
| Equipment | 15,281 | 16,070 | 16,070 | 16,070 | 15,843 | ||||||||||||||||||||||||
| Total accounted for using the operating method | 5,288,381 | 5,107,569 | 5,032,377 | 5,005,707 | 4,967,332 | ||||||||||||||||||||||||
| Less accumulated depreciation | (772,589) | (745,326) | (721,195) | (694,990) | (672,478) | ||||||||||||||||||||||||
| Accounted for using the operating method, net | 4,515,792 | 4,362,243 | 4,311,182 | 4,310,717 | 4,294,854 | ||||||||||||||||||||||||
| Accounted for using the direct financing method | 25,497 | 25,673 | 25,845 | 25,999 | 26,154 | ||||||||||||||||||||||||
| Accounted for using the sales-type method | 14,405 | 14,407 | 569 | 570 | 571 | ||||||||||||||||||||||||
| Property under development | 265,812 | 179,172 | 116,635 | 35,492 | 18,784 | ||||||||||||||||||||||||
| Investment in rental property, net | 4,821,506 | 4,581,495 | 4,454,231 | 4,372,778 | 4,340,363 | ||||||||||||||||||||||||
| Cash and cash equivalents | 30,540 | 81,966 | 20,784 | 9,605 | 14,845 | ||||||||||||||||||||||||
| Accrued rental income | 178,880 | 174,867 | 172,310 | 166,436 | 162,717 | ||||||||||||||||||||||||
| Tenant and other receivables, net | 4,404 | 3,573 | 3,605 | 2,581 | 3,281 | ||||||||||||||||||||||||
| Prepaid expenses and other assets | 55,910 | 59,866 | 55,815 | 52,260 | 41,584 | ||||||||||||||||||||||||
| Interest rate swap, assets | 18,248 | 19,590 | 23,490 | 29,681 | 46,220 | ||||||||||||||||||||||||
| Goodwill | 339,769 | 339,769 | 339,769 | 339,769 | 339,769 | ||||||||||||||||||||||||
| Intangible lease assets, net | 268,010 | 258,145 | 256,675 | 264,076 | 267,638 | ||||||||||||||||||||||||
| Total assets | $ | 5,717,267 | $ | 5,519,271 | $ | 5,326,679 | $ | 5,237,186 | $ | 5,216,417 | |||||||||||||||||||
| Liabilities and equity | |||||||||||||||||||||||||||||
| Unsecured revolving credit facility | $ | 266,036 | $ | 95,824 | $ | 197,880 | $ | 174,122 | $ | 93,014 | |||||||||||||||||||
| Mortgages, net | 56,689 | 57,168 | 75,685 | 76,260 | 76,846 | ||||||||||||||||||||||||
| Unsecured term loans, net | 994,219 | 994,550 | 994,028 | 893,505 | 897,201 | ||||||||||||||||||||||||
| Senior unsecured notes, net | 1,190,738 | 1,190,315 | 846,441 | 846,252 | 846,064 | ||||||||||||||||||||||||
| Interest rate swap, liabilities | 1,501 | 1,994 | 7,625 | 3,353 | — | ||||||||||||||||||||||||
| Accounts payable and other liabilities | 60,081 | 55,662 | 57,409 | 48,424 | 48,983 | ||||||||||||||||||||||||
| Dividends payable | 59,513 | 58,665 | 58,451 | 58,220 | 58,317 | ||||||||||||||||||||||||
| Accrued interest payable | 13,502 | 9,488 | 8,542 | 9,399 | 5,837 | ||||||||||||||||||||||||
| Intangible lease liabilities, net | 41,527 | 43,096 | 44,797 | 46,837 | 48,731 | ||||||||||||||||||||||||
| Total liabilities | 2,683,806 | 2,506,762 | 2,290,858 | 2,156,372 | 2,074,993 | ||||||||||||||||||||||||
| Equity | |||||||||||||||||||||||||||||
| Broadstone Net Lease, Inc. equity: | |||||||||||||||||||||||||||||
| Preferred stock, $0.001 par value | — | — | — | — | — | ||||||||||||||||||||||||
| Common stock, $0.00025 par value | 48 | 47 | 47 | 47 | 47 | ||||||||||||||||||||||||
| Additional paid-in capital | 3,502,380 | 3,463,010 | 3,459,939 | 3,456,041 | 3,450,584 | ||||||||||||||||||||||||
| Cumulative distributions in excess of retained earnings | (620,221) | (597,571) | (571,302) | (536,074) | (496,543) | ||||||||||||||||||||||||
| Accumulated other comprehensive income | 19,788 | 19,172 | 18,009 | 29,720 | 49,657 | ||||||||||||||||||||||||
| Total Broadstone Net Lease, Inc. equity | 2,901,995 | 2,884,658 | 2,906,693 | 2,949,734 | 3,003,745 | ||||||||||||||||||||||||
| Non-controlling interests | 131,466 | 127,851 | 129,128 | 131,080 | 137,679 | ||||||||||||||||||||||||
| Total equity | 3,033,461 | 3,012,509 | 3,035,821 | 3,080,814 | 3,141,424 | ||||||||||||||||||||||||
| Total liabilities and equity | $ | 5,717,267 | $ | 5,519,271 | $ | 5,326,679 | $ | 5,237,186 | $ | 5,216,417 | |||||||||||||||||||
BROADSTONE NET LEASE, INC. | www.broadstone.com | © 2026 Broadstone Net Lease, LLC. All rights reserved. | 6 | |||||||
| Three Months Ended | |||||||||||||||||||||||||||||
| December 31, 2025 | September 30, 2025 | June 30, 2025 | March 31, 2025 | December 31, 2024 | |||||||||||||||||||||||||
| Revenues | |||||||||||||||||||||||||||||
| Lease revenues, net | $ | 118,295 | $ | 114,167 | $ | 112,986 | $ | 108,690 | $ | 112,130 | |||||||||||||||||||
| Operating expenses | |||||||||||||||||||||||||||||
| Depreciation and amortization | 41,768 | 40,246 | 42,575 | 39,497 | 42,987 | ||||||||||||||||||||||||
| Property and operating expense | 6,282 | 6,198 | 5,003 | 5,488 | 6,764 | ||||||||||||||||||||||||
| General and administrative | 9,666 | 9,974 | 9,571 | 9,672 | 9,928 | ||||||||||||||||||||||||
| Provision for impairment of investment in rental properties | 4,668 | 6,999 | 11,939 | 16,128 | 17,690 | ||||||||||||||||||||||||
| Total operating expenses | 62,384 | 63,417 | 69,088 | 70,785 | 77,369 | ||||||||||||||||||||||||
| Other income (expenses) | |||||||||||||||||||||||||||||
| Interest income | (14) | 182 | 122 | 99 | 42 | ||||||||||||||||||||||||
| Interest expense | (25,051) | (28,230) | (21,112) | (20,074) | (19,564) | ||||||||||||||||||||||||
| Gain on sale of real estate | 8,371 | 3,259 | 566 | 405 | 8,196 | ||||||||||||||||||||||||
| Income taxes | (392) | (208) | (199) | (355) | (527) | ||||||||||||||||||||||||
| Other income (expenses) | (3,797) | 1,312 | (3,445) | (487) | 4,699 | ||||||||||||||||||||||||
| Net income | 35,028 | 27,065 | 19,830 | 17,493 | 27,607 | ||||||||||||||||||||||||
| Net income attributable to non-controlling interests | (1,902) | (599) | 330 | (750) | (1,217) | ||||||||||||||||||||||||
| Net income attributable to Broadstone Net Lease, Inc. | $ | 33,126 | $ | 26,466 | $ | 20,160 | $ | 16,743 | $ | 26,390 | |||||||||||||||||||
| Weighted average number of common shares outstanding | |||||||||||||||||||||||||||||
Basic (a) | 188,480 | 188,099 | 188,041 | 187,865 | 187,592 | ||||||||||||||||||||||||
Diluted (a) | 197,935 | 197,632 | 197,138 | 196,898 | 196,697 | ||||||||||||||||||||||||
Net earnings per common share (b) | |||||||||||||||||||||||||||||
| Basic | $ | 0.17 | $ | 0.14 | $ | 0.11 | $ | 0.09 | $ | 0.14 | |||||||||||||||||||
| Diluted | $ | 0.17 | $ | 0.14 | $ | 0.10 | $ | 0.09 | $ | 0.14 | |||||||||||||||||||
BROADSTONE NET LEASE, INC. | www.broadstone.com | © 2026 Broadstone Net Lease, LLC. All rights reserved. | 7 | |||||||
| Three Months Ended | |||||||||||||||||||||||||||||
| December 31, 2025 | September 30, 2025 | June 30, 2025 | March 31, 2025 | December 31, 2024 | |||||||||||||||||||||||||
| Net income | 35,028 | $ | 27,065 | $ | 19,830 | $ | 17,493 | $ | 27,607 | ||||||||||||||||||||
| Real property depreciation and amortization | 41,686 | 40,164 | 42,492 | 39,411 | 42,902 | ||||||||||||||||||||||||
| Gain on sale of real estate | (8,371) | (3,259) | (566) | (405) | (8,196) | ||||||||||||||||||||||||
| Provision for impairment of investment in rental properties | 4,667 | 6,999 | 11,939 | 16,128 | 17,690 | ||||||||||||||||||||||||
| FFO | $ | 73,010 | $ | 70,969 | $ | 73,695 | $ | 72,627 | $ | 80,003 | |||||||||||||||||||
| Net write-offs of accrued rental income | 1,103 | 755 | 3 | 2,228 | 120 | ||||||||||||||||||||||||
| Other non-core income from real estate transactions | (211) | (27) | (46) | (63) | (1,183) | ||||||||||||||||||||||||
| Cost of debt extinguishment | — | — | — | 165 | — | ||||||||||||||||||||||||
| Severance and employee transition costs | — | 1 | 53 | 1 | 187 | ||||||||||||||||||||||||
Other (income) expenses (a) | 3,797 | (1,312) | 3,445 | 322 | (4,700) | ||||||||||||||||||||||||
| Core FFO | $ | 77,699 | $ | 70,386 | $ | 77,150 | $ | 75,280 | $ | 74,427 | |||||||||||||||||||
| Straight-line rent adjustment | (5,140) | (4,960) | (5,586) | (5,907) | (6,312) | ||||||||||||||||||||||||
| Adjustment to provision for credit losses | — | — | (13) | — | — | ||||||||||||||||||||||||
| Amortization of debt issuance costs | 1,566 | 1,357 | 1,328 | 1,237 | 983 | ||||||||||||||||||||||||
| Non-capitalized transaction costs | 157 | 125 | 142 | 117 | 299 | ||||||||||||||||||||||||
| Realized gain or loss on interest rate swaps and other non-cash interest expense | 14 | 6,116 | 7 | 2 | (6) | ||||||||||||||||||||||||
| Amortization of lease intangibles | (1,017) | (1,198) | (1,191) | (1,064) | (991) | ||||||||||||||||||||||||
| Stock-based compensation | 2,492 | 2,488 | 2,471 | 2,147 | 1,977 | ||||||||||||||||||||||||
| Deferred taxes | 75 | — | — | — | 155 | ||||||||||||||||||||||||
| AFFO | $ | 75,846 | $ | 74,314 | $ | 74,308 | $ | 71,812 | $ | 70,532 | |||||||||||||||||||
Diluted weighted average shares outstanding (b) | 197,935 | 197,632 | 197,138 | 196,898 | 196,697 | ||||||||||||||||||||||||
Net earnings per diluted share (c) | $ | 0.17 | $ | 0.14 | $ | 0.10 | $ | 0.09 | $ | 0.14 | |||||||||||||||||||
FFO per diluted share (c) | 0.37 | 0.36 | 0.37 | 0.37 | 0.41 | ||||||||||||||||||||||||
Core FFO per diluted share (c) | 0.39 | 0.35 | 0.39 | 0.38 | 0.38 | ||||||||||||||||||||||||
AFFO per diluted share (c) | 0.38 | 0.37 | 0.38 | 0.36 | 0.36 | ||||||||||||||||||||||||
BROADSTONE NET LEASE, INC. | www.broadstone.com | © 2026 Broadstone Net Lease, LLC. All rights reserved. | 8 | |||||||
| Three Months Ended | |||||||||||||||||||||||||||||
| December 31, 2025 | September 30, 2025 | June 30, 2025 | March 31, 2025 | December 31, 2024 | |||||||||||||||||||||||||
| Contractual rental amounts billed for operating leases | $ | 106,196 | $ | 102,270 | $ | 101,014 | $ | 99,314 | $ | 98,193 | |||||||||||||||||||
| Adjustment to recognize contractual operating lease billings on a straight-line basis | 5,317 | 5,134 | 5,753 | 6,064 | 6,444 | ||||||||||||||||||||||||
| Net write-offs of accrued rental income | (1,103) | (755) | — | (2,228) | — | ||||||||||||||||||||||||
| Variable rental amounts earned | 1,210 | 732 | 718 | 680 | 1,098 | ||||||||||||||||||||||||
| Earned income from direct financing leases | 671 | 675 | 679 | 682 | 686 | ||||||||||||||||||||||||
| Interest income from sales-type leases | 474 | 326 | 14 | 14 | 15 | ||||||||||||||||||||||||
| Operating expenses billed to tenants | 5,138 | 5,752 | 4,795 | 4,944 | 5,400 | ||||||||||||||||||||||||
| Other income from real estate transactions | 392 | 43 | 63 | 77 | 1,054 | ||||||||||||||||||||||||
| Adjustment to revenue recognized for uncollectible rental amounts billed, net | — | (10) | (50) | (857) | (760) | ||||||||||||||||||||||||
| Total lease revenues, net | $ | 118,295 | $ | 114,167 | $ | 112,986 | $ | 108,690 | $ | 112,130 | |||||||||||||||||||
BROADSTONE NET LEASE, INC. | www.broadstone.com | © 2026 Broadstone Net Lease, LLC. All rights reserved. | 9 | |||||||
| Three Months Ended December 31, | |||||||||||||||||||||||||||||
| Number of Properties | 2025 | 2024 | $ Change | % Change | |||||||||||||||||||||||||
| Same Store Properties: | |||||||||||||||||||||||||||||
| Contractual rent increases | |||||||||||||||||||||||||||||
| Total | 649 | $ | 81,250 | $ | 79,792 | $ | 1,458 | 1.8 | % | ||||||||||||||||||||
| Industrial | 170 | 47,380 | 46,549 | 831 | 1.8 | % | |||||||||||||||||||||||
| Retail | 456 | 26,556 | 26,066 | 490 | 1.9 | % | |||||||||||||||||||||||
| Other | 23 | 7,314 | 7,177 | 137 | 1.9 | % | |||||||||||||||||||||||
Revenue generating capital expenditures during periods (a) | 6 | 2,216 | 2,007 | 209 | |||||||||||||||||||||||||
| Leasing activity | 38 | 4,619 | 3,628 | 991 | |||||||||||||||||||||||||
Cash basis tenants (b) | 15 | 2,367 | 2,400 | (33) | |||||||||||||||||||||||||
| Currently vacant | 1 | — | 89 | (89) | |||||||||||||||||||||||||
| Same store rental revenue | 709 | 90,452 | (c) | 87,916 | (c) | 2,536 | 2.9 | % | |||||||||||||||||||||
| Industrial | 182 | 52,282 | 50,330 | 1,952 | 3.9 | % | |||||||||||||||||||||||
| Retail | 499 | 29,963 | 29,583 | 380 | 1.3 | % | |||||||||||||||||||||||
| Other | 29 | 8,208 | 8,002 | 206 | 2.6 | % | |||||||||||||||||||||||
| Non-Same Store Properties: | |||||||||||||||||||||||||||||
| Investments during periods | 62 | (d) | 16,659 | 8,693 | |||||||||||||||||||||||||
Contractual rental amounts - current property portfolio | 771 | 107,111 | 96,609 | ||||||||||||||||||||||||||
Sold during periods presented | 86 | (e) | 474 | 1,753 | |||||||||||||||||||||||||
| Contractual rental amounts | 857 | 107,585 | 98,362 | ||||||||||||||||||||||||||
| Straight-line and other non-cash adjustments | N/A | 5,055 | 7,187 | ||||||||||||||||||||||||||
Other revenue (f) | N/A | 5,549 | 6,454 | ||||||||||||||||||||||||||
| Constant currency adjustment | N/A | 106 | 127 | ||||||||||||||||||||||||||
| Total Lease revenues, net | $ | 118,295 | $ | 112,130 | |||||||||||||||||||||||||
BROADSTONE NET LEASE, INC. | www.broadstone.com | © 2026 Broadstone Net Lease, LLC. All rights reserved. | 10 | |||||||
Years Ended December 31, | |||||||||||||||||||||||||||||
| Number of Properties | 2025 | 2024 | $ Change | % Change | |||||||||||||||||||||||||
| Same Store Properties: | |||||||||||||||||||||||||||||
| Contractual rent increases | |||||||||||||||||||||||||||||
| Total | 649 | $ | 321,755 | $ | 316,009 | $ | 5,746 | 1.8 | % | ||||||||||||||||||||
| Industrial | 170 | 188,323 | 185,219 | 3,104 | 1.7 | % | |||||||||||||||||||||||
| Retail | 456 | 104,428 | 102,444 | 1,984 | 1.9 | % | |||||||||||||||||||||||
| Other | 23 | 29,004 | 28,346 | 658 | 2.3 | % | |||||||||||||||||||||||
Revenue generating capital expenditures during periods (a) | 6 | 8,560 | 7,963 | 597 | |||||||||||||||||||||||||
| Leasing activity | 38 | 17,069 | 16,157 | 912 | |||||||||||||||||||||||||
Cash basis tenants (b) | 15 | 9,512 | 9,526 | (14) | |||||||||||||||||||||||||
| Currently vacant | 1 | 237 | 355 | (118) | |||||||||||||||||||||||||
| Same store rental revenue | 709 | 357,133 | (c) | 350,010 | (c) | 7,123 | 2.0 | % | |||||||||||||||||||||
| Industrial | 182 | 206,490 | 201,540 | 4,950 | 2.5 | % | |||||||||||||||||||||||
| Retail | 499 | 118,273 | 116,905 | 1,368 | 1.2 | % | |||||||||||||||||||||||
| Other | 29 | 32,370 | 31,565 | 805 | 2.6 | % | |||||||||||||||||||||||
| Non-Same Store Properties: | |||||||||||||||||||||||||||||
| Investments during periods | 62 | (d) | 48,750 | 17,097 | |||||||||||||||||||||||||
Contractual rental amounts - current property portfolio | 771 | 405,883 | 367,107 | ||||||||||||||||||||||||||
Sold during periods presented | 86 | (e) | 5,287 | 19,246 | |||||||||||||||||||||||||
| Contractual rental amounts | 857 | 411,170 | 386,353 | ||||||||||||||||||||||||||
| Straight-line and other non-cash adjustments | N/A | 21,769 | 22,510 | ||||||||||||||||||||||||||
Other revenue (f) | N/A | 21,223 | 22,732 | ||||||||||||||||||||||||||
| Constant currency adjustment | N/A | (24) | 205 | ||||||||||||||||||||||||||
| Total Lease revenues, net | $ | 454,138 | $ | 431,800 | |||||||||||||||||||||||||
BROADSTONE NET LEASE, INC. | www.broadstone.com | © 2026 Broadstone Net Lease, LLC. All rights reserved. | 11 | |||||||
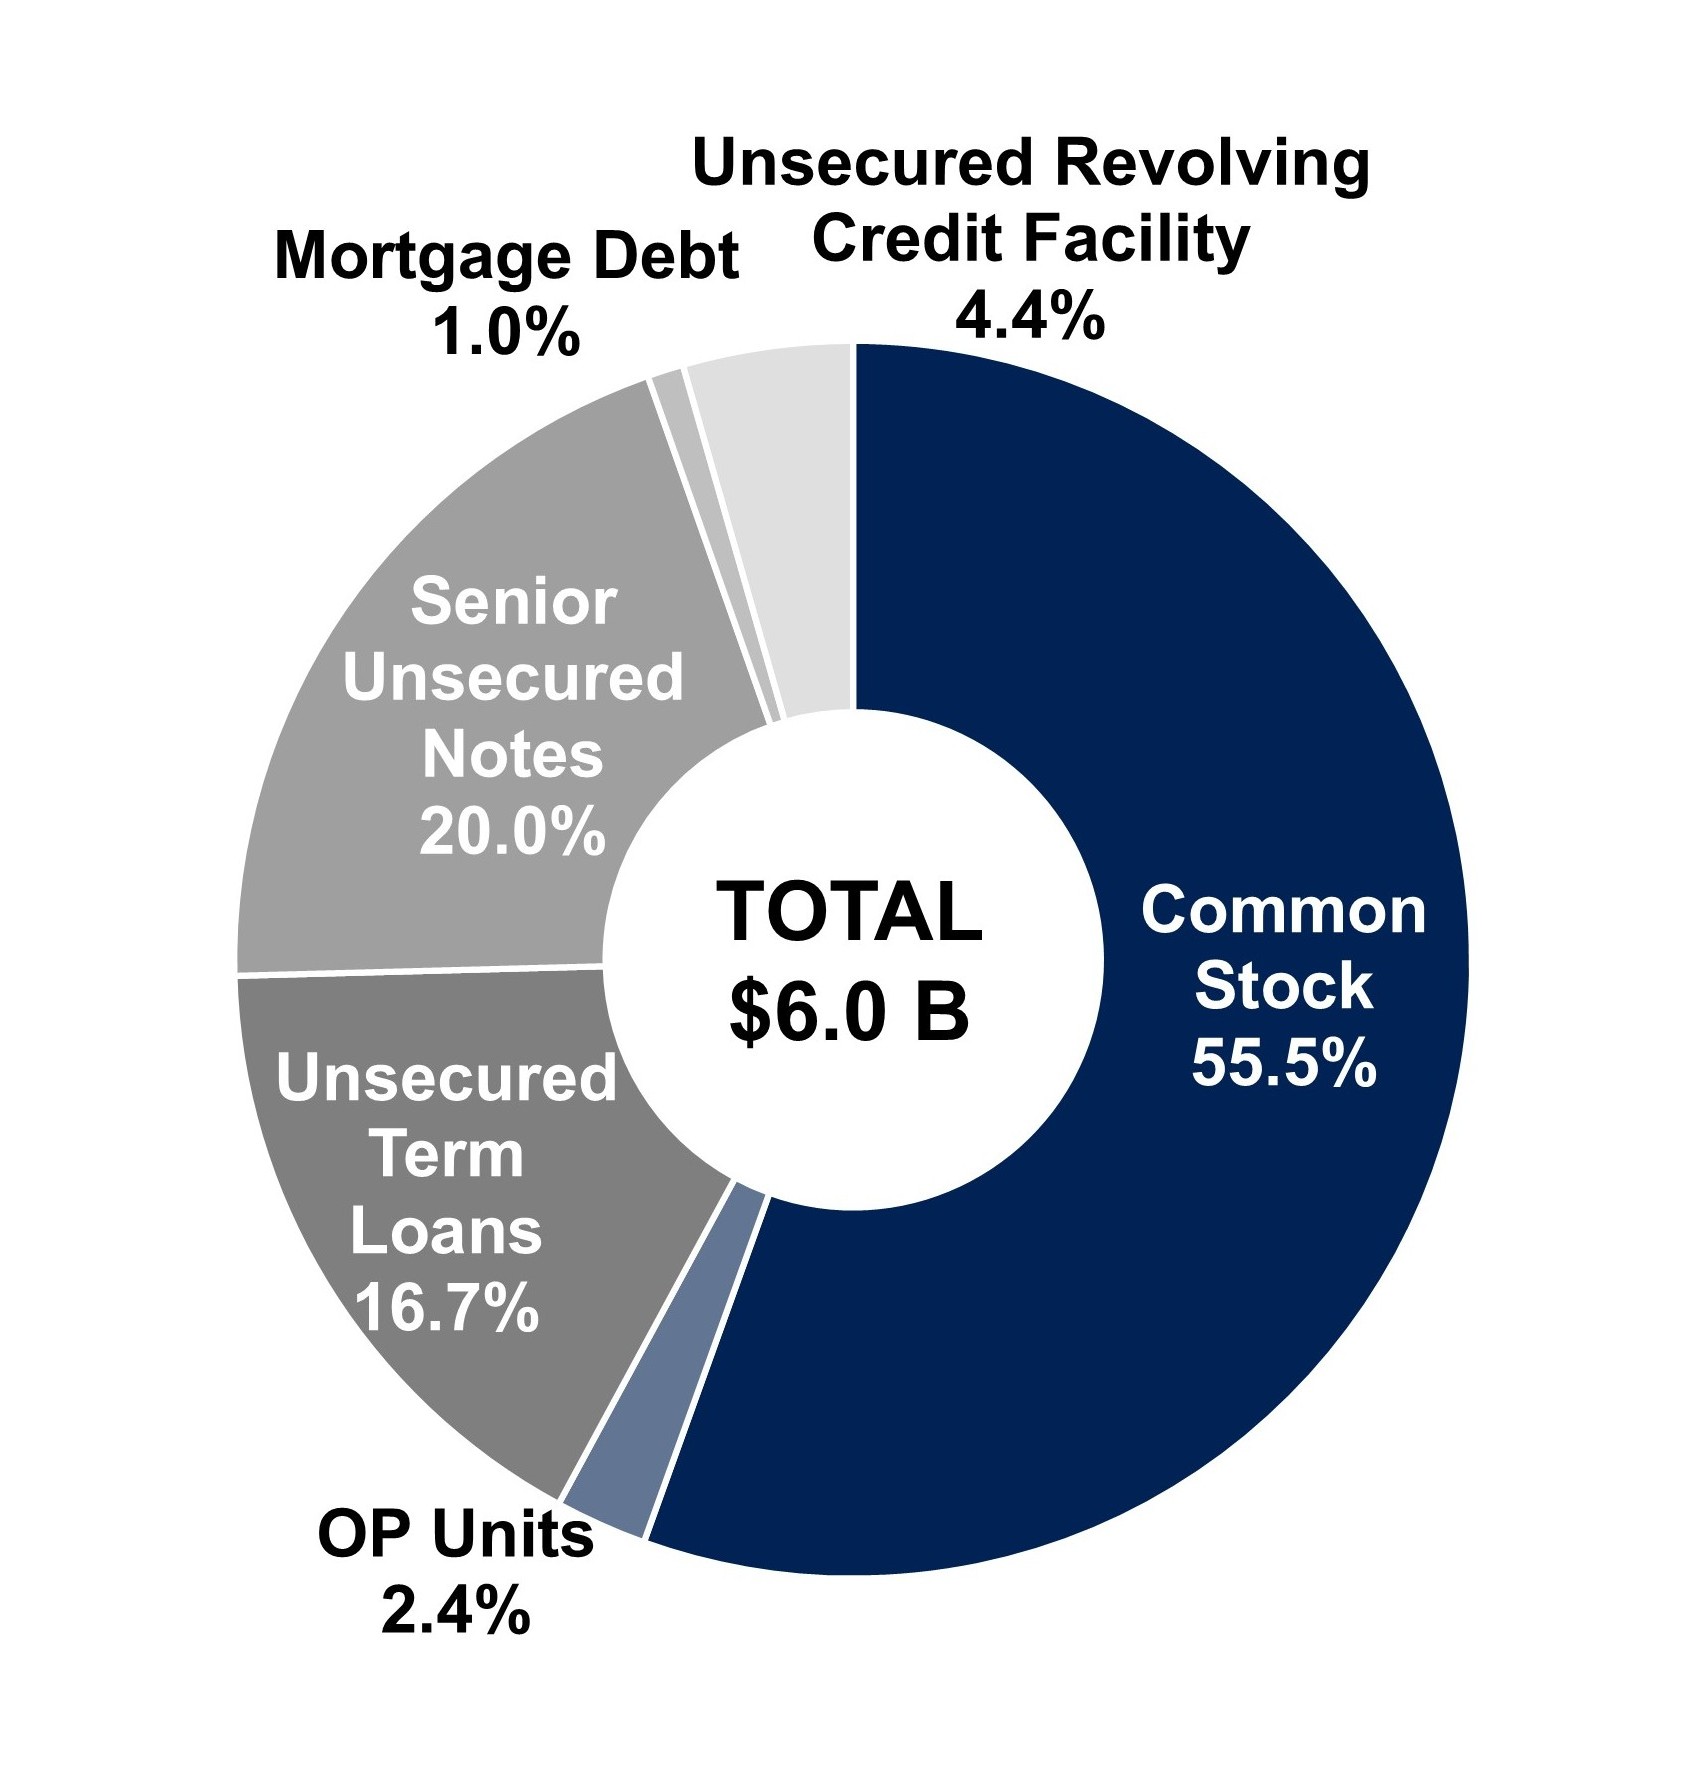
| EQUITY | |||||
| Shares of Common Stock | 191,423 | ||||
| OP Units | 8,296 | ||||
| Common Stock & OP Units | 199,719 | ||||
Price Per Share / Unit at December 31, 2025 | $ | 17.37 | |||
| IMPLIED EQUITY MARKET CAPITALIZATION | $ | 3,469,119 | |||
| % of Total Capitalization | 57.9 | % | |||
| DEBT | |||||
| Unsecured Revolving Credit Facility | $ | 266,036 | |||
| Unsecured Term Loans | 1,000,000 | ||||
| Unsecured Term Loan - 2027 | 200,000 | ||||
| Unsecured Term Loan - 2028 | 500,000 | ||||
| Unsecured Term Loan - 2029 | 300,000 | ||||
| Senior Unsecured Notes | 1,200,000 | ||||
| Senior Unsecured Notes - 2027 | 150,000 | ||||
| Senior Unsecured Notes - 2028 | 225,000 | ||||
| Senior Unsecured Notes - 2030 | 100,000 | ||||
| Senior Unsecured Public Notes - 2031 | 375,000 | ||||
Senior Unsecured Public Notes - 2032 | 350,000 | ||||
| Mortgage Debt - Various | 56,717 | ||||
| TOTAL DEBT | $ | 2,522,753 | |||
| % of Total Capitalization | 42.1 | % | |||
| Floating Rate Debt % | 12.8 | % | |||
| Fixed Rate Debt % | 87.2 | % | |||
| Secured Debt % | 2.2 | % | |||
| Unsecured Debt % | 97.8 | % | |||
| Total Capitalization | $ | 5,991,872 | |||
| Less: Cash and Cash Equivalents | (30,540) | ||||
| Enterprise Value | $ | 5,961,332 | |||
BROADSTONE NET LEASE, INC. | www.broadstone.com | © 2026 Broadstone Net Lease, LLC. All rights reserved. | 12 | |||||||
| Shares of Common Stock | OP Units | Total Diluted Shares | |||||||||||||||
Balance, January 1, 2025 | 188,626 | 8,646 | 197,272 | ||||||||||||||
Grants of restricted stock awards | 292 | — | 292 | ||||||||||||||
| Retirement of common shares under equity incentive plan | (86) | — | (86) | ||||||||||||||
| Forfeiture of restricted stock awards | (3) | — | (3) | ||||||||||||||
| OP unit conversion | 244 | (244) | — | ||||||||||||||
Balance, March 31, 2025 | 189,073 | 8,402 | 197,475 | ||||||||||||||
Grants of restricted stock awards | 61 | — | 61 | ||||||||||||||
| Forfeiture of restricted stock awards | (4) | — | (4) | ||||||||||||||
Balance, June 30, 2025 | 189,130 | 8,402 | 197,532 | ||||||||||||||
Grants of restricted stock awards | 1 | — | 1 | ||||||||||||||
| Forfeiture of restricted stock awards | (1) | — | (1) | ||||||||||||||
| OP unit conversion | 86 | (86) | — | ||||||||||||||
Balance, September 30, 2025 | 189,216 | 8,316 | 197,532 | ||||||||||||||
Grants of restricted stock awards | 2,188 | — | 2,188 | ||||||||||||||
| Forfeiture of restricted stock awards | (1) | — | (1) | ||||||||||||||
| OP unit conversion | 20 | (20) | — | ||||||||||||||
Balance, December 31, 2025 | 191,423 | 8,296 | 199,719 | ||||||||||||||
BROADSTONE NET LEASE, INC. | www.broadstone.com | © 2026 Broadstone Net Lease, LLC. All rights reserved. | 13 | |||||||
December 31, | |||||||||||||||||||||||||||||
| 2025 | 2024 | Interest Rate | Maturity Date | ||||||||||||||||||||||||||
| Unsecured revolving credit facility | $ | 266,036 | $ | 93,014 | applicable reference rate + 0.85% | (a) | Mar. 2029 | (d) | |||||||||||||||||||||
| Unsecured term loans: | |||||||||||||||||||||||||||||
| 2026 Unsecured Term Loan | — | 400,000 | one-month adjusted SOFR + 1.00% | (b) | Feb. 2026 | (e) | |||||||||||||||||||||||
| 2027 Unsecured Term Loan | 200,000 | 200,000 | daily simple SOFR + 0.95% | (c) | Aug. 2027 | ||||||||||||||||||||||||
| 2028 Unsecured Term Loan | 500,000 | — | one-month SOFR + 0.95% | (b) | Mar. 2028 | (f) | |||||||||||||||||||||||
| 2029 Unsecured Term Loan | 300,000 | 300,000 | daily simple SOFR + 0.95% | (c) | Feb. 2029 | (g) | |||||||||||||||||||||||
| Total unsecured term loans | 1,000,000 | 900,000 | |||||||||||||||||||||||||||
| Unamortized debt issuance costs, net | (5,781) | (2,799) | |||||||||||||||||||||||||||
| Total unsecured term loans, net | 994,219 | 897,201 | |||||||||||||||||||||||||||
| Senior unsecured notes: | |||||||||||||||||||||||||||||
| 2027 Senior Unsecured Notes - Series A | 150,000 | 150,000 | 4.84% | Apr. 2027 | |||||||||||||||||||||||||
| 2028 Senior Unsecured Notes - Series B | 225,000 | 225,000 | 5.09% | Jul. 2028 | |||||||||||||||||||||||||
| 2030 Senior Unsecured Notes - Series C | 100,000 | 100,000 | 5.19% | Jul. 2030 | |||||||||||||||||||||||||
| 2031 Senior Unsecured Public Notes | 375,000 | 375,000 | 2.60% | Sep. 2031 | |||||||||||||||||||||||||
| 2032 Senior Unsecured Public Notes | 350,000 | — | 5.00% | Nov. 2032 | |||||||||||||||||||||||||
| Total senior unsecured notes | 1,200,000 | 850,000 | |||||||||||||||||||||||||||
| Unamortized debt issuance costs and original issuance discounts, net | (9,262) | (3,936) | |||||||||||||||||||||||||||
| Total senior unsecured notes, net | 1,190,738 | 846,064 | |||||||||||||||||||||||||||
| Total unsecured debt, net | $ | 2,450,993 | $ | 1,836,279 | |||||||||||||||||||||||||
| Lender | Origination Date | Maturity Date | Interest Rate | December 31, 2025 | December 31, 2024 | |||||||||||||||||||||||||||
| Wilmington Trust National Association | Apr-19 | Feb-28 | 4.92 | % | $ | 41,393 | $ | 42,838 | ||||||||||||||||||||||||
| Wilmington Trust National Association | Jun-18 | Aug-25 | 4.36 | % | — | 18,283 | ||||||||||||||||||||||||||
| PNC Bank | Oct-16 | Nov-26 | 3.62 | % | 15,324 | 15,792 | ||||||||||||||||||||||||||
| Total mortgages | 56,717 | 76,913 | ||||||||||||||||||||||||||||||
| Debt issuance costs, net | (28) | (67) | ||||||||||||||||||||||||||||||
| Mortgages, net | $ | 56,689 | $ | 76,846 | ||||||||||||||||||||||||||||
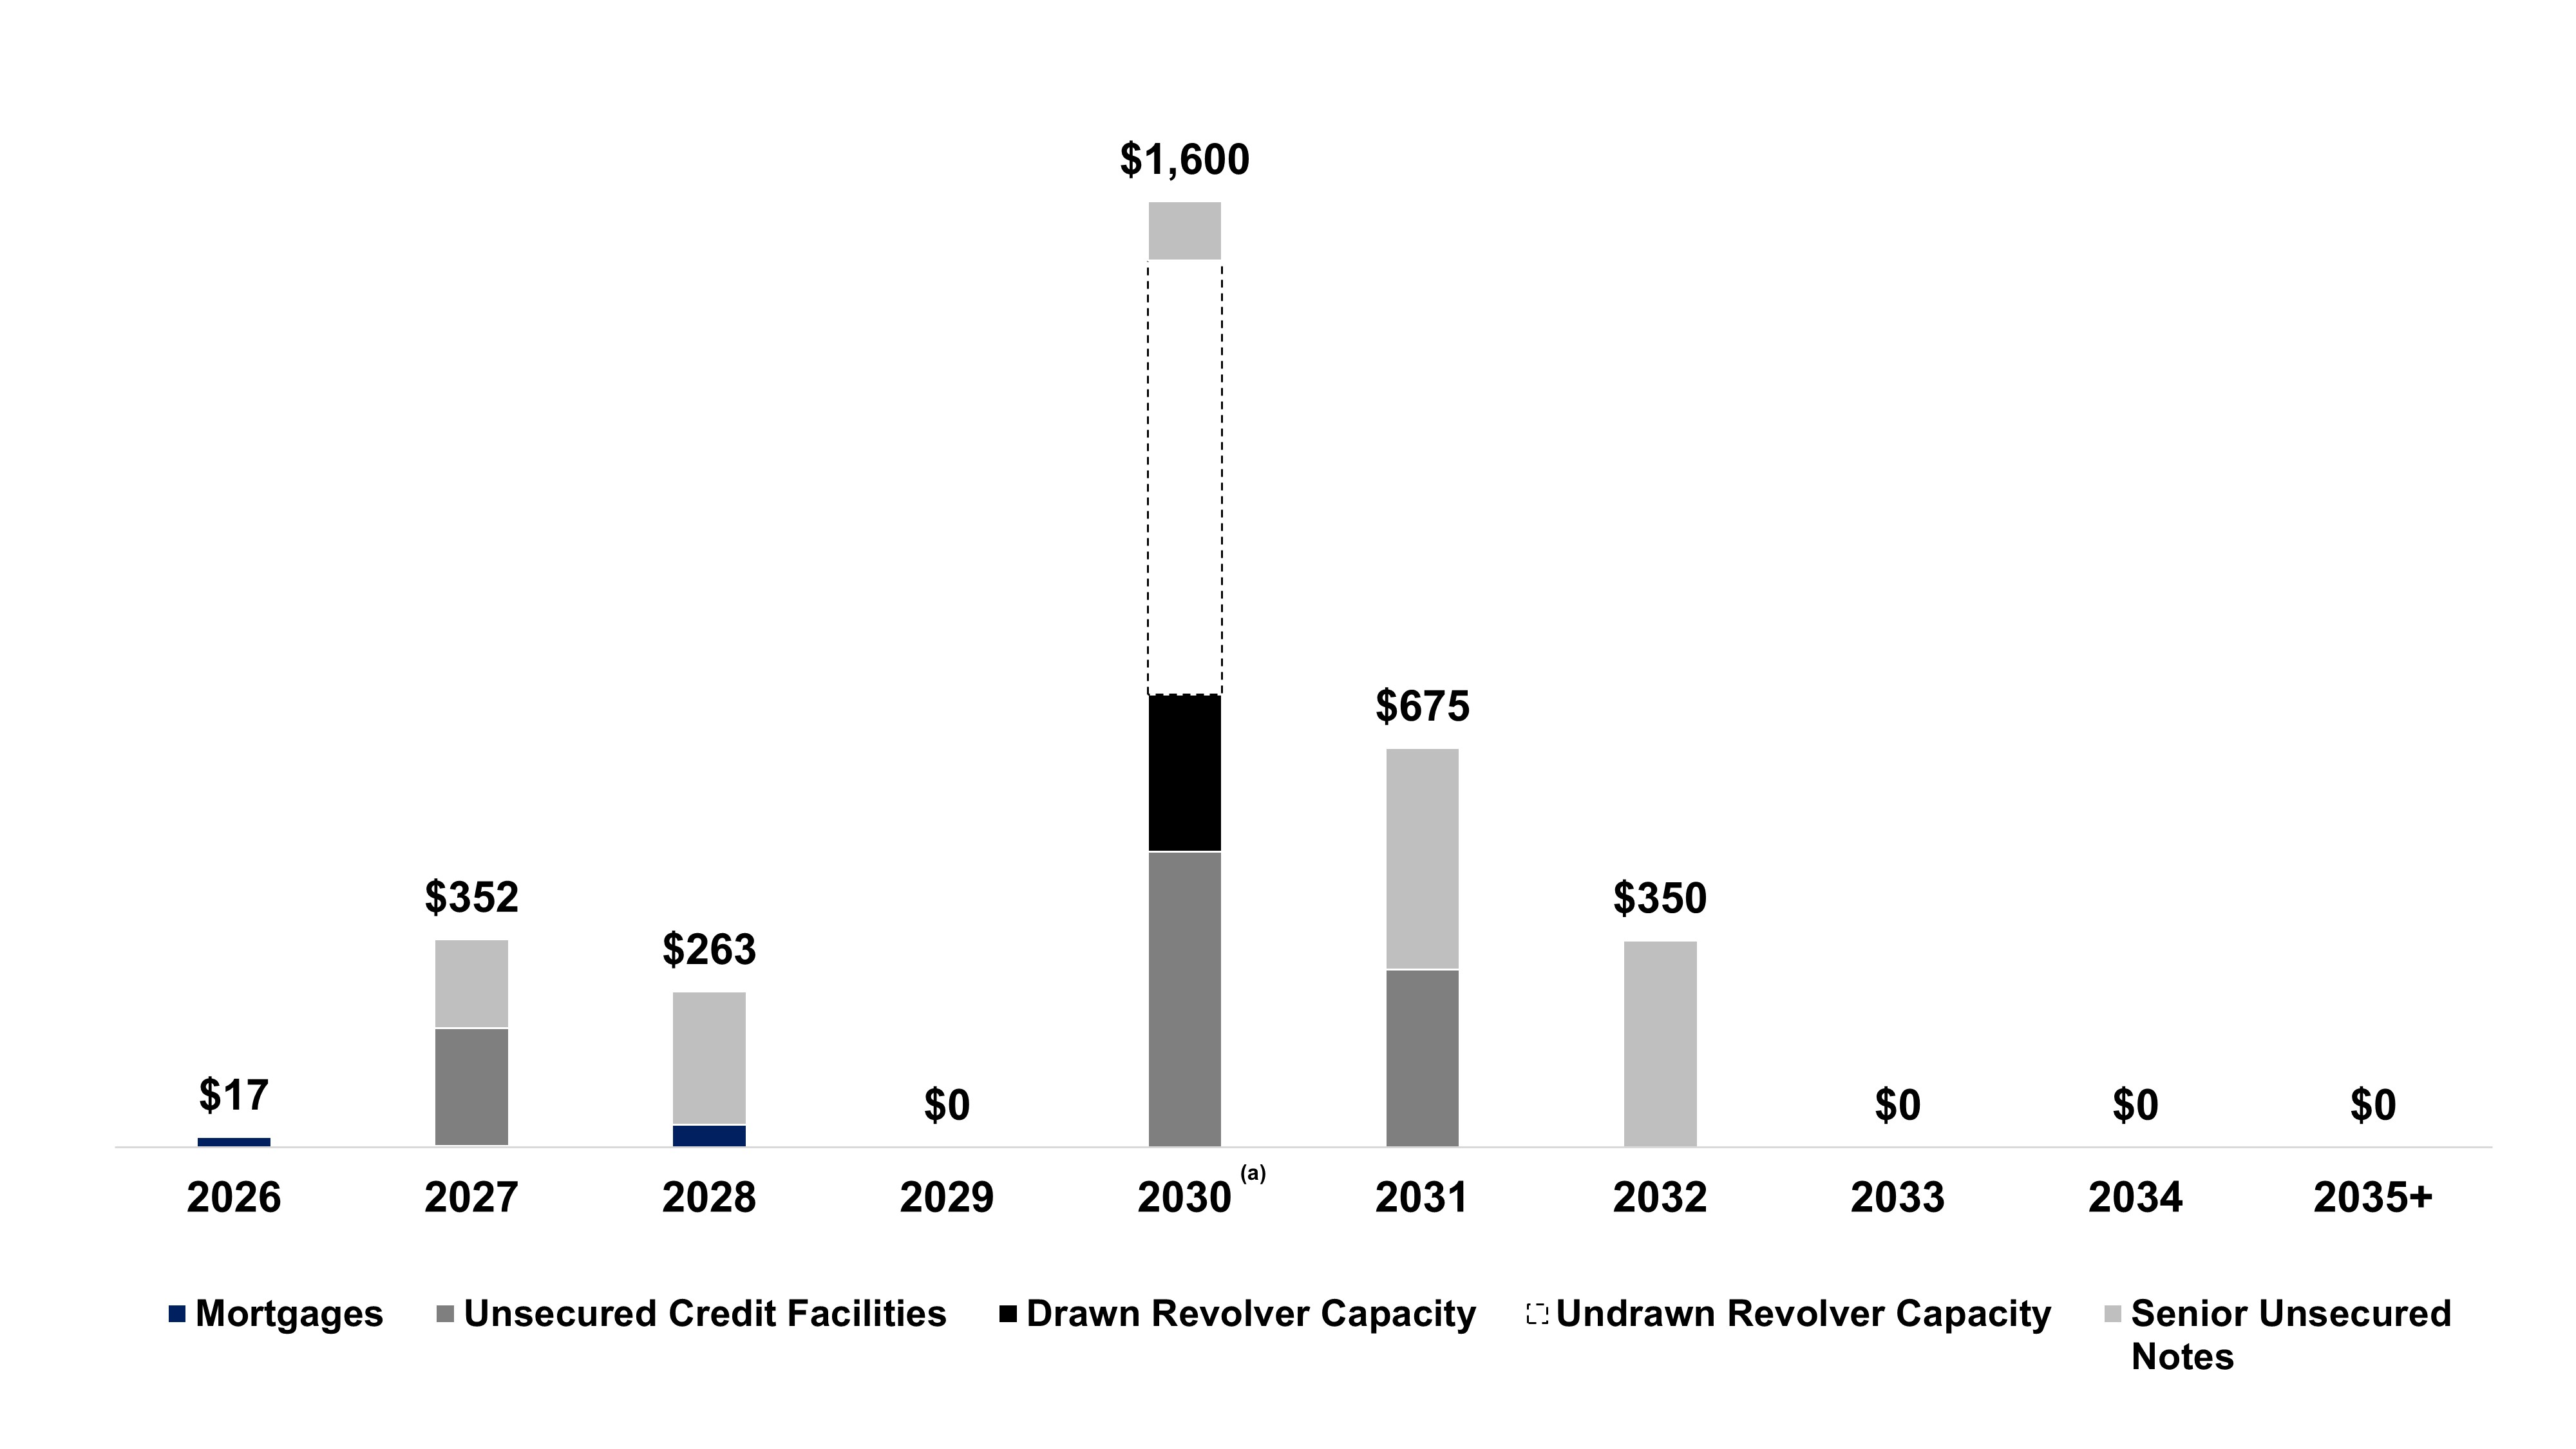
| Year of Maturity | Revolving Credit Facility | Mortgages | Term Loans | Senior Notes | Total | ||||||||||||||||||||||||
| 2026 | $ | — | $ | 16,843 | $ | — | $ | — | $ | 16,843 | |||||||||||||||||||
| 2027 | — | 1,596 | 200,000 | 150,000 | 351,596 | ||||||||||||||||||||||||
| 2028 | — | 38,278 | 500,000 | 225,000 | 763,278 | ||||||||||||||||||||||||
| 2029 | 266,036 | — | 300,000 | — | 566,036 | ||||||||||||||||||||||||
| 2030 | — | — | — | 100,000 | 100,000 | ||||||||||||||||||||||||
| Thereafter | — | — | — | 725,000 | 725,000 | ||||||||||||||||||||||||
| Total | $ | 266,036 | $ | 56,717 | $ | 1,000,000 | $ | 1,200,000 | $ | 2,522,753 | |||||||||||||||||||
BROADSTONE NET LEASE, INC. | www.broadstone.com | © 2026 Broadstone Net Lease, LLC. All rights reserved. | 14 | |||||||
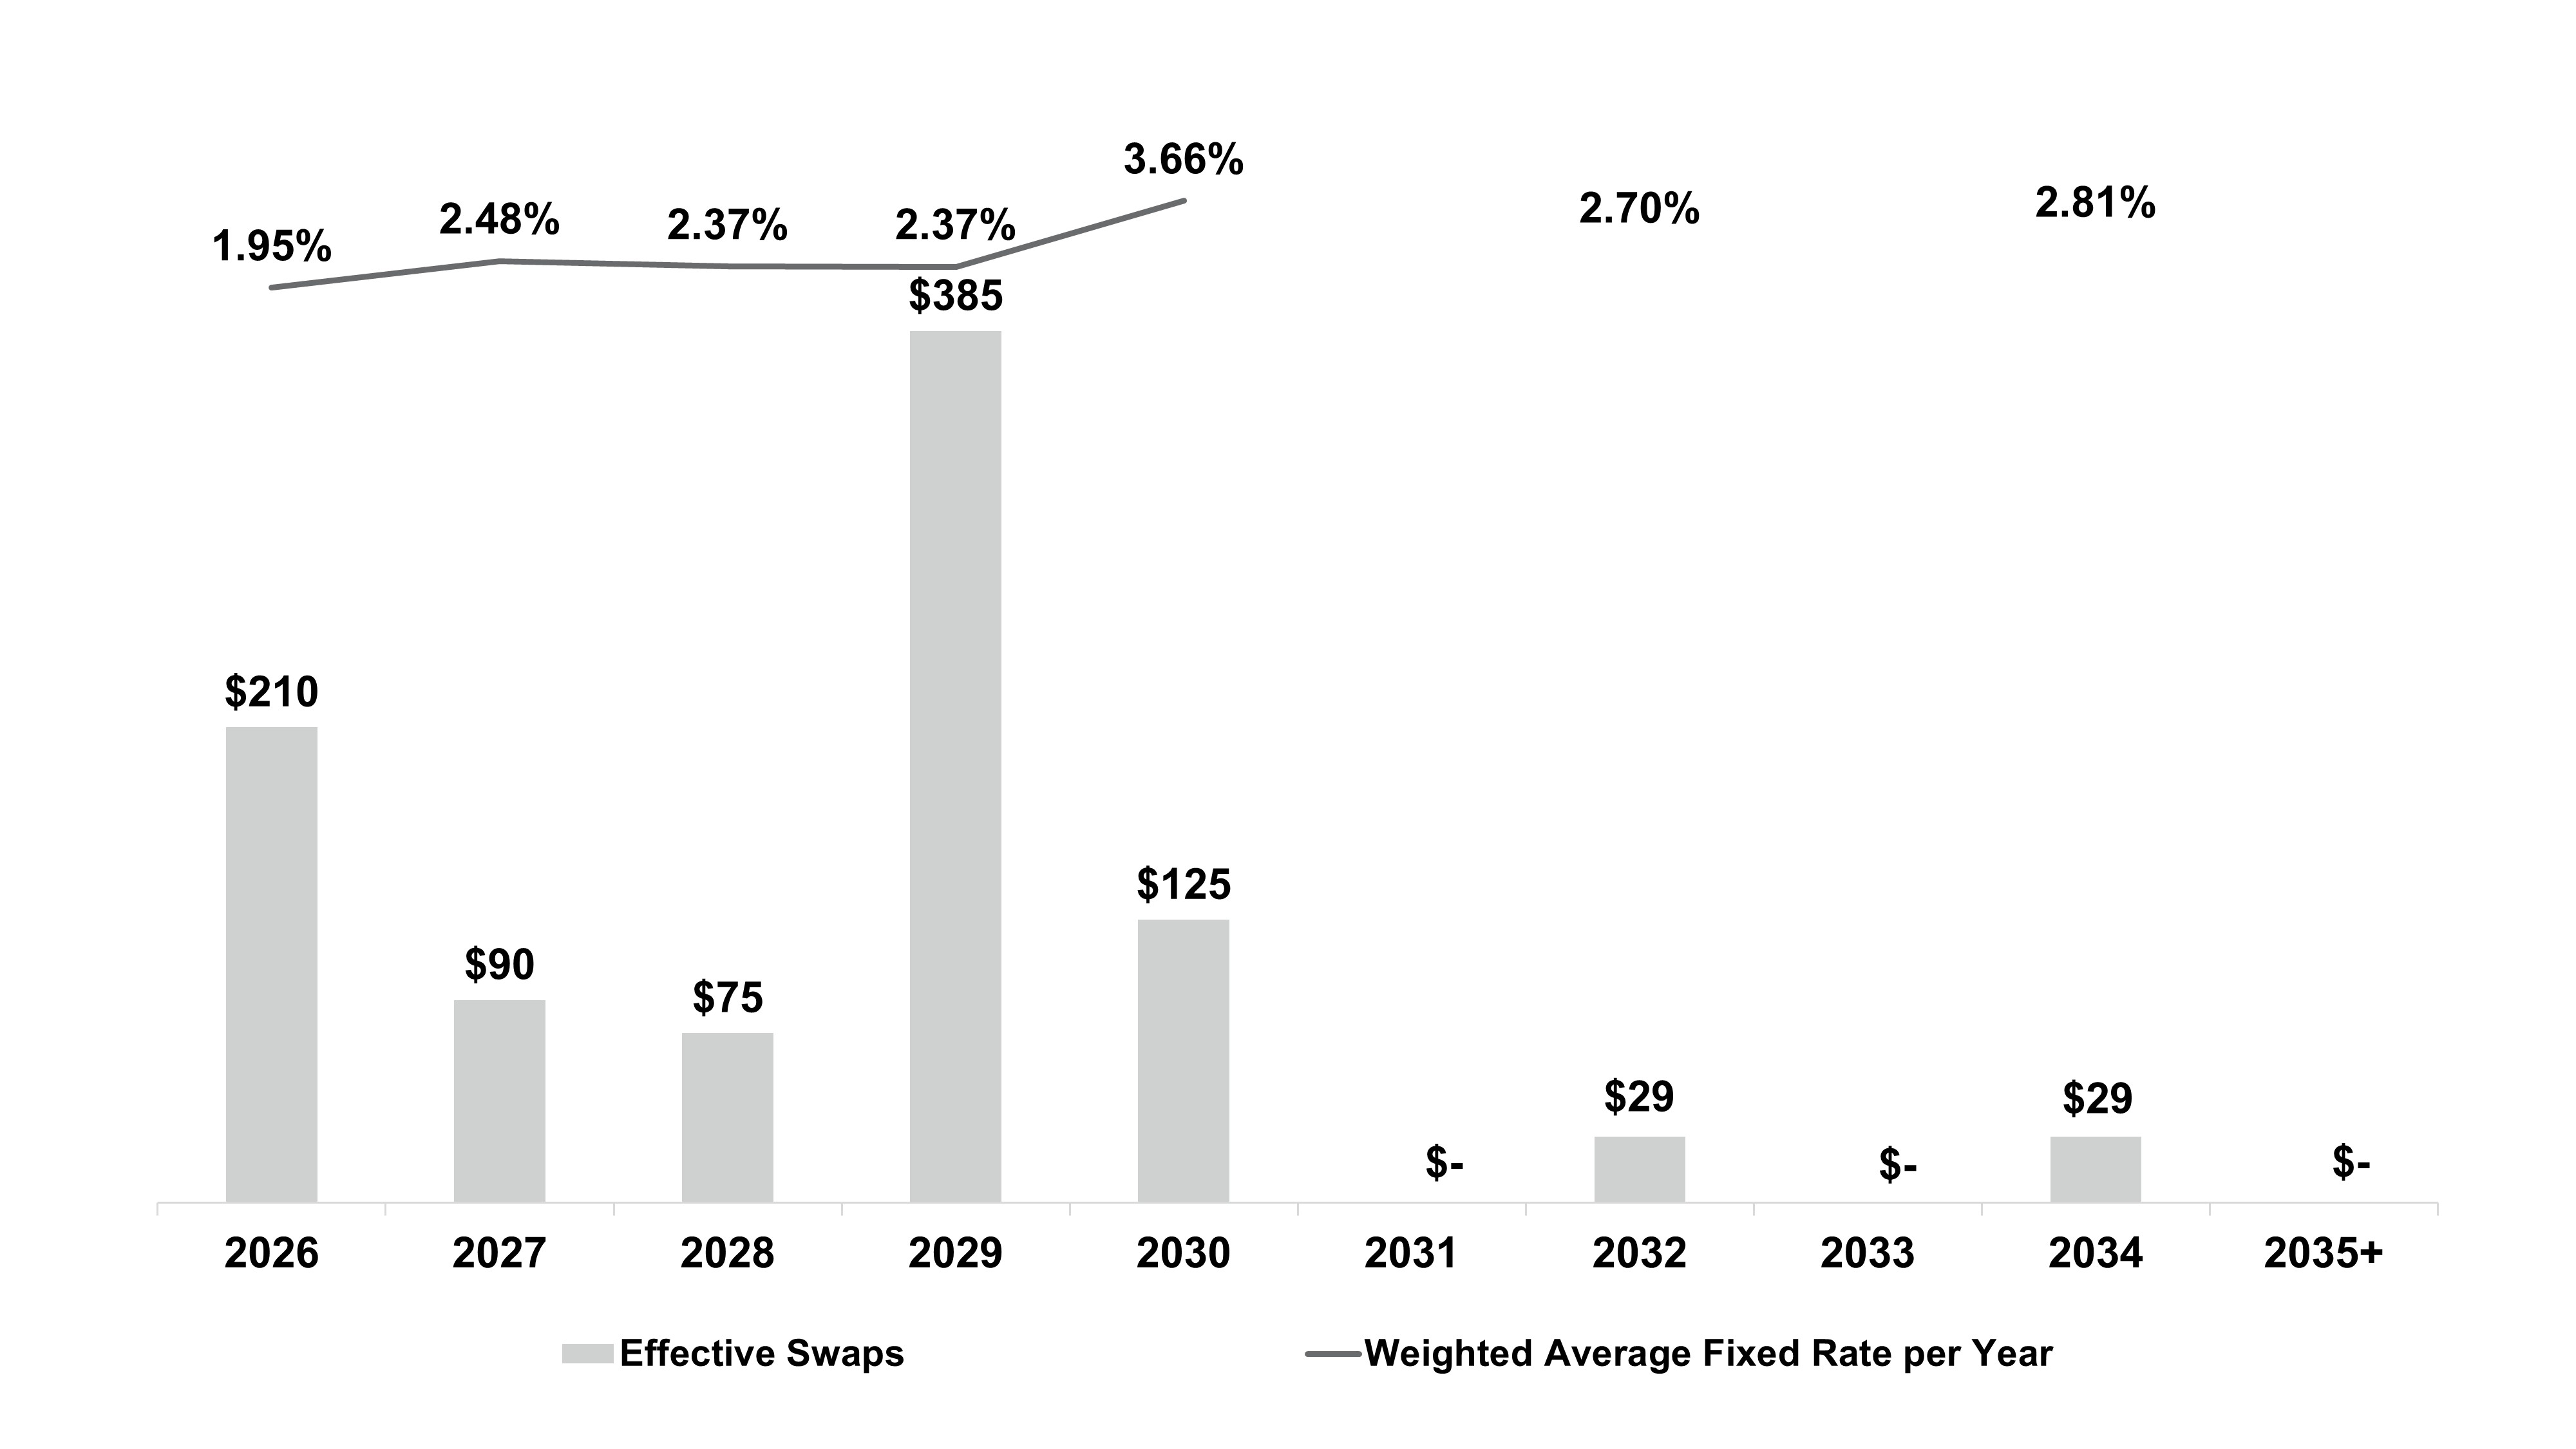
| (in thousands, except interest rates) | December 31, 2025 | |||||||||||||||||||||||||||||||
| Counterparty | Maturity Date | Fixed Rate | Variable Rate Index | Notional Amount | Fair Value | |||||||||||||||||||||||||||
| Bank of Montreal | January 2026 | 1.92 | % | daily compounded SOFR | 25,000 | 1 | ||||||||||||||||||||||||||
| Bank of Montreal | January 2026 | 2.05 | % | daily compounded SOFR | 40,000 | 2 | ||||||||||||||||||||||||||
| Capital One, National Association | January 2026 | 2.08 | % | daily compounded SOFR | 35,000 | 2 | ||||||||||||||||||||||||||
| Truist Financial Corporation | January 2026 | 1.93 | % | daily compounded SOFR | 25,000 | 1 | ||||||||||||||||||||||||||
| Capital One, National Association | April 2026 | 2.68 | % | daily compounded SOFR | 15,000 | 43 | ||||||||||||||||||||||||||
| Capital One, National Association | July 2026 | 1.32 | % | daily compounded SOFR | 35,000 | 410 | ||||||||||||||||||||||||||
| Bank of Montreal | December 2026 | 2.33 | % | daily compounded SOFR | 10,000 | 116 | ||||||||||||||||||||||||||
| Bank of Montreal | December 2026 | 1.99 | % | daily compounded SOFR | 25,000 | 373 | ||||||||||||||||||||||||||
| Toronto-Dominion Bank | March 2027 | 2.46 | % | daily compounded CORRA | 14,607 | (a) | 32 | |||||||||||||||||||||||||
| Wells Fargo Bank, N.A. | April 2027 | 2.72 | % | daily compounded SOFR | 25,000 | 224 | ||||||||||||||||||||||||||
| Bank of Montreal | December 2027 | 2.37 | % | daily compounded SOFR | 25,000 | 494 | ||||||||||||||||||||||||||
| Capital One, National Association | December 2027 | 2.37 | % | daily compounded SOFR | 25,000 | 493 | ||||||||||||||||||||||||||
| Wells Fargo Bank, N.A. | January 2028 | 2.37 | % | daily compounded SOFR | 75,000 | 1,485 | ||||||||||||||||||||||||||
| Bank of Montreal | May 2029 | 2.09 | % | daily compounded SOFR | 25,000 | 1,084 | ||||||||||||||||||||||||||
| Regions Bank | May 2029 | 2.11 | % | daily compounded SOFR | 25,000 | 1,067 | ||||||||||||||||||||||||||
| Regions Bank | June 2029 | 2.03 | % | daily compounded SOFR | 25,000 | 1,136 | ||||||||||||||||||||||||||
| U.S. Bank National Association | June 2029 | 2.03 | % | daily compounded SOFR | 25,000 | 1,135 | ||||||||||||||||||||||||||
| Regions Bank | August 2029 | 2.58 | % | one-month SOFR | 100,000 | 2,501 | ||||||||||||||||||||||||||
| Toronto-Dominion Bank | August 2029 | 2.58 | % | one-month SOFR | 45,000 | 1,145 | ||||||||||||||||||||||||||
| U.S. Bank National Association | August 2029 | 2.65 | % | one-month SOFR | 15,000 | 345 | ||||||||||||||||||||||||||
| U.S. Bank National Association | August 2029 | 2.58 | % | one-month SOFR | 100,000 | 2,508 | ||||||||||||||||||||||||||
| U.S. Bank National Association | August 2029 | 1.35 | % | daily compounded SOFR | 25,000 | 1,793 | ||||||||||||||||||||||||||
| Toronto-Dominion Bank | December 2030 | 3.66 | % | daily simple SOFR | 70,000 | (c) | (835) | |||||||||||||||||||||||||
| Regions Bank | December 2030 | 3.66 | % | daily simple SOFR | 55,000 | (c) | (666) | |||||||||||||||||||||||||
| Regions Bank | March 2032 | 2.69 | % | daily compounded CORRA | 14,607 | (a) | 394 | |||||||||||||||||||||||||
| U.S. Bank National Association | March 2032 | 2.70 | % | daily compounded CORRA | 14,607 | (a) | 391 | |||||||||||||||||||||||||
| Bank of Montreal | March 2034 | 2.81 | % | daily compounded CORRA | 29,214 | (b) | 1,073 | |||||||||||||||||||||||||
| Total Swaps | $ | 943,035 | $ | 16,747 | ||||||||||||||||||||||||||||
BROADSTONE NET LEASE, INC. | www.broadstone.com | © 2026 Broadstone Net Lease, LLC. All rights reserved. | 15 | |||||||
| Three Months Ended | |||||||||||||||||||||||||||||
| December 31, 2025 | September 30, 2025 | June 30, 2025 | March 31, 2025 | December 31, 2024 | |||||||||||||||||||||||||
| Net income | $ | 35,028 | $ | 27,065 | $ | 19,830 | $ | 17,493 | $ | 27,607 | |||||||||||||||||||
| Depreciation and amortization | 41,768 | 40,246 | 42,575 | 39,497 | 42,987 | ||||||||||||||||||||||||
| Interest expense | 25,051 | 28,230 | 21,112 | 20,074 | 19,565 | ||||||||||||||||||||||||
| Income taxes | 392 | 208 | 199 | 355 | 527 | ||||||||||||||||||||||||
| EBITDA | $ | 102,239 | $ | 95,749 | $ | 83,716 | $ | 77,419 | $ | 90,686 | |||||||||||||||||||
| Provision for impairment of investment in rental properties | 4,667 | 6,999 | 11,939 | 16,128 | 17,690 | ||||||||||||||||||||||||
| Gain on sale of real estate | (8,371) | (3,259) | (566) | (405) | (8,197) | ||||||||||||||||||||||||
| EBITDAre | $ | 98,535 | $ | 99,489 | $ | 95,089 | $ | 93,142 | $ | 100,179 | |||||||||||||||||||
Adjustment for current quarter investment activity (a) | 1,821 | 1,797 | 573 | 978 | 28 | ||||||||||||||||||||||||
Adjustment for current quarter disposition activity (b) | (286) | (257) | (490) | (135) | (11) | ||||||||||||||||||||||||
Adjustment to exclude non-recurring and other expenses (c) | 2,515 | (177) | (332) | 44 | 348 | ||||||||||||||||||||||||
| Adjustment to exclude net write-offs of accrued rental income | 1,103 | 755 | 3 | 2,228 | 120 | ||||||||||||||||||||||||
| Adjustment to exclude realized / unrealized foreign exchange (gain) loss | 1,282 | (1,312) | 3,445 | 322 | (4,699) | ||||||||||||||||||||||||
| Adjustment to exclude cost of debt extinguishment | — | — | — | 166 | — | ||||||||||||||||||||||||
| Adjustment to exclude other income from real estate transactions | (392) | (43) | (46) | (63) | (1,183) | ||||||||||||||||||||||||
| Adjusted EBITDAre | $ | 104,578 | $ | 100,252 | $ | 98,242 | $ | 96,682 | $ | 94,782 | |||||||||||||||||||
Estimated revenues from developments (d) | 2,867 | 2,544 | 1,629 | 631 | 334 | ||||||||||||||||||||||||
| Pro Forma Adjusted EBITDAre | $ | 107,445 | $ | 102,796 | $ | 99,871 | $ | 97,313 | $ | 95,116 | |||||||||||||||||||
| Annualized EBITDAre | $ | 394,140 | $ | 397,956 | $ | 380,356 | $ | 372,568 | $ | 400,716 | |||||||||||||||||||
| Annualized Adjusted EBITDAre | 418,312 | 401,008 | 392,968 | 386,728 | 379,128 | ||||||||||||||||||||||||
| Pro Forma Annualized Adjusted EBITDAre | 429,780 | 411,184 | 399,484 | 389,252 | 380,464 | ||||||||||||||||||||||||
| Three Months Ended | |||||||||||||||||||||||||||||
| December 31, 2025 | September 30, 2025 | June 30, 2025 | March 31, 2025 | December 31, 2024 | |||||||||||||||||||||||||
| Adjusted EBITDAre | $ | 104,578 | $ | 100,252 | $ | 98,242 | $ | 96,682 | $ | 94,782 | |||||||||||||||||||
| General and administrative (excluding certain expenses reflected above) | 9,666 | 9,984 | 9,524 | 9,628 | 9,581 | ||||||||||||||||||||||||
| Adjusted Net Operating Income ("NOI") | $ | 114,244 | $ | 110,236 | $ | 107,766 | $ | 106,310 | $ | 104,363 | |||||||||||||||||||
| Straight-line rental revenue, net | (5,676) | (5,282) | (5,693) | (6,084) | (6,317) | ||||||||||||||||||||||||
| Other amortization and non-cash charges | (1,017) | (1,364) | (1,569) | (1,007) | (796) | ||||||||||||||||||||||||
| Adjusted Cash NOI | $ | 107,551 | $ | 103,590 | $ | 100,504 | $ | 99,219 | $ | 97,250 | |||||||||||||||||||
| Annualized Adjusted NOI | $ | 456,976 | $ | 440,944 | $ | 431,064 | $ | 425,240 | $ | 417,452 | |||||||||||||||||||
| Annualized Adjusted Cash NOI | 430,204 | 414,360 | 402,016 | 396,876 | 389,000 | ||||||||||||||||||||||||
BROADSTONE NET LEASE, INC. | www.broadstone.com | © 2026 Broadstone Net Lease, LLC. All rights reserved. | 16 | |||||||
| December 31, 2025 | September 30, 2025 | June 30, 2025 | March 31, 2025 | December 31, 2024 | |||||||||||||||||||||||||
| Debt | |||||||||||||||||||||||||||||
| Unsecured revolving credit facility | $ | 266,036 | $ | 95,824 | $ | 197,880 | $ | 174,122 | $ | 93,014 | |||||||||||||||||||
| Unsecured term loans, net | 994,219 | 994,550 | 994,028 | 893,505 | 897,201 | ||||||||||||||||||||||||
| Senior unsecured notes, net | 1,190,738 | 1,190,315 | 846,441 | 846,252 | 846,064 | ||||||||||||||||||||||||
| Mortgages, net | 56,689 | 57,168 | 75,685 | 76,260 | 76,846 | ||||||||||||||||||||||||
| Debt issuance costs | 15,072 | 15,171 | 9,578 | 10,300 | 6,802 | ||||||||||||||||||||||||
| Gross Debt | 2,522,754 | 2,353,028 | 2,123,612 | 2,000,439 | 1,919,927 | ||||||||||||||||||||||||
| Cash and cash equivalents | (30,540) | (81,966) | (20,784) | (9,605) | (14,845) | ||||||||||||||||||||||||
| Restricted cash | (3,102) | (1,354) | (1,192) | (1,428) | (1,148) | ||||||||||||||||||||||||
| Net Debt | 2,489,112 | 2,269,708 | 2,101,636 | 1,989,406 | 1,903,934 | ||||||||||||||||||||||||
Estimated net proceeds from forward equity agreements (a) | (10,964) | (37,257) | (37,722) | (38,124) | (38,514) | ||||||||||||||||||||||||
| Pro Forma Net Debt | $ | 2,478,148 | $ | 2,232,451 | $ | 2,063,914 | $ | 1,951,282 | $ | 1,865,420 | |||||||||||||||||||
| Leverage Ratios: | |||||||||||||||||||||||||||||
| Net Debt to Annualized EBITDAre | 6.3x | 5.7x | 5.5x | 5.3x | 4.8x | ||||||||||||||||||||||||
| Net Debt to Annualized Adjusted EBITDAre | 6.0x | 5.7x | 5.3x | 5.1x | 5.0x | ||||||||||||||||||||||||
| Pro Forma Net Debt to Annualized Adjusted EBITDAre | 5.8x | 5.4x | 5.2x | 5.0x | 4.9x | ||||||||||||||||||||||||
| Covenants | Required | Revolving Credit Facility and Unsecured Term Loans | Senior Unsecured Notes Series A, B, & C | Senior Unsecured Public Notes | ||||||||||||||||||||||
| Leverage ratio | ≤ 0.60 to 1.00 | 0.37 | 0.38 | Not Applicable | ||||||||||||||||||||||
| Secured indebtedness ratio | ≤ 0.40 to 1.00 | 0.01 | 0.01 | Not Applicable | ||||||||||||||||||||||
| Unencumbered coverage ratio | ≥ 1.75 to 1.00 | 4.05 | Not Applicable | Not Applicable | ||||||||||||||||||||||
| Fixed charge coverage ratio | ≥ 1.50 to 1.00 | 3.80 | 3.80 | Not Applicable | ||||||||||||||||||||||
| Total unsecured indebtedness to total unencumbered eligible property value | ≤ 0.60 to 1.00 | 0.39 | 0.43 | Not Applicable | ||||||||||||||||||||||
| Dividends and other restricted payments | Only applicable in case of default | Not Applicable | Not Applicable | Not Applicable | ||||||||||||||||||||||
| Aggregate debt ratio | ≤ 0.60 to 1.00 | Not Applicable | Not Applicable | 0.42 | ||||||||||||||||||||||
| Consolidated income available for debt to annual debt service charge | ≥ 1.50 to 1.00 | Not Applicable | Not Applicable | 4.54 | ||||||||||||||||||||||
| Total unencumbered assets to total unsecured debt | ≥ 1.50 to 1.00 | Not Applicable | Not Applicable | 2.40 | ||||||||||||||||||||||
| Secured debt ratio | ≤ 0.40 to 1.00 | Not Applicable | Not Applicable | 0.01 | ||||||||||||||||||||||
BROADSTONE NET LEASE, INC. | www.broadstone.com | © 2026 Broadstone Net Lease, LLC. All rights reserved. | 17 | |||||||
Weighted Average Debt Maturity: 4.3 years (a) | ||
Weighted Average Effective Swap Maturity: 2.9 years | ||
BROADSTONE NET LEASE, INC. | www.broadstone.com | © 2026 Broadstone Net Lease, LLC. All rights reserved. | 18 | |||||||
| Q4 2025 | Q3 2025 | Q2 2025 | Q1 2025 | YTD 2025 | |||||||||||||
| Acquisitions: | |||||||||||||||||
| Number of transactions | 5 | 3 | 1 | 3 | 12 | ||||||||||||
| Number of properties | 15 | 3 | 1 | 6 | 25 | ||||||||||||
| Square feet | 1,104 | 1,080 | 348 | 438 | 2,970 | ||||||||||||
| Acquisition price | $ | 176,747 | $ | 139,462 | $ | 54,722 | $ | 59,004 | $ | 429,935 | |||||||
| Industrial | 146,504 | 118,128 | 54,722 | 41,088 | 360,442 | ||||||||||||
| Retail | 30,243 | 21,334 | — | 17,916 | 69,493 | ||||||||||||
| Initial cash capitalization rate | 7.0 | % | 7.1 | % | 7.1 | % | 7.2 | % | 7.0 | % | |||||||
| Straight-line yield | 8.7 | % | 8.1 | % | 8.2 | % | 8.3 | % | 8.4 | % | |||||||
| Weighted average lease term (years) | 17.1 | 12.0 | 10.7 | 13.6 | 14.2 | ||||||||||||
| Weighted average annual rent increase | 2.6 | % | 2.4 | % | 3.0 | % | 2.6 | % | 2.6 | % | |||||||
| Build-to-suit developments: | |||||||||||||||||
| Investments | $ | 78,523 | $ | 40,999 | $ | 63,295 | $ | 26,494 | $ | 209,311 | |||||||
| Revenue generating capital expenditures: | |||||||||||||||||
| Number of existing properties | — | 1 | — | 3 | 4 | ||||||||||||
| Investments | $ | — | $ | 5,507 | $ | — | $ | 2,835 | $ | 8,342 | |||||||
| Initial cash capitalization rate | — | 8.5 | % | — | 8.0 | % | 8.3 | % | |||||||||
| Weighted average lease term (years) | — | 16.7 | — | 17.7 | 17.0 | ||||||||||||
| Weighted average annual rent increase | — | 2.0 | % | — | 1.7 | % | 1.9 | % | |||||||||
| Transitional capital: | |||||||||||||||||
| Number of transactions | 4 | 2 | 2 | — | 8 | ||||||||||||
Investments | $ | 60,067 | $ | 17,926 | $ | 22,781 | $ | — | $ | 100,774 | |||||||
| Cash capitalization rate | 7.8 | % | 7.8 | % | 7.8 | % | — | 7.8 | % | ||||||||
| Total investments | $ | 315,337 | $ | 203,894 | $ | 140,798 | $ | 88,333 | $ | 748,362 | |||||||
Total initial cash capitalization rate (a) | 7.0 | % | 7.1 | % | 7.1 | % | 7.2 | % | 7.0 | % | |||||||
Total weighted average lease term (years) (a) | 17.1 | 12.2 | 10.7 | 13.8 | 14.2 | ||||||||||||
Total weighted average annual rent increase (a) | 2.6 | % | 2.4 | % | 3.0 | % | 2.5 | % | 2.6 | % | |||||||
BROADSTONE NET LEASE, INC. | www.broadstone.com | © 2026 Broadstone Net Lease, LLC. All rights reserved. | 19 | |||||||
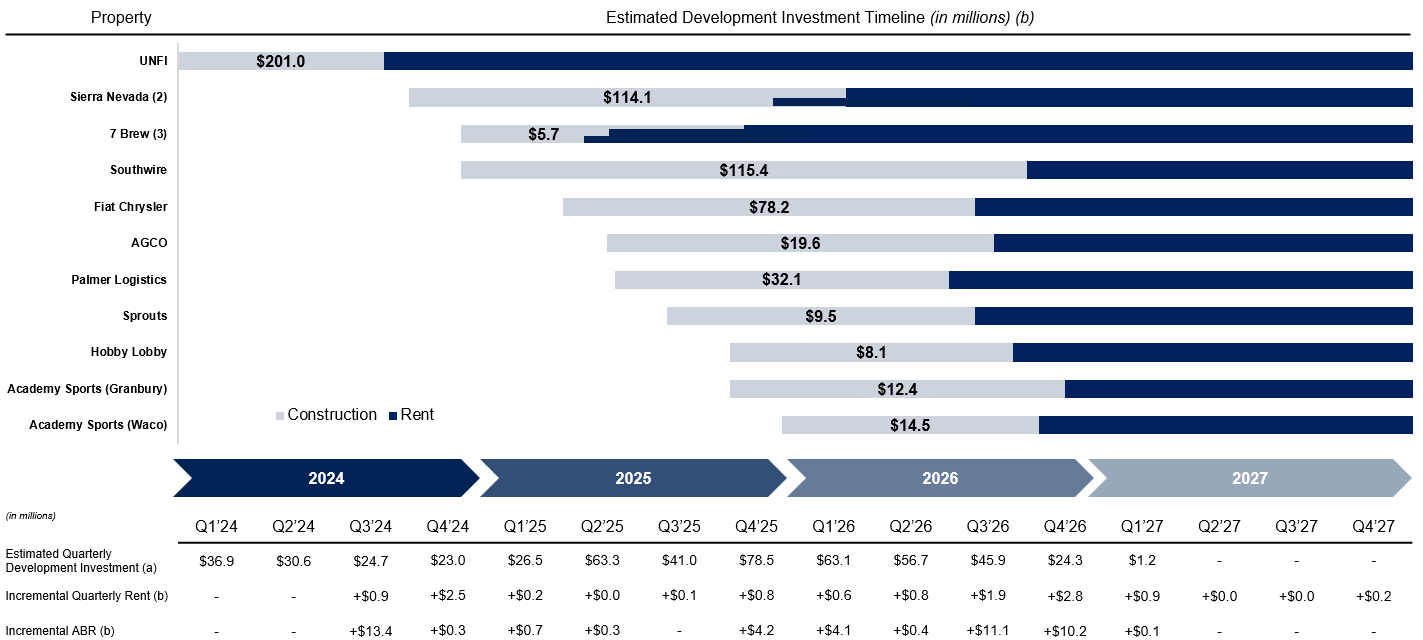
| Property | Projected Rentable Square Feet | Start Date (a) | Target Stabilization Date/Stabilized Date (a) | Lease Term (Years) | Annual Rent Escalations | Estimated Total Project Investment (a) | Cumulative Investment | QTD Q4 2025 Investment | Estimated Remaining Investment | Estimated Cash Capitalization Rate (a) | Estimated Straight-line Yield | |||||||||||||||||||||||||||||||||||||||||||||||||||||||||
| In-process retail: | ||||||||||||||||||||||||||||||||||||||||||||||||||||||||||||||||||||
| Sprouts (Bedford, TX) | 22 | Jul. 2025 | Aug. 2026 | 15 | 0.9 | % | $ | 9,533 | $ | 626 | $ | 626 | $ | 8,907 | 7.2 | % | 7.7 | % | ||||||||||||||||||||||||||||||||||||||||||||||||||
| Hobby Lobby (Granbury, TX) | 55 | Oct. 2025 | Sep. 2026 | 15 | 0.7 | % | 8,129 | 1,407 | 1,407 | 6,722 | 7.1 | % | 7.4 | % | ||||||||||||||||||||||||||||||||||||||||||||||||||||||
| Academy Sports (Granbury, TX) | 55 | Oct. 2025 | Nov. 2026 | 15 | 0.6 | % | 12,393 | 2,793 | 2,793 | 9,600 | 7.1 | % | 7.4 | % | ||||||||||||||||||||||||||||||||||||||||||||||||||||||
| Academy Sports (Waco, TX) | 68 | Dec. 2025 | Sep. 2026 | 15 | 0.6 | % | 14,488 | 5,824 | 5,824 | 8,664 | 7.2 | % | 7.5 | % | ||||||||||||||||||||||||||||||||||||||||||||||||||||||
| In-process industrial: | ||||||||||||||||||||||||||||||||||||||||||||||||||||||||||||||||||||
| Sierra Nevada (Dayton, OH) | 122 | Oct. 2024 | Mar. 2026 | 15 | 3.0 | % | 55,525 | 42,826 | 15,174 | 12,699 | 7.7 | % | 9.6 | % | ||||||||||||||||||||||||||||||||||||||||||||||||||||||
| Southwire (Bremen, GA) | 1,178 | Dec. 2024 | Oct. 2026 | 10 | 2.8 | % | 115,411 | 42,607 | 20,407 | 72,804 | 7.8 | % | 8.8 | % | ||||||||||||||||||||||||||||||||||||||||||||||||||||||
| Fiat Chrysler Automobile (Forsyth, GA) | 422 | Apr. 2025 | Aug. 2026 | 15 | 2.8 | % | 78,242 | 34,326 | 14,691 | 43,916 | 6.9 | % | 8.3 | % | ||||||||||||||||||||||||||||||||||||||||||||||||||||||
| AGCO (Visalia, CA) | 115 | Jun. 2025 | Aug. 2026 | 12 | 3.5 | % | 19,567 | 14,536 | 222 | 5,031 | 7.0 | % | 8.5 | % | ||||||||||||||||||||||||||||||||||||||||||||||||||||||
Palmer Logistics (Midlothian, TX) (b) | 270 | Jul. 2025 | Jul. 2026 | 12.3 | 3.5 | % | 32,063 | 12,875 | 7,615 | 19,188 | 7.6 | % | 9.2 | % | ||||||||||||||||||||||||||||||||||||||||||||||||||||||
| 2,307 | 12.9 | 2.7 | % | 345,351 | 157,820 | 68,759 | 187,531 | 7.4 | % | 8.6 | % | |||||||||||||||||||||||||||||||||||||||||||||||||||||||||
| Stabilized industrial: | ||||||||||||||||||||||||||||||||||||||||||||||||||||||||||||||||||||
| UNFI (Sarasota, FL) | 1,016 | Jan. 2023 | Sep. 2024 | 15 | 2.5 | % | 200,958 | 200,958 | — | — | 7.2 | % | 8.6 | % | ||||||||||||||||||||||||||||||||||||||||||||||||||||||
| Sierra Nevada (Dayton, OH) | 122 | Oct. 2024 | Nov. 2025 | 15 | 3.0 | % | 58,563 | 54,146 | 9,562 | 4,417 | 7.5 | % | 9.3 | % | ||||||||||||||||||||||||||||||||||||||||||||||||||||||
| Stabilized retail: | ||||||||||||||||||||||||||||||||||||||||||||||||||||||||||||||||||||
| 7Brew (High Point, NC) | 1 | Dec. 2024 | Feb. 2025 | 15 | 1.9 | % | 1,975 | 1,975 | — | — | 8.0 | % | 8.8 | % | ||||||||||||||||||||||||||||||||||||||||||||||||||||||
| 7Brew (Charleston, SC) | 1 | Feb. 2025 | Apr. 2025 | 15 | 1.9 | % | 1,729 | 1,729 | — | — | 7.9 | % | 8.8 | % | ||||||||||||||||||||||||||||||||||||||||||||||||||||||
| 7Brew (Jacksonville, FL) | 1 | Jun. 2025 | Nov. 2025 | 15 | 1.9 | % | 2,008 | 1,613 | 202 | 395 | 8.0 | % | 8.8 | % | ||||||||||||||||||||||||||||||||||||||||||||||||||||||
| Total / weighted average | 3,448 | 13.8 | 2.6 | % | $ | 610,584 | $ | 418,241 | $ | 78,523 | $ | 192,343 | 7.4 | % | 8.7 | % | ||||||||||||||||||||||||||||||||||||||||||||||||||||
BROADSTONE NET LEASE, INC. | www.broadstone.com | © 2026 Broadstone Net Lease, LLC. All rights reserved. | 20 | |||||||
BROADSTONE NET LEASE, INC. | www.broadstone.com | © 2026 Broadstone Net Lease, LLC. All rights reserved. | 21 | |||||||
Property (a) | Investment (’000s) | Stabilized Cash Capitalization Rate (b) | Annualized Initial Cash NOI Yield | Remaining Initial Term (Years) | ||||||||||||||||||||||
Sunset Hills Retail Center - St. Louis, MO (c) (d) | $ | 52,915 | 8.0 | % | 7.6 | % | 1.5 | |||||||||||||||||||
Project Triboro Industrial Park - Olyphant, PA (e) | 100,059 | 7.8 | % | — | % | 2.8 | ||||||||||||||||||||
BROADSTONE NET LEASE, INC. | www.broadstone.com | © 2026 Broadstone Net Lease, LLC. All rights reserved. | 22 | |||||||
| Q1 2025 | ||||||||||||||||||||||||||||||||
| Property Type | Number of Properties | Square Feet | Acquisition Price | Disposition Price | Net Book Value | |||||||||||||||||||||||||||
| Other | 3 | 30 | $ | 9,621 | $ | 7,385 | $ | 9,802 | ||||||||||||||||||||||||
| Total Properties | 3 | 30 | 9,621 | 7,385 | 9,802 | |||||||||||||||||||||||||||
| Weighted average cash cap rate | 9.2 | % | ||||||||||||||||||||||||||||||
| Q2 2025 | ||||||||||||||||||||||||||||||||
| Property Type | Number of Properties | Square Feet | Acquisition Price | Disposition Price | Net Book Value | |||||||||||||||||||||||||||
| Retail | 6 | 31 | $ | 13,720 | $ | 7,548 | $ | 9,154 | ||||||||||||||||||||||||
| Other | 2 | 67 | 26,700 | 5,550 | 7,473 | |||||||||||||||||||||||||||
| Total Properties | 8 | 98 | 40,420 | 13,098 | 16,628 | |||||||||||||||||||||||||||
| Weighted average cash cap rate | 9.5 | % | ||||||||||||||||||||||||||||||
| Q3 2025 | ||||||||||||||||||||||||||||||||
| Property Type | Number of Properties | Square Feet | Acquisition Price | Disposition Price | Net Book Value | |||||||||||||||||||||||||||
| Retail | 1 | 6 | $ | 2,506 | $ | 1,512 | $ | 1,757 | ||||||||||||||||||||||||
| Industrial | 10 | 410 | 40,908 | 36,561 | 26,630 | |||||||||||||||||||||||||||
| Other | 1 | 9 | 1,791 | 650 | 1,938 | |||||||||||||||||||||||||||
| Total Properties | 12 | 425 | 45,205 | 38,723 | 30,325 | |||||||||||||||||||||||||||
| Weighted average cash cap rate | 7.0 | % | ||||||||||||||||||||||||||||||
| Q4 2025 | ||||||||||||||||||||||||||||||||
| Property Type | Number of Properties | Square Feet | Acquisition Price | Disposition Price | Net Book Value | |||||||||||||||||||||||||||
| Retail | 2 | 9 | $ | 6,008 | $ | 3,134 | $ | 2,045 | ||||||||||||||||||||||||
| Industrial | 3 | 316 | 47,614 | 33,763 | 26,688 | |||||||||||||||||||||||||||
| Total Properties | 5 | 325 | 53,622 | 36,897 | 28,733 | |||||||||||||||||||||||||||
| Weighted average cash cap rate | 6.5 | % | ||||||||||||||||||||||||||||||
| YTD 2025 | ||||||||||||||||||||||||||||||||
| Property Type | Number of Properties | Square Feet | Acquisition Price | Disposition Price | Net Book Value | |||||||||||||||||||||||||||
| Retail | 9 | 46 | $ | 22,234 | $ | 12,194 | $ | 12,956 | ||||||||||||||||||||||||
| Industrial | 13 | 726 | 88,522 | 70,324 | 53,318 | |||||||||||||||||||||||||||
| Other | 6 | 106 | 38,112 | 13,585 | 19,213 | |||||||||||||||||||||||||||
| Total Properties | 28 | 878 | $ | 148,868 | $ | 96,103 | $ | 85,487 | ||||||||||||||||||||||||
| Weighted average cash cap rate | 7.3 | % | ||||||||||||||||||||||||||||||
BROADSTONE NET LEASE, INC. | www.broadstone.com | © 2026 Broadstone Net Lease, LLC. All rights reserved. | 23 | |||||||
| December 31, 2025 | September 30, 2025 | June 30, 2025 | March 31, 2025 | December 31, 2024 | ||||||||||||||||||||||||||||
| Properties | 771 | 759 | 766 | 769 | 765 | |||||||||||||||||||||||||||
| U.S. States | 44 | 44 | 44 | 44 | 44 | |||||||||||||||||||||||||||
| Canadian Provinces | 4 | 4 | 4 | 4 | 4 | |||||||||||||||||||||||||||
| Total annualized base rent | $428.8 | M | $412.9 | M | $404.2 | M | $401.3 | M | $395.5 | M | ||||||||||||||||||||||
| Total rentable square footage (“SF”) | 41.6 | M | 40.7 | M | 40.1 | M | 39.8 | M | 39.4 | M | ||||||||||||||||||||||
| Tenants | 206 | 204 | 205 | 204 | 202 | |||||||||||||||||||||||||||
| Brands | 197 | 195 | 195 | 192 | 190 | |||||||||||||||||||||||||||
| Industries | 57 | 56 | 56 | 55 | 55 | |||||||||||||||||||||||||||
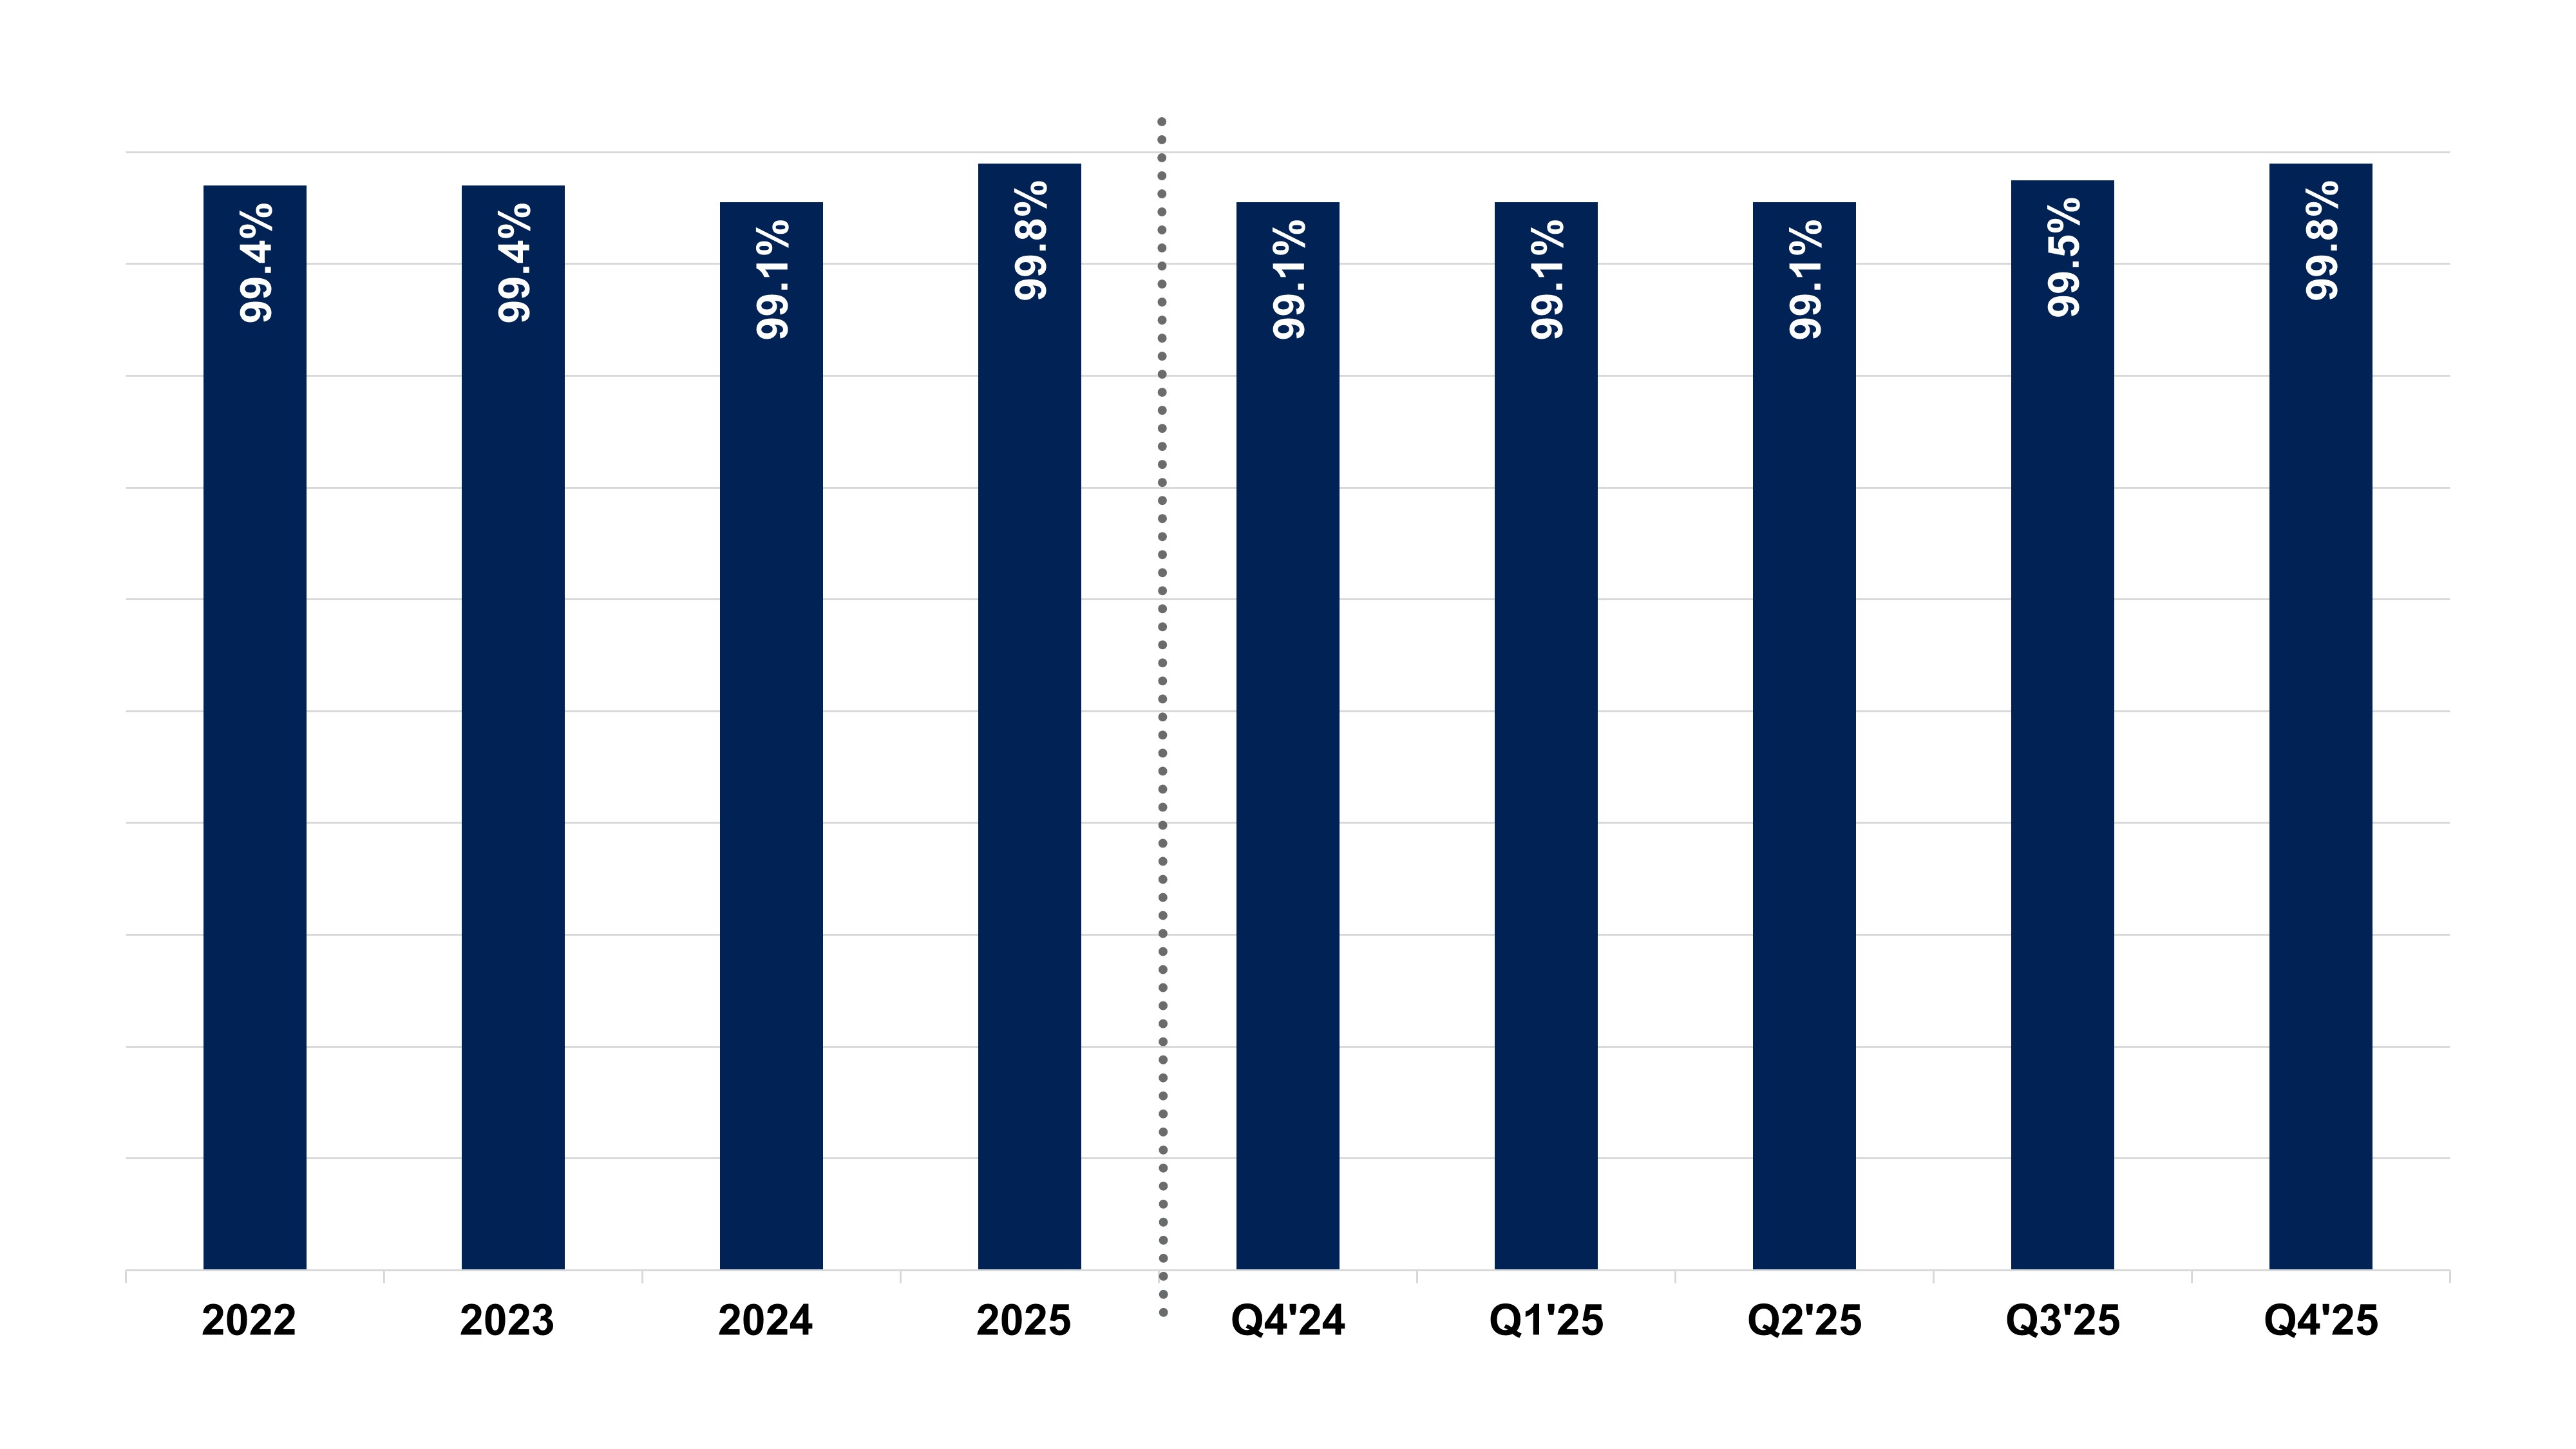
| Occupancy (based on SF) | 99.8 | % | 99.5 | % | 99.1 | % | 99.1 | % | 99.1 | % | ||||||||||||||||||||||
| Rent Collection | 100.0 | % | 100.0 | % | 99.6 | % | 99.1 | % | 99.2 | % | ||||||||||||||||||||||
| Top 10 tenant concentration | 21.1 | % | 21.3 | % | 21.8 | % | 21.9 | % | 21.9 | % | ||||||||||||||||||||||
| Top 20 tenant concentration | 34.3 | % | 34.7 | % | 35.2 | % | 35.3 | % | 35.5 | % | ||||||||||||||||||||||
Investment grade (tenant/guarantor) (b) | 20.2 | % | 20.9 | % | 20.7 | % | 20.1 | % | 20.2 | % | ||||||||||||||||||||||
Financial reporting coverage (c) | 95.4 | % | 96.6 | % | 92.4 | % | 94.1 | % | 94.2 | % | ||||||||||||||||||||||
| Rent coverage ratio (restaurants only) | 3.2x | 3.2x | 3.3x | 3.2x | 3.3x | |||||||||||||||||||||||||||
| Weighted average annual rent increases | 2.1 | % | 2.0 | % | 2.0 | % | 2.0 | % | 2.0 | % | ||||||||||||||||||||||
| Weighted average remaining lease term | 9.6 years | 9.5 years | 9.7 years | 10.0 years | 10.2 years | |||||||||||||||||||||||||||
| Master leases (based on ABR) | ||||||||||||||||||||||||||||||||
| Total portfolio | 38.6 | % | 39.0 | % | 40.1 | % | 40.9 | % | 41.4 | % | ||||||||||||||||||||||
| Multi-site tenants | 64.9 | % | 66.5 | % | 68.3 | % | 68.7 | % | 69.1 | % | ||||||||||||||||||||||
BROADSTONE NET LEASE, INC. | www.broadstone.com | © 2026 Broadstone Net Lease, LLC. All rights reserved. | 24 | |||||||
| Tenant | Property Type | # of Properties | ABR (’000s) | ABR as a % of Total Portfolio | Square Feet (’000s) | SF as a % of Total Portfolio | ||||||||||||||||||||||||||||||||
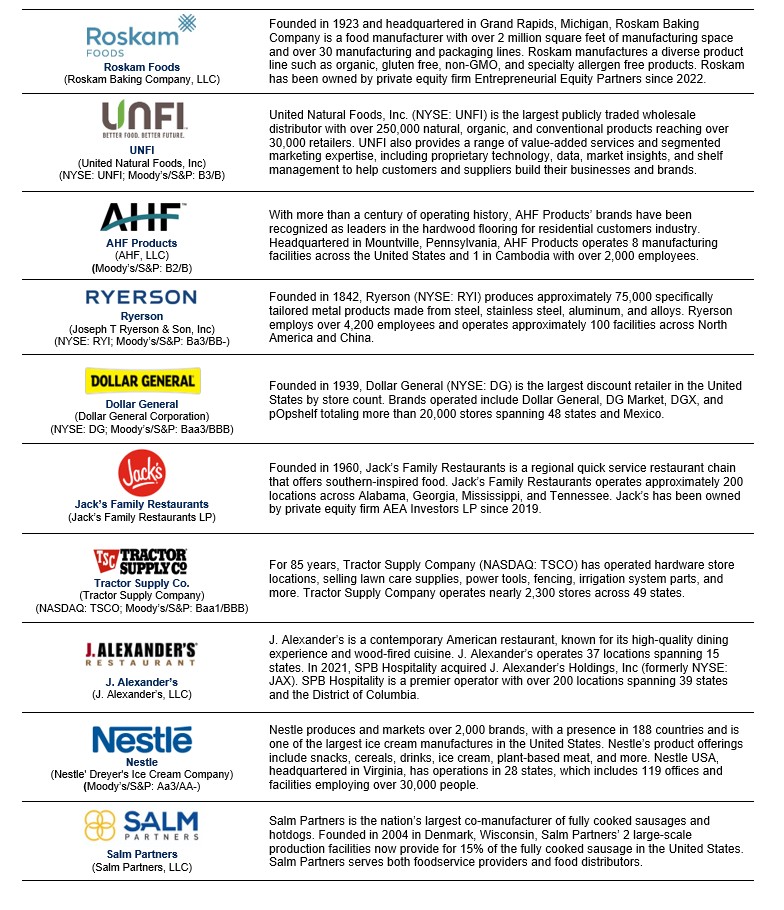
| Roskam Baking Company, LLC* | Food Processing | 7 | $ | 16,560 | 3.9 | % | 2,250 | 5.4 | % | |||||||||||||||||||||||||||||
| United Natural Foods, Inc. | Distribution & Warehouse | 1 | 14,746 | 3.4 | % | 1,016 | 2.5 | % | ||||||||||||||||||||||||||||||
| AHF, LLC* | Distribution & Warehouse/Manufacturing | 8 | 9,853 | 2.3 | % | 2,284 | 5.5 | % | ||||||||||||||||||||||||||||||
| Joseph T. Ryerson & Son, Inc | Distribution & Warehouse | 11 | 8,116 | 1.9 | % | 1,599 | 3.8 | % | ||||||||||||||||||||||||||||||
| Dollar General Corporation | General Merchandise | 74 | 7,835 | 1.8 | % | 717 | 1.7 | % | ||||||||||||||||||||||||||||||
| Jack’s Family Restaurants LP* | Quick Service Restaurants | 43 | 7,757 | 1.8 | % | 147 | 0.4 | % | ||||||||||||||||||||||||||||||
| Tractor Supply Company | General Merchandise | 23 | 6,525 | 1.5 | % | 462 | 1.1 | % | ||||||||||||||||||||||||||||||
J. Alexander’s Tractor Supply Company’s, LLC* | Casual Dining | 16 | 6,395 | 1.5 | % | 131 | 0.3 | % | ||||||||||||||||||||||||||||||
Nestle’ Dreyer’s Ice Cream Company | Cold Storage/Food Processing | 2 | 6,329 | 1.5 | % | 503 | 1.2 | % | ||||||||||||||||||||||||||||||
| Salm Partners, LLC* | Food Processing | 2 | 6,276 | 1.5 | % | 426 | 1.0 | % | ||||||||||||||||||||||||||||||
| Total Top 10 Tenants | 187 | $ | 90,392 | 21.1 | % | 9,535 | 22.9 | % | ||||||||||||||||||||||||||||||
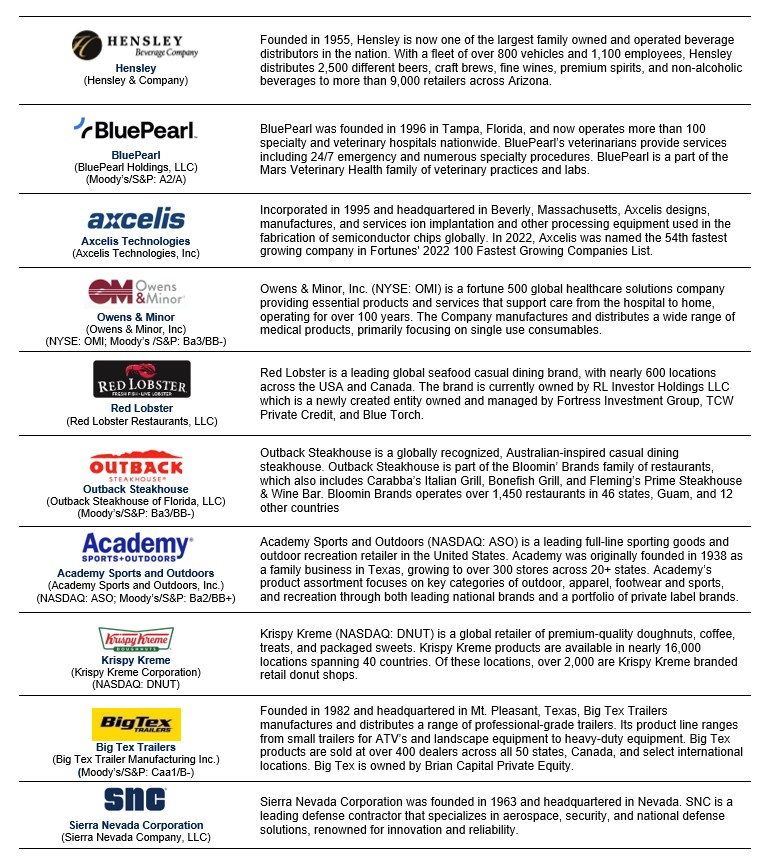
| Hensley & Company* | Distribution & Warehouse | 3 | $ | 6,231 | 1.5 | % | 577 | 1.4 | % | |||||||||||||||||||||||||||||
| BluePearl Holdings, LLC** | Animal Services | 13 | 6,004 | 1.4 | % | 159 | 0.4 | % | ||||||||||||||||||||||||||||||
| Axcelis Technologies, Inc. | Flex and R&D | 1 | 5,900 | 1.4 | % | 418 | 1.0 | % | ||||||||||||||||||||||||||||||
| Owens & Minor | Distribution & Warehouse | 2 | 5,785 | 1.3 | % | 523 | 1.3 | % | ||||||||||||||||||||||||||||||
| Red Lobster Hospitality & Red Lobster Restaurants LLC* | Casual Dining | 18 | 5,674 | 1.3 | % | 147 | 0.3 | % | ||||||||||||||||||||||||||||||
Outback Steakhouse of Florida, LLC*(a) | Casual Dining | 22 | 5,636 | 1.3 | % | 140 | 0.3 | % | ||||||||||||||||||||||||||||||
| Academy LTD | General Merchandise | 8 | 5,600 | 1.3 | % | 535 | 1.3 | % | ||||||||||||||||||||||||||||||
| Krispy Kreme Doughnut Corporation | Quick Service Restaurants/ Food Processing | 27 | 5,537 | 1.3 | % | 156 | 0.4 | % | ||||||||||||||||||||||||||||||
Big Tex Trailer Manufacturing, Inc.* | Automotive/Distribution & Warehouse/Manufacturing/Office | 17 | 5,260 | 1.2 | % | 1,301 | 3.1 | % | ||||||||||||||||||||||||||||||
| Sierra Nevada Corporation | Manufacturing | 3 | 5,094 | 1.2 | % | 159 | 0.4 | % | ||||||||||||||||||||||||||||||
| Total Top 20 Tenants | 301 | $ | 147,113 | 34.3 | % | 13,650 | 32.8 | % | ||||||||||||||||||||||||||||||
BROADSTONE NET LEASE, INC. | www.broadstone.com | © 2026 Broadstone Net Lease, LLC. All rights reserved. | 25 | |||||||
BROADSTONE NET LEASE, INC. | www.broadstone.com | © 2026 Broadstone Net Lease, LLC. All rights reserved. | 26 | |||||||
BROADSTONE NET LEASE, INC. | www.broadstone.com | © 2026 Broadstone Net Lease, LLC. All rights reserved. | 27 | |||||||
BROADSTONE NET LEASE, INC. | www.broadstone.com | © 2026 Broadstone Net Lease, LLC. All rights reserved. | 28 | |||||||
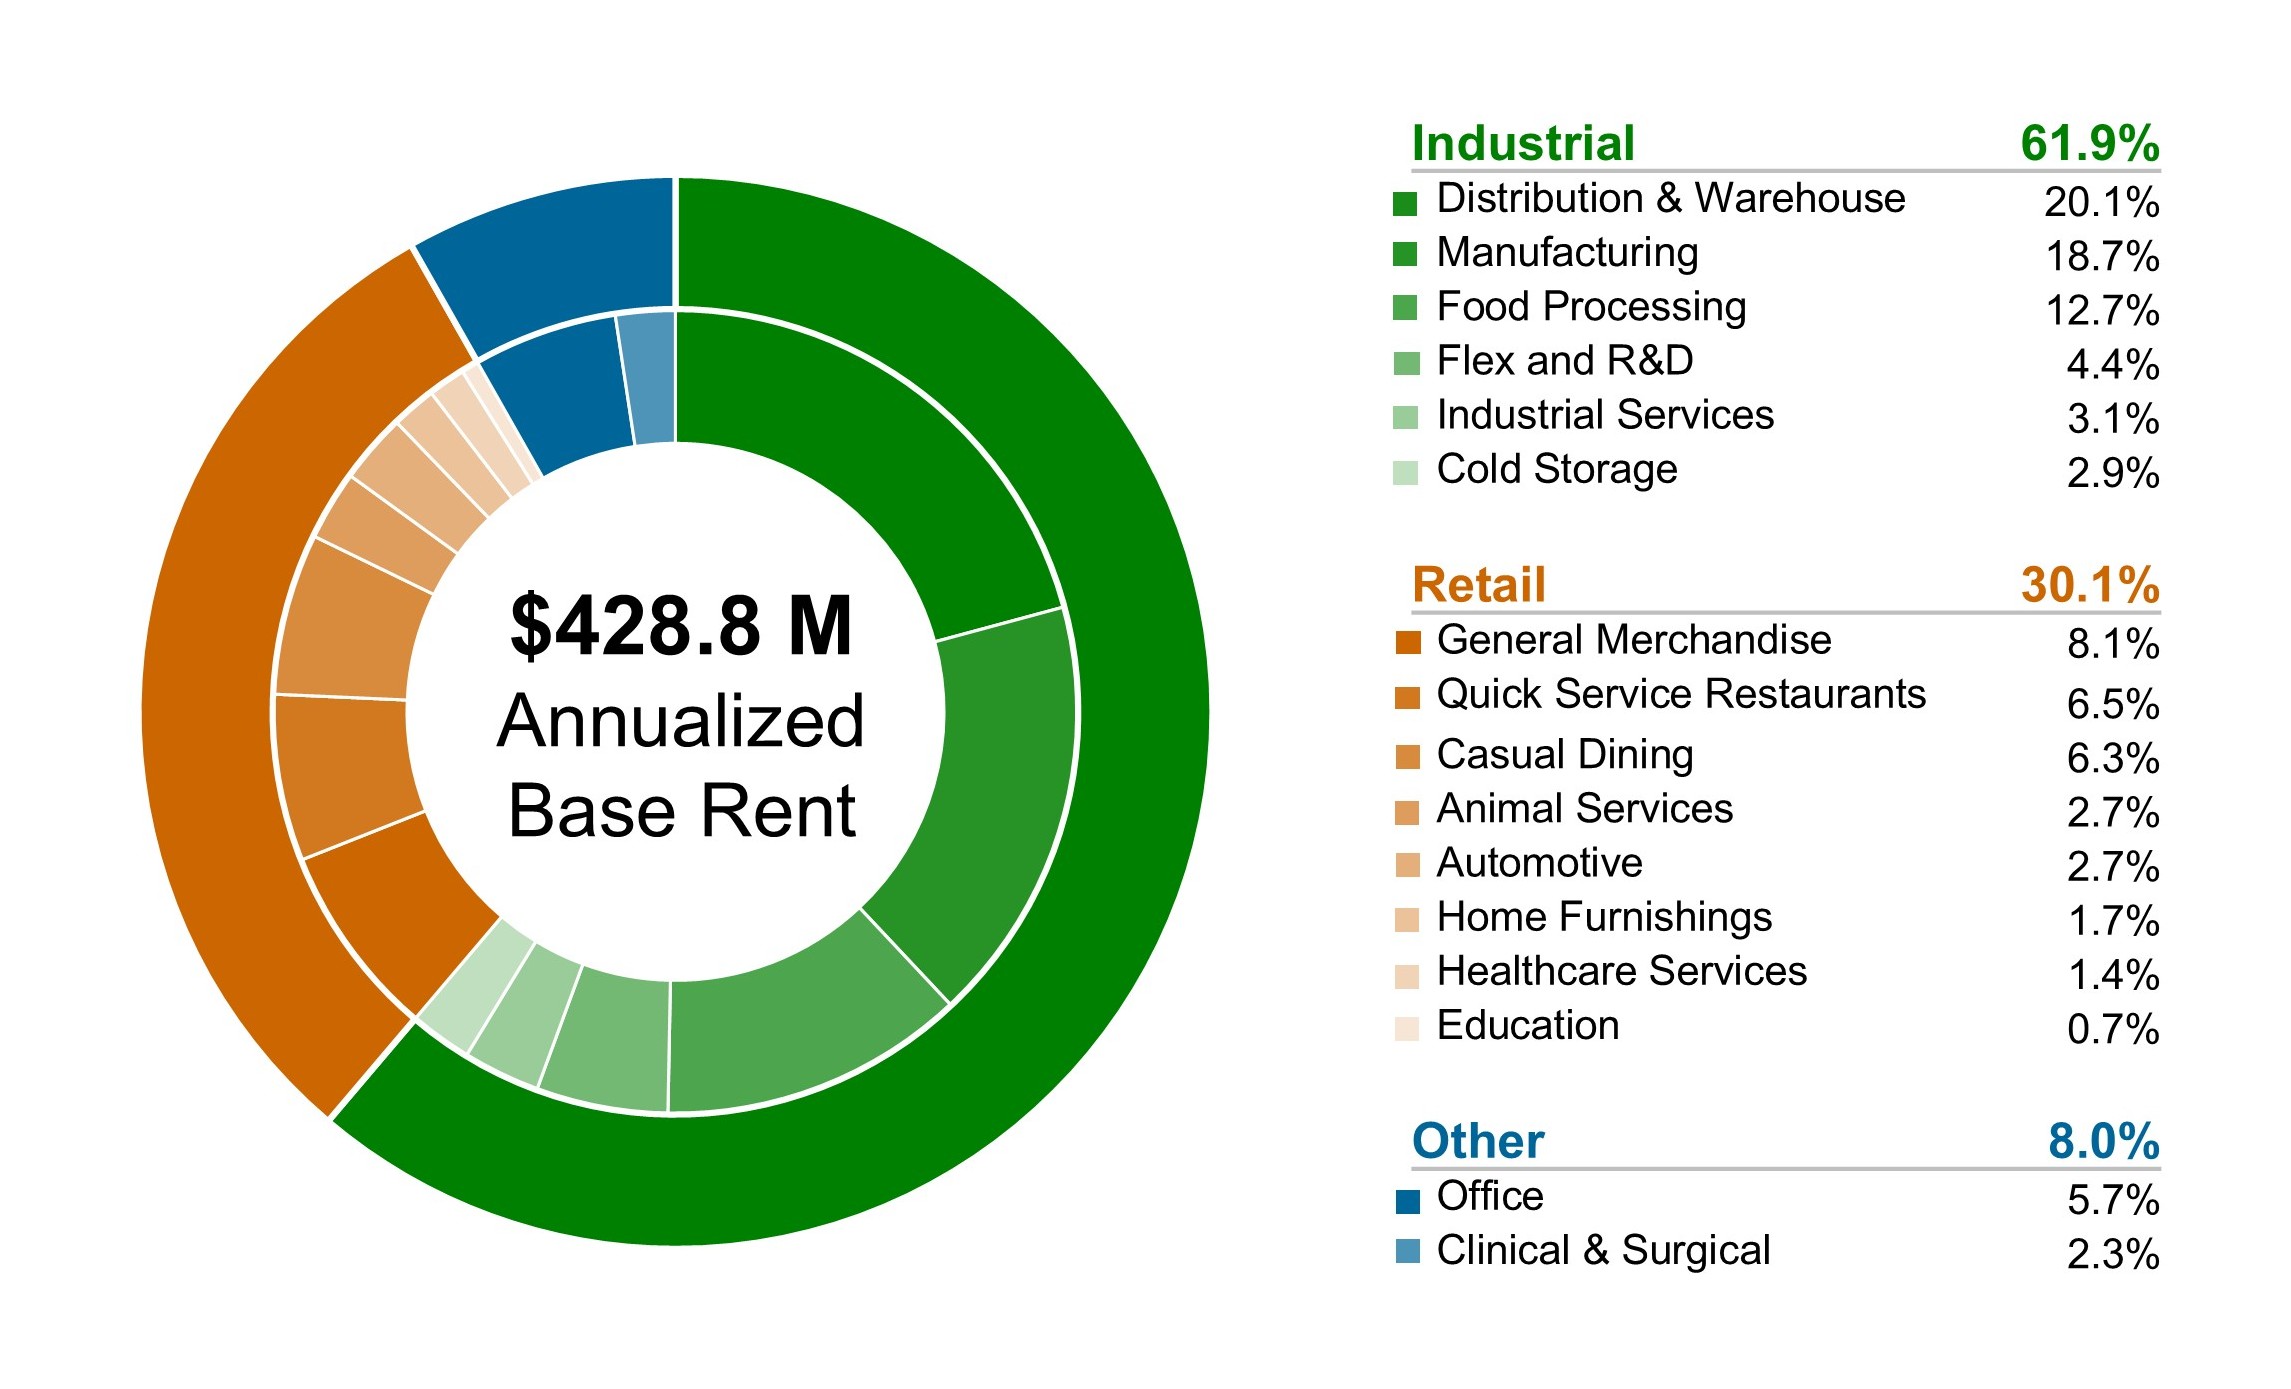
| Property Type | # of Properties | ABR (’000s) | ABR as a % of Total Portfolio | Square Feet (’000s) | SF as a % of Total Portfolio | |||||||||||||||||||||||||||
| Industrial | ||||||||||||||||||||||||||||||||
| Distribution & Warehouse | 53 | $ | 86,341 | 20.1 | % | 12,058 | 29.0 | % | ||||||||||||||||||||||||
| Manufacturing | 81 | 80,171 | 18.7 | % | 12,843 | 30.9 | % | |||||||||||||||||||||||||
| Food Processing | 36 | 54,363 | 12.7 | % | 6,050 | 14.5 | % | |||||||||||||||||||||||||
| Flex and R&D | 8 | 19,069 | 4.4 | % | 1,394 | 3.4 | % | |||||||||||||||||||||||||
| Industrial Services | 21 | 13,093 | 3.1 | % | 529 | 1.3 | % | |||||||||||||||||||||||||
| Cold Storage | 4 | 12,441 | 2.9 | % | 874 | 2.1 | % | |||||||||||||||||||||||||
| In-Process Development | 5 | — | — | % | — | — | % | |||||||||||||||||||||||||
| Untenanted | — | — | — | % | 55 | 0.1 | % | |||||||||||||||||||||||||
| Industrial Total | 208 | 265,478 | 61.9 | % | 33,803 | 81.3 | % | |||||||||||||||||||||||||
| Retail | ||||||||||||||||||||||||||||||||
| General Merchandise | 156 | 34,884 | 8.1 | % | 2,645 | 6.4 | % | |||||||||||||||||||||||||
| Quick Service Restaurants | 154 | 27,846 | 6.5 | % | 516 | 1.3 | % | |||||||||||||||||||||||||
| Casual Dining | 95 | 26,934 | 6.3 | % | 637 | 1.5 | % | |||||||||||||||||||||||||
| Animal Services | 27 | 11,605 | 2.7 | % | 421 | 1.0 | % | |||||||||||||||||||||||||
| Automotive | 63 | 11,413 | 2.7 | % | 755 | 1.8 | % | |||||||||||||||||||||||||
| Home Furnishings | 13 | 7,510 | 1.7 | % | 797 | 1.9 | % | |||||||||||||||||||||||||
| Healthcare Services | 18 | 6,094 | 1.4 | % | 220 | 0.5 | % | |||||||||||||||||||||||||
| Education | 4 | 2,952 | 0.7 | % | 119 | 0.3 | % | |||||||||||||||||||||||||
| In-Process Development | 3 | — | — | % | — | — | % | |||||||||||||||||||||||||
| Untenanted | 1 | — | — | % | 10 | — | % | |||||||||||||||||||||||||
| Retail Total | 534 | 129,238 | 30.1 | % | 6,120 | 14.7 | % | |||||||||||||||||||||||||
| Other | ||||||||||||||||||||||||||||||||
| Office | 14 | 24,162 | 5.7 | % | 1,311 | 3.2 | % | |||||||||||||||||||||||||
| Clinical & Surgical | 15 | 9,967 | 2.3 | % | 327 | 0.8 | % | |||||||||||||||||||||||||
| Other Total | 29 | 34,129 | 8.0 | % | 1,638 | 4.0 | % | |||||||||||||||||||||||||
| Total | 771 | $ | 428,845 | 100.0 | % | 41,561 | 100.0 | % | ||||||||||||||||||||||||
BROADSTONE NET LEASE, INC. | www.broadstone.com | © 2026 Broadstone Net Lease, LLC. All rights reserved. | 29 | |||||||
| Q4 2025 | Q3 2025 | Q2 2025 | Q1 2025 | Q4 2024 | |||||||||||||||||||||||||
| Industrial | |||||||||||||||||||||||||||||
| Number of properties | 208 | 207 | 215 | 211 | 210 | ||||||||||||||||||||||||
| Square feet (000s) | 33,803 | 33,081 | 32,694 | 32,231 | 31,898 | ||||||||||||||||||||||||
| Weighted average lease term (years) | 10.5 | 10.3 | 10.5 | 10.7 | 11.0 | ||||||||||||||||||||||||
| Weighted average annual rent escalation | 2.2 | % | 2.2 | % | 2.1 | % | 2.2 | % | 2.1 | % | |||||||||||||||||||
| Percentage of total ABR | 61.9 | % | 61.2 | % | 60.7 | % | 59.8 | % | 59.6 | % | |||||||||||||||||||
| Retail | |||||||||||||||||||||||||||||
| Number of properties | 534 | 523 | 521 | 526 | 520 | ||||||||||||||||||||||||
| Square feet (000s) | 6,120 | 5,934 | 5,790 | 5,820 | 5,712 | ||||||||||||||||||||||||
| Weighted average lease term (years) | 9.4 | 9.5 | 9.8 | 10.0 | 10.2 | ||||||||||||||||||||||||
| Weighted average annual rent escalation | 1.7 | % | 1.7 | % | 1.7 | % | 1.7 | % | 1.7 | % | |||||||||||||||||||
| Percentage of total ABR | 30.1 | % | 30.6 | % | 31.0 | % | 31.3 | % | 31.2 | % | |||||||||||||||||||
| Other | |||||||||||||||||||||||||||||
| Number of properties | 29 | 29 | 30 | 32 | 35 | ||||||||||||||||||||||||
| Square feet (000s) | 1,638 | 1,638 | 1,647 | 1,714 | 1,744 | ||||||||||||||||||||||||
| Weighted average lease term (years) | 3.8 | 4.1 | 4.2 | 4.8 | 5.0 | ||||||||||||||||||||||||
| Weighted average annual rent escalation | 2.4 | % | 2.4 | % | 2.4 | % | 2.4 | % | 2.4 | % | |||||||||||||||||||
| Percentage of total ABR | 8.0 | % | 8.2 | % | 8.3 | % | 8.9 | % | 9.2 | % | |||||||||||||||||||
BROADSTONE NET LEASE, INC. | www.broadstone.com | © 2026 Broadstone Net Lease, LLC. All rights reserved. | 30 | |||||||
| Tenant Industry | # of Properties | ABR (’000s) | ABR as a % of Total Portfolio | Square Feet (’000s) | SF as a % of Total Portfolio | |||||||||||||||||||||||||||
| Packaged Foods & Meats | 39 | $ | 57,234 | 13.3 | % | 6,339 | 15.3 | % | ||||||||||||||||||||||||
| Restaurants | 252 | 55,623 | 13.0 | % | 1,196 | 2.9 | % | |||||||||||||||||||||||||
| Food Distributors | 7 | 28,409 | 6.6 | % | 2,534 | 6.1 | % | |||||||||||||||||||||||||
| Specialty Stores | 42 | 22,276 | 5.2 | % | 1,932 | 4.6 | % | |||||||||||||||||||||||||
| Distributors | 28 | 22,028 | 5.1 | % | 3,357 | 8.1 | % | |||||||||||||||||||||||||
| Healthcare Facilities | 42 | 21,572 | 5.0 | % | 748 | 1.8 | % | |||||||||||||||||||||||||
| Auto Parts & Equipment | 38 | 19,071 | 4.5 | % | 2,971 | 7.1 | % | |||||||||||||||||||||||||
| Home Furnishing Retail | 17 | 12,502 | 2.9 | % | 1,692 | 4.1 | % | |||||||||||||||||||||||||
| General Merchandise Stores | 110 | 11,666 | 2.7 | % | 1,035 | 2.5 | % | |||||||||||||||||||||||||
| Specialized Consumer Services | 44 | 11,539 | 2.7 | % | 707 | 1.7 | % | |||||||||||||||||||||||||
| Metal & Glass Containers | 8 | 10,933 | 2.6 | % | 2,206 | 5.3 | % | |||||||||||||||||||||||||
| Healthcare Services | 17 | 10,868 | 2.6 | % | 568 | 1.3 | % | |||||||||||||||||||||||||
| Aerospace & Defense | 6 | 10,287 | 2.4 | % | 574 | 1.4 | % | |||||||||||||||||||||||||
| Industrial Machinery | 19 | 9,987 | 2.3 | % | 1,901 | 4.6 | % | |||||||||||||||||||||||||
| Forest Products | 8 | 9,853 | 2.3 | % | 2,284 | 5.5 | % | |||||||||||||||||||||||||
Other (42 industries) | 93 | 114,997 | 26.8 | % | 11,452 | 27.5 | % | |||||||||||||||||||||||||
| Untenanted properties | 1 | — | — | % | 65 | 0.2 | % | |||||||||||||||||||||||||
| Total | 771 | $ | 428,845 | 100.0 | % | 41,561 | 100.0 | % | ||||||||||||||||||||||||
BROADSTONE NET LEASE, INC. | www.broadstone.com | © 2026 Broadstone Net Lease, LLC. All rights reserved. | 31 | |||||||
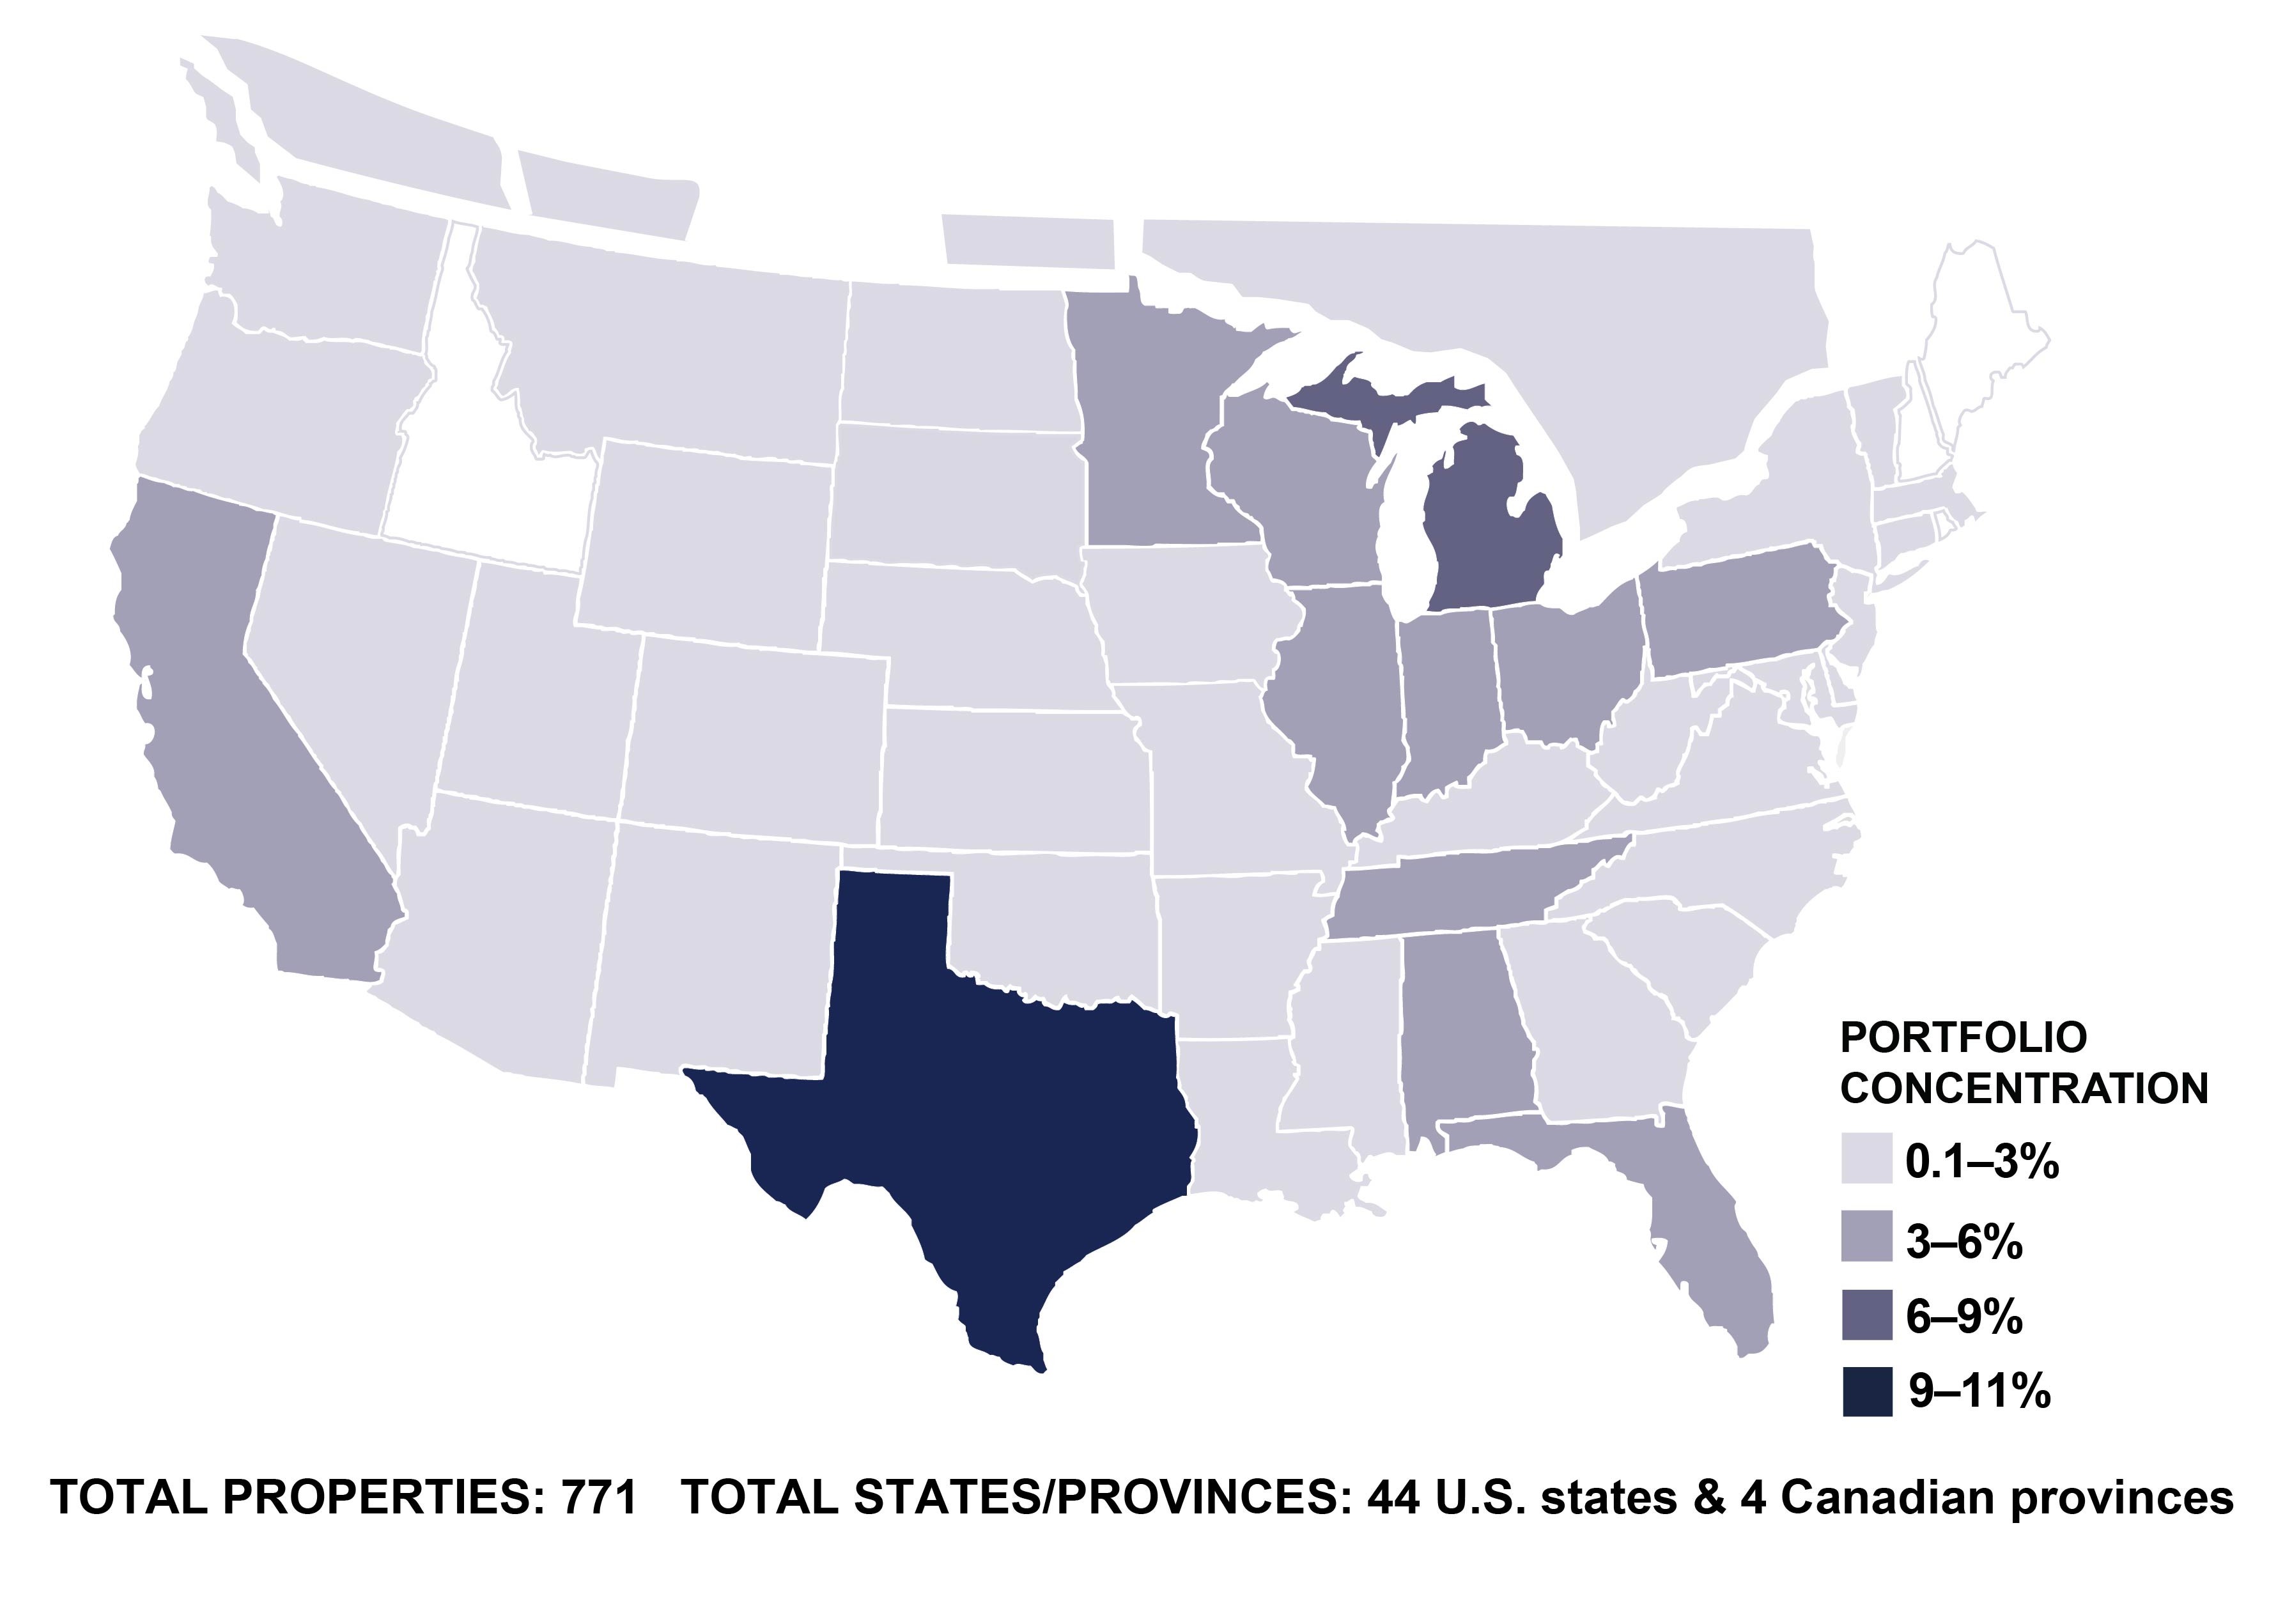
| State / Province | # of Properties | ABR (’000s) | ABR as a % of Total Portfolio | Square Feet (’000s) | SF as a % of Total Portfolio | State / Province | # of Properties | ABR (’000s) | ABR as a % of Total Portfolio | Square Feet (’000s) | SF as a % of Total Portfolio | ||||||||||||||||||||||||||||||||||||||||||||||||||||||||||||
| TX | 69 | $ | 43,680 | 10.2 | % | 4,090 | 9.8 | % | MS | 12 | $ | 4,184 | 1.0 | % | 607 | 1.5 | % | ||||||||||||||||||||||||||||||||||||||||||||||||||||||
| MI | 51 | 36,973 | 8.6 | % | 4,009 | 9.7 | % | LA | 5 | 3,837 | 0.9 | % | 211 | 0.5 | % | ||||||||||||||||||||||||||||||||||||||||||||||||||||||||
| FL | 28 | 25,466 | 5.9 | % | 1,549 | 3.7 | % | NE | 6 | 3,438 | 0.8 | % | 492 | 1.2 | % | ||||||||||||||||||||||||||||||||||||||||||||||||||||||||
| IL | 29 | 23,334 | 5.4 | % | 2,364 | 5.7 | % | SC | 13 | 3,404 | 0.8 | % | 304 | 0.7 | % | ||||||||||||||||||||||||||||||||||||||||||||||||||||||||
| CA | 16 | 22,714 | 5.3 | % | 2,215 | 5.3 | % | NJ | 2 | 3,404 | 0.8 | % | 266 | 0.6 | % | ||||||||||||||||||||||||||||||||||||||||||||||||||||||||
| WI | 25 | 22,109 | 5.2 | % | 2,223 | 5.4 | % | WA | 14 | 3,388 | 0.8 | % | 147 | 0.4 | % | ||||||||||||||||||||||||||||||||||||||||||||||||||||||||
| OH | 49 | 21,025 | 4.9 | % | 1,712 | 4.1 | % | IA | 4 | 2,938 | 0.7 | % | 622 | 1.5 | % | ||||||||||||||||||||||||||||||||||||||||||||||||||||||||
| MN | 21 | 20,226 | 4.7 | % | 3,051 | 7.3 | % | UT | 3 | 2,810 | 0.6 | % | 280 | 0.7 | % | ||||||||||||||||||||||||||||||||||||||||||||||||||||||||
| PA | 33 | 16,425 | 3.8 | % | 2,305 | 5.5 | % | NM | 9 | 2,795 | 0.6 | % | 107 | 0.3 | % | ||||||||||||||||||||||||||||||||||||||||||||||||||||||||
| TN | 48 | 15,427 | 3.6 | % | 1,084 | 2.6 | % | CO | 4 | 2,633 | 0.6 | % | 126 | 0.3 | % | ||||||||||||||||||||||||||||||||||||||||||||||||||||||||
| IN | 27 | 14,360 | 3.3 | % | 1,687 | 4.1 | % | MD | 3 | 2,167 | 0.5 | % | 205 | 0.5 | % | ||||||||||||||||||||||||||||||||||||||||||||||||||||||||
| AL | 53 | 13,189 | 3.1 | % | 950 | 2.3 | % | CT | 2 | 1,945 | 0.5 | % | 55 | 0.1 | % | ||||||||||||||||||||||||||||||||||||||||||||||||||||||||
| GA | 35 | 12,250 | 2.9 | % | 1,576 | 3.8 | % | MT | 7 | 1,728 | 0.4 | % | 43 | 0.1 | % | ||||||||||||||||||||||||||||||||||||||||||||||||||||||||
| NC | 26 | 9,989 | 2.3 | % | 961 | 2.3 | % | DE | 4 | 1,175 | 0.3 | % | 133 | 0.3 | % | ||||||||||||||||||||||||||||||||||||||||||||||||||||||||
| KY | 23 | 9,338 | 2.2 | % | 927 | 2.2 | % | ND | 2 | 1,073 | 0.3 | % | 24 | 0.1 | % | ||||||||||||||||||||||||||||||||||||||||||||||||||||||||
| MO | 19 | 9,092 | 2.1 | % | 1,260 | 3.0 | % | VT | 2 | 439 | 0.1 | % | 24 | 0.1 | % | ||||||||||||||||||||||||||||||||||||||||||||||||||||||||
| WV | 18 | 8,986 | 2.1 | % | 1,232 | 3.0 | % | WY | 1 | 338 | 0.1 | % | 21 | 0.1 | % | ||||||||||||||||||||||||||||||||||||||||||||||||||||||||
| AZ | 7 | 8,956 | 2.1 | % | 747 | 1.8 | % | NV | 1 | 282 | 0.1 | % | 6 | 0.0 | % | ||||||||||||||||||||||||||||||||||||||||||||||||||||||||
| OK | 24 | 8,537 | 2.0 | % | 1,001 | 2.4 | % | OR | 1 | 136 | 0.0 | % | 9 | 0.0 | % | ||||||||||||||||||||||||||||||||||||||||||||||||||||||||
| AR | 10 | 7,771 | 1.8 | % | 340 | 0.8 | % | Total U.S. | 764 | $ | 420,655 | 98.1 | % | 41,131 | 99.0 | % | |||||||||||||||||||||||||||||||||||||||||||||||||||||||
| NY | 28 | 7,410 | 1.7 | % | 562 | 1.4 | % | BC | 2 | $ | 4,777 | 1.1 | % | 253 | 0.6 | % | |||||||||||||||||||||||||||||||||||||||||||||||||||||||
| MA | 3 | 6,338 | 1.5 | % | 443 | 1.1 | % | ON | 3 | 2,084 | 0.5 | % | 101 | 0.2 | % | ||||||||||||||||||||||||||||||||||||||||||||||||||||||||
| KS | 10 | 5,325 | 1.2 | % | 643 | 1.5 | % | AB | 1 | 979 | 0.2 | % | 51 | 0.1 | % | ||||||||||||||||||||||||||||||||||||||||||||||||||||||||
| VA | 15 | 5,095 | 1.2 | % | 178 | 0.4 | % | MB | 1 | 350 | 0.1 | % | 25 | 0.1 | % | ||||||||||||||||||||||||||||||||||||||||||||||||||||||||
| SD | 2 | 4,526 | 1.1 | % | 340 | 0.8 | % | Total Canada | 7 | $ | 8,190 | 1.9 | % | 430 | 1.0 | % | |||||||||||||||||||||||||||||||||||||||||||||||||||||||
| Grand Total | 771 | $ | 428,845 | 100.0 | % | 41,561 | 100.0 | % | |||||||||||||||||||||||||||||||||||||||||||||||||||||||||||||||
BROADSTONE NET LEASE, INC. | www.broadstone.com | © 2026 Broadstone Net Lease, LLC. All rights reserved. | 32 | |||||||
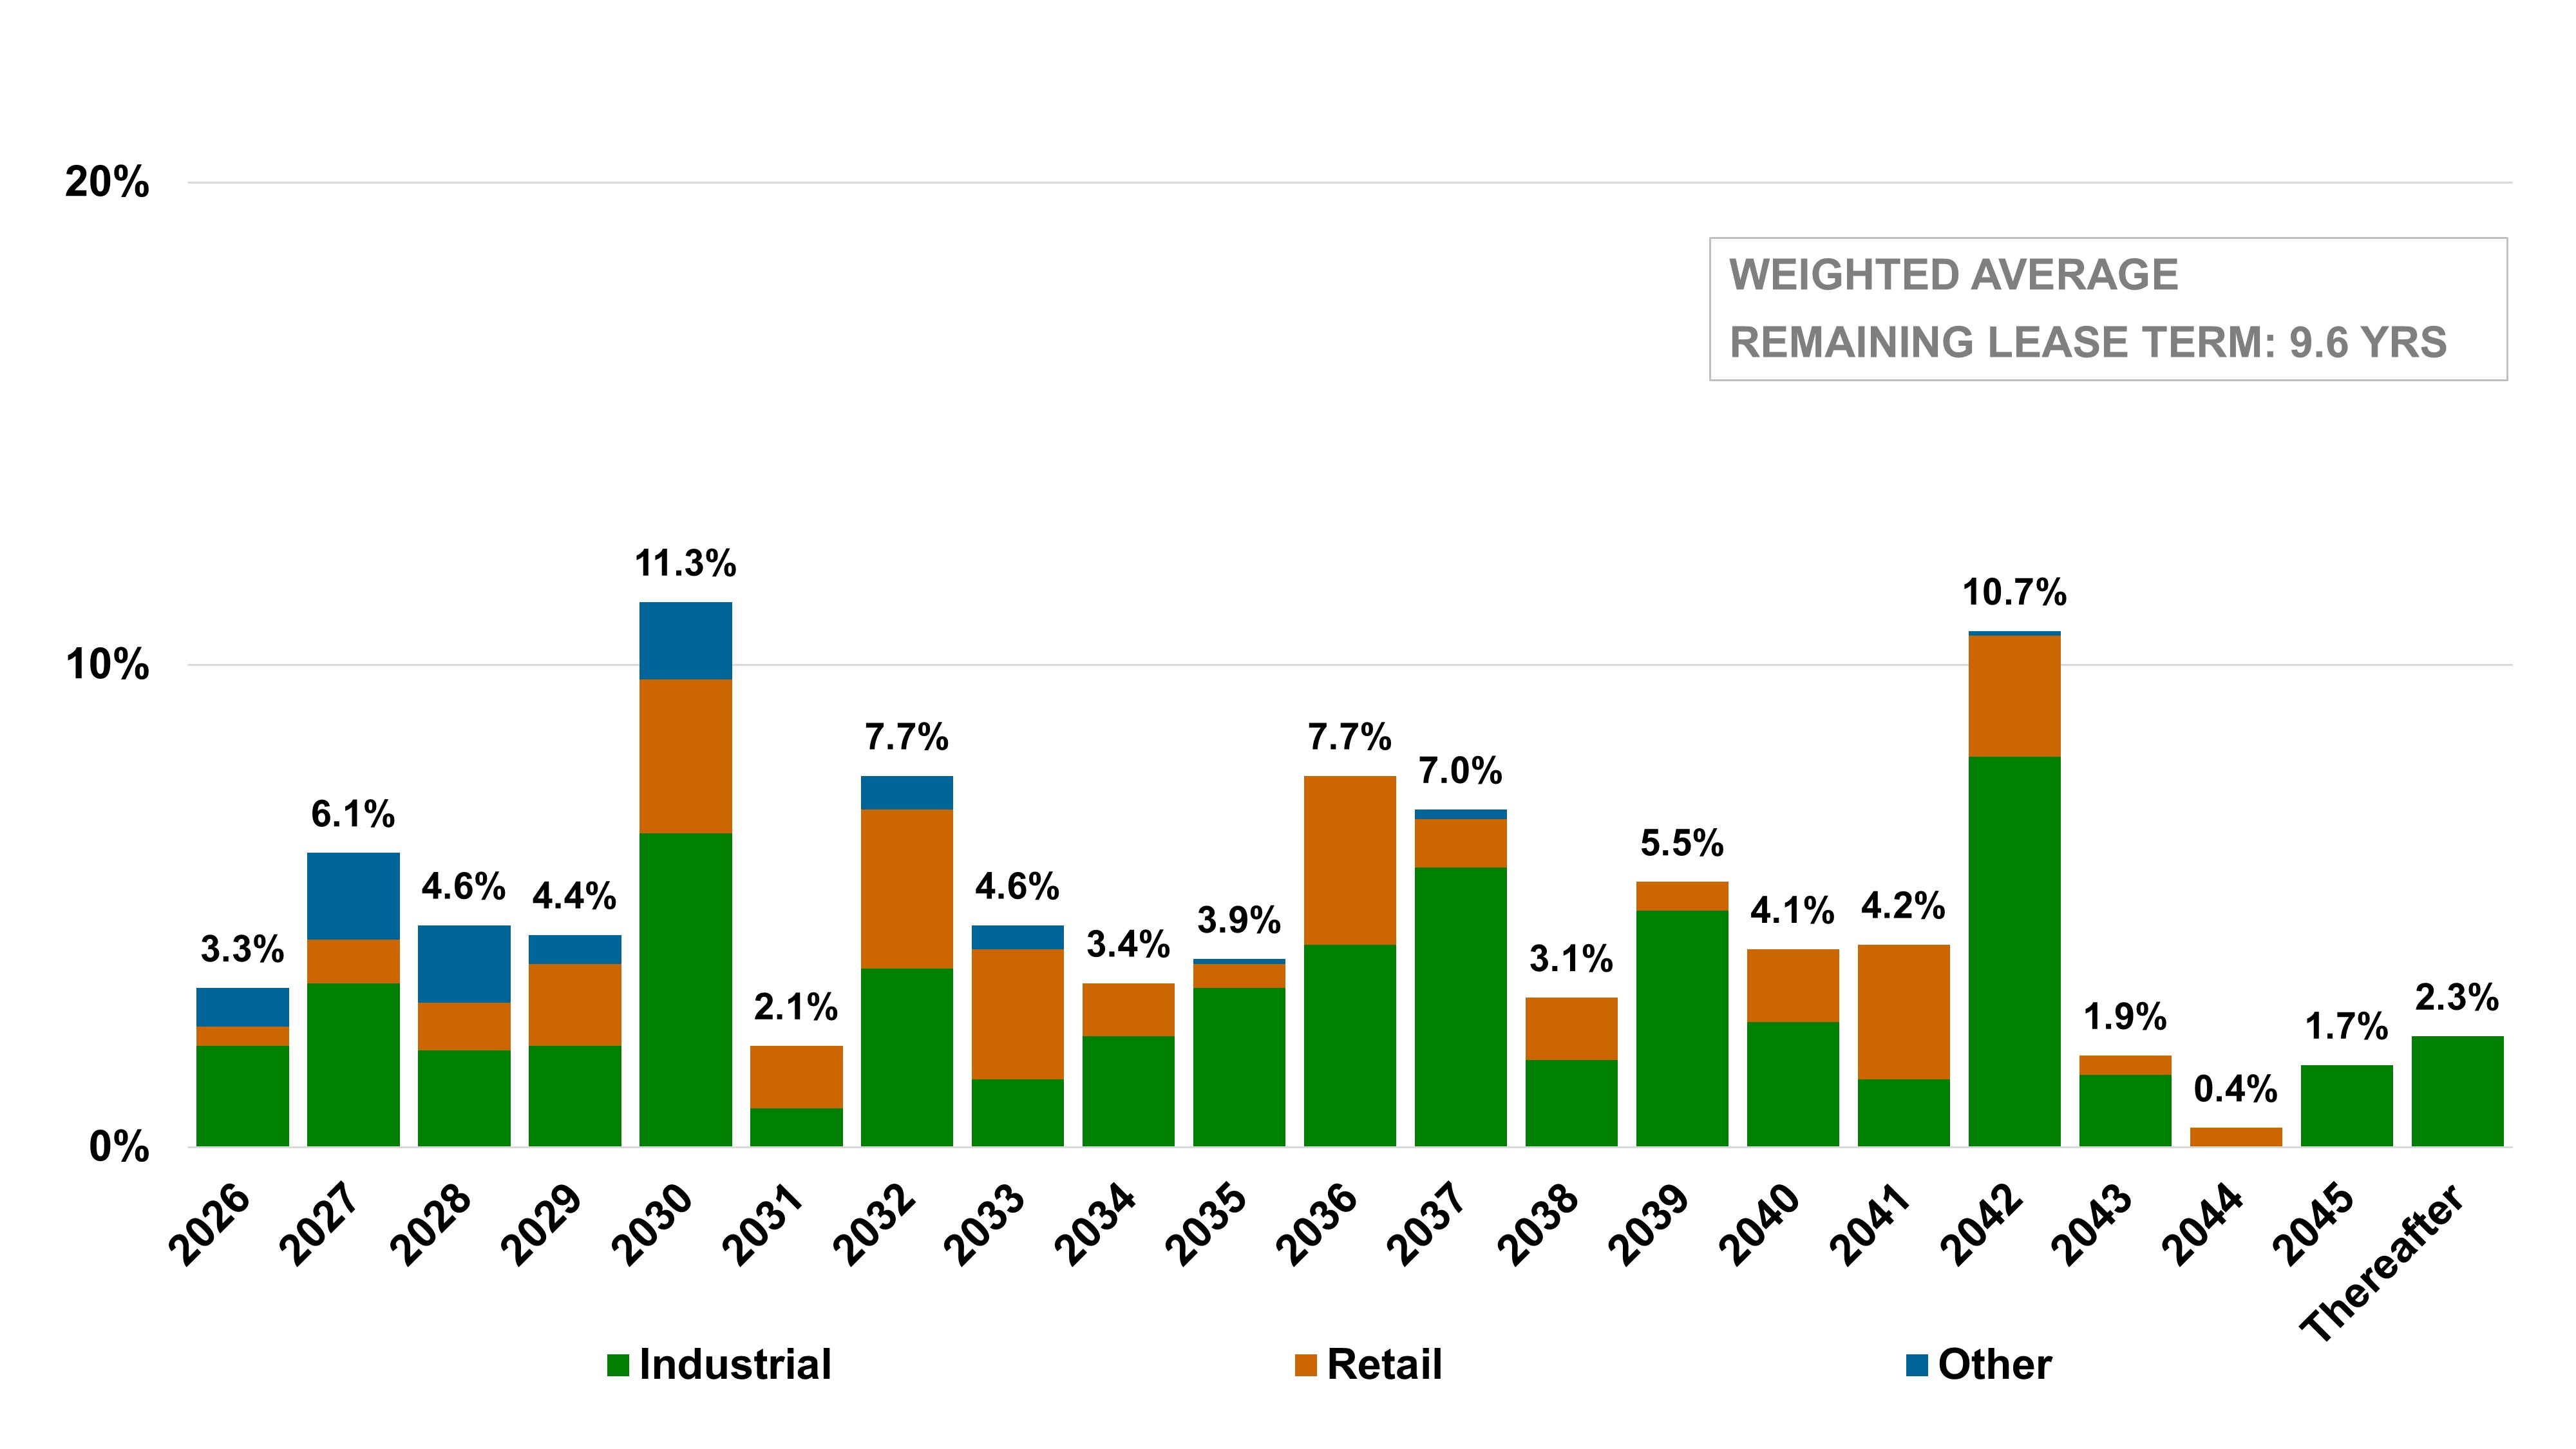
| Expiration Year | # of Properties | # of Leases | ABR (’000s) | ABR as a % of Total Portfolio | Square Feet (’000s) | SF as a % of Total Portfolio | ||||||||||||||||||||||||||||||||
| 2026 | 21 | 22 | $ | 13,978 | 3.3 | % | 1,306 | 3.1 | % | |||||||||||||||||||||||||||||
| 2027 | 28 | 29 | 26,072 | 6.1 | % | 2,248 | 5.4 | % | ||||||||||||||||||||||||||||||
| 2028 | 28 | 28 | 20,167 | 4.6 | % | 1,793 | 4.3 | % | ||||||||||||||||||||||||||||||
| 2029 | 60 | 35 | 18,558 | 4.4 | % | 2,587 | 6.2 | % | ||||||||||||||||||||||||||||||
| 2030 | 98 | 61 | 48,407 | 11.3 | % | 4,279 | 10.3 | % | ||||||||||||||||||||||||||||||
| 2031 | 34 | 29 | 8,964 | 2.1 | % | 872 | 2.1 | % | ||||||||||||||||||||||||||||||
| 2032 | 61 | 46 | 33,047 | 7.7 | % | 3,481 | 8.4 | % | ||||||||||||||||||||||||||||||
| 2033 | 50 | 24 | 19,888 | 4.6 | % | 1,495 | 3.6 | % | ||||||||||||||||||||||||||||||
| 2034 | 38 | 27 | 14,666 | 3.4 | % | 1,245 | 3.0 | % | ||||||||||||||||||||||||||||||
| 2035 | 22 | 17 | 16,853 | 3.9 | % | 2,219 | 5.3 | % | ||||||||||||||||||||||||||||||
| 2036 | 89 | 24 | 33,112 | 7.7 | % | 3,274 | 7.9 | % | ||||||||||||||||||||||||||||||
| 2037 | 23 | 13 | 29,601 | 7.0 | % | 2,786 | 6.7 | % | ||||||||||||||||||||||||||||||
| 2038 | 39 | 38 | 13,330 | 3.1 | % | 1,255 | 3.0 | % | ||||||||||||||||||||||||||||||
| 2039 | 21 | 17 | 23,886 | 5.5 | % | 1,869 | 4.5 | % | ||||||||||||||||||||||||||||||
| 2040 | 33 | 13 | 17,591 | 4.1 | % | 927 | 2.2 | % | ||||||||||||||||||||||||||||||
| 2041 | 40 | 9 | 18,147 | 4.2 | % | 1,453 | 3.5 | % | ||||||||||||||||||||||||||||||
| 2042 | 58 | 13 | 45,558 | 10.7 | % | 4,803 | 11.6 | % | ||||||||||||||||||||||||||||||
| 2043 | 3 | 2 | 8,050 | 1.9 | % | 517 | 1.2 | % | ||||||||||||||||||||||||||||||
| 2044 | 3 | 3 | 1,660 | 0.4 | % | 103 | 0.2 | % | ||||||||||||||||||||||||||||||
| 2045 | 4 | 3 | 7,320 | 1.7 | % | 698 | 1.7 | % | ||||||||||||||||||||||||||||||
| Thereafter | 9 | 2 | 9,990 | 2.3 | % | 2,286 | 5.6 | % | ||||||||||||||||||||||||||||||
| Total leased properties | 762 | 455 | 428,845 | 100.0 | % | 41,496 | 99.8 | % | ||||||||||||||||||||||||||||||
| In-process developments | 8 | 9 | — | — | % | — | — | % | ||||||||||||||||||||||||||||||
| Untenanted properties | 1 | — | — | — | % | 65 | 0.2 | % | ||||||||||||||||||||||||||||||
| Total properties | 771 | 464 | $ | 428,845 | 100.0 | % | 41,561 | 100.0 | % | |||||||||||||||||||||||||||||
BROADSTONE NET LEASE, INC. | www.broadstone.com | © 2026 Broadstone Net Lease, LLC. All rights reserved. | 33 | |||||||
| Number of properties | |||||
Vacant properties at January 1, 2025 | 2 | ||||
Lease expirations (a) | 2 | ||||
| Leasing activities | (2) | ||||
Vacant properties at March 31, 2025 | 2 | ||||
Lease expirations (a) | 5 | ||||
| Leasing activities | (2) | ||||
| Vacant dispositions | (3) | ||||
Vacant properties at June 30, 2025 | 2 | ||||
Lease expirations (a) | 16 | ||||
| Leasing activities | (12) | ||||
| Vacant dispositions | (3) | ||||
Vacant properties at September 30, 2025 | 3 | ||||
Lease expirations (a) | 13 | ||||
| Leasing activities | (12) | ||||
| Vacant dispositions | (3) | ||||
Vacant properties at December 31, 2025 | 1 | ||||
BROADSTONE NET LEASE, INC. | www.broadstone.com | © 2026 Broadstone Net Lease, LLC. All rights reserved. | 34 | |||||||
BROADSTONE NET LEASE, INC. | www.broadstone.com | © 2026 Broadstone Net Lease, LLC. All rights reserved. | 35 | |||||||
BROADSTONE NET LEASE, INC. | www.broadstone.com | © 2026 Broadstone Net Lease, LLC. All rights reserved. | 36 | |||||||