UNITED STATES
SECURITIES AND EXCHANGE COMMISSION
Washington, D.C. 20549
FORM 6-K
Report of Foreign Issuer
Pursuant To Rule 13a-16 Or 15d-16 of the
Securities Exchange Act of 1934
For the month of August 2026
Commission File Number: 333-251238
COSAN S.A.
(Exact name of registrant as specified in its charter)
N/A
(Translation of registrant’s name into English)
Av. Brigadeiro Faria Lima, 4100, – 16th floor
São Paulo, SP 04538-132 Brazil
(Address of principal executive offices)
Indicate by check mark whether the registrant files or will file annual reports under cover of Form 20-F or Form 40‑F:
Form 20-F ☒ Form 40-F ☐
Indicate by check mark if the registrant is submitting the Form 6-K in paper as permitted by Regulation S-T Rule 101(b)(1):
Yes ☐ No ☒
Indicate by check mark if the registrant is submitting the Form 6-K in paper as permitted by Regulation S-T Rule 101(b)(7):
Yes ☐ No ☒
cosan Results 2Q26

São Paulo, August 14, 2026 - COSAN S.A. (B3: CSAN3; NYSE: CSAN) (“Cosan” or “Company”) today announces its results for the second quarter of 2026 (2Q26), in accordance with accounting practices adopted in Brazil and International Financial Reporting Standards (IFRS). Comparisons made in this report consider the comparison between 2Q26 and 2Q25, except where otherwise indicated.
Key Highlights
We present below the main advances in the simplification and optimization of Cosan’s capital structure since the beginning of the fiscal year:
•
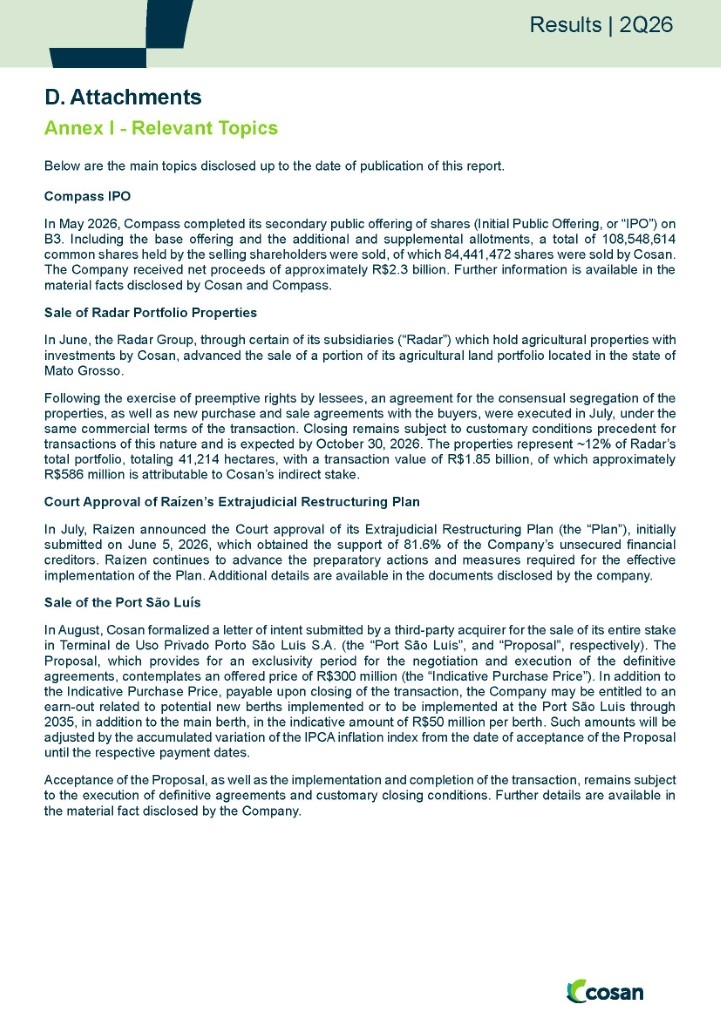
Secondary initial public offering (IPO) of Compass shares on B3, totaling R$3.0 billion and resulting in net proceeds of approximately R$2.3 billion for Cosan.
•
Sale of part of Radar’s portfolio, in a transaction involving R$1.85 billion, of which approximately R$ 586 million corresponds to Cosan’s stake. Closing of the transaction is expected in October 2026, subject to customary conditions precedent.
•
Letter of intent with exclusivity for the sale of the Terminal de Uso Privado Porto São Luís S.A. (the “Port São Luís”) for a total indicative price of R$300 million, corresponding to 100% of Cosan’s stake, in addition to an earn-out of R$50 million per berth for potential new berths implemented by 2035. Acceptance of the proposal, as well as completion of the transaction and the final price, remain subject to the execution of definitive documents and customary conditions precedent.
•
Reduction in expanded net debt, down 20% vs. 1Q26. In 6M26, prepayments already total R$8.8 billion.
•
Rationalization of the holding expenses, with the Company's G&A declining by R$49 million in the 6M26 vs. 6M25, reflecting the ongoing organizational restructuring and the decrease in holding company expenses, most notably, as recently announced, the beginning of the delisting process of Cosan's American Depositary Shares ("ADSs") from the NYSE.
•
Court Approval of Raízen’s Out-of-Court Restructuring Plan, which was approved by 81.6% of Raízen’s unsecured financial creditors.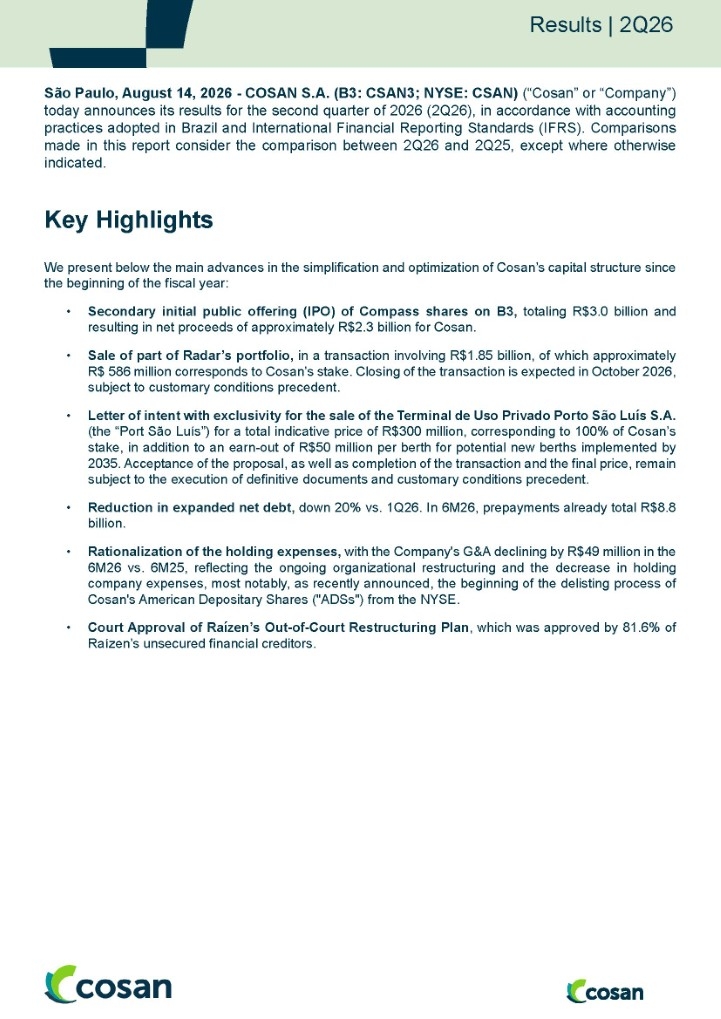
Key Indicators
BRL mn 2Q26
2Q25
Change
1Q26
Change 6M26
6M25
Change
Cosan Corporate¹
Net result2 (320)
(946)
-66%
(1,583)
-80 % (1,904)
(2,734)
-30 %
Expanded Net debt3 9,217
17,538
-47 %
11,471
-20 % 9,217
17,538
-47 %
Dividends and IoC received4 399
579
-31 %
36
n/a 434
2,046
-79 %
LTM debt service coverage ratio net 0.2x
1.2x
-1.0x
0.4x
-0.2x 0.2x
1.2x
-1.0x
Cosan Portfolio
Adjusted EBITDA5 and 6
Rumo 2,267
2,279
-1 %
1,745
30 % 4,012
3,915
2%
Compass 1,275
1,216
5%
1,329
-4 % 2,604
2,513
4%
Moove 475
505
-6 %
236
n/a 710
737
-4 %
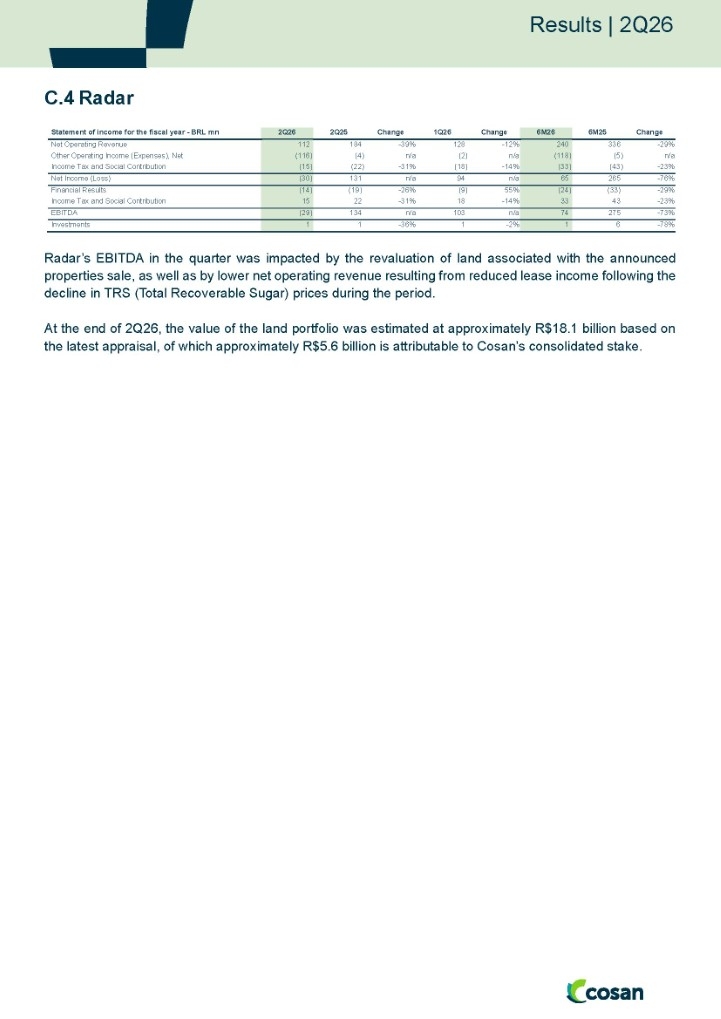
Radar (29)
134
n/a
103
n/a 74
275
-73 %
Notes: (1) Composition of the Cosan Corporate segment as detailed on page 19; (2) Net result attributable to controlling shareholders and considers Raízen’s results in the comparative periods; (3) Considers the preferred share structure of Cosan Dez, for further information, see item B.1 - Debt; (4) Considers the amount before transfer to preferred shareholders, net of taxes and amounts received from other shareholders in the Cosan Corporate segment; (5) Considers 100% of the individual results of the businesses; (6) Adjusted EBITDA excludes one-off effects, as detailed on page 21 of this report.
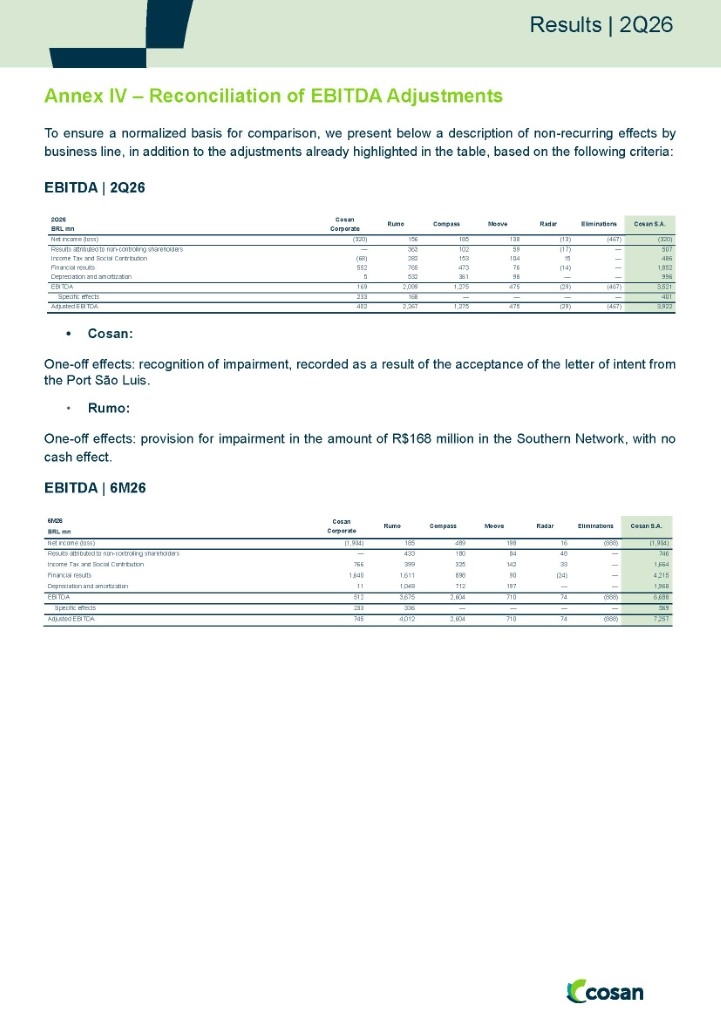
Cosan ended the 2Q26 with a net loss of R$320 million, a 66% improvement compared to 2Q25. This result reflects the one-off negative impact of R$233 million related to the impairment of the asset held for sale (Port São Luís), offset by the non-recognition of Raízen's results for accounting purposes. Excluding the one-off effect of this fair value adjustment, the loss would have narrowed to R$167 million. In addition, the 2Q26 result benefited from a favorable financial result, driven by lower interest on net debt, and from the optimization of general and administrative expenses, with a reduction of R$36 million versus 2Q25, as detailed in item A.2. G&A and Other.
The expanded net debt totaled R$9.2 billion in 2Q26, 20% lower compared to 1Q26. This decrease stems from the inflow of proceeds from Compass's IPO, completed during the quarter, which enabled the early settlement of debentures and commercial notes, as detailed in item B.1. Debt. Compared to 2Q25, expanded net debt declined by 47%, driven by liability management initiatives and by the proceeds from the capitalization and divestments completed over the last twelve months.
The Debt Service Coverage Ratio ("DSCR") ended the quarter at 0.2x, a decrease of 0.2x compared to 1Q26. This variation results from the lower contribution of dividends and interest on capital ("IoC") received on a last-twelve-months basis, reflecting the earnings distribution dynamics of the investees and the concentration of receipts at specific times of the year. Starting this quarter, we are providing guidance for this metric in the range of 0.8x to 1.2x, to enhance transparency and provide greater visibility into the evolution of the DSCR. Further details are provided in item B.2 Debt Service Coverage Ratio (DSCR), as well as in item B.2.1 DSCR Guidance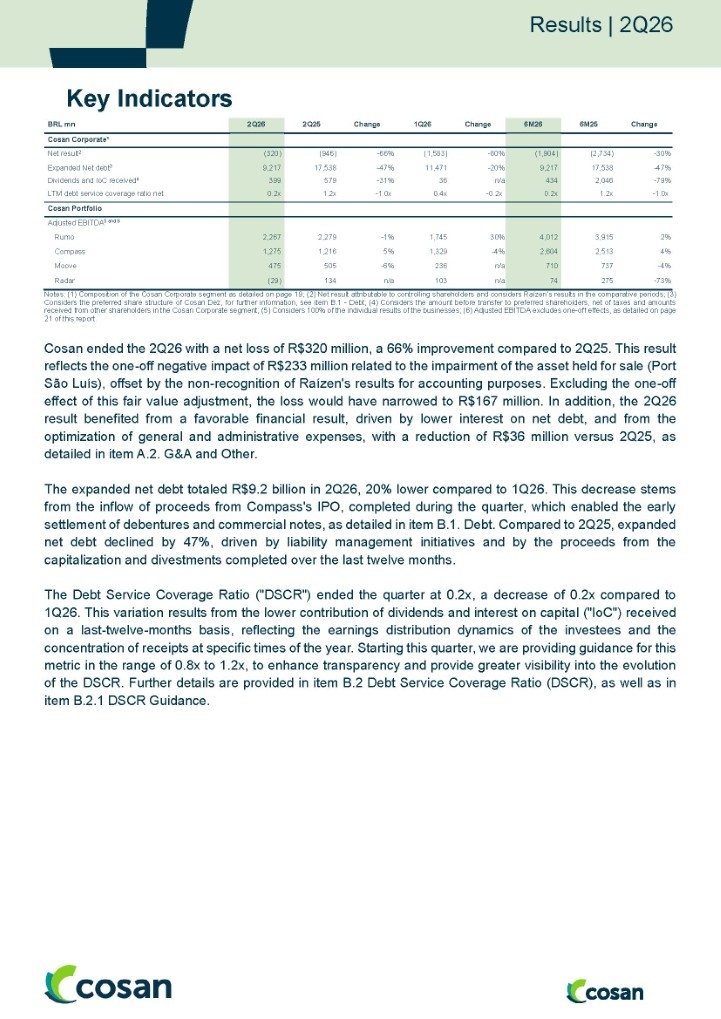
Index
A. Cosan Corporate Results ........................................................................................................................
5
A.1 Equity Pickup (MEP) .................................................................................................................................
5
A.2 G&A and Other ..........................................................................................................................................
5
A.3 Financial Result .........................................................................................................................................
6
A.4 Income Tax and Social Contribution ......................................................................................................
6
A.5 Net Income .................................................................................................................................................
7
B. Capital Structure and Cash Flow - Cosan Corporate ..........................................................................
8
B.1 Debt .............................................................................................................................................................
8
B.2 Debt Service Coverage Ratio (DSCR) ..................................................................................................
9
B.2.1 Debt Service Coverage Ratio (DSCR) Guidance..........................................................
9
B.3 Redemption value of preferred shares ..................................................................................................
11
B.4 Dividends ....................................................................................................................................................
11
B.5 Statement of Cash Flow ...........................................................................................................................
11
C. Portfolio Performance ...............................................................................................................................
13
C.1 Rumo ..........................................................................................................................................................
13
C.2 Compass ....................................................................................................................................................
14
C.3 Moove .........................................................................................................................................................
14
C.4 Radar ..........................................................................................................................................................
15
D. Attachments ...............................................................................................................................................
16
Annex I - Relevant Topics .................................................................................................................................
16
Annex II - Financial Statements ......................................................................................................................
17
Cosan Consolidated SA ...........................................................................................................................
17
Annex III - Reported Segments ...........................................................................................................................
19
Results by segment: Cosan Consolidated .....................................................................................................
20
Annex IV – Reconciliation of EBITDA Adjustments .............................................................................
21
EBITDA | 2Q26 ...................................................................................................................................................
21
EBITDA | 6M26 ..................................................................................................................................................
A. Cosan Corporate Results
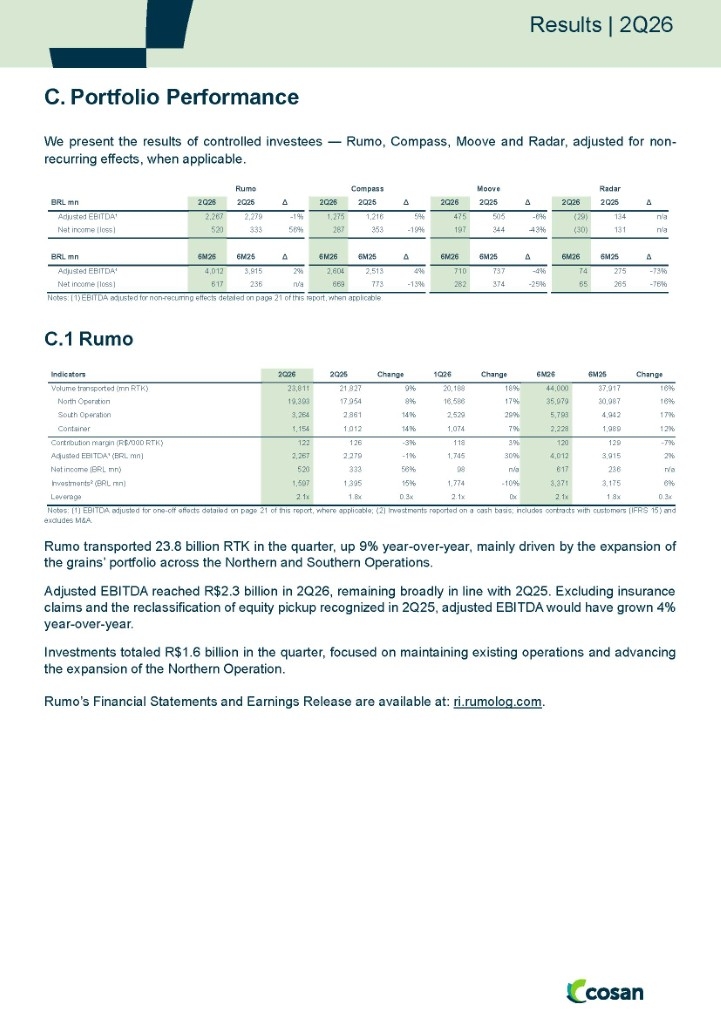
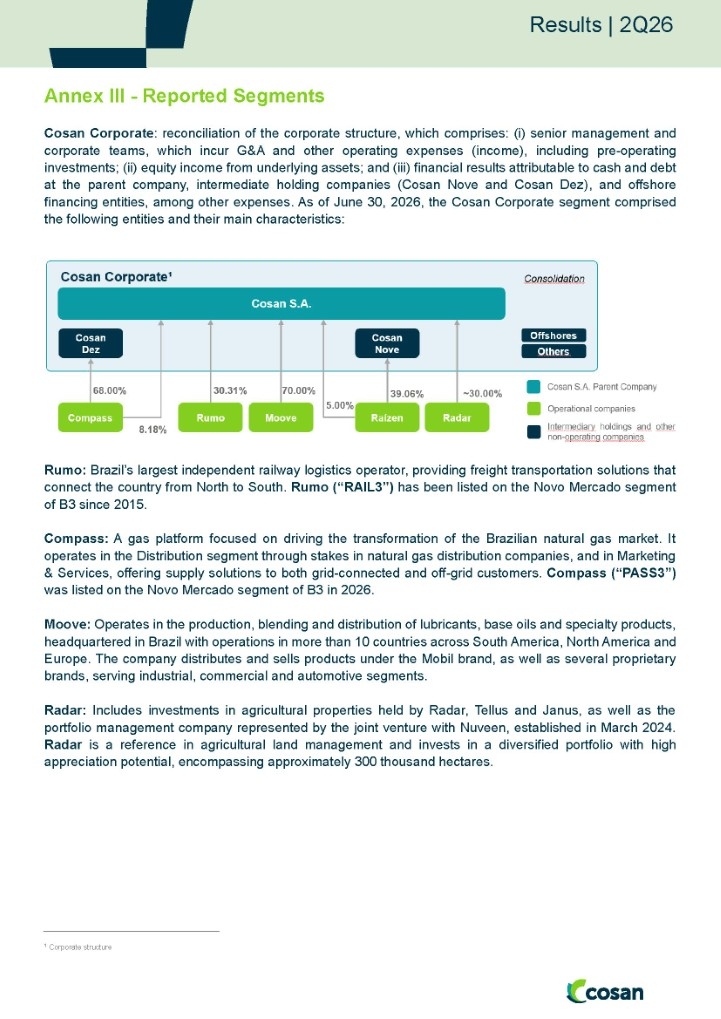
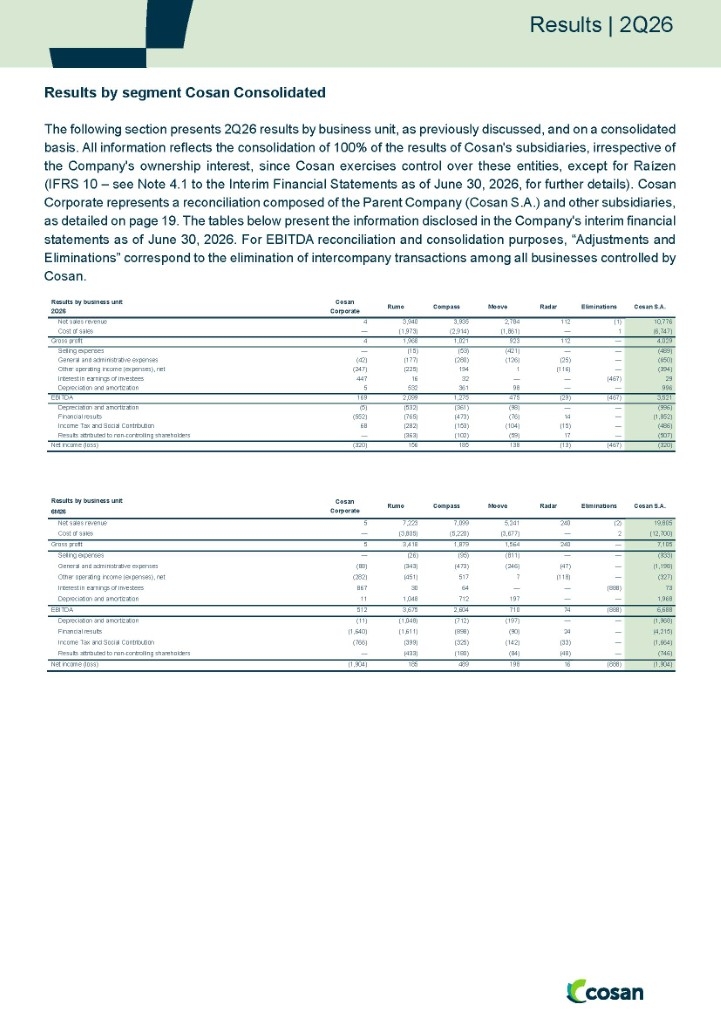
The results of Cosan Corporate, presented under an accounting basis, unless otherwise indicated, comprise: (i) equity pickup from direct and indirect ownership interests in subsidiaries and joint ventures – see the chart on page 19; (ii) general and administrative expenses of Cosan’s corporate structure and other operating income and expenses, mainly related to contingencies; (iii) financial results, which reflect the net cost of the Company’s capital structure; and (iv) taxes applicable to these transactions.
A.1 Equity Pickup (MEP)
BRL mn 2Q26
2Q25
Change
1Q26
Change 6M26
6M25
Change
Rumo 156
100
56
28
128 185
70
115
Compass (Cosan Dez)¹ 165
276
(111)
304
(139) 470
623
(153)
Moove 138
241
(103)
59
79 198
262
(65)
Radar² (12)
38
(50)
28
(40) 16
72
(56)
Raízen³ —
(829)
829
—
— —
(1,966)
1,966
Equity pickup Cosan Corporate 447
(173)
621
420
27 867
(939)
1,807
Notes: (1) Following the IPO, the Company retained control of Compass and now holds, directly and indirectly, a 76.18% ownership interest in its common shares. The subsidiary remains consolidated within the Cosan Corporate segment, with third-party interests reflected in the results attributable to non-controlling interests; (2) Results comprise the Company’s interests in Radar, Tellus and Janus, of 50%, 20% and 20%, respectively; (3) The investment in Raízen S.A. was reduced to zero as of December 31, 2025 and, as a result, will no longer be reflected in Cosan through the equity pickup method (MEP) until its shareholders’ equity becomes positive again. For this reason, no value has been attributed to it in the table above.
Cosan Corporate's equity pickup totaled R$447 million in 2Q26, representing a positive variation of R$621 million compared to 2Q25. Performance was driven by Rumo’s solid results and Moove’s strong operational recovery, both of which delivered a very positive quarter despite a comparison base impacted by non-recurring events recorded in 2Q25 that had positively affected results in that period. Additionally, equity pickup reflected the absence of any contribution from Raízen, as the carrying value of the investment has already been reduced to zero. These effects were partially offset by lower contributions from Compass and Radar. At Compass, results were impacted by higher expenses related to strategic projects and increased financial expenses. At Radar, performance reflected the combined effects of the land revaluation associated with the sale of part of its portfolio and lower lease revenues resulting from the decline in TRS (Total Recoverable Sugar) prices.
A.2 G&A and Other
BRL mn 2Q26
2Q25
Change
1Q26
Change 6M26
6M25
Change
Selling, general and administrative expenses¹ (42)
(78)
36
(46)
4 (88)
(137)
49
Other net operating income (expenses)¹ (247)
(8)
(239)
(35)
(212) (282)
166
(448)
Depreciation and amortization 5
5
—
5
— 11
10
1
Notes: (1) Starting in 4Q23, it began to include the results of pre-operational business and projects from other investments by Cosan, and the intermediate holding companies: Cosan Nove and Cosan Dez.
In 2Q26, Cosan made significant progress in optimizing its cost structure: selling, general and administrative expenses totaled R$42 million, representing a reduction of R$36 million compared to R$78 million in 2Q25. This result was mainly driven by personnel restructuring initiatives and the optimization of other expenses at the holding company level.
Under other operating income (expenses), the Company recorded an expense of R$247 million in 2Q26. The increase compared to 2Q25 was due to the impairment recognized on assets and liabilities held for sale related to the Port São Luís. Its fair value was updated based on the letter of intent of R$300 million, as the Material Fact disclosed to the market on August 13, 2026.
A.3 Financial Result
BRL mn 2Q26
2Q25
Change
1Q26
Change 6M26
6M25
Change
Gross debt cost (683)
(580)
(102)
(1,151)
468 (1,833)
(1,373)
(460)
Perpetual notes (60)
68
(128)
(143)
83 (203)
79
(282)
Other debts (Cosan S.A. and Offshores) (471)
(649)
178
(865)
394 (1,336)
(1,453)
117
Prefs. Cosan Dez (151)
—
(151)
(143)
(8) (295)
—
(295)
Income from financial investments 277
113
164
321
(44) 598
333
264
(=) Interest in net debt (406)
(467)
61
(830)
424 (1,235)
(1,040)
(196)
TRS RAIL3 (105)
—
(105)
(104)
(1) (209)
—
(209)
TRS CSAN3 —
(125)
125
(14)
14 (14)
(167)
153
Other charges, monetary variation, fees and others¹ (41)
(65)
24
(140)
99 (181)
(171)
(10)
(=) Other effects (146)
(190)
44
(259)
113 (404)
(338)
(66)
Financial results (552)
(657)
106
(1,088)
537 (1,640)
(1,378)
(262)
Notes: (1) Includes MtM effects relating to investment in equity stake in Vale in 2Q25.
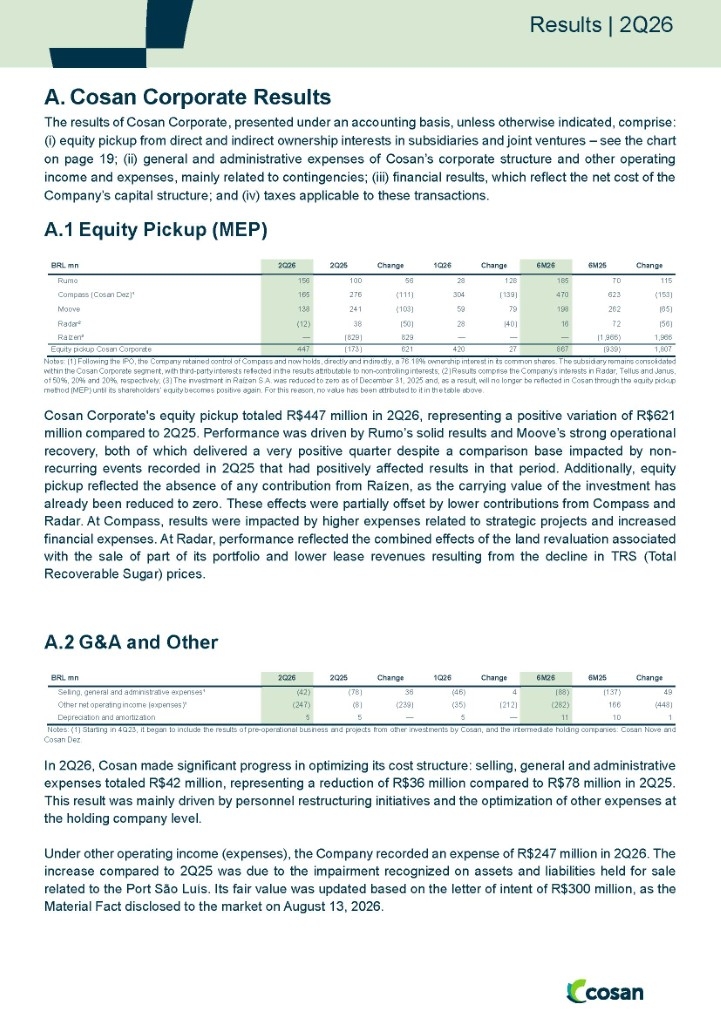
In 2Q26, the gross debt cost totaled R$683 million, a decrease of R$468 million compared to 1Q26, mainly due to the impact of the full early settlements of the bonds and partial early settlements of the debentures and commercial notes, which contributed to the reduction in the holding company's financial expenses.
As a result, the 2Q26 financial result improved by R$537 million versus 1Q26. This variation is largely explained by the absence of the non-recurring effects concentrated in the previous quarter, most notably: (i) R$304 million related to the costs associated with the prepayments of bonds and debentures carried out in 1Q26, in addition to R$96 million of foreign exchange and derivative effects related to the bonds; and (ii) impacts arising from the unwinding of the TRS structure backed by the Company's shares and of the Call Spread structure on Vale shares, which together totaled R$41 million.
Due to the concentration of the early settlements, mainly of the bonds, in 1Q26, the non-recurring effects associated with these transactions had a lower impact in 2Q26, totaling R$12 million related to the prepayment premiums on local debt, which contributed to the normalization of the financial result.
Compared to 2Q25, the financial result declined by R$106 million, substantially driven by the higher yield on financial investments. This performance reflects: (i) the increase in the average cash balance over the period, boosted by the capitalization event carried out in 2025; (ii) the divestment and TRS structure on Rumo shares; and (iii) the receipt of proceeds from Compass's secondary public share offering, completed during the quarter.
A.4 Income Tax and Social Contribution
BRL mn 2Q26
2Q25
Change
1Q26
Change 6M26
6M25
Change
Operating profit (loss) before taxes (388)
(915)
527
(750)
361 (1,138)
(2,287)
1,149
Income and social contribution taxes - nominal rate (%) 34.0 %
34.0 %
34.0 %
34.0 %
34.0 %
Theoretical expense with income and social contribution taxes 132
311
(179)
255
(123) 387
778
(391)
Interest in earnings 152
(59)
211
143
9 295
(319)
614
Other (216)
(412)
196
(1,231)
1,015 (1,448)
(1,278)
(170)
Effective expense with income and social contribution taxes 68
(160)
228
(834)
902 (766)
(820)
54
Income and social contribution taxes - effective rate (%) 17.5 %
-17.5 %
-111.2%
-67.3 %
-35.8 %
Expenses with income and social contribution taxes
Current (2)
—
(2)
(2)
— (4)
(1)
(3)
Deferred 70
(160)
230
(832)
902 (762)
(819)
57
Effective income tax and social contribution expense decreased by R$228 million in 2Q26 compared to 2Q25, due to non-cash effects associated with deferred taxes on the fair value adjustment of the Port São Luís, which represented a credit of approximately R$79 million in deferred taxes.
A.5 Net Income
R$ MM 2Q26
2Q25
Change
1Q26
Change 6M26
6M25
Change
Equity Pickup¹ 447
(173)
621
420
27 867
(939)
1,807
General and administrative expenses (42)
(78)
36
(46)
4 (88)
(137)
49
Other operation income (expenses) (247)
(8)
(239)
(35)
(212) (282)
166
(448)
Financial results (552)
(657)
106
(1,088)
537 (1,640)
(1,378)
(262)
Income tax 68
(160)
228
(834)
902 (766)
(820)
54
Net income (loss) (320)
(1,075)
755
(1,583)
1,263 (1,904)
(3,107)
1,203
Result attributable to non-controlling shareholders
—
(129)
129
—
— —
(373)
373
Result attributable to controlling shareholders
(320)
(946)
625
(1,583)
1,263 (1,904)
(2,734)
830
Notes: (1) Considers Raízen's results in the comparative periods.
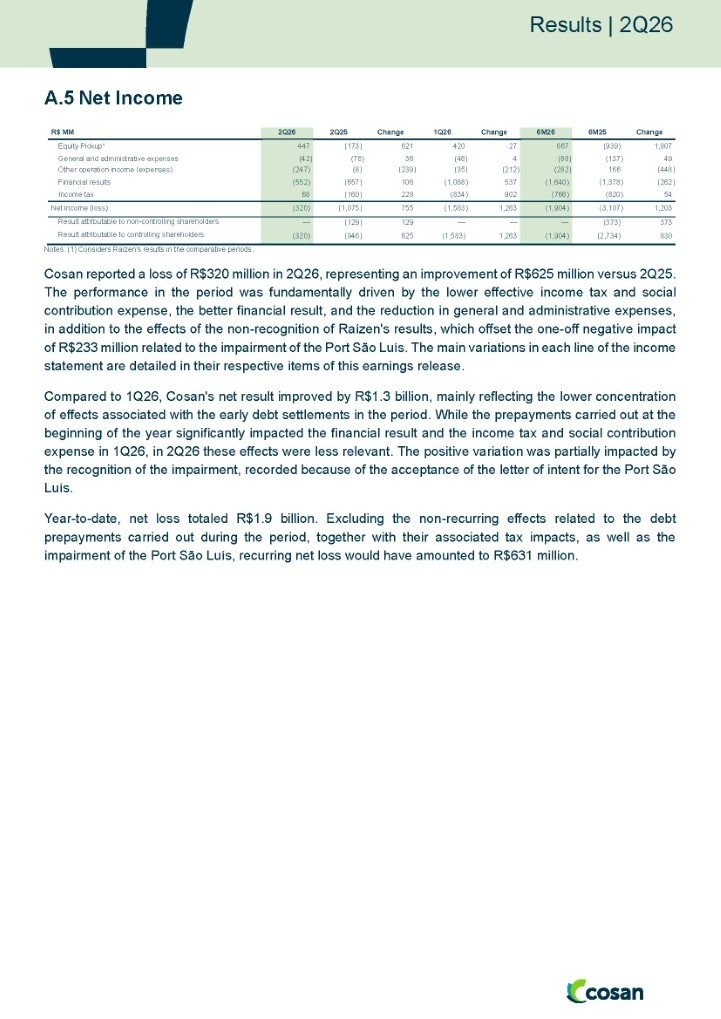
Cosan reported a loss of R$320 million in 2Q26, representing an improvement of R$625 million versus 2Q25. The performance in the period was fundamentally driven by the lower effective income tax and social contribution expense, the better financial result, and the reduction in general and administrative expenses, in addition to the effects of the non-recognition of Raízen's results, which offset the one-off negative impact of R$233 million related to the impairment of the Port São Luís. The main variations in each line of the income statement are detailed in their respective items of this earnings release.
Compared to 1Q26, Cosan's net result improved by R$1.3 billion, mainly reflecting the lower concentration of effects associated with the early debt settlements in the period. While the prepayments carried out at the beginning of the year significantly impacted the financial result and the income tax and social contribution expense in 1Q26, in 2Q26 these effects were less relevant. The positive variation was partially impacted by the recognition of the impairment, recorded because of the acceptance of the letter of intent for the Port São Luís.
Year-to-date, net loss totaled R$1.9 billion. Excluding the non-recurring effects related to the debt prepayments carried out during the period, together with their associated tax impacts, as well as the impairment of the Port São Luís, recurring net loss would have amounted to R$631 million.
B. Capital Structure and Cash Flow - Cosan Corporate
B.1 Debt
BRL mn
Enterprise 2Q26
2Q25
Change
1Q26
Change
Cosan Corporate
Debentures and Commercial Notes¹
Cosan S.A. 9,919
12,810
(2,891)
12,490
(2,570)
Bonds (Senior Notes 2029, 2030 and 2031)
Offshore —
5,873
(5,873)
—
—
Perpetual bonds
Offshore 2,621
2,763
(142)
2,643
(22)
Preferred shares. Cosan Dez
Cosan S.A. 3,871
—
3,871
3,995
(124)
(-) MTM
Cosan S.A. 74
66
8
58
16
Expanded gross debt (ex-IFRS 16)
16,485
21,512
(5,027)
19,185
(2,701)
(-) Cash, cash equivalents and Marketable securities
(7,268)
(3,975)
(3,293)
(7,714)
446
Expanded Net debt²
9,217 17,538 (8,321) 11,471 (2,254)
TRS Rumo³
3,014 — 3,014 2,909 105
Expanded Net debt + TRS Rumo
12,231 17,538 (5,307) 14,380 (2,149)
Notes: (1) Net amount of international capital markets debt structures; (2) Considers the preferred share structure of Cosan Dez; (3) As of 2Q26, the sale and derivative structure involving Rumo shares (TRS) began to be presented in the table, in line with the treatment of its effects in the holding company’s financial results. The Company has no obligation to repurchase the shares.
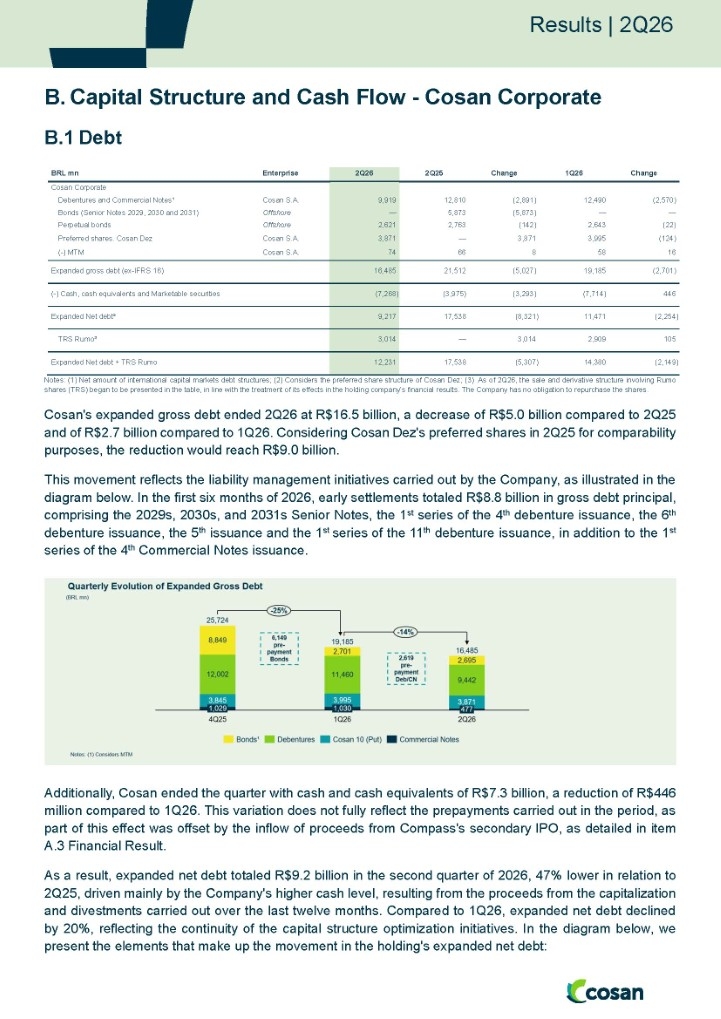
Cosan's expanded gross debt ended 2Q26 at R$16.5 billion, a decrease of R$5.0 billion compared to 2Q25 and of R$2.7 billion compared to 1Q26. Considering Cosan Dez's preferred shares in 2Q25 for comparability purposes, the reduction would reach R$9.0 billion.
This movement reflects the liability management initiatives carried out by the Company, as illustrated in the diagram below. In the first six months of 2026, early settlements totaled R$8.8 billion in gross debt principal, comprising the 2029s, 2030s, and 2031s Senior Notes, the 1st series of the 4th debenture issuance, the 6th debenture issuance, the 5th issuance and the 1st series of the 11th debenture issuance, in addition to the 1st series of the 4th Commercial Notes issuance.
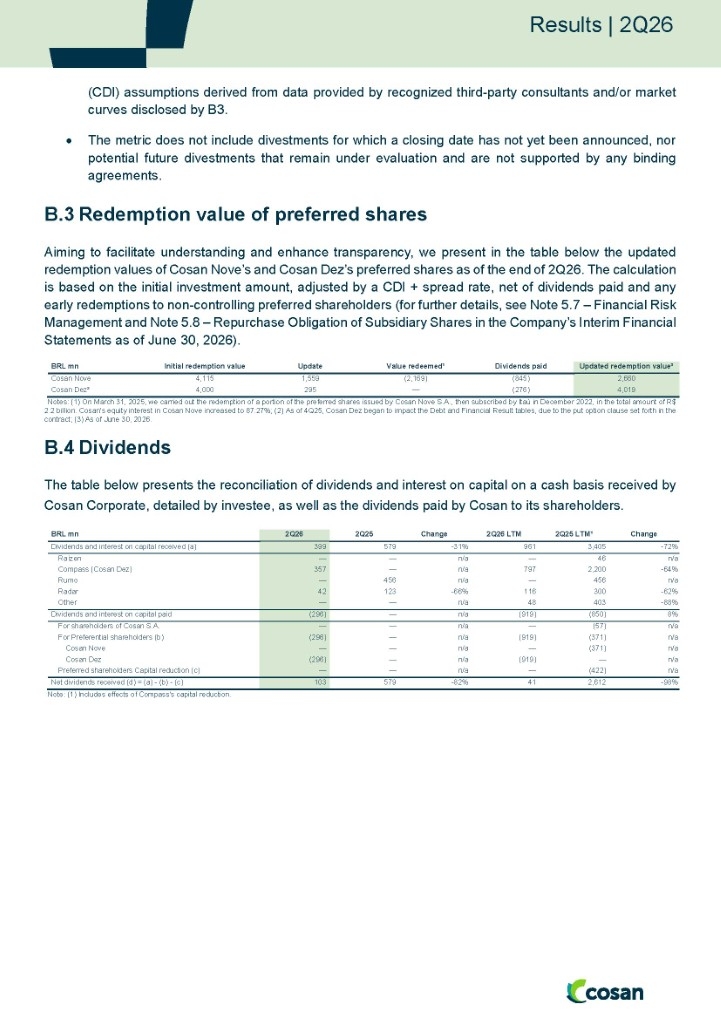
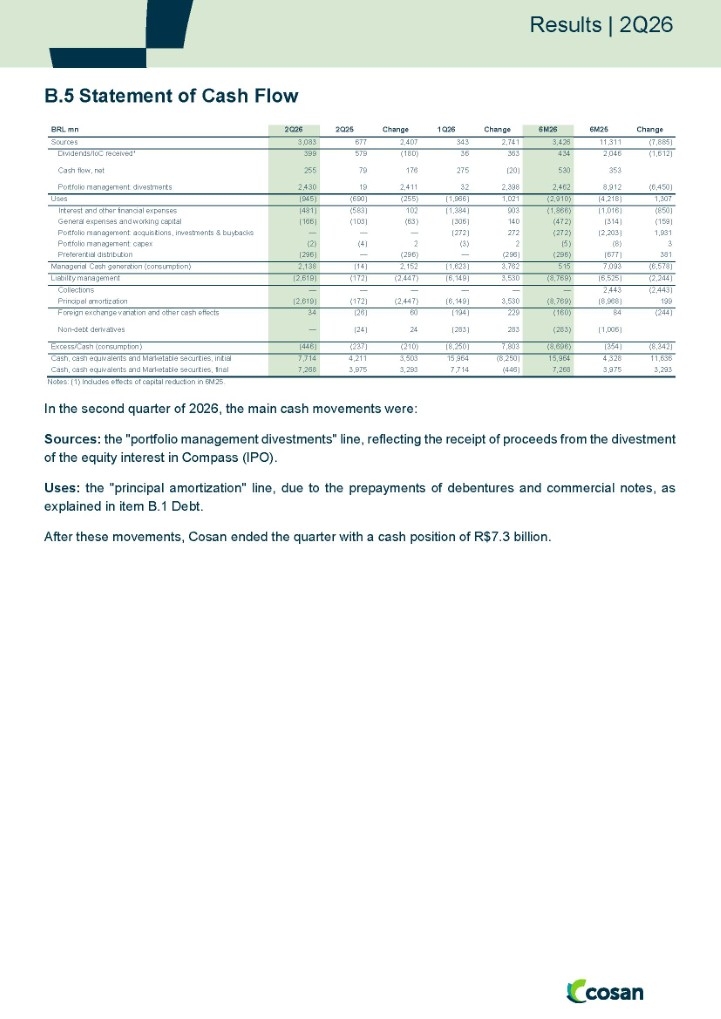
Additionally, Cosan ended the quarter with cash and cash equivalents of R$7.3 billion, a reduction of R$446 million compared to 1Q26. This variation does not fully reflect the prepayments carried out in the period, as part of this effect was offset by the inflow of proceeds from Compass's secondary IPO, as detailed in item A.3 Financial Result.
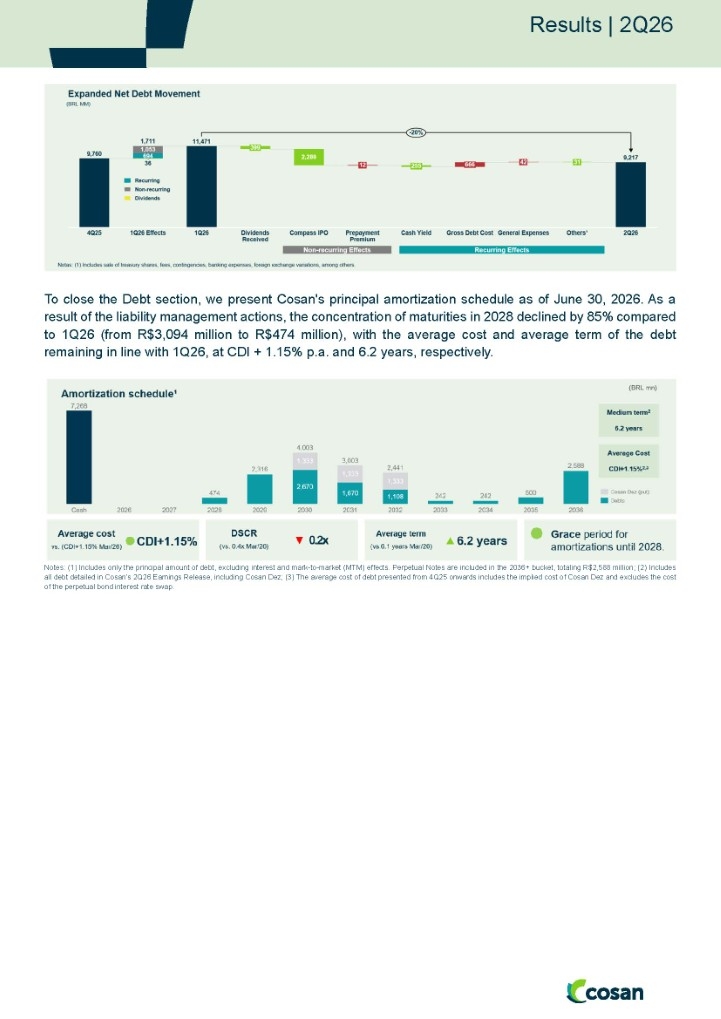
As a result, expanded net debt totaled R$9.2 billion in the second quarter of 2026, 47% lower in relation to 2Q25, driven mainly by the Company's higher cash level, resulting from the proceeds from the capitalization and divestments carried out over the last twelve months. Compared to 1Q26, expanded net debt declined by 20%, reflecting the continuity of the capital structure optimization initiatives. In the diagram below, we present the elements that make up the movement in the holding's expanded net debt:
To close the Debt section, we present Cosan's principal amortization schedule as of June 30, 2026. As a result of the liability management actions, the concentration of maturities in 2028 declined by 85% compared to 1Q26 (from R$3,094 million to R$474 million), with the average cost and average term of the debt remaining in line with 1Q26, at CDI + 1.15% p.a. and 6.2 years, respectively.
Notes: (1) Includes only the principal amount of debt, excluding interest and mark-to-market (MTM) effects. Perpetual Notes are included in the 2036+ bucket, totaling R$2,588 million; (2) Includes all debt detailed in Cosan’s 2Q26 Earnings Release, including Cosan Dez; (3) The average cost of debt presented from 4Q25 onwards includes the implied cost of Cosan Dez and excludes the cost of the perpetual bond interest rate swap.
B.2 Debt Service Coverage Ratio (DSCR)
Cosan Corporate - BRL mn 2Q26
2Q25
Change
1Q26
Change
Dividends and interest on capital (IoC) received LTM¹ 961
3,405
(2,445)
1,141
(180)
Cosan Nove and Dez PNs (440)
(793)
353
(440)
—
Net Dividends and Interest on Capital received LTM (a)4 521
2,612
(2,091)
701
(180)
Net Interest paid LTM2,3 and 4 (b) 2,186
2,258
(72)
1,835
351
Debt Service Coverage Ratio (c = a / b) 0.2x
1.2x
-1.0x
0.4x
-0.2x
Notes: (1) Reconciliation in the dividends table in item B.4 Dividends; (2) Includes interest payments, debt-linked derivatives, and bank derivative expenses; (3) Net of cash yield as of 1Q25; (4) As of 2Q26, the DSCR began to fully consider the dividends received from Compass in the numerator, while the payments to Cosan Dez's preferred shareholders are recognized in the denominator of the indicator. Previously, dividends were considered net of these payments.
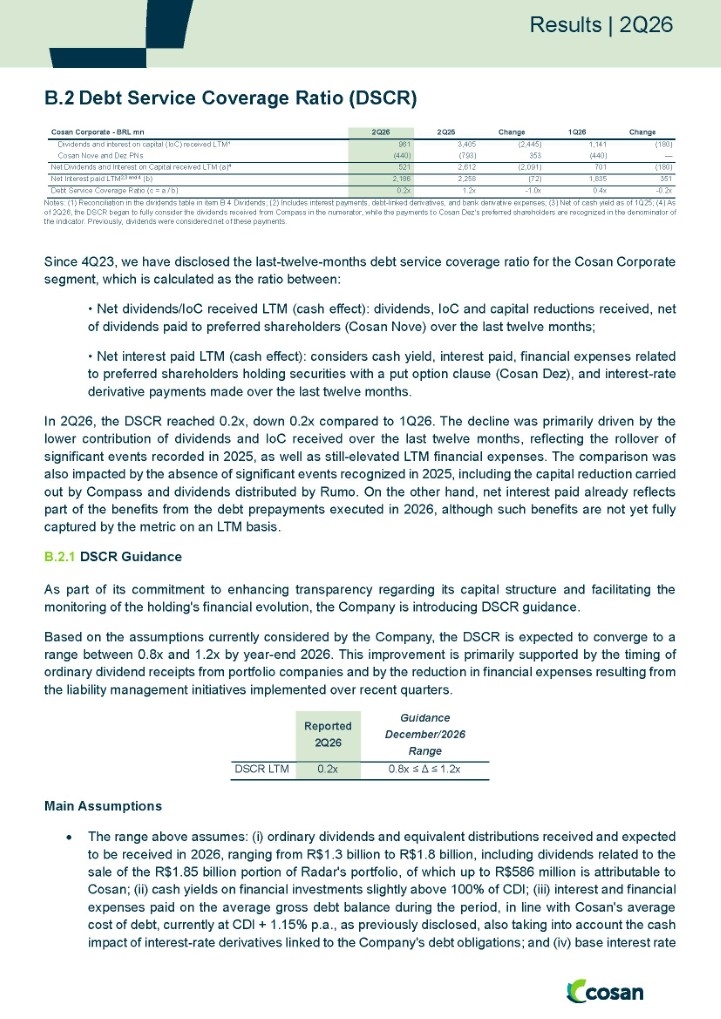
Since 4Q23, we have disclosed the last-twelve-months debt service coverage ratio for the Cosan Corporate segment, which is calculated as the ratio between:
• Net dividends/IoC received LTM (cash effect): dividends, IoC and capital reductions received, net of dividends paid to preferred shareholders (Cosan Nove) over the last twelve months;
• Net interest paid LTM (cash effect): considers cash yield, interest paid, financial expenses related to preferred shareholders holding securities with a put option clause (Cosan Dez), and interest-rate derivative payments made over the last twelve months.
In 2Q26, the DSCR reached 0.2x, down 0.2x compared to 1Q26. The decline was primarily driven by the lower contribution of dividends and IoC received over the last twelve months, reflecting the rollover of significant events recorded in 2025, as well as still-elevated LTM financial expenses. The comparison was also impacted by the absence of significant events recognized in 2025, including the capital reduction carried out by Compass and dividends distributed by Rumo. On the other hand, net interest paid already reflects part of the benefits from the debt prepayments executed in 2026, although such benefits are not yet fully captured by the metric on an LTM basis.
B.2.1 DSCR Guidance
As part of its commitment to enhancing transparency regarding its capital structure and facilitating the monitoring of the holding's financial evolution, the Company is introducing DSCR guidance.
Based on the assumptions currently considered by the Company, the DSCR is expected to converge to a range between 0.8x and 1.2x by year-end 2026. This improvement is primarily supported by the timing of ordinary dividend receipts from portfolio companies and by the reduction in financial expenses resulting from the liability management initiatives implemented over recent quarters.
Reported 2Q26
Guidance
December/2026
Range
DSCR LTM 0.2x
0.8x ≤ Δ ≤ 1.2x
Main Assumptions
•
The range above assumes: (i) ordinary dividends and equivalent distributions received and expected to be received in 2026, ranging from R$1.3 billion to R$1.8 billion, including dividends related to the sale of the R$1.85 billion portion of Radar's portfolio, of which up to R$586 million is attributable to Cosan; (ii) cash yields on financial investments slightly above 100% of CDI; (iii) interest and financial expenses paid on the average gross debt balance during the period, in line with Cosan's average cost of debt, currently at CDI + 1.15% p.a., as previously disclosed, also taking into account the cash impact of interest-rate derivatives linked to the Company's debt obligations; and (iv) base interest rate
.
SIGNATURES
Pursuant to the requirements of the Securities Exchange Act of 1934, the registrant has duly caused this report to be signed on its behalf by the undersigned, thereunto duly authorized.
Date: August 14, 2026
|
COSAN S.A.
|
|
By:
|
/s/ Rafael Bergman
|
|
|
Name: Rafael Bergman
|
|
|
Title: Chief Financial Officer
|