COASTAL FINANCIAL CORPORATION ANNOUNCES SECOND QUARTER 2026 RESULTS
Results Reflect Record Net Interest Income and Continued BaaS Growth, Offset by Credit Expenses Taken on Single Partner Relationship
Company Release: July 30, 2026
Everett, WA – Coastal Financial Corporation (Nasdaq: CCB) (the “Company”, "Coastal", "we", "our", or "us"), the holding company for Coastal Community Bank (the “Bank”), through which it operates a community-focused bank segment ("community bank") with an industry leading banking as a service ("BaaS") segment ("CCBX"), today reported unaudited financial results for the quarter ended June 30, 2026, including net loss of $42.1 million, or $(2.76) per diluted common share, compared to net income of $12.0 million, or $0.78 per diluted common share, for the three months ended March 31, 2026 and $11.0 million, or $0.71 per diluted common share, for the three months ended June 30, 2025. The net loss is primarily attributable to a $68.8 million credit expense related to a single, isolated CCBX partner relationship.
Management Discussion of the Second Quarter Results
“Our second quarter results reflect continued performance of our core franchise, which was offset by decisive action we took on a single non-public company partner relationship. Based on our assessment, we recorded the potential impact fully and in accordance with our credit protection framework. We believe this is an isolated issue pertaining to one partner and does not reflect a change in our view of our broader partner portfolio or BaaS model. We remain focused on disciplined and sustainable growth by partnering with organizations that align with our long-term strategy, thoughtfully expanding our product offerings, and continuing to build a resilient BaaS platform designed to deliver value for all stakeholders,” stated CEO Eric Sprink.
“Despite these credit expenses, we delivered solid loan growth of 9.0%, increased BaaS program income, and continued to deepen relationships with our established partners while advancing new products that support our strategy,” added Sprink. “Our CCBX segment expanded product offerings with existing partners during the quarter while advancing new partners through onboarding toward launch and active status in alignment with our long-term strategy. We also experienced solid quarter-over-quarter growth in BaaS program income, reflecting continued momentum across our diversified revenue streams.”
“Looking ahead, we remain focused on disciplined, sustainable growth by strengthening relationships with larger, well-established partners, thoughtfully expanding our product offerings, and continuing to invest in the infrastructure, technology and risk management capabilities that support our platform. Our operating momentum, our disciplined approach to partner selection, and our strong capital and liquidity position leave us confident in our ability to execute and to create long-term value for shareholders,” concluded Sprink.
Key Points for Second Quarter
•CCBX Partner and Product Expansion. As of June 30, 2026 we had one partner in testing, one in implementation/onboarding, and three signed letters of intent (LOIs). Our active pipeline positions us for continued growth, with new partnership opportunities and product launches expected for the remainder of 2026. Total BaaS program fee income was $12.0 million for the three months ended June 30, 2026, an increase of $1.1 million, or 10.3%, from the three months ended March 31, 2026.
"Our technology modernization initiatives continue to strengthen the CCBX platform, improving operational efficiency, enhancing the partner experience and supporting long-term scalability," stated CCBX President Brian Hamilton.
1
•Items Affecting Second Quarter Results. Significant items impacting June 30, 2026 results included a $22.8 million provision for credit losses and a $46.0 million valuation adjustment to the credit enhancement asset, both related to one partner, not expected to be fully collected under its indemnification arrangement. These items followed an individual assessment of collectability. We also recorded $4.4 million of capitalized software amortization due to shortened useful lives associated with technology modernization.
•Positive On- and Off-Balance Sheet Trends Continue. At June 30, 2026 we swept off $4.26 billion in deposits for Federal Deposit Insurance Corporation ("FDIC") insurance and liquidity purposes, and generated $1.2 million in noninterest income during the quarter ended June 30, 2026, an increase of $467,000, or 65.8%, from $710,000 for the quarter ended March 31, 2026 and an increase of $820,000, or 229.7% from $357,000 for the quarter ended June 30, 2025.
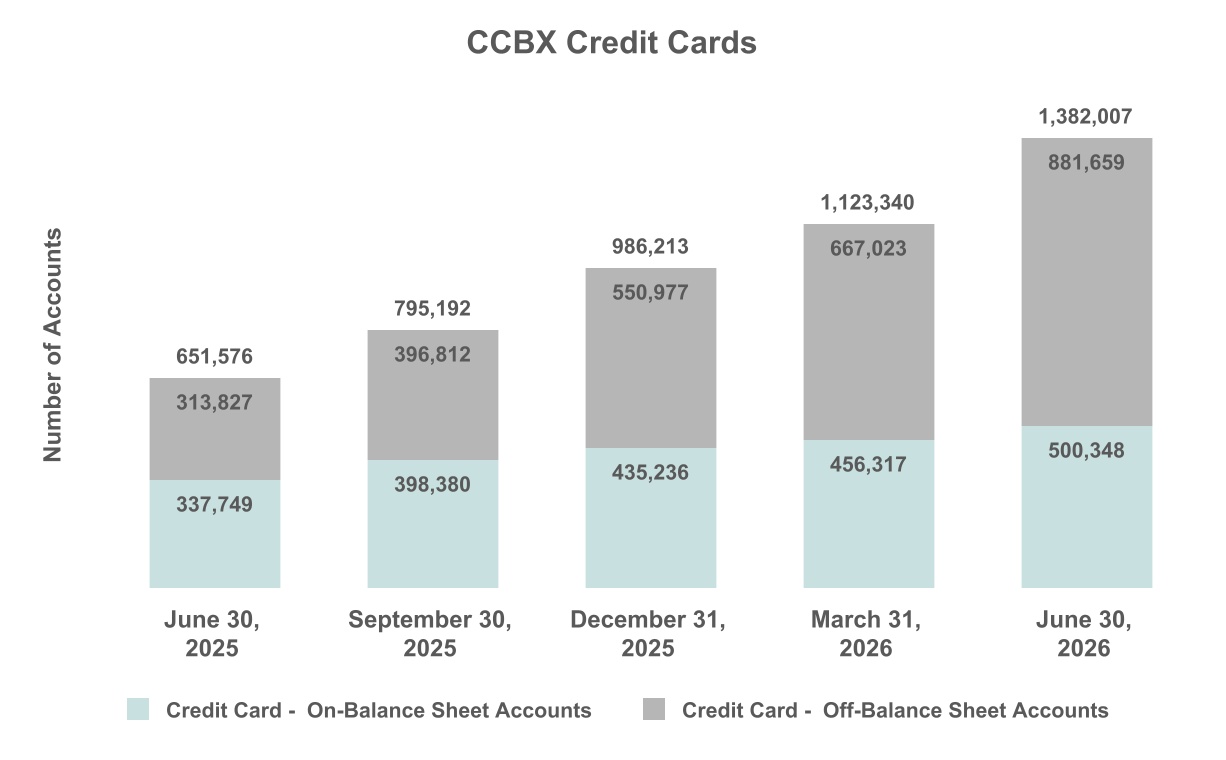
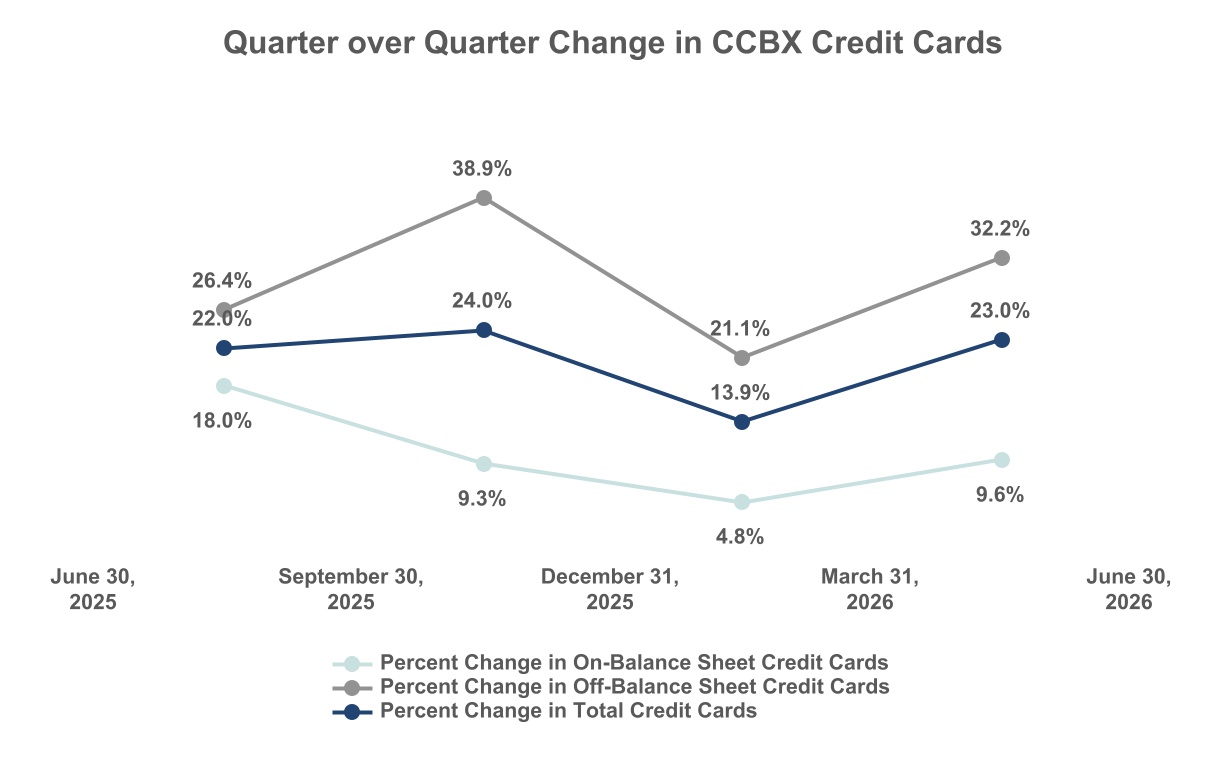
During the second quarter of 2026, we sold $4.56 billion of loans, including $3.68 billion of additional credit card receivables originated through ongoing cardholder spend and revolving activity and sold under existing forward flow arrangements, compared to $3.28 billion of sold loans in the quarter ended March 31, 2026, including $2.63 billion sold under the same forward flow arrangements. As of June 30, 2026 there were 881,659 off-balance sheet credit cards with fee earning potential, an increase of 214,636, or 32.18%, compared to the quarter ended March 31, 2026 and an increase of 567,832, or 180.94%, from June 30, 2025.
Capital and Liquidity
The Company and the Bank remained well capitalized at June 30, 2026, with a Company common equity Tier 1 ratio of 10.86%, a Tier 1 leverage ratio of 9.11%, and a total risk-based capital ratio of 13.30%, each above the levels required to be considered well capitalized. The quarter’s charges reduced capital ratios by approximately one percentage point, and the Company retained $1.01 billion of cash and cash equivalents and $1.12 billion of additional contingent borrowing capacity, with no borrowings outstanding as of June 30, 2026. The Company’s capital efficient model, including ongoing loan sales and off-balance sheet deposit and card programs, continues to support internal capital generation.
Executive Chairman Appointment
The Company also announced that Christopher D. Adams, Chairman since 2019 and a member of the Board since 2016, has been appointed Executive Chairman of Coastal Financial Corporation, effective immediately. In this expanded capacity, Mr. Adams will devote additional time to long-term strategy, leadership development, and external engagement, and partner closely with Mr. Sprink and the rest of the management team.
2
Second Quarter 2026 Financial Highlights
The tables below outline some of our key operating metrics.
Three Months Ended
(Dollars in thousands, except share and per share data; unaudited)
June 30, 2026
March 31, 2026
December 31, 2025
September 30, 2025
June 30, 2025
Income Statement Data:
Interest and dividend income
$
118,554
$
111,681
$
107,886
$
109,027
$
107,797
Interest expense
29,187
28,324
28,521
31,126
31,060
Net interest income
89,367
83,357
79,365
77,901
76,737
Provision for credit losses
92,157
51,398
48,041
56,598
32,211
Net interest (loss) income after
provision for credit losses
(2,790)
31,959
31,324
21,303
44,526
Noninterest income
88,707
66,077
58,661
66,777
42,693
Noninterest expense
141,111
83,452
72,804
70,172
72,832
(Benefit) provision for income tax
(13,089)
2,565
4,538
4,316
3,359
Net (loss) income
$
(42,105)
$
12,019
$
12,643
$
13,592
$
11,028
As of and for the Three Month Period
June 30, 2026
March 31, 2026
December 31, 2025
September 30, 2025
June 30, 2025
Balance Sheet Data:
Cash and cash equivalents
$
1,008,448
$
1,495,467
$
736,970
$
642,258
$
719,759
Investment securities
45,246
46,169
48,247
43,942
45,577
Loans held for sale
107,838
124,039
71,216
42,894
60,474
Loans receivable
4,208,270
3,859,379
3,749,531
3,703,848
3,540,330
Allowance for credit losses
(213,724)
(172,427)
(169,530)
(173,813)
(164,794)
Total assets
5,456,152
5,663,829
4,741,437
4,553,076
4,480,559
Interest bearing deposits
4,249,420
4,462,003
3,564,583
3,408,160
3,358,216
Noninterest bearing deposits
612,478
579,161
579,616
564,403
555,355
Core deposits (1)
4,850,783
5,028,967
4,131,911
3,959,360
3,441,624
Total deposits
4,861,898
5,041,164
4,144,199
3,972,563
3,913,571
Total borrowings
48,112
48,074
48,036
47,999
47,960
Total shareholders’ equity
$
463,447
$
503,762
$
490,959
$
475,277
$
461,709
Share and Per Share Data (2):
(Loss) earnings per share – basic
$
(2.76)
$
0.79
$
0.84
$
0.90
$
0.73
(Loss) earnings per share – diluted
$
(2.76)
$
0.78
$
0.82
$
0.88
$
0.71
Dividends per share
—
—
—
—
—
Book value per share (3)
$
30.33
$
33.05
$
32.43
$
31.45
$
30.59
Tangible book value per share (4)
$
30.05
$
32.76
$
32.13
$
31.45
$
30.59
Weighted avg outstanding shares – basic
15,243,357
15,179,447
15,116,005
15,093,274
15,033,296
Weighted avg outstanding shares – diluted
15,243,357
15,422,822
15,455,856
15,443,987
15,447,923
Shares outstanding at end of period
15,280,689
15,241,491
15,140,192
15,112,000
15,093,036
Stock options outstanding at end of period
65,835
68,585
118,881
122,206
126,654
3
As of and for the Three Month Period
June 30, 2026
March 31, 2026
December 31, 2025
September 30, 2025
June 30, 2025
Credit Quality Data:
Nonperforming assets (5) to total
assets
1.38
%
1.19
%
1.35
%
1.31
%
1.36
%
Nonperforming assets (5) to loans receivable and OREO
1.79
%
1.75
%
1.71
%
1.61
%
1.72
%
Nonperforming loans (5) to total loans receivable
1.79
%
1.75
%
1.71
%
1.61
%
1.72
%
Allowance for credit losses to nonperforming loans
284.2
%
259.3
%
264.4
%
290.8
%
270.7
%
Allowance for credit losses to total loans receivable
5.08
%
4.47
%
4.52
%
4.69
%
4.65
%
Gross charge-offs
$
58,218
$
54,523
$
55,189
$
54,534
$
53,780
Gross recoveries
$
7,583
$
4,936
$
5,114
$
5,289
$
4,467
Net charge-offs to average loans (6)
4.90
%
5.13
%
5.31
%
5.37
%
5.54
%
Capital Ratios:
Company
Tier 1 leverage capital
9.11
%
10.09
%
10.62
%
10.54
%
10.39
%
Common equity Tier 1 risk-based capital
10.86
%
12.08
%
12.43
%
12.33
%
12.32
%
Tier 1 risk-based capital
10.94
%
12.17
%
12.52
%
12.42
%
12.41
%
Total risk-based capital
13.30
%
14.54
%
14.95
%
14.88
%
14.90
%
Bank
Tier 1 leverage capital
9.12
%
10.10
%
10.60
%
10.49
%
10.33
%
Common equity Tier 1 risk-based capital
10.97
%
12.19
%
12.50
%
12.37
%
12.36
%
Tier 1 risk-based capital
10.97
%
12.19
%
12.50
%
12.37
%
12.36
%
Total risk-based capital
12.27
%
13.48
%
13.79
%
13.66
%
13.65
%
(1)Core deposits are defined as all deposits excluding brokered and time deposits.
(2)Share and per share amounts are based on total actual or average common shares outstanding, as applicable.
(3)We calculate book value per share as total shareholders’ equity at the end of the relevant period divided by the outstanding number of our common shares at the end of each period.
(4)Tangible book value per share is a non-GAAP financial measure. We calculate tangible book value per share as total shareholders’ equity at the end of the relevant period, less goodwill and other intangible assets, divided by the outstanding number of our common shares at the end of each period. The most directly comparable GAAP financial measure is book value per share. See reconciliation of the non-GAAP measures at the end of this earnings release for the impact of intangible assets on book value.
(5)Nonperforming assets and nonperforming loans include loans 90+ days past due and accruing interest.
(6)Annualized calculations.
Key Performance Ratios
Return on average assets ("ROA") was (3.32)% for the quarter ended June 30, 2026 compared to 0.98% and 0.99% for the quarters ended March 31, 2026 and June 30, 2025, respectively. The decline in ROA compared to the prior quarters was primarily attributable to charges related to one partner relationship, including a valuation adjustment to the related credit enhancement asset and an increase in the provision for credit losses. ROA was also impacted by higher noninterest expense, including a loss on disposal of internally developed software and increased data processing and software license costs. See the "Provision for Credit Losses" and "Noninterest Expense" discussions below for additional information.
Compared to the quarter ended March 31, 2026, yield on earning assets increased 0.27% while yield on loans receivable decreased by 0.02%. Average loans receivable as of June 30, 2026 increased $269.8 million compared to March 31, 2026 as net CCBX loans continue to grow, despite selling $4.56 billion in CCBX loans during the quarter ended June 30, 2026.
4
Compared to the quarter ended June 30, 2025, yield on earning assets declined 0.28% and yield on loans receivable declined by 0.36%. Average loans receivable as of June 30, 2026 increased $580.6 million compared to June 30, 2025.
The quarter over quarter volatility in the efficiency ratio and noninterest income to average asset performance metrics were driven by changes in the credit enhancement on CCBX loans, which is included within noninterest income, due to changes in CCBX provision expense. Although these items have historically been largely offsetting, a portion of the second quarter 2026 provision was not expected to be fully recovered under a partner indemnification arrangement, resulting in a net adverse impact on earnings. The quarter over quarter change in ROA and return on average equity are related to the expenses previously mentioned.
The following table shows the Company’s key performance ratios for the periods indicated.
Three Months Ended
(unaudited)
June 30, 2026
March 31, 2026
December 31, 2025
September 30, 2025
June 30, 2025
Return on average assets (1)
(3.32)
%
0.98
%
1.09
%
1.19
%
0.99
%
Return on average equity (1)
(33.10)
%
9.80
%
10.41
%
11.52
%
9.72
%
Yield on earnings assets (1)
9.65
%
9.38
%
9.55
%
9.80
%
9.92
%
Yield on loans receivable (1)
10.74
%
10.76
%
10.63
%
10.95
%
11.11
%
Cost of funds (1)
2.62
%
2.59
%
2.77
%
3.07
%
3.13
%
Cost of deposits (1)
2.57
%
2.56
%
2.74
%
3.04
%
3.10
%
Net interest margin (1)
7.27
%
7.00
%
7.03
%
7.00
%
7.06
%
Noninterest expense to average assets (1)
11.13
%
6.78
%
6.25
%
6.13
%
6.52
%
Noninterest income to average assets (1)
7.00
%
5.37
%
5.04
%
5.83
%
3.82
%
Efficiency ratio
79.24
%
55.85
%
52.75
%
48.50
%
60.98
%
Loans receivable to deposits (2)
88.77
%
79.02
%
92.20
%
94.32
%
92.01
%
(1)Annualized calculations shown for quarterly periods presented.
(2)Includes loans held for sale.
Second Quarter Conference Call
The Company will host its second quarter conference call on July 30, 2026 at 8 a.m. ET (5 a.m. PT). A live webcast of the conference call, as well as a replay, will be available online on the Investor Relations section of the Company’s investor website at https://ir.coastalbank.com/
Q2 Earnings Call Webcast Link: Link to Earnings Call
Coastal Financial Corporation Overview
The Company has one main subsidiary, the Bank, which consists of three segments: CCBX, the community bank and treasury & administration. The CCBX segment includes all of our BaaS activities, the community bank segment includes all community banking activities and the treasury & administration segment includes treasury management, overall administration and all other aspects of the Company.
CCBX Performance Update
Our CCBX segment continues to evolve, and we have 30 relationships, at varying stages, including one partner in testing, one in implementation/onboarding, three signed LOIs and three winding down as of June 30, 2026. We continue to focus on the composition of our partner portfolio by emphasizing relationships with well-established organizations that align with our long-term strategy, while continually evaluating our portfolio to ensure it reflects our risk and return objectives. As part of this disciplined approach, we remain focused on strengthening existing partnerships, thoughtfully expanding product offerings, and selectively adding new relationships that complement our platform and support sustainable growth.
5
Our strategy is centered on building long-term partnerships and leveraging the scale of our existing relationships to drive continued growth while maintaining a strong focus on prudent risk management and operational excellence.
Increased partner activity and transaction volumes are driving growth in noninterest income, a trend we expect to continue as existing products scale and new offerings are introduced. As part of our strategy to manage partner and lending limits, as well as overall portfolio composition and credit quality, we plan to continue selling loans. We also retain a portion of the fee income associated with processing transactions on sold credit card loans. This revenue stream continues to grow and is expected to provide ongoing income without adding balance sheet risk or capital requirements.
As our deposit base grows, we expect to continue moving deposits on and off the balance sheet, subject to applicable agreements, to manage liquidity, FDIC insurance coverage, and deposit program operations. This deposit sweep capability allows us to better manage liquidity and deposit programs. At June 30, 2026 we swept off $4.26 billion in deposits for FDIC insurance and liquidity purposes, and generated $1.2 million in noninterest income during the quarter ended June 30, 2026, compared to $710,000 for the quarter ended March 31, 2026. During the quarter ended June 30, 2026, eight partner programs were in various stages of expansion to include additional products, such as lines of credit, deposit programs, asset backed credit cards, credit cards, and other lending products. The expansion of these and other partner initiatives is expected to drive higher partner revenue in upcoming periods.
The following table illustrates the activity and evolution in CCBX relationships for the periods presented.
As of
(unaudited)
June 30, 2026
March 31, 2026
June 30, 2025
Active
22
20
20
Friends and family / testing
1
2
2
Implementation / onboarding
1
3
2
Signed letters of intent
3
2
5
Wind down - active but preparing to exit relationship
3
3
0
Total CCBX relationships
30
30
29
Total exited relationships life to date
10
9
8
CCBX loans increased $341.6 million, or 18.1%, to $2.23 billion despite selling $4.56 billion in loans during the three months ended June 30, 2026, $3.68 billion of which was new activity on previously sold credit card loans.
The following table details the CCBX loan portfolio:
CCBX
As of
June 30, 2026
March 31, 2026
June 30, 2025
(dollars in thousands; unaudited)
Balance
% to Total
Balance
% to Total
Balance
% to Total
Commercial and industrial loans:
Capital call lines
$
204,835
9.2
%
$
176,384
9.4
%
$
199,675
11.9
%
All other commercial & industrial loans
24,638
1.1
21,792
1.2
26,142
1.6
Real estate loans:
Residential real estate loans
324,873
14.6
266,037
14.1
234,786
14.0
Consumer and other loans:
Credit cards
753,171
33.8
693,485
36.8
533,925
31.8
Other consumer and other loans
918,779
41.3
726,943
38.5
686,321
40.7
Gross CCBX loans receivable
2,226,296
100.0
%
1,884,641
100.0
%
1,680,849
100.0
%
Net deferred origination fees
(544)
(517)
(569)
Loans receivable
$
2,225,752
$
1,884,124
$
1,680,280
Loan Yield - CCBX (1)(2)
14.56
%
15.01
%
16.22
%
6
(1)CCBX yield does not include the impact of BaaS loan expense. BaaS loan expense represents the amount paid or payable to partners for credit enhancements and originating & servicing CCBX loans. See reconciliation of the non-GAAP measures at the end of this earnings release for the impact of BaaS loan expense on CCBX loan yield.
(2)Loan yield is annualized for the three months ended for each period presented and includes loans held for sale and nonaccrual loans.
The increase in CCBX loans in the quarter ended June 30, 2026, includes an increase of $251.5 million, or 17.7%, in consumer and other loans, an increase of $58.8 million, or 22.1%, in residential real estate and an increase of $28.5 million, or 16.1%, in capital call lines as a result of normal balance fluctuations and business activities. We sold $4.56 billion in CCBX loans during the quarter ended June 30, 2026 compared to sales of $3.28 billion in the quarter ended March 31, 2026. We continue to manage CCBX credit and concentration levels in an effort to optimize our loan portfolio earnings and generate off-balance sheet fee income. CCBX loan yield decreased 0.45% for the quarter ended June 30, 2026 compared to the quarter ended March 31, 2026 due to a change in overall mix of loans compared to the quarter ended March 31, 2026.
7
The following charts show the growth and quarter over quarter changes in credit card accounts that generate fee income. This includes accounts with balances, which are included in our loan totals, and accounts that have been sold and have no corresponding balance in our loan totals, both of which generate fee income.
8
The following table details the CCBX deposit portfolio:
CCBX
As of
June 30, 2026
March 31, 2026
June 30, 2025
(dollars in thousands; unaudited)
Balance
% to Total
Balance
% to Total
Balance
% to Total
Demand, noninterest bearing
$
109,634
3.3
%
$
77,890
2.2
%
$
60,448
2.6
%
Interest bearing demand and money market
2,723,084
82.8
3,121,888
90.0
2,231,159
94.5
Savings
455,014
13.9
268,444
7.7
51,523
2.2
Total core deposits
3,287,732
100.0
3,468,222
100.0
2,343,130
99.3
Other deposits
—
0.0
—
0.0
17,013
0.7
Total CCBX deposits
$
3,287,732
100.0
%
$
3,468,222
100.0
%
$
2,360,143
100.0
%
Cost of deposits (1)
3.19
%
3.17
%
3.96
%
(1)Cost of deposits is annualized for the three months ended for each period presented.
CCBX deposits reported on the balance sheet decreased $180.5 million, or 5.2%, in the three months ended June 30, 2026 to $3.29 billion. The decline was primarily attributable to increased use of off-balance sheet sweep arrangements and does not reflect a decline in underlying partner deposit activity. Deposits swept off-balance sheet for increased FDIC insurance coverage and liquidity purposes increased to $4.26 billion at June 30, 2026, compared to $2.81 billion for the quarter ended March 31, 2026, demonstrating continued growth in partner balances despite lower reported on-balance-sheet balances. Using third-party facilitator/vendor sweep products, amounts in excess of FDIC insurance coverage are swept off-balance sheet to participating financial institutions.
Community Bank Performance Update
In the quarter ended June 30, 2026, the community bank saw net loans increase $7.3 million, or 0.4%, to $1.98 billion, as a result of loan originations and normal balance fluctuations.
The following table details the community bank loan portfolio:
Community Bank
As of
June 30, 2026
March 31, 2026
June 30, 2025
(dollars in thousands; unaudited)
Balance
% to Total
Balance
% to Total
Balance
% to Total
Commercial and industrial loans
$
237,176
11.9
%
$
235,603
11.9
%
$
149,926
8.0
%
Real estate loans:
Construction, land and land development loans
221,562
11.2
234,911
11.8
194,150
10.4
Residential real estate loans
199,530
10.0
199,185
10.1
198,844
10.7
Commercial real estate loans
1,319,798
66.4
1,300,547
65.6
1,310,882
70.2
Consumer and other loans:
Other consumer and other loans
10,760
0.5
11,587
0.6
12,230
0.7
Gross community bank loans receivable
1,988,826
100.0
%
1,981,833
100.0
%
1,866,032
100.0
%
Net deferred origination fees
(6,308)
(6,578)
(5,944)
Loans receivable
$
1,982,518
$
1,975,255
$
1,860,088
Loan Yield(1)
6.57
%
6.58
%
6.53
%
(1)Loan yield is annualized for the three months ended for each period presented and includes loans held for sale and nonaccrual loans.
The increase in community bank loans consisted of an increase of $19.3 million in commercial real estate loans, an increase of $1.6 million in commercial and industrial loans and an increase of $345,000 in residential real estate loans, partially offset by a decrease of $13.3 million in construction, land and land development loans, and $827,000 in consumer and other loans during the quarter ended June 30, 2026.
9
The following table details the community bank deposit portfolio:
Community Bank
As of
June 30, 2026
March 31, 2026
June 30, 2025
(dollars in thousands; unaudited)
Balance
% to Total
Balance
% to Total
Balance
% to Total
Demand, noninterest bearing
$
502,844
31.9
%
$
501,271
31.9
%
$
494,907
31.9
%
Interest bearing demand and money market
1,005,748
63.9
1,006,623
64.0
545,655
35.1
Savings
54,459
3.5
52,851
3.4
57,933
3.7
Total core deposits
1,563,051
99.3
1,560,745
99.2
1,098,495
70.7
Other deposits
1
0.0
1
0.0
440,975
28.4
Time deposits less than $250,000
7,283
0.5
8,121
0.5
5,299
0.3
Time deposits $250,000 and over
3,831
0.2
4,075
0.3
8,659
0.6
Total community bank deposits
$
1,574,166
100.0
%
$
1,572,942
100.0
%
$
1,553,428
100.0
%
Cost of deposits(1)
1.46
%
1.46
%
1.77
%
(1)Cost of deposits is annualized for the three months ended for each period presented.
Community bank deposits increased $1.2 million, or 0.1%, during the three months ended June 30, 2026 to $1.57 billion as a result of normal growth and balance fluctuations. The community bank segment includes noninterest bearing deposits of $502.8 million, or 31.9%, of total community bank deposits, resulting in a cost of deposits of 1.46%, which is unchanged from the quarter ended March 31, 2026.
10
Net Interest Income and Margin Discussion
Net interest income was $89.4 million for the quarter ended June 30, 2026, an increase of $6.0 million, or 7.2%, from $83.4 million for the quarter ended March 31, 2026, and an increase of $12.6 million, or 16.4%, from $76.7 million for the quarter ended June 30, 2025. Net interest income compared to March 31, 2026 and June 30, 2025 was higher due to interest on loans due to an increase in average loans receivable partially offset by a decrease in interest on interest earning deposits with other banks due to lower average balances.
Net interest margin was 7.27% for the three months ended June 30, 2026, compared to 7.00% for the three months ended March 31, 2026 and 7.06% for the three months ended June 30, 2025. The increase in net interest margin for the three months ended June 30, 2026 compared to the three months ended March 31, 2026 was primarily driven by a higher proportion of interest-earning assets invested in loans rather than interest-bearing deposits with other banks. Net interest margin, net of BaaS loan expense, (a reconciliation of the non-GAAP measures are set forth in the Non-GAAP Financial Measures section of this earnings release) was 3.98% for the three months ended June 30, 2026, compared to 3.90% for the three months ended March 31, 2026 and 4.07% for the three months ended June 30, 2025. The quarter-over-quarter increase in net interest margin, net of BaaS loan expense, was also primarily driven by a higher proportion of interest-earning assets invested in loans rather than interest-bearing deposits with other banks.
Interest and fees on loans receivable increased $8.2 million, or 8.0%, to $111.1 million for the three months ended June 30, 2026, compared to $102.9 million for the three months ended March 31, 2026, as a result of an increase in loans receivable. Interest and fees on loans receivable increased $12.2 million, or 12.4%, compared to $98.9 million for the three months ended June 30, 2025, due to loan growth, partially offset by a decrease in loan yield.
The following table illustrates how net interest margin and loan yield is affected by BaaS loan expense:
Consolidated
As of and for the Three Months Ended
(dollars in thousands; unaudited)
June 30 2026
March 31 2026
June 30 2025
Net interest margin, net of BaaS loan expense:
Net interest margin (1)
7.27
%
7.00
%
7.06
%
Earning assets
4,928,350
4,830,601
4,356,591
Net interest income (GAAP)
89,367
83,357
76,737
Less: BaaS loan expense
(40,409)
(36,940)
(32,483)
Net interest income, net of BaaS loan expense(2)
$
48,958
$
46,417
$
44,254
Net interest margin, net of BaaS loan expense (1)(2)
3.98
%
3.90
%
4.07
%
Loan income net of BaaS loan expense divided by average loans:
Loan yield (GAAP)(1)
10.74
%
10.76
%
11.11
%
Total average loans receivable
$
4,148,380
$
3,878,626
$
3,567,823
Interest and earned fee income on loans (GAAP)
111,097
102,887
98,867
BaaS loan expense
(40,409)
(36,940)
(32,483)
Net loan income(2)
$
70,688
$
65,947
$
66,384
Loan income, net of BaaS loan expense, divided by average loans (1)(2)
6.83
%
6.90
%
7.46
%
(1) Annualized calculations shown for periods presented.
(2) A reconciliation of the non-GAAP measures are set forth at the end of this earnings release.
Average investment securities decreased $1.6 million to $45.8 million compared to the three months ended March 31, 2026 as a result of maturities and principal paydowns, and decreased $482,000 compared to the three months ended June 30, 2025.
Cost of funds was 2.62% for the quarter ended June 30, 2026, an increase of three basis points from the quarter ended March 31, 2026 and a decrease of 51 basis points from the quarter ended June 30, 2025. Cost of deposits for the quarter ended June 30, 2026 was 2.57%, compared to 2.56% for the quarter ended March 31, 2026, and 3.10% for the quarter ended June 30, 2025. The decreased cost of funds and deposits compared to June 30, 2025 was largely due to the reductions in the Fed funds rate in 2025.
11
The following table summarizes the average yield on loans receivable and cost of deposits:
For the Three Months Ended
June 30, 2026
March 31, 2026
June 30, 2025
Yield on
Loans (2)
Cost of
Deposits (2)
Yield on
Loans (2)
Cost of
Deposits (2)
Yield on
Loans (2)
Cost of
Deposits (2)
Community Bank
6.57%
1.46%
6.58%
1.46%
6.53%
1.77%
CCBX (1)
14.56%
3.19%
15.01%
3.17%
16.22%
3.96%
Consolidated
10.74%
2.57%
10.76%
2.56%
11.11%
3.10%
(1)CCBX yield on loans does not include the impact of BaaS loan expense. BaaS loan expense represents the amount paid or payable to partners for credit and fraud enhancements and originating & servicing CCBX loans. To determine Net BaaS loan income earned from CCBX loan relationships, the Company takes BaaS loan interest income and deducts BaaS loan expense to arrive at Net BaaS loan income, which can be compared to interest income on the Company’s community bank loans. See reconciliation of the non-GAAP measures at the end of this earnings release for the impact of BaaS loan expense on CCBX loan yield.
(2)Annualized calculations for periods presented.
The following table illustrates how BaaS loan interest income is affected by BaaS loan expense resulting in net BaaS loan income and the associated yield:
For the Three Months Ended
June 30, 2026
March 31, 2026
June 30, 2025
(dollars in thousands, unaudited)
Income / Expense
Income / expense divided by average CCBX loans (2)
Income / Expense
Income / expense divided by average CCBX loans(2)
Income / Expense
Income / expense divided by average CCBX loans (2)
BaaS loan interest income
$
78,580
14.56
%
$
71,153
15.01
%
$
68,264
16.22
%
Less: BaaS loan expense
40,409
7.49
%
36,940
7.79
%
32,483
7.72
%
Net BaaS loan income (1)
$
38,171
7.07
%
$
34,213
7.22
%
$
35,781
8.50
%
Average BaaS Loans(3)
$
2,164,634
$
1,922,586
$
1,688,492
(1) A reconciliation of the non-GAAP measures are set forth at the end of this earnings release.
(2) Annualized calculations shown for the periods presented.
(3) Includes loans held for sale.
12
Noninterest Income Discussion
Noninterest income was $88.7 million for the three months ended June 30, 2026, an increase of $22.6 million from $66.1 million for the three months ended March 31, 2026, and an increase of $46.0 million from $42.7 million for the three months ended June 30, 2025. The increase in noninterest income for the quarter ended June 30, 2026 as compared to the quarter ended March 31, 2026 was primarily due to a $20.0 million increase in BaaS credit enhancements related to the increase in provision for credit losses based upon an analysis of the CCBX loan portfolio, a $1.3 million increase in BaaS fraud enhancements, and an increase of $1.1 million in BaaS program income (see “Appendix B” for more information on the accounting for BaaS allowance for credit losses and credit and fraud enhancements).
The $46.0 million increase in noninterest income over the quarter ended June 30, 2025 was primarily due to a $41.0 million increase in BaaS credit and fraud enhancements due primarily to loan growth in the CCBX loan portfolio and an increase of $4.4 million in BaaS program income.
Noninterest Expense Discussion
Total noninterest expense increased $57.7 million to $141.1 million for the three months ended June 30, 2026, compared to $83.5 million for the three months ended March 31, 2026, and increased $68.3 million from $72.8 million for the three months ended June 30, 2025. The $57.7 million increase in noninterest expense for the quarter ended June 30, 2026, as compared to the quarter ended March 31, 2026, was primarily due to a $46.0 million credit enhancement receivable valuation adjustment related to the assessment of collectability for one CCBX partner, a $6.7 million increase in data processing and software licenses and a $451,000 increase in salaries and employee benefits, partially offset by an $805,000 decrease in legal and professional fees. Also contributing to the variance is a $3.5 million increase in BaaS loan expense, and a $1.3 million increase in BaaS fraud expense. BaaS loan expense represents the amount paid or payable to partners for credit enhancements and originating & servicing CCBX loans. BaaS fraud expense represents non-credit fraud losses on partner’s customer loan and deposit accounts. A portion of this expense is realized during the quarter in which the loss occurs, and a portion is estimated based on historical or other information from our partners. Data processing and software license costs increased due to continued investments in growth, technology and risk management and included a $4.4 million impact from revising the estimated useful life of certain software assets to reflect their abandonment as they are replaced with the technology modernization initiatives.
The $68.3 million increase in noninterest expenses for the quarter ended June 30, 2026 compared to the quarter ended June 30, 2025 was largely due to a $46.0 million credit enhancement receivable valuation adjustment, $8.8 million increase in data processing and software licenses due to enhancements and investments in technology and a $2.2 million increase in salaries and employee benefits. Also contributing to the variance is a $7.9 million increase in BaaS loan expense and a $1.5 million increase in BaaS fraud expense.
Certain operating expenses associated with CCBX programs are reimbursed by our CCBX partners. In accordance with GAAP we recognize all expenses in noninterest expense and the reimbursement of expenses from our CCBX partners in noninterest income. The following table reflects the portion of noninterest expenses that are reimbursed by partners to assist in understanding how the increases in noninterest expense are related to expenses incurred and reimbursed by CCBX partners:
Three Months Ended
June 30,
March 31,
June 30,
(dollars in thousands; unaudited)
2026
2026
2025
Total noninterest expense (GAAP)
$
141,111
$
83,452
$
72,832
Less: BaaS loan expense
40,409
36,940
32,483
Less: BaaS fraud expense
4,312
3,059
2,804
Less: Reimbursement of expenses (BaaS)
2,259
2,392
646
Noninterest expense, net of BaaS loan expense, BaaS fraud expense
and reimbursement of expenses (BaaS) (1)
$
94,131
$
41,061
$
36,899
(1) A reconciliation of the non-GAAP measures are set forth at the end of this earnings release.
13
Provision for Income Taxes
The provision for income taxes reflected a benefit of $13.1 million for the three months ended June 30, 2026, compared to tax expense of $2.6 million for the three months ended March 31, 2026 and $3.4 million for the three months ended June 30, 2025. The tax benefit recognized during the three months ended June 30, 2026 was primarily attributable to the pre-tax loss incurred during the period, while differences between periods also reflect changes in the taxability of certain equity awards.
As CCBX activities and employee presence expand into additional states, the Company becomes subject to additional state tax jurisdictions, which has increased the overall tax rate used in calculating the provision for income taxes. The Company uses a federal statutory tax rate of 21.0% as a basis for calculating provision for federal income taxes and 5.14% for calculating the provision for state income taxes.
Financial Condition Overview
Total assets decreased $207.7 million, or 3.7%, to $5.46 billion at June 30, 2026 compared to $5.66 billion at March 31, 2026. The decrease is primarily comprised of a $482.4 million decrease in interest earning deposits with other banks and a $16.2 million decrease in loans held for sale, partially offset by a $348.9 million increase in loans receivable.
As of June 30, 2026, in addition to the $1.01 billion in cash on hand, the Company had borrowing capacity of up to a total of $865.6 million from the Federal Reserve Bank discount window and Federal Home Loan Bank, plus an additional $250.0 million available under credit facilities with banker's banks. There were no borrowings outstanding on these lines as of June 30, 2026.
The Company, on a stand alone basis, had a cash balance of $40.2 million as of June 30, 2026, a portion of which is retained for general operating purposes, including debt repayment, and for funding $917,000 in commitments to bank technology investment funds, with the remaining cash available to be contributed to the Bank as capital.
Uninsured deposits were estimated at $1.35 billion as of June 30, 2026, compared to $1.77 billion as of March 31, 2026. While uninsured deposits decreased from the prior quarter, they are expected to remain above historical levels due to the composition and timing of certain partner deposit balances, including the periodic use of sweep arrangements.
Total shareholders’ equity as of June 30, 2026 decreased $40.3 million since March 31, 2026. The decrease in shareholders’ equity was primarily comprised of $42.1 million in net losses partially offset by an increase of $1.8 million in common stock outstanding as a result of equity awards vested and exercised during the three months ended June 30, 2026.
The Company and the Bank remained well capitalized at June 30, 2026, as summarized in the following table.
(unaudited)
Coastal Community Bank
Coastal Financial Corporation
Minimum Well Capitalized Ratios under Prompt Corrective Action (1)
Tier 1 Leverage Capital (to average assets)
9.12
%
9.11
%
5.00
%
Common Equity Tier 1 Capital (to risk-weighted assets)
10.97
%
10.86
%
6.50
%
Tier 1 Capital (to risk-weighted assets)
10.97
%
10.94
%
8.00
%
Total Capital (to risk-weighted assets)
12.27
%
13.30
%
10.00
%
(1) Presents the minimum capital ratios for an insured depository institution, such as the Bank, to be considered well capitalized under the Prompt Corrective Action framework. The minimum requirements for the Company to be considered well capitalized under Regulation Y include to maintain, on a consolidated basis, a total risk-based capital ratio of 10.0 percent or greater and a tier 1 risk-based capital ratio of 6.0 percent or greater.
Asset Quality
The allowance for credit losses was $213.7 million and 5.08% of loans receivable at June 30, 2026 compared to $172.4 million and 4.47% at March 31, 2026 and $164.8 million and 4.65% at June 30, 2025. The allowance for credit loss allocated to the CCBX portfolio was $198.0 million and 8.90% of CCBX loans receivable at June 30, 2026, with $15.7 million of allowance for credit loss allocated to the community bank, or 0.79% of total community bank loans receivable.
14
The following table details the allocation of the allowance for credit loss as of the period indicated:
As of June 30, 2026
As of March 31, 2026
As of June 30, 2025
(dollars in thousands; unaudited)
Community Bank
CCBX
Total
Community Bank
CCBX
Total
Community Bank
CCBX
Total
Loans receivable
$
1,982,518
$
2,225,752
$
4,208,270
$
1,975,255
$
1,884,124
$
3,859,379
$
1,860,088
$
1,680,280
$
3,540,368
Allowance for credit losses
(15,723)
(198,001)
(213,724)
(18,153)
(154,274)
(172,427)
(18,936)
(145,858)
(164,794)
Allowance for credit losses to total loans receivable
0.79
%
8.90
%
5.08
%
0.92
%
8.19
%
4.47
%
1.02
%
8.68
%
4.65
%
Net charge-offs totaled $50.6 million for the quarter ended June 30, 2026, compared to $49.6 million for the quarter ended March 31, 2026 and $49.3 million for the quarter ended June 30, 2025. Net charge-offs as a percent of average loans decreased to 4.90% for the quarter ended June 30, 2026 compared to 5.18% for the quarter ended March 31, 2026, and 5.54% for the quarter ended June 30, 2025. Under one partner program, the Company retains ownership of approximately 5% of a $350.8 million loan portfolio and retains the provision for credit losses for that portfolio. At June 30, 2026, our retained exposure totaled $23.4 million in loans. Net charge-offs for this $23.4 million in loans were $1.0 million for the three months ended June 30, 2026, $1.0 million for the three months ended March 31, 2026 and $1.3 million for the three months ended June 30, 2025.
The following table details net charge-offs for the community bank and CCBX for the period indicated:
Three Months Ended
June 30, 2026
March 31, 2026
June 30, 2025
(dollars in thousands; unaudited)
Community Bank
CCBX
Total
Community Bank
CCBX
Total
Community Bank
CCBX
Total
Gross charge-offs
$
56
$
58,162
$
58,218
$
2
$
54,521
$
54,523
$
11
$
53,769
$
53,780
Gross recoveries
(2)
(7,581)
(7,583)
(3)
(4,933)
(4,936)
(2)
(4,465)
(4,467)
Net charge-offs (recoveries)
$
54
$
50,581
$
50,635
$
(1)
$
49,588
$
49,587
$
9
$
49,304
$
49,313
Net charge-offs to
average loans (1)
0.01
%
9.37
%
4.90
%
0.00
%
10.46
%
5.18
%
0.00
%
11.71
%
5.54
%
(1) Annualized calculations shown for periods presented.
During the quarter ended June 30, 2026, a $94.3 million provision for credit losses was recorded for CCBX partner loans, compared to $52.6 million for the quarter ended March 31, 2026. The increase in the provision for credit losses compared to the prior quarter was primarily driven by loan growth, changes in the composition of the loan portfolio and the establishment of a $22.8 million specific provision related to one partner relationship for credit losses not expected to be fully recovered under the partner's indemnification arrangement following an individual assessment of collectability, bringing the CCBX allowance for credit losses to $198.0 million at June 30, 2026 compared to $154.3 million at March 31, 2026. In general, CCBX loans have a higher level of expected losses than our community bank loans, which is reflected in the factors for the allowance for credit losses.
In accordance with accounting guidance, we estimate and record a provision for expected losses for these CCBX loans and reclassified negative deposit accounts, with expected losses reflected in the allowance for credit losses. When provision expense is recognized for CCBX credit losses and unfunded commitments that are subject to partner indemnification, we also record a credit enhancement asset through noninterest income (BaaS credit enhancements) representing amounts contractually due under the applicable partner agreements. We evaluate the collectability of the credit enhancement asset each reporting period and record a valuation adjustment when collection of all or a portion of the asset is no longer considered probable. The credit enhancement asset is reduced as indemnification payments are received from CCBX partners. Management regularly evaluates and manages counterparty risk associated with its CCBX partners, as the Bank could incur additional credit losses to the extent a partner is unable to fulfill its contractual obligations.
The factors used in management’s analysis for community bank credit losses indicated that a provision recapture of $2.2 million was needed for the quarter ended June 30, 2026 compared to a provision recapture of $1.4 million and $47,000 for the quarters ended March 31, 2026 and June 30, 2025, respectively. The provision recapture in the current period was due
15
to a decrease in weighted average life of the construction, land and land development portfolio and an improvement in the overall mix of the portfolio.
The following table details the provision expense/(recapture) for the community bank and CCBX for the period indicated:
Three Months Ended
(dollars in thousands; unaudited)
June 30, 2026
March 31, 2026
June 30, 2025
Community bank
$
(2,164)
$
(1,428)
$
(47)
CCBX
94,309
52,563
30,976
Total provision expense
$
92,145
$
51,135
$
30,929
Included in provision expense was a $213,000 provision for unfunded commitments, recorded primarily due to higher loss rates on certain CCBX loans.
At June 30, 2026, our nonperforming assets were $75.2 million, or 1.38%, of total assets, compared to $67.6 million, or 1.19%, of total assets, at March 31, 2026, and $60.9 million, or 1.36%, of total assets, at June 30, 2025. These ratios are impacted by nonperforming CCBX loans that are covered by CCBX partner credit enhancements. As of June 30, 2026, $67.0 million of the $69.0 million in nonperforming CCBX loans were covered by CCBX partner credit enhancements described above. Additionally, certain CCBX partners employ collection practices that place specific loans on nonaccrual status to enhance collectability. As of June 30, 2026, $24.6 million of these loans are less than 90 days past due.
Nonperforming assets increased $7.5 million during the quarter ended June 30, 2026, compared to the quarter ended March 31, 2026. Community bank nonperforming loans increased $1.4 million from March 31, 2026 to $6.2 million as of June 30, 2026. CCBX nonperforming loans increased $6.2 million to $69.0 million from March 31, 2026. The increase in CCBX nonperforming loans is due to an increase of $2.9 million in nonaccrual loans from March 31, 2026 to $30.5 million, combined with a $3.3 million increase in CCBX loans that are past due 90 days or more and still accruing interest. As a result of the type of loans (primarily consumer loans) originated through our CCBX partners, we would typically anticipate that balances 90 days past due or more and still accruing will generally increase as those loan portfolios grow. Consumer loans originated through CCBX lending partners may continue to accrue interest beyond 90 days past due. Installment (closed-end) loans generally continue to accrue until 120 past due while revolving (open-end) loans generally continue to accrue until 180 days past due. There were no repossessed assets or other real estate owned at June 30, 2026. Our nonperforming loans to loans receivable ratio was 1.79% at June 30, 2026, compared to 1.75% at March 31, 2026 and 1.72% at June 30, 2025.
16
The following table details the Company’s nonperforming assets for the periods indicated.
Consolidated
As of
(dollars in thousands; unaudited)
June 30, 2026
March 31, 2026
June 30, 2025
Nonaccrual loans:
Commercial and industrial loans
$
243
$
251
$
2,333
Real estate loans:
Construction, land and land development
—
—
1,697
Residential real estate
1,705
314
—
Commercial real estate
4,344
4,344
—
Consumer and other loans:
Credit cards
26,670
24,497
20,140
Other consumer and other loans
3,729
3,015
4,063
Total nonaccrual loans
36,691
32,421
28,233
Accruing loans past due 90 days or more:
Commercial & industrial loans
504
604
926
Real estate loans:
Residential real estate loans
1,446
2,241
1,817
Consumer and other loans:
Credit cards
27,077
24,149
23,116
Other consumer and other loans
9,472
8,205
6,775
Total accruing loans past due 90 days or more
38,499
35,199
32,634
Total nonperforming loans
75,190
67,620
60,867
Real estate owned
—
—
—
Repossessed assets
—
—
—
Total nonperforming assets
$
75,190
$
67,620
$
60,867
Total nonaccrual loans to loans receivable
0.87
%
0.84
%
0.80
%
Total nonperforming loans to loans receivable
1.79
%
1.75
%
1.72
%
Total nonperforming assets to total assets
1.38
%
1.19
%
1.36
%
17
The following tables detail the CCBX and community bank nonperforming assets, which are included in the total nonperforming assets table above.
CCBX
As of
(dollars in thousands; unaudited)
June 30, 2026
March 31, 2026
June 30, 2025
Nonaccrual loans:
Commercial and industrial loans:
All other commercial & industrial loans
$
68
$
81
$
188
Consumer and other loans:
Credit cards
26,670
24,497
20,140
Other consumer and other loans
3,729
3,015
4,063
Total nonaccrual loans
30,467
27,593
24,391
Accruing loans past due 90 days or more:
Commercial & industrial loans
504
604
926
Real estate loans:
Residential real estate loans
1,446
2,241
1,817
Consumer and other loans:
Credit cards
27,077
24,149
23,116
Other consumer and other loans
9,472
8,205
6,775
Total accruing loans past due 90 days or more
38,499
35,199
32,634
Total nonperforming loans
68,966
62,792
57,025
Other real estate owned
—
—
—
Repossessed assets
—
—
—
Total nonperforming assets
$
68,966
$
62,792
$
57,025
Total CCBX nonperforming assets to total consolidated assets
1.26
%
1.11
%
1.27
%
Community Bank
As of
(dollars in thousands; unaudited)
June 30, 2026
March 31, 2026
June 30, 2025
Nonaccrual loans:
Commercial and industrial loans
$
175
$
170
$
2,145
Real estate:
Construction, land and land development
—
—
1,697
Residential real estate
1,705
314
—
Commercial real estate
4,344
4,344
—
Total nonaccrual loans
6,224
4,828
3,842
Accruing loans past due 90 days or more:
Total accruing loans past due 90 days or more
—
—
—
Total nonperforming loans
6,224
4,828
3,842
Other real estate owned
—
—
—
Repossessed assets
—
—
—
Total nonperforming assets
$
6,224
$
4,828
$
3,842
Total community bank nonperforming assets to total consolidated assets
0.11
%
0.09
%
0.09
%
Negative deposit account balances are reclassified as loans for financial reporting purposes and are included in the Company's allowance for credit losses under its CECL methodology. Because these balances do not accrue interest, they are not included in nonaccrual loans. Management monitors the aging, collectability and expected credit losses associated with these balances as part of its ongoing credit risk management process. At June 30, 2026, reclassified negative deposit accounts outstanding for more than 90 days totaled $22.8 million.
18
About Coastal Financial
Coastal Financial Corporation (Nasdaq: CCB) (the “Company”), is an Everett, Washington based bank holding company whose wholly owned subsidiaries are Coastal Community Bank (“Bank”) and Arlington Olympic LLC. The $5.46 billion Bank provides service through 14 full-service branches in Snohomish, Island and King Counties, one loan production office in King County, the Internet and its mobile banking application. The Bank provides banking as a service to digital financial service providers, companies and brands that want to provide financial services to their customers through the Bank's CCBX segment. To learn more about the Company visit www.coastalbank.com.
CCB-ER
Contact
Eric Sprink, Chief Executive Officer, esprink@coastalbank.com
Brandon J. Soto, Executive Vice President & Chief Financial Officer, bsoto@coastalbank.com
Forward-Looking Statements
This earnings release contains forward-looking statements within the meaning of the Private Securities Litigation Reform Act of 1995. These forward-looking statements reflect our current views with respect to, among other things, future events and our financial performance. Any statements about our management’s expectations, beliefs, plans, predictions, forecasts, objectives, assumptions or future events or performance are not historical facts and may be forward-looking. These statements are often, but not always, made through the use of words or phrases such as “anticipate,” “believes,” “can,” “could,” “may,” “predicts,” “potential,” “should,” “will,” “estimate,” “plans,” “projects,” “continuing,” “ongoing,” “expects,” “intends” and similar words or phrases. Any or all of the forward-looking statements in this earnings release may turn out to be inaccurate. The inclusion of or reference to forward-looking information in this earnings release should not be regarded as a representation by us or any other person that the future plans, estimates or expectations contemplated by us will be achieved. We have based these forward looking statements largely on our current expectations and projections about future events and financial trends that we believe may affect our financial condition, results of operations, business strategy and financial needs. Our actual results could differ materially from those anticipated in such forward-looking statements as a result of risks, uncertainties and assumptions that are difficult to predict. Factors that could cause actual results to differ materially from those in the forward-looking statements include, without limitation, our ability to effectively evaluate and manage counterparty risk associated with CCBX partners and the risk that the conflicts in the Middle East and/or changes in U.S. trade policies, including the imposition of tariffs and retaliatory tariffs, may adversely impact our business, financial condition, and results of operations and those other risks and uncertainties discussed under “Risk Factors” in our Annual Report on Form 10-K for the most recent period filed and in any of our subsequent filings with the Securities and Exchange Commission.
If one or more events related to these or other risks or uncertainties materialize, or if our underlying assumptions prove to be incorrect, actual results may differ materially from what we anticipate. You are cautioned not to place undue reliance on forward-looking statements. Further, any forward-looking statement speaks only as of the date on which it is made, and we undertake no obligation to update or revise any forward-looking statement to reflect events or circumstances after the date on which the statement is made or to reflect the occurrence of unanticipated events, except as required by law.
19
COASTAL FINANCIAL CORPORATION
CONDENSED CONSOLIDATED STATEMENTS OF FINANCIAL CONDITION
(Dollars in thousands; unaudited)
ASSETS
June 30, 2026
March 31, 2026
December 31, 2025
September 30, 2025
June 30, 2025
Cash and due from banks
$
48,088
$
52,695
$
34,241
$
34,928
$
29,546
Interest earning deposits with other banks
960,360
1,442,772
702,729
607,330
690,213
Investment securities, available-for-sale, at fair value
27
28
29
31
33
Investment securities, held-to-maturity, at amortized cost
45,219
46,141
48,218
43,911
45,544
Other investments
14,177
14,023
12,837
12,778
12,521
Loans held for sale
107,838
124,039
71,216
42,894
60,474
Loans receivable
4,208,270
3,859,379
3,749,531
3,703,848
3,540,330
Allowance for credit losses
(213,724)
(172,427)
(169,530)
(173,813)
(164,794)
Total loans receivable, net
3,994,546
3,686,952
3,580,001
3,530,035
3,375,536
CCBX credit enhancement asset, net
154,346
180,587
177,657
177,741
167,779
CCBX receivable
28,134
24,926
23,047
16,260
13,009
Premises and equipment, net
25,736
29,710
29,325
29,114
29,052
Lease right-of-use assets
4,368
4,641
4,821
4,788
4,891
Accrued interest receivable
20,937
20,139
18,613
20,493
20,849
Bank-owned life insurance, net
14,199
14,044
13,910
13,777
13,648
Deferred tax asset, net
16,196
—
—
—
3,829
Intangible assets, net
4,207
4,434
4,536
—
—
Other assets
17,774
18,698
20,257
18,996
13,635
Total assets
$
5,456,152
$
5,663,829
$
4,741,437
$
4,553,076
$
4,480,559
LIABILITIES AND SHAREHOLDERS’ EQUITY
LIABILITIES
Deposits
$
4,861,898
$
5,041,164
$
4,144,199
$
3,972,563
$
3,913,571
Subordinated debt, net
44,518
44,480
44,443
44,406
44,368
Junior subordinated debentures, net
3,594
3,594
3,593
3,593
3,592
Deferred compensation
236
251
267
281
295
Accrued interest payable
2,178
2,665
1,435
1,106
954
Lease liabilities
4,522
4,799
4,984
4,956
5,063
CCBX payable
32,980
28,410
27,492
31,221
32,939
Deferred tax liability, net
—
1,656
853
799
—
Other liabilities
42,779
33,048
23,212
18,874
18,068
Total liabilities
4,992,705
5,160,067
4,250,478
4,077,799
4,018,850
SHAREHOLDERS’ EQUITY
Common Stock
236,012
234,222
233,438
230,399
230,423
Retained earnings
227,436
269,541
257,522
244,879
231,287
Accumulated other comprehensive loss, net of tax
(1)
(1)
(1)
(1)
(1)
Total shareholders’ equity
463,447
503,762
490,959
475,277
461,709
Total liabilities and shareholders’ equity
$
5,456,152
$
5,663,829
$
4,741,437
$
4,553,076
$
4,480,559
20
COASTAL FINANCIAL CORPORATION
CONDENSED CONSOLIDATED STATEMENTS OF INCOME
(Dollars in thousands, except per share amounts; unaudited)
Three Months Ended
June 30, 2026
March 31, 2026
December 31, 2025
September 30, 2025
June 30, 2025
INTEREST AND DIVIDEND INCOME
Interest and fees on loans
$
111,097
$
102,887
$
100,206
$
100,367
$
98,867
Interest on interest earning deposits with other banks
6,607
8,128
6,810
8,007
8,085
Interest on investment securities
612
622
635
616
626
Dividends on other investments
238
44
235
37
219
Total interest income
118,554
111,681
107,886
109,027
107,797
INTEREST EXPENSE
Interest on deposits
28,043
27,670
27,863
30,466
30,400
Interest on borrowed funds
1,144
654
658
660
660
Total interest expense
29,187
28,324
28,521
31,126
31,060
Net interest income
89,367
83,357
79,365
77,901
76,737
PROVISION FOR CREDIT LOSSES
92,157
51,398
48,041
56,598
32,211
Net interest income after provision for credit losses
(2,790)
31,959
31,324
21,303
44,526
NONINTEREST INCOME
Service charges and fees
1,016
850
882
903
913
Unrealized gain (loss) on equity securities, net
(25)
126
—
9
(439)
Other income
667
410
459
461
496
Noninterest income, excluding BaaS program income and BaaS indemnification income
1,658
1,386
1,341
1,373
970
Servicing and other BaaS fees
2,917
2,623
2,113
1,575
1,896
Transaction and interchange fees
6,836
5,873
4,924
4,878
5,109
Reimbursement of expenses
2,259
2,392
1,868
1,412
646
BaaS program income
12,012
10,888
8,905
7,865
7,651
BaaS credit enhancements
70,725
50,744
47,325
55,412
31,268
BaaS fraud enhancements
4,312
3,059
1,090
2,127
2,804
BaaS indemnification income
75,037
53,803
48,415
57,539
34,072
Total noninterest income
88,707
66,077
58,661
66,777
42,693
21
NONINTEREST EXPENSE
Salaries and employee benefits
23,615
23,164
22,787
20,189
21,450
Occupancy
890
859
1,091
952
915
Data processing and software licenses
14,348
7,643
6,978
6,114
5,541
Legal and professional expenses
6,197
7,002
4,447
3,957
5,962
Point of sale expense
464
445
105
69
69
Excise taxes
988
1,169
756
696
681
Federal Deposit Insurance Corporation ("FDIC") assessments
Noninterest expense, excluding BaaS loan and BaaS fraud expense
96,390
43,453
40,458
35,205
37,545
BaaS loan expense
40,409
36,940
31,256
32,840
32,483
BaaS fraud expense
4,312
3,059
1,090
2,127
2,804
BaaS loan and fraud expense
44,721
39,999
32,346
34,967
35,287
Total noninterest expense
141,111
83,452
72,804
70,172
72,832
(Loss) income before provision for income taxes
(55,194)
14,584
17,181
17,908
14,387
(BENEFIT) PROVISION FOR INCOME TAXES
(13,089)
2,565
4,538
4,316
3,359
NET INCOME
$
(42,105)
$
12,019
$
12,643
$
13,592
$
11,028
Basic (loss) earnings per common share
$
(2.76)
$
0.79
$
0.84
$
0.90
$
0.73
Diluted (loss) earnings per common share
$
(2.76)
$
0.78
$
0.82
$
0.88
$
0.71
Weighted average number of common shares outstanding:
Basic
15,243,357
15,179,447
15,116,005
15,093,274
15,033,296
Diluted
15,243,357
15,422,822
15,455,856
15,443,987
15,447,923
22
COASTAL FINANCIAL CORPORATION
AVERAGE BALANCES, YIELDS, AND RATES – QUARTERLY
(Dollars in thousands; unaudited)
For the Three Months Ended
June 30, 2026
March 31, 2026
June 30, 2025
Average Balance
Interest & Dividends
Yield /
Cost (1)
Average Balance
Interest & Dividends
Yield /
Cost (1)
Average Balance
Interest & Dividends
Yield /
Cost (1)
Assets
Interest earning assets:
Interest earning deposits with other banks
$
717,893
$
6,607
3.69
%
$
891,511
$
8,128
3.70
%
$
729,652
$
8,085
4.44
%
Investment securities,
available-for-sale (2)
28
—
—
30
1
13.52
35
—
—
Investment securities,
held-to-maturity (2)
45,781
612
5.36
47,420
621
5.31
46,256
626
5.43
Other investments
16,268
238
5.87
13,014
44
1.37
12,825
219
6.85
Loans receivable (3)
4,148,380
111,097
10.74
3,878,626
102,887
10.76
3,567,823
98,867
11.11
Total interest earning assets
4,928,350
118,554
9.65
4,830,601
111,681
9.38
4,356,591
107,797
9.92
Noninterest earning assets:
Allowance for credit losses
(171,130)
(166,987)
(176,022)
Other noninterest earning assets
327,580
324,660
298,698
Total assets
$
5,084,800
$
4,988,274
$
4,479,267
Liabilities and Shareholders’ Equity
Interest bearing liabilities:
Interest bearing deposits
$
3,781,107
$
28,043
2.97
%
$
3,798,235
$
27,670
2.95
%
$
3,369,574
$
30,400
3.62
%
Fed funds borrowings
1,099
11
4.01
—
—
—
—
—
—
FHLB advances and other borrowings
48,725
480
3.95
—
—
—
3
1
—
Subordinated debt
44,494
598
5.39
44,457
599
5.46
44,345
598
5.41
Junior subordinated debentures
3,594
55
6.14
3,593
55
6.21
3,592
61
6.81
Total interest bearing liabilities
3,879,019
29,187
3.02
3,846,285
28,324
2.99
3,417,514
31,060
3.65
Noninterest bearing deposits
588,188
585,211
562,174
Other liabilities
107,447
59,333
44,452
Total shareholders' equity
510,146
497,445
455,127
Total liabilities and shareholders' equity
$
5,084,800
$
4,988,274
$
4,479,267
Net interest income
$
89,367
$
83,357
$
76,737
Interest rate spread
6.63
%
6.39
%
6.27
%
Net interest margin (4)
7.27
%
7.00
%
7.06
%
23
(1)Yields and costs are annualized.
(2)For presentation in this table, average balances and the corresponding average rates for investment securities are based upon historical cost, adjusted for amortization of premiums and accretion of discounts.
(3)Includes loans held for sale and nonaccrual loans.
(4)Net interest margin represents net interest income divided by the average total interest earning assets.
24
COASTAL FINANCIAL CORPORATION
SELECTED AVERAGE BALANCES, YIELDS, AND RATES – BY SEGMENT - QUARTERLY
(Dollars in thousands; unaudited)
For the Three Months Ended
June 30, 2026
March 31, 2026
June 30, 2025
(dollars in thousands, unaudited)
Average Balance
Interest & Dividends
Yield /
Cost (1)
Average Balance
Interest & Dividends
Yield /
Cost (1)
Average Balance
Interest & Dividends
Yield /
Cost (1)
Community Bank
Assets
Interest earning assets:
Loans receivable (2)
$
1,983,746
$
32,517
6.57
%
$
1,956,040
$
31,734
6.58
%
$
1,879,331
$
30,603
6.53
%
Total interest earning assets
1,983,746
32,517
6.57
1,956,040
31,734
6.58
1,879,331
30,603
6.53
Liabilities
Interest bearing liabilities:
Interest bearing deposits
1,062,196
5,657
2.14
%
1,057,293
5,571
2.14
%
1,048,506
6,783
2.59
%
Intrabank liability
426,969
3,931
3.69
403,880
3,625
3.64
342,232
3,792
4.44
Total interest bearing liabilities
1,489,165
9,588
2.58
1,461,173
9,196
2.55
1,390,738
10,575
3.05
Noninterest bearing deposits
494,581
494,867
488,593
Net interest income
$
22,929
$
22,538
$
20,028
Net interest margin(3)
4.64
%
4.67
%
4.27
%
CCBX
Assets
Interest earning assets:
Loans receivable (2)(4)
$
2,164,634
$
78,580
14.56
%
$
1,922,586
$
71,153
15.01
%
$
1,688,492
$
68,264
16.22
%
Intrabank asset
647,884
5,962
3.69
908,700
8,156
3.64
706,157
7,825
4.44
Total interest earning assets
2,812,518
84,542
12.06
2,831,286
79,309
11.36
2,394,649
76,089
12.74
Liabilities
Interest bearing liabilities:
Interest bearing deposits
2,718,911
22,386
3.30
%
2,740,942
22,099
3.27
%
2,321,068
23,617
4.08
%
Total interest bearing liabilities
2,718,911
22,386
3.30
2,740,942
22,099
3.27
2,321,068
23,617
4.08
Noninterest bearing deposits
93,607
90,344
73,581
Net interest income
$
62,156
$
57,210
$
52,472
Net interest margin(3)
8.86
%
8.19
%
8.79
%
Net interest margin, net
of BaaS loan
expense(5)
3.10
%
2.90
%
3.35
%
25
For the Three Months Ended
June 30, 2026
March 31, 2026
June 30, 2025
(dollars in thousands, unaudited)
Average Balance
Interest & Dividends
Yield /
Cost (1)
Average Balance
Interest & Dividends
Yield /
Cost (1)
Average Balance
Interest & Dividends
Yield /
Cost (1)
Treasury & Administration
Assets
Interest earning assets:
Interest earning deposits with other banks
$
717,893
$
6,607
3.69
%
$
891,511
$
8,128
3.70
%
$
729,652
$
8,085
4.44
%
Investment securities,
available-for-sale (6)
28
—
3.52
30
1
13.52
35
—
—
Investment securities,
held-to-maturity (6)
45,781
612
5.36
47,420
621
5.31
46,256
626
5.43
Other investments
16,268
238
5.87
13,014
44
1.37
12,825
219
6.85
Total interest earning assets
779,970
7,457
3.83
%
951,975
—
8,794
3.75
%
788,768
8,930
4.54
%
Liabilities
Interest bearing liabilities:
Fed funds borrowings
$
1,099
11
4.01
%
$
—
—
—
%
$
—
—
—
%
FHLB advances and borrowings
48,725
480
3.95
—
—
—
3
1
—
Subordinated debt
44,494
598
5.39
44,457
599
5.46
44,345
598
5.41
Junior subordinated debentures
3,594
55
6.14
3,593
55
6.21
3,592
61
6.81
Intrabank liability,
net (7)
220,915
2,031
3.69
504,820
4,531
3.64
363,925
4,033
4.44
Total interest bearing liabilities
318,827
3,175
3.99
552,870
5,185
3.80
411,865
4,693
4.57
Net interest income
$
4,282
$
3,609
$
4,237
Net interest margin(3)
2.20
%
1.54
%
2.15
%
(1)Yields and costs are annualized.
(2)Includes loans held for sale and nonaccrual loans.
(3)Net interest margin represents net interest income divided by the average total interest earning assets.
(4)CCBX yield does not include the impact of BaaS loan expense. BaaS loan expense represents the amount paid or payable to partners for credit enhancements, fraud enhancements and originating & servicing CCBX loans. See reconciliation of the non-GAAP measures at the end of this earnings release for the impact of BaaS loan expense on CCBX loan yield.
(5)Net interest margin, net of BaaS loan expense, includes the impact of BaaS loan expense. BaaS loan expense represents the amount paid or payable to partners for credit enhancements, fraud enhancements, originating & servicing CCBX loans. See reconciliation of the non-GAAP measures at the end of this earnings release.
(6)For presentation in this table, average balances and the corresponding average rates for investment securities are based upon historical cost, adjusted for amortization of premiums and accretion of discounts.
(7)Intrabank assets and liabilities are consolidated for period calculations and presented as intrabank asset, net or intrabank liability, net in the table above.
26
Non-GAAP Financial Measures
The Company uses certain non-GAAP financial measures to provide meaningful supplemental information regarding the Company’s operational performance and to enhance investors’ overall understanding of financial performance.
However, these non-GAAP financial measures are supplemental and are not a substitute for an analysis based on GAAP measures. As other companies may use different calculations for these adjusted measures, this presentation may not be comparable to other similarly titled adjusted measures reported by other companies.
The following non-GAAP measures are presented to illustrate the impact of BaaS loan expense on net loan income and yield on loans and CCBX loans and the impact of BaaS loan expense on net interest income and net interest margin.
Loan income, net of BaaS loan expense, divided by average loans, is a non-GAAP measure that includes the impact of BaaS loan expense on loan income and the yield on loans. The most directly comparable GAAP measure is yield on loans.
Net BaaS loan income divided by average CCBX loans is a non-GAAP measure that includes the impact of BaaS loan expense on net BaaS loan income and the yield on CCBX loans. The most directly comparable GAAP measure is yield on CCBX loans.
Net interest income, net of BaaS loan expense, is a non-GAAP measure that includes the impact of BaaS loan expense on net interest income. The most directly comparable GAAP measure is net interest income.
CCBX net interest margin, net of BaaS loan expense, is a non-GAAP measure that includes the impact of BaaS loan expense on net interest rate margin. The most directly comparable GAAP measure is CCBX net interest margin.
27
Reconciliations of the GAAP and non-GAAP measures are presented below.
CCBX
As of and for the Three Months Ended
(dollars in thousands; unaudited)
June 30 2026
March 31 2026
June 30 2025
CCBX loan income net of BaaS loan expense divided by average CCBX loans:
CCBX loan yield (GAAP)(1)
14.56
%
15.01
%
16.22
%
Total average CCBX loans receivable
$
2,164,634
$
1,922,586
$
1,688,492
Interest and earned fee income on CCBX loans (GAAP)
78,580
71,153
68,264
BaaS loan expense
(40,409)
(36,940)
(32,483)
Net BaaS loan income
$
38,171
$
34,213
$
35,781
Net BaaS loan income divided by average CCBX loans (1)
7.07
%
7.22
%
8.50
%
CCBX net interest margin, net of BaaS loan expense:
CCBX net interest margin (1)
8.86
%
8.19
%
8.79
%
CCBX earning assets
2,812,518
2,831,286
2,394,649
Net interest income (GAAP)
62,156
57,210
52,472
Less: BaaS loan expense
(40,409)
(36,940)
(32,483)
Net interest income, net of BaaS
loan expense
$
21,747
$
20,270
$
19,989
CCBX net interest margin, net of BaaS loan expense (1)
3.10
%
2.90
%
3.35
%
Consolidated
As of and for the Three Months Ended
(dollars in thousands; unaudited)
June 30 2026
March 31 2026
June 30 2025
Loan income net of BaaS loan expense divided by average loans:
Loan yield (GAAP)(1)
10.74
%
10.76
%
11.11
%
Total average loans receivable
$
4,148,380
$
3,878,626
$
3,567,823
Interest and earned fee income on loans (GAAP)
111,097
102,887
98,867
BaaS loan expense
(40,409)
(36,940)
(32,483)
Net loan income
$
70,688
$
65,947
$
66,384
Loan income, net of BaaS loan expense, divided by average loans (1)
6.83
%
6.90
%
7.46
%
Net interest margin, net of BaaS loan expense:
Net interest margin (1)
7.27
%
7.00
%
7.06
%
Earning assets
4,928,350
4,830,601
4,356,591
Net interest income (GAAP)
89,367
83,357
76,737
Less: BaaS loan expense
(40,409)
(36,940)
(32,483)
Net interest income, net of BaaS loan expense
$
48,958
$
46,417
$
44,254
Net interest margin, net of BaaS loan expense (1)
3.98
%
3.90
%
4.07
%
(1) Annualized calculations for periods presented.
28
The following non-GAAP measure is presented to illustrate the impact of BaaS loan expense, BaaS fraud expense and reimbursement of expenses (BaaS) on noninterest expense. Certain noninterest expenses are reimbursed by our CCBX partners. In accordance with GAAP we recognize all expenses in noninterest expense and the reimbursement of expenses from our CCBX partners in noninterest income. This non-GAAP measure is intended to help investors distinguish between noninterest expenses borne by the Company and those incurred for, and reimbursed by, CCBX partners.The most comparable GAAP measure is noninterest expense.
As of and for the Three Months Ended
(dollars in thousands, unaudited)
June 30, 2026
March 31, 2026
June 30, 2025
Noninterest expense, net of BaaS loan expense, BaaS fraud expense and reimbursement of expenses (BaaS)
Noninterest expense (GAAP)
$
141,111
$
83,452
$
72,832
Less: BaaS loan expense
40,409
36,940
32,483
Less: BaaS fraud expense
4,312
3,059
2,804
Less: Reimbursement of expenses
2,259
2,392
646
Noninterest expense, net of BaaS loan expense, BaaS fraud expense and reimbursement of expenses
$
94,131
$
41,061
$
36,899
The following non-GAAP measure is presented to illustrate the impact of intangible assets on book value per share. We calculate tangible book value per share as total shareholders’ equity at the end of the relevant period, less goodwill and other intangible assets, divided by the outstanding number of our common shares at the end of each period. The most directly comparable GAAP financial measure is book value per share.
As of
(dollars in thousands, except per share information, unaudited)
June 30, 2026
March 31, 2026
December 31, 2025
September 30, 2025
June 30, 2025
Tangible book value per share
Book value (GAAP)
$
30.33
$
33.05
$
32.43
$
31.45
$
30.59
Total shareholders' equity
463,447
503,762
490,959
475,277
461,709
Less: Intangible assets
4,207
4,434
4,536
—
—
Tangible book value
$
459,240
$
499,328
$
486,423
$
475,277
$
461,709
Common shares outstanding
15,280,689
15,241,491
15,140,192
15,112,000
15,093,036
Tangible book value per share
$
30.05
$
32.76
$
32.13
$
31.45
$
30.59
29
APPENDIX A
As of June 30, 2026
Industry Concentration
We have a diversified loan portfolio, representing a wide variety of industries. Our major categories of loans are commercial real estate, consumer and other loans, residential real estate, commercial and industrial, and construction, land and land development loans. Together they represent $4.22 billion in outstanding loan balances. When combined with $2.82 billion in unused commitments, the total of these categories is $7.03 billion.
Commercial real estate loans represent the largest segment of our loans, comprising 31.3% of our total balance of outstanding loans as of June 30, 2026. Unused commitments to extend credit represents an additional $38.6 million, and the combined total in commercial real estate loans represents $1.36 billion, or 19.3% of our total outstanding loans and loan commitments.
The following table summarizes our loan commitments by industry for our commercial real estate portfolio as of June 30, 2026:
(dollars in thousands; unaudited)
Outstanding Balance
Available Loan Commitments
Total Outstanding Balance & Available Commitments
% of Total Loans
(Outstanding Balance &
Available Commitments)
Average Loan Balance
Number of Loans
Apartments
$
360,740
$
11,168
$
371,908
5.3
%
$
3,797
95
Hotel/Motel
191,714
4,429
196,143
2.8
7,101
27
Convenience Store
144,884
4,259
149,143
2.1
2,195
66
Retail
108,937
778
109,715
1.6
1,184
92
Warehouse
102,109
250
102,359
1.4
1,964
52
Mixed use
100,452
6,961
107,413
1.5
1,092
92
Office
85,371
4,180
89,551
1.3
1,041
82
Mini Storage
63,418
—
63,418
0.9
4,530
14
Strip Mall
42,536
—
42,536
0.6
6,077
7
Manufacturing
31,932
1,695
33,627
0.5
1,228
26
Groups < 0.50% of total
87,705
4,856
92,561
1.3
1,201
73
Total
$
1,319,798
$
38,576
$
1,358,374
19.3
%
$
2,108
626
Consumer loans comprise 39.9% of our total balance of outstanding loans as of June 30, 2026. Unused commitments to extend credit represents an additional $1.20 billion, and the combined total in consumer and other loans represents $2.89 billion, or 41.0% of our total outstanding loans and loan commitments. The $1.20 billion in commitments is subject to CCBX partner/portfolio maximum limits. As illustrated in the table below, our CCBX partners bring in a large number of mostly smaller dollar loans, resulting in an average consumer loan balance of just $500. CCBX consumer loans are underwritten to CCBX credit standards, and underwriting of these loans is regularly tested, including quarterly testing for partners with the largest exposures.
30
The following table summarizes our loan commitments by industry for our consumer and other loan portfolio as of June 30, 2026:
(dollars in thousands; unaudited)
Outstanding Balance
Available Loan Commitments (1)
Total Outstanding Balance & Available Commitments (1)
% of Total Loans
(Outstanding Balance &
Available Commitments)
Average Loan Balance
Number of Loans
CCBX consumer loans
Credit cards
$
753,171
$
1,039,541
$
1,792,712
25.5
%
$
1.5
500,348
Installment loans
738,321
42,958
781,279
11.1
0.4
1,851,498
Lines of credit
144,947
109,649
254,596
3.6
0.2
943,772
Other loans
35,511
—
35,511
0.5
0.1
284,612
Community bank consumer loans
Installment loans
681
5
686
0.0
28.4
24
Lines of credit
210
338
548
0.0
6.8
31
Other loans
9,869
10,000
19,869
0.3
25.0
395
Total
$
1,682,710
$
1,202,491
$
2,885,201
41.0
%
$
0.5
3,580,680
(1)Total exposure on CCBX loans is subject to CCBX partner/portfolio maximum limits.
Residential real estate loans comprise 12.4% of our total balance of outstanding loans as of June 30, 2026. Unused commitments to extend credit represents an additional $785.7 million, which is subject to partner/portfolio maximum limits, and the combined total in residential real estate loans represents $1.31 billion, or 18.6% of our total outstanding loans and loan commitments.
The following table summarizes our loan commitments by industry for our residential real estate loan portfolio as of June 30, 2026:
(dollars in thousands; unaudited)
Outstanding Balance
Available Loan Commitments (1)
Total Outstanding Balance & Available Commitments (1)
% of Total Loans
(Outstanding Balance &
Available Commitments)
Average Loan Balance
Number of Loans
CCBX residential real estate loans
Home equity lines of credit
$
324,873
$
737,158
$
1,062,031
15.1
%
$
29
11,235
Community bank residential real estate loans
Closed end, secured by first liens
152,915
517
153,432
2.2
537
285
Home equity lines of credit
36,073
47,081
83,154
1.2
133
271
Closed end, second liens
10,542
963
11,505
0.1
319
33
Total
$
524,403
$
785,719
$
1,310,122
18.6
%
$
44
11,824
(1)Total exposure on CCBX loans is subject to CCBX partner/portfolio maximum limits.
Commercial and industrial loans comprise 11.1% of our total balance of outstanding loans as of June 30, 2026. Unused commitments to extend credit represents an additional $713.8 million, and the combined total in commercial and industrial loans represents $1.18 billion, or 16.8% of our total outstanding loans and loan commitments. Included in commercial and industrial loans is $204.8 million in outstanding capital call lines, with an additional $591.0 million in available loan commitments, which is limited to a $350.0 million portfolio maximum. Capital call lines are provided to venture capital firms through one of our CCBX BaaS clients. These loans are secured by the capital call rights and are individually underwritten to the Bank’s credit standards, and the underwriting is reviewed by the Bank on every capital call line.
31
The following table summarizes our loan commitment by industry for our commercial and industrial loan portfolio as of June 30, 2026:
(dollars in thousands; unaudited)
Outstanding Balance
Available Loan Commitments (1)
Total Outstanding Balance & Available Commitments (1)
% of Total Loans
(Outstanding Balance &
Available Commitments)
Average Loan Balance
Number of Loans
CCBX C&I loans
Capital call lines
$
204,835
$
590,962
$
795,797
11.3
%
$
1,626
126
Retail and other
loans
24,638
18,364
43,002
0.6
14
1,732
Community bank C&I loans
Financial institutions
101,145
—
101,145
1.4
4,214
24
Other Venture Capital
60,402
30,000
90,402
1.3
12,080
5
Construction/Contractor services
39,274
27,488
66,762
1.0
224
175
Medical / Dental / Other care
5,338
263
5,601
0.1
411
13
Transportation
4,222
15
4,237
0.1
603
7
Manufacturing
4,458
3,182
7,640
0.1
135
33
Groups < 0.10% of total
22,337
43,509
65,846
0.9
111
202
Total
$
466,649
$
713,783
$
1,180,432
16.8
%
$
201
2,317
(1) Total exposure on CCBX loans is subject to CCBX partner/portfolio maximum limits.
Construction, land and land development loans comprise 5.3% of our total balance of outstanding loans as of June 30, 2026. Unused commitments to extend credit represent an additional $75.3 million, and the combined total in construction, land and land development loans represents $296.8 million, or 4.2% of our total outstanding loans and loan commitments.
The following table details our loan commitment for our construction, land and land development portfolio as of June 30, 2026:
(dollars in thousands; unaudited)
Outstanding Balance
Available Loan Commitments
Total Outstanding Balance & Available Commitments
% of Total Loans
(Outstanding Balance &
Available Commitments)
Average Loan Balance
Number of Loans
Commercial construction
$
121,058
$
24,702
$
145,760
2.1
%
$
11,005
11
Residential construction
43,162
43,338
86,500
1.2
1,308
33
Land development
24,753
6,877
31,630
0.5
2,475
10
Undeveloped land loans
17,011
—
17,011
0.2
1,418
12
Developed land loans
15,578
368
15,946
0.2
1,198
13
Total
$
221,562
$
75,285
$
296,847
4.2
%
$
2,805
79
32
Exposure and risk in our construction, land and land development portfolio increased compared to recent periods as indicated in the following table:
Outstanding Balance as of
(dollars in thousands; unaudited)
June 30, 2026
March 31, 2026
December 31, 2025
September 30, 2025
June 30, 2025
Commercial construction
$
121,058
$
138,232
$
124,894
$
124,240
$
104,078
Residential construction
43,162
34,241
37,395
35,929
39,831
Undeveloped land loans
17,011
20,633
20,704
20,584
20,067
Developed land loans
15,578
18,855
20,559
22,756
22,875
Land development
24,753
22,950
18,523
14,552
7,299
Total
$
221,562
$
234,911
$
222,075
$
218,061
$
194,150
Commitments to extend credit for on-balance sheet loans total $2.82 billion at June 30, 2026, however we do not anticipate our customers using the $2.82 billion that is showing as available due to CCBX partner and portfolio limits.
As of June 30, 2026, commitments associated with sold credit card receivables subject to receivable sale agreements totaled $6.15 billion. While we retain the customer account relationship, receivables generated under these programs are periodically sold to BaaS partners pursuant to the applicable receivable sale agreements and remain subject to the Company's established partner and portfolio limits.
The following table presents commitments associated with outstanding commitments to extend credit for on-balance sheet loans, CCBX sold credit card receivable commitments, standby and commercial letters of credit and equity investment commitments as of June 30, 2026:
Consolidated
(dollars in thousands; unaudited)
As of June 30, 2026 (1)
Commitments to extend credit:
Credit cards
$
1,039,541
Residential real estate loans
785,719
Commercial and industrial loans – capital call lines
590,962
Consumer and other loans
162,950
Commercial and industrial loans
122,821
Construction – residential real estate loans
43,339
Commercial real estate loans
38,576
Construction – commercial real estate loans
31,946
Commitments to extend credit
$
2,815,854
CCBX sold receivable commitment
$
6,153,420
Standby letters of credit
$
2,224
Equity investment commitment
$
917
(1)Total exposure on CCBX loans is subject to CCBX partner/portfolio maximum limits.
We have portfolio limits with each of our partners to manage loan concentration risk, liquidity risk and counterparty partner risk. For example, as of June 30, 2026, capital call lines outstanding balance totaled $204.8 million, and while commitments totaled $591.0 million the commitments are cancelable, and are also limited to a maximum of $350.0 million by agreement with the partner. These limits allow us to manage portfolio concentrations with partners and by loan type.
33
See the table below for CCBX portfolio maximums and related available commitments for on-balance sheet loans:
CCBX
(dollars in thousands; unaudited)
Balance
Percent of CCBX Loans Receivable
Available Commitments (1)
Maximum Portfolio Size
Cash Reserve/Pledge Account Amount
Commercial and industrial loans:
Capital call lines
$
204,835
9.2
%
$
590,962
$
350,000
$
—
All other commercial & industrial loans
24,638
1.1
18,364
509,897
1,963
Real estate loans:
Home equity lines of credit (2)
324,873
14.6
737,158
356,250
35,067
Consumer and other loans:
Credit cards - cash secured
54
15
—
Credit cards - unsecured
753,117
1,039,526
56,814
Credit cards - total
753,171
33.8
1,039,541
1,208,750
56,814
Installment loans - cash secured
216,766
42,958
—
Installment loans - unsecured
521,555
—
(18,521)
Installment loans - total
738,321
33.2
42,958
1,660,103
(18,521)
Other consumer and other loans
180,458
8.1
109,649
775,000
1,297
Gross CCBX loans receivable
2,226,296
100.0
%
$
2,538,632
$
4,860,000
$
76,620
Net deferred origination fees
(544)
Loans receivable
$
2,225,752
(1) Remaining commitment available, net of outstanding balance.
(2) These home equity lines of credit are secured by residential real estate and are accessed by using a credit card, but are classified as 1-4 family residential properties per regulatory guidelines.
34
APPENDIX B
As of June 30, 2026
CCBX – BaaS Reporting Information
During the quarter ended June 30, 2026, $70.7 million was recorded in BaaS credit enhancements related to the provision for credit losses - loans and reserve for unfunded commitments for CCBX partner loans and negative deposit accounts. Agreements with our CCBX partners provide a credit enhancement under which the partner indemnifies or reimburses the Bank for covered credit losses on loans, unfunded commitments and negative deposit accounts. In accordance with U.S. GAAP, we estimate expected credit losses on these exposures and record the related provision for credit losses and reserve for unfunded commitments. Concurrently, a credit enhancement asset is recognized through noninterest income (BaaS credit enhancements) representing the expected reimbursement from the partner. The collectability of the credit enhancement asset is evaluated each reporting period and a valuation adjustment is recorded when collection of all or a portion of the asset is no longer considered probable. The credit enhancement asset is relieved as credit enhancement payments and recoveries are received from the CCBX partner or taken from the partner's cash reserve account. Management regularly evaluates and manages counterparty risk associated with its CCBX partners, as the Bank could incur additional credit losses to the extent a partner is unable to fulfill its contractual obligations.
Agreements with our CCBX partners also provide protection to the Bank from fraud by indemnifying or reimbursing covered fraud losses. BaaS fraud includes non-credit fraud losses on loans and deposits originated through partners. Generally fraud losses related to loans are comprised primarily of first payment defaults. Fraud losses are recorded when incurred as losses in noninterest expense, and the enhancement received from the CCBX partner is recorded in noninterest income, resulting in a net impact of zero to the income statement.
Many CCBX partners also pledge a cash reserve account at the Bank, which the Bank can collect from when losses occur that is then replenished by the partner on a regular interval. Although agreements with our CCBX partners provide for credit enhancements that provide protection to the Bank from credit and fraud losses if our partner is unable to fulfill their contractual obligation and if the cash flows on the loans were not sufficient to fund the reimbursement of loan losses, then the Bank would be exposed to additional loan and deposit losses as a result of this counterparty risk. If a CCBX partner does not replenish their cash reserve account, the Bank may consider an alternative plan for funding the cash reserve. This may involve the possibility of adjusting the funding amounts or timelines to better align with the partner's specific situation. If a mutually agreeable funding plan is not agreed to, the Bank could declare the agreement in default, take over servicing and cease paying the partner for servicing the loan and providing credit enhancements. In the event of a partner default, the Bank would evaluate any remaining credit enhancement asset associated with that partner to determine whether a write-off is appropriate. If a write-off occurs, the Bank would stop payments to the CCBX partner and retain the full yield and any fee income on the loan portfolio going forward, decreasing our BaaS loan expense.
The Bank records contractual interest earned from the borrowers on CCBX partner loans in interest income, adjusted for origination costs, which are paid or payable to the CCBX partners. BaaS loan expense represents the amount paid or payable to partners for credit and fraud enhancements and originating & servicing CCBX loans. To determine net revenue (Net BaaS loan income) earned from CCBX loan relationships, the Bank takes BaaS loan interest income and deducts BaaS loan expense to arrive at Net BaaS loan income (a reconciliation of the non-GAAP measures are set forth in the preceding section of this earnings release) which can be compared to interest income on the Company’s community bank loans.
35
The following table illustrates how CCBX partner loan income and expenses are recorded in the financial statements:
Loan income and related loan expense
Three Months Ended
(dollars in thousands; unaudited)
June 30, 2026
March 31, 2026
June 30, 2025
Yield on loans (1)
14.56
%
15.01
%
16.22
%
BaaS loan interest income
$
78,580
$
71,153
$
68,264
Less: BaaS loan expense
40,409
36,940
32,483
Net BaaS loan income (2)
$
38,171
$
34,213
$
35,781
Net BaaS loan income divided by average BaaS loans (1)(2)
7.07
%
7.22
%
8.50
%
(1) Annualized calculation for quarterly periods shown.
(2) A reconciliation of the non-GAAP measures are set forth in the preceding section of this earnings release.
An increase in average loans receivable resulted in increased interest income and net BaaS loan income on CCBX loans during the quarter ended June 30, 2026 compared to the quarter ended March 31, 2026. Our strategy is to optimize the CCBX loan portfolio and strengthen our balance sheet through originating higher quality new loans with enhanced credit standards. These higher quality loans tend to have lower stated rates and expected losses than some of our CCBX loans historically. We continue to manage CCBX credit and concentration levels in an effort to optimize our loan portfolio and also generate off-balance sheet fee income. Growth in CCBX loans has resulted in an increase in interest income for the quarter ended June 30, 2026 compared to the quarter ended June 30, 2025, as well as an increase in net BaaS loan income.
The following tables are a summary of the interest components, direct fees and expenses of BaaS for the periods indicated and are not inclusive of all income and expense related to BaaS.
Interest income
Three Months Ended
(dollars in thousands; unaudited)
June 30, 2026
March 31, 2026
June 30, 2025
BaaS loan interest income
$
78,580
$
71,153
$
68,264
Total BaaS loan interest income
$
78,580
$
71,153
$
68,264
Interest expense
Three Months Ended
(dollars in thousands; unaudited)
June 30, 2026
March 31, 2026
June 30, 2025
BaaS interest expense
$
22,386
$
22,099
$
23,617
Total BaaS interest expense
$
22,386
$
22,099
$
23,617
BaaS income
Three Months Ended
(dollars in thousands; unaudited)
June 30, 2026
March 31, 2026
June 30, 2025
BaaS program income:
Servicing and other BaaS fees
$
2,917
$
2,623
$
1,896
Transaction and interchange fees
6,836
5,873
5,109
Reimbursement of expenses
2,259
2,392
646
Total BaaS program income
12,012
10,888
7,651
BaaS indemnification income:
BaaS credit enhancements
70,725
50,744
31,268
BaaS fraud enhancements
4,312
3,059
2,804
BaaS indemnification income
75,037
53,803
34,072
Total noninterest BaaS income
$
87,049
$
64,691
$
41,723
Servicing and other BaaS fees increased $294,000, and transaction and interchange fees increased $963,000 in the quarter ended June 30, 2026 compared to the quarter ended March 31, 2026. We expect servicing and other BaaS fees to be higher when bringing on new partners and then to decrease when transaction and interchange fees increase as partner activity
36
grows and these recurring fees exceed contracted minimum fees. Increases in BaaS reimbursement of fees offset increases in noninterest expense from BaaS expenses covered by CCBX partners.