SECURITIES AND EXCHANGE COMMISSION
Washington, D.C. 20549
FORM 6-K
Report of Foreign Private Issuer
Pursuant to Rule 13a-16 or 15d-16 of the
Securities Exchange Act of 1934
For the month of August, 2026
Commission File Number 1-34129
AXIA Energia S.A.
(Exact name of registrant as specified in its charter)
AXIA Energia S.A.
(Translation of Registrant's name into English)
Avenida Graça Aranha, 26
Centro, CEP 20030-900
Rio de Janeiro, RJ, Brazil
(Address of principal executive office)
Indicate by check mark whether the registrant files or will file annual reports under cover Form 20-F or Form 40-F.
Form 20-F ___X___ Form 40-F _______
Indicate by check mark whether the registrant by furnishing the information contained in this Form is also thereby furnishing the information to the Commission pursuant to Rule 12g3-2(b) under the Securities Exchange Act of 1934.
Yes _______ No___X____
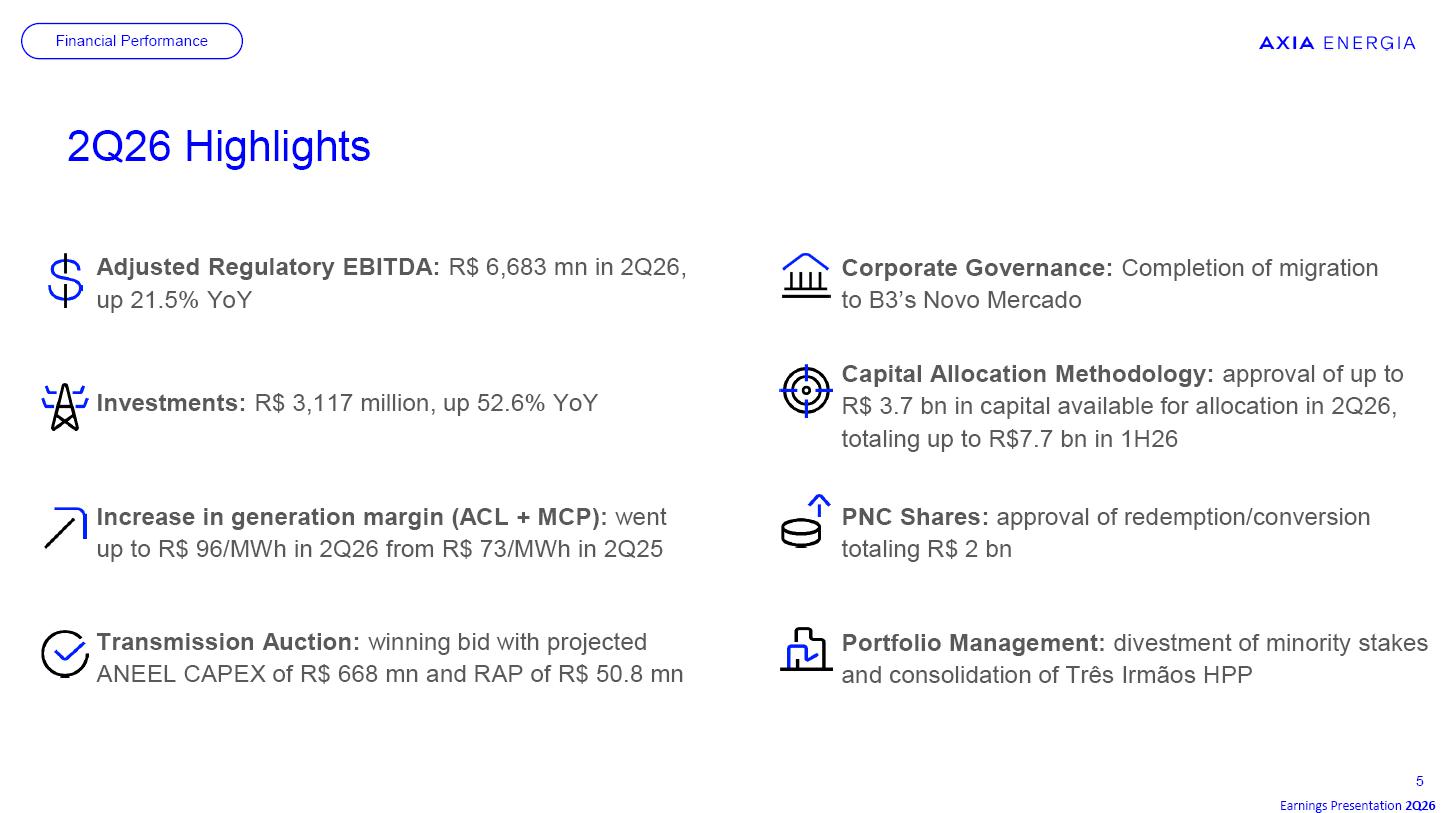
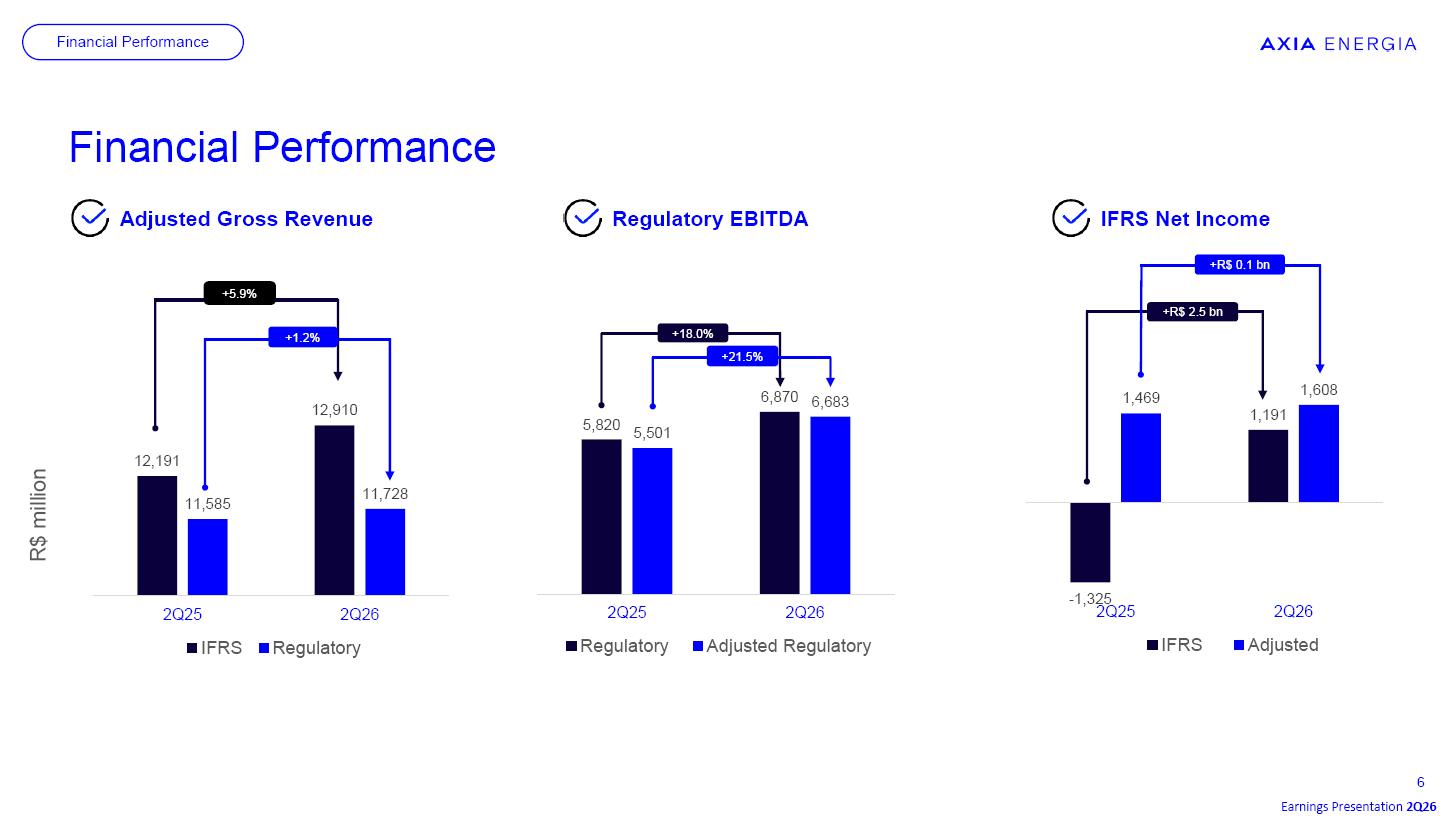
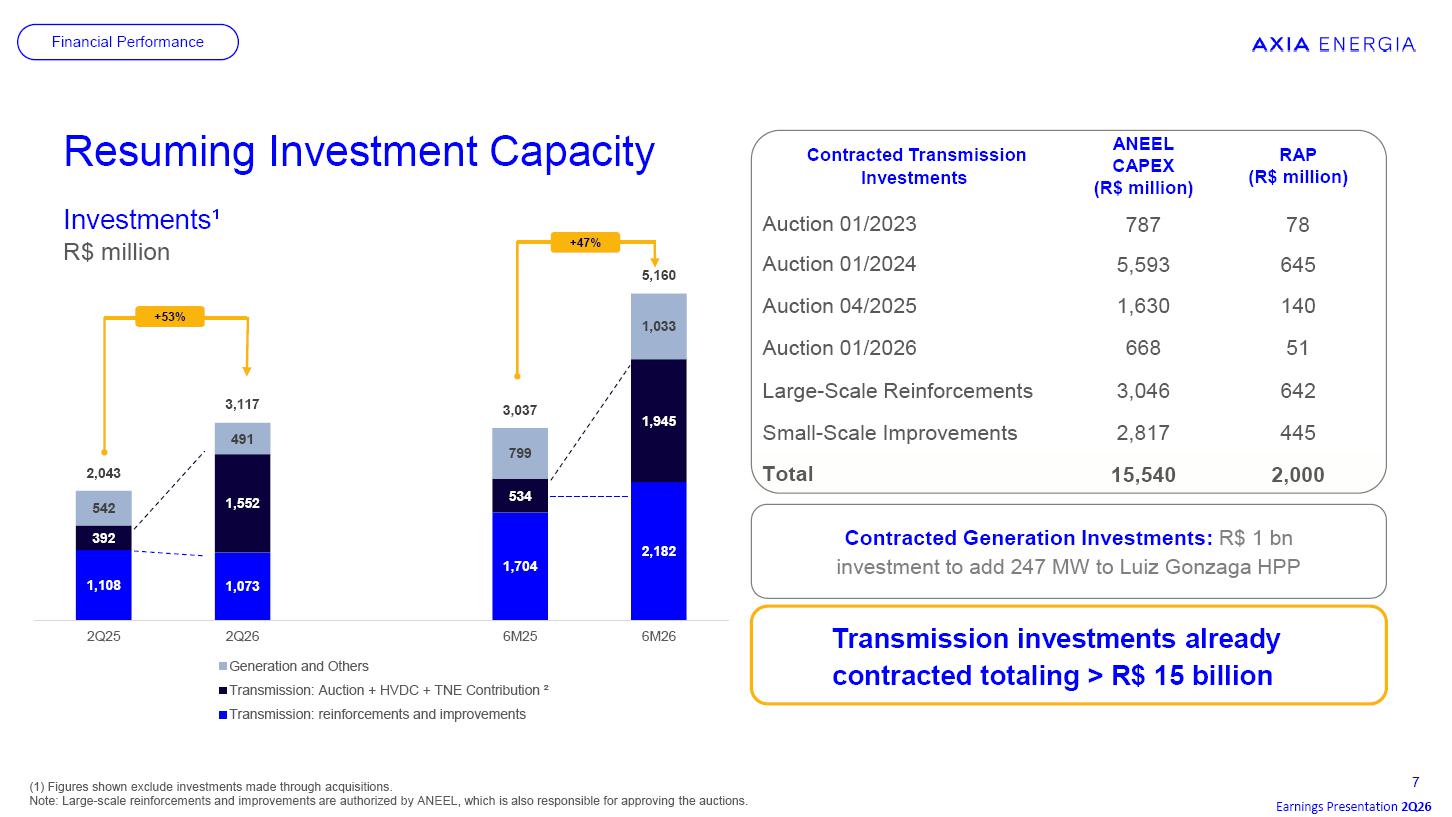
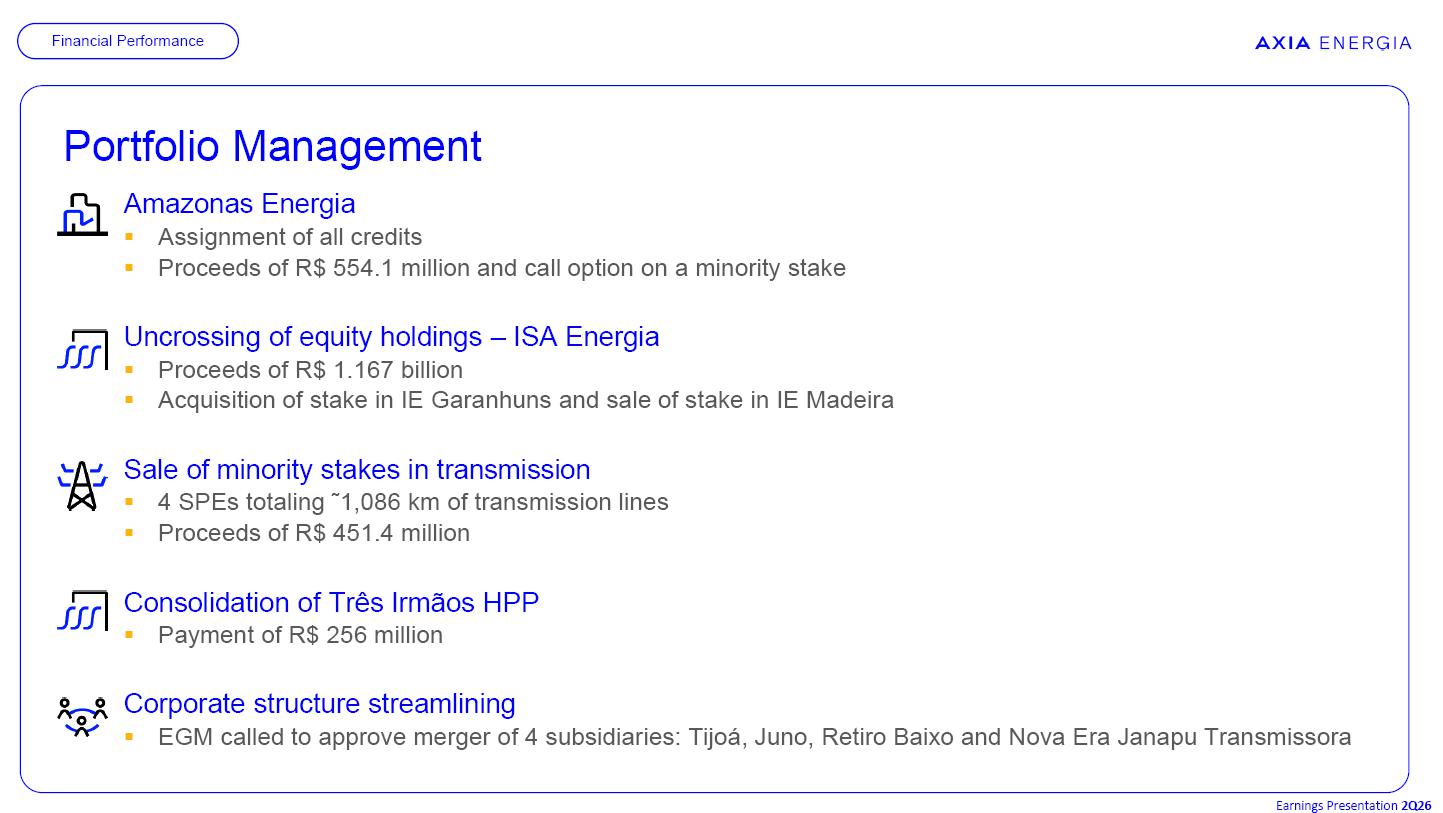
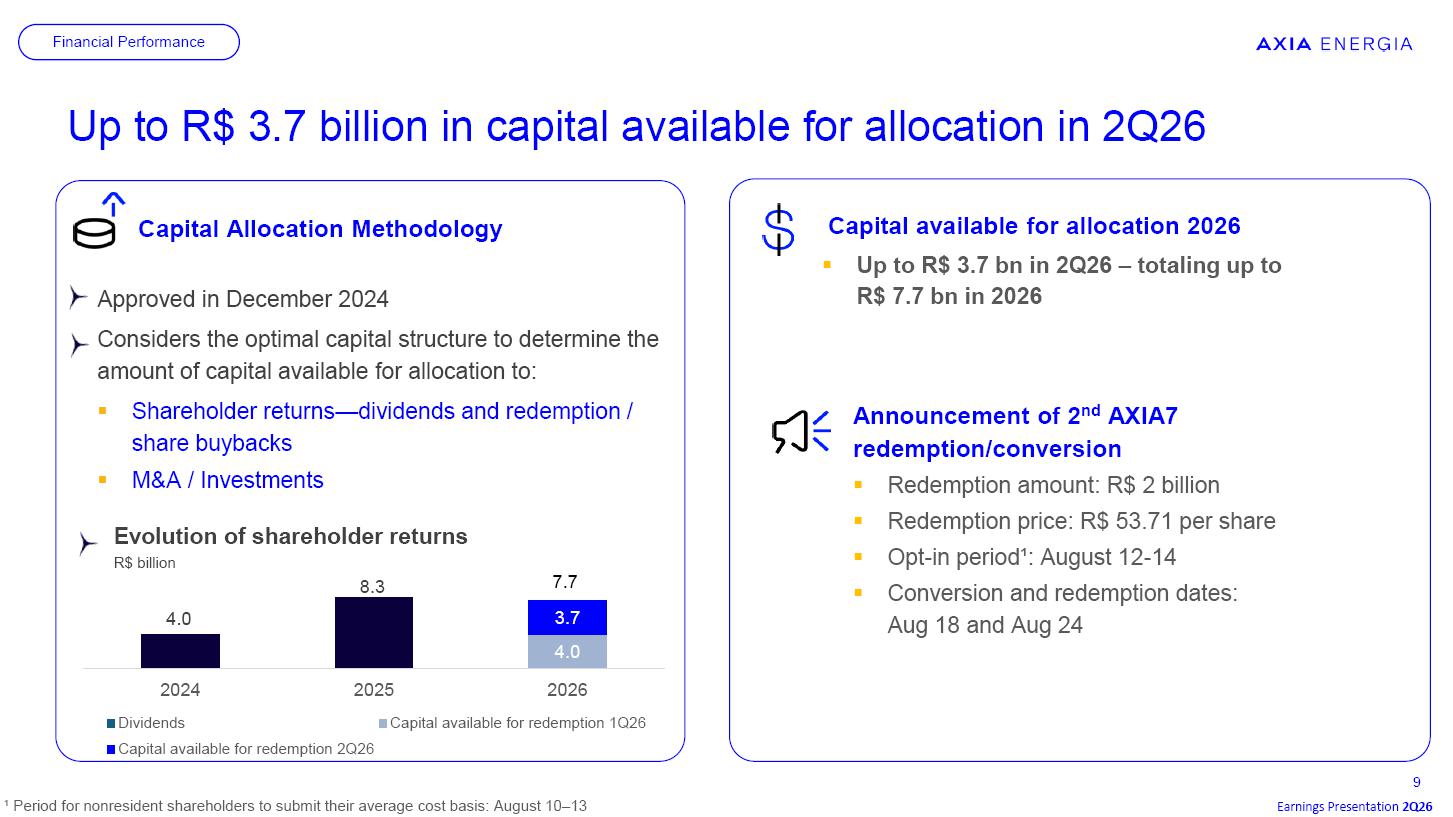
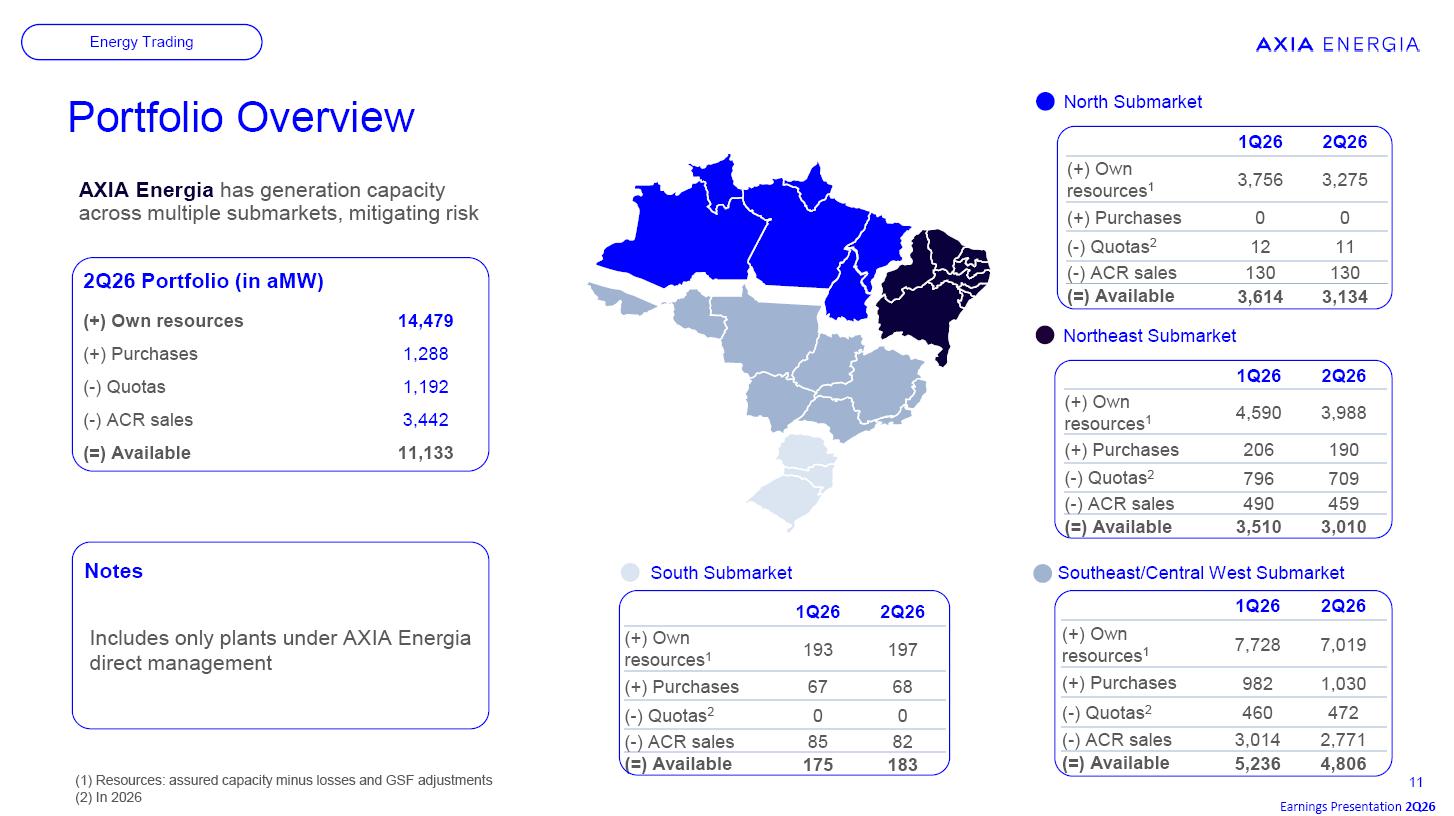
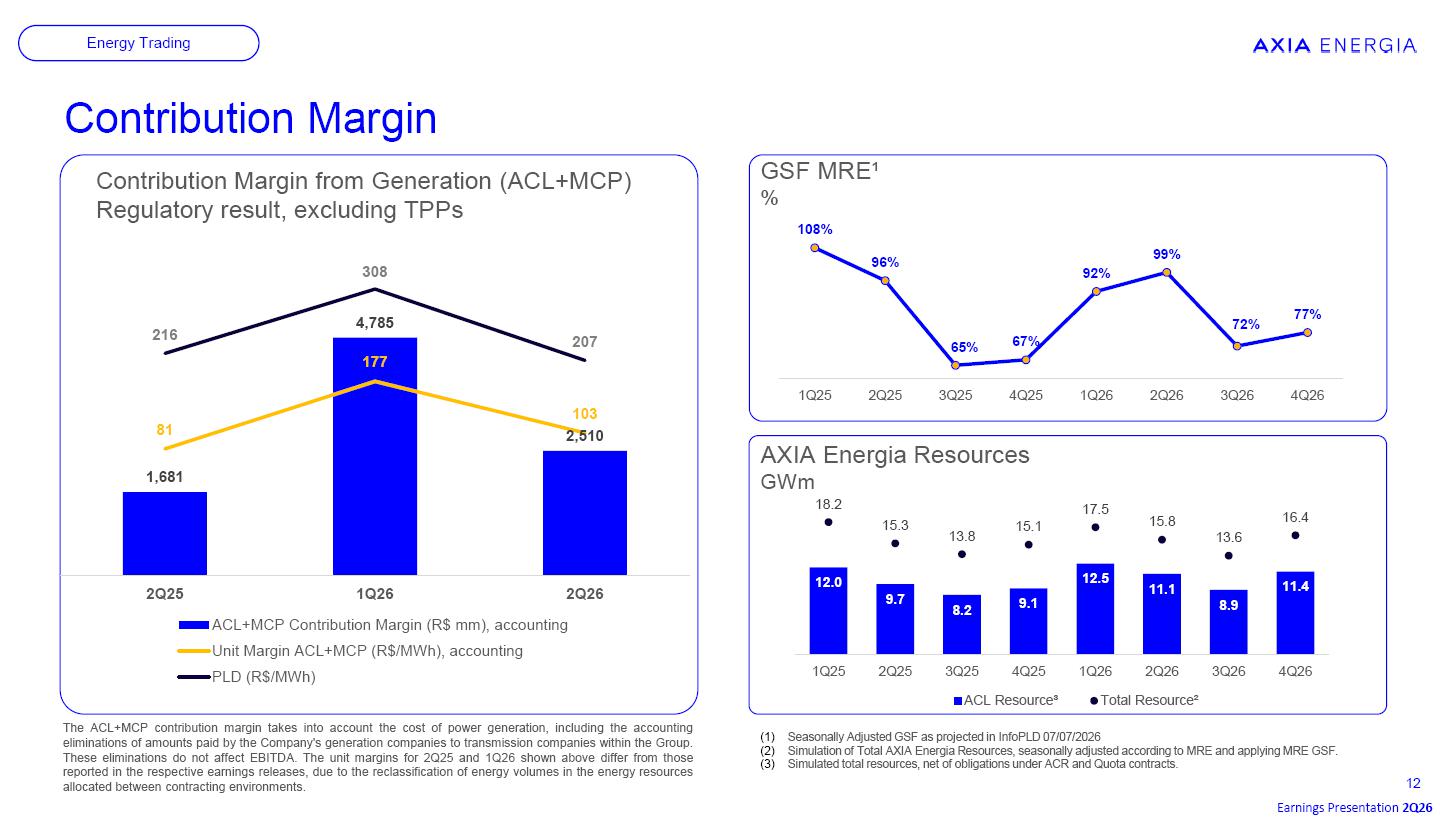
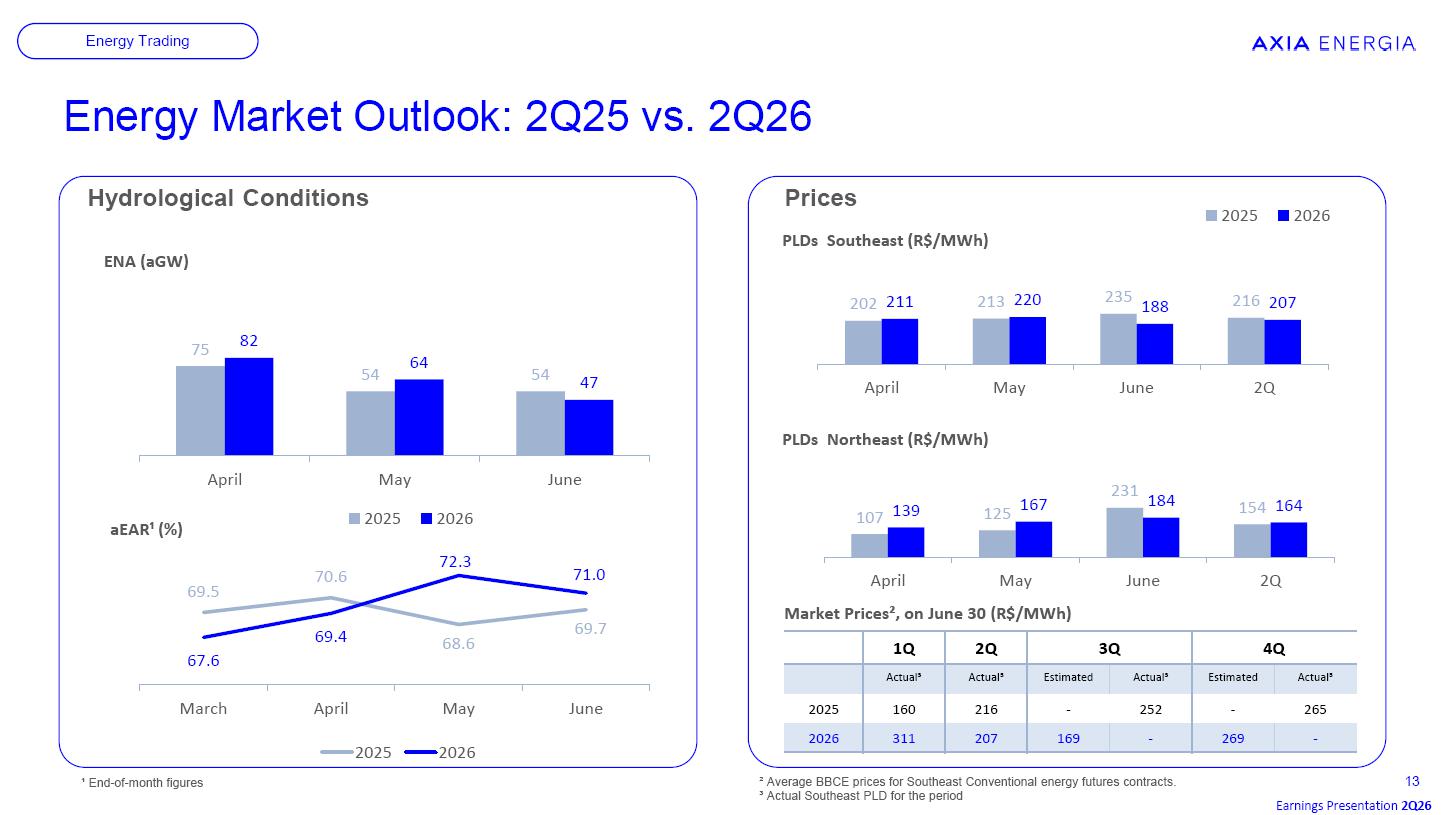
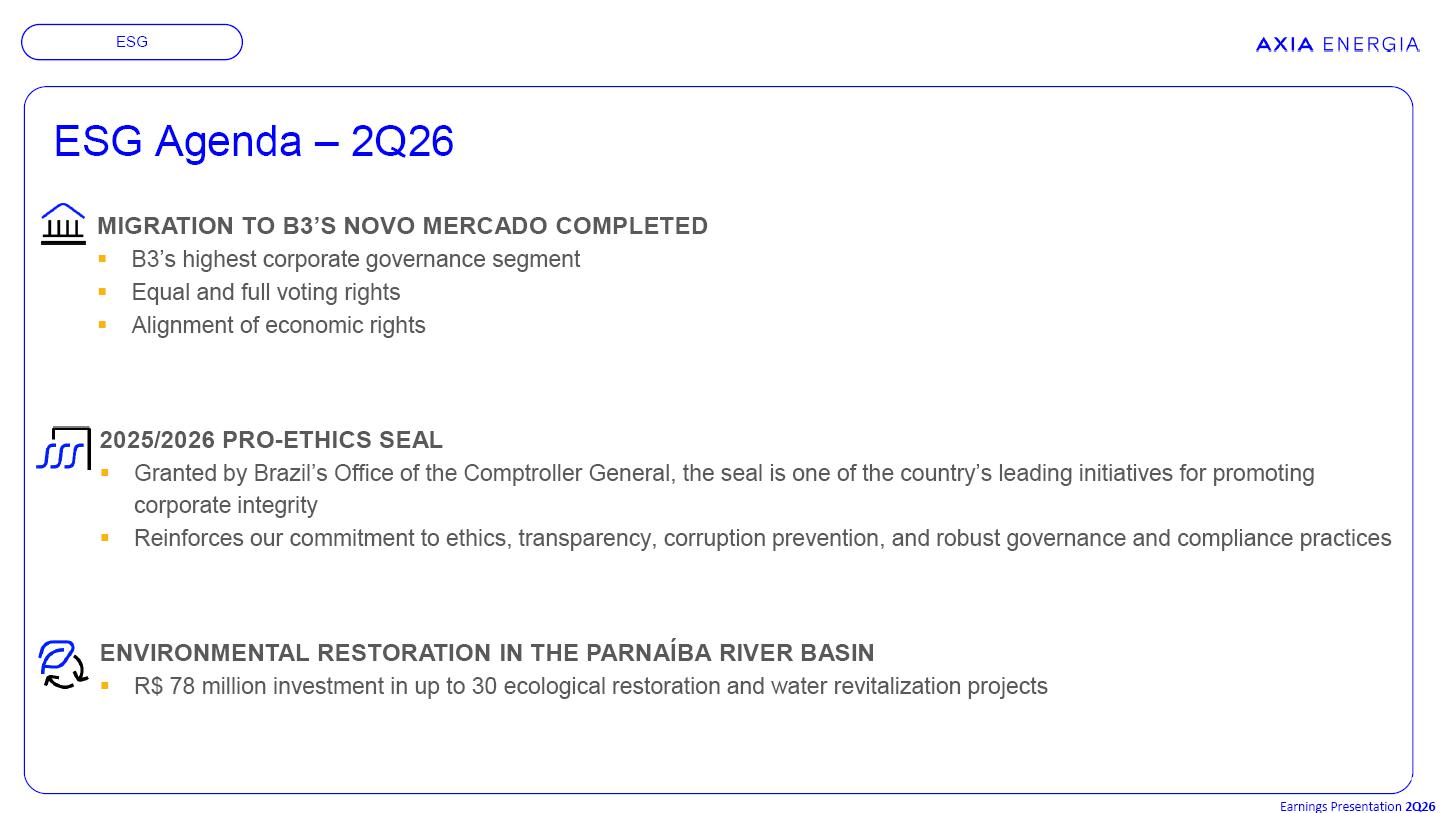
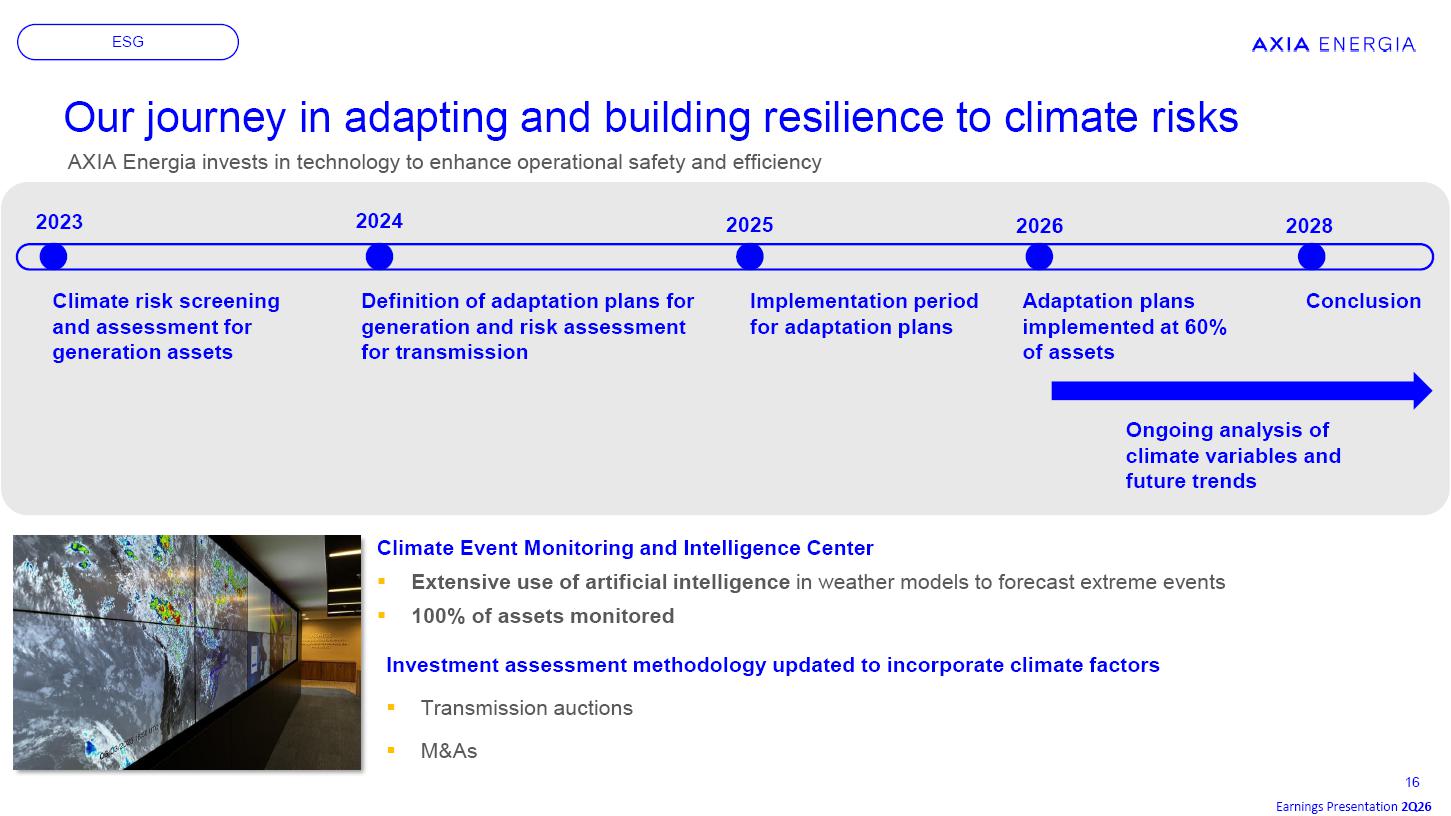
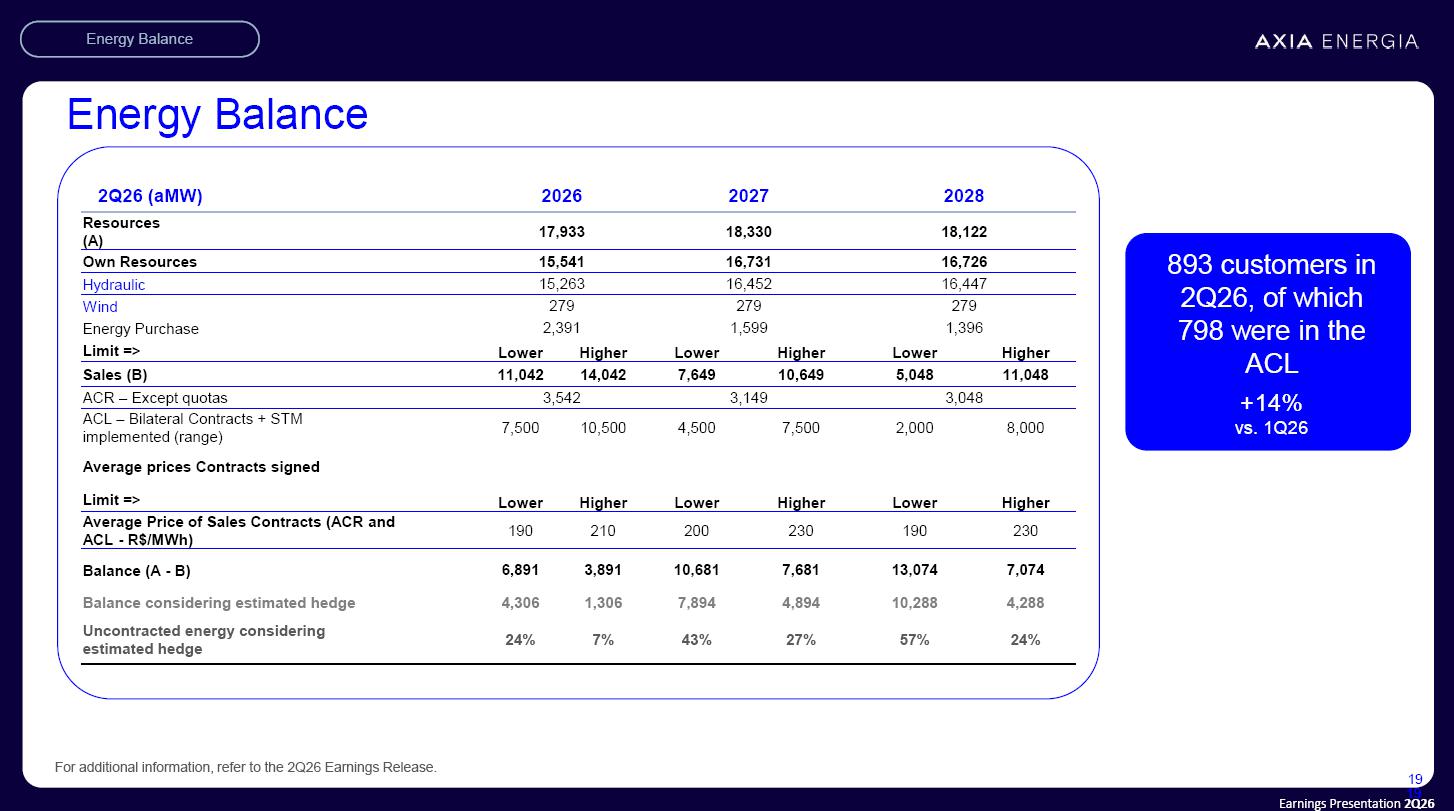
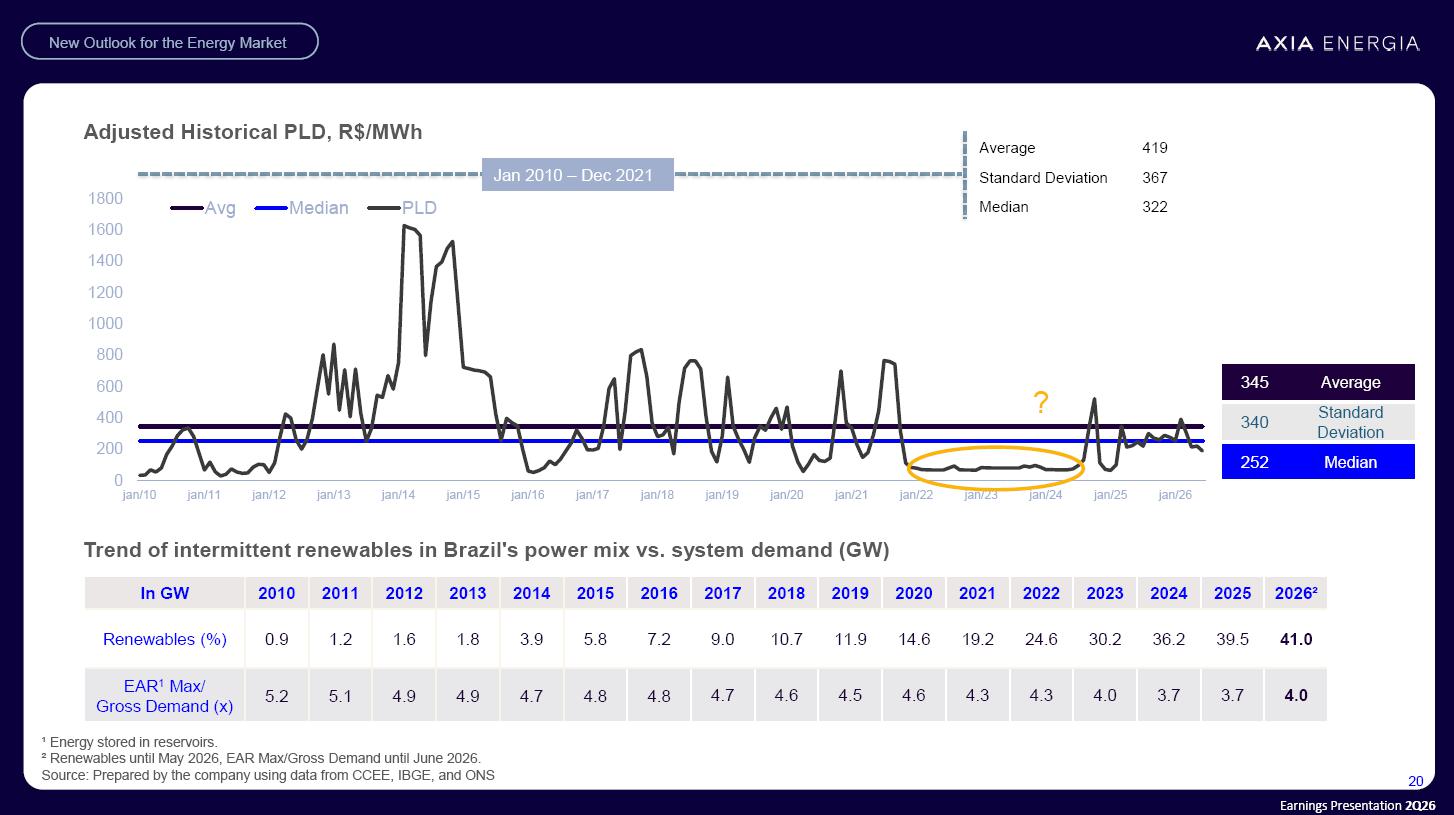
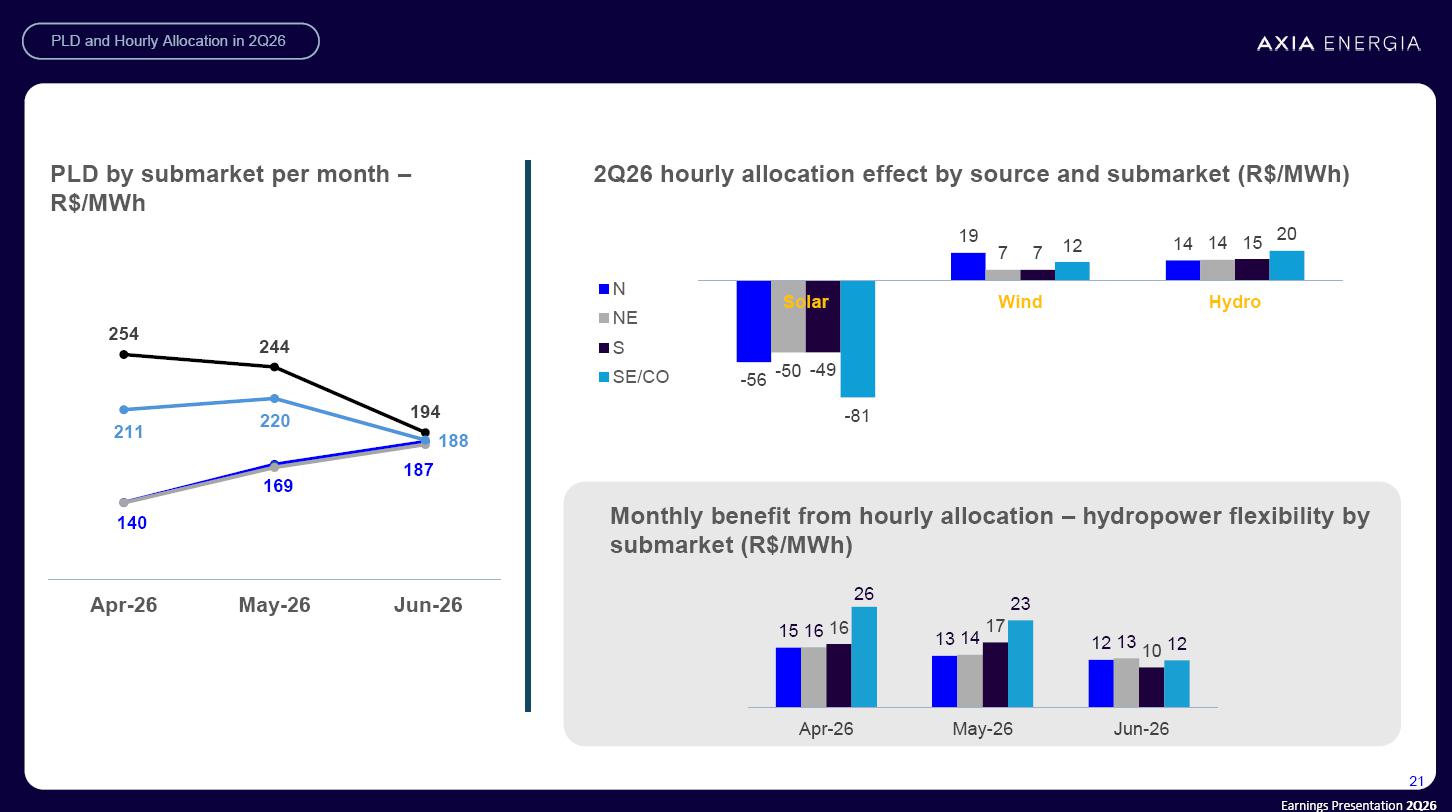
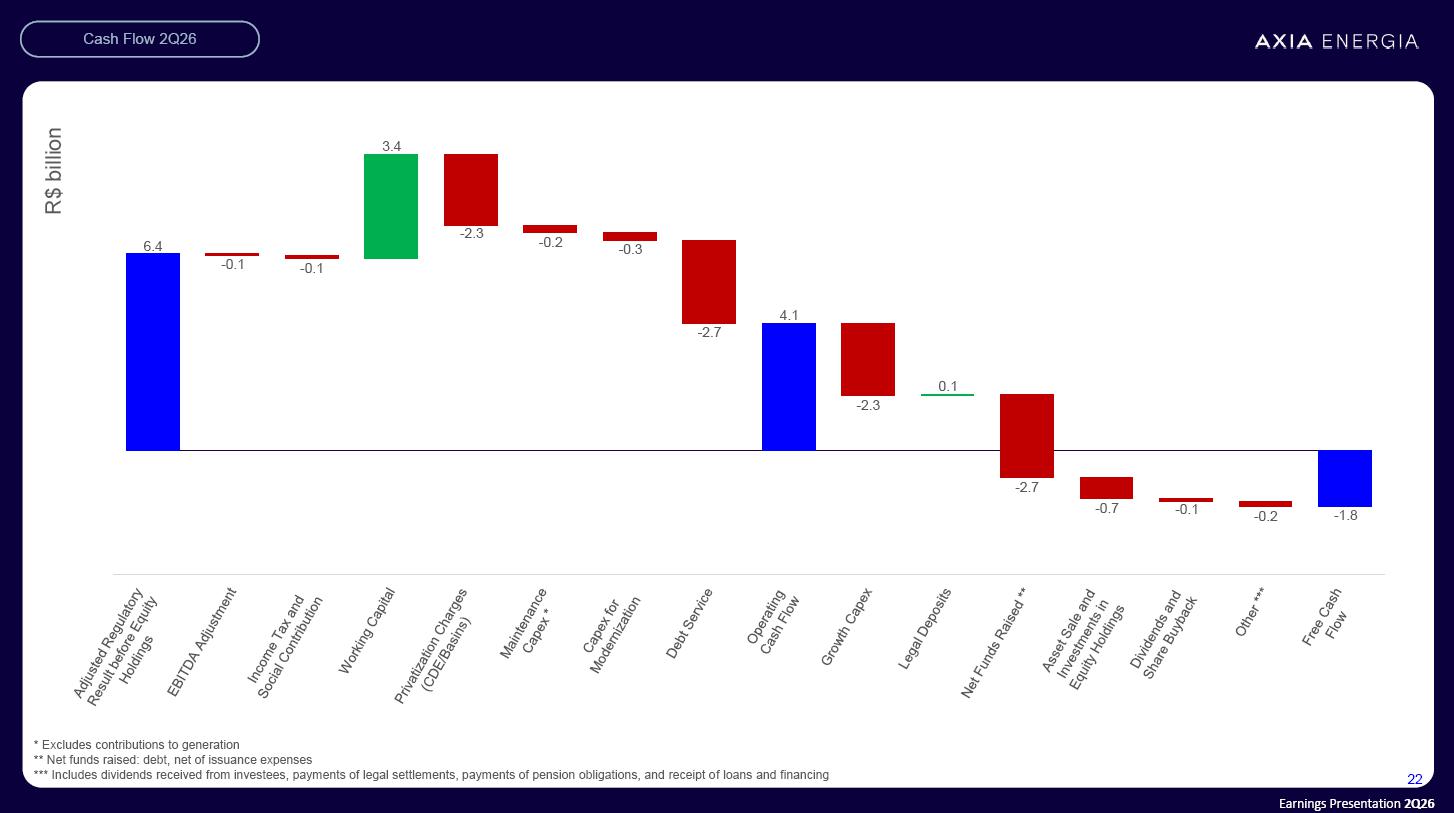
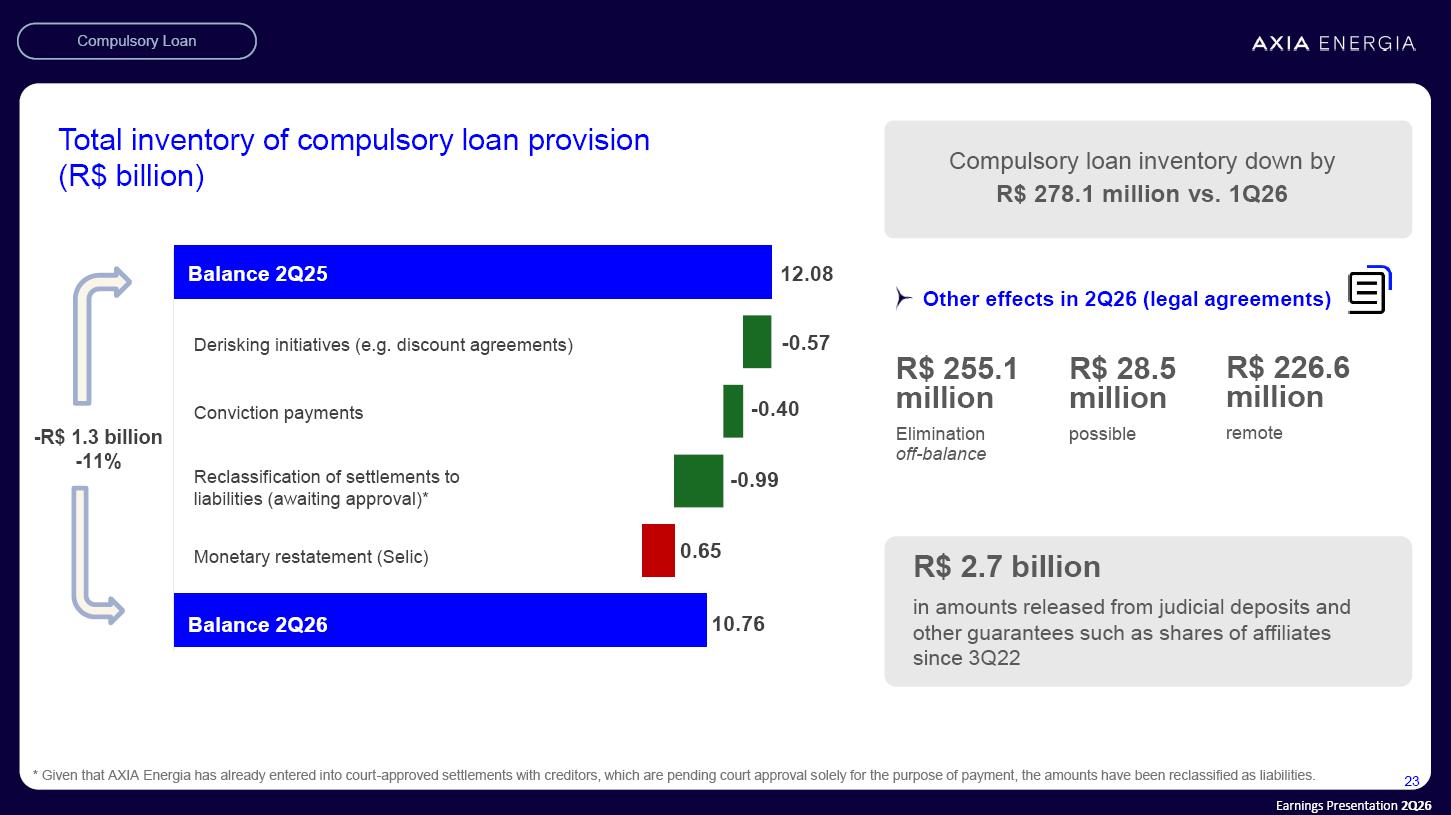
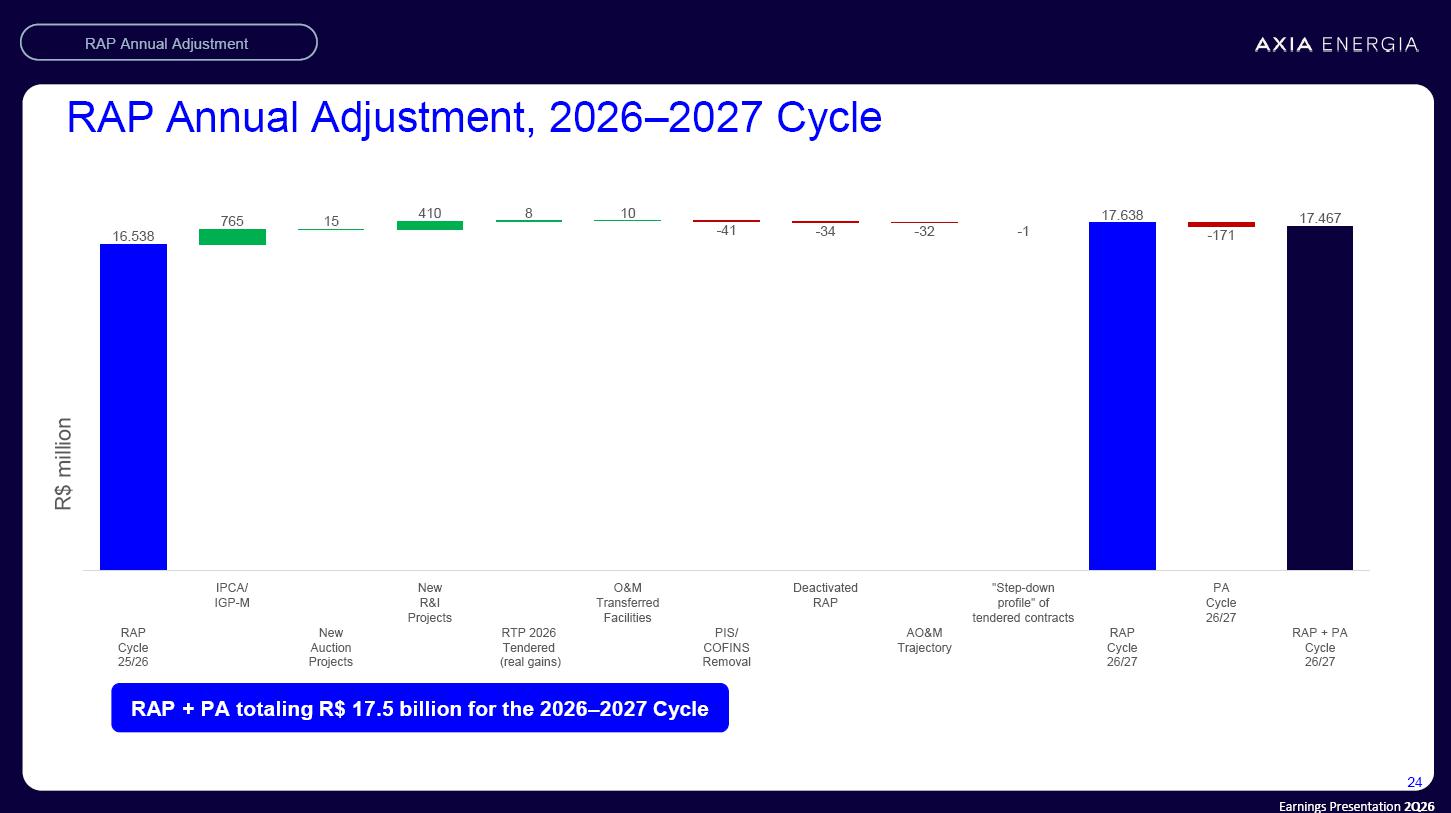
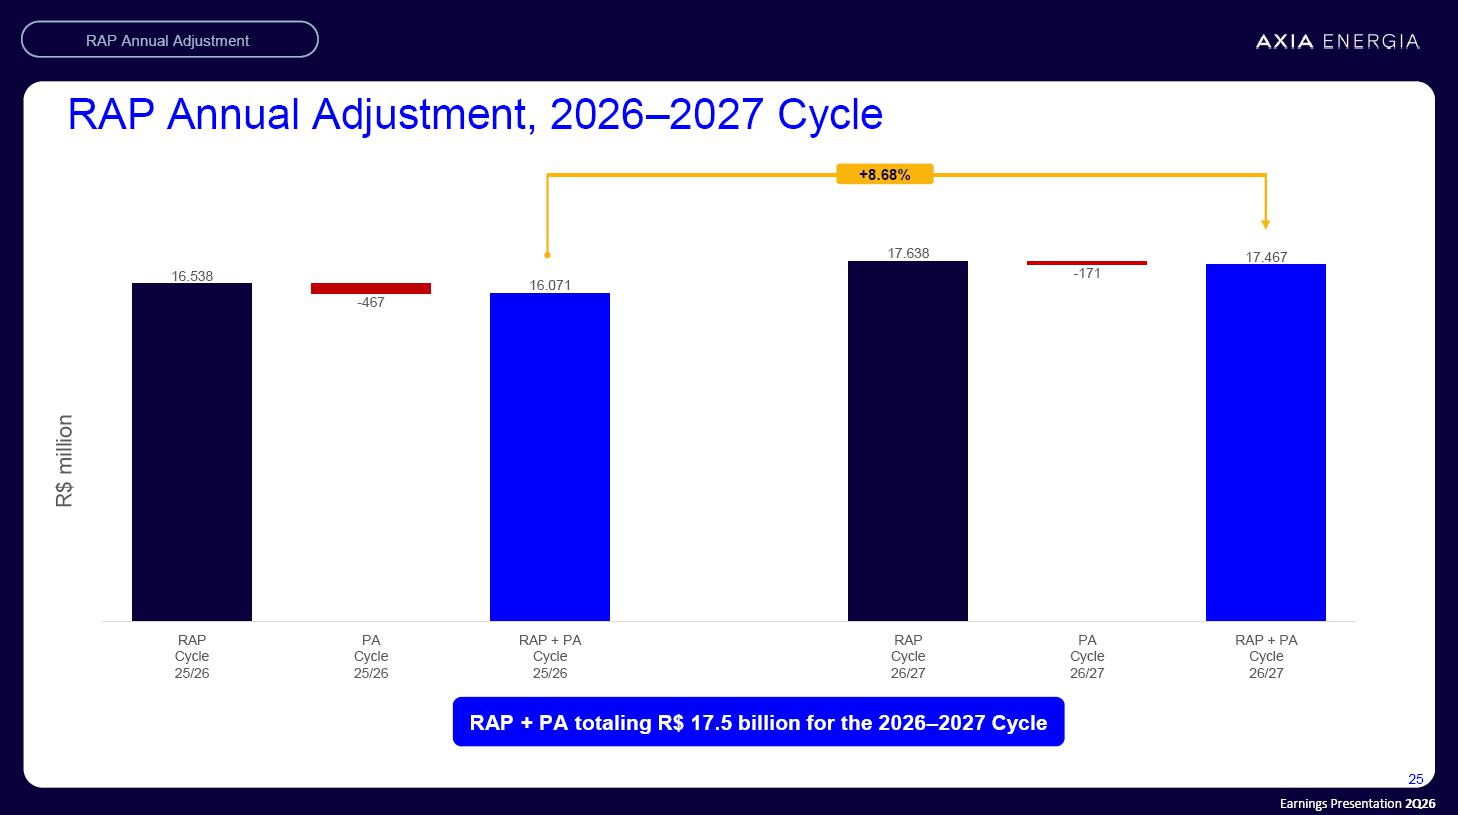
August 2026 2Q26 Earnings Presentation Earnings Presentation 2Q26 2 Disclaimer This presentation may contain estimates and projections that are not statements of historical fact but reflect the beliefs and expectations of our management and may constitute forward-looking statements within the meaning of Section 27A of the Securities Act of 1933, as amended, and Section 21E of the Securities and Exchange Act of 1934, as amended.The words "believes," "may," "can," "estimates," "continues," "anticipates," "intends," "expects," and similar expressions are intended to identify estimates that necessarily involve risks and uncertainties, known or unknown. Known risks and uncertainties include, but are not limited to: general economic, regulatory, political, and commercial conditions in Brazil and abroad; changes in interest rates, inflation, and the value of the Brazilian real; changes in consumerelectricity usage volumes and patterns; competitive conditions; our level of indebtedness, the possibility of receiving payments related to our receivables, changes in rainfall and water levels in the reservoirs used to operate our hydroelectric plants, our financing and capital investment plans, existing and future government regulations, and other risks described in our annual report and other documents filed with the CVM and SEC. Estimates and projections refer only to the date on which they were made, and we assume no obligation to update any of these estimates or projections due to new information or future events. The future results of the Companies' operations and initiatives may differ from current expectations, and investors should not rely solely on the information contained herein. This material contains calculations that may not reflect accurate results due to rounding. Earnings Presentation 2Q26 1. 2Q26 Financial Performance 2. Energy Trading 3. ESG Agenda 3 1. 2Q26 Financial Performance Earnings Presentation 2Q26 2Q26 Highlights 5 Financial Performance Adjusted Regulatory EBITDA: R$ 6,683 mn in 2Q26, up 21.5% YoY Corporate Governance: Completion of migration to B3’s Novo Mercado Transmission Auction: winning bid with projected ANEEL CAPEX of R$ 668 mn and RAP of R$ 50.8 mn Investments: R$ 3,117 million, up 52.6% YoY Capital Allocation Methodology: approval of up toR$ 3.7 bn in capital available for allocation in 2Q26, totaling up to R$7.7 bn in 1H26 Portfolio Management: divestment of minority stakes and consolidation of TrêsIrmãosHPP Increase in generation margin (ACL + MCP): went up to R$ 96/MWh in 2Q26 from R$ 73/MWh in 2Q25 PNC Shares: approval of redemption/conversion totaling R$ 2 bn Earnings Presentation 2Q26 Financial Performance R$ million 6 Financial Performance +5.9% +1.2% +21.5% +18.0% Adjusted Gross Revenue +R$ 0.1 bn +R$ 2.5 bn Regulatory EBITDA IFRS Net Income 12,191 12,910 11,585 11,728 2Q25 2Q26 IFRS Regulatory 5,820 6,870 5,501 6,683 2Q25 2Q26 Regulatory Adjusted Regulatory -1,325 1,191 1,469 1,608 2Q25 2Q26 IFRS Adjusted Earnings Presentation 2Q26 1,108 1,073 1,704 2,182 392 1,552 534 1,945 542 491 799 1,033 2,043 3,117 3,037 5,160 2Q25 2Q26 6M25 6M26 Generation and Others Transmission: Auction + HVDC + TNE Contribution ² Transmission: reinforcements and improvements 7 +53% +47% Resuming Investment Capacity Investments¹ R$ million Contracted Transmission Investments ANEEL CAPEX(R$ million) RAP (R$ million) Auction 01/2023 787 78 Auction 01/2024 5,593 645 Auction 04/2025 1,630 140 Auction 01/2026 668 51 Large-Scale Reinforcements 3,046 642 Small-Scale Improvements 2,817 445 Total 15,540 2,000 Transmission investments already contracted totaling > R$ 15 billion (1) Figures shown exclude investments made through acquisitions. Note: Large-scale reinforcements and improvements are authorized by ANEEL, which is also responsible for approving the auctions. Financial Performance Contracted Generation Investments: R$ 1 bn investment to add 247 MW to Luiz Gonzaga HPP Earnings Presentation 2Q26 Portfolio Management Saleofminoritystakesintransmission ▪ 4 SPEs totaling ˜1,086 km of transmission lines ▪ Proceeds of R$ 451.4 million AmazonasEnergia ▪ Assignment of all credits ▪ Proceeds of R$ 554.1 million and call option on a minority stake ConsolidationofTrêsIrmãosHPP ▪ Payment of R$ 256 million Uncrossingofequityholdings–ISAEnergia ▪ Proceeds of R$ 1.167 billion ▪ Acquisition of stake in IE Garanhunsand sale of stake in IE Madeira Corporatestructurestreamlining ▪ EGM called to approve merger of 4 subsidiaries: Tijoá, Juno, Retiro Baixoand Nova Era JanapuTransmissora 8 Financial Performance Earnings Presentation 2Q26 9 Up to R$ 3.7 billion in capital available for allocation in 2Q26 ▪ Up to R$ 3.7 bn in 2Q26 –totaling up to R$ 7.7 bn in 2026 Announcement of 2ndAXIA7 redemption/conversion ▪ Redemption amount: R$ 2 billion ▪ Redemption price: R$ 53.71 per share ▪ Opt-in period¹: August 12-14 ▪ Conversion and redemption dates: Aug 18 and Aug 24 Capital Allocation Methodology Approved in December 2024 Considers the optimal capital structure to determine the amount of capital available for allocation to: ▪ Shareholder returns—dividends and redemption /share buybacks ▪ M&A / Investments Evolution of shareholder returns R$ billion 4.0 8.3 4.0 3.7 2024 2025 2026 Dividends Capital available for redemption 1Q26 Capital available for redemption 2Q26 ¹Periodfornonresidentshareholderstosubmittheiraveragecostbasis:August10–13 Capitalavailableforallocation2026 7.7 Financial Performance 2. Energy Trading Earnings Presentation 2Q26 11 2Q26 Portfolio (in aMW) (+) Own resources 14,479 (+) Purchases 1,288 (-) Quotas 1,192 (-) ACR sales 3,442 (=) Available 11,133 1Q26 2Q26 (+) Own resources1 193 197 (+) Purchases 67 68 (-) Quotas2 0 0 (-) ACR sales 85 82 (=) Available 175 183 AXIA Energia has generation capacity across multiple submarkets, mitigating risk Portfolio Overview Notes North Submarket Northeast Submarket South Submarket Southeast/Central West Submarket Energy Trading 1Q26 2Q26 (+) Own resources1 3,756 3,275 (+) Purchases 0 0 (-) Quotas2 12 11 (-) ACR sales 130 130 (=) Available 3,614 3,134 1Q26 2Q26 (+) Own resources1 4,590 3,988 (+) Purchases 206 190 (-) Quotas2 796 709 (-) ACR sales 490 459 (=) Available 3,510 3,010 1Q26 2Q26 (+) Own resources1 7,728 7,019 (+) Purchases 982 1,030 (-) Quotas2 460 472 (-) ACR sales 3,014 2,771 (=) Available 5,236 4,806 Includes only plants under AXIA Energia direct management (1) Resources: assured capacity minus losses and GSF adjustments (2) In 2026 Earnings Presentation 2Q26 12 12.0 9.7 8.2 9.1 12.5 11.1 8.9 11.4 18.2 15.3 13.8 15.1 17.5 15.8 13.6 16.4 1Q25 2Q25 3Q25 4Q25 1Q26 2Q26 3Q26 4Q26 ACL Resource³ Total Resource² 108% 96% 65% 67% 92% 99% 72% 77% 1Q25 2Q25 3Q25 4Q25 1Q26 2Q26 3Q26 4Q26 Contribution Margin GSF MRE¹ % Contribution Margin from Generation (ACL+MCP)Regulatory result, excluding TPPs AXIA Energia Resources GWm (1) Seasonally Adjusted GSF as projected in InfoPLD07/07/2026 (2) Simulation of Total AXIA Energia Resources, seasonally adjusted according to MRE and applying MRE GSF. (3) Simulated total resources, net of obligations under ACR and Quota contracts. Energy Trading TheACL+MCPcontributionmargintakesintoaccountthecostofpowergeneration,includingtheaccountingeliminationsofamountspaidbytheCompany'sgenerationcompaniestotransmissioncompanieswithintheGroup.TheseeliminationsdonotaffectEBITDA.Theunitmarginsfor2Q25and1Q26shownabovedifferfromthosereportedintherespectiveearningsreleases,duetothereclassificationofenergyvolumesintheenergyresourcesallocatedbetweencontractingenvironments. 1,681 4,785 81 2,510 177 103 216 308 207 -100 -50 0 50 100 150 200 250 300 0 1.000 2.000 3.000 4.000 5.000 6.000 2Q25 1Q26 2Q26 ACL+MCP Contribution Margin (R$ mm), accounting Unit Margin ACL+MCP (R$/MWh), accounting PLD (R$/MWh) Earnings Presentation 2Q26 13 11.7 9.5 8.2 9.5 ¹End-of-monthfigures Energy Trading 69.5 70.6 68.6 69.7 67.6 69.4 72.3 71.0 March April May June 2025 2026 ENA (aGW) aEAR¹ (%) 75 54 54 82 64 47 April May June 2025 2026 PLDs Southeast (R$/MWh) 202 211 213 220 235 188 216 207 April May June 2Q 2025 2026 107 125 231 139 167 184 154 164 April May June 2Q PLDs Northeast (R$/MWh) Market Prices², on June 30 (R$/MWh) ²AverageBBCEpricesforSoutheastConventionalenergyfuturescontracts. ³ActualSoutheastPLDfortheperiod Energy Market Outlook: 2Q25 vs. 2Q26 1Q 2Q 3Q 4Q Actual³ Actual³ Estimated Actual³ Estimated Actual³ 2025 160 216 - 252 - 265 2026 311 207 169 - 269 - Hydrological Conditions Prices 3. ESG Earnings Presentation 2Q26 15 ESG ESG Agenda –2Q26 2025/2026PRO-ETHICSSEAL ▪ Granted by Brazil’s Office of the Comptroller General, the seal is one of the country’s leading initiatives for promoting corporate integrity ▪ Reinforces our commitment to ethics, transparency, corruption prevention, and robust governance and compliance practices ENVIRONMENTALRESTORATIONINTHEPARNAÍBARIVERBASIN ▪ R$ 78 million investment in up to 30 ecological restoration and water revitalization projects MIGRATIONTOB3’SNOVOMERCADOCOMPLETED ▪ B3’s highest corporate governance segment ▪ Equal and full voting rights ▪ Alignment of economic rights Earnings Presentation 2Q26 Our journey in adapting and building resilience to climate risks AXIA Energia invests in technology to enhance operational safety and efficiency 16 ESG 2023 2024 2025 2026 Climate risk screening and assessment for generation assets Implementation period for adaptation plans Definition of adaptation plans for generation and risk assessment for transmission Adaptation plans implemented at 60% of assets 2028 Climate Event Monitoring and Intelligence Center ▪ Extensive use of artificial intelligence in weather models to forecast extreme events ▪ 100% of assets monitored Investment assessment methodology updated to incorporate climate factors ▪ Transmission auctions ▪ M&As Conclusion Ongoing analysis of climate variables and future trends axiaenergia.com.br @axiaenergia /axiaenergia/ axiaenergia.com.br Q&A Apresentação de Resultados 2T26 Appendix Earnings Presentation 2Q26 893 customers in 2Q26, of which 798 were in the ACL +14% vs. 1Q26 19 19 2Q26 (aMW) 2026 2027 2028 Resources (A) 17,933 18,330 18,122 Own Resources 15,541 16,731 16,726 Hydraulic 15,263 16,452 16,447 Wind 279 279 279 Energy Purchase 2,391 1,599 1,396 Limit => Lower Higher Lower Higher Lower Higher Sales (B) 11,042 14,042 7,649 10,649 5,048 11,048 ACR –Except quotas 3,542 3,149 3,048 ACL –Bilateral Contracts + STM implemented (range) 7,500 10,500 4,500 7,500 2,000 8,000 Average prices Contracts signed Limit => Lower Higher Lower Higher Lower Higher Average Price of Sales Contracts (ACR and ACL -R$/MWh) 190 210 200 230 190 230 Balance (A -B) 6,891 3,891 10,681 7,681 13,074 7,074 Balance considering estimated hedge 4,306 1,306 7,894 4,894 10,288 4,288 Uncontracted energy considering estimated hedge 24% 7% 43% 27% 57% 24% Energy Balance Energy Balance For additional information, refer to the 2Q26 Earnings Release. Earnings Presentation 2Q26 0 200 400 600 800 1000 1200 1400 1600 1800 jan/10 jan/11 jan/12 jan/13 jan/14 jan/15 jan/16 jan/17 jan/18 jan/19 jan/20 jan/21 jan/22 jan/23 jan/24 jan/25 jan/26 Avg Median PLD ? 345 Average 340 Standard Deviation 252 Median Average 419 Standard Deviation 367 Median 322 In GW 2010 2011 2012 2013 2014 2015 2016 2017 2018 2019 2020 2021 2022 2023 2024 2025 2026² Renewables (%) 0.9 1.2 1.6 1.8 3.9 5.8 7.2 9.0 10.7 11.9 14.6 19.2 24.6 30.2 36.2 39.5 41.0 EAR1Max/ Gross Demand (x) 5.2 5.1 4.9 4.9 4.7 4.8 4.8 4.7 4.6 4.5 4.6 4.3 4.3 4.0 3.7 3.7 4.0 20 New Outlook for the Energy Market Adjusted Historical PLD, R$/MWh Trend of intermittent renewables in Brazil's power mix vs. system demand (GW) ¹ Energy stored in reservoirs. ² Renewables until May 2026, EAR Max/Gross Demand until June 2026. Source: Prepared by the company using data from CCEE, IBGE, and ONS Jan 2010 –Dec 2021 Earnings Presentation 2Q26 -56 19 14 -50 7 14 -49 7 15 -81 12 20 Solar Wind Hydro N NE S SE/CO 15 13 12 16 14 13 16 17 10 26 23 12 Apr-26 May-26 Jun-26 140 169 187 254 244 194 211 220 188 Apr-26 May-26 Jun-26 21 PLD and Hourly Allocation in 2Q26 2Q26 hourly allocation effect by source and submarket (R$/MWh) Monthly benefit from hourly allocation –hydropower flexibility by submarket (R$/MWh) PLD by submarket per month –R$/MWh Earnings Presentation 2Q26 22 R$ billion * Excludes contributions to generation ** Net funds raised: debt, net of issuance expenses *** Includes dividends received from investees, payments of legal settlements, payments of pension obligations, and receipt of loans and financing Cash Flow 2Q26 6.4 -0.1 -0.1 3.4 -2.3 -0.2 -0.3 -2.7 4.1 -2.3 0.1 -2.7 -0.7 -0.1 -0.2 -1.8 Earnings Presentation 2Q26 10.76 12.08 0.65 -0.99 -0.40 -0.57 -R$ 1.3 billion -11% Balance 2Q25 Balance 2Q26 Derisking initiatives (e.g. discount agreements) Conviction payments Reclassification of settlements to liabilities (awaiting approval)* Monetary restatement (Selic) 23 Compulsory Loan * Given that AXIA Energia has already entered into court-approved settlements with creditors, which are pending court approval solely for the purpose of payment, the amounts have been reclassified as liabilities. Other effects in 2Q26 (legal agreements) R$ 255.1 million Elimination off-balance R$ 28.5million possible R$226.6million remote Total inventory of compulsory loan provision (R$ billion) Compulsory loan inventory down by R$ 278.1 million vs. 1Q26 R$ 2.7 billion in amounts released from judicial deposits and other guarantees such as shares of affiliates since 3Q22 Earnings Presentation 2Q26 2416.53876515410810-41-34-32-117.638-17117.467RAP Cycle 25/26IPCA/ IGP-MNewAuction ProjectsNew R&IProjectsRTP 2026 Tendered(real gains)O&MTransferred FacilitiesPIS/COFINSRemovalDeactivated RAPAO&MTrajectory"Step-downprofile" oftendered contractsRAP Cycle 26/27PA Cycle 26/27RAP + PA Cycle 26/27 RAP Annual Adjustment RAP + PA totaling R$ 17.5 billion for the 2026–2027 Cycle RAP Annual Adjustment, 2026–2027 Cycle R$ million Earnings Presentation 2Q26 25 R$ million +8.68%16.538-46716.07117.638-17117.467RAP Cycle 25/26PA Cycle 25/26RAP + PA Cycle 25/26RAP Cycle 26/27PA Cycle 26/27RAP + PA Cycle 26/27 RAP Annual Adjustment, 2026–2027 Cycle RAP + PA totaling R$ 17.5 billion for the 2026–2027 Cycle RAP Annual Adjustment axiaenergia.com.br @axiaenergia /axiaenergia/ axiaenergia.com.br Welcome to the power of the new



SIGNATURE
Pursuant to the requirements of the Securities Exchange Act of 1934, the registrant has duly caused this report to be signed on its behalf by the undersigned, thereunto duly authorized.
Date: August 6, 2026
| AXIA Energia S.A. | ||
| By: |
/S/ Eduardo Haiama |
|
|
Eduardo Haiama Vice-President of Finance and Investor Relations |
||
FORWARD-LOOKING STATEMENTS
This document may contain estimates and projections that are not statements of past events but reflect our management’s beliefs and expectations and may constitute forward-looking statements under Section 27A of the Securities Act of 1933, as amended, and Section 21E of the Securities and Exchange Act of 1934, as amended. The words “believes”, “may”, “can”, “estimates”, “continues”, “anticipates”, “intends”, “expects”, and similar expressions are intended to identify estimates that necessarily involve known and unknown risks and uncertainties. Known risks and uncertainties include, but are not limited to: general economic, regulatory, political, and business conditions in Brazil and abroad; fluctuations in interest rates, inflation, and the value of the Brazilian Real; changes in consumer electricity usage patterns and volumes; competitive conditions; our level of indebtedness; the possibility of receiving payments related to our receivables; changes in rainfall and water levels in reservoirs used to operate our hydroelectric plants; our financing and capital investment plans; existing and future government regulations; and other risks described in our annual report and other documents filed with the CVM and SEC. Estimates and projections refer only to the date they were expressed, and we do not assume any obligation to update any of these estimates or projections due to new information or future events. Future results of the Company’s operations and initiatives may differ from current expectations, and investors should not rely solely on the information contained herein. This material contains calculations that may not reflect precise results due to rounding.