.2

Avidbank Investor Presentation | Q3 2025

Safe Harbor Statement and Disclaimer Forward-Looking Statements This presentation and any accompanying oral presentation contain forward-looking statements within the meaning of U.S. federal securities laws, which involve risks and uncertainties. You should not place undue reliance on forward-looking statements because they are subject to numerous uncertainties and factors relating to our operations and business, all of which are difficult to predict and many of which are beyond our control. Forward-looking statements include information concerning our possible or assumed future results of operations, including descriptions of our business strategy and expectations. These forward-looking statements are generally identified by the use of forward-looking terminology, including the terms “anticipate,” “believe,” “could,” “estimate,” “expect,” “intend,” “may,” “plan,” “potential,” “predict,” “project,” “should,” “target,” “will,” “would” and, in each case, their negative or other variations or comparable terminology and expressions. The results, events and circumstances reflected in the forward-looking statements may not be achieved or occur, and actual results, events, or circumstances could differ materially from those described in the forward-looking statements. We caution that the forward-looking information and statements are based largely on our expectations and are subject to a number of known and unknown risks and uncertainties that are subject to change based on factors which are, in many instances, beyond our control. Such forward-looking statements are based on various assumptions (some of which may be beyond our control) and are subject to risks and uncertainties, which change over time, and other factors which could cause actual results to differ materially from those currently anticipated. Such risks and uncertainties include, but are not limited to: uncertain market conditions and economic trends nationally, regionally and particularly in the Bay Area (which we define as the counties of Alameda, Contra Costa, Marin, Monterey, Napa, San Francisco, San Mateo, Santa Clara, Santa Cruz, Solano, and Sonoma) and California; economic conditions affecting the venture capital and private equity industries, including any decline in overall portfolio company investment, merger and acquisition activity and other liquidity events affecting venture and private equity fund and their portfolio companies; risks related to the concentration of our business in California, and specifically within the Bay Area, including risks associated with any downturn in the real estate sector; our inability to successfully reposition our available-for-sale securities portfolio utilizing the proceeds from our recent public offering; the effects of a prolonged government shutdown; incurrence of any losses in connection with any repositioning of our available-for-sale securities portfolio utilizing the proceeds from our recently completed public offering; the occurrence of significant natural disasters, including fires and earthquakes, and acts of war or terrorism; our ability to conduct our business could be disrupted by natural or man-made disasters, including the effects of pandemic viruses; changes in market interest rates that affect the pricing of our loans and deposits and our net interest income; risks related to our strategic focus on lending to small to medium-sized businesses; the sufficiency of the assumptions and estimates we make in establishing reserves for potential loan losses and the value of loan collateral and securities; our ability to attract and retain executive officers and key employees and their customer and community relationships; adverse changes in the financial performance and/or condition of our borrowers and, as a result, increased loan delinquency rates, deterioration in asset quality and losses in our loan portfolio; the costs of and effects of legal and regulatory developments, including legal proceedings and lawsuits we are or may become subject to; the results of regulatory examinations or reviews and the effect of and our ability to comply with, any regulations or regulatory orders or actions we are or may become subject to; our level of nonperforming assets and the costs associated with resolving problem loans; our ability to maintain adequate liquidity and to raise necessary capital to fund our growth strategy and operations or to meet increased minimum regulatory capital levels; the effects of increased competition from a wide variety of local, regional, national and other providers of financial services; technological changes and developments; negative trends in our market capitalization and adverse changes in the price of our common stock; risks associated with unauthorized access, cyber-crime and other threats to data security; the effects of any acquisitions or dispositions we may make or evaluate, and the costs associated with any potential or actual acquisition or disposition; our ability to comply with various governmental and regulatory requirements applicable to financial institutions, including supervisory actions by federal and state banking agencies; the impact of recent and future legislative and regulatory changes, including changes in banking, accounting, securities and tax laws and regulations and their application by our regulators, and economic stimulus programs; governmental monetary and fiscal policies, including the policies of the Federal Reserve and policies related to tariffs; our ability to implement, maintain and improve effective internal controls; our use of the net proceeds from our recent public offering; and our success at managing any of the risks involved any of the foregoing items. Additional factors that could cause actual results to differ materially from those expressed in the forward-looking statements are discussed in the Company's filings with the SEC, including the Company’s most recent quarterly report on Form 10-Q, under the heading “Risk Factors” and available at the SEC’s Internet site www.sec.gov. The foregoing factors should not be considered exhaustive. New risks and uncertainties may emerge from time to time, and it is not possible for us to predict their occurrence or how they will affect us. If one or more of the factors affecting our forward-looking information and statements proves incorrect, then our actual results, performance or achievements could differ materially from those expressed in, or implied by, forward-looking information. Therefore, we caution you not to place undue reliance on our forward-looking information and statements. We disclaim any duty to revise or update the forward-looking statements, whether written or oral, to reflect actual results or changes in the factors affecting the forward-looking statements, except as specifically required by law. Avidbank 2

Safe Harbor Statement and Disclaimer (continued) Industry Information Within this presentation, we reference certain industry and sector information and statistics. We have obtained this information and statistics from various independent, third-party sources. Nothing in the data used or derived from third-party sources should be construed as advice. Some data and other information are also based on our good faith estimates, which are derived from our review of internal surveys and independent sources. We believe that these external sources and estimates are reliable but have not independently verified them. Statements as to our market position are based on market data currently available to us. Although we are not aware of any misstatements regarding the demographic, economic, employment, industry and trade association data presented herein, these estimates involve inherent risks and uncertainties and are based on assumptions that are subject to change. Finally, forward-looking information obtained from these third-party sources is subject to the same qualifications and the additional uncertainties regarding the other forward-looking statements in this presentation. Non-GAAP Financial Measures This presentation includes financial information prepared in accordance with accounting principles generally accepted in the United States ("GAAP"). This presentation also includes non-GAAP financial information, which should be considered supplemental to, not a substitute for, or superior to, the financial measure calculated in accordance with GAAP. Management has presented these non-GAAP financial measures because we believe that these measures provide useful information to management and investors that is supplementary to our financial condition, results of operations and cash flows computed in accordance with GAAP. Management believes that adjusted net income, adjusted diluted earnings per share, adjusted return on average assets, adjusted return on average equity, adjusted efficiency ratio, taxable equivalent net interest income and taxable equivalent net interest margin are reasonable measures to understand the Company’s core operating performance and are important to many investors who are interested in understanding our profitability prospects from our core operations. However, we acknowledge that our non-GAAP financial measures have a number of limitations, As such, you should not view these disclosures as a substitute for results determined in accordance with GAAP, and they are not necessarily comparable to non-GAAP financial measures that other banking companies use. Other banking companies may use names similar to those we use for the non-GAAP financial measures we disclose but may calculate them differently. You should understand how we and other companies each calculate their non-GAAP financial measures when making comparisons. For a description of the non-GAAP financial information included herein and reconciliations to the most directly comparable GAAP measure, see the appendix to this presentation. Avidbank 3

Diversified Commercial Bank Positioned for Growth Overview Founded in 2003 with roots in dynamic Bay Area and a national expansion strategy Disciplined underwriting approach with a proven track record of solid asset quality through various economic cycles Efficient footprint with one full-service branch and two loan production offices Recent Highlights Completed IPO in August 2025, raising $62 million in capital Repositioned AFS investment portfolio by selling $275 million in AFS securities in the third quarter of 2025 and reinvesting a portion of the proceeds into new AFS securities. Immediate improvement in profitability, strengthened capital position, and paid off all wholesale funding Q3 2025 Financial Highlights1 Reported (6.35)% Return on average assets (63.19)% Return on average equity (35.28)% Efficiency Ratio 3.90% Net interest margin -0.01% NCOs / Loans YTD Operating2 1.13% Return on average assets 11.23% Return on average equity 55.72% Efficiency Ratio 3.90% Net interest margin -0.01% NCOs / Loans YTD 1Financial data as of the three months ended September 30, 2025 2Adjusted measures. See GAAP to non-GAAP reconciliation in Appendix for detail Avidbank 4

Our Business Model Local Bay Area Focus Corporate Banking Traditional core commercial banking Provides high touch service that enables our local clients to meet their financing needs and manage their cash Focus on commercial customers throughout the Bay Area Commercial Real Estate Provides a range of financing options at competitive rates and terms for seasoned, stabilized asset, or potential “value-add” opportunities Focus on commercial, multi-family and mixed-use investment properties throughout the Bay Area Construction Lending Provides land acquisition loans, pre-development loans and construction loans on residential, commercial and mixed-use properties Primary focus is residential properties in desirable Bay Area neighborhoods Growing National Presence Venture Lending & Fund Finance Comprehensive suite of banking and financing solutions for technology sector entrepreneurs and their investors Venture-backed companies generate higher volumes of deposits relative to borrowing needs High-touch, relationship-based approach Specialty Finance Provides creative financing solutions to emerging growth and established companies across the U.S. Lending focus includes asset-based lending, AR financing, and M&A sponsor finance High-touch, relationship-based approach Avidbank 5

Bay Area Core, Expanding National Reach AVBH Headquarters Primary Lending Area Banking Relationships Avidbank serves clients in 39 states with team members located in key innovation hubs nationwide 24% of loan balances are outside of California, driven by targeted growth in Venture and Specialty Finance 1Bay Area defined as the counties of Alameda, Contra Costa, Marin, Monterey, Napa, San Francisco, San Mateo, Santa Clara, Santa Cruz, Solano, and Sonoma Avidbank 6
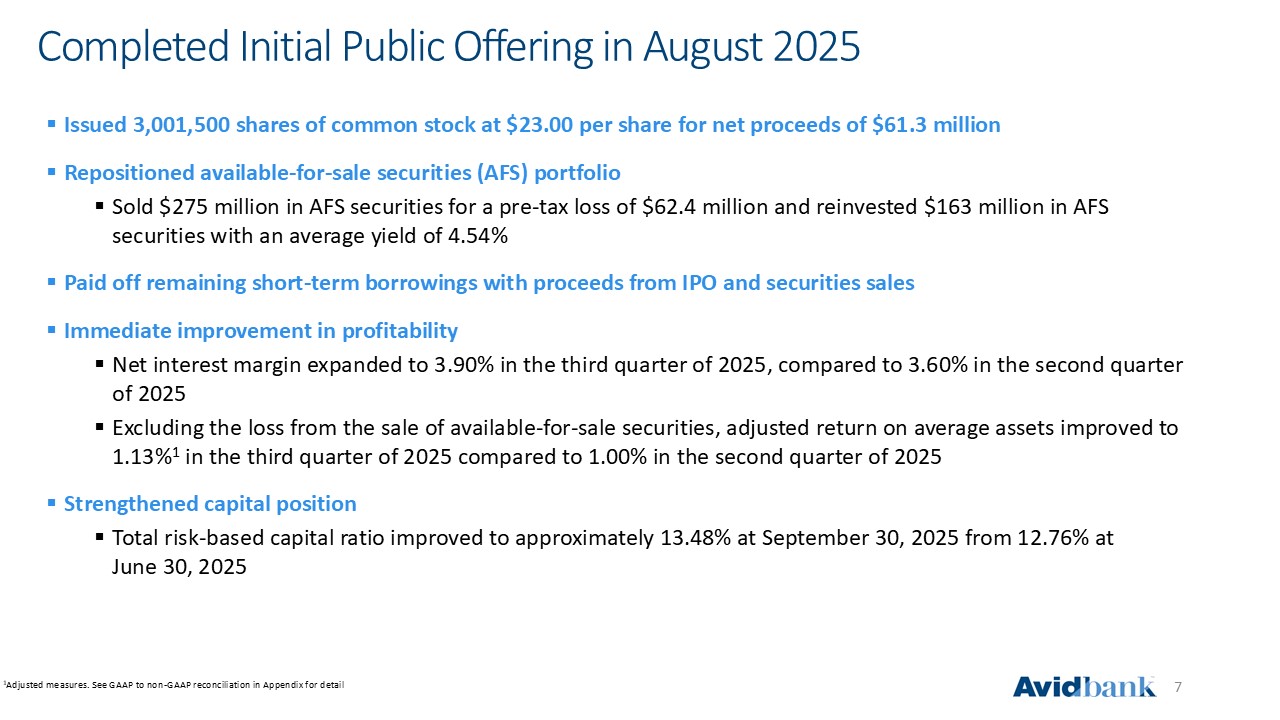
Completed Initial Public Offering in August 2025 Issued 3,001,500 shares of common stock at $23.00 per share for net proceeds of $61.3 million Repositioned available-for-sale securities (AFS) portfolio Sold $275 million in AFS securities for a pre-tax loss of $62.4 million and reinvested $163 million in AFS securities with an average yield of 4.54% Paid off remaining short-term borrowings with proceeds from IPO and securities sales Immediate improvement in profitability Net interest margin expanded to 3.90% in the third quarter of 2025, compared to 3.60% in the second quarter of 2025 Excluding the loss from the sale of available-for-sale securities, adjusted return on average assets improved to 1.13%1 in the third quarter of 2025 compared to 1.00% in the second quarter of 2025 Strengthened capital position Total risk-based capital ratio improved to approximately 13.48% at September 30, 2025 from 12.76% at June 30, 2025 1Adjusted measures. See GAAP to non-GAAP reconciliation in Appendix for detail Avidbank 7

Q3 2025 Income and Profitability Results as of and for S in thousands, except per share amounts Q32025 Q22025 Q12025 _YTD2025 _YTD2024 Select Operating Data: Net Interest Income $ 22,650 $ 20,290 $ 19,352 $ 62,292 $ 56,023 Provision for Credit Losses 1,355 925 - 2,280 3,317 Total Noninterest Income (60,852) 1,538 1,171 (58,143) 4,170 Total Noninterest Expense _13,479 _12,609 _12,842 _38,930 _36,280 Income Before Income Taxes (53,036) 8,294 7,681 (37,061) 20,596 Income Tax Expense (15,301) 2,497 2,245 (10,559) 6,038 Net (Loss) / Income $ (37,735) $5,797 $5,436 $ (26,502) $14,558 Net Income - adjusted $6,707 $5,797 $5,436 $17,940 $14,558 Per Share Data: Diluted Earnings Per Share $ (4.12) $ 0.75 $ 0.71 $ (3.28) $ 1.92 Diluted Earnings Per Share - adjusted’ 0.72 0.75 0.71 2.18 1.92 Book Value Per Share 25.00 25.80 24.85 25.00 23.95 Performance Ratios: Return on Average Assets - adjusted’ 1.13% 1.00% 0.96% 1.03% 0.86% Return on Average Equity - adjusted1 11.2% 11.6% 11.5% 11.4% 11.4% Tax-Equivalent Net Interest Margin 3.90% 3.60% 3.52% 3.68% 3.42% Efficiency Ratio - adjusted’ 55.7% 57.8% 62.6% 58.5% 60.3% Q3 2025 Income Highlights Reported Operating1 $(4.12) Diluted earnings per share $(37,735) Net income (6.35)% Return on average assets 3.90% Net interest margin (35.28)% Efficiency Ratio $0.72 Diluted earnings per share $6,707 Net income 1.13% Return on average assets 3.90% Net interest margin 55.72% Efficiency Ratio 000s in millions 1Adjusted measures. See GAAP to non-GAAP reconciliation in Appendix for detail Avidbank 8

Q3 2025 Balance Sheet Results as of and for S in thousands Q3 2025 Q2 2025 QI 2025 Q3 2025 Q2 2025 Q1 2025 Balance Sheet: Balance Sheet and Capital Ratios: Cash and Cash Equivalents $ 177,319 $ 129,923 $ 125,001 Tier 1 Leverage Ratio 11.1% 10.5% 10.4% Investment Securities 173,588 292,808 296,617 Common Equity Tier 1 Ratio 11.7% 11.0% 11.1% Net Loans 1,937,560 1,892,094 1,822,465 Tier 1 Risk-Based Capital Ratio 11.7% 11.0% 11.1% Other Assets _73,987 _77,304 _75,839 Total Risk-Based Capital Ratio 13.5% 12.8% 12.9% Total Assets $2,362,454 $2,392,129 $ 2,319,922 Common Equity Ratio 11.6% 8.6% 8.5% Deposits $ 2,049,158 $ 2,002,781 $ 1,929,488 Asset Quality Data: Subordinated Debt, Net 22,000 22,000 22,000 Total ACL / Loans + Unfunded Commitments 1.19% 1.15% 1.14% Short-Temm Borrowings - 145,000 155,000 Nonperforming Assets to Total Assets 0.12% 0.06% 0.06% Other Liabilities _18,183 _17,929 _16,815 Net Charge-Offs to Average Loans (0.01%) 0.00% (0.01%) Total Liabilities 2,089,341 2,187,710 2,123,303 Total Shareholders' Equity 273,113 204,419 196,619 Total Liabilities and Shareholders' Equity $ 2,362,454 $ 2,392,129 $ 2,319,922 At September 30, 2025: Loans increased $46.9 million, or 10% annualized, from June 30, 2025 and $171.8 million, or 10%, from September 30, 2024 Average quarterly deposits increased $72.0 million, or 15% annualized, from the second quarter of 2025 and $238.3 million, or 13%, from the third quarter of 2024 Nonperforming assets to total assets totaled 0.12% compared to 0.06% at June 30, 2025 and 0.16% at September 30, 2024 Avidbank 9

Proven Organic Growth Total Assets ($M) $783 $917 $1,132 $1,432 $2,162 $2,133 $2,331 $2,304 $2,362 2017 – Q3 2025 CAGR: 15% 2017Y 2018Y 2019Y 2020Y 2021Y 2022Y 2023Y 2024Y 2025Q3 Total Loans ($M) $648 $807 $889 $993 $1,223 $1,554 $1,741 $1,865 $1,959 2017 – Q3 2025 CAGR: 15% 2017Y 2018Y 2019Y 2020Y 2021Y 2022Y 2023Y 2024Y 2025Q3 Total Deposits ($M) $646 $797 $973 $1,254 $1,979 $1,823 $1,654 $1,891 $2,049 2017 – Q3 2025 CAGR: 16% 2017Y 2018Y 2019Y 2020Y 2021Y 2022Y 2023Y 2024Y 2025Q3 Loan / Deposit Ratio (%) 100% 101% 91% 79% 62% 2% 105% 99% 96% 2017Y 2018Y 2019Y 2020Y 2021Y 2022Y 2023Y 2024Y 2025Q3 Avidbank 10

Net Interest Margin Expansion Net Interest Income ($) and Taxable Equivalent Net Interest Margin1 (%) Steady loan yields, decreasing deposit costs, and DDA growth have contributed to expanding margin 3.35% 3.49% 3.52% 3.60% 3.90% $18,613 $19,199 $19,352 $20,290 $22,650 2024Q3 2024Q4 2025Q1 2025Q2 2025Q3 Historical Loan Yields (%) 7.38% 7.07% 6.96% 7.01% 6.98% 2024Q3 2024Q4 2025Q1 2025Q2 2025Q3 Net Interest Income Sensitivity -2.60% -2.40% 3.72% 7.76% -6.83% -4.33% 5.67% 11.73% 2025Q2 2025Q3 48% of loans floating at 9/30/2025 Historical Deposit Cost (%) Deposit beta since Q2 2024: 59% 3.22% 2.94% 2.76% 2.78% 2.67% 2024Q3 2024Q4 2025Q1 2025Q2 2025Q3 1Adjusted profitability measures. See GAAP to non-GAAP reconciliation in Appendix for detail Avidbank 11

Improvement in Capital Ratios Common Equity Ratio (%) 6.3% 6.4% 7.4% 8.1% 11.6% 2021Y 2022Y 2023Y 2024Y 2025Q3 Tier 1 Risk Based Capital Ratio (%) 8.9% 9.8% 9.9% 10.6% 11.7% 2021Y 2022Y 2023Y 2024Y 2025Q3 Tier 1 Leverage Ratio (%) 6.9% 9.5% 9.8% 10.4% 11.1% 2021Y 2022Y 2023Y 2024Y 2025Q3 Total Risk Based Capital Ratio (%) 11.1% 11.8% 11.9% 12.3% 13.5% 2021Y 2022Y 2023Y 2024Y 2025Q3 Avidbank 12

Diversified Lending Platform Five specialized verticals driving balanced, disciplined growth 15% loan CAGR since 2017, demonstrating consistent execution across cycles Commercial lending focus – C&I plus owner-occupied CRE account for 53% of total loans Diversified CRE book spans office, hotel, retail, industrial and more – no single-sector risk Targeted construction lending focused on residential builds in affluent Bay Area markets with experienced local developers Loan Portfolio by Type CRE Owner Occupied, 9% Residential Real Estate, 2% Venture & Fund Finance, k 17% Construction & Land, 11% Multifamily, 13% Sponsor Finance, 12% Asset-Based Lending, 6% Invoice Financing, 2% Non-Owner Occupied, 21% . Other C&l, 7% Loan Portfolio Interest Rate Comparison1 Fixed 25% Adjustable 27% Floating 48% Total Loans at September 30, 2025: $2.0B 13% of floating rate loans are at floor rates Non-Owner Occupied CRE at 9/30/2025 $s in 000s; % of total loans Office $ 142,360 7% Retail 86,866 4% Hotel/Motel 78,521 4% Industrial 68,711 4% Warehouse 16,634 1% Other 19,531 1% Total $ 412,623 21% Average Non-Owner Occupied Office Loan Size: $3.0M 1Loan portfolio by type does not reflect the divisional breakdowns; divisions may include loans across multiple product types Avidbank 13

Disciplined Credit Culture and Minimal History of Losses Proven ability to manage credit through cycles with minimal loss history, even following tumultuous periods for the sector Low net-charge-offs, averaging just 7 bps annually since 2017, including only 1 bp in both 2022 and 2023 Structured credit process combines efficient execution with strong controls, including: Multi-level credit approval framework Regular divisional portfolio reviews Special Asset Committee meetings twice a month to review any watch, criticized, and classified loans Independent third-party reviews conducted annually on over 90% of loan balances Nonperforming assets represent just 12 bps of total assets as of September 30, 2025 ACL coverage to NPAs stands at 765%; underscoring conservative reserve posture NPAs / Assets (%) 0.66% 0.18% 0.34% 0.25% 0.15% 0.67% 0.06% 0.06% 0.12% 2017Y 2018Y 2019Y 2020Y 2021Y 2022Y 2023Y 2024Y 2025Q3 ACL / Loans + Unfunded Commitments (%) and NCOs / Average Loans (%) ACL/Loans + Unfunded Commitments NCOs / Avg Loans 1.34% 1.26% 1.31% 1.30% 1.10% 1.09% 1.22% 1.12% 1.19% 0.01% 0.02% 0.01% 0.04% 0.29% 0.01% 0.01% 0.24% 0.01% 2017Y 2018Y 2019Y 2020Y 2021Y 2022Y 2023Y 2024Y 2025Q3 Avidbank 14

Deposits by Design Multi-pronged deposit strategy links lending verticals with standalone initiatives Venture Lending drives funding with deposit generation well in excess of loan balances Corporate Banking and Specialty Finance are self-funding, supporting loan growth and broader balance sheet strength Treasury Management team bolstered in 2023 Launched a Specialty Deposits group within Treasury Management in the second quarter of 2024 CRE and Construction are asset-focused with limited deposit generation Deposit Engines Fund Loan Growth Dollars in millions Brokered/Other • Loans • Deposits Venture Lending $335 $797 Corporate Banking $381 $595 Specialty Finance $401 $443 Treasury Management $5 $145 Commercial Real Estate $586 $45 Real Estate/Construction $247 $19 $4 $4 Avidbank 15

Funding Deposit growth of 14% in 2024 and 11% annualized as of September 30, 2025 No borrowings or wholesale funding at September 30, 2025, down from $360 million in 2023 Expanded use of reciprocal deposit networks in response to the events of 2023 reduced uninsured deposits from 85% at December 31, 2022, to 34% at December 31, 2023 Renewed focus on growing and diversifying core deposits in 2023 included expanding deposit insurance and bolstering our treasury management team Subordinated debt callable as of 4Q 2024, creating future flexibility Borrowing Capacity Amount Used Data as of Sept. 30, 2025 Dollarsin millions Capacity ($) (%) Available Federal Funds Line of Credit $200 — — $200 FHLB $500 — — $500 Unpledged Securities $174 $9 5% $165 FRB Discount Window $839 — — $839 Available Contingent Capacity $1,713 $9 0.5% ( $1,704 ) Funding Composition Dollars in millions / % of total funding Non-IB Deposits IB Deposits Time Deposits Subordinated Debt Other Borrowings Entirely core funded at September 30, 2025 $688 $808 $995 $1,275 $2,001 $1,975 $2,036 $2,098 $2,071 1% 2% 74% 23% 2017Y 2018Y 2019Y 2020Y 2021Y 2022Y 2023Y 2024Y 2025Q3 Avidbank 16

Securities Portfolio With proceeds from the IPO, paid off short-term borrowings and repositioned securities portfolio Sold $275 million in AFS securities for a loss of $62.4 million and reinvested $163 million in primarily mortgage-backed securities and agency CMOs with an average yield of 4.54% At September 30, 2025, portfolio totaled $174 million with a duration of 3.1 years and average life of 4.6 years 100% of securities portfolio is classified as available for sale Portfolio Composition Agency MBS and CMOs,88% Total Securities at September 30, 2025: $174M Muni and other, 12% Investment Portfolio / Total Assets (%) & Portfolio Yield (%) Investment Portfolio / Total Assets (%) Portfolio Yield (%) 18% 21% 15% 13% 7% 1.62% 2.13% 2.28% 2.31% 2.55% 2021Y 2022Y 2023Y 2024Y 2025Q3 Net Unrealized Loss on AFS Securities ($M) ($6.6) ($83.3) ($68.8) ($72.6) ($0.7) 2021Y 2022Y 2023Y 2024Y 2025Q3 Avidbank 17

Appendix Avidbank 18

Experienced Management Team Mark D. Mordell – Chairman of the Board, President and Chief Executive Officer Joined the board of directors of the Bank in January of 2006, appointed Chairman in February of 2007, named CEO of Avidbank Holdings and the Bank in March 2012 Brings over 30 years of financial services, real estate and diverse business experience to the Company In 1991 founded California Bavarian Corporation and its successor company, CBC Properties, LLC, which was a full service real estate investment and management organization based in Palo Alto Mr. Mordell holds various roles including Advisory Board Member to MMM Management, Inc., the strategic advisor to a family office based in San Francisco, Advisory Board Member of the Donovan & Bank Foundation, which assists Special Forces Operators transition into a life of peace, contentment and balance, and is involved in various community organizations including Stanford University, Peninsula Bridge, Sacred Heart Preparatory School and the Town of Portola Valley Mr. Mordell received a B.A. in Economics from Stanford University Patrick Oakes – Executive Vice President and Chief Financial Officer Joined the Bank as EVP and CFO of Avidbank Holdings and the Bank in March 2022 Came to the Company from Atlantic Capital Bancshares, Inc. (Nasdaq: ACBI, which subsequently merged into SouthState Bank, N.A.) where he served as EVP, CFO and Secretary from 2015 to 2022 Previous roles include EVP and CFO of Square 1 Bank, EVP and CFO of Encore Bancshares, Inc, and Senior Vice President and Treasurer of Sterling Bank Mr. Oakes was named the Atlanta Business Chronicle’s 2021 CFO of the Year among small public company CFOs Mr. Oakes is a Chartered Financial Analyst, and holds a Bachelor of Science in Electrical Engineering Technology degree from Texas A&M University and an MBA, International Finance from Richmond American University London Gina Thoma-Peterson – Executive Vice President and Chief Operating Officer Joined the Bank as EVP and COO of Avidbank Holdings and the Bank in September 2019 Previously spent eight years at MUFG Union Bank holding senior positions in global financial services enterprise and operational risk management, and comprehensive capital and analysis review (CCAR) Spent 12 years at PricewaterhouseCoopers (PwC) in San Francisco, with deep expertise in regulatory compliance, enterprise risk, financial reporting and operational resilience. Led advisory and audit services for the largest PwC portfolio of global, regional and community financial institutions in the Western U.S. Spent six years in bank supervision and regulatory compliance as an Associate National Bank Examiner for the Office of the Comptroller of the Currency, following four years in operational roles with community and regional banks in California and Washington Ms. Thoma-Peterson received her B.A. in Business Administration from the University of Washington Avidbank 19

Experienced Management Team Geoffrey E. Butner – Executive Vice President and Chief Credit Officer Joined as SVP & Deputy Chief Credit Officer of Avidbank Holdings and the Bank in November 2016 and was promoted to EVP & CCO in November 2018 Brings 37 years of experience in the banking and financial services industry serving small and medium sized businesses Previously spent eight years at Square 1 Bank as a Risk Manager, five years at Silicon Valley Bank as a Senior Credit Officer, and was previously Chief Operating Officer of a venture-backed technology startup, eFinance where he led the engineering, product development, customer service, and sales efforts Mr. Butner received his B.A. in Business Economics from the University of California at Santa Barbara. Tami Laura Benedict – Executive Vice President and Chief of Staff Joined the Bank in 2006 as an online banking specialist, was promoted to Assistant VP and Operations Manager of the Bank in 2008, then to VP in 2012, where she took on the additional responsibility as the Deputy BSA (Bank Secrecy Act) Officer In June 2016, Ms. Benedict was promoted to Senior Vice President where she managed the day-to-day operations for Loan Services, Asset-Based Lending Operations, IT, the Branch, Deposit Operations, and Cash Management divisions of the Bank In August 2024, she was appointed Executive Vice President and Chief of Staff of the Bank Victor DeMarco – Executive Vice President and Chief Legal Officer Joined in 2020 as the SVP and General Counsel of Avidbank Holdings and the Bank and was promoted to EVP and Chief Legal Officer in September 2024 Founding member of Square 1 Bank, where he held several leadership positions and helped grow the Bank from inception through its IPO and merger with Pacific Western Bank Between February 2019 and September 2020, he practiced law with Smith Anderson representing many of the top venture banks in the country Mr. DeMarco received his B.S. in business from North Carolina State University, his MBA from the University of North Carolina at Chapel Hill, and his J.D. from North Carolina Central University Arthur Wasson – Executive Vice President and Treasury Management Joined the Bank as EVP, Treasury Management Services of the Bank in August 2023 Previously served as the managing group director and was a founding member of the venture banking team at Signature Bank from 2019 to 2023 Spent seven years at Square 1 Bank, subsequently acquired by Pacific Western Bank, most recently as EVP and Head of the Equity Funds Group and Global Treasury Management He began his banking career first at Merrill Lynch and later at Morgan Stanley in their private banking divisions Mr. Wasson received his B.S. in Accountancy from Villanova University and a J.D. from Albany Law School Avidbank 20

Core Bay Area Banking Divisions Lean Branch Footprint in the Attractive Bay Area San Jose – Sunnyvale – Santa Clara MSA $156.7 Median HHI vs. $78.8 Median HHI ($000s) ($00Os) 9.8% Proj. HHI Growth (‘25-‘30) ) VS. 8.8% Proj. HHI Growth (‘25-‘30) Nationwide Nationwide Bay Area Lending Divisions Corporate Banking Division Focused on small to mid-sized commercial clients across diverse industries Clients typically demonstrate strong financial profiles, including profitability, low leverage, and high liquidity Commercial Real Estate Division Provides term financing for commercial, multi-family, and mixed-use properties All commercial real estate loans are collateralized by investment properties in California Construction Lending Division Primarily serves experienced local developers Finances all stages of residential projects, from land acquisition through construction Bay Area Lending: Anchored in Three Long-Standing Divisions Corporate Banking Division Commercial Real Estate Division Construction & Land Division Provides traditional commercial and owner-occupied lending 19% of total loans Provides financing for multifamily and non-owner-occupied real estate 30% of total loans Financing high quality residential property construction 13% of total loans Note: Financial data as of September 30, 2025 Source: S&P Capital IQ Pro Avidbank 21

Venture Business Banking Overview Driving Core Deposit Growth Through Deep, Relationship-Based Lending in the Innovation Economy Launched in 2019, Avidbank’s venture platform serves VC-backed tech companies and their investors nationwide Platform is highly self-funded, with client deposits meaningfully exceeding loan balances Deposit diversification is increasing as Avidbank expands into the fund finance business $797 million total deposits as of September 30, 2025; 74% tied to lending relationships Borrowers are required to bank with Avidbank which provides full visibility into cashflows and tighter credit control Clients are backed by institutional capital, with experienced sponsors providing support and stability National reach with a strong client base in the Bay Area and other key innovation hubs Positioned to capitalize on market disruption from 2023 through opportunistic talent and client acquisition Balanced mix of early, expansion and late-stage companies Avidbank receives equity warrants in connection with extending loan commitments to certain of its customers. As of September 30, 2025, Avidbank has a total of 136 warrant positions in 92 clients1 Venture Loans and Deposits Loans Deposits Deposit/Loans Venture Lending & Fund Finance $335 $797 2.4x Venture Lending Division Venture Lending Provides financing to VC-backed technology companies and their investors nationwide Fund Finance Provides capital call lines of credit to private equity and venture capital firms nationally 17% of total loans 1Warrant positions are held at the holding company Avidbank 22

Differentiated Self-Funding Specialty Finance Platform Three Teams Provide Unique Credit Solutions While Generating Quality Deposits Sponsor Finance Lending Provides funding for lower-middle market acquisitions 12% of total loans Target Clients " Private equity-backed companies " Entrepreneurs using the search fund model " Institutional sponsors and family offices Industries Served Software " Manufacturers Healthcare " Behavioral health Industrial " Media services • Retail Staffing • Education Asset-Based Lending Secured by receivables and inventory 6% of total loans " Inventory-heavy or asset-intensive businesses " Companies seeking flexible working capital • Seasonal or growth stage businesses " Manufacturers " Packaged goods _ . i i companies " Wholesalers • Business service • Distributors . providers • Consumer Invoice Finance Provides liquidity via accounts receivable collateral 2% of total loans " Rapid growth firms " Businesses with seasonal revenue swings " Companies with limited access to traditional bank credit " Technology " Life sciences " Professional services " Consumer packaged goods companies se“mp . Note: Financial data as of September 30, 2025 Avidbank 23

Historical Balance Sheet S in thousands Fiscal Year Ended December 31, Quarter Ended 2024 2023 2022 2021 2020 Sep. 30, 2025 Jun. 30, 2025 Mar. 31, 2025 Dec. 31, 2024 Sep. 30, 2024 Cash and Cash Equivalents $ 82,701 $ 81,396 $ 47,288 $ 493,343 $ 230,033 $ 177,319 $ 129,923 $ 125,001 $ 82,701 $ 136,533 Investment Securities 296,556 325,320 444,664 380,170 163,631 173,588 292,808 296,617 296,556 316,741 Loans, Net of Deferred Loan Fees 1,864,942 1,740,647 1,554,222 1,223,344 993,483 1,958,585 1,911,718 1,841,187 1,864,942 1,786,756 Allowance for Credit Losses on Loans (18,679) (19,131) (16,481) (13,054) (12,558) (21,025) (19,624) (18,722) (18,679) (22,315) Net Loans 1,846,263 1,721,516 1,537,741 1,210,290 980,925 1,937,560 1,892,094 1,822,465 1,846,263 1,764,441 Bank Owned Life Insurance 12,674 12,315 32,747 31,875 11,425 12,953 12,857 12,764 12,674 12,580 Premises and Equipment, Net 2,331 3,297 4,163 4,565 5,565 1,739 1,927 2,118 2,331 2,549 Other Assets 63,963 86,992 66,665 42,235 39,047 59,295 62,520 60,957 63,963 62,625 Total Assets $ 2,304,488 $ 2,230,836 $ 2,133,268 $ 2,162,478 $ 1,430,626 $ 2,362,454 $ 2,392,129 $ 2,319,922 $ 2,304,488 $ 2,295,469 De posits $ 1,891,355 $ 1,654,329 $ 1,823,235 $ 1,979,410 $ 1,253,754 $ 2,049,158 $ 2,002,781 $ 1,929,488 $ 1,891,355 $ 1,901,528 Subordinated Debt, Net 22,000 21,906 21,805 21,703 21,565 22,000 22,000 22,000 22,000 21,982 Short-Term Borrowings 185,000 360,000 130,000 — — — 145,000 155,000 185,000 160,000 Other Liabilities 19,771 29,289 20,690 24,265 27,383 18,183 17,929 16,815 19,771 23,438 Total Liabilities $ 2,118,126 $ 2,065,524 $ 1,995,730 $ 2,025,378 $ 1,302,702 $ 2,089,341 $ 2,187,710 $ 2,123,303 $ 2,118,126 $ 2,106,948 Common Stock $ 106,997 $ 104,499 $ 102,359 $ 72,799 $ 70,720 $ 169,342 $ 107,608 $ 106,839 $ 106,997 $ 106,169 Retained Earnings 130,703 (E- 3D01 109,688 (o o=E‘ 93,824 ( co c c 68,801 (A EAn) 56,537 ca- 104,201 (450) 141,936 (AE - 2r‘ 136,139 (Aco co) 130,703 (E 3301 124,246 (A- oor y R--uM-G--e utne r uom pre ne nsivc -IC-IE -3. Total Shareholders' Equity 2-PP9 $ 186,362 -199P. $ 165,312 $ P912 137,538 5,7-) $ 137,100 00/ $ 127,924 -7P $ 273,113 $ 204,419 $ 196,619 2-PP0 $ 186,362 7-921 $ 188,521 Total Liabilities and Shareholders' Equity $ 2,304,488 $ 2,230,836 $ 2,133,268 $ 2,162,478 $ 1,430,626 $ 2,362,454 $ 2,392,129 $ 2,319,922 $ 2,304,488 $ 2,295,469 Avidbank 24

Historical Income Statement S in thousands except share data Fiscal Year Ended December 31, Quarter Ended 2024 2023 2022 2021 2020 Sept. 30,2025 Jun. 30, 2025 Mar. 31, 2025 Dec. 31, 2024 Sept. 30, 2024 Interest and Fees on Loans $ 130,878 $ 112,494 $ 71,813 $ 50,823 $ 49,517 $ 33,880 $ 32,967 $ 31,885 $ 32,308 $ 33,488 Interest on Investment Securities 7,162 8,658 9,877 3,606 901 1,157 1,703 1,749 1,770 1,767 Federal Home Loan Bank Dividends 752 690 367 272 193 184 181 185 185 183 Other Interest Income 3,649 3,140 1,342 456 482 2,033 793 706 681 1,198 Total Interest Income $ 142,441 $ 124,982 $ 83,399 $ 55,157 $ 51,093 $ 37,254 $ 35,644 $ 34,525 $ 34,944 $ 36,636 Interest on Deposits $ 54,146 $ 36,414 $ 7,513 $ 2,618 $ 4,712 $ 13,776 $ 13,669 $ 12,827 $ 14,015 $ 14,602 Interest on Borrowings 13,073 15,009 1,440 1,238 1,243 828 1,685 2,346 1,730 3,421 Total Interest Expense $ 67,219 $ 51,423 $ 8,953 $ 3,856 $ 5,955 $ 14,604 $ 15,354 $ 15,173 $ 15,745 $ 18,023 Net Interest Income $ 75,222 $ 73,559 $ 74,446 $ 51,301 $ 45,138 $ 22,650 $ 20,290 $ 19,352 $ 19,199 $ 18,613 Provision for Credit Losses 4,096 3,042 3,510 3,572 1,702 1,355 925 — 779 — Service Charges, Fees and Other Income $ 2,600 $ 2,209 $ 2,617 $ 2,179 $ 1,675 $ 779 $ 840 $ 762 $ 649 $ 675 Foreign Exchange Income 896 411 254 187 — 267 196 220 191 246 Bank-Owned Life Insurance Income 508 894 871 451 269 96 93 90 93 90 Warrant and Success Fee Income 65 23 281 477 — — 273 — 65 — (Loss) / Gain on Sale of Securities — (6,214) (404) 735 — (62,391) — — — — Other income 1,941 25 684 1,012 494 397 136 99 842 779 Total Noninterest Income $ 6,010 $ (2,652) $ 4,303 $ 5,041 $ 2,438 $ (60,852) $ 1,538 $ 1,171 $ 1,840 $ 1,790 Salaries and Employee Benefits $ 32,499 $ 30,572 $ 29,102 $ 25,256 $ 23,233 $ 9,766 $ 8,978 $ 9,097 $ 7,389 $ 8,336 Occupancy and Equipment 4,019 3,954 3,652 4,078 4,123 723 759 996 919 1,033 Data Processing 2,412 2,041 1,737 1,647 1,587 792 759 615 613 638 Regu latory Assessments 2,083 1,663 1,816 1,226 1,088 445 420 544 541 528 Legal and Professional Fees 2,139 1,839 1,290 897 759 591 715 511 452 534 Other Expenses 4,181 3,824 3,193 2,512 2,377 1,162 978 1,079 1,138 1,028 Total Noninterest Expense $ 47,333 $ 43,893 $ 40,790 $ 35,616 $ 33,167 $ 13,479 $ 12,609 $ 12,842 $ 11,052 $ 12,097 Income Before Provision for Income Taxes $ 29,803 $ 23,972 $ 34,449 $ 17,154 $ 12,707 $ (53,036) $ 8,294 $ 7,681 $ 9,208 $ 8,306 Provision for income Taxes 8,788 7,171 9,426 4,890 3,080 (15,301) 2,497 2,245 2,751 2,460 Net Income $ 21,015 $ 16,801 $ 25,023 $ 12,264 $ 9,627 $ (37,735) $ 5,797 $ 5,436 $ 6,457 $ 5,846 Basic Earnings Per Common Share $ 2.83 $ 229 $ 3.68 $ 2.08 $ 1.64 $ (4.12) $ 0.77 $ 0.73 $ 0.87 $ 0.79 Diluted Eamings Per Common Share $ 2.76 $ 2.24 $ 3.60 $ 2.02 $ 1.61 $ (4.12) $ 0.75 $ 0.71 $ 0.84 $ 0.77 Avidbank 25

GAAP to Non-GAAP Reconciliation For the Year Ended December31, For the Quarter Ended S in thousands 2024 2023 2022 2021 2020__ Sept.30,2025 Jun.30,2025 Mar.31,2025 Dec. 31,2024 Sept.30, 2024 Non-GAAP Adjusted Net income Reconciliation Net Income - GAAP $21,015 $16,801 $25,023 $12,264 $9,627 ($37,735) $5,797 $5,436 $6,457 $5,846 Loss on Sale of Securities — 6,214 404 — — 62,391 — — — — Tax Impact of Loss on Sale of Securities — (1,731) (109) — (17,949) — — — — Severance — 324 — — — — — — — — Tax Impact of Severance — (91) — — — — — — — — BOLI Surrender Tax Expense — 478 — — — — — — — — Adjusted Net Income (non-GAAP) $21,015 $21,995 $25,318 $12,264 $9,627 $6,707 $5,797 $5,436 $6,457 $5,846 Non-GAAP Adjusted Diluted Earnings Per Share Reconciliation Diluted Earnings Per Share -GAAP $2.76 $2.24 $3.60 $202 $1.61 ($4.12) $0.75 $0.75 $0.75 $0.75 Loss on Sale of Securities, Net of Income Tax — 0.60 0.04 — — 4.84 — — — — Severance, Net of Income Tax — 0.03 — — — — — — — — BOLI Surrender Tax Expense 0.06 — — Adjusted Diluted Earnings Per Share (non-GAAP) $2.76 $2.94 $3.64 $2.02 $1.61 $0.72 $0.75 $0.75 $0.75 $0.75 Non-GAAP Adjusted Return on Average Assets Reconciliation Net income - GAAP $21,015 $16,801 $25,023 $12,264 $9,627 ($37,735) $5,797 $5,436 $6,457 $5,845 Average Total Assets 2,252,814 2,173,969 2,072,989 1,713,888 1,331,510 2,357,158 2,322,264 2,289,935 2,250,086 2,272,623 Return on Average Assets - GAAP 0.93% 0.77% 1.21% 0.72% 0.72% (6.35%) 1.00% 0.96% 1.14% 1.02% Adjusted Net Income (non-GAAP) $21,015 $21,995 $25,318 $12,264 $9,627 $6,707 $5,797 $5,436 $6,457 $5,845 Average Total Assets 2,252,814 2,173,969 2,072,989 1,713,888 1,331,510 2,357,158 2,322,264 2,289,935 2,250,086 2,272,623 Adjusted Return on Average Assets (non-GAAP) 0.93% 1.01% 1.22% 0.72% 0.72% 1.13% 1.00% 0.96% 1.14% 1.02% Non-GAAP Adjusted Return on Average Equity Reconciliation Net income - GAAP $21,015 $16,801 $25,023 $12,264 $9,627 ($37,735) $5,797 $5,436 $6,457 $5,845 Average Total Equity 175,348 150,045 135,841 133,646 122,510 236,903 200,608 191,891 188,170 179,260 Return on Average Equity - GAAP 11.98% 11.20% 18.42% 9.18% 7.86% (63.19%) 11.59% 11.49% 13.65% 12.97% Adjusted Net Income (non-GAAP) $21,015 $21,995 $25,318 $12,264 $9,627 $6,707 $5,797 $5,436 $6,457 $5,845 Average Total Equity 175,348 150,045 135,841 133,646 122,510 236,908 200,608 191,891 188,170 179,260 Adjusted Return on Average Equity (non-GAAP) 11.98% 14.66% 18.64% 9.18% 7.86% 11.23% 11.59% 11.49% 13.65% 12.97% Avidbank 26

GAAP to Non-GAAP Reconciliation For the Year Ended December 31, For the Quarter Ended S in thousands 2024 2023 2022 2021 2020 Sept. 30 2025 Jun. 30 2025 _Mar.31,2025 Dec. 31,2024 Sept. 30, 2024 Non-GAAP Adjusted Efficiency Ratio Reconciliation Noninterest Expense $47,333 $43,893 $40,790 $35,616 $33,167 $13,479 $12,609 $12,842 $11,052 $12,097 Net Interest Income 75,222 73,559 74,079 51,029 44,945 22,650 20,290 19,352 19,199 18 613 Noninterest Income 6,010 (2,652) 4,670 5,313 2,631 (60,852) 1,538 1,171 1,840 1790 Efficiency Ratio - GAAP 58.3% 61.9% 51.8% 63.2% 69.7% (35.3%) 57.8% 62.6% 52.5% 59.3% Noninterest Expense $47,333 $43,893 $40,790 $35,616 $33,167 $13,479 $12,609 $12,842 $11,052 $12,097 Net Interest Income 75,222 73,559 74,079 51,029 44,945 22,650 20,290 19,352 19,199 18,613 Noninterest Income 6,010 (2,652) 4,670 5,313 2,631 (60,852) 1,538 1,171 1,840 1790 Loss on Sale of Securities — 6,214 404 — — 62,391 — — — — Severance — 324 — — — — — — — — Noninterest Income - Adjusted 6,010 3,886 5,074 5,313 2,631 1,539 1,538 1,171 1,840 1790 Adjusted Efficiency Ratio (non-GAAP) 5830% 56.68% 51.53% 63.21% 6.71% 55.72% 57.77% 62.57% 52.53% 59.29% Non-GAAP Taxable Equivalent Net Interest Income Reconciliation Net interest Income - GAAP $75,222 $73,559 $74,079 $51,029 $44,945 $22,650 $20,290 $19,352 $19,199 $18,613 Adjusted Tax dole Equivalent 25 72 173 — — 8 8 8 7 6 Net interest Income - Taxable Equivalent (non-GAAP) $75,247 $73,631 $74,252 $51,029 $44,945 $22,658 $20,298 $19,360 $19,206 $18 619 Non-GAAP Taxable Equivalent Net interest Margin Reconciliation Net interest Margin - GAAP 3 44% 3.55% 3.78% 3.12% 3.53% 3.90% 3.60% 3.52% 3.48% 3.35% Impact of Taxable Equivalent Adjustment — — — — — — — — 0.01 — Net interest Margin - Taxable Equivalent(non-GAAP) 3.44% 3.55% 3.78% 3.12% 3.53% 3.90% 3.60% 3.52% 3.49% 3.35% Avidbank 27