 |
We began 2026 in a challenging geopolitical environment resulting from the escalation of the conflict in the Middle East since March 2026. The high volatility of oil prices during March, as well as other disruptive factors for the industry, influenced our quarterly performance.
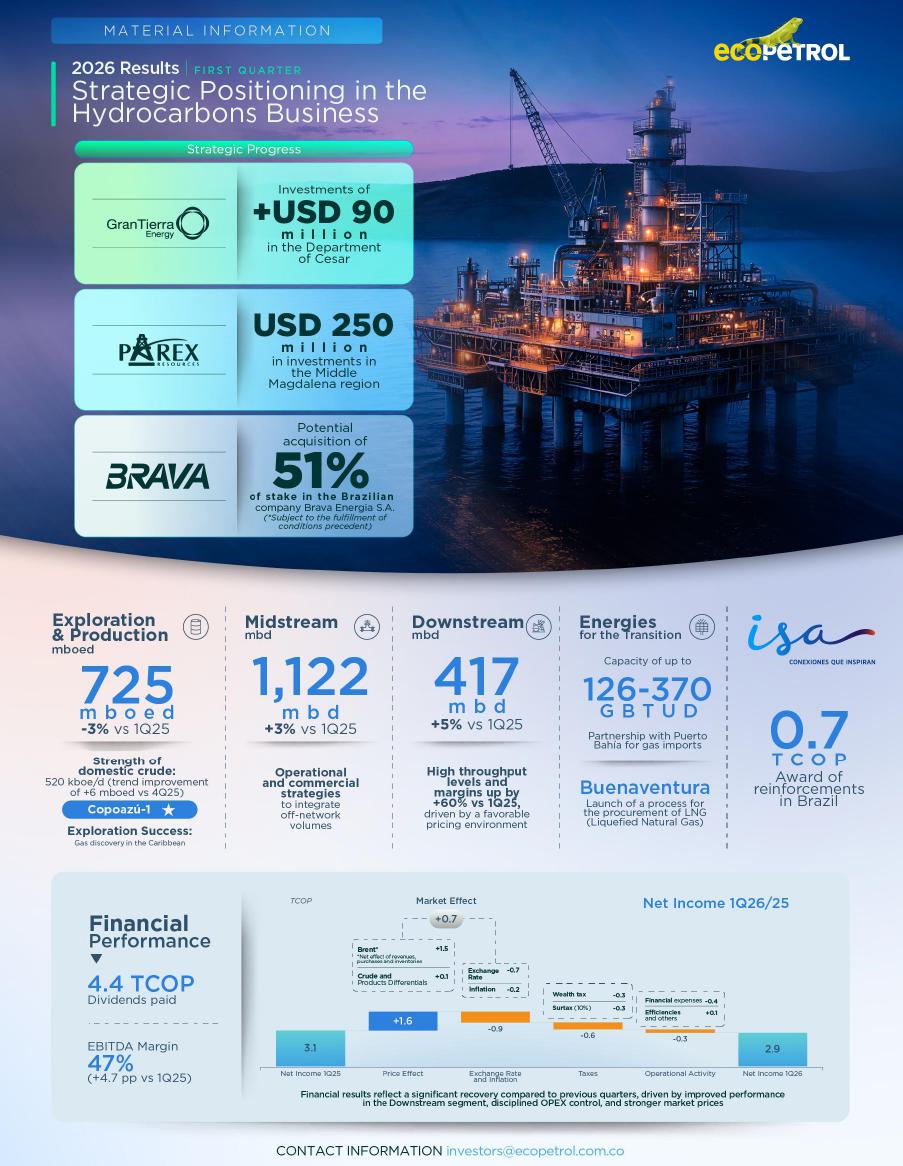
For the first quarter of 2026, we recorded revenues of COP 28.6 trillion (-8.7% vs. 1Q25), EBITDA of COP 13.5 trillion (+1.5% vs. 1Q25), and net income of COP 2.9 trillion (-7.7% vs. 1Q25). We achieved significant improvements with an EBITDA margin reaching 47%, a comparable level to the Group’s strongest historical quarters, supported by operational flexibility amid improved market conditions, enhanced operating efficiency, higher domestic crude production, maximized refinery throughput, and capital discipline.
In the Hydrocarbons line, production stood at 725 mboed (-2.8% vs. 1Q25). Domestic crude production reached 520 mboed, and Permian production averaged 91.8 mboed, exceeding the announced range for the year. The decrease in gas production was primarily attributable to an expected declined rate and lower sales volumes associated with seasonal demand patterns. In exploration, we highlight the declaration of success of the Copoazú-1 well in GUAOFF-0 block that confirmed the presence of two gas accumulations that are independent of the Sirius field.
Transported volumes increased by 2.8% compared to 1Q25 and reached 1,122 mbd. With the start-up of NAFTCUS[1] operations from Monterrey, as an alternative to transporting naphtha by truck to Cusiana, we improved access to diluents, increased utilization of existing infrastructure, reduced operational risks, and lowered transportation costs for heavy and extra-heavy crudes.
In refining, throughput increased to 417 mbd (+5.5% vs. 1Q25), supported by the Barrancabermeja Refinery and the solid operational performance of the Cartagena Refinery. This allowed us to produce 2% more high-value products and achieve a refining margin 60% higher than in 1Q25.
Commercial management across our Bogotá, Houston, and Singapore offices, based on diversification of customers, markets, and contracting schemes, enabled efficient volume placement, mitigation of freight price volatility, and impacts from the entry of Venezuelan heavy crude. As a result, Ecopetrol Group crudes consolidated their leadership in the region due to customer preference for quality and reliability. |
In the Energy Transition business line, we highlight the execution of the Integrated Logistics and Regasification Services agreement with Sociedad Portuaria Puerto Bahía S.A., which will enable the development of infrastructure required for the receipt, storage, and delivery of between 126 and 370 GBTUD of imported natural gas into the National Transportation System during 2026.
Additionally, we completed the construction activities of the 32 MWp Quifa Solar Farm, bringing total installed capacity to 52 MWp.
In the Transmission and Roads business line, ISA Energía Brasil was awarded 46 grid reinforcements, improvements, and connection projects during the quarter. In Colombia, ISA expressed interest in certain urgent projects expected to be executed between 2027 and 2031 for approximately USD 1 trillion.
With respect to matters of corporate governance, two meetings of the General Shareholders’ Assembly were held: an extraordinary meeting on February 5, 2026, and the ordinary meeting on March 27, 2026. During these meetings, new members of the Board of Directors were elected, and shareholders approved the distribution of 55.1% of the net income for 2025 as dividends of COP 121 per share, totaling COP 4.4 trillion. The first payment of dividend was done on April 30, 2026 and the second payment for the Nation is expected to be set in June.
We highlight the strengthening of our core business, such as the potential acquisition of a 51% interest in Brava Energía S.A. in Brazil, and strategic agreements with internationally experienced companies such as Gran Tierra Energy and Parex Resources for the development of oil and gas projects primarily in the Cesar and Middle Magdalena regions.
In April 2026 we filed our annual report for 2025 on Form 20-F with the Securities and Exchange Commission. Through this filing, Ecopetrol, through its Board of Directors and senior management, demonstrates its strong practices in compliance and transparency toward investors in local and international markets.
Finally, the Ecopetrol Group will continue to prioritize capital discipline and financial soundness through strict cost control and margin capture initiatives, as well as contributing to the country’s gas supply and strengthening operational performance in order to address a highly volatile pricing environment and comply with the financial plan established for 2026.
Juan Carlos Hurtado Parra Acting Chief Executive Officer, Ecopetrol S.A |
[1] Nafta Cusiana Project
| |
Table 1: Financial and Operational Summary – Ecopetrol Group
| Most Relevant Results Metrics | 1Q 2026 | 1Q 2025 | ∆ ($) | ∆ (%) |
| External Variables | ||||
| Brent USD/Bl | 78.4 | 75.0 | 3.4 | 4.5% |
| Brent COP | 290 | 314 | (24) | (7.6%) |
| MMCOP Financial Figures | ||||
| Income | 28,625 | 31,365 | (2,740) | (8.7%) |
| EBITDA | 13,458 | 13,258 | 200 | 1.5% |
| EBITDA Margin | 47.0% | 42.3% | - | 4.7 pp |
| Net Income | 2,887 | 3,127 | (240) | (7.7%) |
| mbd/mboed Operative Metrics | ||||
| Sales | 903.4 | 956.0 | (52.6) | (5.5%) |
| Production | 725.2 | 745.5 | (20.3) | (2.7%) |
| Crude oil | 578.2 | 581.8 | (3.6) | (0.6%) |
| Gas and Whites | 147.1 | 163.7 | (16.6) | (10.1%) |
| Refineries throughput | 417.5 | 395.9 | 21.6 | 5.5% |
| Transported Volumes | 1,122.3 | 1,091.7 | 30.6 | 2.8% |
See in Annex Table 1 the Consolidated Income Statement
The figures included in this report are unaudited and are expressed in billions of Colombian pesos (COP), U.S. dollars (USD), Euros (EUR), Brazilian reais (BRL), thousands of barrels of oil equivalent per day (mboed), or tons, as applicable. For presentation purposes, certain figures in this report have been rounded to the nearest decimal place.
Forward-Looking Statements: This release may contain forward-looking statements related to Ecopetrol’s business outlook, estimates of operating and financial results, and growth prospects. Such statements constitute projections and, as such, are based solely on management’s expectations regarding the Company’s future performance and its continued access to capital to finance its business plan. These forward-looking statements are subject, among other things, to changes in market conditions, government regulations, competitive pressures, and the performance of the Colombian economy and the industry, among other factors; therefore, actual results may differ materially, and such statements are subject to change without prior notice.
Key Messages for the Quarter
| · | During 1Q26, the Ecopetrol Group reported EBITDA of COP 13.5 trillion, with an EBITDA margin of 47%, and net income of COP 2.9 trillion. Financial performance during the quarter was mainly driven by improved results in the Refining segment, disciplined operating expense control and favorable price dynamics. These factors partially offset the impact of a lower average exchange rate against the U.S. dollar and a higher tax burden. |
| · | Organic investments amounted to COP 5.3 trillion (USD 1,438 million), with 67% allocated to Colombia and 33% to international operations, primarily focused on maintaining operational reliability, supporting value generation and advancing portfolio diversification. |
| · | Production during the period was negatively impacted by lower gas and liquids output, mainly attributable to natural field decline in the Piedemonte area and higher-than-expected water intrusion at the Guajira field. Notwithstanding these impacts, national crude production averaged 520 mboed while the Permian contribution averaged 91.8 mboed during the quarter. |
| · | As of the end of 1Q26, the Ecopetrol Group reported consolidated cash balances of COP 14 trillion, comprised of 41% denominated in Colombian pesos and 59% denominated in U.S. dollars. Operating activities represented the primary source of liquidity, generating COP 7.2 trillion during the period, highlighting the effective management of working capital. |
| |
Ecopetrol Group Appendice
Table 1: Income Statement - Ecopetrol Group
| Billion (COP) | 1Q 2026 | 1Q 2025 | ∆ (%) | |
| Revenue | ||||
| Local | 14,567 | 15,213 | (4.2%) | |
| Export | 14,058 | 16,152 | (13.0%) | |
| Total revenue | 28,625 | 31,365 | (8.7%) | |
| Cost of sales | ||||
| Depreciation, amortization and depletion | 3,556 | 3,737 | (4.8%) | |
| Variable depreciation, amortization and depletion | 2,336 | 2,515 | (7.1%) | |
| Fixed cost depreciation | 1,220 | 1,222 | (0.2%) | |
| Variable costs | 8,830 | 11,922 | (25.9%) | |
| Imported products | 5,204 | 6,171 | (15.7%) | |
| Local purchases | 3,058 | 4,927 | (37.9%) | |
| Hydrocarbon transportation services | 437 | 485 | (9.9%) | |
| Inventories and others | 131 | 339 | (61.4%) | |
| Fixed costs | 5,120 | 5,046 | 1.5% | |
| Contracted services | 1,150 | 1,076 | 6.9% | |
| Construction services | 978 | 885 | 10.5% | |
| Maintenance | 1,085 | 1,166 | (6.9%) | |
| Labor costs | 1,106 | 1,065 | 3.8% | |
| Other | 801 | 854 | (6.2%) | |
| Total cost of sales | 17,506 | 20,705 | (15.5%) | |
| Gross income | 11,119 | 10,660 | 4.3% | |
| Operating expenses | 2,555 | 2,280 | 12.1% | |
| Administration expenses | 2,449 | 2,184 | 12.1% | |
| Exploration and projects expenses | 106 | 96 | 10.4% | |
| Operating income | 8,564 | 8,380 | 2.2% | |
| Finance result, net | (2,671) | (2,417) | 10.5% | |
| Foreign exchange, net | 62 | (48) | (229.2%) | |
| Interest, net | (1,526) | (1,549) | (1.5%) | |
| Financial income/loss | (1,207) | (820) | 47.2% | |
| Share of profit of companies | 185 | 208 | (11.1%) | |
| Income before income tax | 6,078 | 6,171 | (1.5%) | |
| Income tax | (2,256) | (1,939) | 16.3% | |
| Net income consolidated | 3,822 | 4,232 | (9.7%) | |
| Non-controlling interest | (935) | (1,105) | (15.4%) | |
| Net income attributable to owners of Ecopetrol | 2,887 | 3,127 | (7.7%) | |
| EBITDA | 13,458 | 13,258 | 1.5% | |
| EBITDA margin | 47.0% | 42.3% | 4.7% |