See the inside front cover for important information about access to your Fund’s annual and semiannual shareholder reports.

UNITED STATES
SECURITIES AND EXCHANGE COMMISSION
Washington, D.C. 20549
FORM N-CSR
CERTIFIED SHAREHOLDER REPORT OF REGISTERED
MANAGEMENT INVESTMENT COMPANIES
Investment Company Act file number: 811-22241
______________________________________________
Partners Group Private Equity (Master Fund), LLC
______________________________________________________________________________
(Exact name of registrant as specified in charter)
c/o Partners Group (USA) Inc.
1114 Avenue of the Americas, 37th Floor
New York, NY 10036
______________________________________________________________________________
(Address of principal executive offices) (zip code)
|
Robert M. Collins 1114 Avenue of the Americas, 37th Floor New York, NY 10036 ________________________________________
|
|
(Name and address of agent for service)
|
|
Copy to:
|
|
Joshua B. Deringer, Esq. Faegre Drinker Biddle & Reath LLP One Logan Square, Ste. 2000 Philadelphia, PA 19103-6996 (215) 988-2700
|
Registrant’s telephone number, including area code: (212) 908-2600
Date of fiscal year end: March 31
Date of reporting period: March 31, 2025
Item 1. Reports to Shareholders.
(a) The Reports to Shareholders are attached herewith.
PARTNERS GROUP PRIVATE EQUITY (MASTER FUND), LLC
(a Delaware Limited Liability Company)
Annual Report
For the Year Ended March 31, 2025
See the inside front cover for important information about access to your Fund’s annual and semiannual shareholder reports. |
|
Important information about access to shareholder reports
Beginning on January 1, 2021, as permitted by regulations adopted by the Securities and Exchange Commission, paper copies of the Fund’s annual and semiannual shareholder reports like this one will no longer be sent by mail, unless you specifically request paper copies of the reports. Instead, the reports will be made available on the Fund’s website, and each time a report is posted you will be notified by mail and provided with a website address to access the report.
If you have already elected to receive shareholder reports electronically, you will not be affected by this change and you need not take any action. You may elect to receive shareholder reports and other communications from the Fund electronically at any time by contacting your financial intermediary (such as a broker-dealer or bank) or, if you invest directly with the Fund, by calling 1-888-977-9790.
You may elect to receive all future reports in paper free of charge. If you invest through a financial intermediary, you can contact your financial intermediary to request that you continue receiving paper copies of your shareholder reports. If you invest directly with the Fund, you can call 1-888-977-9790 to let the Fund know you wish to continue receiving paper copies of your shareholder reports. Your election to receive paper reports will apply to all Partners Group funds held in your account if you invest through a financial intermediary or all Partners Group funds held with the fund complex if you invest directly with the Fund.
Partners Group Private Equity (Master Fund), LLC
(a Delaware Limited Liability Company)
Table of Contents
For the Year Ended March 31, 2025
Report of Independent Registered Public Accounting Firm |
1 |
Management’s Discussion of Fund Performance |
2-5 |
Consolidated Schedule of Investments |
6-39 |
Consolidated Statement of Assets and Liabilities |
40-41 |
Consolidated Statement of Operations |
42 |
Consolidated Statements of Changes in Net Assets |
43 |
Consolidated Statement of Cash Flows |
44-45 |
Consolidated Financial Highlights |
46-47 |
Notes to Consolidated Financial Statements |
48-64 |
Fund Management |
65-67 |
Other Information |
68-72 |
Partners Group Private Equity (Master Fund), LLC
(a Delaware Limited Liability Company)
Report of Independent Registered Public Accounting Firm
For the Year Ended March 31, 2025
To the Board of Managers and Members of
Partners Group Private Equity (Master Fund), LLC
Opinion on the Financial Statements
We have audited the accompanying consolidated statement of assets and liabilities, including the consolidated schedule of investments, of Partners Group Private Equity (Master Fund), LLC and its subsidiaries (the “Fund”) as of March 31, 2025, the related consolidated statements of operations and cash flows for the year ended March 31, 2025, the consolidated statement of changes in net assets for each of the two years in the period ended March 31, 2025, including the related notes, and the consolidated financial highlights for each of the five years in the period ended March 31, 2025 (collectively referred to as the “consolidated financial statements”). In our opinion, the consolidated financial statements present fairly, in all material respects, the financial position of the Fund as of March 31, 2025, the results of its operations and its cash flows for the year then ended, the changes in its net assets for each of the two years in the period ended March 31, 2025 and the financial highlights for each of the five years in the period ended March 31, 2025 in conformity with accounting principles generally accepted in the United States of America.
Basis for Opinion
These consolidated financial statements are the responsibility of the Fund’s management. Our responsibility is to express an opinion on the Fund’s consolidated financial statements based on our audit. We are a public accounting firm registered with the Public Company Accounting Oversight Board (United States) (PCAOB) and are required to be independent with respect to the Fund in accordance with the U.S. federal securities laws and the applicable rules and regulations of the Securities and Exchange Commission.
We conducted our audit of these consolidated financial statements in accordance with the auditing standards of the PCAOB and in accordance with auditing standards generally accepted in the United States of America. Those standards require that we plan and perform the audits to obtain reasonable assurance about whether the consolidated financial statements are free of material misstatement, whether due to error or fraud.
Our audits included performing procedures to assess the risks of material misstatement of the consolidated financial statements, whether due to error or fraud, and performing procedures that respond to those risks. Such procedures included examining, on a test basis, evidence regarding the amounts and disclosures in the consolidated financial statements. Our audit also included evaluating the accounting principles used and significant estimates made by management, as well as evaluating the overall presentation of the consolidated financial statements. Our procedures included confirmation of securities owned as of March 31, 2025 by correspondence with the custodian, portfolio company investees private equity funds or agent banks; when replies were not received from the custodian, portfolio company investees, private equity funds or agent banks, we performed other auditing procedures. We believe that our audits provide a reasonable basis for our opinion.
/s/ PricewaterhouseCoopers LLP
Dallas, Texas
May 30, 2025
We have served as the auditor of one or more investment companies in the Partners Group investment company group since 2010.
1
Partners Group Private Equity (Master Fund), LLC
Management’s Discussion of Fund Performance (Unaudited)
March 31, 2025
Dear Members1,
Partners Group is pleased to present the Partners Group Private Equity (Master Fund), LLC (the “Fund”) annual report for the fiscal year ending March 31, 2025. The Fund (Class I)2 produced a 5.8% total return for the fiscal year and finished the year with USD 15.8 billion in net assets. It was the Fund’s fifteenth consecutive year of positive performance. The Fund intends to declare dividends each year equal to all or substantially all its taxable income. As such, in December 2024 the Fund distributed $0.0362 per share to investors, entirely composed of long-term capital gains.
Management commentary
In 2024, the global economy reached a balance between growth and easing inflation; however, it displayed a mix of resilience and divergence across regions. The United States continued to outperform Europe, driven by strong private consumption and robust private sector balance sheets. Global Private Equity buyout activity rebounded in 2024 after two years of subdued activity. The year began with a slow start in Q1, but activity surged in Q2. This momentum largely sustained through Q3, albeit at a level slightly below the prior quarter. This increased activity was supported by recalibrated valuations, improved financing availability alongside declining cost of financing, and the substantial pool of dry powder available for transactions. Despite these signs of normalization, Q4 saw a notable slowdown. As 2024 progressed, momentum built, although global Private Equity exit activity remained below pandemic-era levels. Overall, exit activity demonstrated “slow but steady” growth throughout the year as market conditions gradually improved. Trade sales continued to be the most common form of exit, followed by secondary buyouts. The global secondaries market enjoyed sustained growth in 2024, driven by the necessity for sellers to liquidate assets, alongside favorable public market conditions and reduced interest rates which enhanced investor confidence. The Fund’s performance in 2024 was driven by fundamental earnings growth in the portfolio more than by multiple expansion or exit activity. The Private Equity Direct portfolio in the Fund achieved 9.8%3 growth in EBITDA during the 2024 calendar year while maintaining robust EBITDA margins of 32.3%3. We believe this is strong investment performance in a challenging environment.
The public equity markets experienced a rally in 2024 following the strong performance in 2023: the MSCI World Index (NDDUWI) posted a 18.7% return4 in the calendar year 2024, propelled by the technology industry (especially the “Magnificent Seven” stocks). In contrast to private markets, the public market returns in 2024 were primarily valuation-driven, building on the gains of 2023 and continuing the rebound from the lows of 2022. Notwithstanding the volatility in public market prices, we continued to see stronger growth and positioning from the companies in the Fund’s portfolio compared to public companies. For example, as of December 31, 2024, the MSCI World Index saw EBITDA growth of approximately 8.6% in the 2024 calendar year4, compared to 9.8% in the Fund’s Private Equity Direct portfolio6. The Fund’s portfolio also maintained margins more effectively, with 32.3%3 average EBITDA margin vs. 18.7%4 in the public index in the 2024 calendar year. We believe that focusing on market-leading businesses and taking an active investing approach fosters long-term business growth, leading to outperformance.
While the Fund’s existing portfolio continues to create value for investors, the Adviser was selective in pursuing new investment opportunities in 2024. We remained disciplined in our rigorous underwriting and found select attractive opportunities. We also focused on maintaining a high investment level with less than 10% cash in any given month. Financial markets are adjusting to a new era defined by macroeconomic volatility and elevated uncertainty. In this “brave new world”, investors can no longer solely rely on high levels of real growth or low interest rates to drive returns. For private markets, this shift emphasizes the importance of value creation through asset transformation and identifying investment themes supported by long-term secular trends.
2
Partners Group Private Equity (Master Fund), LLC
Management’s Discussion of Fund Performance (Unaudited)
March 31, 2025 (continued)
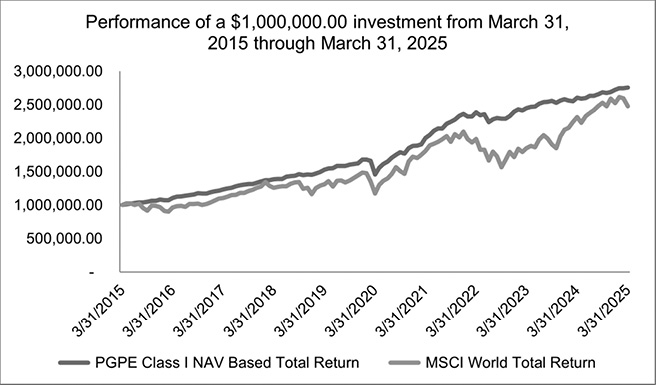
Annualized Total Return as of 31 March 20255 |
|||
1 Year |
5 Year |
10 Year |
|
PGPE Class I NAV Based TR |
5.8% |
13.6% |
10.7% |
PGPE Class A NAV Based TR |
5.1% |
12.8% |
n.a.6 |
PGPE Class A NAV Based TR with Sales Load7 |
1.4% |
12.0% |
n.a.6 |
MSCI World TR4 |
7.0% |
16.1% |
9.5% |
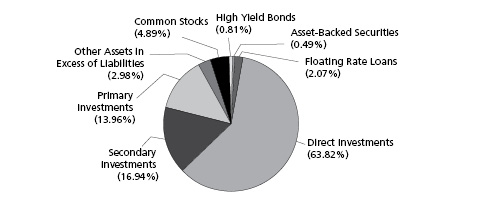
Portfolio positioning
As has been the case since the Fund’s inception, the Adviser’s relative value views will vary across asset class, investment type, geography, or position in the capital structure. We believe that the flexibility afforded by the Fund’s ability to make Direct Investments and primary and secondary Private Equity Fund Investments in a variety of markets, regions, and sectors, will continue to help the Fund achieve its investment objectives. Private Equity Secondary and Direct Investments were the investment focus of 2024. This approach allowed to capitalize on the appealing opportunities within the secondary market, while also continuing to leverage direct investments, which we believe will be the key driver of returns in the future.
As of March 31, 2025, the Fund has direct and indirect exposure to more than 3,000 portfolio companies with the top 20 representing 25.0% of the portfolio. Geographic splits are North America (53%), Europe (38%), Asia-Pacific (6%), and other regions (3%). Of these, the Fund held direct interests in 417 assets (64% of portfolio value), 223 primary commitments (14%), 81 stakes in secondary investments (16%), and 110 listed investments (6%). The Fund is further diversified across more than 15 different vintage years.
We expect to maintain a structural overweight to Private Equity Direct investments and opportunistic secondaries in 2025. While secondaries can be an attractive source of returns in the near-term if LP portfolios are acquired at a discount, we believe that ultimately the value created by direct investments is essential for long-term performance of the Fund.
Private Equity
In 2024, the Fund maintained an overweight allocation in Private Equity, with direct investments complemented by exposure to secondary and primary investments. Private Equity Direct Investments were the largest contributor to the positive performance during the year, accounting for about 35% of the Fund’s investment value creation.
3
Partners Group Private Equity (Master Fund), LLC
Management’s Discussion of Fund Performance (Unaudited)
March 31, 2025 (continued)
Within our Private Equity portfolio, our strategy is a defensive and disciplined approach in how we select and manage our portfolio companies. We buy market-leading business in non-cyclical sectors that are poised for future expansion, and we reenforce these already-strong companies with expertise that our network of experienced Operating Directors brings. We aim to capitalize on organic growth by harnessing transformation and digitalization in sectors that have the potential to become less labor-intensive and where a greater reliance on technology-enabled solutions is appealing.
During the fiscal year, the portfolio companies in the Fund exhibited remarkable EBITDA growth despite the market volatility. We believe this demonstrates the expertise of the investment team in identifying and capitalizing on non-cyclical themes such as technology and industrial sectors. The active involvement of the investment team with portfolio companies also played a crucial role in driving EBITDA growth, showing the value of hands-on management in the success of a company. Furthermore, our active involvement in risk management ensured that a substantial majority of our Private Equity Direct portfolio is protected against fluctuations in variable interest rates with interest rate hedges in place and debt maturities in 2028 and beyond.
Private Debt
Private Debt continued to be appealing in 2024 due to the favorable environment of relatively higher interest rates. The yield in the Private Debt portfolio provided attractive risk-adjusted return, and we added to this position to capitalize on the trend, particularly while the buyout transaction volumes remained below pre-pandemic levels. The direct lending market has been steadily growing, capturing market share from the traditional bank-led syndicated loan market and positioning itself as a credible alternative to conventional bank lending, particularly for large financing transactions.
Given these trends, the Fund maintained its tactical target allocation to Private Debt throughout the financial year. Our approach involved a thematic analysis, focusing on specific sectors and companies and benefiting from our direct underwriting capabilities. We actively sought opportunities characterized by substantial equity cushions, moderate leverage, and contractual safeguards. The Fund’s portfolio reflects both high diversification and selectivity, allowing us to mitigate risks associated with lower-rated issuers.
Private Infrastructure
During the financial year, the Fund’s allocation to Private Infrastructure remains well-positioned. Private Infrastructure’s inherent link to inflation and essential services has effectively shielded it from inflationary pressures and demand challenges. Consequently, the asset class was the second largest contributor to the positive performance during the year, accounting for about 20% of the Fund’s investment value creation.
To build value in our infrastructure businesses, we focus on platform expansion coupled with entrepreneurship at scale to cultivate businesses within high-conviction thematic areas. We do so at reasonable valuations by buying mid-stage companies with future value-add potential, rather than paying premiums for established (“core”) infrastructure businesses. Our value-add approach to infrastructure earns returns that are attractive in the Fund’s Private Equity-focused portfolio, while providing diversification of return drivers.
Other investments
A considerably smaller portion of the Fund’s investments is allocated to other liquid assets, including Common Stocks (both listed infrastructure and listed Private Equity). Additionally, to a lesser degree, the Fund also invests nominal amounts in Asset-Backed Securities
In 2024, the liquid portion of the fund experienced strong single digit performance with a bifurcation in performance between listed Private Equity and infrastructure. The Private Equity listed portfolio fared better than the infrastructure listed portfolio during this period. Asset managers played a pivotal role in the strong performance of listed Private Equity assets. This was fueled by robust credit fundraising, their expansion into the insurance sector, and the anticipation that several key holdings might be included in the S&P 500 index.
Looking ahead
At a macro level, the global economy continues to display signs of overall resilience, but the outlook is heavily dependent on US policy shifts, notably regarding tariffs which is fueling uncertainty. Inflation has moderated across major developed economies, but recent upticks in the US in particular highlight ongoing challenges in fully cooling price growth. Central banks are navigating this complex landscape with cautious monetary policy adjustments. In its base case, Partners Group anticipates
4
Partners Group Private Equity (Master Fund), LLC
Management’s Discussion of Fund Performance (Unaudited)
March 31, 2025 (continued)
an investment landscape characterized by inflation and interest rate volatility, which will lead to fluctuations in valuations and cash flows. This situation reinforces the need for disciplined underwriting, with a careful approach to leverage as well as a focus on margin resilience.
Since the announcement by the US administration of new tariffs on April 2, we have witnessed increased volatility in public markets and rising levels of uncertainty in the macro-economic environment. The impact of new tariffs announced by the US administration on the Fund is low. 86% of PGPE’s control direct Private Equity portfolio is either out of tariff scope or expected to see limited impact, with significant diversification across sectors like Industrial Services, Information Technology, and Health Care. The Fund is purpose-built from 20+ years of experience learned from past crises like the global financial crisis and COVID-19 pandemic. The fund is well-positioned to weather market volatility with a diversified portfolio of high-quality assets, ample liquidity, and flexibility to take advantage of attractive investment opportunities that arise from market dislocation.
We sincerely appreciate the trust and confidence you have placed in Partners Group through your investment in the Fund. Thank you for your ongoing support. If you have any further questions or comments, we encourage you to reach out to your dedicated Partners Group representative or email our team at the provided address at DLPGPEOperations@partnersgroup.com.
Sincerely,
Partners Group (USA) Inc.
Note: Data as of March 31, 2025.
|
1. |
Terms used but not defined in this letter have the meanings set forth in the Notes to the Fund’s Financial Statements for the fiscal year ended March 31, 2025 hereinafter appearing. |
|
2. |
Past performance is not indicative of future results. Performance is not annualized for time horizons of one year or less. Returns shown do not reflect the deduction of taxes that a shareholder would pay on the Fund’s distributions or the sale of Fund shares. All figures are net of all fees including advisory and incentive fees and fund expenses. Performance reflects expense reimbursements and/or fees waived by the adviser, without which performance would be lower. There is no assurance that similar results will be achieved in the future. Certain statements in this commentary are forward-looking statements. The forward-looking statements and other views expressed herein are those of Fund management as of the date of this letter. Actual future results or occurrences may differ significantly from those anticipated in any forward-looking statements, and there is no guarantee that any predictions will come to pass. The views expressed herein are subject to change at any time, due to numerous market and other factors. The Fund disclaims any obligation to update publicly or revise any forward-looking statements or views expressed herein. There can be no assurance that the Fund will achieve its investment objectives. |
|
3. |
Data as of December 31, 2024. The Fund’s LTM EBITDA margins (%), Private Equity Direct portfolio companies, NAV-weighted. The Fund’s LTM EBITDA margins (%), PG Private Equity Direct portfolio companies, NAV-weighted. |
|
4. |
The MSCI World Index captures large and mid cap representation across 23 Developed Markets (DM) countries. With 1,539 constituents, the index covers approximately 85% of the free float-adjusted market capitalization in each country. DM countries include: Australia, Austria, Belgium, Canada, Denmark, Finland, France, Germany, Hong Kong, Ireland, Israel, Italy, Japan, Netherlands, New Zealand, Norway, Portugal, Singapore, Spain, Sweden, Switzerland, the UK and the US. The MSCI World Index was launched on Mar 31, 1986. Data prior to the launch date is back-tested data (i.e. calculations of how the index might have performed over that time period had the index existed). There are frequently material differences between back-tested performance and actual results. Past performance — whether actual or back-tested — is no indication or guarantee of future performance. The index is unmanaged and does not include fees. Investors may not invest in the index directly. The index does not serve as a benchmark for the Fund and the index performance is presented for illustrative purposes only. |
|
6. |
The inception date of Class A is December 31, 2016. |
|
7. |
Assumes Maximum Placement Fee for Class A of 3.50%. |
5
Partners Group Private Equity (Master Fund), LLC
(a Delaware Limited Liability Company)
Consolidated Schedule of Investments –
March 31, 2025
INVESTMENT PORTFOLIO AS A PERCENTAGE OF TOTAL NET ASSETS
Public Investments (8.26%) North America (2.85%) |
Industry |
Acquisition |
Shares |
Fair |
|||||||||
American Tower Corp. |
Communication |
05/29/20 | 144,186 | $ | 31,389,292 | ||||||||
American Water Works Co., Inc. |
Utilities |
02/16/16 | 184,163 | 27,178,776 | |||||||||
Apollo Global Management, LLC |
Diversified Financial Services |
09/05/23 | 160,529 | 21,982,841 | |||||||||
Ares Capital Corp. |
Diversified Financial Services |
02/16/16 | 463,366 | 10,268,191 | |||||||||
Ares Management Corp. |
Diversified Financial Services |
06/28/19 | 80,588 | 11,806,948 | |||||||||
Atmos Energy Corp. |
Utilities |
02/16/16 | 148,398 | 22,937,879 | |||||||||
Blackstone Group, Inc. |
Diversified Financial Services |
07/12/19 | 97,638 | 13,643,934 | |||||||||
Blue Owl Capital, Inc. |
Financials |
10/21/24 | 245,311 | 4,916,033 | |||||||||
Brookfield Corp. |
Diversified Financial Services |
12/12/22 | 160,530 | 8,411,772 | |||||||||
Canadian National Railway Co. |
Transportation |
05/14/19 | 209,549 | 20,351,526 | |||||||||
CMS Energy Corp. |
Utilities |
11/01/19 | 280,605 | 21,079,048 | |||||||||
Crown Castle International Corp. |
Communication |
02/16/16 | 118,153 | 12,318,632 | |||||||||
CSX Corp. |
Transportation |
11/28/23 | 509,003 | 14,969,778 | |||||||||
Equinix Inc. |
Diversified Financial Services |
07/31/20 | 22,565 | 18,382,803 | |||||||||
Golub Capital BDC Inc. |
Diversified Financial Services |
02/24/22 | 686,115 | 10,380,920 | |||||||||
HarbourVest Global Private Equity |
Diversified Financial Services |
12/21/18 | 552,038 | 18,066,835 | |||||||||
KKR & Co., Inc. |
Diversified Financial Services |
02/16/16 | 136,879 | 15,824,581 | |||||||||
Old Dominion Freight Line, Inc. |
Transportation |
09/25/24 | 58,456 | 9,666,284 | |||||||||
Onex Corp. |
Diversified Financial Services |
02/16/16 | 160,988 | 10,742,733 | |||||||||
Republic Services Inc. |
Commercial & Professional Services |
08/28/17 | 104,545 | 25,327,072 | |||||||||
SBA Communications Corp. |
Real Estate |
09/05/23 | 71,489 | 15,728,295 | |||||||||
Sempra Energy |
Utilities |
06/28/23 | 224,963 | 16,046,611 | |||||||||
TC Energy Corp. |
Utilities |
11/01/19 | 426,965 | 20,147,521 | |||||||||
Tempus AI, Inc. |
Health Care |
03/17/25 | 4,126 | 198,915 | |||||||||
The Williams Companies, Inc. |
Utilities |
03/20/23 | 307,168 | 18,350,216 | |||||||||
TPG Inc. |
Financials |
09/25/24 | 142,760 | 6,765,396 | |||||||||
Union Pacific Corp. |
Transportation |
06/29/16 | 107,665 | 25,432,626 | |||||||||
Waste Management Inc. |
Utilities |
07/02/20 | 78,590 | 18,188,870 | |||||||||
Total North America (2.85%) |
450,504,328 | ||||||||||||
Western Europe (2.04%) |
|||||||||||||
3i Group Plc |
Diversified Financial Services |
10/01/20 | 450,987 | 21,053,659 | |||||||||
Aena SA |
Transportation |
12/21/18 | 128,065 | 29,957,877 | |||||||||
Cellnex Telecom SA |
Communication |
05/15/19 | 1,162,869 | 41,230,994 | |||||||||
CVC Capital Partners Plc |
Financials |
04/26/24 | 635,527 | 12,509,031 | |||||||||
Elia System Operator SA/NV |
Utilities |
11/03/22 | 121,217 | 10,492,747 | |||||||||
EQT AB |
Diversified Financial Services |
04/06/20 | 249,557 | 7,563,547 | |||||||||
Eurazeo SA |
Financials |
12/12/16 | 160,485 | 11,803,307 | |||||||||
Ferrovial SA |
Industrials |
04/15/24 | 340,864 | 15,159,665 | |||||||||
HBM Healthcare Investments AG |
Diversified Financial Services |
04/07/20 | 37,705 | 7,713,161 | |||||||||
HgCapital Trust PLC |
Diversified Financial Services |
02/12/16 | 3,449,053 | 22,486,735 | |||||||||
The accompanying notes are an integral part of these Consolidated Financial Statements.
6
Partners Group Private Equity (Master Fund), LLC
(a Delaware Limited Liability Company)
Consolidated Schedule of Investments –
March 31, 2025 (continued)
Public Investments (continued) Western Europe (continued) |
Industry |
Acquisition |
Shares |
Fair |
|||||||||
Infrastrutture Wireless Italiane S.p.A. |
Communication |
09/26/24 | 1,308,378 | $ | 13,826,625 | ||||||||
Intermediate Capital Group PLC |
Diversified Financial Services |
12/12/16 | 764,172 | 19,277,505 | |||||||||
Investor AB |
Diversified Financial Services |
08/28/17 | 436,532 | 12,973,928 | |||||||||
National Grid PLC |
Utilities |
02/12/16 | 1,866,431 | 24,312,983 | |||||||||
NB Private Equity Partners Ltd. |
Diversified Financial Services |
11/06/19 | 338,673 | 6,611,005 | |||||||||
Pantheon International Participations Plc |
Diversified Financial Services |
11/04/19 | 1,963,880 | 7,593,587 | |||||||||
Terna Rete Elettrica Nazionale SpA |
Utilities |
01/05/18 | 2,764,278 | 24,963,991 | |||||||||
Vinci SA |
Transportation |
02/12/16 | 255,603 | 32,090,836 | |||||||||
Total Western Europe (2.04%) |
321,621,183 | ||||||||||||
Total Common Stocks (Cost $723,505,433)(4.89%) |
$ | 772,125,511 | |||||||||||
High Yield Bonds (0.81%) |
Interest |
Acquisition |
Maturity |
Investment |
Principal |
Fair |
||||||||||||
North America (0.18%) |
||||||||||||||||||
Acrisure LLC / Acrisure Finance, Inc. ***, + |
7.50% |
06/05/24 | 11/06/30 | Senior |
$ | 3,000,000 | $ | 3,141,025 | ||||||||||
Camelot Return Merger Sub Inc. ***, + |
Cash 8.75% + SFvvv |
07/20/22 | 08/01/28 | Senior |
1,500,000 | 1,237,335 | ||||||||||||
Clarios Global LP / Clarios US Finance Co ***, + |
Cash 6.75% + SFvvv |
01/14/25 | 02/15/30 | Senior |
400,000 | 404,256 | ||||||||||||
Clarios Global LP / Clarios US Finance Co. ***, + |
4.375% |
06/21/24 | 05/15/26 | Senior |
€ | 1,575,000 | 1,727,089 | |||||||||||
CommScope LLC ***, + |
Cash 9.50% + SFvvv |
12/17/24 | 12/17/31 | Senior |
$ | 718,000 | 712,767 | |||||||||||
Pactiv Evergreen Group ***, + |
4.00% |
06/20/24 | 10/15/27 | Senior |
7,941,333 | 8,227,555 | ||||||||||||
Quikrete Holdings Inc. ***, + |
Cash 6.38% + SFvvv |
01/31/25 | 03/01/32 | Senior |
933,000 | 938,645 | ||||||||||||
Radiology Partners, Inc. + |
8.50% |
04/22/24 | 01/31/29 | Senior |
7,715,086 | 7,743,304 | ||||||||||||
Raven Acquisition Holdings LLC ***, + |
6.87% |
10/14/24 | 11/15/31 | Senior |
1,200,000 | 1,169,100 | ||||||||||||
UPCB Finance VII Ltd. ***, + |
3.625% |
06/24/24 | 06/15/29 | Senior |
€ | 3,525,287 | 3,869,434 | |||||||||||
Total North America (0.18%) |
29,170,510 | |||||||||||||||||
Western Europe (0.63%) |
||||||||||||||||||
AccorInvest Group S.A. ***, +, d |
6.375% |
09/18/24 | 10/15/29 | Senior |
738,000 | 822,853 | ||||||||||||
Belron UK Finance PLC ***, +, d |
5.75% |
10/02/24 | 10/15/29 | Senior |
$ | 3,667,000 | 3,644,045 | |||||||||||
Deuce Finco Plc + |
5.50% |
06/24/24 | 06/15/27 | Senior |
£ | 5,873,770 | 6,450,171 | |||||||||||
Deuce Finco Plc ***, + |
5.50% |
05/01/24 | 06/15/27 | Senior |
4,991,735 | 7,740,206 | ||||||||||||
Howden UK Refinance PLC / Howden UK Refinance 2 PLC / Howden US Refinance LLC ***, + |
7.25% |
05/08/24 | 02/15/31 | Senior |
$ | 5,000,000 | 5,099,737 | |||||||||||
IMA Industria Macchine ***, + |
3.75% |
06/20/24 | 01/15/28 | Senior |
€ | 6,000,000 | 6,446,490 | |||||||||||
INEOS Finance Plc ***, + |
7.50% |
01/31/24 | 04/15/29 | Senior |
$ | 1,800,000 | 1,857,015 | |||||||||||
Ineos Quattro Finance 2 ***, + |
2.50% |
06/19/24 | 01/15/26 | Senior |
€ | — | — | |||||||||||
Miller Homes Group Finco Plc + |
7.00% |
02/26/24 | 05/15/29 | Senior |
£ | 3,570,097 | 4,477,970 | |||||||||||
Nobian Finance B.V. ***, + |
3.625% |
06/19/24 | 07/15/26 | Senior |
€ | 10,000,000 | 10,837,134 | |||||||||||
ONE Hotels GmbH ***, + |
7.75% |
05/02/24 | 04/02/31 | Senior |
2,000,000 | 2,377,835 | ||||||||||||
Rossini S.à.r.l. ***, + |
6.75% |
07/11/24 | 12/31/29 | Senior |
906,000 | 1,023,212 | ||||||||||||
Rossini S.à.r.l. ***, + |
3.875% + E## |
07/11/24 | 12/31/29 | Senior |
2,840,000 | 3,087,860 | ||||||||||||
Sammontana Italia S.p.A. ***, +, d |
3.75% + E## |
10/02/24 | 08/15/31 | Senior |
3,294,000 | 3,574,012 | ||||||||||||
Sherwood Financing PLC +, d |
6.00% |
12/03/24 | 11/15/26 | Senior |
£ | 3,883,333 | 5,255,640 | |||||||||||
Sherwood Financing PLC ***, + |
5.55% + E## |
11/28/24 | 12/15/29 | Senior |
€ | 4,800,000 | 5,194,243 | |||||||||||
Summer BC Holdco A S.à.r.l. + |
9.25% |
05/08/24 | 10/31/27 | Senior |
2,695,170 | 3,383,654 | ||||||||||||
TeamSystem SpA ***, + |
3.50% + E## |
07/17/24 | 07/31/31 | Senior |
3,830,000 | 4,145,317 | ||||||||||||
TeamSystem SpA ***, + |
3.50% |
06/20/24 | 02/15/28 | Senior |
5,959,726 | 6,462,050 | ||||||||||||
The accompanying notes are an integral part of these Consolidated Financial Statements.
7
Partners Group Private Equity (Master Fund), LLC
(a Delaware Limited Liability Company)
Consolidated Schedule of Investments –
March 31, 2025 (continued)
Public Investments (continued) High Yield Bonds (continued) |
Interest |
Acquisition |
Maturity |
Investment |
Principal |
Fair |
||||||||||||
Verisure Holding AB ***, + |
3.25% |
06/20/24 | 02/15/27 | Senior |
$ | 10,000,000 | $ | 10,703,543 | ||||||||||
Wp/ap Telecom Holdings III B.V. ***, + |
5.50% |
05/29/24 | 01/15/30 | Senior |
€ | 5,874,875 | 6,509,838 | |||||||||||
Total Western Europe (0.63%) |
99,092,825 | |||||||||||||||||
Total High Yield Bonds (Cost $122,837,666)(0.81%) |
$ | 128,263,335 | ||||||||||||||||
Asset-Backed Securities (0.49%) |
||||||||||||||||||
AGL CLO 9 Ltd. ***, + |
6.50% + SFvv |
04/11/24 | 04/20/37 | Series 2020-9A, Class ER |
3,500,000 | 3,619,076 | ||||||||||||
AIMCO CLO 21 Ltd. ***, + |
6.00% + SFvv |
04/09/24 | 04/18/37 | Series 2024-21A, Class E |
3,000,000 | 3,096,498 | ||||||||||||
AIMCO CLO Series 2015-A ***, + |
6.35% + SFvv |
08/21/24 | 10/17/34 | Series 2015-AA, Class ER3 |
1,967,607 | 1,979,465 | ||||||||||||
Ballyrock CLO 18 Ltd . + |
5.25+ SFvv |
03/21/25 | 04/15/38 | Series 2021-18A, Class DR |
2,260,000 | 2,276,153 | ||||||||||||
Ballyrock CLO 20 Ltd. ***, + |
6.20% + SFvv |
09/18/24 | 10/15/36 | Series 2022-20A, Class DR2 |
3,000,000 | 3,006,586 | ||||||||||||
Benefit Street Partners CLO XXXIV Ltd. ***, + |
6.70% + SFvv |
03/22/24 | 07/25/37 | Series 2024-34A, Class E |
1,000,000 | 1,033,283 | ||||||||||||
Benefit Street Partners CLO XXXIV Ltd. ***, + |
0.00% |
03/22/24 | 07/25/37 | Series 2024-34A, Class SUB |
2,500,000 | 1,896,750 | ||||||||||||
CIFC Funding 2019-VI Ltd. ***, + |
6.25% + SFvv |
05/22/24 | 07/16/37 | Series 2019-6A, Class ER |
1,200,000 | 1,232,669 | ||||||||||||
CIFC Funding 2021-I Ltd. ***, + |
6.00% + SFvv |
06/03/24 | 07/25/37 | Series 2021-1A, Class ER |
2,500,000 | 2,563,165 | ||||||||||||
CIFC Funding 2021-VI Ltd. ***, + |
6.51% + SFvv |
09/22/21 | 10/15/34 | Series 2021-6A, Class E |
1,500,000 | 1,534,067 | ||||||||||||
CIFC Funding 2022-IV Ltd. ***, + |
7.00% + SFvv |
04/20/22 | 07/16/35 | Series 2022-4A, Class E |
1,250,000 | 1,284,532 | ||||||||||||
CIFC Funding 2024-II Ltd. ***, + |
0.00% |
04/01/24 | 04/22/37 | Series 2024-2A, Class SUBB |
3,000,000 | 2,413,500 | ||||||||||||
CIFC Funding Ltd. ***, + |
7.27% + SFvv |
04/05/22 | 04/21/35 | Series 2022-3A, Class E |
1,000,000 | 1,029,887 | ||||||||||||
Elmwood CLO 26 Ltd. ***, + |
6.45% + SFvv |
02/15/24 | 04/18/37 | Series 2024-1A, Class E |
2,500,000 | 2,563,891 | ||||||||||||
Elmwood CLO 28 Ltd. ***, + |
6.00% + SFvv |
04/19/24 | 04/17/37 | Series 2024-4A, Class E |
1,400,000 | 1,446,540 | ||||||||||||
Elmwood CLO VII Ltd. ***, + |
5.90% + SFvv |
09/26/24 | 10/17/37 | Series 2020-4A, Class ERR |
2,750,000 | 2,750,057 | ||||||||||||
Elmwood CLO X Ltd. ***, + |
5.85% + SFvv |
04/05/24 | 07/20/37 | Series 2021-3A, Class ER |
4,500,000 | 4,462,217 | ||||||||||||
Magnetite XXIV Ltd. ***, + |
6.40% + SFvv |
02/04/22 | 04/15/35 | Series 2019-24A, Class ER |
4,000,000 | 4,106,983 | ||||||||||||
OHA Credit Funding 19 Ltd. ***, + |
5.60% + SFvv |
05/31/24 | 07/20/37 | Series 2024-19A, Class E |
950,000 | 979,483 | ||||||||||||
OHA Credit Funding 6 Ltd. ***, + |
5.25%+ SFvv |
10/11/24 | 10/20/37 | Series 2020-6A, Class ER2 |
2,000,000 | 2,010,456 | ||||||||||||
OHA Credit Partners XI Ltd. ***, + |
5.75% + SFvv |
05/06/24 | 04/20/37 | Series 2015-11A, Class ER2 |
2,000,000 | 2,047,192 | ||||||||||||
Palmer Square CLO 2024-2 Ltd. ***, + |
5.70% + SFvv |
05/30/24 | 07/20/37 | Series 2024-2A, Class E |
4,000,000 | 4,118,553 | ||||||||||||
Southwick Park CLO LLC ***, + |
6.51% + SFvv |
11/16/21 | 07/20/32 | Series 2019-4A, Class ER |
800,000 | 794,739 | ||||||||||||
Symphony CLO XXV Ltd. ***, + |
6.76% + SFvv |
03/12/21 | 04/19/34 | Series 2021-25A, Class E |
752,616 | 762,459 | ||||||||||||
Wellman Park CLO Ltd. ***, + |
6.30% + SFvv |
07/25/24 | 07/15/37 | Series 2021-1A, Class ER |
2,000,000 | 2,054,385 | ||||||||||||
Total North America (0.35%) |
55,062,586 | |||||||||||||||||
Western Europe (0.14%) |
||||||||||||||||||
Aurium CLO V Designated Activity Co. ***, + |
6.16% + E## |
03/08/21 | 04/17/34 | Series 5A, Class ER |
€ | 1,500,000 | 1,644,234 | |||||||||||
Aurium CLO VII DAC ***, + |
5.86% + E## |
02/04/22 | 05/15/34 | Series 7A, Class E |
1,521,243 | 1,628,745 | ||||||||||||
Avoca CLO XXVI DAC ***, + |
9.12% + E## |
02/23/22 | 04/15/35 | Series 26A, Class F |
1,200,000 | 1,325,955 | ||||||||||||
Avoca CLO XXVI DAC ***, + |
6.51% + E## |
02/23/22 | 04/15/35 | Series 26A, Class E |
750,000 | 829,124 | ||||||||||||
Blackrock European CLO VIII DAC ***, + |
6.26% + E## |
02/03/22 | 01/20/36 | Series 8A, Class ER |
1,000,000 | 1,089,977 | ||||||||||||
Boyce Park CLO Ltd. ***, + |
6.25% + SFvv |
01/28/22 | 04/21/35 | Series 2022-1A, Class E |
$ | 2,625,000 | 2,668,271 | |||||||||||
Brookhaven Park CLO Ltd. ***, + |
6.50% + SFvv |
03/15/24 | 04/19/37 | Series 2024-1A, Class E |
1,000,000 | 1,037,740 | ||||||||||||
Carlyle Euro CLO 2021-1 DAC ***, + |
6.12% + E## |
05/01/21 | 04/15/34 | Series 2021-1A, Class D |
€ | 333,000 | 366,131 | |||||||||||
The accompanying notes are an integral part of these Consolidated Financial Statements.
8
Partners Group Private Equity (Master Fund), LLC
(a Delaware Limited Liability Company)
Consolidated Schedule of Investments –
March 31, 2025 (continued)
Public Investments (continued) Western Europe (continued) |
Interest |
Acquisition |
Maturity |
Investment |
Principal |
Fair |
||||||||||||
Carlyle Global Market Strategies 2015-1 Ltd. ***, + |
0.00% |
01/20/22 | 01/16/33 | Series 2015-1A, Class SUB |
$ | 3,000,000 | $ | 818,745 | ||||||||||
Carlyle Global Market Strategies 2015-1 Ltd. ***, + |
5.50% + E## |
01/20/22 | 01/16/33 | Series 2015-1A, Class DR |
1,502,063 | 1,644,689 | ||||||||||||
Carysfort Park CLO ***, + |
6.14% + E## |
03/12/21 | 07/28/34 | Series 2021-1A, Class D |
500,000 | 553,521 | ||||||||||||
Octagon 58 Ltd. ***, + |
7.20% + SFvv |
04/21/22 | 07/15/37 | Series 2022-1A, Class E |
$ | 2,140,000 | 2,191,387 | |||||||||||
Otranto Park CLO ***, + |
7.05% + E## |
03/04/22 | 05/15/35 | Series 1A, Class E |
€ | 1,172,000 | 1,302,183 | |||||||||||
Otranto Park CLO ***, + |
4.15% + E## |
03/04/22 | 05/15/35 | Series 1A, Class D |
750,000 | 822,725 | ||||||||||||
Palmer Square European Loan Funding 2022-1 DAC ***, + |
5.90% + E## |
02/03/22 | 10/15/31 | Series 2022-1A, Class E |
667,000 | 736,141 | ||||||||||||
Palmer Square European Loan Funding 2022-1 DAC ***, + |
8.05% + E## |
02/03/22 | 10/15/31 | Series 2022-1A, Class F |
500,000 | 547,984 | ||||||||||||
Palmer Square European Loan Funding 2024-1 DAC ***, + |
6.75% + E## |
02/22/24 | 08/15/33 | Series 2024-1A, Class E |
1,230,000 | 1,343,140 | ||||||||||||
Storm King Park CLO Ltd. ***, + |
6.15% + SFvv |
09/17/24 | 10/15/37 | Series 2022-1A, Class ER |
$ | 1,500,000 | 1,508,349 | |||||||||||
Total Western Europe (0.14%) |
22,059,041 | |||||||||||||||||
Total Asset-Backed Securities (Cost $77,942,191)(0.49%) |
$ | 77,121,627 | ||||||||||||||||
Floating Rate Loans (2.07%) North America (1.53%) |
||||||||||||||||||
AAL Delaware Holdco, Inc. + |
3.50% + SFv |
09/30/24 | 07/30/31 | Senior |
798,000 | 793,268 | ||||||||||||
Ahead DB Holdings, LLC +, f |
Cash 3.00% + SF (0.75% Floor)vv |
03/26/25 | 02/01/31 | Senior |
2,000,000 | 1,998,920 | ||||||||||||
AIT Worldwide Logistics, Inc. + |
4.75% + SFvv |
12/09/24 | 04/08/30 | Senior |
3,990,000 | 3,992,075 | ||||||||||||
Alliant Holdings Intermediate LLC + |
3.00% + SFv |
09/12/24 | 09/19/31 | Senior |
4,975,000 | 4,950,125 | ||||||||||||
Alpha Generation LLC + |
2.75% + SFv |
09/19/24 | 09/30/31 | Senior |
1,194,000 | 1,195,875 | ||||||||||||
Amentum Government Services Holdings LLC + |
2.25% + SFv |
07/30/24 | 09/29/31 | Senior |
997,500 | 966,647 | ||||||||||||
Archkey Solutions LLC +, e |
Cash 4.75% + SFvv |
03/03/25 | 11/01/31 | Senior |
2,600,000 | 2,600,201 | ||||||||||||
Aspire Bakeries Holdings LLC + |
4.25% + SFv |
12/31/24 | 12/13/30 | Senior |
994,975 | 998,706 | ||||||||||||
Avalara, Inc. +, e, f |
Cash 3.25% + SFvv |
03/21/25 | 03/26/32 | Senior |
4,500,000 | 4,482,590 | ||||||||||||
BCPE Empire Holdings, Inc. + |
3.50% + SFv |
12/31/24 | 12/11/28 | Senior |
2,300,000 | 2,271,250 | ||||||||||||
Bella Holding Company, LLC + |
Cash 3.25% + SF (0.75% Floor)vv |
03/31/25 | 05/10/28 | Senior |
3,482,019 | 3,479,372 | ||||||||||||
Belron Finance 2019 LLC +, d |
2.75% + SFvv |
10/02/24 | 10/16/31 | Senior |
8,258,500 | 8,254,701 | ||||||||||||
CCC Intelligent Solutions Inc. + |
2.00% + SFv |
03/31/25 | 01/23/32 | Senior |
997,500 | 996,881 | ||||||||||||
CHG Healthcare Services, Inc. + |
3.00% + SFv |
09/30/24 | 09/29/28 | Senior |
1,790,955 | 1,790,614 | ||||||||||||
Citrin Cooperman Advisors LLC +, f |
Cash 3.00% + SFvv |
03/06/25 | 04/01/32 | Senior |
254,545 | 253,036 | ||||||||||||
Citrin Cooperman Advisors LLC +, f |
Cash 3.00% + SFvv |
03/06/25 | 04/01/32 | Senior |
3,945,455 | 3,922,058 | ||||||||||||
Clarios Global LP + |
4.5% + SFv |
03/31/25 | 01/28/32 | Senior |
2,100,000 | 2,072,007 | ||||||||||||
Clydesdale Acquisition Holdings Inc. +, f |
Cash 3.25% + SF (0.50% Floor)vv |
03/27/25 | 04/01/32 | Senior |
53,265 | 53,032 | ||||||||||||
Clydesdale Acquisition Holdings Inc. +, f |
Cash 3.25% + SF (0.50% Floor)vv |
03/27/25 | 04/01/32 | Senior |
3,046,735 | 3,033,421 | ||||||||||||
Cotiviti Corporation +, f |
Cash 2.75% + SFvv |
02/14/25 | 03/26/32 | Senior |
4,500,000 | 4,404,375 | ||||||||||||
CPPIB Capital, Inc. + |
3.25% + SFvv |
09/30/24 | 08/20/31 | Senior |
1,393,001 | 1,385,744 | ||||||||||||
Cube Industrials Buyer Inc. + |
3.50% + SFvv |
10/28/24 | 10/17/31 | Senior |
1,000,000 | 994,590 | ||||||||||||
Delta 2 (LUX) S.à.r.l. +, d |
09/10/24 | 09/30/31 | Senior |
1,033,333 | 1,033,013 | |||||||||||||
Delta 2 (LUX) S.à.r.l. + |
2.00% + SFvv |
09/10/24 | 09/10/31 | Senior |
2,061,434 | 2,060,794 | ||||||||||||
Dragon Buyer, Inc. + |
3.00% + SFvv |
09/24/24 | 09/30/31 | Senior |
5,785,500 | 5,749,341 | ||||||||||||
Dynamo Newco II GmbH + |
4.00% + SFvvv |
09/25/24 | 09/26/31 | Senior |
4,626,750 | 4,636,883 | ||||||||||||
The accompanying notes are an integral part of these Consolidated Financial Statements.
9
Partners Group Private Equity (Master Fund), LLC
(a Delaware Limited Liability Company)
Consolidated Schedule of Investments –
March 31, 2025 (continued)
Public Investments (continued) North America (continued) |
Interest |
Acquisition |
Maturity |
Investment |
Principal |
Fair |
||||||||||||
ECO Material Tech Inc. + |
Cash 3.25% + SFvv |
03/31/25 | 02/12/32 | Senior |
$ | 2,000,000 | $ | 1,995,640 | ||||||||||
Epic Crude Services, LP + |
3.00% + SFvv |
10/22/24 | 10/15/31 | Senior |
2,250,000 | 2,252,002 | ||||||||||||
First Brands Group, LLC + |
5.00% + SFvv |
11/15/24 | 03/30/27 | Senior |
1,247,392 | 1,162,033 | ||||||||||||
First Brands Group, LLC + |
5.00% + SFvv |
11/12/24 | 03/30/27 | Senior |
742,598 | 692,012 | ||||||||||||
Focus Financial Partners, LLC +, f |
Cash 2.75% + SFvv |
01/28/25 | 09/15/31 | Senior |
949,615 | 941,581 | ||||||||||||
Focus Financial Partners, LLC + |
5.00% + P |
02/24/25 | 09/15/31 | Senior |
3,148,005 | 3,121,373 | ||||||||||||
Fortis 333, Inc. + |
3.50% + SFv |
02/06/25 | 03/29/32 | Senior |
1,600,000 | 1,592,000 | ||||||||||||
Froneri International Ltd. +, d |
2.00% + SFvv |
09/17/24 | 09/17/31 | Senior |
4,000,000 | 3,979,240 | ||||||||||||
Genesys Cloud Services Holdings II LLC + |
Cash 2.50% + SFvv |
03/31/25 | 01/30/32 | Senior |
6,600,000 | 6,538,752 | ||||||||||||
GFL Environmental Inc. + |
Cash 2.50% + SFvv |
03/07/25 | 02/04/32 | Senior |
1,200,000 | 1,191,000 | ||||||||||||
Gloves Buyer, Inc. +, f |
4.00% + SFv |
01/17/25 | 01/17/32 | Senior |
3,400,000 | 3,278,178 | ||||||||||||
Golden State Food LLC + |
4.25% + SFv |
12/12/24 | 12/04/31 | Senior |
2,636,816 | 2,648,629 | ||||||||||||
Hanger, Inc. +, e |
3.50% + SFv |
12/31/24 | 10/23/31 | Senior |
1,949,049 | 1,950,063 | ||||||||||||
Hanger, Inc. +, e |
3.50% + SFv |
10/16/24 | 10/23/31 | Senior |
250,951 | 36,648 | ||||||||||||
Hobbs & Associates LLC + |
3.25% + SFvv |
07/16/24 | 07/23/31 | Senior |
498,750 | 492,516 | ||||||||||||
Hobbs & Associates LLC +, e |
3.25% + SFv |
09/30/24 | 07/23/31 | Senior |
5,000,000 | 4,934,000 | ||||||||||||
Holding Socotec +, d |
3.75% + SF |
11/22/24 | 06/30/28 | Senior |
1,455,000 | 1,457,735 | ||||||||||||
Illuminate Buyer, LLC +, d |
10/10/24 | 12/31/29 | Senior |
1,592,000 | 1,590,010 | |||||||||||||
Inmar, Inc. + |
5.00% + SFv |
12/31/24 | 10/30/31 | Senior |
2,288,500 | 2,290,651 | ||||||||||||
Iridium Satellite LLC +, f |
4.75% + SFv |
03/26/25 | 09/20/30 | Senior |
2,992,424 | 2,948,017 | ||||||||||||
John Bean Technologies Corp +, d, f |
10/09/24 | 10/09/31 | Senior |
1,000,000 | 1,000,730 | |||||||||||||
Kaman Corporation +, e |
Cash 2.75% + SF (0.50% Floor)vv |
03/06/25 | 02/26/32 | Senior |
2,500,000 | 2,256,617 | ||||||||||||
Kaseya Inc. + |
Cash 3.25% + SFvv |
03/31/25 | 03/20/32 | Senior |
5,300,000 | 5,290,089 | ||||||||||||
KKR Apple Bidco, LLC + |
3.25% + SFv |
02/14/25 | 09/23/31 | Senior |
4,500,000 | 4,472,595 | ||||||||||||
Lernen Bidco Ltd. + |
4.00% + SFvv |
11/04/24 | 10/27/31 | Senior |
4,189,500 | 4,192,139 | ||||||||||||
LSF12 Crown US Commercial Bidco LLC +, d |
CME Term SOFR + 4.25% |
10/11/24 | 12/02/31 | Senior |
6,800,000 | 6,692,356 | ||||||||||||
Madison IAQ LLC +, f |
Cash 3.25% + SF (0.50% Floor)vv |
03/28/25 | 03/28/32 | Senior |
6,000,000 | 5,940,000 | ||||||||||||
Madison Safety & Flow LLC +, f |
Cash 2.75% + SFvv |
09/26/24 | 09/26/31 | Senior |
1,990,000 | 1,985,025 | ||||||||||||
Minimax Viking GmbH + |
Cash 2.25% + SFvv |
03/27/25 | 03/17/32 | Senior |
2,100,000 | 2,096,073 | ||||||||||||
MJH Healthcare Holdings, LLC +, f |
Cash 3.25% + SFvv |
03/26/25 | 01/28/29 | Senior |
1,994,975 | 1,986,676 | ||||||||||||
Newly Weds Foods Inc. + |
Cash 2.25% + SFvv |
03/19/25 | 03/15/32 | Senior |
4,500,000 | 4,477,500 | ||||||||||||
Nielsen Consumer Inc. + |
5.00% + SFv |
03/31/25 | 03/06/28 | Senior |
4,600,000 | 4,590,800 | ||||||||||||
NSM Top Holdings Corp. + |
5.25% + SFvv |
08/05/24 | 05/14/29 | Senior |
1,890,500 | 1,904,679 | ||||||||||||
Nuvei Technologies Corp. + |
3.00% + SFv |
12/13/24 | 11/15/31 | Senior |
3,750,000 | 3,730,200 | ||||||||||||
Nvent Electric Public Limited Company + |
Cash 3.50% + SFvv |
03/31/25 | 01/30/32 | Senior |
1,850,000 | 1,851,924 | ||||||||||||
Paint Intermediate III LLC + |
3.00% + SFvv |
09/11/24 | 09/11/31 | Senior |
1,300,000 | 1,300,819 | ||||||||||||
Plano HoldCo, Inc. + |
3.50% + SFvv |
08/02/24 | 08/15/31 | Senior |
4,800,000 | 4,788,000 | ||||||||||||
Quartz Acquireco LLC +, f |
Cash 2.25% + SFvv |
03/25/25 | 06/28/30 | Senior |
4,987,342 | 4,962,405 | ||||||||||||
Quikrete Holdings, Inc. + |
Cash 2.25% + SFvv |
03/31/25 | 02/10/32 | Senior |
2,880,000 | 2,851,286 | ||||||||||||
Raven Acquisition Holdings LLC +, e |
3.25% + SFv |
12/31/24 | 11/19/31 | Senior |
3,000,000 | 2,768,733 | ||||||||||||
Recess Holdings, Inc. + |
Cash 3.75% + SF (1.00% Floor)vv |
01/24/25 | 02/20/30 | Senior |
2,481,250 | 2,485,915 | ||||||||||||
Red Planet Borrower, LLC + |
5.25% + SFv |
12/31/24 | 10/02/28 | Senior |
3,200,000 | 3,201,344 | ||||||||||||
Rohm Holding GmbH +, f |
Cash 5.50% + SFvvv; PIK 1.49% |
02/19/25 | 01/31/29 | Senior |
2,000,000 | 1,926,260 | ||||||||||||
Ryan Specialty Group LLC + |
2.25% + SFv |
09/10/24 | 09/15/31 | Senior |
997,500 | 996,383 | ||||||||||||
Sauer Brands Inc. + |
Cash 3.25% + SFvv |
02/04/25 | 02/05/32 | Senior |
86,207 | 86,228 | ||||||||||||
Sauer Brands Inc. + |
Cash 3.25% + SFvv |
03/31/25 | 02/04/32 | Senior |
913,793 | 914,022 | ||||||||||||
The accompanying notes are an integral part of these Consolidated Financial Statements.
10
Partners Group Private Equity (Master Fund), LLC
(a Delaware Limited Liability Company)
Consolidated Schedule of Investments –
March 31, 2025 (continued)
Public Investments (continued) North America (continued) |
Interest |
Acquisition |
Maturity |
Investment |
Principal |
Fair |
||||||||||||
Southern Veterinary Partners, LLC + |
3.25% + SFvv |
12/05/24 | 12/04/31 | Senior |
$ | 1,900,000 | $ | 1,896,960 | ||||||||||
Stonepeak Nile Parent LLC + |
2.75% + SFv |
02/03/25 | 04/09/32 | Senior |
1,800,000 | 1,795,230 | ||||||||||||
Storable, Inc. + |
Cash 3.25% + SFvv |
03/31/25 | 04/16/31 | Senior |
2,800,000 | 2,786,896 | ||||||||||||
Summer (BC) Holdco B S.à.r.l. + |
Cash 8.75% + SFvvv |
03/31/25 | 02/15/29 | Senior |
4,700,000 | 4,698,073 | ||||||||||||
Summit Acquisition Inc. + |
3.75% + SFvv |
12/31/24 | 10/16/31 | Senior |
1,000,000 | 1,001,250 | ||||||||||||
Sunrise Financing Partnership + |
2.50% + SFvvv |
03/28/25 | 02/15/32 | Senior |
4,300,000 | 4,264,310 | ||||||||||||
Tecta America Corp. + |
Cash 3.00% + SFvv |
02/12/25 | 02/18/32 | Senior |
2,800,000 | 2,782,864 | ||||||||||||
Terex Corporation + |
2.00% + SFv |
12/31/24 | 10/08/31 | Senior |
2,000,000 | 2,005,000 | ||||||||||||
Thevelia (US) LLC + |
3.00% + SFvv |
09/30/24 | 06/18/29 | Senior |
2,183,417 | 2,181,605 | ||||||||||||
Thunder Generation Funding LLC + |
3.00% + SFvv |
09/27/24 | 09/27/31 | Senior |
5,970,000 | 5,976,567 | ||||||||||||
Tidal Waste & Recycling Holdings LLC + |
3.50% + SFvv |
12/31/24 | 10/24/31 | Senior |
1,000,000 | 1,002,030 | ||||||||||||
TK Elevator Midco GmbH +, f |
3.00% + SFv |
03/04/25 | 04/30/30 | Senior |
2,575,000 | 2,571,318 | ||||||||||||
TMF Group Holding B.V. +, f |
Cash 2.75% + SFvv |
01/15/25 | 05/03/28 | Senior |
563,000 | 560,421 | ||||||||||||
TransDigm, Inc. + |
2.50% + SFvv |
09/25/24 | 01/19/32 | Senior |
4,676,500 | 4,657,654 | ||||||||||||
USALCO LLC +, d, e, f |
4.00% + SFv |
09/17/24 | 09/17/31 | Senior |
1,646,260 | 1,493,592 | ||||||||||||
Varsity Brands, Inc. +, f |
Cash 3.50% + SFvv |
08/26/24 | 08/26/31 | Senior |
3,800,000 | 3,732,322 | ||||||||||||
Worldwide Express Operations, LLC + |
4.00%+SFvv |
12/31/24 | 07/26/28 | Senior |
3,581,491 | 3,540,913 | ||||||||||||
Zacapa S.à.r.l. + |
3.75% + SFvv |
12/31/24 | 03/22/29 | Senior |
1,591,803 | 1,592,137 | ||||||||||||
Total North America (1.53%) |
240,749,539 | |||||||||||||||||
Western Europe (0.54%) |
||||||||||||||||||
AccorInvest Group SA + |
5.25% + E## |
02/28/25 | 06/10/27 | Senior |
€ | 542,075 | 587,634 | |||||||||||
AD Education +, d |
4.00% + E#### |
10/22/24 | 11/14/31 | Senior |
4,500,000 | 4,863,041 | ||||||||||||
Albion Financing 3 S.à.r.l. + |
Cash 3.00% + SF (0.50% Floor)vv |
02/14/25 | 08/16/29 | Senior |
$ | 1,000,000 | 1,002,190 | |||||||||||
Care Bidco SAS +, d, f |
3.50% + E## |
05/13/24 | 11/06/28 | Senior |
€ | 2,100,000 | 2,267,990 | |||||||||||
CD&R Firefly Bidco Ltd. +, d, f |
5.50% + S>> |
04/03/24 | 04/29/29 | Senior |
£ | 5,000,000 | 6,460,037 | |||||||||||
Chrysaor Bidco S.à.r.l. + |
SFv |
05/15/24 | 05/14/24 | $ | 2,626,875 | 2,609,029 | ||||||||||||
Elsan SAS + |
3.35% + E## |
09/26/24 | 06/16/28 | Senior |
€ | 5,000,000 | 5,372,329 | |||||||||||
HBX Group International PLC +, f |
Cash 2.75% + E### |
03/26/25 | 02/18/32 | Senior |
5,200,000 | 5,622,996 | ||||||||||||
IGT Holding IV AB +, f |
Cash 3.50% + SF (0.50% Floor)vvv |
03/19/25 | 09/01/31 | Senior |
$ | 1,500,000 | 1,503,750 | |||||||||||
Inspired FinCo Holdings Ltd. +, f |
Cash 3.25% + E### |
02/06/25 | 02/28/31 | Senior |
€ | 3,300,000 | 3,551,226 | |||||||||||
Inspired Finco Holdings Ltd. +, f |
Cash 3.25% + E### |
02/06/19 | 02/28/31 | Senior |
1,018,519 | 1,096,058 | ||||||||||||
Inspired Finco Holdings Ltd. +, f |
3.25% + E## |
02/06/25 | 02/28/31 | Senior |
2,037,037 | 2,192,115 | ||||||||||||
Lorca Holdco Ltd. + |
3.70% + E## |
09/24/24 | 09/17/27 | Senior |
2,709,458 | 2,904,431 | ||||||||||||
LSF10 XL Bidco S.C.A. +, d |
4.175% + E## |
05/07/24 | 04/12/28 | Senior |
5,000,000 | 5,265,680 | ||||||||||||
MasOrange Finco Plc +, f |
Cash 2.75% + E## |
02/21/25 | 03/25/31 | Senior |
8,100,000 | 8,682,878 | ||||||||||||
Nobian Finance B.V. +, f |
Cash 3.50% + E## |
03/04/25 | 07/31/30 | Senior |
5,400,000 | 5,810,864 | ||||||||||||
Quimper AB +, d |
3.75% + E# |
05/17/24 | 03/15/30 | Senior |
7,000,000 | 7,588,923 | ||||||||||||
Speedster Bidco GmbH +, d, f |
3.75% + E## |
10/18/24 | 10/17/31 | Senior |
10,000,000 | 10,829,007 | ||||||||||||
Sport Group Holding GmbH + |
Cash 4.00% + E### |
01/08/25 | 07/08/31 | Senior |
2,600,000 | 2,815,907 | ||||||||||||
Summer (BC) Holdco B S.à.r.l. + |
Cash 4.50% + E### |
03/04/25 | 01/31/29 | Senior |
3,737,050 | 4,034,343 | ||||||||||||
Summer (BC) Holdco B S.à.r.l. + |
4.50% + E## |
05/07/24 | 01/31/29 | Senior |
570,642 | 616,038 | ||||||||||||
Total Western Europe (0.54%) |
85,676,466 | |||||||||||||||||
Total Floating Rate Loans (Cost $325,890,297)(2.07%) |
$ | 326,426,005 | ||||||||||||||||
Total Public Investments (Cost $1,250,175,587)(8.26%) |
$ | 1,303,936,478 | ||||||||||||||||
The accompanying notes are an integral part of these Consolidated Financial Statements.
11
Partners Group Private Equity (Master Fund), LLC
(a Delaware Limited Liability Company)
Consolidated Schedule of Investments –
March 31, 2025 (continued)
Private Equity Investments (94.72%) Direct Equity (54.88%) |
Investment Type |
Acquisition |
Shares |
Fair |
|||||||||
Asia - Pacific (3.62%) |
|||||||||||||
AAVAS Financiers Limited +, a, e |
Common equity |
03/28/18 | 2,623,753 | $ | 37,972,607 | ||||||||
Argan Mauritius Limited +, a, e |
Common equity |
05/09/16 | 106,215 | 14,005,149 | |||||||||
Compass Education +, a, e |
Common equity |
01/21/25 | 19,328,293 | 19,328,293 | |||||||||
Continuity CNC Capital Limited +, a |
Common equity |
03/01/18 | 1,021 | 1 | |||||||||
GreenSquare Operating HoldCo Pte. Ltd. +, a, e |
Preferred equity |
03/06/25 | 388,906 | 242,231 | |||||||||
GreenSquare Operating HoldCo Pte. Ltd. +, a, e |
Common equity |
03/06/25 | 7,937 | 4,944 | |||||||||
Huntress Co-Investment L.P., 1 +, a, c |
Limited partnership interest |
04/08/16 | — | 1 | |||||||||
KKR Pebble Co-Invest L.P. +, a, c, e |
Limited partnership interest |
05/13/21 | — | 30,977,607 | |||||||||
Murra Warra Asset Hold Trust +, a, e |
Common equity |
09/10/18 | 1 | 1 | |||||||||
Murra Warra II Asset Hold Trust +, a, e |
Common equity |
07/30/20 | 1 | 7,786 | |||||||||
Murra Warra II Project Hold Trust +, a, e |
Common equity |
07/30/20 | 1 | 1,947 | |||||||||
Murra Warra Project Hold Trust +, a, e |
Common equity |
09/10/18 | 1 | 1 | |||||||||
Partners Terra Pte. Ltd. +, a, b, e |
Common equity |
05/14/21 | 7,980,885 | 11,267,935 | |||||||||
PG Esmeralda Pte. Ltd. +, a, b, e |
Common equity |
03/03/21 | 5,433,284 | — | |||||||||
PG Esmeralda Pte. Ltd. +, a, b, e |
Preferred equity |
03/03/21 | 7,421,005 | 21,314,750 | |||||||||
PG Loa Pte. Ltd. +, a |
Common equity |
04/25/22 | 1,209,387 | 1,494,133 | |||||||||
PG Loa Pte. Ltd. +, a |
Preferred equity |
04/25/22 | 22,978,363 | 28,388,532 | |||||||||
PG Power Pte. Ltd. +, a, e |
Common equity |
10/30/24 | 3,026,755 | 1,970,348 | |||||||||
Platform Hold Trust +, a, e |
Preferred equity |
03/06/25 | 1,895,469 | 1,180,597 | |||||||||
Sunsure Energy Private Limited +, a, b, c, e |
Member interest |
12/27/22 | — | 11,912,651 | |||||||||
Sunsure Energy Private Limited +, a, b, e |
Common equity |
12/27/22 | 481,884 | 7,319,498 | |||||||||
Sunsure Energy Private Limited +, a, b, e |
Preferred equity |
12/27/22 | 1,927,535 | 3,371,094 | |||||||||
TPG Upswing Co-Invest, L.P. +, a, c |
Limited partnership interest |
01/10/19 | — | 14,831,393 | |||||||||
Zenith Longitude Limited +, a, b, e |
Common equity |
08/13/21 | 26,838,037 | 364,712,669 | |||||||||
Total Asia - Pacific (3.62%) |
570,304,168 | ||||||||||||
North America (25.83%) |
|||||||||||||
Alliant Holdings, L.P. +, a, c |
Limited partnership interest |
12/01/21 | — | 41,673,173 | |||||||||
Allied Benefit Systems Holdings LP +, a, c |
Limited partnership interest |
10/22/24 | — | 36,199,840 | |||||||||
AmSurg HoldCo, LLC +, a |
Common equity |
11/03/23 | 896,098 | 33,609,935 | |||||||||
AP VIII Prime Security Services Holdings, L.P. +, a, c, e |
Limited partnership interest |
05/02/16 | — | 8,686,530 | |||||||||
Astorg VII Co-Invest ERT +, a, c |
Limited partnership interest |
01/31/20 | — | 89,713,097 | |||||||||
BCPE Hercules Holdings, LP +, a |
Common equity |
07/30/18 | 869,932 | 1,953,768 | |||||||||
BI Gen Holdings, Inc. +, a |
Common equity |
01/01/21 | 14,561 | 290,601 | |||||||||
CapitalSpring Finance Company, LLC +, a, b |
Common equity |
03/01/17 | 3,020,546 | 2,251,984 | |||||||||
Carestream Dental Technology, Inc. +, a |
Common equity |
08/30/24 | 4,205,000 | 2,453,050 | |||||||||
CB Poly Holdings, LLC +, a, e |
Preferred equity |
08/16/16 | 171,270 | 26,089,273 | |||||||||
CB Titan MidCo Holdings, Inc. +, a |
Common equity |
01/01/21 | 56,634 | 1 | |||||||||
CBI Parent, L.P. +, a, c |
Limited partnership interest |
01/06/21 | — | — | |||||||||
CBI Parent, L.P. +, a |
Preferred equity |
10/17/22 | 5,611,689 | — | |||||||||
CD&R Mercury Co-Investor, L.P. +, a, c, e |
Limited partnership interest |
10/14/20 | — | 166,444,216 | |||||||||
Checkers Topco, LLC +, a |
Common equity |
06/16/23 | 9,517 | 86,769 | |||||||||
Clarience Technologies, LLC +, a |
Common equity |
03/05/24 | 3,429 | 10,455,629 | |||||||||
Confluent Health Holdings LP +, a, b |
Common equity |
05/30/19 | 30,362 | 70,678,267 | |||||||||
ConvergeOne Holdings, Inc. +, a |
Common equity |
06/06/24 | 2,154,218 | 1,377,125 | |||||||||
Cowboy Topco, Inc. +, a |
Common equity |
05/18/22 | 1,348,750 | 1,852,304 | |||||||||
Cure Holdings, LLC +, a, e |
Common equity |
05/13/21 | 2,723 | 9,249 | |||||||||
Cure Holdings, LLC +, a |
Common equity |
05/13/21 | 238,834 | 896,341 | |||||||||
Dermatology Holdings, L.P. +, a, b, c, e |
Limited partnership interest |
04/01/22 | — | 171,952,426 | |||||||||
DIF VI Co-Invest Project 2C C.V. +, a, c, e |
Limited partnership interest |
03/15/22 | — | 60,831,604 | |||||||||
ECP Holding Company, LLC +, a, c, e |
Member interest |
03/15/16 | — | 123,590 | |||||||||
ECP Parent, LLC +, a, b, e |
Common equity |
11/15/21 | 105,520,023 | 105,669,367 | |||||||||
ECP Parent, LLC +, a, b, e |
Preferred equity |
12/21/23 | 4,250,000 | 10,460,483 | |||||||||
The accompanying notes are an integral part of these Consolidated Financial Statements.
12
Partners Group Private Equity (Master Fund), LLC
(a Delaware Limited Liability Company)
Consolidated Schedule of Investments –
March 31, 2025 (continued)
Private Equity Investments (continued) Direct Equity (continued) |
Investment Type |
Acquisition |
Shares |
Fair |
|||||||||
North America (continued) |
|||||||||||||
EdgeCore Holdings, L.P. +, a, b, c, e |
Limited partnership interest |
08/22/24 | — | $ | 155,593,184 | ||||||||
Elgin Co-Investment, L.P.2 +, a |
Common equity |
11/28/16 | 1 | 1 | |||||||||
Encore Holdings LP +, a, b, e |
Common equity |
07/01/22 | 60,573 | 151,981,910 | |||||||||
EnfraGen LLC +, a, b, e |
Common equity |
09/17/19 | 37,786 | 90,596,577 | |||||||||
EQT Infrastructure IV Co-Investment (B) SCSp +, a, c |
Limited partnership interest |
03/09/20 | — | 141,579,799 | |||||||||
EQT IX Co-Investment (F) SCSp +, a, c, e |
Limited partnership interest |
11/15/21 | — | 147,110,456 | |||||||||
EQT VIII Co-Investment (C) SCSp +, a, c, e |
Limited partnership interest |
01/25/19 | — | 57,389,273 | |||||||||
EQT X Co-Investment (A) SCSp +, a, c, e |
Limited partnership interest |
07/02/24 | — | 21,519,853 | |||||||||
EXW Coinvest L.P. +, a, c |
Limited partnership interest |
06/17/16 | — | — | |||||||||
FH EP Parent L.P. +, a, c, e |
Limited partnership interest |
03/12/24 | — | 16,960,982 | |||||||||
FRP Investors II, L.P. +, a, c, e |
Limited partnership interest |
09/16/22 | — | 71,637,989 | |||||||||
Gateway Fleets Holdings, LP +, a, b, c, e |
Limited partnership interest |
09/30/24 | — | 1,816,000 | |||||||||
Halo Parent Newco, LLC +, a |
Preferred equity |
02/22/22 | 1,109 | 14,304,257 | |||||||||
Icebox Holdco I Inc. +, a, b, c |
Member interest |
03/01/22 | — | 62,798,626 | |||||||||
Icebox Parent L.P. +, a, b, c |
Limited partnership interest |
12/22/21 | — | 303,143,923 | |||||||||
Idera Parent L.P. +, a, b, c, e |
Limited partnership interest |
03/02/21 | — | 180,121,935 | |||||||||
KDOR Merger Sub Inc. +, a |
Common equity |
05/11/18 | 481 | 1 | |||||||||
KENE Holdings, L.P. +, a, c |
Limited partnership interest |
08/08/19 | — | 444,341 | |||||||||
KKR Cavalry Co-Invest Blocker Parent L.P. +, a, c |
Limited partnership interest |
03/24/22 | — | 96,631,051 | |||||||||
KKR Enterprise Co-Invest AIV A L.P. +, a, c |
Limited partnership interest |
07/31/20 | — | 126,657 | |||||||||
KPOCH Holdings, L.P. +, a, b, c |
Limited partnership interest |
11/10/22 | — | 200,518,312 | |||||||||
KPSKY Holdings L.P. +, a, b, c |
Limited partnership interest |
10/19/21 | — | 45,279,023 | |||||||||
KSLB Holdings, LLC +, a |
Common equity |
07/30/18 | 252,000 | 19,253 | |||||||||
LTF Holdings, Inc. +, a, e |
Common equity |
01/06/20 | 247,131 | 6,816,811 | |||||||||
LTF Holdings, Inc. +, a |
Common equity |
01/06/20 | 3,122,345 | 64,186,048 | |||||||||
Lumin Digital, LLC +, a, e |
Preferred equity |
11/20/24 | 24,471,996 | 24,474,052 | |||||||||
Lumin Digital, LLC +, a |
Preferred equity |
02/12/25 | 6,117,996 | 6,118,510 | |||||||||
Matterhorn Topco, L.P. +, a, c |
Limited partnership interest |
04/04/23 | — | 18,275,868 | |||||||||
MHS Acquisition Holdings, LLC +, a, b |
Common equity |
03/10/17 | 356 | 330,763 | |||||||||
MHS Acquisition Holdings, LLC +, a, b |
Preferred equity |
03/10/17 | 35,285 | 179,660 | |||||||||
MHS Blocker Purchaser L.P. +, a, b, c |
Limited partnership interest |
03/10/17 | — | 39,465,468 | |||||||||
Milestone Investment Holdings, LLC +, a, e |
Common equity |
09/23/21 | 22,293,150 | 30,375,437 | |||||||||
NC Ocala Co-Invest Alpha, L.P. +, a, c |
Limited partnership interest |
11/24/21 | — | 85,696,092 | |||||||||
OMNIA Coinvest L.P. +, a, c, e |
Limited partnership interest |
10/23/20 | — | 29,178,070 | |||||||||
Onecall Holdings, L.P. +, a |
Common equity |
11/29/17 | 1 | 435,437 | |||||||||
Onex Fox, L.P. +, a, c, e |
Limited partnership interest |
04/25/19 | — | 104,756,093 | |||||||||
Orion Opportunity L.P. +, a, c, e |
Limited partnership interest |
09/01/21 | — | 57,953,273 | |||||||||
PG BRPC Investment, LLC +, a, b |
Common equity |
08/01/19 | 32,079 | 76,446,421 | |||||||||
PG Delta HoldCo, LLC +, a, b, e |
Common equity |
06/24/21 | 40,952 | 111,748,823 | |||||||||
Raptor Holding Parent, L.P. +, a |
Common equity |
04/01/22 | 11,209 | 1,136,735 | |||||||||
Real Hero Topco, L.P. +, a, c |
Limited partnership interest |
04/01/21 | — | 18,188,336 | |||||||||
Real Hero Topco, L.P. +, a, c, e |
Limited partnership interest |
02/24/25 | — | 1,475,220 | |||||||||
Safari Co-Investment L.P. +, a, c |
Limited partnership interest |
03/14/18 | — | 1,654,414 | |||||||||
Safari Co-Investment L.P. +, a, c, e |
Limited partnership interest |
03/14/18 | — | 4,902,370 | |||||||||
Sandvine Corporation +, a |
Common equity |
03/03/25 | 923,247 | 163,446 | |||||||||
SC Landco Parent, LLC +, a |
Common equity |
11/28/16 | 2,672 | 484,601 | |||||||||
SC Landco Parent, LLC +, a |
Preferred equity |
04/21/17 | — | 1 | |||||||||
Shermco Intermediate Holdings, Inc. +, a, e |
Common equity |
06/05/18 | 11,525 | 2,765,517 | |||||||||
Shingle Coinvest LP +, a, c, e |
Limited partnership interest |
05/29/18 | — | 1 | |||||||||
SIH RP HoldCo L.P. +, a, e |
Common equity |
09/10/19 | 5,995,126 | 78,203,932 | |||||||||
SLP West Holdings Co-Invest Feeder II, L.P. +, a, c, e |
Limited partnership interest |
08/18/17 | — | 1 | |||||||||
SLP West Holdings Co-Invest Feeder II, L.P. +, a, c |
Limited partnership interest |
08/18/17 | — | 1 | |||||||||
SnackTime PG Holdings, Inc. +, a, b, e |
Common equity |
05/23/18 | 12 | — | |||||||||
SnackTime PG Holdings, Inc. +, a, b, c, e |
Member interest |
05/23/18 | — | — | |||||||||
The accompanying notes are an integral part of these Consolidated Financial Statements.
13
Partners Group Private Equity (Master Fund), LLC
(a Delaware Limited Liability Company)
Consolidated Schedule of Investments –
March 31, 2025 (continued)
Private Equity Investments (continued) Direct Equity (continued) |
Investment Type |
Acquisition |
Shares |
Fair |
|||||||||
North America (continued) |
|||||||||||||
Space Co-Invest LP +, a, c, e |
Limited partnership interest |
01/17/25 | — | $ | 20,339,023 | ||||||||
Specialty Pharma Holdings LP +, a, b, c |
Limited partnership interest |
04/01/21 | — | 143,805,401 | |||||||||
Starfish Intermediate, Inc. +, a |
Preferred equity |
06/06/22 | 7,136,374 | 233,506,214 | |||||||||
Stonepeak Tiger (Co-Invest) Holdings (I-B) L.P. +, a, c, e |
Limited partnership interest |
08/17/21 | — | 33,837,771 | |||||||||
SureWerx Topco, L.P. +, a, b, c, e |
Limited partnership interest |
04/30/24 | — | 360,024 | |||||||||
SureWerx Topco, L.P. +, a, b, c |
Limited partnership interest |
12/28/22 | — | 64,979,446 | |||||||||
Surveyor Co-Invest SCSp +, a, c, e |
Limited partnership interest |
10/17/24 | — | 24,418,404 | |||||||||
T-VIII Mercury Co-Invest L.P. +, a, c, e |
Limited partnership interest |
07/29/21 | — | 8,492,942 | |||||||||
Thermostat Purchaser, L.P. +, a, b, c |
Limited partnership interest |
08/31/21 | — | 113,403,193 | |||||||||
TKC Topco LLC +, a |
Common equity |
10/14/16 | 4,632,829 | 1,159,949 | |||||||||
VEEF II Co-Invest 2-A, L.P. +, a, c |
Limited partnership interest |
03/15/22 | — | 7,074,131 | |||||||||
Velocity Holdings US LP +, a, c, e |
Limited partnership interest |
08/31/22 | — | 27,092,184 | |||||||||
VEPF VII Co-Invest 2-A, LP +, a, c, e |
Limited partnership interest |
09/10/21 | — | 12,620 | |||||||||
VEPF VII Co-Invest 2-A, LP +, a, c |
Limited partnership interest |
04/06/21 | — | 30,460 | |||||||||
Vistra Group Holdings (BVI) II Limited +, a |
Common equity |
11/04/15 | 7,428 | 1 | |||||||||
WHCG Purchaser, L.P. +, a, b, c |
Limited partnership interest |
06/22/21 | — | 12,488,736 | |||||||||
WHCG Purchaser, L.P. +, a, b, e |
Preferred equity |
08/02/24 | 10,934,833 | 11,656,827 | |||||||||
WHCG Purchaser, L.P. +, a, b |
Preferred equity |
08/02/24 | 3,088,000 | 3,291,891 | |||||||||
Woof Parent L.P. +, a |
Common equity |
12/21/20 | 1,441 | 1 | |||||||||
Total North America (25.83%) |
4,074,692,644 | ||||||||||||
Rest of World (1.26%) |
|||||||||||||
Carlyle Retail Turkey Partners, L.P. +, a, c |
Limited partnership interest |
07/11/13 | — | 9,444,243 | |||||||||
PG Investment Company 1113B S.à r.l. +, a, e |
Common equity |
10/01/24 | 63,259,178 | 177,256,748 | |||||||||
PG Investment Company 53 S.à.r.l. +, a |
Preferred equity |
03/04/24 | 6,084,438 | 7,514,376 | |||||||||
PG Investment Company 53 S.à.r.l. +, a |
Common equity |
03/04/24 | 711,862 | 4,191,655 | |||||||||
Velvet LP SCS +, a, c |
Limited partnership interest |
03/04/24 | — | 192,534 | |||||||||
Total Rest of World (1.26%) |
198,599,556 | ||||||||||||
South America (0.02%) |
|||||||||||||
Centauro Co-Investment Fund, L.P. +, a, c |
Limited partnership interest |
11/28/13 | — | 3,841,211 | |||||||||
Total South America (0.02%) |
3,841,211 | ||||||||||||
Western Europe (24.15%) |
|||||||||||||
Akur8 SAS +, a, e |
Common equity |
08/28/24 | 6,271,791 | 8,089,649 | |||||||||
Akur8 SAS +, a, e |
Preferred equity |
08/28/24 | 8,741,790 | 10,357,323 | |||||||||
Ark EquityCo SAS +, a, c, e |
Limited partnership interest |
02/21/22 | — | 16,852,999 | |||||||||
Aston Lux Acquisitions S.à.r.l. +, a, c |
Limited partnership interest |
11/28/19 | — | 3,899,942 | |||||||||
Aston Lux Acquisitions S.à.r.l. +, a |
Common equity |
01/11/21 | 218,625 | 265,456 | |||||||||
Astorg VIII Co-Invest Open Health +, a, c |
Limited partnership interest |
08/04/22 | — | 14,841,587 | |||||||||
Astorg VIII Co-Invest Open Health +, a, c, e |
Limited partnership interest |
07/14/23 | — | 248,956 | |||||||||
Audiotonix Co-Invest SCSp +, a, c, e |
Limited partnership interest |
07/23/24 | — | 14,752,597 | |||||||||
BC European Capital X - Ceramtec Co-Investment (1) LP +, a, e |
Common equity |
02/06/18 | 575,918 | 1 | |||||||||
Blackstone Cornerstone Co-Invest (CYM) L.P. +, a, c, e |
Limited partnership interest |
04/16/24 | — | 25,281,883 | |||||||||
Bock Capital JVCo Nature S.à.r.l. +, a, b |
Common equity |
07/01/21 | 12,590,000,000 | 241,107,667 | |||||||||
Capri Acquisitions Topco Limited +, a, e |
Common equity |
11/01/17 | 8,345,985 | 32,799,703 | |||||||||
CD&R Market Co-Investor, L.P. +, a, c, e |
Limited partnership interest |
11/10/21 | — | 59,744,631 | |||||||||
Ciddan S.à.r.l. +, a, e |
Preferred equity |
09/15/17 | 23,249,522 | 27,886,840 | |||||||||
Ciddan S.à.r.l. +, a, e |
Common equity |
09/15/17 | 12,263,240 | 49,262,449 | |||||||||
Climeworks AG +, a |
Common equity |
04/25/22 | 18,455 | 85,623 | |||||||||
Climeworks AG +, a, e |
Preferred equity |
04/25/22 | 2,288,663 | 65,623,142 | |||||||||
EQT Future Co-Investment (C) SCSp +, a, c |
Limited partnership interest |
02/15/23 | — | 95,497,209 | |||||||||
EQT Jaguar Co-Investment SCSp +, a, c |
Limited partnership interest |
04/18/24 | — | 776,008 | |||||||||
The accompanying notes are an integral part of these Consolidated Financial Statements.
14
Partners Group Private Equity (Master Fund), LLC
(a Delaware Limited Liability Company)
Consolidated Schedule of Investments –
March 31, 2025 (continued)
Private Equity Investments (continued) Direct Equity (continued) |
Investment Type |
Acquisition |
Shares |
Fair |
|||||||||
Western Europe (continued) |
|||||||||||||
EQT Jaguar Co-Investment SCSp +, a, c, e |
Limited partnership interest |
11/30/18 | — | $ | 69,799,300 | ||||||||
EQT VIII Co-Investment (D) SCSp +, a, c, e |
Limited partnership interest |
10/01/19 | — | 212,945,596 | |||||||||
EQT VIII Co-Investment (D) SCSp +, a, c |
Limited partnership interest |
10/01/19 | — | 10,295,629 | |||||||||
Fides S.p.A +, a |
Common equity |
12/15/16 | 78,505 | 167,171 | |||||||||
Five Arrows Royal FAPI IV Co Invest SCSp +, a, c, e |
Limited partnership interest |
07/05/24 | — | 5,082,981 | |||||||||
Global Blue Group Holding AG +, a |
Common equity |
09/11/20 | 97,250 | 731,400 | |||||||||
Global Blue Holding L.P. +, a, c |
Limited partnership interest |
07/31/12 | — | 11,057,762 | |||||||||
Green DC LuxCo S.à.r.l. +, a, b, c, e |
Member interest |
01/20/22 | — | 42,064,345 | |||||||||
Green DC LuxCo S.à.r.l. +, a, b |
Common equity |
01/20/22 | 26,701,331 | 141,522,437 | |||||||||
Green DC LuxCo S.à.r.l. +, a, b, c, e |
Member interest |
03/31/24 | — | 14,977,351 | |||||||||
Green DC LuxCo S.à.r.l. +, a, b, e |
Common equity |
03/31/24 | 19,465,958 | 51,321,737 | |||||||||
Hera Co-investment LP +, a, c, e |
Limited partnership interest |
10/25/24 | — | 16,355,415 | |||||||||
KKR Pegasus Co-Invest L.P. +, a, c |
Limited partnership interest |
07/07/22 | — | 17,666,050 | |||||||||
KKR Sprint Co-Invest L.P. +, a, c |
Limited partnership interest |
09/29/22 | — | — | |||||||||
KKR Traviata Co-invest L.P. +, a, c |
Limited partnership interest |
12/18/19 | — | 151,924,007 | |||||||||
Luxembourg Investment Company 261 S.à.r.l. +, a |
Common equity |
07/31/18 | 1,484 | 62,718,113 | |||||||||
Luxembourg Investment Company 261 S.à.r.l. +, a, c |
Member interest |
07/31/18 | — | 67,305,479 | |||||||||
Luxembourg Investment Company 285 S.à.r.l. +, a, b |
Preferred equity |
08/22/19 | 7,865,820 | — | |||||||||
Luxembourg Investment Company 285 S.à.r.l. +, a, b, c |
Member interest |
08/22/19 | — | 9,221,658 | |||||||||
Luxembourg Investment Company 285 S.à.r.l. +, a, b |
Common equity |
08/22/19 | 6,999,953 | — | |||||||||
Luxembourg Investment Company 293 S.à.r.l. +, a, b, e |
Common equity |
06/26/19 | 9,789,622 | 40,305,579 | |||||||||
Luxembourg Investment Company 293 S.à.r.l. +, a, b, c, e |
Member interest |
06/26/19 | — | 12,695,895 | |||||||||
Luxembourg Investment Company 314 S.à.r.l. +, a, b |
Common equity |
08/22/19 | 192,000 | 1 | |||||||||
Luxembourg Investment Company 404 S.à.r.l. +, a, b, e |
Common equity |
02/14/23 | 145,800 | 7,809,693 | |||||||||
Luxembourg Investment Company 404 S.à.r.l. +, a, b, e |
Preferred equity |
02/14/23 | — | 15,961,980 | |||||||||
Luxembourg Investment Company 414 S.à.r.l. +, a, b, c, e |
Member interest |
07/02/21 | — | 42,746,135 | |||||||||
Luxembourg Investment Company 414 S.à.r.l. +, a, b, e |
Common equity |
07/02/21 | 12,316,087 | 70,911,014 | |||||||||
Luxembourg Investment Company 430 S.à.r.l. +, a, b, e |
Common equity |
05/10/21 | 52,594,635 | 63,306,634 | |||||||||
Luxembourg Investment Company 430 S.à.r.l. +, a, b, c, e |
Member interest |
05/10/21 | — | 16,416,258 | |||||||||
Magnesium Co-Invest SCSp +, a, c, e |
Limited partnership interest |
05/19/22 | — | 115,415,806 | |||||||||
Mauritius (Luxemburg) Investments S.à.r.l. +, a |
Common equity |
10/19/21 | 11,698 | 1 | |||||||||
Menrva Co-Investment, L.P. +, a, c |
Limited partnership interest |
11/22/24 | — | 11,034,170 | |||||||||
Nerve Co-Invest SCSp +, a, c, e |
Limited partnership interest |
01/27/21 | — | 65,449,727 | |||||||||
Nerve Co-Invest SCSp +, a, c |
Limited partnership interest |
01/27/21 | — | 8,870,780 | |||||||||
Oakley Capital V Co-Investment (A) SCSp +, a, c, e |
Limited partnership interest |
12/12/22 | — | 76,412,733 | |||||||||
Orbiter Investments S.à.r.l. +, a, b, e |
Common equity |
12/17/21 | 4,898,329 | 149,926,532 | |||||||||
Orbiter Investments S.à.r.l. +, a, b |
Common equity |
12/17/21 | 3,670,528 | 75,474,083 | |||||||||
OT Luxco 3 & Cy S.C.A. +, a |
Warrants |
12/01/17 | 844,553 | 965,514 | |||||||||
Partners Group Satellite HoldCo S.à.r.l. +, a, b, e |
Common equity |
03/22/23 | 7,017,978 | — | |||||||||
Partners Group Satellite HoldCo S.à.r.l. +, a, b, e |
Preferred equity |
03/22/23 | 7,975,901 | 39,639,485 | |||||||||
Partners Group Satellite Warehouse S.C.S. +, a, b, c |
Member interest |
03/22/23 | — | 1,061,955 | |||||||||
PG Investment Company 18 S.à.r.l. +, a, b, e |
Preferred equity |
07/07/22 | 113,856,528 | 167,783,721 | |||||||||
PG Investment Company 18 S.à.r.l. +, a, b, e |
Common equity |
07/07/22 | 12,650,106 | 54,148,338 | |||||||||
PG Investment Company 24 S.à.r.l. +, a, b, e |
Common equity |
07/13/22 | 889,862 | 11,028,453 | |||||||||
PG Investment Company 24 S.à.r.l. +, a, b, e |
Preferred equity |
07/13/22 | 101,367,616 | 141,939,004 | |||||||||
PG Investment Company 60 S.à r.l. +, a, b, e |
Common equity |
01/31/24 | 109,610 | 485,577 | |||||||||
PG Investment Company 60 S.à r.l. +, a, b, e |
Preferred equity |
01/31/24 | 269,765 | 6,349,707 | |||||||||
PG Investment Company 67 S.à.r.l. +, a, e |
Preferred equity |
07/16/24 | 9,255,649 | 10,693,404 | |||||||||
PG Investment Company 67 S.à.r.l. +, a, e |
Common equity |
07/16/24 | 1,029,239 | 1,189,119 | |||||||||
PG Investment Company 69 S.à.r.l. +, a |
Preferred equity |
07/16/24 | 301,734 | 347,840 | |||||||||
PG Investment Company 69 S.à.r.l. +, a |
Common equity |
07/16/24 | 533,864 | 615,712 | |||||||||
PG Investment Company 71 S.à.r.l. +, a, e |
Common equity |
09/26/24 | 6,385,371 | 6,841,302 | |||||||||
PG Investment Company 76 S.à.r.l. +, a, e |
Common equity |
09/03/24 | 360,670 | 1 | |||||||||
PG Investment Company 76 S.à.r.l. +, a, b, e |
Preferred equity |
09/03/24 | 43,748,069 | 47,907,474 | |||||||||
The accompanying notes are an integral part of these Consolidated Financial Statements.
15
Partners Group Private Equity (Master Fund), LLC
(a Delaware Limited Liability Company)
Consolidated Schedule of Investments –
March 31, 2025 (continued)
Private Equity Investments (continued) Direct Equity (continued) |
Investment Type |
Acquisition |
Shares |
Fair |
|||||||||
Western Europe (continued) |
|||||||||||||
PG Lion Management Warehouse S.C.S +, a, b, c |
Limited partnership interest |
08/22/19 | — | $ | 64,839 | ||||||||
PG Polaris TopCo S.à r.l. +, a, e |
Common equity |
03/27/24 | 1,941,043 | 15,921,982 | |||||||||
PG Polaris TopCo S.à r.l. +, a |
Preferred equity |
03/27/24 | 36,879,822 | 31,736,412 | |||||||||
PG Polaris Warehouse SCSp +, a, c |
Limited partnership interest |
03/27/24 | — | 1,063,405 | |||||||||
PG TLP S.à.r.l. +, a, b, c, e |
Member interest |
04/14/21 | — | 61,903,419 | |||||||||
PG TLP S.à.r.l. +, a, b, e |
Common equity |
04/14/21 | 6,473,126 | 79,661,677 | |||||||||
PG Wave Limited +, a, b, e |
Common equity |
02/03/22 | 53,215,581 | 103,594,992 | |||||||||
Pharmathen GP S.à.r.l. +, a, b |
Common equity |
01/20/22 | 110,300 | 1 | |||||||||
Pharmathen Topco S.à r.l. +, a, b |
Preferred equity |
02/21/25 | 3,560,390 | 3,964,237 | |||||||||
Pharmathen Topco S.à.r.l. +, a, b |
Preferred equity |
01/20/22 | 98,858,068 | 128,441,484 | |||||||||
Pharmathen Topco S.à.r.l. +, a, b |
Common equity |
01/20/22 | 79,910 | 1 | |||||||||
Polyusus Lux XVI S.à.r.l. +, a, b, e |
Common equity |
05/23/18 | 44,442,345 | — | |||||||||
Polyusus Lux XVI S.à.r.l. +, a, b, e |
Preferred equity |
07/05/24 | 247,436,062 | 2,998,139 | |||||||||
Polyusus Lux XVI S.à.r.l. +, a, b, c |
Member interest |
10/03/22 | — | 1 | |||||||||
Polyusus Lux XVI S.à.r.l. +, a, b, c, e |
Member interest |
10/01/22 | — | 1 | |||||||||
Polyusus Lux XVI S.à.r.l. +, a, b |
Preferred equity |
07/05/24 | 22 | 1 | |||||||||
Polyusus Lux XXIII S.à.r.l. +, a, e |
Preferred equity |
04/11/22 | 1,155,552 | 56,911 | |||||||||
Polyusus Lux XXIII S.à.r.l. +, a |
Common equity |
08/19/21 | 3,936,244 | 46,199 | |||||||||
Polyusus Lux XXIII S.à.r.l. +, a, e |
Preferred equity |
08/19/21 | 1,341,978 | 783,302 | |||||||||
Polyusus Lux XXIII S.à.r.l. +, a, e |
Common equity |
08/19/21 | 447,324 | 165,724 | |||||||||
Polyusus Lux XXIII S.à.r.l. +, a |
Preferred equity |
08/19/21 | 11,772,986 | 218,356 | |||||||||
Quadriga Capital IV Investment Holding II LP +, a, e |
Common equity |
09/28/18 | 238,583 | 2 | |||||||||
Quadriga Capital IV Investment Holding II LP +, a |
Common equity |
09/09/16 | 1,432,376 | 2 | |||||||||
Refresco 2 Co-Invest SCSp +, a, c |
Limited partnership interest |
07/12/22 | — | 51,721,770 | |||||||||
Rivage Luxco S.à.r.l. +, a |
Common equity |
02/22/22 | 450,000 | 58,532,039 | |||||||||
Rivage Luxco S.à.r.l. +, a, e |
Common equity |
06/28/23 | 450,000 | 372,477 | |||||||||
Root JVCo S.à.r.l. +, a, b, c |
Member interest |
09/29/20 | — | 42,403,456 | |||||||||
Root JVCo S.à.r.l. +, a, b |
Common equity |
02/07/23 | 2,362,997 | 26,809,385 | |||||||||
Root JVCo S.à.r.l. +, a, b |
Preferred equity |
02/07/23 | 27,236,127 | 57,671,225 | |||||||||
Strider Investment 2 +, a, e |
Preferred equity |
04/01/23 | 278,539 | 973,946 | |||||||||
Strider Investment 3 +, a, e |
Preferred equity |
04/01/23 | 24,476 | 26,434 | |||||||||
Strider Topco S.a.s. +, a, c |
Member interest |
04/01/23 | — | 4,015,055 | |||||||||
Strider Topco S.a.s. +, a, e |
Common equity |
04/01/23 | 8,138,656 | 28,398,971 | |||||||||
Strider Topco S.a.s. +, a, e |
Preferred equity |
04/01/23 | 52,067,087 | 69,586,241 | |||||||||
Surfaces SLP (SCSp) +, a, b, c |
Limited partnership interest |
10/01/20 | — | 23,277,717 | |||||||||
Vanquish Bidco +, a, c |
Member interest |
05/25/23 | — | 3,893,018 | |||||||||
Vanquish Topco +, a |
Preferred equity |
05/25/23 | 34,851,987 | 33,151,245 | |||||||||
Vanquish Topco +, a |
Common equity |
05/25/23 | 379,731 | 1 | |||||||||
Veonet Co-Invest SCSp (Lux) +, a, c, e |
Limited partnership interest |
03/09/22 | — | 42,495,175 | |||||||||
Zephyr Syndication L.P. +, a, c, e |
Limited partnership interest |
08/08/24 | — | 14,605,252 | |||||||||
Zoncolan Topco S.à.r.l. +, a, b, c |
Member interest |
10/28/21 | — | 57,109,304 | |||||||||
Zoncolan Topco S.à.r.l. +, a, b, e |
Common equity |
10/28/21 | 23,234,622 | 42,249,376 | |||||||||
Zoncolan Topco S.à.r.l. +, a, b, e |
Preferred equity |
08/01/24 | 2,850,750 | 6,116,947 | |||||||||
Total Western Europe (24.15%) |
3,810,293,844 | ||||||||||||
Total Direct Equity (54.88%) |
$ | 8,657,731,423 | |||||||||||
The accompanying notes are an integral part of these Consolidated Financial Statements.
16
Partners Group Private Equity (Master Fund), LLC
(a Delaware Limited Liability Company)
Consolidated Schedule of Investments –
March 31, 2025 (continued)
Private Equity Investments (continued) Direct Debt (8.94%) |
Interest |
Acquisition |
Maturity |
Investment |
Principal |
Fair |
||||||||||||
Asia - Pacific (0.37%) |
||||||||||||||||||
FFML Holdco Limited +, a |
Cash 6.25% + BBSY (0.75% Floor)†† |
11/30/22 | 11/30/28 | Senior |
$ | 11,564,338 | $ | 10,508,855 | ||||||||||
Fugue Finance B.V. +, a |
Cash 4.50% + SF (0.50% Floor)vv |
03/10/23 | 01/31/28 | Senior |
5,433,680 | 5,434,957 | ||||||||||||
Fugue Finance B.V. +, a |
Cash 3.75% + SFvv |
03/06/24 | 02/26/31 | Senior |
7,960,000 | 7,961,871 | ||||||||||||
Fugue Finco Pty Ltd. +, a, e |
Cash 5.75% + BBSY†† |
04/10/24 | 04/10/30 | Senior |
966,531 | 883,528 | ||||||||||||
Fugue Finco Pty Ltd. +, a |
Cash 5.75% + BBSY†† |
04/10/24 | 05/30/30 | Senior |
3,621,280 | 3,430,340 | ||||||||||||
Fugue NZ Bidco Limited +, a |
Cash 5.75% + BBSY†† |
04/10/24 | 05/30/30 | Senior |
2,370,912 | 2,219,194 | ||||||||||||
Global Academic Group Limited +, a |
Cash 6.00% + BBSY (0.50% Floor)†† |
07/26/22 | 07/26/27 | Senior |
12,728,400 | 11,541,103 | ||||||||||||
Global Academic Group Limited +, a |
Cash 4.91% + BBSY †† |
01/30/25 | 07/26/27 | Senior |
653,208 | 652,762 | ||||||||||||
Global Academic Group Limited +, a, e |
Cash 6.00% + BBSY (0.50% Floor)† |
07/26/22 | 07/26/27 | Senior |
395,158 | 396,937 | ||||||||||||
Global Academic Group Limited +, a |
Cash 6.00% + BBSY (0.50% Floor)†† |
07/29/22 | 07/29/27 | Senior |
4,651,970 | 4,155,599 | ||||||||||||
Greencross Limited +, a |
Cash 5.75% + BBSY (0.75% Floor)†† |
09/30/24 | 03/23/28 | Senior |
9,386,799 | 8,397,309 | ||||||||||||
Snacking Investments BidCo Pty Limited +, a |
Cash 4.00% + SF (1.00% Floor)v |
01/15/20 | 12/18/26 | Senior |
1,235,000 | 1,241,947 | ||||||||||||
Voyage Australia Pty Ltd +, a |
Cash 3.50% + SF (0.50% Floor)vv |
07/23/21 | 06/18/28 | Senior |
1,640,500 | 1,646,143 | ||||||||||||
Total Asia - Pacific (0.37%) |
58,470,545 | |||||||||||||||||
North America (5.45%) |
||||||||||||||||||
Acrisure, LLC +, a |
Cash 3.50% + SFv |
03/27/20 | 02/15/27 | Senior |
13,661,512 | 13,593,204 | ||||||||||||
Aimbridge Acquisition Co., Inc. +, a |
Cash 3.75% + SFvv |
04/26/23 | 02/02/26 | Senior |
4,429,930 | 4,083,976 | ||||||||||||
Aimbridge Acquisition Co., Inc. +, a |
Cash 5.5% + SFvv |
03/20/25 | 03/11/30 | Senior |
401,995 | 562,082 | ||||||||||||
Air Medical Group Holdings, Inc. +, a |
Cash 4.25% + SF (1.00% Floor)vv |
02/25/21 | 10/02/25 | Senior |
7,978,852 | 7,987,709 | ||||||||||||
AlixPartners, LLP +, a |
Cash 2.50% + SF (0.50% Floor)v |
06/12/24 | 02/04/28 | Senior |
4,948,444 | 4,952,230 | ||||||||||||
Alliant Holdings Intermediate, LLC +, a |
Cash 3.50% + SF (0.50% Floor)v |
12/08/21 | 11/05/27 | Senior |
1,272,014 | 1,268,788 | ||||||||||||
Allied Universal Holdco LLC +, a |
Cash 3.75% + SFv |
06/12/24 | 05/12/28 | Senior |
— | — | ||||||||||||
Alter Domus +, a, e |
01/31/25 | 10/30/31 | Senior |
— | — | |||||||||||||
American Airlines, Inc. +, a |
Cash 2.50% + SFvv |
09/06/24 | 06/04/29 | Senior |
4,950,000 | 4,891,837 | ||||||||||||
Amneal Pharmaceuticals, Inc. +, a, e |
Cash 5.50% + SFv |
06/03/22 | 05/04/25 | Senior |
8,146,744 | 8,302,061 | ||||||||||||
Apex Tool Group +, a |
Cash 5.25% + SF (0.50% Floor)v |
02/22/22 | 02/08/29 | Senior |
3,194,643 | 2,204,304 | ||||||||||||
Apro, LLC +, a |
Cash 3.75% + SFvv |
06/26/24 | 07/09/31 | Senior |
3,283,500 | 3,277,360 | ||||||||||||
Aptean, Inc +, a, e |
Cash 4.75% + SF (0.75% Floor)vv |
01/30/24 | 01/30/31 | Senior |
1,037,286 | 1,037,286 | ||||||||||||
Aptean, Inc +, a |
Cash 4.75% + SF (0.75% Floor)vv |
01/30/24 | 01/30/31 | Senior |
7,047,349 | 7,047,349 | ||||||||||||
AQA Acquisition Holding, Inc. +, a |
Cash 4.25% + SF (0.50% Floor)vv |
03/18/21 | 03/03/28 | Senior |
— | 1 | ||||||||||||
ArchKey Solutions +, a, e |
12/11/24 | 10/10/31 | Senior |
— | — | |||||||||||||
athenahealth Group, Inc. +, a |
Cash 3.25% + SF (0.50% Floor)vv |
02/23/22 | 02/15/29 | Senior |
10,562,183 | 10,475,309 | ||||||||||||
Banff Merger Sub Inc. +, a |
Cash 4.25% + SFvv |
01/31/22 | 10/02/25 | Senior |
4,361,843 | 4,296,677 | ||||||||||||
Barracuda Networks, Inc. +, a |
Cash 7.00% + SF (0.50% Floor)vvv |
05/17/22 | 08/15/30 | Second Lien |
2,000,000 | 1,395,000 | ||||||||||||
Bausch & Lomb Inc. +, a |
Cash 3.25% + SF (0.50% Floor)vv |
05/18/22 | 05/10/27 | Senior |
11,156,431 | 11,137,075 | ||||||||||||
Bausch + Lomb Corp. +, a |
Cash 4.00% + SFv |
09/14/23 | 09/14/28 | Senior |
1,970,000 | 1,970,010 | ||||||||||||
BCPE Empire Holdings, Inc. +, a |
Cash 4.00% + SF (0.50% Floor)v |
06/07/23 | 12/11/28 | Senior |
2,261,489 | 2,234,476 | ||||||||||||
Bella Holding Company, LLC +, a, e |
Cash 3.75% + SF (0.75% Floor)v |
05/13/21 | 04/01/28 | Senior |
5,453,946 | 5,449,774 | ||||||||||||
BI Gen Holdings, Inc. +, a |
Cash 5.00% + SFvv |
10/04/18 | 09/05/25 | Senior |
5,457,842 | 5,486,605 | ||||||||||||
Blackhawk Network Holdings, Inc. +, a |
Cash 5.00% + SF (1.00% Floor)v |
03/18/24 | 02/27/29 | Senior |
6,153,578 | 6,143,670 | ||||||||||||
The accompanying notes are an integral part of these Consolidated Financial Statements.
17
Partners Group Private Equity (Master Fund), LLC
(a Delaware Limited Liability Company)
Consolidated Schedule of Investments –
March 31, 2025 (continued)
Private Equity Investments (continued) Direct Debt (continued) |
Interest |
Acquisition |
Maturity |
Investment |
Principal |
Fair |
||||||||||||
North America (continued) |
||||||||||||||||||
BlueConic Holding, Inc. +, a |
Cash 6.50% + SF (0.75% Floor)vv |
01/27/22 | 01/27/28 | Senior |
$ | 18,912,000 | $ | 18,861,798 | ||||||||||
BlueConic Holding, Inc. +, a |
Cash 6.50% + SF (0.75% Floor)vv |
06/13/23 | 01/27/28 | Senior |
7,092,000 | 7,073,174 | ||||||||||||
Brand Industrial Services, Inc. +, a, f |
Cash 4.50% + SF (0.50% Floor)vv |
04/19/24 | 08/01/30 | Senior |
6,805,838 | 6,445,515 | ||||||||||||
Brown Group Holding, LLC +, a |
Cash 3.00% + SF (0.50% Floor)vv |
06/09/22 | 07/02/29 | Senior |
2,165,884 | 2,153,929 | ||||||||||||
Brown Group Holding, LLC +, a |
Cash 2.75% + SFvv |
05/23/24 | 06/07/28 | Senior |
2,976,794 | 2,964,500 | ||||||||||||
Cablevision Lightpath LLC +, a |
Cash 3.25% + SFv |
05/29/24 | 11/30/27 | Senior |
7,937,824 | 7,939,808 | ||||||||||||
Calpine Corporation +, a, e |
Cash 2.00% + SFv |
06/14/24 | 01/31/31 | Senior |
9,950,000 | 9,928,209 | ||||||||||||
Campaign Monitor (UK) Limited +, a |
Cash 8.90% + SF (1.00% Floor)vv; PIK 14.795% |
01/01/21 | 11/06/26 | Second Lien |
223,688 | 200,796 | ||||||||||||
Campaign Monitor (UK) Limited +, a |
Cash 8.90% + SF (1.00% Floor)vv |
01/01/21 | 11/06/26 | Second Lien |
1,789,508 | 1,606,369 | ||||||||||||
CapitalSpring Finance Company, LLC +, a, b |
PIK 5.00% |
03/01/17 | 02/10/25 | Mezzanine |
2,996,971 | 2,957,299 | ||||||||||||
Carestream Dental Technology, Inc. +, a |
Cash 6.25% + SFv |
08/30/24 | 08/30/30 | Senior |
3,513,857 | 3,538,805 | ||||||||||||
CD&R Hydra Buyer, Inc. +, a |
Cash 4.00% + SFv |
03/15/24 | 03/25/31 | Senior |
1,782,000 | 3,630,438 | ||||||||||||
Cedar Fair, L.P. +, a |
Cash 2.00% + SFv |
05/23/24 | 05/01/31 | Senior |
2,977,500 | 2,972,289 | ||||||||||||
Central Parent LLC +, a |
Cash 3.25% + SFvv |
12/11/24 | 07/06/29 | Senior |
568,571 | 1,720,040 | ||||||||||||
Charlotte Buyer Inc +, a |
Cash 5.25% + SF (0.50% Floor)vv |
08/16/22 | 02/11/28 | Senior |
4,046,555 | 4,028,507 | ||||||||||||
Charter NEX US, Inc. +, a |
Cash 3.50% + SF (0.75% Floor)v |
05/31/19 | 12/01/27 | Senior |
1,401,599 | 1,400,920 | ||||||||||||
Checkers Drive-in Restaurants, Inc. +, a |
Cash 7.00% + SFvv |
06/16/23 | 06/16/27 | Senior |
4,416 | 4,423 | ||||||||||||
Cheniere Energy Partners +, a |
Cash 3.50% + SF (0.50% Floor)vvvv |
06/09/21 | 06/04/28 | Senior |
7,898,431 | 7,889,190 | ||||||||||||
Clarios Global LP +, a |
Cash 3.00% + E# |
05/16/24 | 04/30/26 | Senior |
7,622,168 | 7,519,009 | ||||||||||||
Clydesdale Acquisition Holdings, Inc. +, a |
Cash 3.675% + SF (0.50% Floor)vv |
04/19/22 | 04/13/29 | Senior |
5,309,787 | 5,292,079 | ||||||||||||
CommScope, Inc. +, a |
Cash 3.25% + SFv |
04/26/19 | 04/06/26 | Senior |
2,231,835 | 2,225,787 | ||||||||||||
ConnectWise, LLC +, a |
Cash 3.50% + SF (0.76% Floor)vv |
10/06/21 | 09/29/28 | Senior |
1,644,750 | 3,631,909 | ||||||||||||
Conservice Midco, LLC +, a |
Cash 4.00% + SFvv |
05/18/20 | 05/13/27 | Senior |
1,624,273 | 1,617,873 | ||||||||||||
Cornerstone Building Brands, Inc. +, a |
Cash 3.25% + SFv |
06/24/24 | 04/12/28 | Senior |
2,969,072 | 2,940,468 | ||||||||||||
Cornerstone Building Brands, Inc. +, a |
Cash 4.50% + SFv |
05/17/24 | 05/15/31 | Senior |
1,691,500 | 1,404,554 | ||||||||||||
Cornerstone OnDemand, Inc. +, a |
Cash 3.75% + SF (0.50% Floor)v |
10/22/21 | 10/16/28 | Senior |
1,164,000 | 1,016,684 | ||||||||||||
Cornerstone OnDemand, Inc. +, a |
Cash 6.00% + SF (1.00% Floor)v |
09/07/23 | 10/16/28 | Senior |
2,947,500 | 2,812,159 | ||||||||||||
Critical Start, Inc. +, a, e |
Cash 6.25% + SF (0.75% Floor)vv |
03/27/23 | 05/17/28 | Senior |
10,168,480 | 8,620,782 | ||||||||||||
Critical Start, Inc. +, a |
Cash 3.125% + SF (0.75% Floor)vv + PIK 3.125% |
03/27/23 | 05/17/28 | Senior |
4,808,645 | 4,711,028 | ||||||||||||
Crown Subsea Communications Holding, Inc. +, a |
Cash 4.75% + SF (0.75% Floor)v |
02/07/24 | 01/30/31 | Senior |
7,363,000 | 7,383,248 | ||||||||||||
CSC Holdings, LLC +, a |
Cash 2.50% + SFv |
08/11/21 | 04/15/27 | Senior |
— | — | ||||||||||||
CSC Holdings, LLC +, a |
Cash 4.50% + SFvv |
12/07/18 | 01/15/26 | Senior |
17 | — | ||||||||||||
Datix Bidco Limited +, a |
Cash 5.50% + S>>> |
04/25/24 | 04/30/31 | Senior |
901,982 | 920,277 | ||||||||||||
Delta TopCo, Inc. +, a |
Cash 3.50% + SFvv |
05/13/24 | 12/24/29 | Senior |
2,878,286 | 2,851,130 | ||||||||||||
Dentive Capital, LLC +, a |
Cash 6.75% + SF (0.75% Floor)vv |
12/23/22 | 12/22/28 | Senior |
9,922,912 | 9,893,812 | ||||||||||||
Dentive Capital, LLC +, a, e |
Cash 6.75% + SF (0.75% Floor)vv |
12/23/22 | 12/22/28 | Senior |
4,371,511 | 5,596,486 | ||||||||||||
Dentive, LLC +, a, e |
Cash 6.75% + SFvv |
05/03/24 | 12/23/28 | Senior |
3,927,307 | 3,915,790 | ||||||||||||
Dexko Global, Inc. +, a |
Cash 3.75% + SF (0.50% Floor)vv |
10/07/21 | 10/04/28 | Senior |
1,556,000 | 1,455,140 | ||||||||||||
DG Investment Intermediate Holdings 2, Inc. +, a |
Cash 3.75% + SF (0.76% Floor)v |
04/23/21 | 03/31/28 | Senior |
9,169,152 | 9,178,688 | ||||||||||||
Dieter’s Metal Fabricating Limited +, a |
Cash 5.25% + SF (1.00% Floor)vv |
12/19/23 | 12/19/29 | Senior |
437,193 | 437,193 | ||||||||||||
Diligent Corporation +, a |
Cash 5.00% + SFvv + PIK 3.00% |
05/02/24 | 08/02/30 | Senior |
3,575,690 | 3,546,067 | ||||||||||||
The accompanying notes are an integral part of these Consolidated Financial Statements.
18
Partners Group Private Equity (Master Fund), LLC
(a Delaware Limited Liability Company)
Consolidated Schedule of Investments –
March 31, 2025 (continued)
Private Equity Investments (continued) Direct Debt (continued) |
Interest |
Acquisition |
Maturity |
Investment |
Principal |
Fair |
||||||||||||
North America (continued) |
||||||||||||||||||
Diligent Corporation +, a, e |
Cash 5.00% + SFvv |
04/30/24 | 08/04/30 | Senior |
$ | 20,857,887 | $ | 20,842,574 | ||||||||||
Discovery Energy Holding Corporation +, a |
Cash 4.75% + SFv |
05/14/24 | 01/30/31 | Senior |
4,396,553 | 4,330,605 | ||||||||||||
Dwyer Instruments, Inc. +, a, e |
Cash 3.75% + P |
03/31/25 | 07/20/29 | Senior |
1,382,680 | 61,967 | ||||||||||||
Eagle Broadband Investments, LLC +, a, e |
Cash 3.00% + SF (0.75% Floor)vv |
04/24/24 | 11/12/27 | Senior |
4,948,320 | 4,936,469 | ||||||||||||
ECI Macola/Max Holding, LLC +, a |
Cash 3.75% + SF (0.75% Floor)vv |
09/13/21 | 11/09/27 | Senior |
1,636,485 | 1,639,889 | ||||||||||||
Element Materials Technology +, a, e |
Cash 4.25% + SF (0.50% Floor)vv |
08/17/22 | 06/22/29 | Senior |
1,863,768 | 1,863,181 | ||||||||||||
Element Materials Technology +, a, e |
Cash 4.25% + SFvv |
08/17/22 | 06/22/29 | Senior |
4,038,165 | 4,036,893 | ||||||||||||
Endurance International Group Holdings, Inc. +, a |
Cash 3.50% + SF (0.75% Floor)vv |
04/28/21 | 02/10/28 | Senior |
2,049,998 | 1,393,999 | ||||||||||||
Engineered Machinery Holdings, Inc. +, a |
Cash 3.75% + SF (0.75% Floor)vv |
08/16/21 | 05/21/28 | Senior |
1,548,000 | 1,550,786 | ||||||||||||
Epiq Systems +, a |
Cash 4.75% + SF (0.75% Floor)v |
06/02/22 | 04/26/29 | Senior |
6,887,157 | 6,841,530 | ||||||||||||
Evergreen Services Group, LLC +, a |
Cash 6.25% + SF (0.75% Floor)vv |
06/15/22 | 06/15/29 | Senior |
13,912,398 | 13,869,404 | ||||||||||||
Evergreen Services Group, LLC +, a, e |
Cash 5.75% + SFvv |
02/26/24 | 06/15/29 | Senior |
3,995,578 | 3,983,231 | ||||||||||||
Fiesta Purchaser, Inc. +, a |
Cash 4.00% + SFv |
02/15/24 | 02/12/31 | Senior |
6,252,829 | 6,206,589 | ||||||||||||
Filtration Group Corp. +, a |
Cash 3.50% + SF (0.50% Floor)v |
11/01/21 | 10/21/28 | Senior |
2,031,750 | 2,032,553 | ||||||||||||
Flynn Restaurant Group LP +, a |
Cash 4.25% + SF (0.50% Floor)vv |
12/10/21 | 11/22/28 | Senior |
3,308,456 | 3,313,998 | ||||||||||||
Foundation Building Materials, Inc. +, a |
Cash 4.00% + SFv |
03/06/24 | 01/29/31 | Senior |
3,857,437 | 5,370,411 | ||||||||||||
Global Medical Response, Inc. +, a, f |
Cash 4.75% + SFvv |
04/18/24 | 10/31/28 | Senior |
2,787,709 | 2,782,723 | ||||||||||||
Global Medical Response, Inc. +, a |
Cash 4.25% + SF (1.00% Floor)vv |
03/27/24 | 10/31/28 | Senior |
3,003,903 | 3,007,237 | ||||||||||||
GoTo Group, Inc. +, a |
Cash 4.75% + SFv |
02/05/24 | 04/30/28 | Senior |
— | 1 | ||||||||||||
Grant Thornton Advisors LLC +, a |
Cash 3.25% + SFvv |
06/05/24 | 06/02/31 | Senior |
3,880,524 | 3,862,461 | ||||||||||||
GTCR W Merger Sub, LLC +, a |
Cash 3.00% + SFvv |
02/06/24 | 01/31/31 | Senior |
1,795,500 | 1,785,966 | ||||||||||||
Gurobi Optimization, LLC +, a, e |
Cash 4.75% + SFvv |
09/10/24 | 09/10/31 | Senior |
8,463,615 | 8,331,363 | ||||||||||||
Hanger, Inc. +, a, e |
11/12/24 | 10/23/31 | Senior |
— | — | |||||||||||||
Heartland Dental Holdings, Inc. +, a |
Cash 5.00% + SF (0.75% Floor)vv |
05/15/18 | 04/28/28 | Senior |
8,396,497 | 8,464,591 | ||||||||||||
Heartland Home Services, Inc. +, a |
Cash 6.75% + SF (1.00% Floor)vv |
11/08/22 | 12/15/26 | Senior |
11,760,000 | 11,542,485 | ||||||||||||
Help/Systems Holdings, Inc. +, a |
Cash 6.75% + SF (0.75% Floor)v |
11/05/21 | 11/19/27 | Second Lien |
3,600,000 | 2,507,994 | ||||||||||||
Help/Systems Holdings, Inc. +, a |
Cash 4.00% + SF (1.00% Floor)v |
05/25/21 | 11/19/26 | Senior |
4,030,303 | 3,699,818 | ||||||||||||
High Bar Brands Operating LLC +, a, e |
Cash 5.25% + SF (1.00% Floor)vv |
12/19/23 | 12/19/29 | Senior |
370,031 | 370,031 | ||||||||||||
High Bar Brands Operating, LLC +, a, e |
Cash 5.25% + SF (1.00% Floor)vv |
12/19/23 | 12/19/29 | Senior |
2,535,720 | 2,163,486 | ||||||||||||
Howden Group Holdings Ltd. +, a |
Cash 4.00% + SF (0.50% Floor)vv |
02/14/24 | 04/18/30 | Senior |
1,378,894 | 1,380,432 | ||||||||||||
Hub International Ltd. +, a |
Cash 3.25% + SF (0.75% Floor)vv |
06/08/23 | 06/20/30 | Senior |
1,086,312 | 1,083,319 | ||||||||||||
Husky Injection Molding Systems Ltd. +, a |
Cash 5.00% + SFvvv |
02/01/24 | 02/01/29 | Senior |
2,481,250 | 2,473,757 | ||||||||||||
Husky Injection Molding Systems Ltd. +, a |
Cash 9.00% |
02/01/24 | 02/15/29 | Senior |
200,000 | 203,161 | ||||||||||||
Idera, Inc. +, a, b |
Cash 3.50% + SF (0.75% Floor)vv |
12/17/18 | 03/02/28 | Senior |
1,223,033 | 1,136,766 | ||||||||||||
Ineos Quattro Holdings UK Limited +, a |
Cash 4.25% + SF (0.50% Floor)v |
03/07/24 | 01/29/26 | Senior |
3,267,000 | 3,152,655 | ||||||||||||
Iris Holdings Inc. +, a |
Cash 4.75% + SF (0.50% Floor)vv |
06/15/22 | 06/28/28 | Senior |
1,802,773 | 5,477,970 | ||||||||||||
Kaman Corporation +, a, e |
03/06/25 | 01/30/32 | Senior |
— | — | |||||||||||||
The accompanying notes are an integral part of these Consolidated Financial Statements.
19
Partners Group Private Equity (Master Fund), LLC
(a Delaware Limited Liability Company)
Consolidated Schedule of Investments –
March 31, 2025 (continued)
Private Equity Investments (continued) Direct Debt (continued) |
Interest |
Acquisition |
Maturity |
Investment |
Principal |
Fair |
||||||||||||
North America (continued) |
||||||||||||||||||
KCIBT Intermediate II, Inc. +, a |
Cash 1.00% + SF (1.00% Floor)vv |
12/23/20 | 06/30/27 | Senior |
$ | — | $ | 1 | ||||||||||
KDC/ONE Development Corporation, Inc. +, a |
Cash 4.50% + SFv |
06/11/24 | 08/15/28 | Senior |
2,200,000 | 2,202,948 | ||||||||||||
Kene Acquisition, Inc. +, a, e |
Cash 5.50% + SF (1.00% Floor)vv |
02/13/24 | 02/07/31 | Senior |
3,951,135 | 3,729,888 | ||||||||||||
Kingpin Intermediate Holdings LLC +, a |
Cash 3.50% + SFvv |
10/05/18 | 02/08/28 | Senior |
8,199,534 | 8,173,952 | ||||||||||||
Knowlton Development Corp. Inc. +, a |
Cash 4.50% + SFv |
06/24/22 | 12/22/25 | Senior |
1,476,919 | 1,478,898 | ||||||||||||
KSLB Holdings, LLC +, a |
Cash 8.75% + SF (1.00% Floor)vv |
01/01/21 | 01/26/28 | Second Lien |
3,212,308 | 2,703,607 | ||||||||||||
Lakeshore Learning Materials, LLC +, a |
Cash 3.50% + SFv |
06/06/24 | 09/29/28 | Senior |
984,681 | 953,910 | ||||||||||||
LBM Acquisition, LLC +, a |
Cash 3.75% + SFv |
08/02/24 | 06/06/31 | Senior |
9,730,130 | 9,021,047 | ||||||||||||
Magenta Buyer LLC +, a |
Cash 1.50% + SFvv; PIK 6.25% |
10/01/24 | 07/27/29 | Senior |
— | 2 | ||||||||||||
Magenta Buyer LLC +, a |
Cash 1.50% + SFvv; PIK 5.50% |
10/01/24 | 07/27/29 | Senior |
971,490 | 8,752 | ||||||||||||
Mamba Purchaser, Inc. +, a |
Cash 3.25% + SF (0.50% Floor)v |
06/07/24 | 10/16/28 | Senior |
2,772,070 | 2,771,488 | ||||||||||||
Maverick Bidco, Inc. +, a |
Cash 6.75% + SF (0.75% Floor)vv |
05/26/21 | 05/18/29 | Second Lien |
6,603,000 | 6,495,701 | ||||||||||||
Max US BidCo, Inc. +, a |
Cash 5.00% + SF (0.50% Floor)vv |
10/11/23 | 10/03/30 | Senior |
4,950,000 | 4,870,825 | ||||||||||||
McAfee Corp. +, a |
Cash 3.50% + E# |
06/07/24 | 03/01/29 | Senior |
10,580,728 | 9,382,541 | ||||||||||||
McAfee Inc. +, a |
Cash 3.75% + SF (0.50% Floor)vv |
03/09/22 | 03/01/29 | Senior |
3,146,614 | 3,016,832 | ||||||||||||
Mitchell International, Inc. +, a |
Cash 3.25% + SFv |
06/21/24 | 06/06/31 | Senior |
4,975,000 | 4,923,807 | ||||||||||||
MJH Healthcare Holdings, LLC +, a |
Cash 3.50% + SF (0.50% Floor)vv |
04/08/22 | 01/28/29 | Senior |
1,649,287 | 1,642,418 | ||||||||||||
Motion Acquisition Limited +, a |
Cash 3.50% + SFvv |
01/24/24 | 11/12/29 | Senior |
2,960,175 | 2,875,070 | ||||||||||||
Naked Juice LLC +, a |
Cash 3.25% + SF (0.50% Floor)vv |
05/23/24 | 01/24/29 | Senior |
1,979,644 | 1,063,059 | ||||||||||||
National Mentor Holdings, Inc. +, a |
Cash 3.75% + SF (0.75% Floor)vv |
04/26/21 | 03/02/28 | Senior |
1,984,930 | 1,928,062 | ||||||||||||
Navicure, Inc. +, a |
Cash 4.00% + SFvv |
11/19/19 | 10/22/26 | Senior |
2,981,643 | 2,974,189 | ||||||||||||
Nelipak Holding Company +, a, e |
Cash 5.50% + SF (1.00% Floor)vv |
04/04/24 | 03/26/31 | Senior |
3,350,915 | 3,318,275 | ||||||||||||
NEP Group, Inc. +, a |
Cash 4.00% + SF (0.50% Floor)vv |
12/06/21 | 08/19/26 | Senior |
1,900,633 | 5,049 | ||||||||||||
NEP Group, Inc. +, a |
Cash 3.25% + SFvv + PIK 1.50% |
02/10/22 | 08/19/26 | Senior |
1,069,776 | 1,000,291 | ||||||||||||
NorthStar Group Services, Inc. +, a |
Cash 4.75% + SFvv |
06/05/24 | 05/08/30 | Senior |
2,878,250 | 2,897,434 | ||||||||||||
NSM Top Holdings Corp. +, a |
Cash 5.25% + SFvv |
11/26/19 | 11/16/26 | Senior |
1,425,338 | 1,435,429 | ||||||||||||
OceanKey (U.S.) II Corp. +, a |
Cash 3.50% + SF (0.05% Floor)vv |
01/06/22 | 12/15/28 | Senior |
2,000,000 | 1,998,360 | ||||||||||||
Olympus Water US Holding Corp. +, a |
Cash 5.00% + SF (1.50% Floor)vv |
05/24/23 | 11/09/28 | Senior |
1,373,677 | 1,354,796 | ||||||||||||
OneDigital Borrower, LLC +, a |
Cash 3.25% + SF (0.50% Floor)v |
06/13/24 | 06/13/31 | Senior |
4,512,130 | 4,488,712 | ||||||||||||
Oscar AcquisitionCo, LLC +, a, e |
Cash 4.50% + SF (0.50% Floor)vv |
02/08/24 | 04/29/29 | Senior |
7,416,340 | 6,960,754 | ||||||||||||
Pactiv Evergreen Inc. +, a |
Cash 2.50% + SFv |
06/12/24 | 09/24/28 | Senior |
1,511,789 | 1,511,207 | ||||||||||||
Pascal Midco 2, LLC +, a |
Cash 5.75% + SF (0.75% Floor)vv |
07/01/22 | 07/21/27 | Senior |
13,472,898 | 13,346,485 | ||||||||||||
PDI TA Holdings, Inc. +, a |
Cash 5.50% + SF (0.75% Floor)vv |
02/06/24 | 02/01/31 | Senior |
6,451,509 | 6,419,251 | ||||||||||||
PDI TA Holdings, Inc. +, a, e |
Cash 5.50% + SF (0.75% Floor)vv |
02/01/24 | 02/03/31 | Senior |
1,676,603 | 1,761,795 | ||||||||||||
Pediatric Associates Holding Company, LLC +, a |
Cash 3.25% + SFvv |
08/05/24 | 12/29/28 | Senior |
3,959,184 | 3,700,847 | ||||||||||||
Peraton Corp. +, a |
Cash 3.75% + SF (0.75% Floor)v |
04/12/21 | 02/01/28 | Senior |
886,611 | 5,326,078 | ||||||||||||
PetSmart LLC +, a |
Cash 3.75% + SF (0.75% Floor)v |
05/22/24 | 02/11/28 | Senior |
5,953,728 | 5,874,335 | ||||||||||||
Pre-Paid Legal Services, Inc. +, a, e |
Cash 3.75% + SF (0.50% Floor)v |
01/18/22 | 12/15/28 | Senior |
10,675,568 | 10,588,829 | ||||||||||||
Pre-Paid Legal Services, Inc. +, a |
Cash 3.75% + SF (0.50% Floor)v |
01/18/22 | 12/14/29 | Senior |
— | — | ||||||||||||
Premier Care Dental Management, LLC +, a, e |
Cash 5.25% + SFv |
05/31/24 | 08/05/28 | Senior |
7,651,248 | 3,979,737 | ||||||||||||
Pretium PKG Holdings, Inc. +, a |
Cash 6.75% + SF (0.50% Floor)vv |
10/05/21 | 10/01/29 | Second Lien |
1,800,000 | 423,747 | ||||||||||||
Primary Products Finance, LLC +, a, e |
Cash 3.50% + SF (0.50% Floor)vv |
06/06/24 | 04/01/29 | Senior |
2,574,033 | 2,561,626 | ||||||||||||
ProAmpac PG Borrower, LLC +, a |
Cash 4.50% + SF (0.75% Floor)vv |
09/26/23 | 09/15/28 | Senior |
1,982,743 | 1,979,441 | ||||||||||||
The accompanying notes are an integral part of these Consolidated Financial Statements.
20
Partners Group Private Equity (Master Fund), LLC
(a Delaware Limited Liability Company)
Consolidated Schedule of Investments –
March 31, 2025 (continued)
Private Equity Investments (continued) Direct Debt (continued) |
Interest |
Acquisition |
Maturity |
Investment |
Principal |
Fair |
||||||||||||
North America (continued) |
||||||||||||||||||
Project Alpha Intermediate Holding, Inc. +, a |
Cash 4.75% + SF (0.50% Floor)vv |
10/31/23 | 10/28/30 | Senior |
$ | 6,336,160 | $ | 6,331,123 | ||||||||||
Project Boost Purchaser, LLC +, a, e |
Cash 3.50% + SFvv |
07/29/24 | 07/16/31 | Senior |
— | 1 | ||||||||||||
Project Leopard Holdings, Inc. +, a |
Cash 5.25% + SF (0.50% Floor)vv |
06/15/22 | 07/20/29 | Senior |
2,730,384 | 2,374,164 | ||||||||||||
Prometric Holdings PIK, Inc. +, a |
Cash 7.50% + SF (1.00% Floor)vv; PIK 9.25% |
10/06/23 | 07/31/28 | Mezzanine |
8,286,825 | 8,544,821 | ||||||||||||
Prometric Holdings, Inc. +, a |
Cash 3.00% + SF (1.00% Floor)v |
10/26/23 | 01/31/28 | Senior |
5,820,874 | 5,857,255 | ||||||||||||
PT Intermediate Holdings III, LLC +, a |
Cash 3.25% + SFvv + PIK 1.75% |
04/09/24 | 04/09/30 | Senior |
27,321,430 | 27,321,430 | ||||||||||||
PT Intermediate Holdings III, LLC +, a, e |
Cash 6.75% + SFvv + PIK 1.75% |
04/09/24 | 04/09/30 | Senior |
570,975 | 570,975 | ||||||||||||
Radiology Partners, Inc. +, a |
Cash 4.00% + SFvv |
01/01/21 | 01/31/29 | Senior |
2,156,078 | 2,088,701 | ||||||||||||
Radwell Parent, LLC +, a, e |
Cash 5.50% + SF (0.75% Floor)vv |
12/01/22 | 04/01/29 | Senior |
1,120,924 | 304,059 | ||||||||||||
Radwell Parent, LLC +, a |
Cash 6.525% + SF (0.75% Floor)vv |
04/06/22 | 04/01/29 | Senior |
13,827,852 | 13,827,852 | ||||||||||||
Radwell Parent, LLC +, a |
Cash 6.75% + SF (0.75% Floor)vv |
12/01/22 | 04/01/29 | Senior |
5,866,450 | 5,866,450 | ||||||||||||
Rand Parent, LLC +, a, e |
Cash 3.75% + SFvv |
08/09/24 | 03/17/30 | Senior |
2,574,016 | 5,491,012 | ||||||||||||
Raptor Parent, LLC +, a, e |
Cash 6.525% + SF (0.75% Floor)vv |
04/06/22 | 04/01/29 | Senior |
1,526,914 | 1,526,914 | ||||||||||||
Recess Holdings, Inc. +, a |
Cash 4.50% + SF (1.00% Floor)vv |
03/01/24 | 02/20/30 | Senior |
6,352,000 | 6,352,667 | ||||||||||||
Recorded Books Inc. +, a, d |
Cash 4.00% + SFv |
06/17/22 | 08/29/25 | Senior |
— | — | ||||||||||||
Red Planet Borrower, LLC +, a |
Cash 3.75% + SF (0.50% Floor)v |
10/04/21 | 10/02/28 | Senior |
6,065,553 | 6,693,050 | ||||||||||||
Redstone Holdco 2 L.P. +, a |
Cash 4.75% + SF (0.75% Floor)vv |
05/10/21 | 04/27/28 | Senior |
1,083,705 | 599,234 | ||||||||||||
Redstone Holdco 2 L.P. +, a, e |
Cash 7.75% + SF (0.75% Floor)vv |
05/03/21 | 04/16/29 | Second Lien |
2,500,000 | 981,250 | ||||||||||||
Rent-A-Center, Inc. +, a |
Cash 2.75% + SF (0.75% Floor)vv |
03/02/21 | 02/17/28 | Senior |
912,374 | — | ||||||||||||
Riverside Assessments, LLC +, a, e |
Cash 5.25% + SFvv |
03/19/24 | 03/19/31 | Senior |
2,787,709 | 2,806,070 | ||||||||||||
RL Datix Holdings (USA), Inc. +, a |
Cash 5.50% + SFvvv |
04/25/24 | 04/30/31 | Senior |
2,399,040 | 2,370,777 | ||||||||||||
Rocket Software, Inc. +, a |
Cash 4.25% + SF (0.00% Floor)v |
12/05/18 | 11/28/28 | Senior |
— | — | ||||||||||||
Rough Country, LLC +, a |
Cash 3.50% + SF (0.75% Floor)v |
08/03/21 | 07/26/28 | Senior |
1,833,197 | 1,795,387 | ||||||||||||
Ryan LLC +, a, e |
Cash 4.50% + SF (0.50% Floor)v |
11/20/23 | 11/14/30 | Senior |
151,997 | 151,759 | ||||||||||||
Ryan, LLC +, a, e |
Cash 4.50% + SF (0.50% Floor)v |
11/20/23 | 11/14/30 | Senior |
661,289 | 3,882,902 | ||||||||||||
Sabre GLBL Inc. +, a |
Cash 3.50% + SF (0.50% Floor)v |
08/09/21 | 12/17/27 | Senior |
— | — | ||||||||||||
Sandvine Corporation +, a |
Cash 1.00% + SFvv; PIK 5.00% |
03/03/25 | 03/01/30 | Senior |
593,695 | 588,582 | ||||||||||||
Sauer Brands +, a, e |
03/04/25 | 02/19/32 | Senior |
— | — | |||||||||||||
Sedgwick Claims Management Services, Inc. +, a, f |
Cash 3.75% + SFvv |
08/09/24 | 02/24/28 | Senior |
1,741,250 | 8,423,691 | ||||||||||||
Senneca Holdings, Inc. +, a |
PIK 10.00% |
01/01/21 | 11/11/25 | 1.5 Lien |
1,490,000 | 1 | ||||||||||||
Senneca Holdings, Inc. +, a |
PIK 11.00% |
01/01/21 | 05/11/26 | Second Lien |
— | 2 | ||||||||||||
Senneca Holdings, Inc. +, a, d |
PIK 11.00% |
01/01/21 | 05/11/26 | Second Lien |
1,276,647 | 1 | ||||||||||||
Skopima Consilio Parent LLC +, a |
Cash 4.00% + SF (0.76% Floor)vvvv |
05/18/21 | 04/30/28 | Senior |
12,740,263 | 12,673,121 | ||||||||||||
Sound Inpatient Physicians, Inc. +, a |
Cash 3.50% + SFv |
07/01/24 | 06/28/28 | Senior |
3,034,027 | 3,809,736 | ||||||||||||
Sound Inpatient Physicians, Inc. +, a |
Cash 5.50% + SF (1.00% Floor)vv |
06/04/24 | 06/28/28 | Senior |
578,825 | 602,557 | ||||||||||||
Sovos Compliance, LLC +, a |
Cash 4.50% + SF (0.50% Floor)v |
08/16/21 | 08/11/28 | Senior |
4,618,300 | 4,604,191 | ||||||||||||
SS&C Technologies, Inc. +, a |
Cash 2.00% + SFv |
05/14/24 | 04/29/31 | Senior |
3,405,337 | 3,406,767 | ||||||||||||
SSH Group Holdings, Inc. +, a |
Cash 4.25% + SFvv |
06/05/19 | 07/30/25 | Senior |
7,740,232 | 7,742,283 | ||||||||||||
Star US Bidco, LLC +, a |
Cash 4.25% + SF (1.00% Floor)v |
04/24/20 | 03/17/27 | Senior |
1,825,242 | 1,827,241 | ||||||||||||
Surgery Center Holdings, Inc. +, a |
Cash 3.50% + SFv |
01/02/24 | 12/19/30 | Senior |
890,361 | 890,615 | ||||||||||||
Tacala Investment Corp. +, a |
Cash 4.00% + SF (0.75% Floor)v |
02/08/24 | 01/31/31 | Senior |
2,376,060 | 2,378,365 | ||||||||||||
Tank Holding Corp. +, a, e |
Cash 5.75% + SF (0.75% Floor)vv |
03/31/22 | 03/31/28 | Senior |
20,953,485 | 20,248,511 | ||||||||||||
Telenet Financing USD LLC +, a |
Cash 2.00% + SFv |
04/27/20 | 04/30/28 | Senior |
5,400,000 | 5,239,134 | ||||||||||||
Thevelia (US), LLC +, a |
Cash 3.75% + SFvv |
03/29/23 | 06/18/29 | Senior |
6,784,786 | 6,780,681 | ||||||||||||
Tivity Health Inc +, a |
Cash 6.00% + SF (0.75% Floor)vv |
06/28/22 | 06/28/29 | Senior |
20,439,652 | 20,303,399 | ||||||||||||
The accompanying notes are an integral part of these Consolidated Financial Statements.
21
Partners Group Private Equity (Master Fund), LLC
(a Delaware Limited Liability Company)
Consolidated Schedule of Investments –
March 31, 2025 (continued)
Private Equity Investments (continued) Direct Debt (continued) |
Interest |
Acquisition |
Maturity |
Investment |
Principal |
Fair |
||||||||||||
North America (continued) |
||||||||||||||||||
Tory Burch LLC +, a |
Cash 3.50% + SF (0.50% Floor)v |
04/30/21 | 04/16/28 | Senior |
$ | 962,500 | $ | 959,747 | ||||||||||
Trident TPI Holdings, Inc. +, a |
Cash 4.00% + SF (0.50% Floor)v |
09/22/21 | 09/15/28 | Senior |
1,650,383 | 1,597,653 | ||||||||||||
Trilon Group, LLC +, a |
Cash 6.25% + SF (0.75% Floor)vv |
06/02/22 | 05/27/29 | Senior |
5,119,538 | 5,140,191 | ||||||||||||
Trilon Group, LLC +, a, e |
Cash 6.25% + SF (0.75% Floor)vv |
06/02/22 | 05/27/29 | Senior |
5,132,531 | 5,146,769 | ||||||||||||
Triton Water Holdings, Inc. +, a |
Cash 3.25% + SF (0.50% Floor)vv |
04/19/21 | 03/31/28 | Senior |
1,347,627 | 1,344,359 | ||||||||||||
UKG Inc. +, a |
Cash 3.50% + SF (0.75% Floor)vv |
07/13/20 | 05/04/26 | Senior |
3,919,503 | 3,916,485 | ||||||||||||
UP Education +, a, e |
12/16/24 | 07/29/27 | Senior |
— | — | |||||||||||||
Upstream Newco, Inc. +, a |
Cash 4.25% + SFvv |
08/04/21 | 11/20/26 | Senior |
6,125,783 | 5,076,743 | ||||||||||||
USALCO +, a, e |
10/04/24 | 09/18/31 | Senior |
— | — | |||||||||||||
Utz Quality Foods, LLC +, a |
Cash 3.00% + SFvv |
01/29/21 | 01/20/28 | Senior |
2,932,943 | — | ||||||||||||
Verde Purchaser, LLC +, a |
Cash 4.125% |
05/02/24 | 11/15/28 | Senior |
5,000,000 | 4,843,667 | ||||||||||||
Verde Purchaser, LLC +, a |
Cash 4.50% + SFvv |
05/10/24 | 11/30/30 | Senior |
6,666,500 | 6,639,934 | ||||||||||||
Virtusa Corp. +, a |
Cash 3.75% + SF (0.75% Floor)vv |
02/28/22 | 02/11/28 | Senior |
3,025,440 | 3,022,611 | ||||||||||||
Vision Solutions, Inc. +, a |
Cash 4.00% + SF (0.75% Floor)vv |
05/06/21 | 04/24/28 | Senior |
3,292,914 | 3,191,723 | ||||||||||||
Vision Solutions, Inc. +, a |
Cash 7.25% + SF (0.75% Floor)vv |
09/07/21 | 04/23/29 | Second Lien |
— | — | ||||||||||||
VS Buyer, LLC +, a |
Cash 3.25% + SFvv |
04/10/20 | 02/28/27 | Senior |
3,800,924 | 3,803,318 | ||||||||||||
Weld North Education LLC +, a, e |
Cash 3.50% + SF (0.75% Floor)vv |
01/06/21 | 12/21/27 | Senior |
8,170,755 | 8,149,307 | ||||||||||||
White Cap Supply Holdings, LLC +, a |
Cash 3.25% + SFv |
06/06/24 | 10/19/29 | Senior |
2,892,750 | 4,460,911 | ||||||||||||
Windsor Holdings III, LLC +, a |
Cash 4.50% + SFv |
08/07/23 | 08/01/30 | Senior |
2,266,674 | 2,247,317 | ||||||||||||
Woof Holdings, Inc. +, a |
Cash 3.75% + SF (0.75% Floor)vv |
09/26/23 | 12/21/27 | Senior |
2,948,810 | 1,568,767 | ||||||||||||
WWEX UNI TopCo Holdings, LLC +, a |
Cash 4.25% + SF (0.75% Floor)vv |
08/03/21 | 07/26/28 | Senior |
2,612,250 | 2,582,314 | ||||||||||||
YI Group Midco, LLC +, a, e |
Cash 5.75% + SF (1.00% Floor)v |
12/01/23 | 12/01/29 | Senior |
6,068,647 | 5,832,065 | ||||||||||||
Zacapa S.à.r.l. +, a |
Cash 4.25% + SF (0.50% Floor)vv |
07/31/18 | 03/22/29 | Senior |
7,618,207 | 7,631,310 | ||||||||||||
Total North America (5.45%) |
859,344,647 | |||||||||||||||||
Rest of World (0.03%) |
||||||||||||||||||
AI Sirona (Luxembourg) Acquisition S.à.r.l. +, a |
Cash 5.00% + E# |
05/17/24 | 09/30/28 | Senior |
5,437,714 | 5,408,863 | ||||||||||||
Total Rest of World (0.03%) |
5,408,863 | |||||||||||||||||
Western Europe (3.09%) |
||||||||||||||||||
AD Education +, a |
PIK 8.50% |
06/21/22 | 03/30/29 | Mezzanine |
14,770,114 | 16,383,962 | ||||||||||||
AEA International Holdings (Luxembourg) S.à.r.l. +, a |
Cash 3.75% + SF (0.50% Floor)vv |
09/15/21 | 09/07/28 | Senior |
2,225,910 | 2,206,433 | ||||||||||||
AI PLEX AcquiCo GmbH +, a |
Cash 5.00% + SFv |
08/23/19 | 07/31/26 | Senior |
4,742,367 | 4,573,420 | ||||||||||||
Albion Financing 3 S.à.r.l +, a |
Cash 5.51% + SF (0.50% Floor)vv |
01/14/22 | 08/17/26 | Senior |
3,908,018 | 3,916,557 | ||||||||||||
Anticimex Global AB +, a |
Cash 3.40% + SFvv |
06/18/24 | 11/16/28 | Senior |
2,673,000 | 5,662,611 | ||||||||||||
Artemis Acquisitions (UK) Limited +, a |
Cash 3.75% + E## |
06/25/24 | 06/26/31 | Senior |
4,000,000 | 4,303,782 | ||||||||||||
Asgard Investments B.V. +, a |
Cash 5.50% + E## |
03/15/22 | 03/15/29 | Senior |
13,721,320 | 13,498,698 | ||||||||||||
Aston Finco S.à.r.l. +, a |
Cash 4.25% + SFv |
11/14/19 | 10/09/26 | Senior |
1,562,887 | 1,494,675 | ||||||||||||
Aston Finco S.à.r.l. +, a |
Cash 8.25% + S> |
10/25/19 | 10/09/27 | Second Lien |
36,733,592 | 33,841,162 | ||||||||||||
Athena Bidco +, a |
Cash 4.00% + E### |
03/06/24 | 04/14/31 | Senior |
3,691,558 | 3,679,147 | ||||||||||||
Athena BidCo GmbH +, a |
Cash 2.75% + E# |
05/22/24 | 03/31/27 | Senior |
264,895 | — | ||||||||||||
Auris Luxembourg III S.à.r.l. +, a, e |
Cash 3.75% + SFvvv |
04/04/19 | 02/27/26 | Senior |
5,247,559 | 5,247,559 | ||||||||||||
Auris Luxembourg III S.à.r.l. +, a |
Cash 4.50% + E### |
06/12/24 | 02/27/26 | Senior |
4,339,194 | 4,326,269 | ||||||||||||
Babar Bidco +, a |
Cash 4.00% + E### |
12/04/20 | 11/17/27 | Senior |
171,647 | 1 | ||||||||||||
Barentz Midco B.V. +, a |
Cash 3.25% + SFvv |
04/29/24 | 03/30/31 | Senior |
2,189,000 | 2,180,332 | ||||||||||||
Biscuit Holding S.A.S +, a, e |
Cash 4.00% + E### |
06/03/24 | 02/12/27 | Senior |
4,325,208 | 4,233,606 | ||||||||||||
BME Group Holding B.V. +, a |
Cash 4.75% + E## |
03/22/24 | 10/30/26 | Senior |
4,324,150 | 3,942,650 | ||||||||||||
CAB +, a |
Cash 3.50% + E## |
06/12/24 | 02/09/28 | Senior |
7,463,202 | 7,168,084 | ||||||||||||
The accompanying notes are an integral part of these Consolidated Financial Statements.
22
Partners Group Private Equity (Master Fund), LLC
(a Delaware Limited Liability Company)
Consolidated Schedule of Investments –
March 31, 2025 (continued)
Private Equity Investments (continued) Direct Debt (continued) |
Interest |
Acquisition |
Maturity |
Investment |
Principal |
Fair |
||||||||||||
Western Europe (continued) |
||||||||||||||||||
Casper Bidco SAS +, a |
Cash 3.75% + E# |
03/01/24 | 03/21/31 | Senior |
$ | 6,305,908 | $ | 6,361,845 | ||||||||||
CD&R Firefly Bidco Limited +, a |
Cash 6.00% + S>> |
08/31/18 | 06/23/25 | Senior |
7,113,072 | 7,116,196 | ||||||||||||
CD&R Firefly Bidco Limited +, a |
Cash 5.75% + S>> |
03/16/24 | 06/21/28 | Senior |
1,907,075 | 1,938,011 | ||||||||||||
CEP V Investment 22 S.à.r.l. (Lux) +, a |
PIK 8.25% + SFv |
02/28/22 | 08/31/30 | Mezzanine |
8,008,804 | 8,008,804 | ||||||||||||
CEP V Investment 22 S.à.r.l. (Lux) +, a |
PIK 8.25% + E### |
02/28/22 | 08/31/30 | Mezzanine |
1,119,808 | 1,090,720 | ||||||||||||
Cidron Kuma 2 S.à.r.l. +, a |
Cash 13.00% + E (0.50% Floor)#### |
01/01/21 | 02/28/26 | Second Lien |
1,353,600 | 1,203,303 | ||||||||||||
Constellation Automotive Group Limited +, a |
Cash 4.75% + S>>> |
09/03/21 | 07/28/28 | Senior |
1,387,192 | 1,288,715 | ||||||||||||
Constellation Automotive Limited +, a |
Cash 7.50% + S> |
10/18/21 | 07/30/29 | Second Lien |
1,372,084 | 1,290,058 | ||||||||||||
Constellation BidCo GmbH +, a |
Cash 5.25% + E## |
10/26/22 | 06/27/29 | Senior |
26,760,488 | 28,650,479 | ||||||||||||
Constellation HoldCo GmbH +, a, e |
Cash 5.15% + E## |
08/08/24 | 08/08/31 | Senior |
1,110,043 | 1,074,393 | ||||||||||||
CTEC III GmbH +, a |
Cash 3.50% + E## |
03/29/18 | 03/16/29 | Senior |
14,737,672 | 14,137,143 | ||||||||||||
DataCo AcquiCo GmbH +, a |
Cash 6.00% + E### |
01/26/24 | 01/31/31 | Senior |
9,473,132 | 9,296,595 | ||||||||||||
Dorna Sports, S.L. +, a |
Cash 3.25% + E### |
06/25/24 | 03/30/29 | Senior |
5,374,619 | 5,410,537 | ||||||||||||
Eagle Bidco Limited +, a |
Cash 3.75% + E# |
09/07/23 | 03/20/28 | Senior |
7,386,454 | 7,434,162 | ||||||||||||
Europa University Education Group +, a |
Cash 3.75% + E### |
06/13/24 | 06/13/31 | Senior |
3,300,000 | 3,584,050 | ||||||||||||
Financiere Astek +, a, e |
Cash 6.50% + E## |
04/25/24 | 04/25/31 | Senior |
1,913,950 | 1,907,659 | ||||||||||||
Financiere Astek +, a |
Cash 6.50% + E## |
04/25/24 | 04/25/31 | Senior |
6,333,943 | 6,367,231 | ||||||||||||
Financiere Mendel +, a |
Cash 3.25% + SFvv |
12/06/23 | 11/12/30 | Senior |
— | — | ||||||||||||
Froneri International Limited +, a, e |
Cash 2.25% + SFv |
07/05/24 | 01/29/27 | Senior |
3,979,221 | 3,959,504 | ||||||||||||
Fusilli AcquiCo S.à.r.l. +, a |
Cash 5.25% + E### |
01/27/22 | 04/12/26 | Senior |
6,845,735 | 6,900,125 | ||||||||||||
Grupo Iberica de Congelados, SA +, a |
Cash 7.12% + E# |
06/28/19 | 11/30/27 | Senior |
453,937 | — | ||||||||||||
Grupo Iberica de Congelados, SA +, a |
Cash 7.75% + E## |
06/28/19 | 11/30/27 | Senior |
507,254 | — | ||||||||||||
Gulfstream Bidco AS +, a |
Cash 5.00% + SFvv |
01/19/24 | 01/19/31 | Senior |
3,676,000 | 3,643,707 | ||||||||||||
HomeVi SAS +, a |
Cash 3.25% + E## |
05/10/24 | 10/31/29 | Senior |
10,533,054 | 10,619,958 | ||||||||||||
Hunter Douglas NV +, a |
Cash 3.50% + SF (0.50% Floor)vv |
03/07/22 | 02/26/29 | Senior |
7,905,892 | 7,596,257 | ||||||||||||
Hunter Holdco 3 Limited +, a, e |
Cash 4.25% + SF (0.50% Floor)vv |
08/26/21 | 08/19/28 | Senior |
10,285,188 | 9,886,636 | ||||||||||||
IGT Holding IV AB +, a |
Cash 5.31% + SF (0.50% Floor)vv |
07/21/21 | 03/31/28 | Senior |
1,824,000 | 1,828,560 | ||||||||||||
Inception Finco S.à r.l. +, a |
Cash 4.50% + SFvv |
03/15/24 | 04/18/31 | Senior |
1,091,750 | 1,094,992 | ||||||||||||
Ineos Quattro Holdings UK Limited +, a |
Cash 3.75% + SFv |
03/17/23 | 03/01/30 | Senior |
1,965,000 | 1,856,925 | ||||||||||||
Infinity Bidco 1 Limited +, a |
Cash 3.40% + E# |
07/03/24 | 07/06/28 | Senior |
3,241,938 | 3,219,414 | ||||||||||||
Lernen Bidco Ltd. +, a |
Cash 4.25% + E### |
06/16/23 | 04/24/29 | Senior |
6,523,196 | 6,507,969 | ||||||||||||
Loire UK Midco 3 Limited +, a |
Cash 3.75% + SF (0.75% Floor)vv |
07/09/21 | 04/21/27 | Senior |
— | — | ||||||||||||
Lorca Holdco Limited +, a |
Cash 3.50% + E### |
07/02/24 | 03/25/31 | Senior |
11,600,226 | 14,351,410 | ||||||||||||
Mar Bidco S.à.r.l. +, a |
Cash 4.25% + SFvv |
07/30/21 | 07/06/28 | Senior |
— | — | ||||||||||||
Matador Bidco S.à.r.l. +, a |
Cash 4.25% + SFv |
08/01/24 | 07/16/29 | Senior |
8,523,676 | 8,523,719 | ||||||||||||
Nobel Bidco B.V. +, a |
Cash 3.50% + E### |
06/12/24 | 09/01/28 | Senior |
5,423,992 | 5,343,982 | ||||||||||||
Nomad Foods Limited +, a |
Cash 3.75% + SF (0.50% Floor)vvv |
12/09/22 | 11/12/29 | Senior |
1,161,379 | 1,161,379 | ||||||||||||
Nord Anglia Education PLC +, a |
PIK 10.50% |
01/13/25 | 01/13/33 | Mezzanine |
11,167,351 | 11,145,082 | ||||||||||||
Nouryon Finance B.V. +, a |
Cash 3.50% + E## |
06/20/24 | 04/03/28 | Senior |
2,100,000 | 2,271,371 | ||||||||||||
Nouryon Finance B.V. +, a |
Cash 4.00% + SFvv |
03/03/23 | 04/03/28 | Senior |
2,370,105 | 2,374,561 | ||||||||||||
One Hotels GmbH +, a |
Cash 4.50% + E## |
06/12/24 | 04/02/31 | Senior |
6,725,751 | 6,730,660 | ||||||||||||
PEARLS (Netherlands) Bidco B.V. +, a |
Cash 4.00% + SFvvv |
03/30/22 | 03/01/29 | Senior |
2,447,803 | 2,417,218 | ||||||||||||
The accompanying notes are an integral part of these Consolidated Financial Statements.
23
Partners Group Private Equity (Master Fund), LLC
(a Delaware Limited Liability Company)
Consolidated Schedule of Investments –
March 31, 2025 (continued)
Private Equity Investments (continued) Direct Debt (continued) |
Interest |
Acquisition |
Maturity |
Investment |
Principal |
Fair |
||||||||||||
Western Europe (continued) |
||||||||||||||||||
PEARLS (Netherlands) Bidco B.V. +, a |
Cash 4.00% + E## |
06/06/24 | 02/26/29 | Senior |
$ | 7,614,628 | $ | 7,521,605 | ||||||||||
Pegasus BidCo B.V. +, a |
Cash 3.75% + SF (0.50% Floor)vv |
02/14/24 | 07/12/29 | Senior |
6,950,009 | 6,950,009 | ||||||||||||
Piolin II S.à.r.l. +, a |
Cash 4.50% + E### |
06/11/24 | 09/16/29 | Senior |
10,240,413 | 10,366,202 | ||||||||||||
Planet US Buyer LLC +, a |
Cash 3.50% + SFvv |
02/20/24 | 02/07/31 | Senior |
2,878,250 | 2,873,760 | ||||||||||||
Platin2025 Acquisition S.à.r.l. +, a |
Cash 3.90% + E## |
05/28/24 | 12/29/28 | Senior |
6,524,382 | 6,469,543 | ||||||||||||
Rainbow Jvco Ltd. +, a |
Cash 7.25% + E##; PIK 7.25% |
02/24/22 | 02/24/30 | Mezzanine |
212,930 | 4,129 | ||||||||||||
Rainbow UK Holdco Limited +, a |
Cash 3.75% + E### |
05/31/24 | 02/26/29 | Senior |
11,935,918 | 11,823,823 | ||||||||||||
RC Acquisition II B.V. +, a |
Cash 6.25% + E## |
12/19/23 | 12/18/30 | Senior |
9,234,378 | 9,078,014 | ||||||||||||
Rohm Holding GmbH +, a |
Cash 4.50% + E### + PIK 0.25% |
06/28/24 | 01/31/29 | Senior |
6,441,470 | 6,222,039 | ||||||||||||
Sapphire Bidco B.V. +, a |
Cash 3.00% + E## |
05/25/18 | 05/03/28 | Senior |
2,271,578 | 2,159,452 | ||||||||||||
Sevetys Invest +, a, e |
Cash 6.25% + E## |
12/16/22 | 08/03/29 | Senior |
17,672,953 | 17,632,378 | ||||||||||||
Sigma Holdco B.V. +, a |
Cash 4.75% + SFvvv |
09/20/23 | 01/02/28 | Senior |
5,890,753 | 5,864,981 | ||||||||||||
Sigma Holdco B.V. +, a |
Cash 4.25% + SFvvv |
08/26/24 | 01/03/28 | Senior |
2,970,266 | 7,031,685 | ||||||||||||
Skywalker BidCo GmbH +, a |
Cash 6.00% + E### |
12/20/23 | 12/20/30 | Senior |
8,763,127 | 8,632,466 | ||||||||||||
Starfruit Finco B.V. +, a, e |
Cash 3.50% + SFvv |
11/14/18 | 10/01/25 | Senior |
2,648,236 | 2,644,925 | ||||||||||||
Summer (BC) Bidco B LLC +, a |
Cash 5.00% + SF (0.75% Floor)vv |
09/08/21 | 12/04/26 | Senior |
965,281 | 965,132 | ||||||||||||
team.blue Finco S.à.r.l. +, a |
Cash 3.20% + E# |
06/25/21 | 03/27/28 | Senior |
11,959,050 | 11,566,068 | ||||||||||||
TK Elevator Midco GmbH +, a |
Cash 3.50% + SF (0.5% Floor)vvv |
03/11/24 | 04/30/30 | Senior |
7,181,486 | 7,169,601 | ||||||||||||
TMF Sapphire Bidco B.V. +, a |
Cash 5.00% + SFvv |
07/25/23 | 05/03/28 | Senior |
1,382,570 | 1,376,238 | ||||||||||||
Virgin Media Bristol LLC +, a |
Cash 3.25% + SFv |
06/25/24 | 01/31/29 | Senior |
10,000,000 | 9,822,750 | ||||||||||||
Virgin Media Bristol, LLC +, a |
Cash 2.50% + SFv |
02/07/18 | 01/31/28 | Senior |
5,486,250 | 5,363,930 | ||||||||||||
ZF Invest +, a |
Cash 3.475% + E## |
06/04/24 | 07/12/28 | Senior |
5,222,419 | 5,162,363 | ||||||||||||
Ziggo Financing Partnership +, a |
Cash 2.50% + SFv |
02/27/20 | 04/30/28 | Senior |
6,000,000 | 5,868,750 | ||||||||||||
Total Western Europe (3.09%) |
486,822,121 | |||||||||||||||||
Total Direct Debt (8.94%) |
$ | 1,410,046,176 | ||||||||||||||||
Total Direct Investments (63.82%) |
$ | 10,067,777,599 | ||||||||||||||||
Secondary Investments *, c (16.94%) |
Acquisition |
Fair |
||||||
Asia - Pacific (1.36%) |
||||||||
Affinity Asia Pacific Fund IV (No.2) L.P. +, a, e |
09/30/24 | $ | 4,657,457 | |||||
Archer Capital Fund 5 +, a, e |
09/30/24 | 58,119 | ||||||
Bain Capital Asia Fund II, L.P. +, a, e |
03/31/25 | 1,013,721 | ||||||
Baring Asia Private Equity Fund IV, L.P. +, a, e |
11/24/09 | 1 | ||||||
Carlyle Asia Partners IV, L.P. +, a, e |
12/31/24 | 1,618,711 | ||||||
Carlyle Asia Partners V, L.P. +, a, e |
12/31/24 | 2,005,515 | ||||||
Crescent Capital Partners IV, LP +, a, e |
09/30/24 | 38,196 | ||||||
CVC Capital Partners Asia Pacific III, L.P. +, a, e |
01/11/13 | 246,272 | ||||||
CVC Capital Partners Asia Pacific IV, L.P. +, a, e |
12/31/24 | 1,786,429 | ||||||
Hony Capital Fund VIII (Cayman), L.P. +, a, e |
12/31/24 | 1,074,388 | ||||||
KKR Asian Fund III L.P. +, a, e |
12/31/24 | 425,374 | ||||||
KV Asia Capital Fund I L.P. +, a, e |
09/30/24 | 1,524,589 | ||||||
MBK Partners Colonel Fund, L.P. +, a, e |
09/20/21 | 79,207,338 | ||||||
Navis Asia Fund VII, L.P. +, a, e |
03/31/25 | 16,958,288 | ||||||
North Haven Private Equity Asia III, L.P. +, a, e |
03/31/25 | 370,393 | ||||||
Primavera Capital Fund III L.P. +, a, e |
12/31/24 | 1,382,779 | ||||||
The Baring Asia Private Equity Fund VII, L.P. +, a, e |
03/31/24 | 5,243,446 | ||||||
Tiara CG Private Equity Fund 2017, L.P. +, a, e |
03/31/25 | 12,243,269 | ||||||
Tiara CG Private Equity Fund 2019, L.P. +, a, e |
03/31/25 | 25,368,422 | ||||||
Tiara CG Private Equity Fund 2019S, L.P. +, a, e |
03/31/25 | 7,201,185 | ||||||
The accompanying notes are an integral part of these Consolidated Financial Statements.
24
Partners Group Private Equity (Master Fund), LLC
(a Delaware Limited Liability Company)
Consolidated Schedule of Investments –
March 31, 2025 (continued)
Private Equity Investments (continued) |
Acquisition |
Fair |
||||||
Asia - Pacific (continued) |
||||||||
TPG Asia VII (B), L.P. +, a, e |
12/07/18 | $ | 16,422,400 | |||||
TRG Growth Partnership (Offshore) II, L.P. +, a, e |
08/02/10 | 17,050 | ||||||
TRG Growth Partnership (Offshore), L.P. +, a, e |
08/02/10 | 1 | ||||||
TRG Growth Partnership II, L.P. +, a, e |
07/08/10 | 41,996 | ||||||
Warburg Pincus China L.P. +, a |
12/31/24 | 1,652,153 | ||||||
Yunfeng Capital Fund III, L.P. +, a, e |
05/18/21 | 28,822,734 | ||||||
Yunfeng Capital Fund IV, L.P. +, a, e |
05/31/21 | 5,219,077 | ||||||
Total Asia - Pacific (1.36%) |
214,599,303 | |||||||
North America (11.64%) |
||||||||
Abingworth Bioventures V, L.P. +, a, e |
06/30/12 | 1 | ||||||
ACP Investment Fund, L.P. +, a |
09/30/24 | 133,418 | ||||||
APH Extended Value Fund H LP (US) +, a, e |
12/13/24 | 33,157,420 | ||||||
Apollo Investment Fund IX, L.P. +, a, e |
01/01/25 | 950,661 | ||||||
Apollo Investment Fund VI, L.P. +, a, e |
01/01/25 | 315,613 | ||||||
Apollo Investment Fund VII, L.P. +, a, e |
07/01/10 | 1 | ||||||
Apollo Overseas Partners (Delaware) VII, L.P. +, a, e |
10/01/09 | 1 | ||||||
Ardian Co-Investment Fund IV +, a, e |
12/31/24 | 4,988,340 | ||||||
Ares Corporate Opportunities Fund V, L.P. +, a, e |
01/01/25 | 1,840,078 | ||||||
Ares PE Extended Value Fund, L.P. +, a, e |
11/14/19 | 37,506,981 | ||||||
Arroyo Investors Fund IV, L.P. +, a, e |
02/25/25 | 5,580,217 | ||||||
ASP SEC Exchange Fund II LP +, a, e |
09/30/24 | 9,735,850 | ||||||
August Capital V Special Opportunities, L.P. +, a, e |
10/01/24 | 76,894 | ||||||
Avenue Golden Continuation Fund PV, L.P. +, a, e |
04/26/22 | 170,494,719 | ||||||
Bain Capital Fund VII, L.P. +, a |
12/31/24 | 331,507 | ||||||
Bain Capital Fund X, L.P. +, a, e |
06/30/11 | 3,306,323 | ||||||
Bain Capital Fund XI, L.P. +, a, e |
12/31/24 | 529,350 | ||||||
Bain Capital Fund XII, L.P. +, a, e |
12/31/24 | 1,117,021 | ||||||
Bain Capital Venture Fund 2009, L.P. +, a, e |
09/30/24 | 58,871 | ||||||
Bain Capital Venture Fund 2012, L.P. +, a |
09/30/24 | 1,843,774 | ||||||
Bain Capital VIII Coinvestment Fund, L.P. +, a, e |
12/31/15 | 1 | ||||||
BC X Private Investors, L.P. +, a, e |
12/31/24 | 452,279 | ||||||
BC XI Private Investor, L.P. +, a, e |
12/31/24 | 1,396,319 | ||||||
Berkshire Fund VIII, L.P. +, a, e |
09/03/21 | 14,042,265 | ||||||
Berkshire Fund VIII, L.P. +, a, e |
09/30/24 | 751,865 | ||||||
Berkshire Fund X-A, L.P. +, a, e |
09/03/21 | 21,802,514 | ||||||
Bertram Growth Capital II-A, L.P. +, a, e |
09/30/15 | 1 | ||||||
Birch Hill Equity Partners (US) IV, LP +, a, e |
01/13/25 | 949,275 | ||||||
Blackstone Capital Partners IV, L.P. +, a, e |
03/31/25 | 11,465 | ||||||
Blackstone Capital Partners V, L.P. +, a, e |
03/31/25 | 10,015 | ||||||
Blackstone Capital Partners VIII +, a, e |
03/31/25 | 1,816,330 | ||||||
Carlyle Partners V, L.P. +, a, e |
12/31/24 | 479,484 | ||||||
Carlyle Partners VII, L.P. +, a, e |
02/15/23 | 31,075,618 | ||||||
Carlyle Partners VIII, L.P. +, a, e |
03/10/23 | 5,389,204 | ||||||
Carlyle Syniverse Co-Investment, L.P. +, a |
12/31/24 | 97,362 | ||||||
CCMP Capital Investors III, L.P. +, a, e |
12/31/24 | 12,562 | ||||||
Centerbridge Seaport Acquisition Fund, L.P. +, a, e |
05/12/22 | 134,001 | ||||||
Clayton, Dubilier & Rice Fund VIII, L.P. +, a, e |
03/29/12 | 2 | ||||||
Clayton, Dubilier & Rice Fund X, L.P. +, a, e |
12/31/24 | 1,045,154 | ||||||
Cortec Group Fund V, L.P. +, a, e |
09/30/24 | 106 | ||||||
Court Square Capital Partners V +, a, e |
12/20/24 | — | ||||||
DST Opportunities Access Offshore L.P. +, a, e |
09/30/20 | 9,301,003 | ||||||
ECP Terra-Gen Growth Fund, L.P. +, a, e |
03/23/21 | 24,788 | ||||||
EETF Sidecar, L.P. +, a, e |
04/30/21 | 5,284,293 | ||||||
EnCap Energy Co-Investment Fund I-C, L.P. +, a, e |
04/30/21 | 790,161 | ||||||
The accompanying notes are an integral part of these Consolidated Financial Statements.
25
Partners Group Private Equity (Master Fund), LLC
(a Delaware Limited Liability Company)
Consolidated Schedule of Investments –
March 31, 2025 (continued)
Private Equity Investments (continued) |
Acquisition |
Fair |
||||||
North America (continued) |
||||||||
EnCap Energy Transition Fund I, L.P. +, a, e |
04/30/21 | $ | 1,889,711 | |||||
Energy Capital Partners Credit Solutions II, L.P. +, a, e |
02/03/21 | 2,646,208 | ||||||
Energy Capital Partners III, L.P. +, a, e |
02/01/21 | 10,316,499 | ||||||
Fengate Everest Continuation Fund L.P. +, a, e |
06/17/24 | 26,199,448 | ||||||
FFL Capital Partners IV +, a, e |
12/31/24 | 1,101,174 | ||||||
FFL Parallel Fund CF, L.P. +, a, e |
12/31/24 | 5,240,694 | ||||||
Frazier Healthcare VI, L.P. +, a |
06/30/12 | 1 | ||||||
FS Equity Partners V, L.P. +, a, e |
08/07/12 | 6 | ||||||
FullBloom +, a |
07/17/19 | 1 | ||||||
GA Continuity Fund I L.P. (Bermuda) +, a, e |
06/30/21 | 90,820,105 | ||||||
General Atlantic Investment Partners 2021, L.P. +, a, e |
07/02/21 | 9,311,600 | ||||||
General Atlantic Investment Partners 2023, L.P. +, a, e |
12/01/22 | 2,677,561 | ||||||
Genstar Capital Partners IX, L.P. +, a, e |
03/31/24 | 2,718,077 | ||||||
Genstar Capital Partners V, L.P. +, a, e |
09/30/15 | 1 | ||||||
Genstar IX Opportunities Fund I +, a, e |
03/31/24 | 1,339,170 | ||||||
Gores Capital Partners III, L.P. +, a, e |
01/01/25 | 148,052 | ||||||
Green Equity Investors Side CF, L.P. +, a, e |
04/16/21 | 46,986,232 | ||||||
Gridiron Energy Feeder I, L.P. +, a, e |
05/15/17 | 36,119,837 | ||||||
Gridiron Energy, LLC +, a |
10/01/24 | 18,437,834 | ||||||
Gryphon Partners 3.5, L.P. +, a, e |
05/21/13 | 66,069 | ||||||
Gryphon Partners IV L.P. +, a, e |
02/08/16 | 14,325,478 | ||||||
H.I.G. Bayside Debt & LBO Fund II, L.P. +, a, e |
12/30/10 | 120,183 | ||||||
Icon Partners IV, L.P. +, a, e |
05/26/21 | 34,677,843 | ||||||
Icon Partners V, L.P. +, a, e |
12/27/21 | 102,612,997 | ||||||
Index Ventures Life VI (Jersey), L.P. +, a, e |
09/30/24 | 570,684 | ||||||
Insight Venture Partners Continuation Fund, L.P. +, a, e |
09/09/19 | 51,898,337 | ||||||
Investcorp Technology Partners III (Cayman), L.P. +, a, e |
08/19/11 | 1 | ||||||
J.C. Flowers III-B L.P. +, a, e |
12/31/24 | 39,298 | ||||||
J.C. Flowers IV L.P. +, a, e |
12/31/24 | 935,092 | ||||||
JVP International 2019E, L.P. +, a |
12/31/24 | 1,430,494 | ||||||
JVP Media V, L.P. +, a |
12/31/24 | 882,770 | ||||||
JVP VII Opportunity, L.P. +, a, e |
12/31/24 | 3,890,093 | ||||||
KKR Americas Fund XII (EEA) L.P. +, a, e |
12/31/24 | 2,422,383 | ||||||
KKR Associates Indigo Equity Partners, L.P. +, a |
06/09/22 | 140,391,316 | ||||||
KSL Capital Partners CV I, L.P. +, a, e |
05/23/22 | 62,413,813 | ||||||
Lee Equity Partners II, L.P. +, a, e |
06/30/17 | 5,664,683 | ||||||
Lee Equity Partners Realization Fund, L.P. +, a |
06/30/17 | 3,121,331 | ||||||
LEP Captive Co-Invest II, L.P. +, a |
07/01/22 | 18,928,283 | ||||||
LS Power Equity Partners III Feeder 1, L.P. +, a, e |
01/01/25 | 6,525,497 | ||||||
Madison Dearborn Capital Partners V, L.P. +, a, e |
03/31/11 | 4 | ||||||
Madison Dearborn Capital Partners VIII, L.P. +, a, e |
03/15/21 | 9,882,043 | ||||||
Mainsail Partners III, L.P. +, a, e |
09/30/24 | 250,718 | ||||||
Marlin Equity III, L.P. +, a, e |
09/30/24 | 29,446 | ||||||
Mesa Natural Gas Solutions +, a, e |
02/25/25 | 9,806,786 | ||||||
MidOcean Partners III, L.P. +, a, e |
06/30/11 | 1 | ||||||
MidOcean Partners V, L.P. +, a, e |
12/31/24 | 1,464,005 | ||||||
Monomoy Capital Partners II, L.P. +, a, e |
09/30/15 | 128,941 | ||||||
New Enterprise Associates 14, L.P. +, a, e |
10/01/24 | 6,308,411 | ||||||
New Enterprise Associates 17, L.P. +, a, e |
09/30/20 | 7,109,499 | ||||||
New Mountain Capital V, L.P. +, a, e |
12/31/24 | 615,222 | ||||||
NewView Capital Fund I, L.P. +, a, e |
01/01/25 | 9,343,464 | ||||||
NGP Natural Resources X, L.P. +, a, e |
09/30/24 | 281,914 | ||||||
Northgate Growth Fund, L.P. +, a |
12/20/19 | 8,210,170 | ||||||
Northlane Capital Partners II LP +, a, e |
12/31/24 | 2,692,583 | ||||||
NVP VIII PG, L.P. +, a, e |
05/31/19 | 84,925,889 | ||||||
The accompanying notes are an integral part of these Consolidated Financial Statements.
26
Partners Group Private Equity (Master Fund), LLC
(a Delaware Limited Liability Company)
Consolidated Schedule of Investments –
March 31, 2025 (continued)
Private Equity Investments (continued) |
Acquisition |
Fair |
||||||
North America (continued) |
||||||||
Oak Investment Partners XII, L.P. +, a |
06/28/12 | $ | 1,035 | |||||
Oaktree Opportunities Fund Xb, L.P. +, a, e |
01/01/25 | 1,770,116 | ||||||
Onex Partners V LP +, a, e |
12/31/24 | 2,270,523 | ||||||
Overbay Capital Partners 2024 Fund Aggregator (AIV IV) LP +, a, e |
12/31/24 | 18,259,949 | ||||||
Overbay Capital Partners 2024 Fund Offshore LP +, a, e |
12/31/24 | 12,311,594 | ||||||
Palladium Equity Partners III, L.P. +, a, e |
08/02/10 | 1 | ||||||
Performance Venture Capital Reinvestment Fund, L.P. +, a, e |
03/12/25 | 99,323,882 | ||||||
PlayCore CV, L.P. +, a, e |
11/21/24 | 18,539,820 | ||||||
Providence Equity Partners IV, L.P. +, a, e |
06/30/11 | 8,915 | ||||||
Providence Equity Partners V, L.P. +, a, e |
06/30/11 | 1 | ||||||
Providence Equity Partners VI -A, L.P. +, a, e |
01/01/25 | 15,549 | ||||||
Providence Equity Partners VI-A, L.P. +, a, e |
06/30/11 | 4,392 | ||||||
Providence Equity Partners VII-A, L.P. +, a, e |
06/30/13 | 1 | ||||||
PT2, L.P. +, a, e |
12/21/21 | 12,822,809 | ||||||
Redpoint Omega II, L.P. +, a |
09/30/24 | 1,658,314 | ||||||
Redpoint Ventures IV, L.P. +, a |
09/30/24 | 596,448 | ||||||
Revelstoke EPIC Fund I, L.P. +, a, e |
11/20/19 | 66,492,018 | ||||||
Riverstone Global Energy and Power Fund VI, L.P. +, a, e |
01/01/25 | 648,838 | ||||||
RoundTable Healthcare Partners III, L.P. +, a, e |
09/30/24 | 913,032 | ||||||
Samson Partners, L.P. +, a, e |
12/21/20 | 52,065,152 | ||||||
Sigma Partners 6, L.P. +, a |
09/30/24 | 654,129 | ||||||
Sigma Partners 7, L.P. +, a |
09/30/24 | 189,123 | ||||||
Sigma Partners 8, L.P. +, a |
09/30/24 | 650,334 | ||||||
Silver Lake Partners III, L.P. +, a, e |
03/31/13 | 844,388 | ||||||
Silver Lake Partners V, L.P. +, a, e |
09/30/20 | 9,907,812 | ||||||
Silver Lake Partners VI, L.P. +, a, e |
09/30/22 | 43,977,586 | ||||||
SL SPV-1, L.P. +, a |
12/01/17 | 5 | ||||||
SL SPV-2, L.P. +, a |
06/30/10 | 6,160,754 | ||||||
Sterling Capital Partners IV, L.P. +, a, e |
12/01/24 | 270,606 | ||||||
Sterling Partners - Small Market Growth 2009, L.P. +, a, e |
12/01/24 | 338,651 | ||||||
STG IV, L.P. +, a, e |
09/30/24 | 233,704 | ||||||
Summit Partners Growth Equity Fund IX-B, L.P. +, a, e |
12/31/24 | 1,262,233 | ||||||
Summit Partners Growth Equity Fund VIII-B, L.P. +, a, e |
12/31/24 | 274,300 | ||||||
Summit Partners Venture Capital Fund III-B, L.P. +, a, e |
12/31/24 | 284,844 | ||||||
Sun Capital Partners V, L.P. +, a, e |
09/30/13 | — | ||||||
SV Life Sciences Fund IV CF, L.P. +, a, e |
12/31/24 | 3,882,805 | ||||||
SV Life Sciences Fund IV, L.P. +, a, e |
12/31/24 | 76,315 | ||||||
TA Atlantic & Pacific VI, L.P. +, a, e |
09/30/15 | 49,935 | ||||||
TA Atlantic and Pacific VII-A L.P. +, a, e |
09/30/24 | 2,946,670 | ||||||
TA Subordinated Debt Fund III, L.P. +, a, e |
09/30/24 | 13,531 | ||||||
TA XI, L.P. +, a, e |
09/30/15 | 715,685 | ||||||
TCV VII (A), L.P. +, a, e |
09/30/13 | 1 | ||||||
Thomas H. Lee Parallel (Cayman) Fund VII, L.P. +, a, e |
01/01/25 | 3,783,485 | ||||||
Thomas H. Lee Parallel Fund VII, L.P. +, a, e |
01/01/25 | 1,334,225 | ||||||
Thomas H. Lee Parallel Fund VIII, L.P. +, a, e |
01/01/25 | 1,118,329 | ||||||
TorQuest Partners Fund (U.S.) II, L.P. +, a, e |
09/30/15 | 200,661 | ||||||
TPG Healthcare Partners, L.P. +, a, e |
04/01/24 | 3,320,520 | ||||||
TPG Partners V, L.P. +, a, e |
07/11/11 | 1 | ||||||
TPG Partners VI, L.P. +, a, e |
12/31/12 | 239,105 | ||||||
TPG Partners VII, L.P. +, a, e |
01/01/25 | 10,282,148 | ||||||
TPG Partners VIII, L.P. +, a, e |
04/01/24 | 15,724,930 | ||||||
Trident VIII, L.P. +, a, e |
09/30/22 | 31,626,063 | ||||||
Trinity Ventures 2024, L.P. +, a, e |
12/20/24 | 53,782,133 | ||||||
Trivest Fund V, L.P. +, a, e |
10/01/24 | 1,296,781 | ||||||
TSCP CV II, L.P. +, a, e |
09/09/24 | 21,182 | ||||||
The accompanying notes are an integral part of these Consolidated Financial Statements.
27
Partners Group Private Equity (Master Fund), LLC
(a Delaware Limited Liability Company)
Consolidated Schedule of Investments –
March 31, 2025 (continued)
Private Equity Investments (continued) |
Acquisition |
Fair |
||||||
North America (continued) |
||||||||
TSCP CV II, L.P. +, a |
09/09/24 | $ | 4,890,426 | |||||
Vector Capital V, L.P. +, a, e |
02/26/25 | 21,271,250 | ||||||
Vector Capital VI, L.P. +, a, e |
02/26/25 | 1,736,799 | ||||||
Vista Equity Partners Fund VII, L.P. +, a, e |
01/01/25 | 1,246,309 | ||||||
Vistria Fund III, L.P. +, a, e |
07/29/19 | 14,071,492 | ||||||
Vistria Fund IV, L.P. +, a, e |
10/01/22 | 44,357,034 | ||||||
Vistria Fund V, L.P. +, a, e |
03/31/23 | 3,603,067 | ||||||
Warburg Pincus Global Growth, L.P. +, a, e |
12/31/24 | 4,465,281 | ||||||
Warburg Pincus Private Equity X, L.P. +, a |
09/28/12 | 202,917 | ||||||
Warburg Pincus Private Equity XI, L.P. +, a |
01/01/25 | 293,486 | ||||||
Warburg Pincus Private Equity XII, L.P. +, a, e |
03/31/25 | 9,967,830 | ||||||
Welsh, Carson, Anderson & Stowe XI, L.P. +, a |
09/30/24 | 5,438 | ||||||
Welsh, Carson, Anderson & Stowe XII, L.P. +, a, e |
12/31/18 | 26,650,007 | ||||||
Welsh, Carson, Anderson & Stowe XIII, L.P. +, a, e |
12/20/18 | 5,008,495 | ||||||
Total North America (11.64%) |
1,835,686,253 | |||||||
Rest of World (0.24%) |
||||||||
Advent Latin American Private Equity Fund V, L.P. +, a, e |
10/01/24 | 838,167 | ||||||
Advent Latin American Private Equity Fund VI-B L.P. +, a, e |
03/31/25 | 11,813,411 | ||||||
Advent Latin American Private Equity Fund VII-A SCSp +, a, e |
03/31/25 | 16,579,573 | ||||||
Carlyle Global Financial Services Partners III, L.P. +, a, e |
12/31/24 | 2,896,253 | ||||||
NG Capital Partners I, L.P. +, a, e |
12/31/24 | 1 | ||||||
Pitango Venture Capital Fund VI L.P. +, a, e |
09/30/24 | 5,875,299 | ||||||
Victoria South American Partners II, L.P. +, a, e |
09/30/24 | 506,858 | ||||||
Total Rest of World (0.24%) |
38,509,562 | |||||||
Western Europe (3.70%) |
||||||||
3i Eurofund Vb, L.P. +, a |
09/30/09 | 4,922 | ||||||
3i Growth Capital B, L.P. +, a, e |
10/01/14 | 1 | ||||||
Abingworth Bioventures III, L.P. +, a, e |
09/30/15 | 3,668 | ||||||
Abingworth Bioventures V Co-Investment Growth Equity Fund, L.P. +, a, e |
06/30/12 | 1 | ||||||
Abingworth Bioventures VI LP +, a, e |
10/01/24 | 375,142 | ||||||
Advent International GPE IX-A +, a, e |
12/31/24 | 2,461,462 | ||||||
Advent International GPE VI, L.P. +, a |
09/30/10 | 320,663 | ||||||
Advent International GPE VI, L.P. +, a, e |
10/01/24 | 130,305 | ||||||
Advent International GPE VII-E, L.P. +, a, e |
10/01/24 | 459,933 | ||||||
Alchemy Special Opportunities Fund II L.P. +, a, e |
09/30/24 | 419,672 | ||||||
Aparca8 Capital Estacionamientos, S.C.R., S.A. +, a, e |
12/15/23 | 9,156,965 | ||||||
Apax Europe VI - A, L.P. +, a, e |
07/01/11 | 33,827 | ||||||
Apax Europe VII - B, L.P. +, a, e |
04/30/11 | 9,434 | ||||||
APAX Europe VII - B, L.P. +, a, e |
10/01/24 | 50,788 | ||||||
Apax IX USD (Feeder) L.P. +, a, e |
01/01/25 | 1,334,339 | ||||||
Apax VIII - A L.P. +, a, e |
01/01/25 | 358,747 | ||||||
Apax X USD L.P. +, a, e |
01/01/25 | 2,076,748 | ||||||
Astorg IQ-EQ Fund SCSp +, a, e |
01/13/22 | 28,926,833 | ||||||
Astorg V FCPR +, a |
09/30/15 | 9,144 | ||||||
Astorg V FCPR +, a, e |
09/30/24 | 8,842 | ||||||
August Capital V, L.P. +, a, e |
10/01/24 | 405,264 | ||||||
Bain Capital Europe Fund III, L.P. +, a, e |
03/31/25 | 481 | ||||||
Bain Capital Europe Fund V, SCSp +, a, e |
12/31/24 | 1,655,911 | ||||||
BC European Capital IX, L.P. +, a, e |
09/30/14 | 1,178,420 | ||||||
BC European Capital X LP +, a, e |
12/31/24 | 2,031,988 | ||||||
Carlyle Europe Partners II, L.P. +, a, e |
12/28/12 | 29,696 | ||||||
Carlyle Europe Partners III, L.P. +, a, e |
12/28/12 | 145,193 | ||||||
Carlyle Europe Partners IV, L.P. +, a, e |
12/31/24 | 6,127,775 | ||||||
The accompanying notes are an integral part of these Consolidated Financial Statements.
28
Partners Group Private Equity (Master Fund), LLC
(a Delaware Limited Liability Company)
Consolidated Schedule of Investments –
March 31, 2025 (continued)
Private Equity Investments (continued) |
Acquisition |
Fair |
||||||
Western Europe (continued) |
||||||||
Carlyle Europe Partners V, L.P. +, a, e |
12/31/24 | $ | 1,631,940 | |||||
CCP IX L.P. No.2 +, a |
09/30/14 | 2 | ||||||
CD&R Value Building Partners I, L.P. +, a |
12/17/21 | 61,004,807 | ||||||
Charterhouse Capital Partners IX +, a, e |
09/30/24 | 19,444 | ||||||
Charterhouse Capital Partners X L.P. +, a, e |
12/31/24 | 6,266,322 | ||||||
CVC Capital Partners Pachelbel (A) SCSp +, a, e |
07/08/24 | 1,956,107 | ||||||
CVC Capital Partners VII L.P. +, a, e |
03/31/24 | 14,862,565 | ||||||
CVC Capital Partners VIII, L.P. +, a, e |
03/31/24 | 12,733,295 | ||||||
CVC European Equity Partners III L.P. +, a, e |
12/31/24 | 428,124 | ||||||
CVC European Equity Partners V, L.P. +, a, e |
12/28/12 | 1 | ||||||
Daiwa ICP European Infrastructure 1, L.P. +, a, e |
12/22/22 | 66,273,309 | ||||||
DBAG Fund VI (Guernsey) L.P. +, a, e |
09/30/24 | 390,584 | ||||||
Elvaston Capital Fund V +, a, e |
03/31/25 | 18,552,656 | ||||||
EPIC I-b Fund SLP +, a, e |
11/30/20 | 27,289,717 | ||||||
EQT IX, L.P. (EUR) +, a, e |
03/31/25 | 34,217,073 | ||||||
ESP Golden Bear Europe Fund +, a, e |
12/31/16 | 391,347 | ||||||
Eurazeo Capital IV B SCSp +, a, e |
12/31/24 | 8,542,369 | ||||||
F2i III +, a, e |
07/01/24 | 7,228,191 | ||||||
Fourth Cinven Fund, L.P. +, a, e |
04/16/10 | 589 | ||||||
France Special Situations Fund I FPCI +, a, e |
10/01/24 | 183,154 | ||||||
G Square Capital I +, a |
12/01/24 | 1,210 | ||||||
Galileo III FCPR +, a, e |
09/30/15 | 29,472 | ||||||
Graphite Capital Partners VII, L.P. +, a, e |
09/30/15 | 240,003 | ||||||
HitecVision Asset Solutions, L.P. +, a, e |
09/30/24 | 3,518 | ||||||
HitecVision SpringPoint L.P. +, a, e |
09/30/24 | 2,239 | ||||||
HitecVision V, L.P. +, a, e |
09/30/24 | 5,253 | ||||||
HitecVision VI, L.P. +, a, e |
09/30/24 | 1,408,199 | ||||||
Index Ventures Growth II (Jersey), L.P. +, a |
09/30/24 | 1,197,032 | ||||||
Index Ventures VI (Jersey), L.P. +, a, e |
09/30/24 | 10,258,698 | ||||||
Industrial Opportunity Partners II, L.P. +, a, e |
09/30/24 | 167,081 | ||||||
Investindustrial V L.P. +, a, e |
09/30/24 | 1,122,088 | ||||||
Italian Private Equity Fund IV, L.P. +, a, e |
01/29/16 | 3,840 | ||||||
KKR European Fund III, L.P. +, a, e |
11/01/10 | 42,295 | ||||||
KKR European Fund III, L.P. (USD) +, a, e |
12/31/24 | 478,676 | ||||||
KKR European Fund IV (EEA) L.P. +, a, e |
12/31/24 | 15,441,620 | ||||||
KKR European Fund V (EUR) SCSp +, a, e |
12/31/24 | 4,024,569 | ||||||
L Capital 3 FPCI +, a, e |
12/02/24 | 428,955 | ||||||
Latour Capital I +, a |
12/31/24 | 76,346 | ||||||
Living Bridge 5 L.P. +, a, e |
10/01/24 | 599,146 | ||||||
Montagu III, L.P. +, a, e |
12/09/09 | 1 | ||||||
Montagu V L.P. +, a, e |
12/31/24 | 2,916,066 | ||||||
Montagu+ SCSp +, a, e |
12/06/21 | 70,566,587 | ||||||
Oaktree European Principal Fund IV Feeder (Cayman), L.P. +, a, e |
01/01/25 | 974,153 | ||||||
PAI Europe VI, L.P. +, a, e |
12/31/24 | 2,411,295 | ||||||
PAI Europe VII-1 +, a, e |
12/31/24 | 504,642 | ||||||
Permira Europe II, L.P. +, a |
11/29/13 | 4,558 | ||||||
Permira Europe III, L.P. +, a |
09/30/13 | 2,296 | ||||||
Permira Europe III, L.P. +, a, e |
01/01/25 | 50,593 | ||||||
Permira VI L.P. 1 +, a, e |
01/01/25 | 2,163,032 | ||||||
Permira VII L.P. +, a, e |
09/29/22 | 43,454,741 | ||||||
Permira VIII SCSp +, a, e |
03/30/25 | 10,869,391 | ||||||
Phoenix Equity Partners 2010 LP +, a |
09/30/24 | 4,583 | ||||||
Piper Private Equity Fund V L.P. +, a, e |
10/01/24 | 151,050 | ||||||
Prime Ventures IV C.V. +, a, e |
09/30/24 | 1,599,108 | ||||||
PSC III G, LP +, a, e |
12/31/24 | 4,916,276 | ||||||
The accompanying notes are an integral part of these Consolidated Financial Statements.
29
Partners Group Private Equity (Master Fund), LLC
(a Delaware Limited Liability Company)
Consolidated Schedule of Investments –
March 31, 2025 (continued)
Private Equity Investments (continued) |
Acquisition |
Fair |
||||||
Western Europe (continued) |
||||||||
Rivean Special Opportunity Fund I Coöperatief U.A. +, a, e |
11/29/22 | $ | 23,571,160 | |||||
Riverside Europe Fund IV, L.P. +, a, e |
09/30/14 | 1 | ||||||
Sixth Cinven Fund (No.2) Limited Partnership +, a, e |
03/31/24 | 3,582,729 | ||||||
STG Alternative Investments S.C.A. SICAV-RAIF +, a, e |
09/17/21 | 32,982,962 | ||||||
Summit Partners Europe Private Equity Fund, L.P. +, a, e |
03/31/25 | 1 | ||||||
TDR Capital III ‘B’ L.P. +, a, e |
10/01/24 | 2,720,560 | ||||||
The Seventh Cinven Fund, L.P. +, a, e |
03/31/24 | 10,814,242 | ||||||
Trilantic Capital Partners V (Europe) S.C.A., SICAR +, a, e |
11/20/20 | 5,936,358 | ||||||
Trilantic Europe VI SCSp +, a, e |
12/10/20 | 3,922,032 | ||||||
Turkish Private Equity Fund III L.P. +, a, e |
09/30/24 | 3,701,466 | ||||||
WPEF V Feeder LP +, a, e |
01/01/25 | 98,826 | ||||||
Total Western Europe (3.70%) |
583,136,709 | |||||||
Total Secondary Investments (16.94%) |
$ | 2,671,931,827 | ||||||
Primary Investments *, c (13.96%) |
||||||||
Asia - Pacific (0.88%) |
||||||||
Bain Capital Asia V, L.P. +, a, e |
09/01/23 | 466,431 | ||||||
Baring Asia Private Equity Fund V, L.P. +, a, e |
12/01/10 | 222,195 | ||||||
BGH Capital Fund I +, a, e |
03/01/18 | 18,022,204 | ||||||
BGH Capital VCLP II +, a, e |
02/01/22 | 508,456 | ||||||
CPEChina Fund III, L.P. +, a, e |
03/28/18 | 31,995,276 | ||||||
CVC Capital Partners Asia VI L.P. +, a, e |
12/23/22 | 585,278 | ||||||
Hony Capital Fund VIII, L.P. +, a, e |
10/30/15 | 9,029,988 | ||||||
Hony Capital Partners V, L.P. +, a, e |
12/15/11 | 2,275,093 | ||||||
J-STAR No.4-C, L.P. +, a, e |
08/02/19 | 13,594,524 | ||||||
J-STAR No.5-B, L.P. +, a, e |
02/28/22 | 4,279,967 | ||||||
Kedaara Capital Growth Fund IV +, a, e |
04/03/24 | 204,161 | ||||||
Kedaara Capital III Limited +, a, e |
06/17/21 | 7,242,300 | ||||||
KKR Asian Fund IV SCSp +, a, e |
05/29/20 | 4,594,333 | ||||||
Primavera Capital Fund III L.P. +, a, e |
05/09/18 | 11,621,939 | ||||||
Primavera Capital Fund IV, L.P. +, a, e |
05/20/21 | 4,990,914 | ||||||
Southern Capital Fund IV L.P. +, a, e |
01/26/18 | 5,018,026 | ||||||
The Baring Asia Private Equity Fund VII, L.P. +, a, e |
07/10/18 | 8,813,977 | ||||||
Tiara CG Private Equity Fund 2024, L.P. +, a, e |
11/29/24 | 27,621 | ||||||
TPG ASIA VIII (B), L.P. +, a, e |
07/01/22 | 6,998,300 | ||||||
Trustbridge Partners VI, L.P. +, a, e |
04/12/18 | 7,954,238 | ||||||
Total Asia - Pacific (0.88%) |
138,445,221 | |||||||
North America (8.40%) |
||||||||
Advent Global Technology, L.P. +, a, e |
06/25/19 | 3,080,502 | ||||||
AEA Investors Fund VII L.P. +, a, e |
02/08/19 | 3,574,268 | ||||||
American Industrial Partners Capital Fund VII, L.P. +, a, e |
03/29/19 | 28,195,718 | ||||||
American Industrial Partners Capital Fund VIII, L.P. +, a, e |
07/10/23 | 469,260 | ||||||
Apollo Investment Fund IX, L.P +, a, e |
06/01/17 | 33,366,669 | ||||||
Apollo Investment Fund VIII, L.P. +, a, e |
06/28/13 | 2,586,963 | ||||||
Ares Corporate Opportunities Fund IV, L.P. +, a, e |
04/19/12 | 1,604,325 | ||||||
Ares Corporate Opportunities Fund V, L.P. +, a, e |
12/28/15 | 9,279,121 | ||||||
Ares Corporate Opportunities Fund VI, L.P. +, a, e |
06/02/20 | 2,777,714 | ||||||
Avista Capital Partners II, L.P. +, a, e |
01/01/14 | 1 | ||||||
Bain Capital Fund XII, L.P. +, a, e |
06/30/17 | 16,429,532 | ||||||
Bain Capital Fund XIII, L.P. +, a, e |
08/07/20 | 18,953,008 | ||||||
Baring Asia Private Equity Fund IX, L.P. +, a, e |
12/23/24 | — | ||||||
Barings Transportation Fund, L.P. +, a, e |
09/23/21 | 11,166,897 | ||||||
Berkshire Fund IX, L.P. +, a, e |
03/18/16 | 14,064,686 | ||||||
The accompanying notes are an integral part of these Consolidated Financial Statements.
30
Partners Group Private Equity (Master Fund), LLC
(a Delaware Limited Liability Company)
Consolidated Schedule of Investments –
March 31, 2025 (continued)
Private Equity Investments (continued) |
Acquisition |
Fair |
||||||
North America (continued) |
||||||||
Berkshire Fund XI-TE, L.P. +, a, e |
12/18/23 | $ | — | |||||
Caltius Partners V-A, L.P. +, a, e |
12/02/14 | 6,005,034 | ||||||
Carlyle Partners VII, L.P. +, a, e |
11/29/17 | 56,433,709 | ||||||
Carlyle Partners VIII, L.P. +, a, e |
09/10/21 | 6,376,012 | ||||||
Centerbridge Seaport Acquisition Fund, L.P. +, a |
04/27/22 | 1,051,907 | ||||||
Clayton, Dubilier & Rice Fund IX, L.P. +, a, e |
07/31/13 | 5,630,309 | ||||||
Clayton, Dubilier & Rice Fund X, L.P. +, a, e |
12/13/16 | 18,534,829 | ||||||
Clayton, Dubilier & Rice Fund XI, L.P. +, a, e |
05/15/20 | 19,460,430 | ||||||
Clayton, Dubilier & Rice Fund XII, L.P. +, a, e |
09/02/22 | 8,472,441 | ||||||
Clearlake Capital Partners V, L.P. +, a, e |
12/15/17 | 30,158,572 | ||||||
Clearlake Capital Partners VI, L.P. +, a, e |
12/10/19 | 21,619,332 | ||||||
Clearlake Capital Partners VII, L.P. +, a, e |
09/23/21 | 11,464,514 | ||||||
Clearlake Capital Partners VIII, L.P. +, a, e |
04/05/24 | 1,144,969 | ||||||
Crescent Mezzanine Partners VI, L.P. +, a, e |
03/30/12 | 278,091 | ||||||
Cressey & Company Fund VII-A L.P. +, a, e |
06/30/22 | 1,060,757 | ||||||
ECP V, LP +, a, e |
08/19/22 | 3,698,545 | ||||||
Frazier Healthcare Growth Buyout Fund X, L.P. +, a, e |
03/10/21 | 12,688,930 | ||||||
Frazier Healthcare Growth Buyout Fund XI, L.P. +, a, e |
09/20/24 | — | ||||||
Genstar AMBA CV, L.P. +, a |
04/01/23 | 587,807 | ||||||
Genstar Capital Partners IX, L.P. +, a, e |
02/21/19 | 24,077,183 | ||||||
Genstar Capital Partners VI, L.P. +, a, e |
09/01/12 | 207,665 | ||||||
Genstar Capital Partners VII, L.P. +, a, e |
06/26/15 | 5,819,383 | ||||||
Genstar Capital Partners VIII, L.P. +, a, e |
03/23/17 | 33,585,905 | ||||||
Genstar Capital Partners X, L.P. +, a, e |
04/01/21 | 11,295,949 | ||||||
Genstar Capital Partners XI, L.P. +, a, e |
04/26/23 | 776,069 | ||||||
Genstar X Opportunities Fund, L.P. +, a, e |
08/13/21 | 2,728,436 | ||||||
Genstar XI Opportunities Fund, L.P. +, a, e |
04/26/23 | 607,781 | ||||||
GHO Capital IV +, a, e |
12/27/24 | — | ||||||
GI Data Infrastructure Fund II LP +, a, e |
01/27/23 | 1,792,559 | ||||||
GoldPoint Mezzanine Partners IV, L.P. +, a, e |
12/30/15 | 5,561,053 | ||||||
Green Equity Investors IX, L.P. +, a, e |
03/01/22 | 9,789,878 | ||||||
Green Equity Investors Side VIII, L.P. +, a, e |
10/18/19 | 37,693,896 | ||||||
Gryphon Heritage Partners, L.P. +, a, e |
12/17/20 | 5,644,111 | ||||||
Gryphon Partners V, L.P. +, a, e |
02/23/18 | 8,667,090 | ||||||
Gryphon Partners VI, L.P. +, a, e |
12/17/20 | 8,637,450 | ||||||
Harvest Partners IX, L.P. +, a, e |
09/24/21 | 6,179,154 | ||||||
Harvest Partners VII, L.P. +, a, e |
12/14/15 | 9,764,027 | ||||||
Harvest Partners VIII, L.P. +, a, e |
12/19/18 | 19,992,191 | ||||||
Hellman & Friedman Capital Partners VII, L.P. +, a, e |
06/30/14 | 1 | ||||||
Hellman & Friedman Capital Partners X, L.P. +, a, e |
05/10/21 | 12,786,114 | ||||||
Hellman & Friedman Capital Partners XI, LP +, a, e |
03/31/23 | — | ||||||
Hg Saturn 4 L.P. +, a, e |
03/01/25 | — | ||||||
HGGC Fund IV, L.P. +, a, e |
04/08/22 | 2,560,705 | ||||||
Icon Partners IV, L.P. +, a, e |
09/01/21 | 5,913,791 | ||||||
Icon Partners V, L.P. +, a, e |
12/27/21 | 10,086,420 | ||||||
Impilo Healthcare AB +, a, e |
02/28/25 | — | ||||||
Insight Partners XII (Co-Investors), L.P. +, a, e |
05/14/21 | 2,114,114 | ||||||
Insight Partners XIII, L.P. +, a, e |
12/23/22 | 1,487,487 | ||||||
Insight Venture Partners X, L.P. +, a, e |
07/06/18 | 14,044,686 | ||||||
Insight Venture Partners XI, L.P. +, a, e |
12/17/19 | 7,444,116 | ||||||
Insight Ventures Partners XII, L.P. +, a, e |
05/14/21 | 6,693,345 | ||||||
Jade Equity Investors II, L.P. +, a, e |
03/01/22 | 1,020,948 | ||||||
K6 Private Investors, L.P. +, a, e |
06/28/24 | — | ||||||
Khosla Ventures VIII, L.P. +, a, e |
01/06/23 | 1,081,197 | ||||||
KKR Americas Fund XII L.P. +, a, e |
01/31/18 | 30,426,359 | ||||||
The accompanying notes are an integral part of these Consolidated Financial Statements.
31
Partners Group Private Equity (Master Fund), LLC
(a Delaware Limited Liability Company)
Consolidated Schedule of Investments –
March 31, 2025 (continued)
Private Equity Investments (continued) |
Acquisition |
Fair |
||||||
North America (continued) |
||||||||
KKR Associates Indigo Equity Partners, L.P. +, a |
10/01/22 | $ | 2,066,807 | |||||
KKR North America Fund XI, L.P. +, a, e |
02/01/12 | 3,780,622 | ||||||
KKR North America Fund XIII, SCSP +, a, e |
04/06/21 | 8,596,150 | ||||||
KKR North America Fund XIV +, a, e |
12/19/24 | — | ||||||
Kleiner Perkins Caufield & Byers XIX LLC +, a, e |
03/05/20 | 13,436,623 | ||||||
Kleiner Perkins Select Fund III, LLC +, a, e |
06/28/24 | 1,283,750 | ||||||
KLEINER PERKINS XXI, LLC +, a, e |
06/28/24 | 1,202,500 | ||||||
Kohlberg TE Investors IX, L.P. +, a, e |
12/20/19 | 26,444,717 | ||||||
Kohlberg TE Investors VIII, L.P. +, a, e |
08/04/16 | 23,719,525 | ||||||
Kohlberg TE Investors X, L.P. +, a, e |
10/06/23 | 231,036 | ||||||
Lee Equity Partners IV, L.P. +, a, e |
06/28/24 | 4,824,026 | ||||||
Leeds Equity Partners VI, L.P. +, a, e |
11/25/16 | 17,185,730 | ||||||
Lerer Hippeau Select Fund III, L.P. +, a, e |
12/20/19 | 6,208,746 | ||||||
Lerer Hippeau VII, L.P. +, a, e |
12/20/19 | 3,469,647 | ||||||
Lux Total Opportunities, L.P. +, a, e |
05/28/21 | 3,385,763 | ||||||
Lux Ventures VII, L.P. +, a, e |
05/28/21 | 1,450,109 | ||||||
Lux Ventures VIII, L.P. +, a, e |
04/03/23 | 2,170,705 | ||||||
Madison Dearborn Capital Partners VIII, L.P. +, a, e |
03/20/20 | 9,366,868 | ||||||
Mayfield Select III, L.P. +, a, e |
05/01/23 | — | ||||||
Mayfield XVII, L.P. +, a, e |
05/01/23 | 163,149 | ||||||
Nautic Partners IX-A, L.P. +, a, e |
03/12/19 | 8,507,323 | ||||||
Nautic Partners VII-A, L.P. +, a, e |
06/27/14 | 2,101,200 | ||||||
Nautic Partners X-A, L.P. +, a, e |
07/19/21 | 10,513,134 | ||||||
Nautic Partners XI-A, L.P. +, a, e |
06/21/24 | — | ||||||
NEA 18 Venture Growth Equity, L.P. +, a, e |
12/22/21 | 2,616,117 | ||||||
New Enterprise Associates 14, L.P. +, a, e |
05/04/12 | 6,530,649 | ||||||
New Enterprise Associates 17, L.P. +, a, e |
06/06/19 | 8,958,821 | ||||||
New Enterprise Associates 18, L.P. +, a, e |
12/22/21 | 2,547,765 | ||||||
New Mountain Capital V, L.P. +, a, e |
06/29/17 | 22,126,606 | ||||||
New Mountain Partners VI, L.P. +, a, e |
10/16/20 | 24,824,000 | ||||||
New Mountain Partners VII, L.P. +, a, e |
04/06/23 | 1,020,617 | ||||||
NexPhase Capital Fund III-A, L.P. +, a, e |
09/01/16 | 12,338,272 | ||||||
NexPhase Capital Fund V, L.P. +, a, e |
08/04/23 | 83,282 | ||||||
Nordic Capital Evolution II +, a, e |
12/14/24 | — | ||||||
Oak Hill Capital Partners IV, L.P. +, a, e |
04/28/17 | 5,198,154 | ||||||
Oak Hill Capital Partners V, L.P. +, a, e |
12/21/18 | 37,114,179 | ||||||
Oak Hill Capital Partners VI, L.P. +, a, e |
02/25/22 | 3,264,272 | ||||||
Oakley Capital Private Equity Fund VI +, a, e |
03/21/25 | — | ||||||
Pamlico Capital V, L.P. +, a, e |
02/03/20 | 4,403,036 | ||||||
Pamlico Capital VI, L.P. +, a, e |
12/17/24 | — | ||||||
PennantPark Credit Opportunities Fund II, L.P. +, a, e |
08/03/12 | 719,566 | ||||||
Revelstoke Capital Partners Fund III, L.P +, a, e |
02/23/22 | 6,362,592 | ||||||
Silver Lake Partners IV, L.P. +, a, e |
07/30/12 | 10,582,266 | ||||||
Silver Lake Partners V, L.P. +, a, e |
03/31/17 | 42,900,922 | ||||||
Silver Lake Partners VI, L.P. +, a, e |
06/04/20 | 7,540,587 | ||||||
Silver Lake Partners VII, L.P. +, a, e |
05/26/22 | 5,395,366 | ||||||
Spark Capital Growth Fund IV, L.P. +, a, e |
10/14/21 | 6,829,643 | ||||||
Spark Capital Growth Fund V, L.P. +, a, e |
02/29/24 | 558,447 | ||||||
Spark Capital VII, L.P. +, a, e |
10/14/21 | 3,273,164 | ||||||
Spark Capital VIII, L.P. +, a, e |
02/29/24 | 222,889 | ||||||
Sumeru Equity Partners Fund, L.P. +, a, e |
04/27/15 | 3,665,411 | ||||||
Summit Partners Growth Equity Fund XI, L.P. +, a, e |
10/01/21 | 2,178,882 | ||||||
Summit Partners Growth Equity Fund XII, L.P. +, a, e |
10/01/24 | — | ||||||
TA Select Opportunities Fund II-B, L.P. +, a, e |
05/27/21 | 2,780,386 | ||||||
TA XIII-B, L.P. +, a, e |
05/02/19 | 17,864,752 | ||||||
The accompanying notes are an integral part of these Consolidated Financial Statements.
32
Partners Group Private Equity (Master Fund), LLC
(a Delaware Limited Liability Company)
Consolidated Schedule of Investments –
March 31, 2025 (continued)
Private Equity Investments (continued) |
Acquisition |
Fair |
||||||
North America (continued) |
||||||||
TA XIV-B, L.P. +, a, e |
05/27/21 | $ | 11,213,153 | |||||
TCV X, L.P. +, a, e |
08/31/18 | 14,375,322 | ||||||
TCV XI (A), L.P. +, a, e |
10/02/20 | 9,114,729 | ||||||
The Veritas Capital Fund IX, L.P. +, a, e |
07/01/24 | 57,612 | ||||||
Thompson Street Capital Partners IV, L.P. +, a, e |
12/10/15 | 6,334,591 | ||||||
Thompson Street Capital Partners V, L.P. +, a, e |
05/04/18 | 9,037,731 | ||||||
Thompson Street Capital Partners VI, L.P. +, a, e |
06/11/21 | 12,422,988 | ||||||
TPG Partners IX, L.P. +, a, e |
12/23/22 | 1,180,198 | ||||||
TPG Partners VII, L.P. +, a, e |
03/01/16 | 4,322,751 | ||||||
TPG Partners VIII, L.P. +, a, e |
01/31/19 | 11,626,571 | ||||||
Trident IX, L.P. +, a, e |
11/19/21 | 15,697,370 | ||||||
Trident VII, L.P. +, a, e |
09/22/16 | 36,724,122 | ||||||
Trident VIII, L.P. +, a, e |
04/05/19 | 25,548,671 | ||||||
Trident X, L.P. +, a, e |
05/23/24 | — | ||||||
Vista Equity Partners Fund VII, L.P. +, a, e |
08/31/18 | 20,949,551 | ||||||
Vista Equity Partners Fund VIII, L.P. +, a, e |
04/28/22 | 16,029,831 | ||||||
Vistria Fund II, L.P. +, a, e |
12/19/17 | 12,217,043 | ||||||
Vistria Fund III, L.P. +, a, e |
06/19/19 | 14,071,492 | ||||||
Vistria Fund IV, L.P. +, a, e |
03/31/21 | 15,925,858 | ||||||
Vistria Fund V, L.P. +, a, e |
10/31/23 | 623,606 | ||||||
Warburg Pincus Global Growth 14, L.P. +, a, e |
01/31/22 | 6,927,565 | ||||||
Warburg Pincus Global Growth, L.P. +, a, e |
11/20/18 | 11,239,784 | ||||||
Welsh, Carson, Anderson & Stowe XII, L.P. +, a |
12/19/14 | 6,821,042 | ||||||
Welsh, Carson, Anderson & Stowe XIII, L.P. +, a, e |
12/20/18 | 18,030,584 | ||||||
Welsh, Carson, Anderson & Stowe XIV, L.P. +, a, e |
01/19/22 | 1,970,350 | ||||||
West Street Offshore Infrastructure Partners IV +, a, e |
11/02/22 | 8,615,212 | ||||||
Windjammer Senior Equity Fund IV, L.P. +, a, e |
02/06/13 | 3,188,736 | ||||||
Total North America (8.40%) |
1,324,969,151 | |||||||
Rest of World (0.55%) |
||||||||
Advent Latin American Private Equity Fund VI-H L.P. +, a, e |
10/17/14 | 8,282,184 | ||||||
Patria - Brazilian Private Equity Fund IV, L.P. +, a, e |
06/30/11 | 3,191,066 | ||||||
Polish Enterprise Fund VIII, L.P. +, a, e |
09/15/17 | 75,513,120 | ||||||
Total Rest of World (0.55%) |
86,986,370 | |||||||
Western Europe (4.13%) |
||||||||
Adagia Capital Europe S.L.P. +, a, e |
06/01/21 | 6,637,046 | ||||||
Advent International GPE IX-C, L.P. +, a, e |
05/31/19 | 26,843,500 | ||||||
Advent International GPE VII-B, L.P. +, a, e |
07/01/12 | 1,256,592 | ||||||
Advent International GPE VIII-C, L.P +, a, e |
03/22/16 | 7,903,446 | ||||||
Advent International GPE X (USD) +, a, e |
05/31/22 | 10,962,724 | ||||||
Apax X USD L.P. +, a, e |
07/16/19 | 20,945,503 | ||||||
APAX XI USD L.P. +, a, e |
06/30/22 | 7,809,062 | ||||||
Astorg Mid-Cap +, a, e |
02/22/21 | 4,449,920 | ||||||
Astorg VI, FCPI +, a, e |
06/30/16 | 3,511,790 | ||||||
Astorg VIII S.à.r.l. +, a, e |
12/17/21 | 7,600,947 | ||||||
Axcel VI K/S +, a, e |
02/21/20 | 27,282,897 | ||||||
Axcel VII K/S +, a, e |
05/17/23 | 332,229 | ||||||
Bain Capital Europe Fund IV, L.P. +, a, e |
09/01/14 | 2,766,699 | ||||||
Bain Capital Europe Fund VI, SCSp +, a, e |
06/30/22 | 2,435,167 | ||||||
BC Partners XI, L.P. +, a, e |
12/18/20 | 23,597,429 | ||||||
Bregal Unternehmerkapital IV-A SCSP +, a, e |
05/23/24 | 611,019 | ||||||
CapVest Equity Partners III B, L.P. +, a, e |
08/30/13 | 15,799 | ||||||
Capvis Equity V L.P. +, a, e |
01/17/18 | 20,388,574 | ||||||
Carlyle Europe Partners IV, L.P. +, a, e |
08/27/13 | 1 | ||||||
The accompanying notes are an integral part of these Consolidated Financial Statements.
33
Partners Group Private Equity (Master Fund), LLC
(a Delaware Limited Liability Company)
Consolidated Schedule of Investments –
March 31, 2025 (continued)
Private Equity Investments (continued) |
Acquisition |
Fair |
||||||
Western Europe (continued) |
||||||||
Carlyle Europe Partners V, L.P. +, a, e |
04/23/18 | $ | 7,006,274 | |||||
CD&R Value Building Partners I, L.P. +, a |
12/17/21 | 7,588,121 | ||||||
Charterhouse Capital Partners XI +, a, e |
11/26/21 | 5,599,110 | ||||||
CVC Capital Partners IX L.P. +, a, e |
05/12/23 | 144,633 | ||||||
CVC Capital Partners VI (A) L.P. +, a, e |
07/05/13 | 5,673,802 | ||||||
CVC Capital Partners VIII, L.P. +, a, e |
06/19/20 | 2,310,816 | ||||||
DPE Deutschland IV +, a, e |
08/24/20 | 4,349,997 | ||||||
EPIC Fund III, SLP +, a, e |
06/25/24 | 1,330,334 | ||||||
EQT IX, L.P. (USD) +, a, e |
05/15/20 | 22,672,267 | ||||||
EQT Mid-Market (No.1) Feeder L.P. +, a, e |
07/01/16 | 10,969,533 | ||||||
EQT X, L.P. (USD) +, a, e |
04/28/22 | 9,057,159 | ||||||
Exponent Private Equity Partners V, L.P. +, a, e |
09/14/23 | 3,538,737 | ||||||
Gilde Buy-Out Fund VI C.V. +, a, e |
06/28/19 | 23,985,686 | ||||||
Graphite Capital Partners IX L.P. +, a, e |
04/11/18 | 14,592,615 | ||||||
Hg Genesis 10 L.P. +, a, e |
04/14/22 | 4,300,379 | ||||||
Hg Mercury 4 L.P. +, a, e |
01/12/23 | 1,925,819 | ||||||
Hg Saturn 3 L.P. +, a, e |
02/25/22 | 14,702,771 | ||||||
Hg Saturn I L.P. +, a, e |
06/28/18 | 14,478,272 | ||||||
HgCapital 8 L.P. +, a, e |
12/19/16 | 16,533,184 | ||||||
HgCapital Mercury 2 +, a, e |
02/15/17 | 14,650,027 | ||||||
Index Ventures Growth III (Jersey) L.P. +, a |
03/18/15 | 22,837,487 | ||||||
KKR European Fund V (EUR) SCSp +, a, e |
11/05/18 | 27,400,994 | ||||||
KKR European Fund VI (USD) +, a, e |
11/01/21 | 7,521,117 | ||||||
Livingbridge 7 L.P. +, a, e |
09/04/20 | 13,026,677 | ||||||
MCH Iberian Capital Fund V FCR +, a, e |
12/10/21 | 19,248,029 | ||||||
Nordic Capital Evo GP, SCSp +, a, e |
06/30/21 | 7,075,617 | ||||||
Nordic Capital IX, L.P. +, a, e |
07/18/17 | 38,892,955 | ||||||
Nordic Capital X, L.P. +, a, e |
09/30/20 | 23,662,512 | ||||||
Nordic Capital XI, L.P. +, a, e |
05/01/22 | 17,821,579 | ||||||
Oakley Capital Fund V, SCSp +, a, e |
04/28/22 | 6,016,084 | ||||||
Oakley Capital Private Equity Fund VI +, a, e |
12/17/24 | 91,400 | ||||||
PAI Europe VI-1, L.P. +, a, e |
03/12/15 | 3,650,223 | ||||||
PAI Partners VIII-1 SCSp +, a, e |
12/17/21 | 10,963,374 | ||||||
Permira VII L.P. +, a, e |
06/21/19 | 29,812,399 | ||||||
Permira VIII SCSp +, a, e |
02/10/22 | 12,113,629 | ||||||
ProA Capital Iberian Buyout Fund IV, F.C.R. +, a, e |
05/31/23 | 1,970,538 | ||||||
Rivean Capital Fund VII Cooperatief U.A. +, a, e |
05/24/23 | 7,281,615 | ||||||
Sixth Cinven Fund (No.3) L.P. +, a, e |
05/01/16 | 5,021,276 | ||||||
The Eighth Cinven Fund, L.P. +, a, e |
07/05/22 | 911,315 | ||||||
The Paragon Partners Fund IV GmbH & Co. KG +, a, e |
04/29/22 | 16,631 | ||||||
The Seventh Cinven Fund, L.P. +, a, e |
04/16/19 | 34,059,793 | ||||||
Vitruvian Investment Partnership V +, a, e |
10/07/22 | 1,420,800 | ||||||
Total Western Europe (4.13%) |
651,575,924 | |||||||
Total Primary Investments (13.96%) |
$ | 2,201,976,666 | ||||||
Total Private Equity Investments (Cost $10,780,359,996)(94.72%) |
$ | 14,941,686,092 | ||||||
Total Investments (Cost $12,030,535,583)(102.98%) |
16,245,622,570 | |||||||
Other Assets in Excess of Liabilities ((2.98)%) |
(470,507,457 | ) | ||||||
Net Assets (100.00%) |
$ | 15,775,115,113 | ||||||
|
* |
Direct Investments are private investments directly into the equity or debt of selected operating companies, often together with the management of the company. Primary Investments are investments in newly established private equity partnerships |
The accompanying notes are an integral part of these Consolidated Financial Statements.
34
Partners Group Private Equity (Master Fund), LLC
(a Delaware Limited Liability Company)
Consolidated Schedule of Investments –
March 31, 2025 (continued)
where underlying portfolio companies are not known as of the time of investment. Secondary Investments are portfolios of assets on the secondary market.
|
** |
The Fair Value of any Direct Investment may not necessarily reflect the current or expected future performance of such Direct Investment or the Fair Value of the Fund’s interest in such Direct Investment. Furthermore, the Fair Value of any Direct Investment has not been calculated, reviewed, verified or in any way approved by such Direct Investment or its general partner, manager or sponsor (including any of its affiliates). Please see below for further details regarding the valuation policy of the Fund. |
|
*** |
Security exempt from registration under Rule 144A of the Securities Act of 1933, as amended (the “Securities Act”). These securities may be sold in certain transactions in reliance on an exemption from registration (normally to “qualified institutional buyers” in accordance with Rule 144(a)(1) under the Securities Act). At March 31, 2025, the aggregate value of these securities is $175,798,070 or 1.11% of the Fund’s net assets. |
|
# |
As of March 31, 2025, 1 month EURIBOR was 2.36%. |
|
## |
As of March 31, 2025, 3 month EURIBOR was 2.34%. |
|
### |
As of March 31, 2025, 6 month EURIBOR was 2.34%. |
|
#### |
As of March 31, 2025, 12 month EURIBOR was 2.31%. |
|
+ |
The fair value of the investment was determined using significant unobservable inputs. |
|
† |
As of March 31, 2025, 1 month Bank Bill Swap Rate was 4.10%. |
|
†† |
As of March 31, 2025, 3 month Bank Bill Swap Rate was 4.13%. |
|
> |
As of March 31, 2025, 1 month Sterling Overnight Interbank Average Rate was 4.46%. |
|
>> |
As of March 31, 2025, 3 month Sterling Overnight Interbank Average Rate was 4.56%. |
|
>>> |
As of March 31, 2025, 6 month Sterling Overnight Interbank Average Rate was 4.69%. |
|
¤ ¤ |
As of March 31, 2025, 3 month Stockholm Interbank Offered Rate was 2.35%. |
|
v |
As of March 31, 2025, 1 month Secured Overnight Financing Rate was 4.32%. |
|
vv |
As of March 31, 2025, 3 month Secured Overnight Financing Rate was 4.29%. |
|
vvv |
As of March 31, 2025, 6 month Secured Overnight Financing Rate was 4.19%. |
|
vvvv |
As of March 31, 2025, 12 month Secured Overnight Financing Rate was 4.01%. |
|
a |
Private equity investments are generally issued in private placement transactions and as such are generally restricted as to resale. Each investment may have been purchased on various dates and for different amounts. The date of the first purchase is reflected under Acquisition Date as shown in the Schedule of Investments. Total fair value of restricted investments as of March 31, 2025 was $14,941,686,092, or 94.72% of net assets. As of March 31, 2025, the aggregate cost of each investment restricted to resale was $11,186,881, $10,621,500, $19,328,293, $1,021, $246,903, $5,039, $1, $29,283,000, $1, $7,899, $1,975, $0, $8,328,753, $5,433,284, $1,475,400, $62,095,072, $1,213,408, $23,054,747, $1,992,104, $1,203,367, $11,939,384, $1,706,867, $3,378,222, $18,518,292, $7,428, $126,985,067, $24,784,703, $30,810,000, $27,959,148, $9,524,381, $44,578,381, $869,932, $150,000, $4,168,272, $4,205,000, $17,127,003, $56,634, $117,093,144, $5,611,689, $53,921,126, $94,154, $8,436,000, $33,244,066, $2,154,218, $1,348,750, $27,230, $3,602,070, $120,019,757, $38,954,115, $0, $7,120,999, $8,508,337, $85, $100,008,345, $95,420,649, $1, $77,931,448, $37,029,643, $94,861,790, $103,097,510, $56,985,983, $20,475,870, $9,367,969, $10,422,000, $47,761,620, $1,816,000, $15,617,280, $62,643,771, $122,197,759, $151,702,453, $250,000, $1, $56,035,477, $716,331, $187,500,000, $61,566,000, $252,000, $3,959,873, $52,809,507, $24,471,996, $6,117,996, $11,341,677, $317,827, $172,633, $37,921,966, $22,375,189, $60,534,545, $15,306,665, $0, $45,225,381, $40,504,218, $32,126,730, $48,694,632, $1,120,924, $13,722,831, $1,113,032, $2,361,000, $6,996,130, $923,247, $3, $1, $1,201,845, $0, $39,540,146, $7,491,892, $20,019, $2,218, $55,011,041, $14,874,473, $20,339,023, $90,509,738, $178,485,000, $32,836,010, $301,146, $54,353,000, $22,552,209, $5,017,926, $71,817,900, $4,632,829, $3,627,408, $22,347,898, $18,807,918, $45,804,840, $68,399,200, $10,934,833, $3,088,000, $1,441,200, $7,070,769, $70,080,810, $6,624,409, $775,038, $144,157, $6,014,065, $7,094,033, $9,728,692, $12,366,563, $3,796,283, $264,490, $21,849,512, $402,797, $13,873,440, $700,484, $22,280,716, $149,423,941, $83,995,867, $78,514,453, $27,818,080, $14,672,982, $465,142, $60,730,492, $47,337,703, $711,598, $32,709,803, $57,670,611, $6,710,154, $745,309, $4,660,720, $1,045,423, $1, $37,402,098, $52,429,641, $14,523,738, $43,441,404, $16,395,896, $11,664,381, $42,840,839, $92,759,254, $21,615,986, $48,949,162, $17,052,864, $17,052,864, $3,377,868, $18,476,616, $10,370,882, $7,793, $1,667,819, $14,746,472, $40,092,414, $9,770,324, $64,619,159, $15,139,432, $78,803,152, $13,620, $11,034,169, $41,647,590, $5,073,504, $51,641,872, $95,734,502, $93,661,837, $0, $4,764,565, $48,728,442, $1,455,130, $115,820,054, $128,682, $1,135,700, $102,497,783, $119,065, $5,814,436, $9,896,019, $1,101,070, $328,227, $580,738, $6,726,235, $395,770, $48,005,615, $1,063,586, $1,941,291, $36,879,819, $748,547, $5,337,259, $88,269,190, $73,161,629, $1,773, $3,722,755, $112,190,937, $88,912, $6,275,980, $26,882,311, $333,654, $850,000, $24, $42,946, $231,415, $77,113, $25,704, $694,245, $282,465, $1,595,951, $33,461,675, $51,009,931, $312,165, $36,261,531, $2,858,842, $42,469,064, $302,803, $26,591, $3,389,622, $8,834,459, $56,519,570, $34,731,898, $3,381,170, $42,986,878, $936,729, $26,379,481, $12,374,422, $97,483,897, $6,616,483, $5,822,805, $11,294,543, |
The accompanying notes are an integral part of these Consolidated Financial Statements.
35
Partners Group Private Equity (Master Fund), LLC
(a Delaware Limited Liability Company)
Consolidated Schedule of Investments –
March 31, 2025 (continued)
$5,454,677, $7,942,532, $966,531, $3,512,641, $2,299,785, $12,627,224, $644,090, $395,158, $4,614,439, $9,338,118, $1,231,469, $1,631,824, $13,722,969, $5,671,986, $564,906, $7,965,719, $4,975,069, $1,274,487, $2,781, $0, $4,955,543, $8,153,316, $3,003,935, $3,275,883, $1,032,354, $6,988,253, $6, $0, $10,516,807, $4,311,354, $1,953,879, $11,122,344, $1,955,378, $2,226,860, $5,461,613, $5,430,738, $6,051,866, $18,706,458, $6,949,329, $6,721,037, $2,144,830, $2,988,557, $0, $7,716,457, $10,037,119, $223,688, $1,785,490, $3,057,444, $3,426,010, $3,761,619, $2,970,812, $1,980,860, $3,972,574, $1,401,599, $4,423, $7,949,934, $7,632,117, $5,296,300, $2,175,672, $3,620,472, $1,595,475, $3,425,102, $1,683,840, $1,160,723, $2,881,356, $8,767,805, $4,751,912, $7,298,570, $27, $3,078, $883,942, $2,872,053, $9,759,574, $5,541,931, $3,840,578, $1,551,460, $9,196,713, $429,915, $3,552,692, $20,709,673, $4,277,359, $61,672, $4,930,692, $1,634,541, $1,850,033, $4,008,444, $2,045,916, $1,543,960, $6,844,452, $13,766,818, $3,961,369, $6,198,111, $2,028,867, $3,289,259, $5,793,637, $2,692,774, $3,003,903, $1, $3,880,524, $1,787,689, $8,377,380, $0, $8,455,740, $11,622,070, $3,600,000, $4,030,303, $366,660, $2,127,430, $1,370,082, $1,077,566, $2,472,675, $200,000, $1,219,975, $3,212,664, $5,526,461, $0, $236, $2,200,000, $3,709,645, $8,196,102, $1,469,140, $3,190,974, $983,655, $9,637,728, $0, $8,757, $2,760,240, $6,582,727, $4,741,140, $9,584,967, $3,138,681, $4,952,390, $1,649,077, $2,962,003, $1,933,342, $1,922,957, $2,981,268, $583,333, $2,714,896, $7,042, $1,067,522, $2,865,418, $1,421,354, $1,995,025, $1,323,455, $4,491,410, $7,481,343, $1,512,273, $13,301,918, $6,394,951, $1,761,970, $3,931,565, $5,647,723, $5,959,657, $10,707,720, $318, $3,953,475, $1,788,319, $2,565,161, $1,967,997, $6,261,200, $1, $2,596,314, $8,331,952, $5,702,379, $27,263,377, $570,356, $2,153,192, $306,404, $13,692,055, $5,742,856, $5,587,715, $1,526,914, $6,270,683, $375, $6,681,741, $1,297,569, $2,472,574, $-2,084, $2,804,994, $2,355,570, $68, $1,830,720, $149,143, $3,851,321, $49, $536,019, $0, $8,412,088, $0, $1,482,855, $1,266,194, $12,554,060, $3,967,942, $550,035, $4,605,079, $3,405,337, $7,714,982, $1,819,067, $882,748, $2,370,885, $20,704,958, $5,300,526, $6,725,752, $20,283,057, $957,742, $1,648,911, $5,055,466, $5,075,977, $1,344,343, $3,917,172, $0, $6,019,157, $0, $-1,365, $4,717,246, $6,679,103, $3,012,283, $3,284,655, $42, $3,797,330, $8,180,949, $4,574,369, $2,236,238, $2,561,079, $2,598,143, $5,953,150, $7,639,179, $5,448,887, $16,065,373, $2,213,895, $4,617,834, $3,896,484, $5,665,443, $4,287,002, $13,519,588, $1,558,833, $36,285,409, $3,691,558, $4,631, $5,241,117, $4,353,289, $-819, $2,178,880, $4,078,986, $4,153,693, $7,281,848, $6,249,694, $7,102,759, $1,883,515, $7,967,480, $1,106,501, $1,343,206, $1,379,034, $1,362,815, $26,306,409, $1,100,313, $14,567,329, $9,274,444, $5,398,826, $7,054,160, $3,554,594, $1,881,626, $6,159,759, $1, $4,009,554, $6,625,111, $1, $1, $3,595,886, $9,858,091, $7,938,079, $10,223,616, $1,821,701, $1,086,782, $1,950,024, $3,239,847, $6,424,042, $-235, $14,344,082, $0, $8,484,128, $5,387,735, $1,127,513, $11,093,401, $2,100,000, $2,354,676, $6,658,493, $2,437,017, $7,641,182, $6,925,831, $10,151,206, $2,871,977, $6,525,814, $4,179, $11,947,474, $9,015,604, $6,200,538, $2,330,990, $17,334,584, $5,787,363, $7,080,136, $8,587,883, $2,644,160, $962,637, $11,899,081, $7,097,512, $1,363,406, $9,959,807, $5,498,416, $5,082,522, $6,031,188, $2,284,329, $1, $455,319, $5,345, $1,452,079, $2,215,711, $214,056, $1,258,462, $1,506,292, $767,204, $371,506, $763,398, $47,367,427, $10,362,003, $1, $1,206,678, $4,719,912, $7,037,360, $20,360,726, $5,423,912, $8,358,923, $1, $46,978, $1, $1,459,768, $31,837,313, $5,651,257, $1,761, $83,355, $33,157,420, $801,789, $219,534, $60,993, $1, $3,545,824, $1,597,422, $24,017,734, $4,732,290, $6,285,419, $71,291, $68,872,230, $462,822, $471,221, $435,702, $773,375, $1, $1,419,228, $282, $327,077, $1,089,361, $186,446, $121,018, $20,043,423, $1, $354,336, $7,263, $256, $2,013,717, $416,540, $21,052,748, $3,917,575, $105,536, $7,517, $27,422, $2, $818,888, $1, $0, $1, $1, $72,245, $2,311, $102,336, $2,139,275, $1, $20,843,716, $748,369, $3,573,994, $1, $204,488, $234,811, $65,675,607, $8,632,811, $2,570,172, $2,233,879, $1, $1,185,660, $41,404, $19,775,525, $18,635,379, $11,956,199, $1, $116,996, $1, $32,242,262, $75,189,856, $345,231, $14,163,763, $1, $24,111, $772,157, $1,135,156, $704,405, $3,055,335, $1,611,335, $123,070,390, $35,810,529, $413,420, $1, $13,932,792, $5,916,151, $4, $7,300,763, $346,868, $24,892, $6,070,655, $1, $1,293,691, $13,021, $3,750,356, $5,902,708, $494,250, $8,657,632, $192,667, $6,880,500, $2,102,501, $41,920,638, $1,008,832, $1,898,833, $1,827,005, $14,549,760, $10,050,281, $1, $72,928,665, $18,539,820, $1, $404,780, $14,673, $2, $1, $9,302,852, $1,271,287, $532,193, $44,353,234, $844,467, $388,157, $31,364,096, $379,874, $211,205, $366,206, $4, $6,940,605, $39,618,188, $116,073, $4, $322,819, $285,021, $131,615, $1,101,589, $92,701, $176,460, $14,639,947, $3,368,192, $22,386, $1, $1,285,296, $1, $189,098, $1, $2,783,114, $981,706, $1,030,261, $895,011, $2,763,328, $1,066,609, $3, $5,728,521, $12,671,012, $22,172,117, $38,570,837, $882,596, $56,701, $4,016,292, $16,526,250, $1,736,799, $1,086,804, $10,076,545, $36,970,726, $3,915,271, $3,349,170, $1, $164,203, $7,690,954, $27,573, $1, $2,181,595, $562,178, $9,049,849, $14,481,798, $3,473,559, $1, $4,137,429, $513,958, $3, $1, $1, $1, $163,953, $2,016,904, $2,178, $110,957, $302,215, $302,746, $6,498,738, $1, $332,524, $28,576, $1,074,706, $408,001, $1,916,999, $12,749,518, $1, $14,942, $857,687, $1, $1,195,555, $371,045, $1,409,987, $60,330, $1,924,891, $7,650,524, $2,224,688, $1,997,564, $37,465,221, $16,749, $5,122,248, $1,610,663, $11,737,112, $11,973,964, $247,167, $1, $41,818,643, $322,750, $16,898,142, $8,919,013, $30,792,320, $1, $8,537,079, $5,145,015, $83,945, $751,333, $1,875, $1, $1, $1, $0, $102,569, $1,453,010, $1,494,223, $11,606,964, $80,907, $1,157,013, $1, $563, $232,211, $15,621,320, $3,724,292, $288,770, $71,613, $313,338, $72,602, $2,426,353, $38,178,331, $893,496, $1,973,177, $421,061, $83,196, $352,692, $30,535, $2,099,795, $35,457,713, $9,726,490, $1, $213,513, $814,818, $4,454,538, $22,713,138, $103,961, $2,126,405, $17,305,825, $1, $2,336,090, $8,567,627, $5,688,697, $3,767,305, $1,968,049, $73,398, $398,908, $1, $15,585,891, $902,389, $18,351,734, $839,591, $7,636,632, $4,634,657, $1,666,037, $3,696,970, $241,472, $6,472,945, $3,380,361, $8,336,566, $6,860,438, $4,866,068, $2,517,343, $26,534, $6,458,809, $7,401,515, $2,081,159, $3,288,734, $13,789,768, $490,224, $15,398,833, $1, $1, $6,163,158, $1,856,545, $94,819, $1, $16,318,219, $0, $6,277,071, $4,659,307, $0, $1,068,047, $36,615,569, $6,137,881, $988,701, $40,903, $1, $17,378,069, $6,265,366, $1, $14,325,635, $10,218,701, $1,200,473, $1, $1,417,065, $3,296,092, $10,656,000, $0, $375,419, $4,349,294, $1, $1, $46,538, $10,259,299, $713,833, $2,277,091, $532,868, $0, $1,710,433, $642,712, $8,973,340, $24,496,837, $1,007,440, $3,550,731, $7,472,270, $6,088,418, $900,652, $9,563,093, $1, $11,255,204, $0, $0, $1,322,506, $5,496,717, $7,388,593, $0, $1,643,762, $1,561,937, $495,336, $4,643,830, $6,621,777, $922,767, $0,
The accompanying notes are an integral part of these Consolidated Financial Statements.
36
Partners Group Private Equity (Master Fund), LLC
(a Delaware Limited Liability Company)
Consolidated Schedule of Investments –
March 31, 2025 (continued)
$980,000, $3,027,243, $1,783,129, $5,545, $7,428,116, $0, $7,717,500, $1,283,750, $1,202,500, $15,535,018, $4,973,047, $218,724, $5,537,640, $575,011, $4,359,398, $3,712,500, $3,375,000, $893,750, $1,580,000, $6,901,709, $0, $150,000, $3,027,013, $357,845, $8,439,634, $0, $2,745,000, $1, $7,537,707, $1,544,596, $1, $18,086,716, $1,164,908, $1, $123,040, $0, $1, $23,092,834, $2,790,551, $0, $4,098,364, $0, $1, $6,055,258, $1, $18,154,264, $5,983,567, $4,735,103, $5,506,875, $570,000, $2,477,125, $235,000, $8,323, $1,996,173, $0, $2,701,875, $4,762,500, $10,838,750, $3,601,700, $8,689,126, $57,612, $1, $1,367,402, $12,913,373, $1,056,937, $1, $6,796,748, $11,956,871, $1,413,908, $13,780,297, $0, $17,467,290, $13,800,997, $203,697, $10,076,545, $13,098,140, $430,145, $5,555,367, $5,677,215, $1, $7,853,743, $2,097,525, $8,335,974, $1, $662,130, $4,737,450, $38,254,188, $5,476,103, $15,380,794, $1, $1, $9,529,257, $16,484,967, $7,540,761, $4,565,709, $1, $6,851,830, $15,618,700, $277,924, $1, $2,347,610, $20,184,969, $1,044,098, $1, $12,151,342, $1, $7,156,987, $4,655,674, $4,449,052, $148,042, $39,622, $2,026,590, $3,757,943, $1,576,591, $18,109,404, $1, $9,624,024, $2,748,895, $19,734,153, $11,700,836, $3,670,250, $1,779,255, $12,589,286, $1, $1, $1, $1, $17,744,805, $10,673,189, $12,618,586, $12,025,199, $5,884,526, $16,026,671, $15,071,651, $16,653,294, $5,646,414, $91,798, $1, $10,598,970, $23,338,239, $10,317,738, $2,366,441, $6,947,365, $1, $1,376,191, $132,781, $25,584,912 and $1,653,280, respectively, totaling $10,780,359,996.
|
b |
Represents an affiliated issuer. |
|
c |
Investment does not issue shares. |
|
d |
Non-income producing. |
|
e |
Investment has been committed to but has not been fully funded by the Fund. |
|
f |
Security or a portion thereof is unsettled at March 31, 2025. |
A summary of outstanding financial instruments at March 31, 2025 is as follows:
Forward Foreign Currency Contracts |
|||||||||||||||||
Settlement Date |
Counterparty |
Currency |
Currency |
Value |
Unrealized |
||||||||||||
April 9, 2025 |
BNY Mellon |
$ | 9,843,813 | zl | 39,200,000 | $ | 10,163,247 | $ | (319,434 | ) | |||||||
April 9, 2025 |
BNY Mellon |
zl | 39,200,000 | $ | 10,163,421 | $ | 10,163,247 | $ | (174 | ) | |||||||
April 9, 2025 |
Barclays |
$ | 73,555,265 | € | 70,000,000 | $ | 76,052,367 | $ | (2,497,102 | ) | |||||||
April 9, 2025 |
Barclays |
$ | 94,746,825 | € | 90,000,000 | $ | 97,781,615 | $ | (3,034,790 | ) | |||||||
April 9, 2025 |
Barclays |
$ | 70,165,402 | € | 67,000,000 | $ | 72,792,980 | $ | (2,627,578 | ) | |||||||
April 9, 2025 |
Barclays |
$ | 13,620,585 | € | 13,000,000 | $ | 14,124,011 | $ | (503,426 | ) | |||||||
April 9, 2025 |
Barclays |
€ | 90,000,000 | $ | 97,760,412 | $ | 97,781,615 | $ | 21,203 | ||||||||
April 9, 2025 |
Barclays |
€ | 90,000,000 | $ | 97,808,166 | $ | 97,781,615 | $ | (26,551 | ) | |||||||
April 9, 2025 |
Barclays |
€ | 30,000,000 | $ | 32,600,019 | $ | 32,593,872 | $ | (6,147 | ) | |||||||
April 9, 2025 |
Barclays |
€ | 30,000,000 | $ | 32,587,107 | $ | 32,593,872 | $ | 6,765 | ||||||||
April 15, 2025 |
Barclays |
$ | 42,852,065 | € | 40,700,000 | $ | 44,225,750 | $ | (1,373,685 | ) | |||||||
April 15, 2025 |
Barclays |
$ | 30,839,718 | € | 29,300,000 | $ | 31,838,194 | $ | (998,476 | ) | |||||||
April 15, 2025 |
Barclays |
$ | 20,954,506 | € | 20,000,000 | $ | 21,732,555 | $ | (778,049 | ) | |||||||
April 15, 2025 |
Barclays |
€ | 90,000,000 | $ | 97,804,584 | $ | 97,796,500 | $ | (8,084 | ) | |||||||
April 15, 2025 |
Nomura International PLC |
$ | 94,812,804 | € | 90,000,000 | $ | 97,796,500 | $ | (2,983,696 | ) | |||||||
April 15, 2025 |
Nomura International PLC |
€ | 90,000,000 | $ | 97,794,000 | $ | 97,796,500 | $ | 2,500 | ||||||||
April 24, 2025 |
Barclays |
$ | 28,740,404 | € | 27,280,000 | $ | 29,662,122 | $ | (921,718 | ) | |||||||
April 24, 2025 |
Barclays |
$ | 45,006,969 | € | 42,720,000 | $ | 46,450,362 | $ | (1,443,393 | ) | |||||||
April 24, 2025 |
Barclays |
$ | 94,867,380 | € | 90,000,000 | $ | 97,858,908 | $ | (2,991,528 | ) | |||||||
April 24, 2025 |
Barclays |
$ | 16,360,483 | £ | 13,000,000 | $ | 16,806,752 | $ | (446,269 | ) | |||||||
April 24, 2025 |
Barclays |
€ | 90,000,000 | $ | 97,853,832 | $ | 97,858,908 | $ | 5,076 | ||||||||
April 24, 2025 |
Barclays |
£ | 13,000,000 | $ | 16,807,402 | $ | 16,806,752 | $ | (650 | ) | |||||||
April 24, 2025 |
Barclays |
€ | 70,000,000 | $ | 76,125,364 | $ | 76,112,484 | $ | (12,880 | ) | |||||||
May 7, 2025 |
BNY Mellon |
$ | 44,805,838 | € | 42,500,000 | $ | 45,981,782 | $ | (1,175,944 | ) | |||||||
May 7, 2025 |
BNY Mellon |
$ | 78,321,679 | Fr. | 70,000,000 | $ | 79,439,849 | $ | (1,118,170 | ) | |||||||
May 7, 2025 |
BNY Mellon |
$ | 25,082,887 | zl | 100,000,000 | $ | 25,742,293 | $ | (659,406 | ) | |||||||
May 7, 2025 |
Bank of America |
$ | 24,764,588 | zl | 100,000,000 | $ | 25,742,293 | $ | (977,705 | ) | |||||||
May 7, 2025 |
Bank of America |
$ | 24,831,932 | zl | 100,000,000 | $ | 25,742,293 | $ | (910,361 | ) | |||||||
May 7, 2025 |
Bank of America |
$ | 5,016,923 | zl | 20,000,000 | $ | 5,148,459 | $ | (131,535 | ) | |||||||
The accompanying notes are an integral part of these Consolidated Financial Statements.
37
Partners Group Private Equity (Master Fund), LLC
(a Delaware Limited Liability Company)
Consolidated Schedule of Investments –
March 31, 2025 (continued)
Forward Foreign Currency Contracts |
|||||||||||||||||
Settlement Date |
Counterparty |
Currency |
Currency |
Value |
Unrealized |
||||||||||||
May 7, 2025 |
Barclays |
$ | 94,886,739 | € | 90,000,000 | $ | 97,373,185 | $ | (2,486,446 | ) | |||||||
May 7, 2025 |
Barclays |
$ | 28,842,025 | € | 27,500,000 | $ | 29,752,918 | $ | (910,893 | ) | |||||||
May 14, 2025 |
BNY Mellon |
$ | 70,013,184 | € | 66,360,000 | $ | 71,822,866 | $ | (1,809,682 | ) | |||||||
May 14, 2025 |
Barclays |
$ | 14,385,448 | € | 13,640,000 | $ | 14,762,868 | $ | (377,420 | ) | |||||||
May 14, 2025 |
Barclays |
$ | 83,986,848 | € | 80,000,000 | $ | 86,585,734 | $ | (2,598,886 | ) | |||||||
May 14, 2025 |
Barclays |
$ | 75,533,142 | £ | 60,000,000 | $ | 77,446,087 | $ | (1,912,945 | ) | |||||||
May 21, 2025 |
BNY Mellon |
$ | 78,448,425 | Fr. | 70,000,000 | $ | 79,569,052 | $ | (1,120,627 | ) | |||||||
May 21, 2025 |
Barclays |
$ | 83,994,264 | € | 80,000,000 | $ | 86,617,886 | $ | (2,623,622 | ) | |||||||
May 21, 2025 |
Nomura International PLC |
$ | 84,418,184 | € | 80,000,000 | $ | 86,617,886 | $ | (2,199,702 | ) | |||||||
June 11, 2025 |
Bank of America |
$ | 20,224,776 | Fr. | 18,000,000 | $ | 20,510,307 | $ | (285,531 | ) | |||||||
June 11, 2025 |
Barclays |
$ | 94,634,055 | € | 90,000,000 | $ | 97,576,210 | $ | (2,942,155 | ) | |||||||
June 11, 2025 |
Barclays |
$ | 75,519,816 | £ | 60,000,000 | $ | 77,439,263 | $ | (1,919,447 | ) | |||||||
June 11, 2025 |
Barclays |
$ | 73,566,374 | € | 70,000,000 | $ | 75,892,608 | $ | (2,326,234 | ) | |||||||
June 11, 2025 |
Barclays |
$ | 19,009,095 | € | 17,500,000 | $ | 18,973,152 | $ | 35,943 | ||||||||
June 11, 2025 |
Nomura International PLC |
$ | 33,490,800 | € | 30,000,000 | $ | 32,525,403 | $ | 965,397 | ||||||||
June 11, 2025 |
Nomura International PLC |
$ | 62,126,109 | € | 55,700,000 | $ | 60,388,832 | $ | 1,737,277 | ||||||||
June 11, 2025 |
Nomura International PLC |
€ | 85,700,000 | $ | 91,047,680 | $ | 92,914,235 | $ | 1,866,555 | ||||||||
June 18, 2025 |
BNY Mellon |
$ | 68,600,450 | Fr. | 61,000,000 | $ | 69,563,050 | $ | (962,600 | ) | |||||||
June 18, 2025 |
BNY Mellon |
$ | 10,121,367 | Fr. | 9,000,000 | $ | 10,263,401 | $ | (142,034 | ) | |||||||
June 18, 2025 |
BNY Mellon |
$ | 22,390,556 | zl | 89,600,000 | $ | 23,025,144 | $ | (634,588 | ) | |||||||
June 18, 2025 |
Bank of America |
$ | 25,042,773 | zl | 100,000,000 | $ | 25,697,706 | $ | (654,933 | ) | |||||||
June 18, 2025 |
Bank of America |
$ | 25,032,185 | zl | 100,000,000 | $ | 25,697,706 | $ | (665,521 | ) | |||||||
June 18, 2025 |
Bank of America |
$ | 7,596,721 | zl | 30,400,000 | $ | 7,812,103 | $ | (215,382 | ) | |||||||
June 18, 2025 |
Barclays |
$ | 94,637,016 | € | 90,000,000 | $ | 97,590,210 | $ | (2,953,194 | ) | |||||||
June 18, 2025 |
Barclays |
$ | 67,342,092 | £ | 53,500,000 | $ | 69,048,357 | $ | (1,706,265 | ) | |||||||
June 18, 2025 |
Barclays |
$ | 8,181,189 | £ | 6,500,000 | $ | 8,389,053 | $ | (207,864 | ) | |||||||
June 18, 2025 |
Barclays |
$ | 73,589,705 | € | 70,000,000 | $ | 75,903,497 | $ | (2,313,792 | ) | |||||||
June 25, 2025 |
Bank of America |
$ | 25,120,048 | zl | 100,000,000 | $ | 25,690,666 | $ | (570,618 | ) | |||||||
June 25, 2025 |
Bank of America |
$ | 25,120,048 | zl | 100,000,000 | $ | 25,690,666 | $ | (570,618 | ) | |||||||
June 25, 2025 |
Bank of America |
$ | 15,193,268 | Fr. | 13,500,000 | $ | 15,407,459 | $ | (214,191 | ) | |||||||
June 25, 2025 |
Bank of America |
$ | 63,589,870 | Fr. | 56,500,000 | $ | 64,483,069 | $ | (893,199 | ) | |||||||
June 25, 2025 |
Bank of America |
$ | 41,020,184 | € | 39,000,000 | $ | 42,305,123 | $ | (1,284,939 | ) | |||||||
June 25, 2025 |
Bank of America |
$ | 94,661,964 | € | 90,000,000 | $ | 97,627,208 | $ | (2,965,244 | ) | |||||||
June 25, 2025 |
Bank of America |
$ | 23,925,612 | zl | 95,600,000 | $ | 24,560,277 | $ | (634,665 | ) | |||||||
June 25, 2025 |
Bank of America |
$ | 6,091,680 | zl | 24,400,000 | $ | 6,268,523 | $ | (176,842 | ) | |||||||
June 25, 2025 |
Barclays |
$ | 63,247,338 | £ | 50,250,000 | $ | 64,852,226 | $ | (1,604,888 | ) | |||||||
June 25, 2025 |
Barclays |
$ | 12,272,922 | £ | 9,750,000 | $ | 12,583,268 | $ | (310,346 | ) | |||||||
June 25, 2025 |
Barclays |
$ | 32,605,849 | € | 31,000,000 | $ | 33,627,149 | $ | (1,021,300 | ) | |||||||
July 16, 2025 |
Barclays |
$ | 98,285,733 | € | 90,000,000 | $ | 97,782,251 | $ | 503,482 | ||||||||
July 16, 2025 |
Barclays |
$ | 32,762,016 | € | 30,000,000 | $ | 32,594,084 | $ | 167,932 | ||||||||
July 16, 2025 |
Nomura International PLC |
$ | 98,254,800 | € | 90,000,000 | $ | 97,782,251 | $ | 472,549 | ||||||||
July 23, 2025 |
BNY Mellon |
$ | 10,121,917 | zl | 39,200,000 | $ | 10,063,013 | $ | 58,904 | ||||||||
July 23, 2025 |
Barclays |
$ | 98,338,761 | € | 90,000,000 | $ | 97,821,947 | $ | 516,814 | ||||||||
July 23, 2025 |
Barclays |
$ | 32,787,315 | € | 30,000,000 | $ | 32,607,316 | $ | 179,999 | ||||||||
July 23, 2025 |
Barclays |
$ | 98,335,665 | € | 90,000,000 | $ | 97,821,947 | $ | 513,718 | ||||||||
July 30, 2025 |
Barclays |
$ | 16,804,695 | £ | 13,000,000 | $ | 16,781,062 | $ | 23,633 | ||||||||
July 30, 2025 |
Barclays |
$ | 98,407,413 | € | 90,000,000 | $ | 97,861,518 | $ | 545,895 | ||||||||
The accompanying notes are an integral part of these Consolidated Financial Statements.
38
Partners Group Private Equity (Master Fund), LLC
(a Delaware Limited Liability Company)
Consolidated Schedule of Investments –
March 31, 2025 (continued)
Forward Foreign Currency Contracts |
|||||||||||||||||
Settlement Date |
Counterparty |
Currency |
Currency |
Value |
Unrealized |
||||||||||||
July 30, 2025 |
Barclays |
$ | 76,531,651 | € | 70,000,000 | $ | 76,114,514 | $ | 417,137 | ||||||||
September 10, 2025 |
Nomura International PLC |
$ | 28,771,150 | € | 25,700,000 | $ | 28,139,635 | $ | 631,515 | ||||||||
September 10, 2025 |
Nomura International PLC |
$ | 62,231,215 | € | 55,700,000 | $ | 60,987,458 | $ | 1,243,757 | ||||||||
September 10, 2025 |
Nomura International PLC |
$ | 5,592,900 | € | 5,000,000 | $ | 5,474,637 | $ | 118,263 | ||||||||
September 10, 2025 |
Nomura International PLC |
€ | 86,400,000 | $ | 94,582,080 | $ | 94,601,729 | $ | 19,649 | ||||||||
December 10, 2025 |
Nomura International PLC |
$ | 56,813,913 | € | 50,700,000 | $ | 55,558,555 | $ | 1,255,358 | ||||||||
December 10, 2025 |
Nomura International PLC |
$ | 39,238,850 | € | 35,000,000 | $ | 38,354,032 | $ | 884,818 | ||||||||
March 11, 2026 |
Nomura International PLC |
$ | 62,576,165 | € | 55,700,000 | $ | 61,327,426 | $ | 1,248,739 | ||||||||
March 11, 2026 |
Nomura International PLC |
$ | 23,268,871 | € | 20,700,000 | $ | 22,791,342 | $ | 477,529 | ||||||||
March 11, 2026 |
Nomura International PLC |
$ | 11,228,500 | € | 10,000,000 | $ | 11,010,310 | $ | 218,190 | ||||||||
June 10, 2026 |
Nomura International PLC |
$ | 45,076,000 | € | 40,000,000 | $ | 44,205,236 | $ | 870,764 | ||||||||
June 10, 2026 |
Nomura International PLC |
$ | 51,526,979 | € | 45,700,000 | $ | 50,504,482 | $ | 1,022,497 | ||||||||
September 9, 2026 |
Nomura International PLC |
$ | 62,872,766 | € | 55,700,000 | $ | 61,788,863 | $ | 1,083,903 | ||||||||
September 9, 2026 |
Nomura International PLC |
$ | 17,735,506 | € | 15,700,000 | $ | 17,416,251 | $ | 319,255 | ||||||||
September 9, 2026 |
Nomura International PLC |
$ | 16,950,450 | € | 15,000,000 | $ | 16,639,730 | $ | 310,720 | ||||||||
December 2, 2026 |
Nomura International PLC |
$ | 93,757,941 | € | 85,700,000 | $ | 95,345,203 | $ | (1,587,262 | ) | |||||||
March 10, 2027 |
Nomura International PLC |
$ | 96,847,488 | € | 86,400,000 | $ | 96,579,082 | $ | 268,406 | ||||||||
| $ | (53,736,484 | ) | |||||||||||||||
Legend:
£ - British Pound
€ - Euro
BBSY - Bank Bill Swap Rate
E - EURIBOR
Fr. - Swiss Franc
I - Indian Rupee
PIK - Payment-in-kind
P - PRIME
S - Sterling Overnight Interbank Average Rate
SF - Secured Overnight Financing Rate
SR - Stockholm Interbank Offered Rate
zl - Polish Zloty
The accompanying notes are an integral part of these Consolidated Financial Statements.
39
Partners Group Private Equity (Master Fund), LLC
(a Delaware Limited Liability Company)
Consolidated Statement of Assets and Liabilities –
March 31, 2025
Assets |
||||
Unaffiliated Private Equity Investments, at fair value (cost $7,423,060,385) |
$ | 10,284,295,844 | ||
Affiliated Private Equity Investments, at fair value (cost of $3,357,299,611) |
4,657,390,248 | |||
Common stocks, at fair value (cost $723,505,433) |
772,125,511 | |||
High Yield Bonds, at fair value (cost $122,837,666) |
128,263,335 | |||
Asset-Backed Securities, at fair value (cost $77,942,191) |
77,121,627 | |||
Floating Rate Loans, at fair value (cost $325,890,297) |
326,426,005 | |||
Cash and cash equivalents |
236,741,344 | |||
Cash denominated in foreign currencies (cost $39,413,185) |
42,189,697 | |||
Investment sales receivable |
13,078,681 | |||
Unaffiliated dividends and interest receivable |
43,669,506 | |||
Affiliated interest receivable |
961,632 | |||
Due from broker |
75,630,000 | |||
Unrealized appreciation on forward foreign currency contracts |
18,014,142 | |||
Other receivable |
23,468,351 | |||
Receivable for fund units sold |
244,584 | |||
Prepaid expenses |
437,732 | |||
Total Assets |
$ | 16,700,058,239 | ||
Liabilities |
||||
Investment purchases payable |
219,535,572 | |||
Distribution, servicing and transfer agency fees payable |
18,466,099 | |||
Unrealized depreciation on forward foreign currency contracts |
71,750,626 | |||
Repurchase amounts payable for tender offers |
483,273,906 | |||
Due to affiliates |
120,000 | |||
Incentive fee payable |
22,960,888 | |||
Management fees payable |
44,135,063 | |||
Dividends payable |
78,541 | |||
Professional fees payable |
476,010 | |||
Line of credit fees payable |
12,887,600 | |||
Interest expense payable |
3,996,964 | |||
Accounting and administration fees payable |
6,980,479 | |||
Custodian fees payable |
431,788 | |||
Deferred tax liability, net |
33,656,755 | |||
Other payable |
6,192,835 | |||
Total Liabilities |
$ | 924,943,126 | ||
Commitments and contingencies (See note 11) |
||||
Net Assets |
$ | 15,775,115,113 | ||
Net Assets consists of: |
||||
Paid-in capital |
$ | 12,616,274,978 | ||
Distributable earnings (accumulated loss) |
3,158,840,135 | |||
Total Net Assets |
$ | 15,775,115,113 |
The accompanying notes are an integral part of these Consolidated Financial Statements.
40
Partners Group Private Equity (Master Fund), LLC
(a Delaware Limited Liability Company)
Consolidated Statement of Assets and Liabilities –
March 31, 2025 (continued)
Class A Units |
||||
Net assets |
$ | 8,583,218,907 | ||
Units outstanding |
4,143,977,069 | |||
Net asset value per unit |
$ | 2.07 | ||
Class I Units |
||||
Net assets |
$ | 7,191,896,206 | ||
Units outstanding |
3,307,771,127 | |||
Net asset value per unit |
$ | 2.17 |
The accompanying notes are an integral part of these Consolidated Financial Statements.
41
Partners Group Private Equity (Master Fund), LLC
(a Delaware Limited Liability Company)
Consolidated Statement of Operations –
For the Year Ended March 31, 2025
Investment Income |
||||
Dividends from unaffiliated investments (net of $603,914 withholding tax) |
$ | 76,395,555 | ||
Dividends from affiliated investments |
5,937,921 | |||
Interest from unaffiliated investments |
209,892,001 | |||
Interest from affiliated investments |
2,295,667 | |||
Transaction fee income from unaffiliated issuers |
3,751,335 | |||
Transaction fee income from affiliated issuers |
6,777,047 | |||
Other fee income |
7,784,662 | |||
Total Investment Income |
312,834,188 | |||
Operating Expenses |
||||
Management fees |
251,737,540 | |||
Incentive fees |
99,456,006 | |||
Line of credit fees |
13,517,167 | |||
Professional fees |
10,170,367 | |||
Accounting and administration fees |
7,500,752 | |||
Board of Managers’ fees |
530,000 | |||
Custodian fees |
486,161 | |||
Insurance expense |
393,402 | |||
Interest expense |
13,475 | |||
Distribution and servicing fees |
||||
Class A Units |
58,995,659 | |||
Transfer agency fees |
||||
Class A Units |
1,270,679 | |||
Class I Units |
849,693 | |||
Other expenses |
1,753,132 | |||
Total Expenses |
446,674,033 | |||
Net Investment Loss |
(133,839,845 | ) | ||
Net Realized Gain (Loss) and Change in Unrealized Appreciation (Depreciation) on Investments, Forward Foreign Currency Contracts and Foreign Currency |
||||
Net realized gain from investments |
453,830,979 | |||
Net realized gain from affiliated investments |
69,764,959 | |||
Net realized loss on foreign currency transactions |
(6,917,754 | ) | ||
Net realized gain on forward foreign currency contracts |
106,893,375 | |||
Net realized gain distributions from primary and secondary investments |
156,954,028 | |||
Net change in accumulated unrealized appreciation (depreciation) on: |
||||
Unaffiliated investments |
82,410,129 | |||
Affiliated investments |
189,805,281 | |||
Foreign currency translation |
2,013,342 | |||
Forward foreign currency contracts |
(82,967,210 | ) | ||
Deferred income tax expense on unrealized appreciation |
(3,774,940 | ) | ||
Net Realized Gain (Loss) and Change in Unrealized Appreciation (Depreciation) on Investments, Forward Foreign Currency Contracts and Foreign Currency |
968,012,189 | |||
Net Increase (Decrease) in Net Assets From Operations |
$ | 834,172,344 |
The accompanying notes are an integral part of these Consolidated Financial Statements.
42
Partners Group Private Equity (Master Fund), LLC
(a Delaware Limited Liability Company)
Consolidated Statements of Changes in Net Assets –
For the |
For the |
|||||||
Increase (decrease) in Net Assets resulting from operations: |
||||||||
Net investment loss |
$ | (133,839,845 | ) | $ | (153,954,880 | ) | ||
Net realized gain (loss) on investments, foreign currency transactions and forward foreign currency contracts |
780,525,587 | 193,797,042 | ||||||
Net change in unrealized appreciation (depreciation) on investments, foreign currency translation and forward foreign currency contracts |
187,486,602 | 796,526,277 | ||||||
Net increase in Net Assets resulting from operations |
$ | 834,172,344 | $ | 836,368,439 | ||||
Distributions to Members from: |
||||||||
Distributable earnings |
(275,119,177 | ) | (400,009,858 | ) | ||||
Total distributions to Members |
$ | (275,119,177 | ) | $ | (400,009,858 | ) | ||
Capital transactions (See note 5): |
||||||||
Issuance of common Units |
||||||||
Class A Units |
$ | 897,386,781 | $ | 867,184,668 | ||||
Class I Units |
838,147,453 | 728,148,848 | ||||||
Reinvestment of common Units |
||||||||
Class A Units |
141,591,539 | 207,209,706 | ||||||
Class I Units |
104,103,438 | 152,280,709 | ||||||
Redemption of common Units |
||||||||
Class A Units |
(693,458,689 | ) | (438,997,302 | ) | ||||
Class I Units |
(876,816,689 | ) | (554,919,154 | ) | ||||
Exchanges of common Units |
||||||||
Class A Units |
(42,299,009 | ) | (62,024,192 | ) | ||||
Class I Units |
42,299,009 | 62,024,192 | ||||||
Total increase in Net Assets resulting from capital transactions |
$ | 410,953,833 | $ | 960,907,475 | ||||
Total increase in Net Assets |
$ | 970,007,000 | $ | 1,397,266,056 | ||||
Net Assets at beginning of year |
$ | 14,805,108,113 | $ | 13,407,842,057 | ||||
Net Assets at end of year |
$ | 15,775,115,113 | $ | 14,805,108,113 | ||||
The accompanying notes are an integral part of these Consolidated Financial Statements.
43
Partners Group Private Equity (Master Fund), LLC
(a Delaware Limited Liability Company)
Consolidated Statement of Cash Flows –
For the Year Ended March 31, 2025
CASH FLOWS FROM OPERATING ACTIVITIES |
||||
Net Increase in Net Assets from Operations |
$ | 834,172,344 | ||
Adjustments to reconcile Net Increase (Decrease) in Net Assets from Operations to net cash provided by (used in) operating activities: |
||||
Net change in accumulated unrealized (appreciation) depreciation on investments |
(272,215,410 | ) | ||
Net change in unrealized (appreciation) depreciation on forward foreign currency contracts |
82,967,210 | |||
Net realized (gain) loss from investments and foreign currency transactions |
(516,678,184 | ) | ||
Purchases of investments |
(3,489,311,392 | ) | ||
Interest income pay-in-kind |
710,443 | |||
Proceeds from sales of investments |
2,197,056,663 | |||
Sales and amortization of short-term investments |
74,236,426 | |||
Amortization of premium and accretion of discount |
(5,807,971 | ) | ||
Decrease in deposit for investments |
656,586 | |||
Increase in dividends and interest receivable |
(27,386,835 | ) | ||
Increase in due from broker |
(75,630,000 | ) | ||
Increase in other receivable |
(19,434,865 | ) | ||
Increase in prepaid expenses |
(353,799 | ) | ||
Increase in dividends payable |
73,554 | |||
Increase in due to affiliates |
120,000 | |||
Decrease in due to broker |
(26,320,000 | ) | ||
Increase in incentive fees payable |
5,898,495 | |||
Increase in management fees payable |
5,770,596 | |||
Increase in distribution, servicing and transfer agency fees payable |
928,960 | |||
Decrease in professional fees payable |
(2,060,021 | ) | ||
Increase in line of credit fees payable |
10,147,133 | |||
Increase in interest expense payable |
3,985,353 | |||
Increase in accounting and administrative fees payable |
1,901,922 | |||
Increase in custodian fees payable |
117,685 | |||
Increase in deferred tax liability, net |
3,774,940 | |||
Increase in other payable |
6,145,198 | |||
Net Cash (Used in) Operating Activities |
(1,206,534,969 | ) | ||
The accompanying notes are an integral part of these Consolidated Financial Statements.
44
Partners Group Private Equity (Master Fund), LLC
(a Delaware Limited Liability Company)
Consolidated Statement of Cash Flows –
For the Year Ended March 31, 2025 (continued)
CASH FLOWS FROM FINANCING ACTIVITIES |
||||
Proceeds from issuance of Units |
$ | 1,735,289,650 | ||
Distributions paid |
(29,424,200 | ) | ||
Payments for Units redeemed |
(1,394,038,636 | ) | ||
Net Cash Provided by Financing Activities |
311,826,814 | |||
Net change in cash and cash equivalents |
(894,708,155 | ) | ||
Effect of exchange rate changes on cash |
(6,917,754 | ) | ||
Cash and cash equivalents at beginning of year(1) |
1,180,556,950 | |||
Cash and cash equivalents at end of year(2) |
$ | 278,931,041 | ||
Supplemental and non-cash financing activities |
||||
Cash paid during the year for interest |
$ | (3,971,878 | ) | |
Reinvestment of common Units |
$ | 245,694,977 |
|
(1) |
Balance includes cash and cash equivalents and cash denominated in foreign currencies of $1,163,033,562 and $17,523,388 respectively. |
|
(2) |
Balance includes cash and cash equivalents and cash denominated in foreign currencies of $236,741,344 and $42,189,697, respectively. |
The accompanying notes are an integral part of these Consolidated Financial Statements.
45
Partners Group Private Equity (Master Fund), LLC
(a Delaware Limited Liability Company)
Consolidated Financial Highlights –
Class A |
||||||||||||||||||||
Year Ended |
Year Ended |
Year Ended |
Year Ended |
Year Ended |
||||||||||||||||
Per Unit Operating Performance:(1) |
||||||||||||||||||||
Net asset value, beginning of year |
$ | 2.01 | $ | 1.95 | $ | 1.98 | $ | 1.78 | $ | 1.33 | ||||||||||
Income from investment operations: |
||||||||||||||||||||
Net investment loss(2) |
(0.03 | ) | (0.03 | ) | (0.03 | ) | (0.06 | ) | (0.05 | ) | ||||||||||
Net realized and unrealized gains (losses) on investments(2) |
0.13 | 0.15 | 0.06 | 0.38 | 0.53 | |||||||||||||||
Net increase (decrease) in net assets resulting from operations |
0.10 | 0.12 | 0.03 | 0.32 | 0.48 | |||||||||||||||
Distributions from: |
||||||||||||||||||||
Net realized gains |
(0.04 | ) | (0.06 | ) | (0.06 | ) | (0.12 | ) | (0.03 | ) | ||||||||||
Total distributions |
(0.04 | ) | (0.06 | ) | (0.06 | ) | (0.12 | ) | (0.03 | ) | ||||||||||
Net asset value, end of year |
$ | 2.07 | $ | 2.01 | $ | 1.95 | $ | 1.98 | $ | 1.78 | ||||||||||
Total Return(3) |
5.07 | % | 5.68 | % | 1.96 | % | 18.12 | % | 36.48 | % | ||||||||||
Ratios and supplemental data: |
||||||||||||||||||||
Net assets, end of year in thousands (000’s) |
$ | 8,583,219 | $ | 8,007,550 | $ | 7,228,144 | $ | 6,367,381 | $ | 4,098,863 | ||||||||||
Net investment income (loss) to average net assets before Incentive Fee |
(0.55 | )% | (0.71 | )% | (1.28 | )% | (1.29 | )% | (1.00 | )% | ||||||||||
Ratio of gross expenses to average net assets, excluding Incentive Fee(4)(5) |
2.56 | % | 2.58 | % | 2.67 | % | 2.72 | % | 2.77 | % | ||||||||||
Ratio of Incentive Fee to average net assets |
0.64 | % | 0.70 | % | 0.33 | % | 1.88 | % | 2.10 | % | ||||||||||
Ratio of gross expenses and Incentive Fee to average net assets(4)(5) |
3.20 | % | 3.28 | % | 3.00 | % | 4.60 | % | 4.87 | % | ||||||||||
Ratio of expense waivers to average net assets |
— | % | — | % | — | % | — | % | — | % | ||||||||||
Ratio of net expenses and Incentive Fee to average net assets(5) |
3.20 | % | 3.28 | % | 3.00 | % | 4.60 | % | 4.87 | % | ||||||||||
Ratio of net expenses to average net assets, excluding Incentive Fee(5) |
2.56 | % | 2.58 | % | 2.67 | % | 2.72 | % | 2.77 | % | ||||||||||
Portfolio Turnover |
15.04 | % | 12.48 | % | 10.26 | % | 20.77 | % | 19.36 | % | ||||||||||
|
* |
During the year ended March 31, 2025, the Fund effected a 1-for-4 unit split on July 2, 2024. All historical per unit information has been retroactively adjusted to reflect this unit split. |
|
(1) |
Selected data for a Net Asset Value per Unit outstanding throughout the period. |
|
(2) |
Calculated using average units outstanding. |
|
(3) |
Total return based on net asset value calculated as the change in Net Asset Value per Unit during the respective periods, assuming distributions, if any, are reinvested on the effects of the performance of the Fund during the period. |
|
(4) |
Represents the ratio of expenses to average net assets absent fee waivers and/or expense waivers by/to the Adviser. |
|
(5) |
Ratio does not include expenses of Primary and Secondary Investments. |
The accompanying notes are an integral part of these Consolidated Financial Statements.
46
Partners Group Private Equity (Master Fund), LLC
(a Delaware Limited Liability Company)
Consolidated Financial Highlights –
Class I |
||||||||||||||||||||
Year Ended |
Year Ended |
Year Ended |
Year Ended |
Year Ended |
||||||||||||||||
Per Unit Operating Performance:(1) |
||||||||||||||||||||
Net asset value, beginning of year |
$ | 2.09 | $ | 2.02 | $ | 2.03 | $ | 1.80 | $ | 1.34 | ||||||||||
Income from investment operations: |
||||||||||||||||||||
Net investment income (loss)(2) |
(0.01 | ) | (0.01 | ) | (0.02 | ) | (0.05 | ) | (0.04 | ) | ||||||||||
Net realized and unrealized gain (loss) on investments(2) |
0.13 | 0.14 | 0.07 | 0.40 | 0.53 | |||||||||||||||
Net Increase in Net Assets from Operations |
0.12 | 0.13 | 0.05 | 0.35 | 0.49 | |||||||||||||||
Distributions from: |
||||||||||||||||||||
Net realized gains |
(0.04 | ) | (0.06 | ) | (0.06 | ) | (0.12 | ) | (0.03 | ) | ||||||||||
Total distributions |
(0.04 | ) | (0.06 | ) | (0.06 | ) | (0.12 | ) | (0.03 | ) | ||||||||||
Net asset value, end of year |
$ | 2.17 | $ | 2.09 | $ | 2.02 | $ | 2.03 | $ | 1.80 | ||||||||||
Total Return after Incentive Fee(3) |
5.80 | % | 6.42 | % | 2.68 | % | 18.95 | % | 37.44 | % | ||||||||||
Ratio and Supplemental Data: |
||||||||||||||||||||
Net assets, end of period in thousands (000’s) |
$ | 7,191,896 | $ | 6,797,558 | $ | 6,179,698 | $ | 5,703,697 | $ | 3,688,456 | ||||||||||
Net investment income (loss) to average net assets before Incentive Fee(4)(5) |
0.16 | % | (0.01 | )% | (0.57 | )% | (0.56 | )% | (0.29 | )% | ||||||||||
Ratio of gross expenses to average net assets, excluding Incentive Fee(4)(5) |
1.86 | % | 1.88 | % | 1.96 | % | 2.00 | % | 2.05 | % | ||||||||||
Ratio of Incentive Fee to average net assets |
0.64 | % | 0.70 | % | 0.33 | % | 1.89 | % | 2.12 | % | ||||||||||
Ratio of gross expenses and Incentive Fee to average net assets(4)(5) |
2.50 | % | 2.58 | % | 2.29 | % | 3.89 | % | 4.17 | % | ||||||||||
Ratio of expense waivers to average net assets |
— | % | — | % | — | % | — | % | — | % | ||||||||||
Ratio of net expenses and Incentive Fee to average net assets(5) |
2.50 | % | 2.58 | % | 2.29 | % | 3.89 | % | 4.17 | % | ||||||||||
Ratio of net expenses to average net assets, excluding Incentive Fee(5) |
1.86 | % | 1.88 | % | 1.96 | % | 2.00 | % | 2.05 | % | ||||||||||
Portfolio Turnover |
15.04 | % | 12.48 | % | 10.26 | % | 20.77 | % | 19.36 | % | ||||||||||
|
* |
During the year ended March 31, 2025, the Fund effected a 1-for-4 unit split on July 2, 2024. All historical per unit information has been retroactively adjusted to reflect this unit split. |
|
(1) |
Selected data for a Net Asset Value per Unit outstanding throughout the period. |
|
(2) |
Calculated using average units outstanding. |
|
(3) |
Total return based on net asset value calculated as the change in Net Asset Value per Unit during the respective periods, assuming distributions, if any, are reinvested on the effects of the performance of the Fund during the period. |
|
(4) |
Represents the ratio of expenses to average net assets absent fee waivers and/or expense reimbursement by/to the Adviser. |
|
(5) |
Ratio does not include expenses of Primary and Secondary Investments. |
The accompanying notes are an integral part of these Consolidated Financial Statements.
47
Partners Group Private Equity (Master Fund), LLC
(a Delaware Limited Liability Company)
Notes to Consolidated Financial Statements – March 31, 2025
1. Organization
Partners Group Private Equity (Master Fund), LLC (the “Fund”) is a Delaware limited liability company that was organized on August 4, 2008 and commenced operations on July 1, 2009. The Fund is registered under the Investment Company Act of 1940, as amended (the “Investment Company Act”), as a non-diversified, closed-end management investment company. The Fund has filed an application to register units of limited liability company interests in the Fund (“Units”) under the Securities Act of 1933 as amended (the “1933 Act”). The Fund is managed by Partners Group (USA) Inc. (the “Adviser”), an investment adviser registered under the Investment Advisers Act of 1940, as amended (the “Investment Advisers Act”) pursuant to a second amended and restated investment management agreement between the Fund and the Adviser (the “Investment Management Agreement”). The Board of Managers of the Fund (collectively, the “Board” and each member thereof a “Manager”) has oversight responsibility for the management and supervision of the business operations of the Fund. As permitted by applicable law, the Board may delegate any of its rights, powers and authority to, among others, the officers of the Fund, a committee of the Board, or the Adviser, as it did in causing the Fund to enter into the Investment Management Agreement. The Fund’s investment objective is to seek long-term capital appreciation by investing in a diversified portfolio of private equity and debt investments including infrastructure. The Fund makes investments directly and through its wholly owned subsidiaries, Partners Group Private Equity (Subholding), LLC (the “Onshore Subsidiary”), Partners Group Private Equity (Luxembourg) S.à r.l (the “Offshore Subsidiary”), Partners Group Revolver Pooling PGPE, LLC (the “Revolver Subsidiary”), and Partners Group Private Equity (BSL), LLC and Partners Group Private Equity (BSL) SPV, LLC (collectively, the “BSL Subsidiaries”).
Units are offered only to investors that represent that they are “accredited investors” within the meaning of Rule 501 under the Securities Act of 1933, as amended, and “qualified clients” within the meaning of Rule 205-3 under the Investment Advisers Act. Purchasers of Units become members of the Fund (“Members”).
The Fund has elected to be treated for U.S. federal income tax purposes, and intends to qualify annually, as a regulated investment company (“RIC”) under Subchapter M of the Internal Revenue Code of 1986, as amended (the “Code”).
The Fund currently offers two classes of Units designated as “Class A Units” and “Class I Units”. In the future the Fund may offer additional classes of Units. The Class A Units and the Class I Units have, and each additional class of Units issued by the Fund, if any, will have different characteristics, particularly regarding the sales charges that purchasers of Units of the additional class bear, and the distribution and service fees, if any, and other class specific expenses, if any, that are charged to holders of Units of the additional class. The Fund has received an exemptive order from the SEC with respect to the Fund’s multi-class structure.
Although Units of each class represent pro rata interests in the Fund, each class votes separately on class-specific matters. Realized and unrealized gains and losses and net investment income and losses, other than class-specific expenses, are allocated daily to each class of Units based on the relative net assets of each class to the total net assets of the Fund.
2. Significant Accounting Policies
The Fund is an investment company and applies the guidance set forth in Accounting Standards Codification (“ASC”) 946, Financial Services—Investment Companies. The following is a summary of significant accounting and reporting policies used in preparing the consolidated financial statements.
2.a. Basis of Accounting
The Fund’s accounting and reporting policies conform with U.S. generally accepted accounting principles (“U.S. GAAP”).
2.b. Valuation of Investments
Investments held by the Fund include short-term investments, publicly traded equity (“Public Investments”), direct equity and debt investments in operating companies (“Direct Investments”) and primary and secondary investments in private equity funds (“Primary Investments” and “Secondary Investments”, respectively, and together, “Private Equity Fund Investments”; Direct Investments and Private Equity Fund Investments, collectively, “Private Equity Investments”).
The Fund is required to report its investments, including those for which current market values are not readily available, at fair value.
48
Partners Group Private Equity (Master Fund), LLC
(a Delaware Limited Liability Company)
Notes to Consolidated Financial Statements – March 31, 2025 (continued)
2. Significant Accounting Policies (continued)
The Fund values its investments in accordance with ASC 820, Fair Value Measurements (“ASC 820”), which defines fair value as the amount that would be received to sell an asset or paid to transfer a liability in an orderly transaction between market participants at the applicable measurement date, and Rule 2a-5 under the Investment Company Act (“Rule 2a-5”). Pursuant to Rule 2a-5, the Board designated the Adviser as “valuation designee” to perform fair value determinations and approved amended Valuation Procedures.
Fair value is based on observable market prices or parameters or derived from such prices or parameters when such quotations are readily available. In accordance with Rule 2a-5, a market quotation is “readily available” only when it is a quoted price (unadjusted) in active markets for identical instruments that a fund can access at the measurement date, provided that such a quotation is not considered to be readily available if it is not reliable.
The Adviser, as “valuation designee” under Rule 2a-5, determines the fair value of the Fund’s Private Equity Investments in conformity with U.S. GAAP, Rule 2a-5, and the Fund’s Valuation Procedures. As permitted by the Valuation Procedures, the Adviser values the Fund’s Private Equity Investments in consultation with persons who are employees of the Adviser’s parent company or one of its subsidiaries. The Valuation Procedures require evaluation of all relevant factors reasonably available to the Adviser and its affiliates at the time the Fund’s Private Equity Investments are valued.
Direct Investments
In assessing the fair value of the Fund’s non-traded Direct Investments in accordance with the Valuation Procedures, the Adviser uses a variety of methods such as earnings multiples, discounted cash flow and market data from third party pricing services. The Adviser makes valuation assumptions based on market conditions existing at the end of each reporting period. Quoted market prices or dealer quotes for certain similar instruments are used for debt investments where appropriate. Other techniques, such as option pricing models and estimated discounted value of future cash flows, are used to determine fair value for the remaining financial instruments. Because of the inherent uncertainty of estimates, fair value determinations based on estimates may differ from the values that would have been used had a ready market for the securities existed, and the differences could be material.
Private Equity Fund Investments
The fair values of Private Equity Fund Investments determined by the Adviser in accordance with the Valuation Procedures are estimates. These estimates are net of management and performance incentive fees or allocations payable pursuant to the respective organizational documents of the Private Equity Fund Investments. Ordinarily, the fair value of a Private Equity Fund Investment is based on the net asset value of that Private Equity Fund Investment reported by its investment manager. If the Adviser determines that the most recent net asset value reported by the investment manager of a Private Equity Fund Investment does not represent fair value or if the manager of a Private Equity Fund Investment fails to report a net asset value to the Fund, a fair value determination is made by the Adviser in accordance with the Valuation Procedures. In making that determination, the Adviser will consider whether it is appropriate, considering all relevant circumstances, to value such Private Equity Fund Investment at the net asset value last reported by its investment manager, or whether to adjust such value by a premium or discount. Because of the inherent uncertainty of estimates, fair value determinations based on estimates may differ from the values that would have been used had a ready market for the securities existed, and the differences could be material.
For each of the Fund’s Private Equity Fund Investments (for the purposes of this paragraph, an “Investee”), the Fund has no right to cause the Investee or any third party to purchase the Fund’s investment in the Investee, at the end of the term of such investment, or any other time. Accordingly, in a typical Private Equity Fund Investment, the Fund expects to realize the value remaining in its investment at the end of the investment’s term through distributions resulting from the liquidation of the remaining assets of the Investee.
Public Investments
The fair values of financial instruments traded on one or more of the U.S. national securities exchanges, the Nasdaq Stock Market or any foreign stock exchange will be valued based on their respective market price (“Readily Available Market Quotations”). A market quotation is readily available only when that quotation is a quoted price (unadjusted) in active markets for identical investments that the fund can access at the measurement date, provided that quotation will not be readily available if it is not reliable.
49
Partners Group Private Equity (Master Fund), LLC
(a Delaware Limited Liability Company)
Notes to Consolidated Financial Statements – March 31, 2025 (continued)
2. Significant Accounting Policies (continued)
The fair values of asset-backed securities are determined by price quotations from unaffiliated market makers, financial institutions that regularly trade similar investments or independent valuation agents using industry standard valuation models.
The Valuation Procedures are implemented by the Adviser and State Street Bank and Trust Company, as the Fund’s administrator (the “Administrator”). Both the Adviser and the Administrator are subject to the oversight of, and report to, the Board. The Adviser and the Administrator monitor and review the methodologies of the various third-party pricing services that are employed by the Fund.
The Adviser and certain of its affiliates act as investment advisers to clients other than the Fund. However, the valuation attributed to a Private Equity Investment held by the Fund and to the same Private Equity Investment held by another client, one of the Adviser’s affiliates, or by a client of one of its affiliates might differ due to differences in accounting, regulatory or other factors applicable to the Fund, to such other client or the Adviser’s affiliate.
2.c. Cash and Cash Equivalents
In the normal course of its business the Fund holds cash, including foreign currencies, in short-term interest-bearing deposit accounts, and short-term U.S. Treasury Bills (“T-Bills”) to provide liquidity pending investment in Private Equity Investments. T-Bills are valued at amortized cost which is close to or a proxy for fair value. At times, the amounts held in these accounts may exceed applicable federally insured limits. The Fund has not experienced any losses in these accounts and does not believe that it is exposed to significant credit risk in these accounts.
2.d. Foreign Currency Translation
The books and records of the Fund are maintained in U.S. Dollars. Generally, valuations of assets and liabilities denominated in currencies other than the U.S. Dollar are translated into U.S. Dollar equivalents using valuation date exchange rates, while purchases, realized gains and losses, income and expenses are translated at transaction date exchange rates. As of March 31, 2025, the Fund’s investments denominated in foreign currencies were as follows:
Currency |
Number of |
|||
Australian Dollars |
17 | |||
Brazilian Reals |
1 | |||
Canadian Dollars |
6 | |||
Euros |
353 | |||
Indian Rupees |
2 | |||
Japanese Yen |
6 | |||
New Zealand Dollars |
4 | |||
Norwegian Kroner |
2 | |||
Philippine Pesos |
1 | |||
Pounds Sterling |
45 | |||
Swedish Kronor |
2 | |||
Swiss Francs |
7 | |||
The Fund does not separately state the portion of the results of operations due to fluctuations in foreign exchange rates. They are included with other changes in fair values of the investments during the period.
50
Partners Group Private Equity (Master Fund), LLC
(a Delaware Limited Liability Company)
Notes to Consolidated Financial Statements – March 31, 2025 (continued)
2. Significant Accounting Policies (continued)
2.e. Forward Foreign Currency Exchange Contracts
The Fund may enter forward foreign currency exchange contracts to manage foreign exchange rate risk. These contracts for the purchase or sale of a specific foreign currency at a fixed price on a future date may be entered into as a hedge against either specific transactions or portfolio positions. The objective of the Fund’s foreign currency hedging transactions is to reduce the risk that the U.S. Dollar value of the Fund’s foreign currency denominated investments will decline due to changes in foreign currency exchange rates. All forward foreign currency exchange contracts are “marked-to-market” daily at the applicable translation rates resulting in unrealized gains or losses. Realized gains or losses are recorded at the time the forward foreign currency exchange contract is offset by entering a closing transaction or by the delivery or receipt of the currency. The risk that counterparties may be unable to meet the terms of their contracts and the risk of unanticipated movements in the value of a foreign currency relative to the U.S. Dollar are inherent in forward foreign currency exchange contracts.
During the year ended March 31, 2025, the Fund entered 427 long/short forward foreign currency exchange contracts. As disclosed in the Consolidated Statement of Assets and Liabilities, the Fund had $18,014,142 in unrealized appreciation and $(71,750,626) in unrealized depreciation on forward foreign currency exchange contracts. As disclosed in the Consolidated Statement of Operations, the Fund had $106,893,375 in net realized gains (losses) and $(82,967,210) change in net unrealized appreciation (depreciation) on forward foreign currency exchange contracts.
2.f. Investment Income
The Fund records a distribution of cash or in-kind securities on a Private Equity Investment at fair value based on the information contained in the notice provided to the Fund when the distribution is received. Thus, the Fund recognizes in the Consolidated Statement of Operations its share of realized gains (or losses) and the Fund’s share of net investment income (or loss) based upon information received about distributions on Private Equity Investments. Unrealized appreciation (depreciation) on investments presented in the Consolidated Statement of Operations includes the Fund’s share of unrealized gains and losses, realized undistributed gains/losses, and undistributed net investment income (or loss) on Private Equity Investments for the relevant period.
The Fund classifies various types of non-interest income earned from Direct Investments as either other income or transaction income. Other income includes transfer fees, amendment fees, and unfunded fees. Transaction income includes break-up fees, directors’ fees, financial advisory fees, topping fees, investment banking fees, monitoring fees, organizational fees, and syndication fees.
2.g. Interest and Dividend Income
Dividend income is recorded on the ex-dividend date, except for certain dividends received from foreign securities and Direct Equity Investments for which the ex-dividend date has passed, in which case the dividend is recorded as soon as a Fund is informed that the ex-dividend date has occurred. Interest income, adjusted for the accretion of discounts and amortization of premiums, is recorded on an accrual basis from the settlement date, except for securities with a forward starting effective date, where interest income is recorded on the accrual basis from the effective date.
2.h. Fund Expenses
The Fund records expenses for all costs incurred in its conduct of the business of the Fund on an accrual basis, including, but not limited to, the following: all costs of portfolio transactions and positions for the Fund’s account; legal fees; accounting, auditing, and tax preparation fees; custodial fees; fees for lines of credit; fees for data and software providers; costs of insurance; registration costs; fees of each Manager who is not an “interested person” of the Fund, as defined in the Investment Company Act (each, individually an “Independent Manager” and collectively, the “Independent Managers”); and costs of meetings of the Board, including reimbursement of the Independent Managers for their costs in attending meetings of the Board.
2.i. Expenses Relating to Purchases of Secondary Investments
Expenses relating to purchases of Secondary Investments include the amortization of deferred payments on Secondary Investments. Such amortization expense is recognized on a monthly basis until the due date of a deferred payment.
51
Partners Group Private Equity (Master Fund), LLC
(a Delaware Limited Liability Company)
Notes to Consolidated Financial Statements – March 31, 2025 (continued)
2. Significant Accounting Policies (continued)
2.j. Income Taxes
The Fund recognizes tax positions in its consolidated financial statements only when it is more likely than not that the relevant taxing authority will, upon examination, sustain the position based on its merits. A position that meets this standard is measured at the maximum benefit that will more likely than not be realized upon settlement. The Fund classifies any interest expense related to income taxes in income tax expense, and any income tax penalties under expenses in the Consolidated Statements of Operations.
The Fund’s tax positions have been reviewed based on applicable statutes of limitation for tax assessments, which may vary by jurisdiction. Based on this review, the Fund has concluded that no additional provision for income tax is required in the Fund’s consolidated financial statements. The Fund is subject to potential examination by certain taxing authorities in various jurisdictions. The Fund’s tax positions are subject to ongoing interpretation of laws and regulations by taxing authorities.
As noted above, the Fund has elected to be treated for U.S. federal income tax purposes, and intends to qualify annually, as a RIC under Subchapter M of the Code. If the Fund were to fail to meet the requirements of Subchapter M to qualify as a RIC, and if the Fund were ineligible to or otherwise were not to cure such failure, the Fund would be subject to tax on its taxable income, whether or not distributed to Members, at corporate rates, and all distributions of earnings and profits would be taxable to Members as ordinary income. In addition, the Fund could be required to recognize unrealized gains, pay substantial taxes and interest, and make substantial distributions until it requalifies as a RIC that is accorded special tax treatment under Subchapter M. In order to comply with the requirements of Subchapter M, the Fund must distribute substantially all of its taxable income and gains to holders of Fund Units and meet certain diversification and income requirements with respect to its investments. The Onshore Subsidiary is treated as an association taxable as a corporation for U.S. federal income tax purposes. The Offshore Subsidiary, Revolver Subsidiary, and BSL Subsidiaries are each treated as an entity separate from the Fund, and thus are disregarded, for U.S. federal income tax purposes. In preparing its consolidated financial statements, the Onshore Subsidiary is required to recognize its estimate of income taxes for Federal and State purposes as a deferred tax asset or liability. Deferred income taxes reflect the net tax effects of temporary differences between the carrying amounts of assets and liabilities for financial reporting purposes and the corresponding amounts used for income tax purposes. If the Onshore Subsidiary has a deferred tax asset, consideration is given to whether a valuation allowance is required. The Offshore Subsidiary, Revolver Subsidiary, and BSL Subsidiaries are not subject to U.S. federal and state income taxes.
The Fund files tax returns as prescribed by the tax laws of the jurisdictions in which it operates. In the normal course of business, the Fund is subject to examination by U.S. federal, state, local and foreign jurisdictions, where applicable. As of March 31, 2025, the tax years from 2019 forward remain subject to examination by the major tax jurisdictions in which the Fund is subject to examination.
During the year ended March 31, 2025 the Fund reclassified $99,702,655 of undistributed net investment income, $(363,785,140) of accumulated net realized gain (loss) on investments and forward foreign currency contracts, $0 of accumulated net unrealized appreciation on investments and forward foreign currency contracts, and $0 of foreign currency translation, to paid-in capital.
2.k. Use of Estimates
The preparation of financial statements in conformity with U.S. GAAP requires the Fund to make estimates and assumptions that affect the reported amounts of assets and liabilities and the disclosure of contingent assets and liabilities as of the date of the financial statements, as well as the reported increases and decreases in capital from operations during the reporting period. Actual results may differ from those estimates.
2.l. Consolidated Financial Statements
The Consolidated Schedule of Investments, Consolidated Statement of Assets and Liabilities, Consolidated Statement of Operations, Consolidated Statements of Changes in Net Assets, Consolidated Statement of Cash Flows and Consolidated Financial Highlights of the Fund include the accounts of the Subsidiaries. All significant intercompany accounts and transactions have been eliminated in consolidation.
2.m. Disclosures about Offsetting Assets and Liabilities
The Fund is subject to requirements to disclose information about offsetting assets and liabilities and similar arrangements to enable users of its financial statements to understand the effect of those arrangements on its financial position.
52
Partners Group Private Equity (Master Fund), LLC
(a Delaware Limited Liability Company)
Notes to Consolidated Financial Statements – March 31, 2025 (continued)
2. Significant Accounting Policies (continued)
For financial reporting purposes, the Fund does not offset derivative assets and liabilities that are subject to Master Netting Agreements (“MNA”) or similar arrangements in the Consolidated Statement of Assets and Liabilities. The table below presents the amounts of the Fund’s derivative assets and liabilities as of March 31, 2025: gross, net of amounts available for offset under a MNA, and net of the related collateral received and/or pledged, if any, by the Fund:
Counterparty |
Derivative Assets |
Financial |
Collateral |
Net Amount2 |
||||||||||||
Barclays |
$ | 2,937,597 | $ | 2,937,597 | $ | — | $ | — | ||||||||
BNY Mellon |
58,904 | 58,904 | — | — | ||||||||||||
Nomura International PLC |
15,017,641 | 6,770,660 | — | 8,246,981 | ||||||||||||
Counterparty |
Derivative Liabilities |
Financial |
Collateral |
Net Amount3 |
||||||||||||
Bank of America |
$ | 11,151,284 | $ | — | $ | 11,151,284 | $ | — | ||||||||
Barclays |
45,886,023 | 2,937,597 | 42,948,426 | — | ||||||||||||
BNY Mellon |
7,942,659 | 58,904 | 7,883,755 | — | ||||||||||||
Nomura International PLC |
6,770,660 | 6,770,660 | — | — | ||||||||||||
|
1 |
In some instances, the actual collateral received and/or pledged may be more than the amount shown here due to overcollateralization. |
|
2 |
Net amount represents the net amount receivable from the counterparty in the event of default. |
|
3 |
Net amount represents the net amount due from the Fund to the counterparty in the event of default. |
2.n. Recently Adopted Accounting Pronouncements
In this reporting period, the Fund adopted FASB Accounting Standards Update 2023-07, Segment Reporting (Topic 280): Improvements to Reportable Segment Disclosures (“ASU 2023-07”). Adoption of the new standard impacted the notes to the Consolidated Financial Statements only and did not affect the Fund’s financial position or the results of its operations. The Adviser acts as the Fund’s chief operating decision maker (“CODM”), assessing performance and making decisions about resource allocation. The Fund represents a single operating segment, as the CODM monitors and assesses the operating results of the Fund as a whole, based on a defined investment objective of the Fund. The Fund’s portfolio composition, total returns, expense ratios and changes in net assets are used by the CODM to assess segment performance and make sure resource allocations are consistent with the information presented within the Fund’s Consolidated Financial Statements. The accompanying Consolidated Financial Statements detail the Fund’s segment assets, liabilities, revenues, and expenses.
3. Fair Value Measurements
In conformity with U.S. GAAP, investments are classified in their entirety based on the lowest level of input that is significant to the fair value measurement. Estimated fair values may differ from the values that would have been used if a ready market existed or if the investments were liquidated at the valuation date. A three-level hierarchy is used to distinguish between (1) inputs that reflect the assumptions market participants would use in pricing an asset or liability developed based on market data obtained from sources independent of the reporting entity (observable inputs) and (2) inputs that reflect the reporting entity’s own assumptions about the assumptions market participants would use in pricing an asset or liability developed based on the best information available in the circumstances (unobservable inputs). This distinction determines the classification of fair value measurements for disclosure purposes.
53
Partners Group Private Equity (Master Fund), LLC
(a Delaware Limited Liability Company)
Notes to Consolidated Financial Statements – March 31, 2025 (continued)
3. Fair Value Measurements (continued)
The various types of inputs used in determining the value of the Fund’s investments are summarized below for each of the three levels:
Valuation of Investments
|
● |
Level 1 – Pricing inputs are quoted prices available in active markets for identical investments as of the measurement date. The type of investments included in Level 1 include marketable securities that are primarily traded on one or more of the U.S. national securities exchanges, the Nasdaq Stock Market or any foreign stock exchange. The fair value is determined to be the last sale price on the determination date, or, if no sales occurred on that date, the closing bid price on the determination date. In accordance with authoritative guidance, the Fund does not apply a blockage discount to the quoted price for these investments, even in situations where the Fund holds a large position in an investment and a sale could reasonably impact the quoted price. |
|
● |
Level 2 – Pricing inputs are observable inputs other than quoted prices for identical assets in active markets (i.e., not Level 1 inputs). Fair value is determined using models or other valuation methodologies through direct or indirect corroboration with observable market data. Investments that are generally included in this category include corporate notes, convertible notes, warrants and restricted public equity securities. The fair value of legally restricted equity securities may be discounted depending on the likely impact of the restrictions on liquidity and the Adviser’s estimates. |
|
● |
Level 3 – Pricing inputs are unobservable for the investment and include situations where there is little, if any, market activity for the investment. The inputs into the determination of fair value require significant management judgment and/or estimation. Investments that are included in this category are private equity and debt investments, as well as convertible notes and warrants that are not actively traded. The fair value for investments using Level 3 pricing inputs is based on the Adviser’s estimates that consider a combination of various factors and performance measurements. These factors and measurements include the timing of the transaction; the market in which the investment operates; comparable market transactions; operational performance and projections of the investments; various performance multiples as applied to earnings before interest, taxes, depreciation, and amortization or a similar measure of earnings for the latest reporting period or a forward period; brokers’ quotes; and discounted cash flow analysis. |
Due to the inherent uncertainty of estimates, fair value determinations based on estimates may materially differ from the values that would have been used had a ready market for the securities existed. The following is a summary of the Fund’s investments classified in the fair value hierarchy as of March 31, 2025:
Investments |
Level 1 |
Level 2 |
Level 3 |
Total |
||||||||||||
Common Stocks |
$ | 772,125,511 | $ | — | $ | — | $ | 772,125,511 | ||||||||
High Yield Bonds |
— | 128,263,335 | — | 128,263,335 | ||||||||||||
Asset-Backed Securities |
— | — | 77,121,627 | 77,121,627 | ||||||||||||
Floating Rate Loans |
— | — | 326,426,005 | 326,426,005 | ||||||||||||
Direct Investments: |
||||||||||||||||
Direct Equity |
71,002,859 | 731,400 | 8,585,997,164 | 8,657,731,423 | ||||||||||||
Direct Debt |
— | 5,046,828 | 1,404,999,348 | 1,410,046,176 | ||||||||||||
Total Direct Investments* |
$ | 71,002,859 | $ | 5,778,228 | $ | 9,990,996,512 | $ | 10,067,777,599 | ||||||||
Secondary Investments* |
— | — | 2,671,931,827 | 2,671,931,827 | ||||||||||||
Primary Investments* |
— | — | 2,201,976,666 | 2,201,976,666 | ||||||||||||
Total Investments |
$ | 843,128,370 | $ | 134,041,563 | $ | 15,268,452,637 | $ | 16,245,622,570 | ||||||||
54
Partners Group Private Equity (Master Fund), LLC
(a Delaware Limited Liability Company)
Notes to Consolidated Financial Statements – March 31, 2025 (continued)
3. Fair Value Measurements (continued)
Other Financial Instruments |
Level 1 |
Level 2 |
Level 3 |
Total |
||||||||||||
Assets |
||||||||||||||||
Foreign Currency Exchange Contracts** |
$ | — | $ | 18,014,142 | $ | — | $ | 18,014,142 | ||||||||
Total Assets |
$ | — | $ | 18,014,142 | $ | — | $ | 18,014,142 | ||||||||
Liabilities |
||||||||||||||||
Foreign Currency Exchange Contracts** |
$ | — | $ | (71,750,626 | ) | $ | — | $ | (71,750,626 | ) | ||||||
Total Liabilities |
$ | — | $ | (71,750,626 | ) | $ | — | $ | (71,750,626 | ) | ||||||
Total Investments net of Foreign Currency Exchange Contracts |
$ | 843,128,370 | $ | 80,305,079 | $ | 15,268,452,637 | $ | 16,191,886,086 | ||||||||
|
* |
Private Equity Investments are described in Note 2.b. |
|
** |
Forward Foreign Currency Exchange Contracts are described in Note 2.e. |
The following is a reconciliation of the amount of the account balances on April 1, 2024 and March 31, 2025 of those investments in which significant unobservable inputs (Level 3) were used in determining value:
|
Balance |
Realized |
Net Change |
Gross |
Gross |
Net |
Net |
Balance |
||||||||||||||||||||||||
Asset-Backed Securities |
$ | 61,753,834 | $ | 327,296 | $ | (1,245,596 | ) | $ | 41,327,500 | $ | (25,083,797 | ) | $ | 42,390 | $ | — | $ | 77,121,627 | ||||||||||||||
Floating Rate Loans |
$ | — | $ | (1,055 | ) | $ | 535,708 | $ | 326,216,975 | $ | (423,349 | ) | $ | 97,726 | $ | — | $ | 326,426,005 | ||||||||||||||
Direct Investments: |
||||||||||||||||||||||||||||||||
Direct Equity Investments |
$ | 8,531,221,626 | $ | 568,836,741 | $ | (110,292,360 | ) | $ | 507,752,679 | $ | (949,473,427 | ) | $ | — | $ | 37,951,905 | $ | 8,585,997,164 | ||||||||||||||
Direct Debt Investments |
$ | 1,251,252,987 | $ | (41,635,506 | ) | $ | 31,377,199 | $ | 713,506,255 | $ | (554,226,605 | ) | $ | 4,725,018 | $ | — | $ | 1,404,999,348 | ||||||||||||||
Total Direct Investments* |
$ | 9,782,474,613 | $ | 527,201,235 | $ | (78,915,161 | ) | $ | 1,221,258,934 | $ | (1,503,700,032 | ) | $ | 4,725,018 | $ | 37,951,905 | $ | 9,990,996,512 | ||||||||||||||
Secondary Investments* |
$ | 1,827,755,657 | $ | (1,161,351 | ) | $ | 248,610,499 | $ | 734,845,063 | $ | (138,118,041 | ) | $ | — | $ | — | $ | 2,671,931,827 | ||||||||||||||
Primary Investments* |
$ | 2,123,078,112 | $ | (5,169,712 | ) | $ | 28,575,799 | $ | 234,811,714 | $ | (179,319,247 | ) | $ | — | $ | — | $ | 2,201,976,666 | ||||||||||||||
Total |
$ | 13,795,062,216 | $ | 521,196,413 | $ | 197,561,249 | $ | 2,558,460,186 | $ | (1,846,644,466 | ) | $ | 4,865,134 | $ | 37,951,905 | $ | 15,268,452,637 | |||||||||||||||
|
* |
For the purposes of the tables above: (i) “Direct Investments” are private investments directly in the equity or debt of selected operating companies, often together with the management of the investee operating company; (ii) “Primary Investments” are investments in newly established private equity partnerships where underlying portfolio companies are generally not known as of the time of investment; (iii) and “Secondary Investments” are single or portfolios of assets acquired on the secondary market. However, in the private equity market sector the term “secondary investments” is generally understood to mean Private Equity Fund Investments acquired in the secondary market (See Note 2.b). Notwithstanding the foregoing, if the Fund reasonably determines that the strict application of the above definitions would not reflect the economic substance of any investment, the Fund may re-classify such investment as it deems appropriate. |
Changes in inputs or methods used for valuing investments may result in transfers in or out of levels within the fair value hierarchy. The inputs or methods used for valuing investments may not necessarily be an indication of the risk associated with investing in those investments. Transfers between levels of the fair value hierarchy are reported at the beginning of the reporting period in which they occur.
The amount of the net change in unrealized appreciation (depreciation) for the year ended March 31, 2025 relating to investments in Level 3 assets still held at March 31, 2025 is $ 747,070,177, which is included as a component of net change in accumulated unrealized depreciation on investments on the Consolidated Statement of Operations.
55
Partners Group Private Equity (Master Fund), LLC
(a Delaware Limited Liability Company)
Notes to Consolidated Financial Statements – March 31, 2025 (continued)
3. Fair Value Measurements (continued)
The following is a summary of quantitative information about significant unobservable valuation inputs approved by the Adviser for Level 3 Fair Value Measurements for investments held as of March 31, 2025:
Type of Security |
Fair Value |
Valuation Technique(s) |
Unobservable Input |
Range |
|||
Asset-Backed Securities |
$ | 77,122 | Reported fair value |
Reported fair value |
n/a |
||
Floating Rate Loans |
$ | 326,426 | Broker quotes |
Indicative quotes for an inactive market |
n/a |
||
Direct Investments: |
|||||||
Direct Equity |
$ | 786,695 | Discounted cash flow |
Discount factor |
9.33% – 20.68% (13.59%) |
||
| 6,796,522 | Market comparable companies |
Enterprise value to EBITDA multiple |
3.10x – 32.80x (17.43x) |
||||
| 104,756 | Market comparable companies |
Price to book ratio |
1.90x – 1.90x (1.90x) |
||||
| 202,934 | Exit price |
Recent transaction price |
n/a |
||||
| 119,817 | Recent financing/transaction |
Recent transaction price |
n/a |
||||
| 448,729 | Reported fair value |
Reported fair value |
n/a |
||||
| 126,543 | Market comparable companies |
Enterprise value to sales multiple |
1.26x – 19.00x (10.23x) |
||||
Direct Debt |
$ | 967,591 | Broker quotes |
Indicative quotes for an inactive market |
n/a |
||
| 396,314 | Discounted cash flow |
Discount factor |
8.00% – 28.00% (10.06%) |
||||
| 5,212 | Market comparable companies |
Enterprise value to EBITDA multiple |
5.75x – 14.00x (6.87x) |
||||
| 27,262 | Recent financing/transaction |
Recent transaction price |
n/a |
||||
| 8,621 | Market comparable companies |
Enterprise value to sales multiple |
14.0x – 14.0x (14.0x) |
||||
Primary and Secondary Investments |
$ | 4,873,908 | Adjusted reported net asset value |
Reported net asset value |
n/a |
||
|
* |
Level 3 fair value includes accrued interest. |
Level 3 Direct Equity Investments valued using an unobservable input are directly affected by a change in that input. For Level 3 Direct Debt Investments, the Fund estimates fair value utilizing earnings and multiples analysis or an analysis of discounted cash flows that considers the credit risk and interest rate risk of the particular investment. For Direct Investments, significant increases or decreases in these inputs in isolation would result in a significantly lower or higher fair value measurements.
The amounts from Partners Group investment vehicles pertain to non-investment related assets (liabilities) and/or any difference in fair value classification of its underlying investments. In certain cases, this may also include underlying investments that are measured under Level 1 or Level 2 but presented under Level 3 in fair value measurement note since the investments are held under external partnership investments.
56
Partners Group Private Equity (Master Fund), LLC
(a Delaware Limited Liability Company)
Notes to Consolidated Financial Statements – March 31, 2025 (continued)
4. Revolving Credit Agreement
The Fund has a secured, committed multicurrency revolving line of credit (“LOC”) facility with Lloyds Bank Corporate Markets plc (successor of Lloyds Bank plc), NatWest Markets plc (successor of The Royal Bank of Scotland plc), Barclays Bank plc, UBS AG, and Bank of America, N.A. in the aggregate maximum principal amount of $1,261,000,000. The Fund anticipates that this LOC facility will be used primarily for working capital requirements and for financing investments and funding associated costs and expenses. The Fund will incur additional interest and other expenses for the use of this and other future line of credit facilities. Borrowings under this facility had been charged a rate of interest per annum that was the aggregate of the applicable margin of 3.25% which was until June 30, 2023, London Interbank Offered Rate (LIBOR), after June 30, 2023, Secured Overnight Financing Rate (SOFR), or, in relation to any loan in Euros, the Euro Interbank Offered Rate (EURIBOR), and a commitment fee of 1.20% per annum on the daily unused portion. For the year ended March 31, 2025, the Fund did not have any borrowings and did not incur any interest expense under the LOC facility. In addition to the commitment fee under the LOC facility the Fund agrees to pay arrangement fees based on the rate agreed to with the various lenders, agency fees of $25,000 per annum, monitoring fees of $25,000 per annum and trustee fees of $15,000 per annum. The term of the LOC facility runs until January 29, 2027.
5. Unit Transactions/Subscription and Repurchase of Units
In general, Units are offered for purchase as of the first day of each calendar month. However, Units may be offered more or less frequently as determined by the Board in its sole discretion.
Pursuant to the conditions of an exemptive order issued by the SEC, and in compliance with Rule 12b-1 under the Investment Company Act, the Fund has adopted a Distribution and Service Plan for the Class A Units (the “Distribution Plan”). The Distribution Plan allows the Fund to pay distribution fees for the promotion and distribution of its Class A Units and the provision of personal services to holders of Class A Units. Under the Distribution Plan, the Fund may pay as compensation an amount up to 0.70% on an annualized basis of the value of the Fund’s net asset attributable to Class A Units (the “Distribution Fee”). Payment of the Distribution Fee is governed by the Distribution Plan. The Distribution Fee is paid out of the Fund’s assets and decreases the net profits or increases the net losses of the Fund solely with respect to Class A Units. For the year ended March 31, 2025, the Fund accrued distribution fees of $58,995,659 which were attributable to Class A Units. Class I Units are not subject to the Distribution Plan or the Distribution Fee and do not bear any expenses associated therewith. In addition, under the Distribution Plan, subscriptions for Class A Units may be subject to a placement fee (the “Placement Fee”) of up to 3.50% of the subscription amount. No Placement Fee may be charged without the consent of the placement agent.
The Board may, from time to time and in its sole discretion, cause the Fund to repurchase Units from Members pursuant to written tenders by Members at such times and on such terms and conditions as established by the Board. In determining whether the Fund should offer to repurchase Units, the Board considers the recommendation of the Adviser, as well as a variety of other operational, business, and economic factors. The Adviser anticipates recommending to the Board that, under normal circumstances, the Fund conduct quarterly repurchase offers for Units having an aggregate value of no more than 5% of the Fund’s net assets each January 1st, April 1st, July 1st, and October 1st. The Fund is entitled to charge a 2.00% early repurchase fee for any repurchase of Units from a Member at any time prior to the day immediately preceding the first anniversary of the Member’s purchase of such Units.
Transactions in Units were as follows:
For the Year Ended |
For the Year Ended |
|||||||||||||||
Units |
Dollar Amounts |
Units |
Dollar Amounts |
|||||||||||||
Class A Units |
||||||||||||||||
Sales |
3,373,450,989 | $ | 897,386,781 | 435,055,860 | $ | 867,184,668 | ||||||||||
Reinvestments |
69,126,368 | 141,591,539 | 104,139,872 | 207,209,706 | ||||||||||||
Repurchases |
(284,950,289 | ) | (693,458,689 | ) | (218,882,176 | ) | (438,997,302 | ) | ||||||||
Class exchanges |
(11,533,916 | ) | (42,299,009 | ) | (30,924,852 | ) | (62,024,192 | ) | ||||||||
Net increase (decrease) |
3,146,093,152 | $ | 303,220,622 | 289,388,704 | $ | 573,372,880 | ||||||||||
57
Partners Group Private Equity (Master Fund), LLC
(a Delaware Limited Liability Company)
Notes to Consolidated Financial Statements – March 31, 2025 (continued)
5. Unit Transactions/Subscription and Repurchase of Units (continued)
For the Year Ended |
For the Year Ended |
|||||||||||||||
Units |
Dollar Amounts |
Units |
Dollar Amounts |
|||||||||||||
Class I Units |
||||||||||||||||
Sales |
2,777,388,918 | $ | 838,147,453 | 352,539,664 | $ | 728,148,848 | ||||||||||
Reinvestments |
48,501,415 | 104,103,438 | 73,606,452 | 152,280,709 | ||||||||||||
Repurchases |
(342,426,840 | ) | (876,816,689 | ) | (266,162,372 | ) | (554,919,154 | ) | ||||||||
Class exchanges |
11,034,226 | 42,299,009 | 29,826,636 | 62,024,192 | ||||||||||||
Net increase (decrease) |
2,494,497,719 | $ | 107,733,211 | 189,810,380 | $ | 387,534,595 | ||||||||||
|
* |
Updated to reflect the effect of a 1-for-4 unit split on July 2, 2024. |
6. Management Fees, Incentive Fee and Fees and Expenses of Managers
Under the terms of the Investment Management Agreement the Adviser is responsible for providing day-to-day investment management and certain other services to the Fund, subject to the ultimate supervision of and to any policies established by the Board. Accordingly, the Adviser is responsible for developing, implementing and supervising the Fund’s investment program. As consideration for its investment management services under the Investment Management Agreement, the Fund pays the Adviser a monthly management fee equal to 1/12th of 1.50% (1.50% on an annualized basis) of the greater of (i) the Fund’s net asset value and (ii) the Fund’s net asset value less cash and cash equivalents plus the total of all commitments made by the Fund that have not yet been drawn for investment. However, the Adviser has agreed that in no event will the management fee exceed 1.75% as a percentage of the Fund’s net asset value. For the year ended March 31, 2025, the Fund incurred $251,737,540 in management fees payable to the Adviser.
In addition to the monthly management fee, at the end of each calendar quarter (and at certain other times), the Adviser will be entitled to receive an Incentive Fee equal to 10% of the excess, if any, of (i) the net profits of the Fund for the relevant period over (ii) the then balance, if any, of the New Loss Recovery Account (as defined below). For the purposes of calculating the Incentive Fee, the term “net profits” means the amount by which the net asset value of the Fund on the last day of the relevant period exceeds the net asset value of the Fund as of the beginning of the same period, including any net change in unrealized appreciation or depreciation of investments, realized gains or losses, investment income, expenses, while excluding contributions and withdrawals from the calculation of the Incentive Fee. The Fund maintains a memorandum account (the “New Loss Recovery Account”), which had an initial balance of zero and will be (i) increased upon the close of each calendar quarter of the Fund by the amount of the net losses of the Fund for the quarter, and (ii) decreased (but not below zero) upon the close of each calendar quarter by the amount of the net profits of the Fund for the quarter. Members will benefit from the New Loss Recovery Account in proportion to their holdings of Units. For the year ended March 31, 2025, the Fund incurred $99,456,006 in Incentive Fees due to the Adviser.
The Adviser has entered into an expense limitation agreement (the “Expense Limitation Agreement”) with the Fund, whereby the Adviser has agreed to waive fees that it would otherwise be paid, and/or to assume expenses of the Fund (a “Waiver”), if required to ensure the Total Annual Expenses (excluding taxes, interest, brokerage commissions, certain transaction related expenses arising out of investments made by the Fund, extraordinary expenses, the Incentive Fee, and any acquired fund fees and expenses) do not exceed 3.00% on an annualized basis with respect to Class A Units and 2.30% on an annualized basis with respect to Class I Units (the “Expense Limit”). For a period not to exceed three years from the date on which a Waiver is made, the Adviser may recoup amounts waived or assumed, provided it is able to affect such recoupment without causing the Fund’s expense ratio (after recoupment) to exceed the lesser of (a) the expense limit in effect at the time of the waiver, and (b) the expense limit in effect at the time of the recoupment. The Expense Limitation Agreement may be terminated by the Adviser or the Fund upon thirty days’ written notice to the other party. During the year ended March 31, 2025, the Adviser did not waive any fees and the Fund did not pay any recoupment of existing waivers pursuant to the Expense Limitation Agreement.
58
Partners Group Private Equity (Master Fund), LLC
(a Delaware Limited Liability Company)
Notes to Consolidated Financial Statements – March 31, 2025 (continued)
6. Management Fees, Incentive Fee and Fees and Expenses of Managers (continued)
Each Independent Manager is paid an annual fee. Effective January 1, 2025, the Fund increased the annual fee from $150,000 to $160,000. The Fund pays an additional fee of $10,000 to the Chairman of the Board, the Chairman of the Audit Committee, the Chairman of the Nominating Committee, and to each Independent Manager that is not the Chair of a Committee. The Fund also reimburses the expenses of the Independent Managers incurred in connection with their services as Independent Managers. The Independent Managers do not receive any pension or retirement benefits from the Fund.
7. Affiliated Investments
Under Section 2(a)(3) of the Investment Company Act, a portfolio company is considered “affiliated” with the Fund if the Fund owns five percent or more of such portfolio company’s outstanding voting securities. The Fund held at least five percent of the outstanding voting securities of the following portfolio companies as of March 31, 2025:
|
Shares/ |
Fair Value |
Gross |
Gross |
Realized |
Change in |
Fair Value |
Affiliated |
||||||||||||||||||||||||
Non-Controlled Affiliates |
||||||||||||||||||||||||||||||||
Bock Capital JVCo Nature S.à.r.l. |
12,590,000,000 | $ | 184,424,230 | $ | — | $ | — | $ | — | $ | 56,683,437 | $ | 241,107,667 | $ | — | |||||||||||||||||
Camelia Investment 1 Limited(3)(4) |
— | 161,208,496 | — | (161,259,391 | ) | 72,124,832 | (72,073,937 | ) | — | 533,328 | ||||||||||||||||||||||
CapitalSpring Finance Company, LLC |
6,017,517 | 8,205,962 | 266,281 | (3,450,517 | ) | (4,795 | ) | 192,352 | 5,209,283 | 316,090 | ||||||||||||||||||||||
Confluent Health Holdings LP |
30,362 | 75,177,581 | 216,482 | (203,671 | ) | — | (4,512,125 | ) | 70,678,267 | 400,432 | ||||||||||||||||||||||
Dermatology Holdings, L.P.(4) |
— | 144,036,748 | 41,324 | — | — | 27,874,354 | 171,952,426 | — | ||||||||||||||||||||||||
Ecom Express Private Limited(5) |
63,417 | 9,410,364 | 1 | — | — | (1,737,457 | ) | 7,672,908 | — | |||||||||||||||||||||||
ECP Parent, LLC |
109,770,023 | 102,237,386 | 5,402 | — | — | 13,887,062 | 116,129,850 | 162,120 | ||||||||||||||||||||||||
EdgeCore Holdings, L.P.(4) |
— | 103,722,191 | 19,701,846 | — | — | 32,169,147 | 155,593,184 | — | ||||||||||||||||||||||||
Encore Holdings LP(4) |
60,573 | 103,191,531 | 17,300,000 | (10,380 | ) | — | 31,500,759 | 151,981,910 | — | |||||||||||||||||||||||
EnfraGen LLC |
37,786 | 90,545,380 | — | (5,148,343 | ) | — | 5,199,540 | 90,596,577 | 2,138,365 | |||||||||||||||||||||||
Gateway Fleets Holdings, LP (4) |
— | — | 1,816,000 | — | — | — | 1,816,000 | — | ||||||||||||||||||||||||
Green DC LuxCo Sarl |
46,167,289 | 154,904,427 | 57,965,142 | — | — | 37,016,301 | 249,885,870 | — | ||||||||||||||||||||||||
Icebox Holdco I Inc(4) |
— | 62,800,836 | 12,228 | — | — | (14,438 | ) | 62,798,626 | 1,548,751 | |||||||||||||||||||||||
Icebox Parent LP(4) |
— | 218,133,631 | — | — | — | 85,010,292 | 303,143,923 | — | ||||||||||||||||||||||||
Idera, Inc. |
1,223,033 | 1,229,521 | (2,934 | ) | (9,242 | ) | 23 | (80,602 | ) | 1,136,766 | 827,371 | |||||||||||||||||||||
Idera Parent L.P.(4) |
— | 270,973,196 | — | — | — | (90,851,261 | ) | 180,121,935 | 203,748 | |||||||||||||||||||||||
KPOCH Holdings, L.P.(4) |
— | 170,690,437 | — | — | — | 29,827,875 | 200,518,312 | 1,279,511 | ||||||||||||||||||||||||
KPSKY Holdings L.P.(4) |
— | 76,653,056 | — | — | — | (31,374,033 | ) | 45,279,023 | 148,950 | |||||||||||||||||||||||
Luxembourg Investment Company 285 S.à.r.l.(6) |
14,865,773 | 28,178,939 | — | — | — | (18,957,281 | ) | 9,221,658 | — | |||||||||||||||||||||||
Luxembourg Investment Company 293 S.à.r.l. |
9,789,622 | 50,762,648 | — | — | — | 2,238,826 | 53,001,474 | — | ||||||||||||||||||||||||
59
Partners Group Private Equity (Master Fund), LLC
(a Delaware Limited Liability Company)
Notes to Consolidated Financial Statements – March 31, 2025 (continued)
7. Affiliated Investments (continued)
|
Shares/ |
Fair Value |
Gross |
Gross |
Realized |
Change in |
Fair Value |
Affiliated |
||||||||||||||||||||||||
Luxembourg Investment Company 314 S.à.r.l.(6) |
192,000 | $ | 1 | $ | — | $ | — | $ | — | $ | — | $ | 1 | $ | — | |||||||||||||||||
Luxembourg Investment Company 404 S.à r.l. |
145,800 | 24,435,176 | — | (16,590 | ) | (133 | ) | (646,780 | ) | 23,771,673 | — | |||||||||||||||||||||
Luxembourg Investment Company 414 S.à r.l. |
12,316,087 | 101,514,227 | — | — | — | 12,142,922 | 113,657,149 | — | ||||||||||||||||||||||||
Luxembourg Investment Company 430 S.à r.l. |
52,594,635 | 76,366,764 | — | — | — | 3,356,128 | 79,722,892 | 62,148 | ||||||||||||||||||||||||
MHS Acquisition Holdings, LLC |
35,641 | 985,319 | — | — | — | (474,896 | ) | 510,423 | — | |||||||||||||||||||||||
MHS Blocker Purchaser L.P.(4) |
— | 76,184,208 | — | — | — | (36,718,740 | ) | 39,465,468 | — | |||||||||||||||||||||||
Orbiter Investments S.à.r.l. |
8,568,857 | 273,466,108 | — | — | — | (48,065,493 | ) | 225,400,615 | — | |||||||||||||||||||||||
Partners Group Satellite HoldCo S.à.r.l. |
14,993,879 | 53,842,689 | 53,303 | — | — | (14,256,507 | ) | 39,639,485 | — | |||||||||||||||||||||||
Partners Group Satellite Warehouse S.C.S.(4) |
— | 1,174,555 | 1,293 | — | — | (113,893 | ) | 1,061,955 | — | |||||||||||||||||||||||
Partners Terra Pte. Ltd. |
7,980,885 | 9,130,863 | 859,665 | — | — | 1,277,407 | 11,267,935 | — | ||||||||||||||||||||||||
PG BRPC Investment, LLC |
32,079 | 84,594,435 | — | — | — | (8,148,014 | ) | 76,446,421 | 402,739 | |||||||||||||||||||||||
PG Delta Holdco, LLC |
40,952 | 87,245,404 | 4,383,782 | — | — | 20,119,637 | 111,748,823 | 461,039 | ||||||||||||||||||||||||
PG Esmeralda Pte. Ltd. |
12,790,872 | 42,748,489 | 6,853,838 | — | — | (35,960,485 | ) | 13,641,842 | — | |||||||||||||||||||||||
PG Investment Company 18 S.à.r.l. |
126,506,634 | 170,136,983 | — | — | — | 51,795,076 | 221,932,059 | 483,074 | ||||||||||||||||||||||||
PG Investment Company 24 S.à.r.l. |
102,257,478 | 152,072,826 | — | — | — | 894,631 | 152,967,457 | 700,666 | ||||||||||||||||||||||||
PG Investment Company 60 S.à.r.l. |
379,375 | 1,928,633 | 3,994,425 | — | — | 912,226 | 6,835,284 | — | ||||||||||||||||||||||||
PG Investment Company 76 S.à.r.l. |
44,108,739 | — | 48,700,262 | (280,328 | ) | (18,549 | ) | (493,910 | ) | 47,907,475 | — | |||||||||||||||||||||
PG Lion Management Warehouse S.C.S(4)(6) |
— | 232,873 | — | — | — | (168,034 | ) | 64,839 | — | |||||||||||||||||||||||
PG TLP S.à r.l. |
6,473,126 | 114,276,166 | 190,038 | — | — | 27,098,892 | 141,565,096 | — | ||||||||||||||||||||||||
PG Wave Limited |
53,215,581 | 86,899,848 | — | — | — | 16,695,144 | 103,594,992 | — | ||||||||||||||||||||||||
Pharmathen GP S.à r.l. |
110,300 | 1 | — | — | — | — | 1 | — | ||||||||||||||||||||||||
Pharmathen Topco S.à r.l. |
102,498,368 | 160,504,707 | 3,722,755 | — | — | (31,821,740 | ) | 132,405,722 | — | |||||||||||||||||||||||
Polyusus Lux XVI S.à.r.l. |
291,878,429 | 2 | 3,005,381 | — | — | (7,241 | ) | 2,998,142 | — | |||||||||||||||||||||||
60
Partners Group Private Equity (Master Fund), LLC
(a Delaware Limited Liability Company)
Notes to Consolidated Financial Statements – March 31, 2025 (continued)
7. Affiliated Investments (continued)
|
Shares/ |
Fair Value |
Gross |
Gross |
Realized |
Change in |
Fair Value |
Affiliated |
||||||||||||||||||||||||
Root JVCo S.à r.l. |
29,599,124 | $ | 111,951,014 | $ | — | $ | — | $ | — | $ | 14,933,052 | $ | 126,884,066 | $ | 125,018 | |||||||||||||||||
SnackTime PG Holdings, Inc. |
12 | 10,573,061 | 4,028 | — | — | (10,577,089 | ) | — | 54,523 | |||||||||||||||||||||||
Specialty Pharma Holdings LP(4) |
— | 145,782,767 | — | — | — | (1,977,366 | ) | 143,805,401 | 225,908 | |||||||||||||||||||||||
Sunsure Energy Private Limited |
2,409,419 | 12,075,632 | 7,253,437 | — | — | 3,274,174 | 22,603,243 | 71,700 | ||||||||||||||||||||||||
SureWerx Topco, L.P.(4) |
— | 59,814,352 | 3,367,000 | — | — | 2,158,118 | 65,339,470 | 335,299 | ||||||||||||||||||||||||
Surfaces SLP (SCSp)(4) |
— | 29,161,781 | — | — | — | (5,884,064 | ) | 23,277,717 | — | |||||||||||||||||||||||
Thermostat Purchaser, L.P.(4) |
— | 90,401,213 | — | — | — | 23,001,980 | 113,403,193 | — | ||||||||||||||||||||||||
WHCG Purchaser, Inc.(3) |
— | 3,407,722 | 169,919 | (3,577,641 | ) | — | — | — | 230,690 | |||||||||||||||||||||||
WHCG Purchaser, Inc.(3)(4) |
— | 2,377,506 | 20,419 | — | (2,336,419 | ) | (61,506 | ) | — | — | ||||||||||||||||||||||
WHCG Purchaser, L.P. |
14,022,833 | 12,901,389 | 14,022,833 | — | — | 513,232 | 27,437,454 | — | ||||||||||||||||||||||||
Zenith Longitude Limited |
26,838,037 | 262,470,388 | — | — | — | 102,242,281 | 364,712,669 | 4,299,165 | ||||||||||||||||||||||||
Zoncolan Topco S.à r.l. |
26,085,372 | 96,885,494 | 5,822,805 | — | — | 2,767,328 | 105,475,627 | — | ||||||||||||||||||||||||
Total Non-Controlled Affiliates |
$ | 4,372,029,156 | $ | 199,746,955 | $ | (173,956,103 | ) | $ | 69,764,959 | $ | 189,805,281 | $ | 4,657,390,248 | $ | 15,010,635 | |||||||||||||||||
|
(1) |
Gross additions may include increases in the cost basis of investments resulting from new portfolio investments, the accretion of discounts and the exchange of one or more existing securities for one or more new securities. |
|
(2) |
Gross reductions may include decreases in the cost basis of investments resulting from principal collections related to investment repayments or sales and the exchange of one or more existing securities for one or more new securities. |
|
(3) |
Investment was exited during the period ended March 31, 2025. |
|
(4) |
Investment does not issue shares. |
|
(5) |
This investment is associated with PG Esmeralda Pte. Ltd. |
|
(6) |
Luxembourg Investment Company 285 S.à.r.l, Luxembourg Investment Company 314 S.à.r.l and PG Lion Management Warehouse S.C.S. are related to the same investment. |
8. Accounting and Administration Agreement
The Administrator serves as administrator and accounting agent to the Fund and provides certain accounting, record keeping and investor related services pursuant to an Accounting and Administration Agreement between the Fund and the Administrator. For its services the Administrator receives a monthly fee that is based upon the average net assets of the Fund, fees on portfolio transactions, as well as reasonable out of pocket expenses. For the year ended March 31, 2025, the Fund incurred $7,500,752 in administration and accounting fees due to the Administrator.
9. Investment Transactions
Total purchases of investments for the year ended March 31, 2025 amounted to $3,649,274,563. Total distribution proceeds from sale, redemption, or other disposition of investments for the year ended March 31, 2025 amounted to $2,276,899,313. The cost of investments for U.S. federal income tax purposes is adjusted for items of taxable income allocated to the Fund from such investments. The Fund relies upon actual and estimated tax information provided by the managers of the Private Equity Fund Investments as to the amounts of taxable income allocated to the Fund as of March 31, 2025.
61
Partners Group Private Equity (Master Fund), LLC
(a Delaware Limited Liability Company)
Notes to Consolidated Financial Statements – March 31, 2025 (continued)
10. Indemnification
In the normal course of business, the Fund may enter contracts that provide general indemnification. The Fund’s maximum exposure under these agreements is dependent on future claims that may be made against the Fund under such agreements, and therefore cannot be established; however, based on management’s experience, the risk of loss from such claims is considered remote.
11. Commitments
As of March 31, 2025, the Fund had funded $16,871,397,248 or 90.3% of the $18,686,122,949 of its total commitments to Private Equity Investments. With respect to its (i) Direct Investments it had funded $12,016,257,236 of $12,512,311,232 in total commitments, (ii) Secondary Investments it had funded $2,807,903,422 of $3,187,256,875 in total commitments, and (iii) Primary Investments it had funded $2,047,236,590 of $2,986,554,842 in total commitments, in each case, as of March 31, 2025.
12. Risk Factors
An investment in the Fund involves significant risks, including industry risk, liquidity risk, interest rate risk and economic conditions risk. These risks should be carefully considered prior to investing and should only be considered by investors financially able to maintain their investment and who can afford a loss of a substantial part or all of such investment. The Fund invests substantially all its available capital in Private Equity Investments. Typically, these investments are in restricted securities that are not traded in public markets and are subject to substantial holding periods, so that the Fund may not be able to resell some of its holdings for extended periods, which may be several years. The Fund may have a concentration of investments in a particular industry or sector. The performance of investments in the sector may have a significant impact on the performance of the Fund. The Fund’s Private Equity Investments are illiquid, typically subject to various restrictions on resale, and there is no assurance that the Fund will be able to realize the value of such investments in a timely manner. Private Equity Fund Investments are generally closed-end private equity partnerships with no right to withdraw prior to the termination of the partnership. The frequency of withdrawals is dictated by the governing documents of the Private Equity Fund Investments. Except where a market exists for the securities in which the Fund is directly or indirectly invested, the valuations of the Fund’s investments are estimated. Due to the inherent uncertainty in estimated valuations, those valuations may differ from the valuations that would have been used had a ready market for the securities existed, and the differences could be material.
Investments in Units provide limited liquidity. It is currently intended that holders of Fund Units will be able to redeem Units only through quarterly offers by the Fund to purchase, from holders of Fund Units, a limited number of Units. Those offers are at the discretion of the Board on the recommendation of the Adviser. Therefore, an investment in the Fund is suitable only for investors who can bear the risks associated with the limited liquidity of Units and should be viewed as a long-term investment. No guarantee or representation is made that the Fund’s investment objective will be met.
The impairment or failure of one or more banks with whom the Fund, an underlying fund or their portfolio companies transacts may inhibit the Fund, an underlying fund or their portfolio companies’ ability to access depository accounts. In such cases, the Fund or an underlying fund or portfolio company may be forced to delay or forgo investments or other business opportunities or initiatives, resulting in lower Fund performance. In the event of such a failure of a banking institution where the Fund, an underlying fund or portfolio company holds depository accounts, access to such accounts could be restricted and U.S. Federal Deposit Insurance Corporation (“FDIC”) protection may not be available for balances in excess of amounts insured by the FDIC. In such instances, the Fund, an underlying fund or their portfolio companies may not recover such excess, uninsured amounts.
The failure of certain financial institutions, namely banks, may increase the possibility of a sustained deterioration of financial market liquidity, or illiquidity at clearing, cash management and/or custodial financial institutions. The failure of a bank (or banks) with which the Fund, an underlying fund or their portfolio companies have a commercial relationship could adversely affect, among other things, the Fund, underlying fund or one of their portfolio company’s ability to pursue key strategic initiatives, including by affecting the Fund, an underlying fund or portfolio company’s ability to borrow from financial institutions on favorable terms.
62
Partners Group Private Equity (Master Fund), LLC
(a Delaware Limited Liability Company)
Notes to Consolidated Financial Statements – March 31, 2025 (continued)
12. Risk Factors (continued)
Additionally, if the sponsor of an underlying fund, or a portfolio company, has a commercial relationship with a bank that has failed or is otherwise distressed, the underlying fund and/or its portfolio companies may experience issues receiving financial support from the sponsor to support its operations or consummate transactions, to the detriment of their business, financial condition and/or results of operations.
13. Tax Information
Distributions to Members are recorded on the ex-dividend date. Income dividends and gain distributions are determined in accordance with income tax rules and regulations that may differ in various (or significant) respects from generally accepted accounting principles. Certain capital accounts in the financial statements have been adjusted for permanent book-tax differences. These adjustments have no impact on net asset values or results of operations.
The tax year of the Fund is the 12-month period ending on October 31.
For the tax year ended October 31, 2024, for U.S. federal income tax purposes, the Fund’s aggregate unrealized appreciation and depreciation on its investments based on cost were as follows:
Investments |
Forward Foreign |
|||||||
Tax Cost |
$ | 10,127,743,748 | $ | 5,038,649,875 | ||||
Gross unrealized appreciation |
5,652,282,265 | 38,000,714 | ||||||
Gross unrealized depreciation |
(130,115,692 | ) | (447,089 | ) | ||||
Net unrealized investment appreciation |
$ | 5,522,166,573 | $ | 37,553,625 | ||||
For the tax year ended October 31, 2024, the Fund made the following permanent book-tax differences and reclassifications. These reclassifications were due to differences between book and tax accounting, primarily for partnership investments, net operating losses, and distribution-related adjustments. These reclassifications had no effect on the net assets or net asset value per share of the Fund.
Paid in capital excess of par value |
$ | 264,082,485 | ||
Distributable earnings (accumulated loss) |
(264,082,485 | ) |
For the tax year ended October 31, 2024, the Fund’s tax year end components of distributable earnings on a tax basis are as follows:
Late Year Ordinary Loss Deferral |
$ | (253,693,857 | ) | |
Net Tax Appreciation/(Depreciation) |
5,521,358,421 | |||
Undistributed Capital Gains |
60,527,142 | |||
Capital Loss Carryover |
— |
The tax character of distributions for the tax years ended October 31, 2024 and 2023, was as follows:
2024 |
2023 |
|||||||
Long-term capital gains |
$ | 275,119,177 | $ | 400,009,858 | ||||
ASC Topic 740, “Accounting for Uncertainty in Income Taxes” (“ASC 740”) provides guidance on the accounting for and disclosure of uncertainty in tax position. ASC 740 requires the evaluation of tax positions taken or expected to be taken in the course of preparing the Fund’s tax returns to determine whether the tax positions are “more-likely-than-not” of being sustained by the applicable tax authority. Tax positions deemed to meet the more-likely-than-not threshold are recorded as a tax benefit or expense in the current year. Based on its analysis of its tax position for all open tax years (the current and
63
Partners Group Private Equity (Master Fund), LLC
(a Delaware Limited Liability Company)
Notes to Consolidated Financial Statements – March 31, 2025 (continued)
13. Tax Information (continued)
prior years, as applicable), the Adviser has concluded that the Fund does not have any uncertain tax positions that met the recognition or measurement criteria of ASC 740. Such open tax years remain subject to examination and adjustment by tax authorities.
As of March 31, 2025, the deferred tax liability within the Onshore Subsidiary amounts to $33,656,755 which is primarily related to net unrealized gains on investments.
14. Stock Split
Effective as of the close of business on the date listed in the subsequent table, the Fund’s units underwent a stock split. There was no impact to the aggregate market value of units outstanding. The historical per unit data presented within the Financial Highlights has been retroactively adjusted to reflect the stock split. The stock split ratios, net effect on the NAV per unit, and the number of units outstanding as of the date indicated were as follows:
Date |
Share Split |
Shares Prior |
Shares After |
Increase |
Increase |
|||||||||||||||||||
Class A |
July 2, 2024 | 1 for 4 | 1,025,821,220 | 4,103,284,880 | Decrease | Increase | ||||||||||||||||||
Class I |
July 2, 2024 | 1 for 4 | 834,063,251 | 3,336,253,004 | Decrease | Increase | ||||||||||||||||||
15. Subsequent Events
Management has evaluated the impact of all subsequent events on the Fund and determined that there were no subsequent events that would require disclosure in, or would be required to be recognized in, these consolidated financial statements, except as discussed below.
Revolving Credit Agreement
On May 15, 2025, the Partners Group Private Equity (BSL), LLC entered into a secured revolving credit facility agreement with Bank of America, N.A. The total original commitment under the secured revolving credit facility is $250,000,000. As of the date of these financial statements the total principal amount outstanding under the secured revolving credit facility is $241,341,017.
64
Partners Group Private Equity (Master Fund), LLC
(a Delaware Limited Liability Company)
Fund Management (Unaudited)
INDEPENDENT MANAGERS |
||||
NAME, ADDRESS AND |
POSITION(S) |
TERM |
PRINCIPAL OCCUPATION(S) |
NUMBER OF |
James F. Munsell |
Chairman and Manager |
Since inception |
Senior Counsel, Cleary Gottlieb Steen & Hamilton LLP (2001-Present); Senior Managing Director, Brock Capital Group LLC (2008-2023). |
3 |
Lewis R. Hood, Jr. |
Manager |
Since 2017 |
Retired; Managing Director and Chief Investment Officer (CIO Emeritus from 2014), ERISA Plans, Prudential Insurance Company of America (2002-2015). |
3 |
Stephen G. Ryan |
Manager |
Since 2017 |
Professor of Accounting, Stern School of Business, New York University (1995-Present). |
3 |
Thomas M. Fortin |
Manager |
Since 2024 |
Retired; Managing Partner and Chief Operating Officer (2017-2021), Managing Partner and Chief Information Officer (2021-2024), iCapital, Inc. (2017-2024). |
3 |
|
* |
Each Manager serves an indefinite term, until his or her successor is elected. |
|
** |
Includes any company with a class of securities registered pursuant to Section 12 of the Exchange Act of 1934, as amended (the “Exchange Act”), or subject to the requirements of Section 15(d) of the Exchange Act or any company registered under the Investment Company Act. |
|
*** |
The Fund Complex consists of Partners Group Private Equity (Master Fund), LLC, Partners Group Next Generation Infrastructure, LLC, and Partners Group Growth, LLC. |
The Fund’s statement of additional information includes additional information about the Managers and Officers of the Fund and is available, without charge, upon request, by calling the Fund at 1-877-748-7209, or by visiting the SEC’s website at www.sec.gov.
65
Partners Group Private Equity (Master Fund), LLC
(a Delaware Limited Liability Company)
Fund Management (Unaudited) (continued)
INTERESTED MANAGERS AND OFFICERS |
||||
NAME, ADDRESS AND |
POSITION(S) |
TERM |
PRINCIPAL OCCUPATION(S) |
NUMBER OF |
Robert Collins(1) |
Manager; President |
Indefinite length—since inception |
Partner, Partners Group (2021–Present); Partners Group (2005–Present). |
3 |
Brian J. Igoe |
Chief Financial Officer |
Indefinite length—since 2022 |
Partners Group (2015-Present) |
3 |
Helen Yankilevich |
Chief Operating Officer |
Indefinite length—since 2021 |
Partners Group (2014-Present) |
3 |
Brian Kawakami |
Chief Compliance Officer |
Indefinite length—since 2013 |
Manager, Brian Kawakami LLC (2015–Present). |
3 |
The Fund’s statement of additional information includes additional information about the Managers and Officers of the Fund and is available, without charge, upon request, by calling the Fund at 1-877-748-7209, or by visiting the SEC’s website at www.sec.gov.
66
Partners Group Private Equity (Master Fund), LLC
(a Delaware Limited Liability Company)
Fund Management (Unaudited) (continued)
INTERESTED MANAGERS AND OFFICERS (continued) |
||||
NAME, ADDRESS AND |
POSITION(S) |
TERM |
PRINCIPAL OCCUPATION(S) |
NUMBER OF |
Vilma DeVooght |
Secretary |
Indefinite length—since 2021 |
Senior Compliance Officer, Partners Group (2021-Present); Senior Counsel, ALPS Fund Services, Inc. (2014-2021).
|
3 |
|
* |
Each Manager serves an indefinite term, until his or her successor is elected. |
|
** |
Includes any company with a class of securities registered pursuant to Section 12 of the Exchange Act of 1934, as amended (the “Exchange Act”), or subject to the requirements of Section 15(d) of the Exchange Act or any company registered under the Investment Company Act. |
|
*** |
The Fund Complex consists of Partners Group Private Equity (Master Fund), LLC, Partners Group Next Generation Infrastructure, LLC, and Partners Group Growth, LLC |
|
(1) |
Mr. Collins is deemed an “interested person” of the Fund due to his position as a Partner of the Adviser. |
The Fund’s statement of additional information includes additional information about the Managers and Officers of the Fund and is available, without charge, upon request, by calling the Fund at 1-877-748-7209, or by visiting the SEC’s website at www.sec.gov.
67
Partners Group Private Equity (Master Fund), LLC
(a Delaware Limited Liability Company)
Other Information (Unaudited)
Proxy Voting
The Fund is required to file Form N-PX, with its complete proxy voting record for the twelve months ended June 30, no later than August 31. The Fund’s Form N-PX filing is available: (i) without charge, upon request, by calling 1-877-748-7209 or (ii) by visiting the SEC’s website at www.sec.gov.
Availability of Quarterly Portfolio Schedules
The Fund files its complete schedule of portfolio holdings with the SEC for the first and third quarters of each fiscal year as an exhibit to its reports on Form N-PORT. The Fund’s Forms N-PORT are available on the SEC’s website at www.sec.gov.
Federal Tax Information (Unaudited)
For the tax year ended October 31, 2024, the amount of long-term capital gains designated by the Fund was $275,119,230.
Approval of Investment Management Agreement
At a meeting of the Board held on December 13, 2023, the Board, including a majority of the Independent Managers, approved by a unanimous vote the continuation of the Second Amended and Restated Investment Management Agreement (the “Agreement”).
In advance of the meeting, the Independent Managers requested and received extensive materials from the Adviser to assist them in considering the renewal of the Agreement. The materials provided by the Adviser included detailed comparative information relating to the performance, advisory fees and other expenses of the Fund.
The Board engaged in a detailed discussion of the materials with management of the Adviser. The Independent Managers then met separately with independent counsel to the Independent Managers for a further review of the information presented in the materials. Following this session, the full Board reconvened and after further discussion determined that the information presented provided a sufficient basis upon which to approve the Agreement.
Discussion of Factors Considered
The Independent Managers considered, among other things: (1) the terms of the Agreement; (2) the nature and quality of the advisory services rendered; (3) the experience and qualifications of the personnel that provide such services; (4) the fee structure and the expense ratios in relation to those of other investment companies having comparable investment policies and limitations; (5) the direct and indirect costs incurred by the Adviser and its affiliates in performing advisory services for the Fund, the basis of determining and allocating these costs, and the profitability to the Adviser and its affiliates in performing such services; (6) possible economies of scale arising from the growth of the Fund and the extent to which these have been passed on to the Fund; (7) other compensation or possible benefits to the Adviser and its affiliates arising from their advisory and other relationships with the Fund; (8) the Fund’s investment performance compared to other similar funds; (9) the fees charged by the Adviser and other investment advisers to similar clients and in comparison to industry fees for similar services; and (10) possible conflicts of interest that the Adviser may have with respect to the Fund.
The Independent Managers concluded that the nature, extent, and quality of the services provided by the Adviser to the Fund is appropriate and consistent with the terms of the limited liability company agreement of the Fund, that the quality of those services is consistent with industry norms and that the Fund benefits from the Adviser’s management of the Fund’s investment program. In this regard, they took into account the scope of services provided to the Fund by the Adviser under the Agreement and the complexity of the Fund’s investment program. The Independent Managers noted that, as compared to a group of other similar funds, the Fund generally underperformed for the 2023 fiscal year and generally outperformed for the 2022 fiscal year. The Independent Managers also considered that the performance of the Fund was positive for the one-, three-, five- and ten-year periods ended September 30, 2023 and had been positive since inception. The Independent Managers considered that on a regular basis they received and reviewed information from the Fund’s CCO regarding the Fund’s compliance policies and procedures pursuant to Rule 38a-1 under the 1940 Act. In this regard, the Independent Managers considered the Adviser’s initiatives undertaken in order for the Fund to comply with the SEC rules related to fair valuation and derivatives.
68
Partners Group Private Equity (Master Fund), LLC
(a Delaware Limited Liability Company)
Other Information (Unaudited) (continued)
The Independent Managers also concluded that the Adviser had sufficient personnel with the appropriate education and experience to serve the Fund effectively and has demonstrated its continuing ability to attract and retain qualified personnel. The Independent Managers noted that the Adviser is part of a larger investment advisory group that advises other funds and individual investors with respect to private equity investments and that relationship may make available to the Fund investment opportunities that would not be available to the Fund if the Adviser was not the Fund’s investment adviser.
The Independent Managers considered the costs of the services provided by the Adviser and the compensation and benefits received by the Adviser in providing services to the Fund. The Independent Managers reviewed the financial statements of the Adviser and the Adviser’s parent and a profitability analysis of the Adviser, considered any direct or indirect revenues that could be received by affiliates of the Adviser, and concluded that the Adviser’s fees and profits were reasonable in relation to the nature and quality of the services provided to the Fund, taking into account the fees charged by other advisers for managing comparable funds. The Independent Managers also concluded that the overall expense ratio of the Fund was reasonable, taking into account the size of the Fund and the quality of services provided by the Adviser.
The Independent Managers considered the extent to which economies of scale have been realized and whether fee levels reflect those economies, noting that as the Fund continues to grow, additional economies of scale may be realized. The Independent Mangers considered in that regard that the Fund’s gross and net expense ratios, exclusive of incentive fees, have generally declined as the Fund’s assets have grown.
The Independent Managers also discussed any ancillary benefits that may be received by Partners Group from the Adviser’s management of the Fund, including, without limitation, the potential for increased brand recognition of Partners Group. The Independent Managers concluded that the Adviser’s fees were reasonable in light of any fall-out benefits.
The Independent Managers considered all factors and no one factor alone was deemed dispositive.
Conclusion
The Independent Managers determined that the information presented provided a sufficient basis upon which to approve the continuation of the Agreement and that the compensation and other terms of the Agreement were in the best interests of the Fund and its members.
69
Partners Group Private Equity (Master Fund), LLC
(a Delaware Limited Liability Company)
Other Information (Unaudited) (continued)
Privacy Policy
FACTS |
WHAT DOES PARTNERS GROUP PRIVATE EQUITY (MASTER FUND), LLC DO WITH YOUR PERSONAL INFORMATION? |
Why? |
Financial companies choose how they share your personal information. Federal law gives consumers the right to limit some but not all sharing. Federal law also requires us to tell you how we collect, share, and protect your personal information. Please read this notice carefully to understand what we do. |
What? |
The types of personal information we collect and share depend on the product or service you have with us. This information can include:
● Social Security number ● account balances ● account transactions ● transaction history ● wire transfer instructions ● checking account information
When you are no longer our customer, we continue to share your information as described in this notice. |
How? |
All financial companies need to share customers’ personal information to run their everyday business. In the section below, we list the reasons financial companies can share their customers’ personal information; the reasons Partners Group Private Equity (Master Fund), LLC chooses to share; and whether you can limit this sharing. |
Reasons we can share your personal information |
Does Partners Group Private Equity (Master Fund), LLC share? |
Can you limit this sharing? |
For our everyday business purposes – |
Yes |
No |
For our marketing purposes – |
No |
We do not share |
For joint marketing with other financial companies |
No |
We do not share |
For our affiliates’ everyday business purposes – information about your transactions and experiences |
Yes |
No |
For our affiliates’ everyday business purposes – information about your creditworthiness |
No |
We do not share |
For our affiliates to market to you |
No |
We do not share |
For nonaffiliates to market to you |
No |
We do not share |
Questions? |
Call 1-877-748-7209 |
70
Partners Group Private Equity (Master Fund), LLC
(a Delaware Limited Liability Company)
Other Information (Unaudited) (continued)
Privacy Policy (continued)
What we do |
|
How does Partners Group Private Equity (Master Fund), LLC protect my personal information? |
To protect your personal information from unauthorized access and use, we use security measures that comply with federal law. These measures include computer safeguards and secured files and buildings. |
How does Partners Group Private Equity (Master Fund), LLC collect my personal information? |
We collect your personal information, for example, when you
● open an account ● provide account information ● give us your contact information ● make a wire transfer ● tell us where to send the money
We also collect your information from others, such as credit bureaus, affiliates, or other companies. |
Why can’t I limit all sharing? |
Federal law gives you the right to limit only
● sharing for affiliates’ everyday business purposes – information about your creditworthiness ● affiliates from using your information to market to you ● sharing for nonaffiliates to market to you
State laws and individual companies may give you additional rights to limit sharing. |
European Union’s General Data Protection Regulation |
In addition to the above information, where applicable, you have the following rights under the European Union’s General Data Protection Regulation (“GDPR”) and U.S. Privacy Laws, as applicable and to the extent permitted by law, to
● Check whether we hold personal information about you and to access such data (in accordance with our policy) ● Request the correction of personal information about you that is inaccurate ● Have a copy of the personal information we hold about you provided to you or another “controller” where technically feasible ● Request the erasure of your personal information ● Request the restriction of processing concerning you
The legal grounds for processing of your personal information is for contractual necessity and compliance with law.
If you wish to exercise your rights, please contact:
Partners Group Private Equity (Master Fund), LLC 1114 Avenue of the Americas 37th Floor New York, New York 10036 Attn: Chief Compliance Officer
You are required to ensure the personal information we hold about you is up-to-date and accurate and you must notify us of any changes to the personal data you provided to us. |
71
Partners Group Private Equity (Master Fund), LLC
(a Delaware Limited Liability Company)
Other Information (Unaudited) (continued)
Privacy Policy (continued)
We retain your personal information for a period of at least five (5) years from the date on which you first invested in the Partners Group Private Equity (Master Fund), LLC for which personal data was provided or the date when you fully redeemed your investment. Thereafter, your personal information will be deleted (or otherwise erased or de-identified) any such personal data except as required or permitted by applicable law or regulation.
You also have the right to lodge a complaint with the appropriate regulatory authority with respect to issues you may have. |
|
Definitions |
|
Affiliates |
Companies related by common ownership or control. They can be financial and nonfinancial companies.
● Our affiliates include companies with a Partners Group name, such as Partners Group (USA) Inc., investment adviser to the Fund and other funds, and Partners Group AG. |
Controller |
“Controller” means the natural or legal person, public authority, agency or other body which, alone or jointly with others, determines the purposes and means of the processing of personal data; where the purposes and means of such processing are determined by European Union or European Member State law, the controller or the specific criteria for its nomination may be provided for by European Union or European Member State law. |
Nonaffiliates |
Companies not related by common ownership or control. They can be financial and nonfinancial companies.
● Partners Group Private Equity (Master Fund), LLC does not share with nonaffiliates so they can market to you. |
Joint marketing |
A formal agreement between nonaffiliated financial companies that together market financial products or services to you.
● Partners Group Private Equity (Master Fund), LLC does not jointly market. |
72
(b) Not applicable.
Item 2. Code of Ethics.
The registrant has adopted a code of ethics (the “Code”), as defined in Item 2 of Form N-CSR, that applies to the registrant's principal executive officer, principal financial officer, principal accounting officer or controller, or persons performing similar functions. The registrant did not grant any implicit or explicit waivers to the provisions of the Code during the period covered by the report. A copy of the Code is filed under Item 19(a)(1) of this Form.
Item 3. Audit Committee Financial Expert.
As of the end of the period covered by the report, the registrant's board of managers has determined that Mr. Stephen Ryan is qualified to serve as the audit committee financial expert serving on its audit committee and that he is "independent," as defined by Item 3(a)(2) of Form N-CSR.
Item 4. Principal Accountant Fees and Services.
(a) Audit Fees.
The aggregate fees billed for each of the last two fiscal years for professional services rendered by the principal accountant for the audit of the registrant's annual financial statements or services that are normally provided by the accountant in connection with statutory and regulatory filings or engagements for those fiscal years are $1,116,002 for 2024 and $1,257,065 for 2025.
(b) Audit-Related Fees.
The aggregate fees billed in each of the last two fiscal years for assurance and related services by the principal accountant that are reasonably related to the performance of the audit of the registrant's financial statements and are not reported under paragraph (a) of this Item are $45,000 for 2024 and $10,000 for 2025.
(c) Tax Fees.
The aggregate fees billed in each of the last two fiscal years for professional services rendered by the principal accountant for tax compliance, tax advice, and tax planning are $0 for 2024 and $0 for 2025.
(d) All Other Fees.
The aggregate fees billed in each of the last two fiscal years for products and services provided by the principal accountant other than the services reported in paragraphs (a) through (c) of this Item are $0 for 2024 and $0 for 2025. The registrant's independent registered public accounting firm provides reasonable assurances on the correctness of the processes and procedures leading to the fair value of the investments calculated by Partners Group (USA) Inc. as well as the calculation itself, in accordance with their quarterly fair valuation process.
(e)(1) Audit Committee Pre-Approval Policies and Procedures.
Disclose the audit committee's pre-approval policies and procedures described in paragraph (c)(7) of Rule 2-01 of Regulation S-X.
The registrant's audit committee must pre-approve the audit and non-audit services of the independent registered public accounting firm prior to the independent registered public accounting firm’s engagement.
(e)(2) Percentage of Services.
The percentage of services described in each of paragraphs (b) through (d) of this Item that were approved by the audit committee pursuant to paragraph (c)(7)(i)(C) of Rule 2-01 of Regulation S-X are as follows:
(b) 0%
(c) 0%
(d) 100%
(f) The percentage of hours expended on the principal accountant's engagement to audit the registrant's financial statements for the most recent fiscal year that were attributed to work performed by persons other than the principal accountant's full-time, permanent employees was less than fifty percent.
(g) The aggregate non-audit fees billed by the registrant's accountant for services rendered to the registrant, and rendered to the registrant's investment adviser (not including any sub-adviser whose role is primarily portfolio management and is subcontracted with or overseen by another investment adviser), and any entity controlling, controlled by, or under common control with the adviser that provides ongoing services to the registrant for each of the last two fiscal years of the registrant was $0 for 2024 and $0 for 2025.
(h) The registrant's audit committee of the board of managers has considered whether the provision of non-audit services that were rendered to the registrant's investment adviser (not including any sub-adviser whose role is primarily portfolio management and is subcontracted with or overseen by another investment adviser), and any entity controlling, controlled by, or under common control with the investment adviser that provides ongoing services to the registrant that were not pre-approved pursuant to paragraph (c)(7)(ii) of Rule 2-01 of Regulation S-X is compatible with maintaining the principal accountant's independence.
(i) Not applicable.
(j) Not applicable.
Item 5. Audit Committees of Listed Registrants.
Not applicable.
Item 6. Investments.
(a) Schedules of Investments are included as part of the reports to shareholders filed under Item 1(a) of this Form N-CSR.
(b) Not applicable.
Item 7. Financial Statements and Financial Highlights for Open-End Management Investment Companies
(a) Not applicable.
(b) Not applicable.
Item 8. Changes in and Disagreements with Accountants for Open-End Management Investment Companies
Not applicable.
Item 9. Proxy Disclosures for Open-End Management Investment Companies
Not applicable.
Item 10. Remuneration Paid to Directors, Officers, and Others of Open-End Management Investment Companies
Not applicable.
Item 11. Statement Regarding Basis for Approval of Investment Advisory Contract
Not applicable.
Item 12. Disclosure of Proxy Voting Policies and Procedures for Closed-End Management Investment Companies
The Proxy Voting Policies are attached herewith.
PROXY VOTING POLICY
Investment advisers registered with the SEC, and which exercise voting authority with respect to client securities, are required by Rule 206(4)-6 of the Investment Advisers Act of 1940, as amended (the "Advisers Act") to (a) adopt and implement written policies and procedures that are reasonably designed to ensure that client securities are voted in the best interests of clients, which must include how an adviser addresses material conflicts that may arise between the adviser’s interests and those of its clients; (b) disclose to clients how they may obtain information from the adviser with respect to the voting of proxies for their securities; (c) describe to clients a summary of its proxy voting policies and procedures and, upon request, furnish a copy to its clients; and (d) maintain certain records relating to the adviser’s proxy voting activities when the adviser does have proxy voting authority.
Partners Group (USA) Inc. (the “Adviser”) is the investment manager to Partners Group Private Equity (Master Fund), LLC (the “Fund”). All proxy voting responsibilities of the Fund are performed by the Adviser, with the assistance of the Administrator of the Fund. The Adviser utilizes Glass Lewis Europe Limited ("Proxy Firm"), to administer the voting of the Fund's proxies.
This policy is designed to address the Adviser’s obligations with respect to the Fund pursuant to Rule 206(4)-6 of the Advisers Act.
The Adviser shall vote the proxies appurtenant to all shares of corporate stock or ownership interest owned by the Fund for which it serves as adviser, and the Adviser shall vote said proxies in accordance with the proxy voting policies set forth herein.
1. Scope of Policy
The Adviser is a fiduciary to the Fund. Accordingly, the Adviser has a fiduciary duty to vote all proxies in the best interest of the Fund.
The Adviser has an obligation to vote all proxies received from shares of corporate stock or ownership interest owned by its client accounts in the best interests of those clients.1 In voting these proxies, the Adviser may not be motivated by, or subordinate the Fund's interests, to its own objectives or those of persons or parties unrelated to the Fund. The Adviser will endeavor to exercise all appropriate and lawful care, skill, prudence and diligence in voting proxies, and shall vote all proxies relating to shares or ownership interests owned by the Fund and received by the Adviser. The Adviser shall not be responsible, however, for voting proxies that it does not receive in sufficient time to respond.
In order to carry out its responsibilities with regard to voting proxies, the Adviser will seek to track all shareholder/interest holder meetings convened by companies whose shares are held in the Fund, identify all material issues presented to shareholder/interest holders at such meetings, formulate a reasonable position on each such issue and ensure that proxies pertaining to all shares or ownership interests owned in client accounts are voted in accordance with such determinations.
In addition, the Adviser has engaged the services of the Proxy Firm, an independent third party, to cast proxy votes according to the Adviser’s established guidelines. The Proxy Firm will be required to promptly notify the Adviser of any proxy issues that do not fall under the guidelines set forth below. The Adviser does not believe that conflicts of interest will generally arise in connection with its proxy voting directives.
2. Proxy Guidelines
The Adviser’s general policy is to support proposals that maintain or enhance (i) the economic value of the issuer and (ii) the rights and interests of unitholders, and to oppose proposals that are inconsistent with these objectives. Accordingly, proxy proposals are typically voted as set forth below. However, the Adviser may deviate from such general guidelines if it reasonably determines that doing so is in the best interest of the Fund.
I. Election of Board of Directors
| · | The Adviser will generally vote in support of management’s nominees for the board of directors, and in favor of proposals that support board independence. |
II. Appointment of Independent Auditors
| · | The Adviser will generally support the recommendation of the board of directors. |
III. Issues of Corporate Structure and Shareholder/Interest Holder Rights
| · | The Adviser generally supports proposals designed to maintain or enhance shareholder/interest holder rights and/or value, such as the following: |
1 For purposes of this policy, opportunities to vote on matters raised in connection with the Fund investments are considered to be proxies.
| o | Management proposals for approval of stock/interest repurchase programs or stock splits (including reverse splits). |
| o | Proposals supporting shareholder/interest holders rights (i) to vote on shareholder/interest holder rights plans (poison pills), (ii) to remove supermajority voting provisions and/or (iii) to call special meetings and to act by written consent. |
| · | The Adviser does not support obstacles erected by companies to prevent mergers or takeovers, as it considers that such actions may depress the company’s marketplace value. Accordingly, the Adviser generally votes against management on proposals such as the following: |
| o | Anti-takeover and related provisions that serve to prevent the majority of shareholder/interest holders from exercising their rights or effectively deter appropriate tender offers and other offers. |
| o | Shareholder/interest holder rights plans (poison pills) that allow the board of directors to block appropriate offers to shareholder/interest holders or which trigger provisions preventing legitimate offers from proceeding. |
| o | Reincorporation in a jurisdiction which has more stringent anti-takeover and related provisions. |
| o | Change-in-control provisions in non-salary compensation plans, employment contracts, and severance agreements which benefit management and would be costly to shareholder/interest holders if triggered. |
| o | Establishment of classified boards of directors. |
| · | The Adviser generally votes against management on proposals such as the following, which have potentially substantial financial or best interest impact: |
| o | Capitalization changes that add “blank check” classes of stock or classes that dilute the voting interests of existing shareholder/interest holders. |
| o | Amendments to by-laws which would require super-majority shareholder/interest holder votes to pass or repeal certain provisions. |
| o | Elimination of shareholder/interest holders’ right to call special meetings. |
| o | Excessive compensation. |
| o | “Other business as properly comes before the meeting” proposals which extend “blank check” powers to those acting as proxy. |
| o | Proposals requesting re-election of insiders or affiliated directors who serve on audit, compensation, and nominating committees. |
IV. Mergers and Acquisitions
| · | The Adviser evaluates Mergers and Acquisitions on a case-by-case basis, and will use its discretion to vote in a manner that it believes will maximize shareholder/interest holder value. |
V. Executive and Director Equity-Based Compensation
| · | The Adviser is generally in favor of properly constructed equity-based compensation arrangements. The Adviser will support proposals that provide management with the ability to implement compensation arrangements that are both fair and competitive. However, the Adviser may oppose management proposals that could potentially significantly dilute shareholder/interest holders’ ownership interests in the company, or which it considers unreasonable. |
VI. Corporate Social and Policy Issues
| · | With respect to the wide variety of corporate and social policy issues for which voting may be required, the Adviser generally supports proposals that are designed to enhance the economic value of the issuer, provided such policies are not inconsistent with the principles of socially responsible investing adopted by the Adviser. |
VII. Matters Arising in Respect of Private Market Investments
| · | Matters arising in respect of direct investments will be considered on a case-by-case basis. The Adviser will vote on or consent to such matters in a manner that is consistent with the general policy and principles outlined above. The basis for the voting decision and any recommendation the Adviser may receive from its affiliates or advisers, including the basis for the determination that the decision is in the best interests of the Fund and the Adviser’s other clients, shall be formalized in writing. |
3. Conflicts
From time to time, the Adviser will review a proxy which presents a potential material conflict. As a fiduciary to its clients, the Adviser takes these potential conflicts very seriously. While the Adviser’s only goal in addressing any such potential conflict is to ensure that proxy votes are cast in the clients’ best interests and are not affected by the Adviser’s potential conflict, there are a number of courses the Adviser may take including, but not limited to, delegating the vote to the Proxy Firm. The final decision about which course to follow shall be made by the Adviser’s investment committee.
When the matter clearly corresponds to one of the proposals enumerated above, casting a vote which simply follows the Adviser’s pre-determined policy would eliminate the Adviser’s discretion on the particular issue and hence avoid the conflict.
In other cases, where the matter presents a potential material conflict and is not clearly within one of the enumerated proposals, or is of such a nature that the Adviser believes more active involvement is necessary, the Adviser may delegate the vote to the Proxy Firm to determine the appropriate vote.
Alternatively, in certain situations the Adviser’s investment committee may determine that delegating the vote to the Proxy Firm is unfeasible, impractical or unnecessary. In such situations, the investment committee shall make a decision about the voting of the proxy. The basis for the voting decision, and any recommendation the Adviser may receive from its affiliates or advisers, including the basis for the determination that the decision is in the best interests of the Fund and the Adviser’s other clients, shall be formalized in writing.
4. Proxy Voting Procedures
The following describes the standard procedures that are to be followed with respect to carrying out the Adviser's proxy policy. The execution of these procedures may be delegated in whole or in part.
| 1. | When a proxy vote is called for, all relevant information in the proxy materials will be recorded by the Adviser in a database. |
| 2. | The Adviser will confirm the Fund's holdings of the securities and that the Fund is eligible to vote. |
| 3. | The Adviser will review the proxy and if necessary compile information relating to such proxy. The Adviser will consider whether there are any conflicts or other issues that warrant the delegating the vote to the Proxy Firm. |
| 4. | In determining how to vote, the Adviser will consider the guidelines set forth above, the Adviser’s knowledge of the company, and the recommendations (if any) put forth by the Proxy Firm or an affiliate. |
| 5. | The Adviser will maintain the documentation that supports its voting position. In particular, as to non-routine, materially significant or controversial matters, such documentation will describe the position taken, why that position is in the best interest of the Fund, an indication of whether the Adviser supported or did not support management and/or any other relevant information. |
| 6. | After the proxy is completed but before it is returned to the issuer and/or its agent, the Adviser may review the proxy to determine that the appropriate documentation has been created, including conflict of interest screening. |
| 7. | The Adviser will endeavor to submit its vote on all proxies in a timely fashion, in sufficient time for the vote to be lodged to the extent the Adviser has had an opportunity to follow its Proxy Policy. |
| 8. | The Adviser will retain (i) a copy of each proxy statement that the Adviser receives regarding the Fund's securities; (ii) a record of each vote cast by the Adviser on behalf of the Fund; (iii) a copy of any document created by the Adviser that was material to making a decision how to vote proxies on behalf of the Fund or that memorializes the basis for that decision; (iv) a copy of each written client request for information on how the Adviser voted proxies on behalf of the Fund, and (v) a copy of any written response by the Adviser to any (written or oral) client request for information on how the Adviser voted proxies on behalf of the requesting Fund investor. |
| 9. | The Adviser will periodically review these policies and procedures to ensure compliance. |
5. Obtaining Proxy Voting Information
To obtain information on how the Adviser voted proxies, Fund investors may contact:
Partners Group Private Equity (Master Fund), LLC
1114 Avenue of the Americas, 37th Floor
New York, NY 10036
Attn: Chief Compliance Officer
Re: Proxy voting information request
6. Recordkeeping
The Fund and Adviser shall retain their (i) proxy voting policies and procedures; (ii) proxy statements received regarding portfolio securities of the Fund; (iii) records or votes it casts on behalf of the Fund; (iv) records of Fund investor requests for proxy voting information and responses to such requests, and (v) any documents prepared by the Adviser that are material in making a proxy voting decision. Such records may be maintained with a third party, such as the Proxy Firm, that will provide a copy of the documents promptly upon request.
Adopted: November 2, 2023
Item 13. Portfolio Managers of Closed-End Management Investment Companies
(a)(1) Identification of Portfolio Manager(s) or Management Team Members and Description of Role of Portfolio Manager(s) or Management Team Members
The following table provides biographical information about the members of the Investment Committee of Partners Group (USA) Inc. (the “Adviser”), who are primarily responsible for the day-to-day portfolio management of the Partners Group Private Equity (Master Fund), LLC (the “registrant” or the “Fund”), as of the date of filing of the report:
| Name of Investment Committee Member | Title | Length of Time of Service to the Fund | Business Experience During the Past 5 Years | Role of Investment Committee Member |
| Robert Collins | Partner | Since Inception* | Partner, Partners Group (2021-Present); Managing Director, Partners Group (2012-2021); Partners Group (2005-Present). | Portfolio Management |
| Thomas Stein | Partner | Since 2021 | Partner, Partners Group (2023-Present); Managing Director, Partners Group (2018-2023). | Portfolio Management |
| Adam Howarth | Partner | Since Inception** | Partner, Partners Group (2022-Present); Partners Group (2007-Present). | Portfolio Management |
| Joel Schwartz | Partner | Since 2015 | Partner, Partners Group (2017-Present); Partners Group (2013-Present). | Portfolio Management |
| Anthony Shontz | Partner | Since 2012 | Partner, Partners Group (2022-Present); Partners Group (2007-Present); Director, Board of Partners Group (USA) Inc. (2018-2023). | Portfolio Management |
| Robin Shelley | Managing Director | Since 2024 | Managing Director, Partners Group (2024-Present); Senior Investment Leader, Partners Group (2021-2023); Investment Leader, Partners Group (2020). | Portfolio Management |
| Todd Bright | Partner | Since 2016 | Partner, Partners Group (2018-Present); Partners Group (2014-Present); Director, Board of Partners Group (USA) Inc. (2018-2023). | Portfolio Management |
| Ron Lamontagne | Managing Director | Since 2016 | Managing Director, Partners Group (2015-Present); Partners Group (2015-Present). | Portfolio Management |
| * | Mr. Collins served as a portfolio manager for the registrant from 2009-2012, Chief Financial Officer since inception-2014 and President from 2014-present. |
**Mr. Howarth served as a portfolio manager for the registrant from 2009-2011 and as deputy portfolio manager from 2014-2018.
The following table provides biographical information about the members of the Liquid Private Markets (“LIPM”) Investment Committee of the Adviser, who are primarily responsible for managing the listed private equity portion of the Fund’s portfolio, as of the date of filing of this report:
| Name of Investment Committee Member | Title | Length of Time of Service to the Fund | Business Experience During the Past 5 Years | Role of Investment Committee Member |
| Benjamin Lorenz | Senior Portfolio Manager - LIPM | Since 2022 | Senior Portfolio Manager, Partners Group, (2024-Present); Portfolio Manager, Partners Group (2022-2024); Senior Investment Analyst, Partners Group (2019-2021); Partners Group (2011-Present). | Portfolio Management – LIPM |
| Lorenzo Papi | Portfolio Manager – LIPM | Since 2023 | Portfolio Manager, Partners Group, (2023-Present); Investment Associate, Partners Group (2020-2023); Investment Analyst, Partners Group (2018-2020). | Portfolio Management – LIPM |
| Henrik Stutz | Senior Investment Analyst – LIPM | Since 2023 | Senior Investment Analyst, Partners Group (2021-Present); Associate Investment Analyst, Partners Group (2017-2021). | Portfolio Management – LIPM |
(a)(2) Other Accounts Managed by Portfolio Manager(s) or Management Team Member and Potential Conflicts of Interest
The following table provides information about portfolios and accounts, other than Partners Group Private Equity (Master Fund), LLC, for which the members of the Investment Committee of the Adviser are jointly and primarily responsible for the day-to-day portfolio management as of March 31, 2025:
| NAME OF PORTFOLIO MANAGEMENT TEAM MEMBER | NUMBER OF OTHER ACCOUNTS MANAGED AND TOTAL VALUE OF ASSETS† BY ACCOUNT TYPE FOR WHICH THERE IS NO PERFORMANCE-BASED FEE | NUMBER OF OTHER ACCOUNTS AND TOTAL VALUE OF ASSETS† FOR WHICH ADVISORY FEE IS PERFORMANCE-BASED: |
| Registered investment companies | Other pooled investment vehicles | Other accounts | Registered investment companies | Other pooled investment vehicles | Other accounts | |
| Todd Bright | Zero accounts | Zero accounts | Zero accounts | 2 Registered investment companies with a value of $205million | 16 pooled investment vehicles with a value of $5.5 billion | 41 accounts with a value of $5.5 billion |
| Robert Collins | Zero accounts | Zero accounts | Zero accounts | 2 Registered investment companies with a value of $205million | 16 pooled investment vehicles with a value of $5.5 billion | 41 accounts with a value of $5.5 billion |
| Robin Shelley | Zero accounts | Zero accounts | Zero accounts | 2 Registered investment companies with a value of $205million | 16 pooled investment vehicles with a value of $5.5 billion | 41 accounts with a value of $5.5 billion |
| Thomas Stein | Zero accounts | Zero accounts | Zero accounts | 2 Registered investment companies with a value of $205million | 16 pooled investment vehicles with a value of $ billion | 41 accounts with a value of $ 5.5 billion |
| Adam Howarth | Zero accounts | Zero accounts | Zero accounts | 2 Registered investment companies with a value of $205million | 16 pooled investment vehicles with a value of $5.5 billion | 41 accounts with a value of $5.5 billion |
| Ron Lamontagne | Zero accounts | Zero accounts | Zero accounts | 2 Registered investment companies with a value of $205million | 16 pooled investment vehicles with a value of $5.5 billion | 41 accounts with a value of $5.5 billion |
| Joel Schwartz | Zero accounts | Zero accounts | Zero accounts | 2 Registered investment companies with a value of $205million | 16 pooled investment vehicles with a value of $5.5 billion | 41 accounts with a value of $5.5 billion |
| Anthony Shontz | Zero accounts | Zero accounts | Zero accounts | 2 Registered investment companies with a value of $205million | 16 pooled investment vehicles with a value of $5.5 billion | 41 accounts with a value of $5.5 billion |
| Benjamin Lorenz* | Zero accounts | Zero accounts | Zero accounts | 2 Registered investment companies with a value of $205million** | 16 pooled investment vehicles with a value of $5.5 billion** | Zero accounts |
| Lorenzo Papi* | Zero accounts | Zero accounts | Zero accounts | 2 Registered investment companies with a value of $205million** | 16 pooled investment vehicles with a value of $5.5 billion** | Zero accounts |
| Henrik Stutz* | Zero accounts | Zero accounts | Zero accounts | 2 Registered investment companies with a value of $205million** | 16 pooled investment vehicles with a value of $5.5 billion** | Zero accounts |
| † | Approximate |
| * | Member of the Liquid Private Markets Investment Committee |
| ** | Only the listed portions of the relevant registered investment company's or pooled investment vehicle's portfolios are managed by this member. |
Potential Conflicts of Interests
Members of the Portfolio Management Team are involved in the management of other accounts, including proprietary accounts, separate accounts and other pooled investment vehicles. Members of the Portfolio Management Team may manage separate accounts or other pooled investment vehicles that may have materially higher or different fee arrangements than the Fund and may also be subject to performance-based fees. The side-by-side management of these separate accounts and pooled investment vehicles may raise potential conflicts of interest relating to cross trading and the allocation of investment opportunities.
The Adviser has a fiduciary responsibility to manage all client accounts in a fair and equitable manner. The Adviser seeks to provide best execution of all securities transactions and to allocate investments to client accounts in a fair and reasonable manner. To this end, the Adviser has developed policies and procedures designed to mitigate and manage the potential conflicts of interest that may arise from side-by-side management.
(a)(3) Compensation Structure of Portfolio Manager(s) or Management Team Members
The Adviser is a wholly-owned subsidiary of Partners Group Holding AG (“Partners Group Holding”) and an affiliate of Partners Group AG, the principal operating subsidiary of Partners Group Holding. Partners Group Holding is a listed company with major ownership by its employees. The ownership structure is designed to motivate and retain employees.
The Portfolio Management Team and other employees of the Adviser are compensated with a fixed annual salary, which is typically supplemented by an annual bonus based on individual and team based performance. Key professionals, including the Portfolio Management Team, are additionally compensated through equity participation in Partners Group Holding.
This equity ownership is structured in a manner designed to provide for long-term continuity. Accordingly, the vesting parameters of equity incentives are rather stringent. Any equity or option holder intending to leave the firm has the obligation to render his or her unvested interest back to the company, either in the form of equity shares or options depending upon the extent of ownership interest. As a result, the Adviser believes that members of the Portfolio Management Team have a strong interest to remain with the firm over the long term.
(a)(4) Disclosure of Securities Ownership
The following table sets forth the dollar range of equity securities beneficially owned by each member of the Investment Committee of the Adviser indirectly in the Master Fund as of March 31, 2025:
|
Investment
Committee Member |
Dollar Range of Fund
Shares Beneficially Owned |
| Robert Collins | Over $1,000,000 |
| Robin Shelley | None |
| Thomas Stein | None |
| Adam Howarth | $100,001 - $500,000 |
| Joel Schwartz | None |
| Anthony Shontz | None |
| Todd Bright | None |
| Ron Lamontagne | None |
| Benjamin Lorenz | None |
| Lorenzo Papi | None |
| Henrik Stutz | None |
Item 14. Purchases of Equity Securities by Closed-End Management Investment Company and Affiliated Purchasers
Not applicable.
Item 15. Submission of Matters to a Vote of Security Holders
There have been no material changes to the procedures by which the shareholders may recommend nominees to the registrant's board of managers, where those changes were implemented after the registrant last provided disclosure in response to the requirements of Item 407(c)(2)(iv) of Regulation S-K (17 CFR 229.407), or this Item.
Item 16. Controls and Procedures
(a). The registrant's principal executive and principal financial officers, or persons performing similar functions, have concluded that the registrant's disclosure controls and procedures (as defined in Rule 30a-3(c) under the Investment Company Act of 1940, as amended (the "1940 Act") (17 CFR 270.30a-3(c))) are effective, as of a date within 90 days of the filing date of the report that includes the disclosure required by this paragraph, based on their evaluation of these controls and procedures required by Rule 30a-3(b) under the 1940 Act (17 CFR 270.30a-3(b)) and Rules 13a-15(b) or 15d-15(b) under the Securities Exchange Act of 1934, as amended (17 CFR 240.13a-15(b) or 240.15d-15(b)).
(b). There was no change in the registrant's internal control over financial reporting (as defined in Rule 30a-3(d) under the 1940 Act (17 CFR 270.30a-3(d)) that occurred during the period covered by this report that has materially affected, or is reasonably likely to materially affect, the registrant's internal control over financial reporting.
Item 17. Disclosure of Securities Lending Activities for Closed-End Management Investment Companies
(a) Not applicable.
(b) Not applicable.
Item 18. Recovery of Erroneously Awarded Compensation
Not applicable.
Item 19. Exhibits
(a)(2) Not applicable.
(a)(4) Not applicable.
(a)(5) Not applicable.
SIGNATURES
Pursuant to the requirements of the Securities Exchange Act of 1934, as amended, and the Investment Company Act of 1940, as amended, the registrant has duly caused this report to be signed on its behalf by the undersigned, thereunto duly authorized.
Partners Group Private Equity (Master Fund), LLC
| By (Signature and Title): | /s/ Robert M. Collins | ||
| Robert M. Collins, President & | |||
| Chief Executive Officer | |||
| (Principal Executive Officer) | |||
| Date: | June 9, 2025 |
Pursuant to the requirements of the Securities Exchange Act of 1934, as amended, and the Investment Company Act of 1940, as amended, this report has been signed below by the following persons on behalf of the registrant and in the capacities and on the dates indicated.
| By (Signature and Title): | /s/ Robert M. Collins | ||
| Robert M. Collins, President & | |||
| Chief Executive Officer | |||
| (Principal Executive Officer) | |||
| Date: | June 9, 2025 |
| By (Signature and Title): | /s/ Brian Igoe | ||
| Brian Igoe, Chief Financial Officer | |||
| (Principal Financial Officer) | |||
| Date: | June 9, 2025 |