ITEM 1. SCHEDULE OF INVESTMENTS.
The Schedule(s) of Investments is attached herewith.
Partners Group Private Equity (Master Fund), LLC
(a Delaware Limited Liability Company)
Consolidated Schedule of Investments —
June 30, 2025 (Unaudited)
The unaudited consolidated schedule of investments of Partners Group Private Equity (Master Fund), LLC (the “Fund”), a Delaware limited liability company that is registered under the Investment Company Act of 1940, as amended (the “Investment Company Act”), as a non-diversified, closed-end management investment company, as of June 30, 2025, is set forth below:
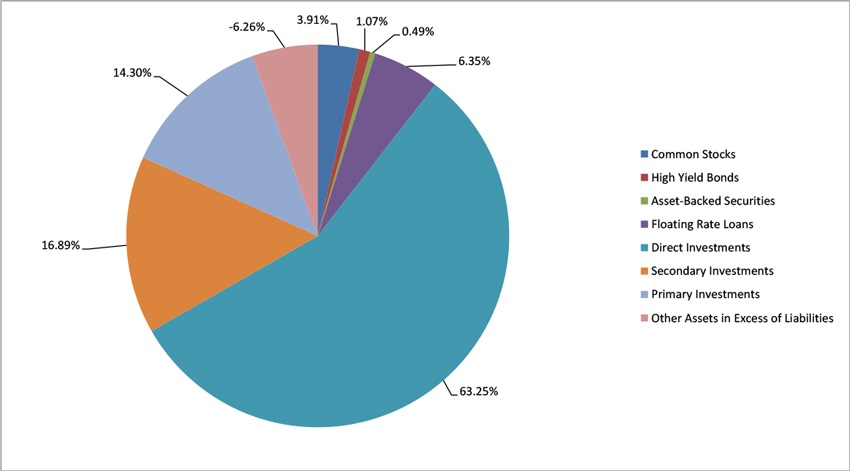
INVESTMENT PORTFOLIO AS A PERCENTAGE OF TOTAL NET ASSETS
| Industry | Acquisition Date | Shares | Fair Value | |||||||||
| Public Investments (11.82%) | ||||||||||||
| Common Stocks (3.91%) | ||||||||||||
| North America (2.24%) | ||||||||||||
| American Tower Corp. | Communication | 05/29/20 | 102,489 | $ | 22,640,845 | |||||||
| American Water Works Co., Inc. | Utilities | 02/16/16 | 142,675 | 19,841,812 | ||||||||
| Apollo Global Management, LLC | Diversified Financial Services | 09/05/23 | 148,123 | 21,012,729 | ||||||||
| Ares Capital Corp. | Diversified Financial Services | 02/16/16 | 454,447 | 9,975,112 | ||||||||
| Ares Management Corp. | Diversified Financial Services | 06/28/19 | 66,086 | 11,430,895 | ||||||||
| Atmos Energy Corp. | Utilities | 02/16/16 | 107,922 | 16,621,067 | ||||||||
| Blackstone Group, Inc. | Diversified Financial Services | 07/12/19 | 89,658 | 13,410,147 | ||||||||
| Blue Owl Capital, Inc. | Financials | 10/21/24 | 389,366 | 7,475,827 | ||||||||
| Brookfield Corp. | Diversified Financial Services | 12/12/22 | 126,980 | 7,849,904 | ||||||||
| Canadian National Railway Co. | Transportation | 05/14/19 | 141,161 | 14,634,437 | ||||||||
| CMS Energy Corp. | Utilities | 11/01/19 | 208,087 | 14,412,106 | ||||||||
| Crown Castle International Corp. | Communication | 02/16/16 | 93,228 | 9,573,583 | ||||||||
| CSX Corp. | Transportation | 11/28/23 | 285,577 | 9,312,666 | ||||||||
| Equinix Inc. | Diversified Financial Services | 07/31/20 | 16,442 | 13,073,199 | ||||||||
| HarbourVest Global Private Equity | Diversified Financial Services | 12/21/18 | 526,232 | 17,987,924 | ||||||||
| KKR & Co., Inc. | Diversified Financial Services | 02/16/16 | 120,962 | 16,077,060 | ||||||||
| Old Dominion Freight Line, Inc. | Transportation | 09/25/24 | 68,718 | 11,152,931 | ||||||||
| Onex Corp. | Diversified Financial Services | 02/16/16 | 188,589 | 15,439,310 | ||||||||
| Republic Services Inc. | Commercial & Professional Services | 08/28/17 | 73,014 | 17,999,411 | ||||||||
| SBA Communications Corp. | Real Estate | 09/05/23 | 48,314 | 11,338,813 | ||||||||
| Sempra Energy | Utilities | 06/28/23 | 148,586 | 11,252,418 | ||||||||
| TC Energy Corp. | Utilities | 11/01/19 | 221,786 | 10,762,572 | ||||||||
| The Williams Companies, Inc. | Utilities | 03/20/23 | 306,883 | 19,263,046 | ||||||||
| TPG Inc. | Financials | 09/25/24 | 122,745 | 6,433,066 | ||||||||
| Union Pacific Corp. | Transportation | 06/29/16 | 73,917 | 17,000,910 | ||||||||
| Waste Management Inc. | Utilities | 07/02/20 | 54,299 | 12,423,068 | ||||||||
| Total North America (2.24%) | 358,394,858 | |||||||||||
| Western Europe (1.67%) | ||||||||||||
| 3i Group Plc | Diversified Financial Services | 10/01/20 | 348,421 | 19,666,850 | ||||||||
| Aena SA | Transportation | 12/21/18 | 747,020 | 19,858,399 | ||||||||
| Cellnex Telecom SA | Communication | 05/15/19 | 779,183 | 30,116,951 | ||||||||
| CVC Capital Partners Plc | Financials | 04/26/24 | 663,187 | 13,524,889 | ||||||||
| Elia System Operator SA/NV | Utilities | 11/03/22 | 84,060 | 9,636,779 | ||||||||
| EQT AB | Diversified Financial Services | 04/06/20 | 247,644 | 8,284,882 | ||||||||
| Eurazeo SA | Financials | 12/12/16 | 210,922 | 14,985,939 | ||||||||
| Ferrovial SA | Industrials | 04/15/24 | 213,483 | 11,335,217 | ||||||||
| HBM Healthcare Investments AG | Diversified Financial Services | 04/07/20 | 33,059 | 7,098,301 | ||||||||
| HgCapital Trust PLC | Diversified Financial Services | 02/12/16 | 2,874,996 | 20,285,126 | ||||||||
| Infrastrutture Wireless Italiane S.p.A. | Communication | 09/26/24 | 787,122 | 9,587,102 | ||||||||
| Intermediate Capital Group PLC | Diversified Financial Services | 12/12/16 | 688,252 | 18,170,314 | ||||||||
| Investor AB | Diversified Financial Services | 08/28/17 | 417,059 | 12,235,887 | ||||||||
| National Grid PLC | Utilities | 02/12/16 | 1,150,321 | 16,729,089 | ||||||||
| NB Private Equity Partners Ltd. | Diversified Financial Services | 11/06/19 | 319,232 | 6,228,015 | ||||||||
| Pantheon International Participations Plc | Diversified Financial Services | 11/04/19 | 1,773,858 | 7,631,005 | ||||||||
| Terna Rete Elettrica Nazionale SpA | Utilities | 01/05/18 | 1,600,405 | 16,375,491 | ||||||||
| Vinci SA | Transportation | 02/12/16 | 164,113 | 24,090,634 | ||||||||
| Total Western Europe (1.67%) | 265,840,870 | |||||||||||
| Total Common Stocks (Cost $573,341,899)(3.91%) | $ | 624,235,728 | ||||||||||
The accompanying notes are an integral part of these Consolidated Financial Statements.
Partners Group Private Equity (Master Fund), LLC
(a Delaware Limited Liability Company)
Consolidated Schedule of Investments —
June 30, 2025 (Unaudited) (continued)
| Interest | Acquisition Date | Maturity Date | Investment Type | Principal | Fair Value** | |||||||||||
| Public Investments (continued) | ||||||||||||||||
| High Yield Bonds (1.07%) | ||||||||||||||||
| North America (0.18%) | ||||||||||||||||
| Acrisure LLC / Acrisure Finance, Inc. ***, + | 7.50% | 06/05/24 | 11/06/30 | Senior | $ | 3,000,000 | $ | 3,085,926 | ||||||||
| Beach Acquisition Bidco, LLC +, f | 0.0525 | 06/26/25 | 07/15/32 | € | 1,500,000 | 1,778,809 | ||||||||||
| Camelot Return Merger Sub Inc. ***, + | Cash 8.75% + SFvvv | 07/20/22 | 08/01/28 | Senior | $ | 1,500,000 | 1,371,037 | |||||||||
| Clarios Global LP / Clarios US Finance Co ***, + | Cash 6.75% + SFvvv | 01/14/25 | 02/15/30 | Senior | 400,000 | 411,516 | ||||||||||
| Clarios Global LP / Clarios US Finance Co. ***, + | 4.375% | 06/21/24 | 05/15/26 | Senior | € | 1,575,000 | 1,850,238 | |||||||||
| CommScope LLC ***, + | Cash 9.50% + SFvvv | 12/17/24 | 12/17/31 | Senior | $ | 718,000 | 712,910 | |||||||||
| Olympus Water US Holding Corporation ***, + | 0.0425 | 05/22/25 | 10/01/28 | 3,077,000 | 2,925,746 | |||||||||||
| Quikrete Holdings Inc. ***, + | Cash 6.38% + SFvvv | 01/31/25 | 03/01/32 | Senior | 933,000 | 952,968 | ||||||||||
| Radiology Partners, Inc. ***, + | 0.085 | 06/26/25 | 07/15/32 | 3,554,000 | 3,594,800 | |||||||||||
| Radiology Partners, Inc. + | 8.50% | 04/22/24 | 01/31/29 | Senior | 7,715,086 | 7,099,564 | ||||||||||
| Raven Acquisition Holdings LLC ***, + | 6.87% | 10/14/24 | 11/15/31 | Senior | 1,200,000 | 1,207,910 | ||||||||||
| UPCB Finance VII Ltd. ***, + | 3.625% | 06/24/24 | 06/15/29 | Senior | € | 3,646,000 | 4,251,496 | |||||||||
| Total North America (0.18%) | 29,242,920 | |||||||||||||||
| Western Europe (0.89%) | ||||||||||||||||
| AccorInvest Group S.A. ***, +, d | 6.375% | 09/18/24 | 10/15/29 | Senior | 738,000 | 914,564 | ||||||||||
| AccorInvest Group SA + | 3.75% + E## | 05/08/25 | 05/15/32 | 3,140,000 | 3,732,283 | |||||||||||
| Albion Financing 1 S.a r.l. ***, + | 0.07 | 05/14/25 | 05/21/30 | $ | 1,062,000 | 1,088,549 | ||||||||||
| Belron UK Finance PLC ***, +, d | 5.75% | 10/02/24 | 10/15/29 | Senior | 3,667,000 | 3,689,677 | ||||||||||
| Deuce Finco Plc + | 5.50% | 06/24/24 | 06/15/27 | Senior | £ | 6,000,000 | 8,191,027 | |||||||||
| Deuce Finco Plc ***, + | 5.50% | 05/01/24 | 06/15/27 | Senior | 5,000,000 | 6,825,856 | ||||||||||
| Dolcetto Holdco SPA ***, +, f | 0.05625 | 06/26/25 | 07/14/32 | € | 3,555,000 | 4,226,543 | ||||||||||
| Dolcetto Holdco SPA ***, +, f | 3.63% + E## | 06/25/25 | 07/14/32 | 2,630,000 | 3,086,055 | |||||||||||
| Flos B&B Italia Spa ***, + | 6.38% + E## | 05/14/25 | 12/17/29 | 5,000,000 | 5,678,227 | |||||||||||
| Howden UK Refinance PLC / Howden UK Refinance 2 PLC / Howden US Refinance LLC ***, + | 7.25% | 05/08/24 | 02/15/31 | Senior | $ | 5,000,000 | 5,187,430 | |||||||||
| IMA Industria Macchine ***, + | 3.75% | 06/20/24 | 01/15/28 | Senior | € | 6,000,000 | 7,006,234 | |||||||||
| INEOS Finance Plc ***, + | 7.50% | 01/31/24 | 04/15/29 | Senior | $ | 1,800,000 | 1,814,186 | |||||||||
| Luna 2.5 S.a r.l. +, f | 0.055 | 06/18/25 | 07/01/32 | € | 962,000 | 1,128,815 | ||||||||||
| Mehilainen Yhtiot Oy + | 0.05125 | 06/11/25 | 06/30/32 | 749,000 | 884,923 | |||||||||||
| Mehilainen Yhtiot Oy + | 0.03375 | 06/11/25 | 06/30/32 | 1,817,000 | 2,143,828 | |||||||||||
| Miller Homes Group Finco Plc + | 7.00% | 02/26/24 | 05/15/29 | Senior | £ | 3,500,000 | 4,826,611 | |||||||||
| Nobian Finance B.V. ***, + | 3.625% | 06/19/24 | 07/15/26 | Senior | € | 10,000,000 | 11,734,050 | |||||||||
| ONE Hotels GmbH ***, + | 7.75% | 05/02/24 | 04/02/31 | Senior | 2,000,000 | 2,526,990 | ||||||||||
| Opal Bidco SAS ***, + | 0.065 | 03/31/25 | 03/31/32 | $ | 6,666,000 | 6,769,650 | ||||||||||
| Rossini S.à.r.l. ***, + | 6.75% | 07/11/24 | 12/31/29 | Senior | € | 906,000 | 1,124,958 | |||||||||
| Rossini S.à.r.l. ***, + | 3.875% + E## | 07/11/24 | 12/31/29 | Senior | 2,840,000 | 3,373,876 | ||||||||||
| Sammontana Italia S.p.A. ***, +, d | 3.75% + E## | 10/02/24 | 08/15/31 | Senior | 3,294,000 | 3,860,606 | ||||||||||
| Sherwood Financing PLC +, d | 6.00% | 12/03/24 | 11/15/26 | Senior | £ | 4,000,000 | 5,446,167 | |||||||||
| Sherwood Financing PLC ***, + | 5.55% + E## | 11/28/24 | 12/15/29 | Senior | € | 4,800,000 | 5,639,244 | |||||||||
| Summer BC Holdco A S.à.r.l. + | 9.25% | 05/08/24 | 10/31/27 | Senior | 2,703,158 | 3,181,692 | ||||||||||
| Teamsystem S.P.A. ***, +, f | 0.05281 | 06/18/25 | 07/01/32 | 4,078,000 | 4,779,997 | |||||||||||
| Teamsystem S.P.A. ***, +, f | 0.05 | 06/18/25 | 07/01/31 | 2,418,000 | 2,845,943 | |||||||||||
The accompanying notes are an integral part of these Consolidated Financial Statements.
Partners Group Private Equity (Master Fund), LLC
(a Delaware Limited Liability Company)
Consolidated Schedule of Investments —
June 30, 2025 (Unaudited) (continued)
| Interest | Acquisition Date | Maturity Date | Investment Type | Principal | Fair Value** | |||||||||||
| Public Investments (continued) | ||||||||||||||||
| High Yield Bonds (continued) | ||||||||||||||||
| Western Europe (continued) | ||||||||||||||||
| TeamSystem SpA ***, + | 3.50% + E## | 07/17/24 | 07/31/31 | Senior | € | 3,830,000 | $ | 4,505,174 | ||||||||
| TeamSystem SpA ***, + | 3.50% | 06/20/24 | 02/15/28 | Senior | 6,000,000 | 7,002,541 | ||||||||||
| Verisure Holding AB ***, + | 3.25% | 06/20/24 | 02/15/27 | Senior | 10,000,000 | 11,725,199 | ||||||||||
| Wp/ap Telecom Holdings III B.V. ***, + | 5.50% | 05/29/24 | 01/15/30 | Senior | 6,000,000 | 7,072,156 | ||||||||||
| Total Western Europe (0.89%) | 142,013,051 | |||||||||||||||
| Total High Yield Bonds (Cost $159,209,157)(1.07%) | $ | 171,255,971 | ||||||||||||||
| Asset-Backed Securities (0.49%) | ||||||||||||||||
| North America (0.37%) | ||||||||||||||||
| AGL CLO 9 Ltd. ***, + | 6.50% + SFvv | 04/11/24 | 04/20/37 | Series 2020-9A, Class ER | $ | 3,500,000 | $ | 3,602,457 | ||||||||
| AIMCO CLO 21 Ltd. ***, + | 6.00% + SFvv | 04/09/24 | 04/18/37 | Series 2024-21A, Class E | 3,000,000 | 3,104,446 | ||||||||||
| AIMCO CLO Series 2015-A ***, + | 6.35% + SFvv | 08/21/24 | 10/17/34 | Series 2015-AA, Class ER3 | 1,967,607 | 2,056,162 | ||||||||||
| Ballyrock CLO 18 Ltd . ***, + | 5.75+ SFvv | 03/21/25 | 04/15/38 | Series 2021-18A, Class DR | 2,260,000 | 2,260,000 | ||||||||||
| Ballyrock CLO 20 Ltd. ***, + | 6.20% + SFvv | 09/18/24 | 10/15/36 | Series 2022-20A, Class DR2 | 3,000,000 | 3,000,000 | ||||||||||
| Benefit Street Partners CLO XXXIV Ltd. ***, + | 6.70% + SFvv | 03/22/24 | 07/25/37 | Series 2024-34A, Class E | 1,000,000 | 1,039,634 | ||||||||||
| Benefit Street Partners CLO XXXIV Ltd. ***, + | 0.00% | 03/22/24 | 07/25/37 | Series 2024-34A, Class SUB | 2,500,000 | 2,027,525 | ||||||||||
| CIFC Funding 2019-VI Ltd. ***, + | 6.25% + SFvv | 05/22/24 | 07/16/37 | Series 2019-6A, Class ER | 1,200,000 | 1,242,350 | ||||||||||
| CIFC Funding 2021-I Ltd. ***, + | 6.00% + SFvv | 06/03/24 | 07/25/37 | Series 2021-1A, Class ER | 2,500,000 | 2,586,741 | ||||||||||
| CIFC Funding 2021-IV Ltd. ***, + | 6.20%+ SFvv | 04/08/25 | 07/23/37 | Series 2021-4A, Class ER | 1,000,000 | 965,701 | ||||||||||
| CIFC Funding 2021-VI Ltd. ***, + | 6.51% + SFvv | 09/22/21 | 10/15/34 | Series 2021-6A, Class E | 1,500,000 | 1,540,727 | ||||||||||
| CIFC Funding 2022-IV Ltd. ***, + | 7.00% + SFvv | 04/20/22 | 07/16/35 | Series 2022-4A, Class E | 1,250,000 | 1,285,754 | ||||||||||
| CIFC Funding 2024-II Ltd. ***, + | 0.00% | 04/01/24 | 04/22/37 | Series 2024-2A, Class SUBB | 3,000,000 | 2,462,940 | ||||||||||
| CIFC Funding Ltd. ***, + | 7.27% + SFvv | 04/05/22 | 04/21/35 | Series 2022-3A, Class E | 1,000,000 | 1,028,970 | ||||||||||
| Elmwood CLO 26 Ltd. ***, + | 6.45% + SFvv | 02/15/24 | 04/18/37 | Series 2024-1A, Class E | 2,500,000 | 2,595,642 | ||||||||||
| Elmwood CLO 28 Ltd. ***, + | 6.00% + SFvv | 04/19/24 | 04/17/37 | Series 2024-4A, Class E | 1,400,000 | 1,455,715 | ||||||||||
| Elmwood CLO VII Ltd. ***, + | 5.90% + SFvv | 09/26/24 | 10/17/37 | Series 2020-4A, Class ERR | 3,750,000 | 3,715,621 | ||||||||||
| Elmwood CLO X Ltd. ***, +, f | 5.95%+ SFvv | 06/23/25 | 07/20/38 | Series 2021-3A, Class ER2 | 2,000,000 | 2,000,000 | ||||||||||
| Elmwood CLO X Ltd. ***, + | 5.85% + SFvv | 04/05/24 | 07/20/37 | Series 2021-3A, Class ER | 4,500,000 | 4,599,234 | ||||||||||
| Magnetite XXIV Ltd. ***, + | 6.40% + SFvv | 02/04/22 | 04/15/35 | Series 2019-24A, Class ER | 4,000,000 | 4,102,552 | ||||||||||
| OHA Credit Funding 19 Ltd. ***, + | 5.60% + SFvv | 05/31/24 | 07/20/37 | Series 2024-19A, Class E | 950,000 | 987,082 | ||||||||||
| OHA Credit Funding 6 Ltd. ***, + | 5.25%+ SFvv | 10/11/24 | 10/20/37 | Series 2020-6A, Class ER2 | 2,000,000 | 2,000,000 | ||||||||||
| OHA Credit Partners XI Ltd. ***, + | 5.75% + SFvv | 05/06/24 | 04/20/37 | Series 2015-11A, Class ER2 | 2,000,000 | 2,047,106 | ||||||||||
| Palmer Square CLO 2024-2 Ltd. ***, + | 5.70% + SFvv | 05/30/24 | 07/20/37 | Series 2024-2A, Class E | 4,000,000 | 4,145,820 | ||||||||||
| Southwick Park CLO LLC ***, + | 6.51% + SFvv | 11/16/21 | 07/20/32 | Series 2019-4A, Class ER | 800,000 | 811,378 | ||||||||||
| Symphony CLO XXV Ltd. ***, + | 6.76% + SFvv | 03/12/21 | 04/19/34 | Series 2021-25A, Class E | 752,616 | 734,220 | ||||||||||
| Wellman Park CLO Ltd. ***, + | 6.30% + SFvv | 07/25/24 | 07/15/37 | Series 2021-1A, Class ER | 2,000,000 | 2,082,199 | ||||||||||
| Total North America (0.37%) | 59,479,976 | |||||||||||||||
| Western Europe (0.12%) | ||||||||||||||||
| Aurium CLO V Designated Activity Co. ***, + | 6.16% + E## | 03/08/21 | 04/17/34 | Series 5A, Class ER | € | 1,500,000 | 1,805,928 | |||||||||
| Aurium CLO VII DAC ***, + | 5.86% + E## | 02/04/22 | 05/15/34 | Series 7A, Class E | 1,521,243 | 1,798,560 | ||||||||||
| Avoca CLO XXVI DAC ***, + | 9.12% + E## | 02/23/22 | 04/15/35 | Series 26A, Class F | 1,200,000 | 1,453,065 | ||||||||||
| Avoca CLO XXVI DAC ***, + | 6.51% + E## | 02/23/22 | 04/15/35 | Series 26A, Class E | 750,000 | 906,340 | ||||||||||
| Blackrock European CLO VIII DAC ***, + | 6.26% + E## | 02/03/22 | 01/20/36 | Series 8A, Class ER | 1,000,000 | 1,203,809 | ||||||||||
| Boyce Park CLO Ltd. ***, + | 6.25% + SFvv | 01/28/22 | 04/21/35 | Series 2022-1A, Class E | $ | 2,625,000 | 2,686,183 | |||||||||
| Brookhaven Park CLO Ltd. ***, + | 6.50% + SFvv | 03/15/24 | 04/19/37 | Series 2024-1A, Class E | 1,000,000 | 1,038,844 | ||||||||||
The accompanying notes are an integral part of these Consolidated Financial Statements.
Partners Group Private Equity (Master Fund), LLC
(a Delaware Limited Liability Company)
Consolidated Schedule of Investments —
June 30, 2025 (Unaudited) (continued)
| Interest | Acquisition Date | Maturity Date | Investment Type | Principal | Fair Value** | |||||||||||
| Public Investments (continued) | ||||||||||||||||
| Asset-Backed Securities (continued) | ||||||||||||||||
| Western Europe (continued) | ||||||||||||||||
| Carlyle Euro CLO 2021-1 DAC ***, + | 6.12% + E## | 05/01/21 | 04/15/34 | Series 2021-1A, Class D | € | 333,000 | $ | 398,964 | ||||||||
| Carlyle Global Market Strategies 2015-1 Ltd. ***, + | 0.00% | 01/20/22 | 01/16/33 | Series 2015-1A, Class SUB | 3,000,000 | 685,034 | ||||||||||
| Carlyle Global Market Strategies 2015-1 Ltd. ***, + | 5.50% + E## | 01/20/22 | 01/16/33 | Series 2015-1A, Class DR | 1,502,063 | 1,760,417 | ||||||||||
| Carysfort Park CLO ***, + | 6.14% + E## | 03/12/21 | 07/28/34 | Series 2021-1A, Class D | 500,000 | 601,868 | ||||||||||
| Otranto Park CLO ***, + | 7.05% + E## | 03/04/22 | 05/15/35 | Series 1A, Class E | 1,172,000 | 1,413,148 | ||||||||||
| Otranto Park CLO ***, + | 4.15% + E## | 03/04/22 | 05/15/35 | Series 1A, Class D | 750,000 | 900,263 | ||||||||||
| Palmer Square European Loan Funding 2022-1 DAC ***, + | 5.90% + E## | 02/03/22 | 10/15/31 | Series 2022-1A, Class E | 667,000 | 803,564 | ||||||||||
| Palmer Square European Loan Funding 2022-1 DAC ***, + | 8.05% + E## | 02/03/22 | 10/15/31 | Series 2022-1A, Class F | 500,000 | 600,781 | ||||||||||
| Storm King Park CLO Ltd. ***, + | 6.15% + SFvv | 09/17/24 | 10/15/37 | Series 2022-1A, Class ER | $ | 1,500,000 | 1,500,000 | |||||||||
| Total Western Europe (0.12%) | 19,556,768 | |||||||||||||||
| Total Asset-Backed Securities (Cost $78,419,057)(0.49%) | $ | 79,036,744 | ||||||||||||||
| Floating Rate Loans (6.35%) | ||||||||||||||||
| North America (4.63%) | ||||||||||||||||
| AAL Delaware Holdco, Inc. + | 2.75% + SFv | 01/31/25 | 07/30/31 | Senior | $ | 794,010 | 797,615 | |||||||||
| Acrisure, LLC + | 3.00% + SFv | 05/06/25 | 11/06/30 | Senior | 13,625,277 | 13,644,489 | ||||||||||
| Acrisure, LLC + | 3.25% + SFv | 06/05/25 | 06/21/32 | Senior | 2,200,000 | 2,211,704 | ||||||||||
| AEA International Holdings (Lux) S.à.r.l. + | 2.75% + SFvv | 05/06/25 | 09/07/28 | Senior | 2,220,303 | 2,236,955 | ||||||||||
| Ahead DB Holdings, LLC + | Cash 3.00% + SF (0.75% Floor)vv | 03/26/25 | 02/01/31 | Senior | 1,994,987 | 2,002,010 | ||||||||||
| Aimbridge Acquisition Co., Inc. + | 1.50% + SFvv | 03/11/25 | 03/11/30 | Senior | 571,001 | 568,386 | ||||||||||
| AIT Worldwide Logistics, Inc + | 4.00% + SFvv | 05/06/25 | 04/08/30 | Senior | 3,980,000 | 4,001,412 | ||||||||||
| Alera Group, Inc. +, f | 05/30/25 | 05/31/32 | Senior | 3,000,000 | 3,022,740 | |||||||||||
| Alliant Holdings Intermediate LLC + | 3.00% + SFv | 09/12/24 | 09/19/31 | Senior | 6,231,342 | 6,258,635 | ||||||||||
| Alpha Generation LLC +, f | 05/30/25 | 09/30/31 | Senior | 5,400,000 | 5,386,500 | |||||||||||
| Alpha Generation LLC +, f | 2.75% + SFv | 09/19/24 | 09/30/31 | Senior | 6,577,432 | 6,591,837 | ||||||||||
| Altera Corporation +, f | 3.00% + SFvv | 06/18/25 | 06/21/32 | Senior | 4,500,000 | 4,515,975 | ||||||||||
| Amentum Government Services Holdings LLC + | 2.25% + SFv | 07/30/24 | 09/29/31 | Senior | 944,167 | 945,234 | ||||||||||
| American Airlines, Inc. +, f | 05/09/25 | 05/28/32 | Senior | 1,900,000 | 1,916,150 | |||||||||||
| Amneal Pharmaceuticals LLC + | 5.50% + SFv | 05/06/25 | 05/04/28 | Senior | 8,094,184 | 8,240,932 | ||||||||||
| Archkey Solutions LLC +, e | Cash 4.75% + SFvv | 03/03/25 | 11/01/31 | Senior | 2,893,500 | 2,612,213 | ||||||||||
| Aspire Bakeries Holdings LLC + | 4.25% + SFv | 12/31/24 | 12/13/30 | Senior | 994,975 | 1,000,736 | ||||||||||
| Auris Luxembourg III S.à.r.l. + | 3.75% + SFvvv | 05/06/25 | 02/28/29 | Senior | 5,234,374 | 5,270,386 | ||||||||||
| Avalara, Inc. +, e | Cash 3.25% + SFvv | 03/21/25 | 03/26/32 | Senior | 5,155,044 | 4,529,937 | ||||||||||
| BCPE Empire Holdings, Inc. + | 3.25% + SFvv | 03/04/25 | 12/11/30 | Senior | 4,544,321 | 4,553,683 | ||||||||||
| Beach Acquisition Bidco, LLC +, f | 3.25% + SFvv | 06/26/25 | 06/25/32 | Senior | 1,850,000 | 1,863,116 | ||||||||||
| Bella Holding Company, LLC + | Cash 3.25% + SF (0.75% Floor)vv | 03/31/25 | 05/10/28 | Senior | 8,913,569 | 8,959,563 | ||||||||||
| Belron Finance 2019 LLC +, d | 2.75% + SFvv | 10/02/24 | 10/16/31 | Senior | 8,237,750 | 8,289,236 | ||||||||||
| Blackhawk Network Holdings, Inc + | 4.00% + SFv | 05/06/25 | 03/12/29 | Senior | 6,138,155 | 6,185,664 | ||||||||||
| Boost Newco Borrower, LLC + | 2.00% + SFvv | 05/06/25 | 01/31/31 | Senior | 1,791,011 | 1,799,590 | ||||||||||
| Boxer Parent Company Inc. + | 3.00% + SFvv | 05/06/25 | 07/30/31 | Senior | 4,350,938 | 4,351,286 | ||||||||||
| Bracket Intermediate Holding Corp + | 4.25% + SFvv | 05/06/25 | 05/08/28 | Senior | 5,444,129 | 5,476,521 | ||||||||||
| Brown Group Holding, LLC +, f | 05/30/25 | 07/01/31 | Senior | 1,837,000 | 1,830,111 | |||||||||||
The accompanying notes are an integral part of these Consolidated Financial Statements.
Partners Group Private Equity (Master Fund), LLC
(a Delaware Limited Liability Company)
Consolidated Schedule of Investments —
June 30, 2025 (Unaudited) (continued)
| Interest | Acquisition Date | Maturity Date | Investment Type | Principal | Fair Value** | |||||||||||
| Public Investments (continued) | ||||||||||||||||
| Floating Rate Loans (continued) | ||||||||||||||||
| North America (continued) | ||||||||||||||||
| Cablevision Lightpath LLC + | 3.00% + SFv | 05/06/25 | 11/30/27 | Senior | $ | 7,917,979 | $ | 7,948,939 | ||||||||
| Calpine Corporation + | 1.75% + SFv | 05/06/25 | 01/31/31 | Senior | 9,950,000 | 9,961,840 | ||||||||||
| Carestream Dental Technology, Inc. + | 6.25% + SFv | 05/06/25 | 08/30/30 | Senior | 3,513,857 | 3,566,565 | ||||||||||
| CCC Intelligent Solutions Inc. + | 2.00% + SFv | 03/31/25 | 01/23/32 | Senior | 995,000 | 998,940 | ||||||||||
| Cengage Learning, Inc. +, f | 3.50% + SFvv | 11/14/24 | 03/24/31 | Senior | 3,000,000 | 2,998,125 | ||||||||||
| CFC Bidco 2022 Ltd. +, f | 05/30/25 | 05/30/32 | Senior | 11,300,000 | 11,300,000 | |||||||||||
| Charlotte Buyer, Inc. + | 4.25% + SFv | 05/06/25 | 02/11/28 | Senior | 4,036,413 | 4,043,356 | ||||||||||
| Charter NEX US, Inc. + | 2.75% + SFv | 05/06/25 | 11/29/30 | Senior | 1,397,940 | 1,405,489 | ||||||||||
| CHG Healthcare Services Inc. + | 3.00% + SFvv | 02/28/25 | 09/29/28 | Senior | 1,781,978 | 1,792,313 | ||||||||||
| Chrysaor Bidco Sarl +, e | 05/06/25 | 10/30/31 | Senior | 192,814 | — | |||||||||||
| Citrin Cooperman Advisors LLC +, e | Cash 3.00% + SFvv | 03/06/25 | 04/01/32 | Senior | 4,200,000 | 3,963,108 | ||||||||||
| Clarios Global LP + | 4.5% + SFv | 03/31/25 | 01/28/32 | Senior | 2,100,000 | 2,110,941 | ||||||||||
| Clydesdale Acquisition Holdings Inc. + | Cash 3.25% + SF (0.50% Floor)vv | 03/27/25 | 04/01/32 | Senior | 3,046,735 | 3,049,081 | ||||||||||
| Clydesdale Acquisition Holdings Inc. + | Cash 3.25% + SF (0.50% Floor)vv | 03/27/25 | 04/01/32 | Senior | 53,265 | 53,306 | ||||||||||
| Colossus Acquireco LLC +, f | 1.75% + SFvv | 06/12/25 | 06/11/32 | Senior | 3,800,000 | 3,793,920 | ||||||||||
| CommScope, Inc. +, f | 5.25% + SFv | 05/02/25 | 12/17/29 | Senior | 4,231,835 | 4,289,811 | ||||||||||
| Conservice Midco, LLC + | 3.00% + SFv | 05/06/25 | 05/13/30 | Senior | 1,620,202 | 1,627,639 | ||||||||||
| Cotiviti Corporation + | Cash 2.75% + SFvv | 02/14/25 | 03/26/32 | Senior | 4,500,000 | 4,485,015 | ||||||||||
| CPPIB Capital, Inc. + | 3.25% + SFvv | 09/30/24 | 08/20/31 | Senior | 1,389,503 | 1,393,852 | ||||||||||
| CQP Holdco LP + | 2.00% + SFvv | 05/06/25 | 12/31/30 | Senior | 7,878,685 | 7,906,969 | ||||||||||
| Crown Subsea Communications Holding,Inc. + | 4.00% + SFvv | 05/06/25 | 01/30/31 | Senior | 12,812,146 | 12,894,913 | ||||||||||
| Cube Industrials Buyer Inc. + | 3.50% + SFvv | 10/28/24 | 10/17/31 | Senior | 997,500 | 1,003,734 | ||||||||||
| Delta 2 (LUX) S.à.r.l. +, d | 09/10/24 | 09/30/31 | Senior | 1,033,333 | 1,037,694 | |||||||||||
| Delta 2 (LUX) S.à.r.l. + | 2.00% + SFvv | 09/10/24 | 09/10/31 | Senior | 2,066,667 | 2,075,388 | ||||||||||
| Delta TopCo, Inc. + | 2.75% + SFvv | 05/06/25 | 11/30/29 | Senior | 6,571,073 | 6,569,035 | ||||||||||
| Dotdash Meredith Inc + | 3.50% + SFvv | 06/05/25 | 06/17/32 | Senior | 783,000 | 786,915 | ||||||||||
| Dragon Buyer, Inc. + | 3.00% + SFvv | 09/24/24 | 09/30/31 | Senior | 5,771,000 | 5,789,063 | ||||||||||
| DTI Holdco, Inc. + | 4.00% + SFv | 05/06/25 | 04/26/29 | Senior | 6,869,939 | 6,815,530 | ||||||||||
| Dynamo Newco II GmbH + | 4.00% + SFvvv | 09/25/24 | 09/26/31 | Senior | 4,615,125 | 4,651,215 | ||||||||||
| ECI Macola Max Holding, LLC + | 3.25% + SFvv | 05/06/25 | 05/09/30 | Senior | 1,632,373 | 1,638,935 | ||||||||||
| ECO Material Tech Inc. + | Cash 3.25% + SFvv | 03/31/25 | 02/12/32 | Senior | 2,000,000 | 2,013,760 | ||||||||||
| Epic Crude Services, LP + | 3.00% + SFvv | 10/22/24 | 10/15/31 | Senior | 2,244,375 | 2,258,425 | ||||||||||
| Fiesta Purchaser, Inc. + | 3.25% + SFv | 05/06/25 | 02/12/31 | Senior | 6,237,118 | 6,266,058 | ||||||||||
| Filtration Group Corporation + | 3.00% + SFv | 05/06/25 | 10/21/28 | Senior | 2,026,500 | 2,039,530 | ||||||||||
| First Brands Group, LLC + | 5.00% + SFvv | 11/15/24 | 03/30/27 | Senior | 1,244,144 | 1,208,512 | ||||||||||
| First Brands Group, LLC + | 5.00% + SFvv | 11/12/24 | 03/30/27 | Senior | 740,042 | 718,951 | ||||||||||
| Flash Charm, Inc. + | 3.50% + SFvv | 05/06/25 | 03/02/28 | Senior | 1,219,933 | 1,147,286 | ||||||||||
| Focus Financial Partners, LLC +, f | 05/30/25 | 09/15/31 | Senior | 4,800,000 | 4,764,000 | |||||||||||
| Focus Financial Partners, LLC +, f | Cash 2.75% + SFvv | 01/28/25 | 09/15/31 | Senior | 8,879,500 | 8,889,623 | ||||||||||
| Fortis 333, Inc. +, f | 3.50% + SFv | 02/06/25 | 03/29/32 | Senior | 3,000,000 | 3,018,750 | ||||||||||
| Froneri International Ltd. +, d | 2.00% + SFvv | 09/17/24 | 09/17/31 | Senior | 7,959,273 | 7,862,090 | ||||||||||
| Fugue Finance B.V. + | 3.25% + SFvv | 05/06/25 | 01/09/32 | Senior | 13,360,196 | 13,430,604 | ||||||||||
| Fugue Finance B.V. +, f | 05/30/25 | 01/09/32 | Senior | 2,600,000 | 2,613,702 | |||||||||||
| Genesys Cloud Services Holdings II LLC + | Cash 2.50% + SFvv | 03/31/25 | 01/30/32 | Senior | 6,583,500 | 6,606,345 | ||||||||||
| GFL Environmental Inc. + | Cash 2.50% + SFvv | 03/07/25 | 02/04/32 | Senior | 1,200,000 | 1,201,956 | ||||||||||
| Gloves Buyer, Inc. +, f | 4.00% + SFv | 01/17/25 | 01/17/32 | Senior | 3,400,000 | 3,350,428 | ||||||||||
| Golden State Food LLC + | 4.25% + SFv | 12/12/24 | 12/04/31 | Senior | 2,630,191 | 2,647,761 | ||||||||||
The accompanying notes are an integral part of these Consolidated Financial Statements.
Partners Group Private Equity (Master Fund), LLC
(a Delaware Limited Liability Company)
Consolidated Schedule of Investments —
June 30, 2025 (Unaudited) (continued)
| Interest | Acquisition Date | Maturity Date | Investment Type | Principal | Fair Value** | |||||||||||
| Public Investments (continued) | ||||||||||||||||
| Floating Rate Loans (continued) | ||||||||||||||||
| North America (continued) | ||||||||||||||||
| Grant Thornton Advisors LLC + | 2.75% + SFv | 05/06/25 | 06/02/31 | Senior | $ | 3,870,799 | $ | 3,884,734 | ||||||||
| Grant Thornton Advisors LLC +, f | 05/08/25 | 06/02/31 | Senior | 5,000,000 | 5,035,950 | |||||||||||
| Hanger, Inc. +, e | 3.50% + SFv | 12/31/24 | 10/23/31 | Senior | 1,944,177 | 1,954,559 | ||||||||||
| Hanger, Inc. +, e | 3.50% + SFv | 10/16/24 | 10/23/31 | Senior | 250,856 | 36,707 | ||||||||||
| Heartland Dental, LLC + | 4.50% + SFvv | 05/17/24 | 04/28/28 | Senior | 8,440,347 | 8,468,875 | ||||||||||
| Help/Systems Holdings, Inc. + | 4.00% + SFvv | 05/11/21 | 11/19/26 | Senior | 4,019,697 | 3,840,418 | ||||||||||
| Herc Holdings Inc + | 2.00% + SFvv | 05/16/25 | 06/02/32 | Senior | 1,000,000 | 1,005,420 | ||||||||||
| Herschend Entertainment Company, LLC +, f | 05/15/25 | 05/27/32 | Senior | 600,000 | 606,000 | |||||||||||
| Hobbs & Associates LLC +, e | 3.25% + SFv | 09/30/24 | 07/23/31 | Senior | 6,078,690 | 5,525,962 | ||||||||||
| Holding Socotec +, d | 3.75% + SF | 11/22/24 | 06/30/28 | Senior | 1,440,244 | 1,453,753 | ||||||||||
| Howden Group Holdings Ltd. + | 3.50% + SFv | 05/06/25 | 04/18/30 | Senior | 3,071,040 | 3,094,349 | ||||||||||
| HUB International Limited + | 2.50% + SFvv | 05/06/25 | 06/20/30 | Senior | 927,241 | 932,972 | ||||||||||
| Hunter Douglas Inc. +, f | 3.25% + SFvv | 05/06/25 | 01/20/32 | Senior | 9,386,807 | 9,419,098 | ||||||||||
| Husky Injection Molding Systems Ltd. (Yukon Acquisition Inc.) + | 4.50% + SFvv | 02/02/24 | 02/15/29 | Senior | 200,000 | 200,000 | ||||||||||
| Illuminate Buyer, LLC +, d | 10/10/24 | 12/31/29 | Senior | 1,588,000 | 1,597,306 | |||||||||||
| Imagine Learning LLC +, f | 3.50% + SFv | 05/06/25 | 12/21/29 | Senior | 8,978,026 | 8,823,424 | ||||||||||
| Inception Holdco S.à.r.l. + | 3.75% + SFvv | 05/06/25 | 04/09/31 | Senior | 1,089,000 | 1,099,901 | ||||||||||
| Inception Holdco S.à.r.l. +, f | 05/30/25 | 04/18/31 | Senior | 300,000 | 303,003 | |||||||||||
| Ineos US Finance LLC +, f | 05/02/25 | 11/08/28 | Senior | 857,143 | 839,914 | |||||||||||
| Inmar, Inc. + | 5.00% + SFv | 12/31/24 | 10/30/31 | Senior | 2,288,500 | 2,309,966 | ||||||||||
| International Entertainment JJCo 3 Ltd. +, f | 3.75% + SFvv | 05/02/25 | 04/29/32 | Senior | 4,600,000 | 4,634,500 | ||||||||||
| Iridium Satellite LLC + | 4.75% + SFv | 03/26/25 | 09/20/30 | Senior | 2,473,176 | 2,484,973 | ||||||||||
| John Bean Technologies Corp +, d | 2.00% + SFv 2.75% + SFv2.75% + SFv | 05/06/25 | 01/02/23 | Senior | 997,500 | 1,002,986 | ||||||||||
| Kaman Corporation +, e | 2.75% + SFvvv | 01/30/25 | 02/26/32 | Senior | 2,500,000 | 2,291,981 | ||||||||||
| Kaseya Inc. + | Cash 3.25% + SFvv | 03/31/25 | 03/20/32 | Senior | 5,286,750 | 5,326,031 | ||||||||||
| kdc/one Development Corporation, Inc. + | 4.00% + SFv | 05/06/25 | 08/15/28 | Senior | 3,676,919 | 3,693,685 | ||||||||||
| KKR Apple Bidco, LLC + | 3.25% + SFv | 02/14/25 | 09/23/31 | Senior | 4,477,500 | 4,495,052 | ||||||||||
| Lernen Bidco Ltd. + | 4.00% + SFvv | 11/04/24 | 10/27/31 | Senior | 4,179,026 | 4,209,491 | ||||||||||
| LSF12 Crown US Commercial Bidco LLC +, d | CME Term SOFR + 4.25% | 10/11/24 | 12/02/31 | Senior | 6,800,000 | 6,825,500 | ||||||||||
| Madison IAQ LLC + | Cash 3.25% + SF (0.50% Floor)vv | 03/28/25 | 03/28/32 | Senior | 6,000,000 | 6,038,760 | ||||||||||
| Madison Safety & Flow LLC + | Cash 2.75% + SFvv | 09/26/24 | 09/26/31 | Senior | 1,985,000 | 1,996,176 | ||||||||||
| Matador Bidco S.a.r.l. + | 4.25% + SFv | 05/06/25 | 07/30/29 | Senior | 8,523,676 | 8,587,604 | ||||||||||
| Mavis Tire Express Services Corp. +, f | 06/10/25 | 05/04/28 | Senior | 2,593,500 | 2,607,142 | |||||||||||
| McAfee, LLC + | 3.00% + SFv | 05/06/25 | 03/01/29 | Senior | 3,130,881 | 3,067,292 | ||||||||||
| MDVIP, Inc. + | 2.75% + SFv | 05/06/25 | 10/16/28 | Senior | 2,765,105 | 2,772,045 | ||||||||||
| Minimax Viking GmbH + | Cash 2.25% + SFvv | 03/27/25 | 03/17/32 | Senior | 2,100,000 | 2,114,448 | ||||||||||
| MJH Healthcare Holdings, LLC + | Cash 3.25% + SFvv | 03/26/25 | 01/28/29 | Senior | 3,635,082 | 3,660,092 | ||||||||||
| Motion Finco Sarl + | 3.50% + SFvv | 05/06/25 | 11/12/29 | Senior | 2,952,774 | 2,843,285 | ||||||||||
| Naked Juice LLC + | 3.25% + SFvv | 04/09/25 | 01/24/29 | Senior | 1,326,995 | 984,192 | ||||||||||
| Naked Juice LLC + | 6.00% + SFvv | 05/06/25 | 01/24/30 | Senior | 335,121 | 157,088 | ||||||||||
| NEP Group, Inc. + | 3.25% + SFvv | 05/06/25 | 08/19/26 | Senior | 1,071,076 | 996,101 | ||||||||||
| Newly Weds Foods Inc. + | Cash 2.25% + SFvv | 03/19/25 | 03/15/32 | Senior | 4,500,000 | 4,522,500 | ||||||||||
| Nielsen Consumer Inc. + | 5.00% + SFv | 03/31/25 | 03/06/28 | Senior | 4,588,500 | 4,607,863 | ||||||||||
The accompanying notes are an integral part of these Consolidated Financial Statements.
Partners Group Private Equity (Master Fund), LLC
(a Delaware Limited Liability Company)
Consolidated Schedule of Investments —
June 30, 2025 (Unaudited) (continued)
| Interest | Acquisition Date | Maturity Date | Investment Type | Principal | Fair Value** | |||||||||||
| Public Investments (continued) | ||||||||||||||||
| Floating Rate Loans (continued) | ||||||||||||||||
| North America (continued) | ||||||||||||||||
| Nomad Foods US LLC + | 2.50% + SFvvv | 05/06/25 | 11/12/29 | Senior | $ | 1,161,379 | $ | 1,162,831 | ||||||||
| Nouryon Finance B.V. + | 3.25% + SFvv | 05/06/25 | 04/03/28 | Senior | 2,364,165 | 2,379,981 | ||||||||||
| Nouryon Finance B.V. + | 3.25% + SFvv | 05/06/25 | 04/03/28 | Senior | 2,641,535 | 2,661,346 | ||||||||||
| NSM Top Holdings Corp. + | 4.75% + SFvv | 06/13/25 | 05/14/29 | Senior | 3,307,548 | 3,331,032 | ||||||||||
| Nuvei Technologies Corp. + | 3.00% + SFv | 12/13/24 | 11/15/31 | Senior | 3,740,625 | 3,752,745 | ||||||||||
| Nvent Electric Public Limited Company + | Cash 3.50% + SFvv | 03/31/25 | 01/30/32 | Senior | 1,850,000 | 1,861,304 | ||||||||||
| Olympus Water US Holding Corporation + | 3.00% + SFvv | 05/06/25 | 06/20/31 | Senior | 1,370,234 | 1,362,451 | ||||||||||
| OneDigital Borrower LLC + | 3.00% + SFv | 05/06/25 | 07/02/31 | Senior | 5,247,000 | 5,255,185 | ||||||||||
| Opal Bidco SAS +, f | 05/02/25 | 04/28/32 | Senior | 6,100,000 | 6,149,593 | |||||||||||
| Orion US Finco Inc. +, f | 05/20/25 | 05/20/32 | Senior | 4,800,000 | 4,834,272 | |||||||||||
| Paint Intermediate III LLC + | 3.00% + SFvv | 09/11/24 | 09/11/31 | Senior | 1,296,750 | 1,294,727 | ||||||||||
| Pegasus BidCo BV + | 3.25% + SFvv | 05/06/25 | 07/12/29 | Senior | 6,932,546 | 6,997,574 | ||||||||||
| Plano HoldCo, Inc. + | 3.50% + SFvv | 08/02/24 | 08/15/31 | Senior | 4,788,000 | 4,620,420 | ||||||||||
| Primary Products Finance LLC + | 3.25% + SFv | 05/06/25 | 04/01/29 | Senior | 2,567,565 | 2,568,926 | ||||||||||
| Primo Brands Corporation + | 2.25% + SFvv | 05/06/25 | 03/31/28 | Senior | 1,344,250 | 1,351,576 | ||||||||||
| Proampac PG Borrower LLC + | 4.00% + SFvv | 05/06/25 | 09/15/28 | Senior | 1,977,736 | 1,989,859 | ||||||||||
| Project Alpha Intermediate Holding, Inc. + | 3.25% + SFvv | 05/06/25 | 10/26/30 | Senior | 6,320,240 | 6,364,102 | ||||||||||
| Prometric Holdings, Inc. +, f | 3.75% + SFvv | 06/18/25 | 06/25/32 | Senior | 5,400,000 | 5,427,000 | ||||||||||
| Prometric Holdings, Inc. + | 05/06/25 | 01/31/28 | Senior | 5,820,874 | 5,712,483 | |||||||||||
| Proofpoint, Inc. +, f | 3.00% + SFvv | 06/18/25 | 08/31/28 | Senior | 1,500,000 | 1,509,390 | ||||||||||
| Quartz Acquireco LLC + | Cash 2.25% + SFvv | 03/25/25 | 06/28/30 | Senior | 4,974,684 | 4,996,473 | ||||||||||
| Quikrete Holdings, Inc. + | Cash 2.25% + SFvv | 03/31/25 | 02/10/32 | Senior | 2,872,800 | 2,879,637 | ||||||||||
| QXO Inc + | 3.00% + SFvv | 04/23/25 | 04/30/32 | Senior | 453,333 | 457,540 | ||||||||||
| Radiology Partners Inc + | 5.00% + SFvv | 05/06/25 | 01/31/29 | Senior | 2,158,969 | 2,157,338 | ||||||||||
| Radiology Partners Inc +, f | 06/26/25 | 06/25/32 | Senior | 7,400,000 | 7,407,326 | |||||||||||
| Rand Parent, LLC + | 3.00% + SFvv | 05/06/25 | 03/18/30 | Senior | 5,537,640 | 5,516,929 | ||||||||||
| Raven Acquisition Holdings LLC +, e | 3.25% + SFv | 12/31/24 | 11/19/31 | Senior | 2,993,000 | 2,798,469 | ||||||||||
| Recess Holdings, Inc. + | Cash 3.75% + SF (1.00% Floor)vv | 01/24/25 | 02/20/30 | Senior | 8,795,271 | 8,845,668 | ||||||||||
| Red Planet Borrower, LLC + | 5.25% + SFv | 12/31/24 | 10/02/28 | Senior | 3,192,000 | 3,213,291 | ||||||||||
| Rohm Holding GmbH + | Cash 5.50% + SFvvv; PIK 1.49% | 02/19/25 | 01/31/29 | Senior | 6,720,353 | 6,532,721 | ||||||||||
| Ryan Specialty Group LLC + | 2.25% + SFv | 09/10/24 | 09/15/31 | Senior | 995,000 | 999,975 | ||||||||||
| Saphilux S.à.r.l. +, f | 05/22/25 | 07/18/28 | Senior | 4,500,000 | 4,533,750 | |||||||||||
| Sauer Brands Inc. +, e | Cash 3.25% + SFvv | 03/31/25 | 02/04/32 | Senior | 1,000,000 | 919,864 | ||||||||||
| SCIH Salt Holdings Inc. + | 3.00% + SFvv | 05/28/25 | 01/31/29 | Senior | 498,747 | 500,597 | ||||||||||
| Shift4 Payments, LLC +, f | 05/08/25 | 06/30/32 | Senior | 900,000 | 910,125 | |||||||||||
| Skopima Merger Sub Inc. + | 3.75% + SFv | 05/06/25 | 05/12/28 | Senior | 12,708,332 | 12,590,526 | ||||||||||
| Snacking Investments Bidco Pty Limited + | 4.00% + SFvv | 05/06/25 | 12/18/26 | Senior | 1,231,750 | 1,242,996 | ||||||||||
| Southern Veterinary Partners, LLC + | 3.25% + SFvv | 12/05/24 | 12/04/31 | Senior | 1,895,250 | 1,904,802 | ||||||||||
| Sovos Compliance, LLC + | 4.00% + SFv | 05/06/25 | 08/13/29 | Senior | 4,604,115 | 4,639,290 | ||||||||||
| Spa Holdings 3 Oy + | 05/23/35 | 05/23/30 | Senior | 6,700,000 | 6,720,971 | |||||||||||
| Spring Education Group, Inc. +, e | 4.00% + SFvv | 09/29/23 | 10/04/30 | Senior | 7,720,636 | 7,776,148 | ||||||||||
| Stonepeak Nile Parent LLC + | 2.75% + SFv | 02/03/25 | 04/09/32 | Senior | 1,800,000 | 1,809,000 | ||||||||||
| Storable, Inc. + | Cash 3.25% + SFvv | 03/31/25 | 04/16/31 | Senior | 2,793,000 | 2,801,742 | ||||||||||
The accompanying notes are an integral part of these Consolidated Financial Statements.
Partners Group Private Equity (Master Fund), LLC
(a Delaware Limited Liability Company)
Consolidated Schedule of Investments —
June 30, 2025 (Unaudited) (continued)
| Interest | Acquisition Date | Maturity Date | Investment Type | Principal | Fair Value** | |||||||||||
| Public Investments (continued) | ||||||||||||||||
| Floating Rate Loans (continued) | ||||||||||||||||
| North America (continued) | ||||||||||||||||
| Student Transportation of America Holdings, Inc +, e, f | 06/10/25 | 06/24/32 | Senior | $ | 900,000 | $ | 785,945 | |||||||||
| Summer (BC) Holdco B S.a r.l + | 5.00% + SFvv | 05/06/25 | 02/15/29 | Senior | 5,651,011 | 5,621,446 | ||||||||||
| Summer (BC) Holdco B S.a r.l + | 5.00% + SFvv | 05/06/25 | 02/15/29 | Senior | 5,665,281 | 5,707,771 | ||||||||||
| Summit Acquisition Inc. + | 3.75% + SFvv | 12/31/24 | 10/16/31 | Senior | 997,500 | 1,002,488 | ||||||||||
| Sunrise Financing Partnership + | 2.50% + SFvvv | 03/28/25 | 02/15/32 | Senior | 4,300,000 | 4,304,386 | ||||||||||
| Surgery Center Holdings, Inc. + | 2.75% + SFv | 05/06/25 | 12/19/30 | Senior | 885,875 | 890,863 | ||||||||||
| Tacala, LLC + | 3.50% + SFv | 05/06/25 | 01/31/31 | Senior | 2,370,090 | 2,388,506 | ||||||||||
| Tecta America Corp. + | Cash 3.00% + SFvv | 02/12/25 | 02/18/32 | Senior | 1,400,000 | 1,408,540 | ||||||||||
| Terex Corporation + | 2.00% + SFv | 12/31/24 | 10/08/31 | Senior | 1,995,000 | 2,009,763 | ||||||||||
| Thevelia (US) LLC + | 3.00% + SFvv | 09/30/24 | 06/18/29 | Senior | 8,945,498 | 8,995,861 | ||||||||||
| Tidal Waste & Recycling Holdings LLC + | 3.50% + SFvv | 12/31/24 | 10/24/31 | Senior | 997,500 | 1,007,016 | ||||||||||
| TK Elevator Midco GmbH + | 3.00% + SFv | 03/04/25 | 04/30/30 | Senior | 9,732,095 | 9,806,254 | ||||||||||
| TMF Group Holding B.V. + | 2.75% + SFvv | 01/15/25 | 05/03/28 | Senior | 1,943,464 | 1,955,611 | ||||||||||
| TransDigm, Inc. + | 2.50% + SFvv | 09/25/24 | 01/19/32 | Senior | 4,664,750 | 4,684,249 | ||||||||||
| Trident TPI Holdings, Inc. + | 3.75% + SFvv | 05/06/25 | 09/15/28 | Senior | 1,646,246 | 1,627,364 | ||||||||||
| Trucordia Insurance Holdings LLC + | 3.25% + SFv | 06/12/25 | 06/17/32 | Senior | 6,500,000 | 6,558,955 | ||||||||||
| Truist Insurance Holdings LLC + | 2.75% + SFvv | 05/30/25 | 05/06/31 | Senior | 900,000 | 901,692 | ||||||||||
| Truist Insurance Holdings LLC +, f | 06/05/25 | 05/06/31 | Senior | 900,000 | 897,750 | |||||||||||
| UKG Inc. + | 3.00% + SFv | 05/06/25 | 02/10/31 | Senior | 3,909,630 | 3,934,652 | ||||||||||
| Upfield B.V. + | 3.75% + SFvv | 05/06/25 | 01/03/28 | Senior | 12,952,468 | 12,987,569 | ||||||||||
| USALCO LLC +, d, e | 4.00% + SFv | 09/17/24 | 09/17/31 | Senior | 1,642,521 | 1,498,420 | ||||||||||
| Varsity Brands, Inc. + | Cash 3.50% + SFvv | 08/26/24 | 08/26/31 | Senior | 3,790,500 | 3,805,207 | ||||||||||
| Verifone Systems, Inc. + | 5.50% + SFvv | 04/07/25 | 08/18/28 | Senior | 2,000,000 | 1,945,000 | ||||||||||
| Virtusa Corporation + | 3.25% + SFvv | 06/14/24 | 02/15/29 | Senior | 3,017,800 | 3,021,602 | ||||||||||
| Vision Solutions, Inc. + | 4.00% + SFvv | 05/06/25 | 04/24/28 | Senior | 3,284,383 | 3,194,063 | ||||||||||
| Voyager Parent, LLC +, f | 05/08/25 | 05/09/32 | Senior | 3,000,000 | 2,993,700 | |||||||||||
| VS Buyer, LLC + | 2.75% + SFvv | 05/06/25 | 04/12/31 | Senior | 3,791,398 | 3,816,686 | ||||||||||
| Waystar Technologies, Inc. + | 2.25% + SFv | 05/06/25 | 10/22/29 | Senior | 2,974,149 | 2,992,738 | ||||||||||
| Windsor Holdings III, LLC + | 2.75% + SFv | 05/06/25 | 08/01/30 | Senior | 2,260,993 | 2,267,301 | ||||||||||
| WOOF Holdings, Inc +, f | 3.95% + SFvv | 05/30/25 | 12/31/29 | Senior | 3,902,067 | 3,326,512 | ||||||||||
| WOOF Holdings, Inc + | 3.75% + SFvv | 05/30/25 | 12/31/29 | Senior | 1,138,830 | 632,996 | ||||||||||
| Worldwide Express Operations, LLC +, f | 4.00%+SFvv | 12/31/24 | 07/26/28 | Senior | 12,371,478 | 12,396,592 | ||||||||||
| Zacapa S.à.r.l. + | 3.75% + SFvv | 12/31/24 | 03/22/29 | Senior | 9,186,295 | 9,224,235 | ||||||||||
| Total North America (4.63%) | 740,736,834 | |||||||||||||||
| Western Europe (1.72%) | ||||||||||||||||
| AD Education +, d | 4.00% + E#### | 10/22/24 | 11/14/31 | Senior | € | 4,500,000 | 5,303,133 | |||||||||
| ADB Safegate BV +, f | 05/23/25 | 05/24/32 | Senior | 1,800,000 | 2,126,323 | |||||||||||
| AI Sirona (Luxembourg) Acquisition S.à.r.l. +, f | 05/09/25 | 09/30/28 | Senior | 4,300,000 | 5,072,585 | |||||||||||
| Albion Financing 3 S.à.r.l. + | Cash 3.00% + SF (0.50% Floor)vv | 02/14/25 | 08/16/29 | Senior | $ | 4,893,223 | 4,882,847 | |||||||||
| Apleona Holding GmbH +, e, f | 05/02/25 | 04/10/32 | Senior | € | 4,600,000 | 5,021,190 | ||||||||||
| Artemis Acquisitions (UK) Limited + | 3.00% + E## | 05/06/25 | 07/07/31 | Senior | 4,000,000 | 4,632,603 | ||||||||||
| Artemis Bidco SAS +, f | 05/28/25 | 05/28/32 | Senior | 3,600,000 | 4,240,099 | |||||||||||
The accompanying notes are an integral part of these Consolidated Financial Statements.
Partners Group Private Equity (Master Fund), LLC
(a Delaware Limited Liability Company)
Consolidated Schedule of Investments —
June 30, 2025 (Unaudited) (continued)
| Interest | Acquisition Date | Maturity Date | Investment Type | Principal | Fair Value** | |||||||||||
| Public Investments (continued) | ||||||||||||||||
| Floating Rate Loans (continued) | ||||||||||||||||
| Western Europe (continued) | ||||||||||||||||
| Athena Holdco S.A.S. + | 3.25% + E## | 05/06/25 | 04/14/31 | Senior | € | 3,400,000 | $ | 4,003,620 | ||||||||
| Auris Luxembourg III S.à.r.l. + | 4.00% + E### | 05/06/25 | 02/28/29 | Senior | 4,000,000 | 4,709,907 | ||||||||||
| AutoForm Engineering GmbH + | 3.75% + E## | 04/02/25 | 02/28/29 | Senior | 3,300,000 | 3,895,431 | ||||||||||
| Care Bidco SAS +, d, f | 3.50% + E## | 05/13/24 | 11/06/28 | Senior | 2,100,000 | 2,474,278 | ||||||||||
| Casper BidCo SAS + | 3.75% + E# | 05/06/25 | 03/21/31 | Senior | 5,900,000 | 6,929,874 | ||||||||||
| CD&R Firefly Bidco Limited +, d | 5.50% + SF>> | 05/06/25 | 06/21/28 | Senior | £ | 5,500,000 | 7,544,639 | |||||||||
| CD&R Firefly Bidco Limited +, f | 4.75% + SF>>>> | 05/06/25 | 04/29/29 | Senior | 6,500,000 | 8,890,388 | ||||||||||
| Cerelia +, f | 06/03/25 | 06/24/32 | Senior | € | 2,600,000 | 3,062,294 | ||||||||||
| Chrysaor Bidco S.à.r.l. + | SFv | 05/15/24 | 05/14/24 | $ | 2,594,166 | 2,615,724 | ||||||||||
| Clarios Global LP + | 3.00% + E# | 05/06/25 | 07/16/31 | Senior | € | 7,012,491 | 8,227,998 | |||||||||
| Colosseum Dental Finance B.V. +, f | 3.75% + E### | 06/23/25 | 03/22/32 | Senior | 1,900,000 | 2,240,171 | ||||||||||
| Eagle Bidco Limited + | 3.25% + E# | 05/06/25 | 03/20/28 | Senior | 6,900,000 | 8,079,168 | ||||||||||
| Elsan SAS + | 3.50% + E## | 05/06/25 | 06/16/31 | Senior | 5,000,000 | 5,874,359 | ||||||||||
| Finco Utilitas BV +, f | 05/30/25 | 09/30/30 | Senior | 4,300,000 | 5,055,127 | |||||||||||
| Fugue Finance B.V. + | 3.25% + E## | 04/04/25 | 01/09/32 | Senior | 3,000,000 | 3,524,369 | ||||||||||
| HBX Group International PLC + | Cash 2.75% + E### | 03/26/25 | 02/18/32 | Senior | 5,200,000 | 6,109,333 | ||||||||||
| IGT Holding IV AB + | Cash 3.50% + SF (0.50% Floor)vvv | 03/19/25 | 09/01/31 | Senior | $ | 3,324,000 | 3,355,179 | |||||||||
| Inspired FinCo Holdings Ltd. +, f | Cash 3.25% + E### | 02/06/25 | 02/28/31 | Senior | € | 244,444 | 286,474 | |||||||||
| Inspired Finco Holdings Ltd. +, f | 3.25% + E## | 02/06/25 | 02/28/31 | Senior | 2,037,037 | 2,390,269 | ||||||||||
| Inspired Finco Holdings Ltd. +, f | Cash 3.25% + E### | 02/06/19 | 02/28/31 | Senior | 1,018,519 | 1,195,135 | ||||||||||
| International Entertainment JJCo 3 Ltd. +, f | 4.75% + SF>>>> | 05/02/25 | 04/29/32 | Senior | £ | 2,500,000 | 3,447,945 | |||||||||
| Lernen Bidco Limited + | 4.00% + E### | 05/06/25 | 04/25/29 | Senior | € | 6,000,000 | 7,066,832 | |||||||||
| LSF10 XL Bidco S.C.A. +, d | 4.175% + E## | 05/07/24 | 04/12/28 | Senior | 5,000,000 | 5,843,029 | ||||||||||
| Luna 2.5 S.à.r.l. +, f | 06/18/25 | 06/28/32 | Senior | 1,600,000 | 1,882,818 | |||||||||||
| MasOrange Finco Plc + | Cash 2.75% + E## | 02/21/25 | 03/25/31 | Senior | 24,197,458 | 28,204,317 | ||||||||||
| Motel One GmbH +, f | 4.50% + E## | 05/02/25 | 05/03/32 | Senior | 8,300,000 | 9,800,132 | ||||||||||
| Nobian Finance B.V. +, f | 05/30/25 | 07/01/29 | Senior | 3,200,000 | 3,750,615 | |||||||||||
| Nobian Finance B.V. + | Cash 3.50% + E## | 03/04/25 | 07/31/30 | Senior | 5,400,000 | 6,307,683 | ||||||||||
| Platin2025 Holdings S.a r.l. + | 3.15% + E## | 05/06/25 | 12/29/28 | Senior | 6,000,000 | 6,989,880 | ||||||||||
| Prosol SAS +, f | 06/04/25 | 07/12/31 | Senior | 2,100,000 | 2,470,311 | |||||||||||
| Prosol SAS + | 3.50% + E## | 05/06/25 | 07/12/28 | Senior | 4,800,000 | 5,646,425 | ||||||||||
| Quimper AB +, d | 3.75% + E# | 05/17/24 | 03/15/30 | Senior | 7,000,000 | 8,232,727 | ||||||||||
| Rohm Holding GmbH + | 5.00% + E## | 05/06/25 | 01/31/29 | Senior | 6,010,086 | 6,813,053 | ||||||||||
| Rubix Group Midco 3 Limited +, f | 05/23/25 | 09/30/28 | Senior | 6,400,000 | 7,547,416 | |||||||||||
| Speedster Bidco GmbH +, d | 3.75% + E## | 10/18/24 | 10/17/31 | Senior | 10,000,000 | 11,775,002 | ||||||||||
| Sport Group Holding GmbH + | Cash 4.00% + E### | 01/08/25 | 07/08/31 | Senior | 2,600,000 | 3,064,704 | ||||||||||
| Summer (BC) Holdco B S.à.r.l. + | 4.50% + E## | 05/07/24 | 01/31/29 | Senior | 570,642 | 666,246 | ||||||||||
| Summer (BC) Holdco B S.à.r.l. + | Cash 4.50% + E### | 03/04/25 | 01/31/29 | Senior | 3,737,050 | 4,363,148 | ||||||||||
| Talbot Participation S.A.S +, f | 3.50% + E### | 06/27/25 | 06/25/32 | Senior | 6,200,000 | 7,299,337 | ||||||||||
| team.blue Finco Sarl + | 3.45% + E## | 05/06/25 | 09/30/29 | Senior | 10,700,000 | 12,506,844 | ||||||||||
| Thyme HoldCo S.a r.l. +, f | 3.50% + E## | 06/27/25 | 06/28/32 | Senior | 5,800,000 | 6,835,558 | ||||||||||
| TMF Group Holding B.V. + | 3.25% + E## | 05/06/25 | 05/03/28 | Senior | 2,000,000 | 2,355,352 | ||||||||||
| Total Western Europe (1.72%) | 274,611,891 | |||||||||||||||
| Total Floating Rate Loans (Cost $984,544,750)(6.35%) | $ | 1,015,348,725 | ||||||||||||||
| Total Public Investments (Cost $1,795,514,863)(11.82%) | $ | 1,889,877,168 | ||||||||||||||
The accompanying notes are an integral part of these Consolidated Financial Statements.
Partners Group Private Equity (Master Fund), LLC
(a Delaware Limited Liability Company)
Consolidated Schedule of Investments —
June 30, 2025 (Unaudited) (continued)
| Investment Type | Acquisition Date | Shares | Cost | Fair Value** | ||||||||||||
| Private Equity Investments (94.44%) | ||||||||||||||||
| Direct Investments * (63.25%) | ||||||||||||||||
| Direct Equity (57.08%) | ||||||||||||||||
| Asia - Pacific (3.34%) | ||||||||||||||||
| AAVAS Financiers Limited +, a, e | Common equity | 03/28/18 | 2,623,753 | $ | 11,186,881 | $ | 3,071,382 | |||||||||
| Argan Mauritius Limited +, a, e | Common equity | 05/09/16 | 106,215 | 10,621,500 | 14,228,402 | |||||||||||
| Compass Education +, a, e | Common equity | 01/21/25 | 19,328,293 | 19,328,293 | 19,663,716 | |||||||||||
| Continuity CNC Capital Limited +, a | Common equity | 03/01/18 | 1,021 | 1,021 | 1 | |||||||||||
| GreenSquare Operating HoldCo Pte. Ltd. +, a, e | Preferred equity | 03/06/25 | 389,330 | 246,903 | 254,810 | |||||||||||
| GreenSquare Operating HoldCo Pte. Ltd. +, a, e | Common equity | 03/06/25 | 7,946 | 5,039 | 5,200 | |||||||||||
| Huntress Co-Investment L.P., 1 +, a, c | Limited partnership interest | 04/08/16 | — | 1 | 1 | |||||||||||
| KKR Pebble Co-Invest L.P. +, a, c, e | Limited partnership interest | 05/13/21 | — | 29,283,000 | 30,975,265 | |||||||||||
| Murra Warra Asset Hold Trust +, a, e | Common equity | 09/10/18 | 1 | 1 | 1 | |||||||||||
| Murra Warra II Asset Hold Trust +, a, e | Common equity | 07/30/20 | 1 | 11,765 | 12,149 | |||||||||||
| Murra Warra II Project Hold Trust +, a, e | Common equity | 07/30/20 | 1 | 2,942 | 3,038 | |||||||||||
| Murra Warra Project Hold Trust +, a, e | Common equity | 09/10/18 | 1 | — | 1 | |||||||||||
| Partners Terra Pte. Ltd. +, a, b, e | Common equity | 05/14/21 | 7,980,885 | 8,322,911 | 11,578,834 | |||||||||||
| PG Esmeralda Pte. Ltd. +, a, b, e | Common equity | 03/03/21 | 5,433,284 | 5,429,378 | — | |||||||||||
| PG Esmeralda Pte. Ltd. +, a, b, e | Preferred equity | 03/03/21 | 7,421,005 | 63,570,472 | 21,544,599 | |||||||||||
| PG Loa Pte. Ltd. +, a | Common equity | 04/25/22 | 1,209,387 | 1,207,432 | 1,547,669 | |||||||||||
| PG Loa Pte. Ltd. +, a | Preferred equity | 04/25/22 | 22,978,363 | 23,054,747 | 29,405,707 | |||||||||||
| PG Power Pte. Ltd. +, a, e | Common equity | 10/30/24 | 3,026,755 | 2,064,013 | 2,374,664 | |||||||||||
| Platform Hold Trust +, a, e | Preferred equity | 03/06/25 | 17,921,420 | 1,203,367 | 1,241,907 | |||||||||||
| Sunsure Energy Private Limited +, a, b, c, e | Member interest | 12/27/22 | — | 11,944,526 | 11,944,526 | |||||||||||
| Sunsure Energy Private Limited +, a, b, e | Common equity | 12/27/22 | 1,571,724 | 1,704,922 | 8,488,441 | |||||||||||
| Sunsure Energy Private Limited +, a, b, e | Preferred equity | 12/27/22 | 3,371,095 | 3,379,594 | 3,379,594 | |||||||||||
| TPG Upswing Co-Invest, L.P. +, a, c | Limited partnership interest | 01/10/19 | — | 18,518,292 | 15,921,139 | |||||||||||
| Zenith Longitude Limited +, a, b, e | Common equity | 08/13/21 | 26,838,037 | 126,985,067 | 357,612,934 | |||||||||||
| Total Asia - Pacific (3.34%) | 533,253,980 | |||||||||||||||
| North America (26.10%) | ||||||||||||||||
| Aimbridge Acquisition Co., Inc. +, a | Common equity | 03/11/25 | 4,145,864 | 3,866,765 | 3,866,765 | |||||||||||
| Alliant Holdings, L.P. +, a, c | Limited partnership interest | 12/01/21 | — | 24,784,703 | 43,078,416 | |||||||||||
| Allied Benefit Systems Holdings LP +, a, c | Limited partnership interest | 10/22/24 | — | 30,810,000 | 38,819,398 | |||||||||||
| AmSurg HoldCo, LLC +, a | Common equity | 11/03/23 | 896,098 | 27,959,148 | 36,778,067 | |||||||||||
| AP VIII Prime Security Services Holdings, L.P. +, a, c, e | Limited partnership interest | 05/02/16 | — | 5,925,072 | 4,142,769 | |||||||||||
| AppLogic Networks OpCo I LLC +, a | Common equity | 03/03/25 | 351,924 | 351,924 | 351,924 | |||||||||||
| Astorg VII Co-Invest ERT +, a, c | Limited partnership interest | 04/28/21 | — | 44,578,381 | 94,465,676 | |||||||||||
| BCPE Hercules Holdings, LP +, a | Common equity | 07/30/18 | 869,932 | 869,932 | 2,048,080 | |||||||||||
| BI Gen Holdings, Inc. +, a | Common equity | 01/01/21 | 14,561 | 150,000 | 283,296 | |||||||||||
| CapitalSpring Finance Company, LLC +, a, b | Common equity | 03/01/17 | 3,020,546 | 4,168,272 | 2,251,984 | |||||||||||
| Carestream Dental Technology, Inc. +, a | Common equity | 08/30/24 | 306,125 | 4,205,000 | 4,205,000 | |||||||||||
| CB Poly Holdings, LLC +, a, e | Preferred equity | 08/16/16 | 171,270 | 17,127,003 | 25,715,733 | |||||||||||
| CB Titan MidCo Holdings, Inc. +, a | Common equity | 01/01/21 | 56,634 | 56,634 | 1 | |||||||||||
| CBI Parent, L.P. +, a, c | Limited partnership interest | 01/06/21 | — | 117,093,144 | — | |||||||||||
| CBI Parent, L.P. +, a | Preferred equity | 10/17/22 | 5,611,689 | 5,611,689 | — | |||||||||||
| CD&R Mercury Co-Investor, L.P. +, a, c, e | Limited partnership interest | 10/14/20 | — | 53,921,126 | 174,415,430 | |||||||||||
| Checkers Topco, LLC +, a | Common equity | 06/16/23 | 9,517 | 94,154 | 78,697 | |||||||||||
| Clarience Technologies, LLC +, a | Common equity | 03/05/24 | 3,429 | 8,436,000 | 15,350,011 | |||||||||||
| Confluent Health Holdings LP +, a, b | Common equity | 05/30/19 | 30,344 | 33,244,066 | 71,541,690 | |||||||||||
| ConvergeOne Holdings, Inc. +, a | Common equity | 06/06/24 | 248,182 | 2,154,218 | 1,292,367 | |||||||||||
| Cowboy Topco, Inc. +, a | Common equity | 05/18/22 | 1,348,750 | 1,348,750 | 1,933,124 | |||||||||||
The accompanying notes are an integral part of these Consolidated Financial Statements.
Partners Group Private Equity (Master Fund), LLC
(a Delaware Limited Liability Company)
Consolidated Schedule of Investments —
June 30, 2025 (Unaudited) (continued)
| Investment Type | Acquisition Date | Shares | Cost | Fair Value** | ||||||||||||
| Private Equity Investments (continued) | ||||||||||||||||
| Direct Investments * (continued) | ||||||||||||||||
| Direct Equity (continued) | ||||||||||||||||
| Cure Holdings, LLC +, a | Common equity | 05/13/21 | 263,891 | $ | 3,602,070 | $ | 1,272,313 | |||||||||
| Cure Holdings, LLC +, a, e | Common equity | 05/13/21 | 2,723 | 27,230 | 13,129 | |||||||||||
| Dermatology Holdings, L.P. +, a, b, c, e | Limited partnership interest | 04/01/22 | — | 120,019,757 | 172,024,077 | |||||||||||
| DIF VI Co-Invest Project 2C C.V. +, a, c, e | Limited partnership interest | 03/15/22 | — | 38,954,116 | 64,868,458 | |||||||||||
| ECP Holding Company, LLC +, a, c, e | Member interest | 03/15/16 | — | — | 123,590 | |||||||||||
| ECP Parent, LLC +, a, b, e | Common equity | 11/15/21 | 105,520,023 | 107,129,344 | 105,968,114 | |||||||||||
| ECP Parent, LLC +, a, b, e | Preferred equity | 12/21/23 | 8,508,337 | 8,508,422 | 10,912,939 | |||||||||||
| EdgeCore Holdings, L.P. +, a, b, c, e | Limited partnership interest | 11/10/22 | — | 97,807,196 | 179,037,128 | |||||||||||
| Elgin Co-Investment, L.P.2 +, a | Common equity | 11/28/16 | 1 | 1 | 1 | |||||||||||
| Encore Holdings LP +, a, b, e | Common equity | 07/01/22 | 67,986 | 77,931,448 | 160,442,304 | |||||||||||
| EnfraGen LLC +, a, b, e | Common equity | 09/17/19 | 37,786 | 37,061,706 | 90,590,928 | |||||||||||
| EQT Infrastructure IV Co-Investment (B) SCSp +, a, c | Limited partnership interest | 03/09/20 | — | 94,861,790 | 140,680,414 | |||||||||||
| EQT IX Co-Investment (F) SCSp +, a, c, e | Limited partnership interest | 11/15/21 | — | 103,097,510 | 148,386,700 | |||||||||||
| EQT VIII Co-Investment (C) SCSp +, a, c, e | Limited partnership interest | 01/25/19 | — | 56,985,983 | 58,598,743 | |||||||||||
| EQT X Co-Investment (A) SCSp +, a, c, e | Limited partnership interest | 07/02/24 | — | 20,475,870 | 24,321,464 | |||||||||||
| EXW Coinvest L.P. +, a, c | Limited partnership interest | 06/17/16 | — | 9,367,969 | — | |||||||||||
| FH EP Parent L.P. +, a, c, e | Limited partnership interest | 03/12/24 | — | 8,915,101 | 15,810,174 | |||||||||||
| FRP Investors II, L.P. +, a, c, e | Limited partnership interest | 09/16/22 | — | 47,761,620 | 78,266,203 | |||||||||||
| Gateway Fleets Holdings, LP +, a, b, c, e | Limited partnership interest | 09/30/24 | — | 1,833,960 | 1,816,000 | |||||||||||
| Halo Parent Newco, LLC +, a | Preferred equity | 02/22/22 | 1,109 | 15,617,280 | 17,004,407 | |||||||||||
| Icebox Holdco I Inc. +, a, b, c | Member interest | 03/01/22 | — | 62,643,771 | 62,997,708 | |||||||||||
| Icebox Parent L.P. +, a, b, c | Limited partnership interest | 12/22/21 | — | 122,197,759 | 304,299,059 | |||||||||||
| Idera Parent L.P. +, a, b, c, e | Limited partnership interest | 03/02/21 | — | 151,702,453 | 168,681,143 | |||||||||||
| KDOR Merger Sub Inc. +, a | Common equity | 05/11/18 | 481 | 250,000 | 1 | |||||||||||
| KENE Holdings, L.P. +, a, c | Limited partnership interest | 08/08/19 | — | 1 | 448,243 | |||||||||||
| KKR Cavalry Co-Invest Blocker Parent L.P. +, a, c | Limited partnership interest | 03/24/22 | — | 56,035,477 | 97,137,219 | |||||||||||
| KKR Enterprise Co-Invest AIV A L.P. +, a, c | Limited partnership interest | 07/31/20 | — | 716,331 | 126,657 | |||||||||||
| KPOCH Holdings, L.P. +, a, b, c | Limited partnership interest | 11/10/22 | — | 187,500,000 | 199,935,000 | |||||||||||
| KPSKY Holdings L.P. +, a, b, c | Limited partnership interest | 10/19/21 | — | 61,566,000 | 45,338,495 | |||||||||||
| KSLB Holdings, LLC +, a | Common equity | 07/30/18 | 252,000 | 252,000 | 1 | |||||||||||
| LTF Holdings, Inc. +, a | Common equity | 01/06/20 | 3,122,345 | 56,008,500 | 64,441,194 | |||||||||||
| LTF Holdings, Inc. +, a, e | Common equity | 01/06/20 | 2,351,867 | 4,128,245 | 6,843,891 | |||||||||||
| Lumin Digital, LLC +, a | Preferred equity | 02/12/25 | 5,098,332 | 6,117,996 | 6,666,370 | |||||||||||
| Lumin Digital, LLC +, a, e | Preferred equity | 11/20/24 | — | 24,471,996 | 26,665,494 | |||||||||||
| Matterhorn Topco, L.P. +, a, c | Limited partnership interest | 12/27/23 | — | 11,341,677 | 20,647,367 | |||||||||||
| Mesa Natural Gas Solutions +, a, e | Limited partnership interest | 02/25/25 | — | 6,070,655 | 11,223,792 | |||||||||||
| MHS Acquisition Holdings, LLC +, a, b | Common equity | 08/18/17 | 356 | 317,827 | 284,784 | |||||||||||
| MHS Acquisition Holdings, LLC +, a, b | Preferred equity | 03/10/17 | 35,285 | 172,633 | 154,685 | |||||||||||
| MHS Blocker Purchaser L.P. +, a, b, c | Limited partnership interest | 03/10/17 | — | 37,921,966 | 33,979,373 | |||||||||||
| Milestone Investment Holdings, LLC +, a, e | Common equity | 09/23/21 | 22,293,150 | 22,375,189 | 30,506,690 | |||||||||||
| NC Ocala Co-Invest Alpha, L.P. +, a, c | Limited partnership interest | 11/24/21 | — | 60,534,545 | 87,124,344 | |||||||||||
| OMNIA Coinvest L.P. +, a, c, e | Limited partnership interest | 10/23/20 | — | 15,306,665 | 29,509,704 | |||||||||||
| Onecall Holdings, L.P. +, a | Common equity | 11/29/17 | 1 | — | 435,437 | |||||||||||
| Onex Fox, L.P. +, a, c, e | Limited partnership interest | 04/25/19 | — | 45,225,381 | 106,820,270 | |||||||||||
| Orion Opportunity L.P. +, a, c, e | Limited partnership interest | 09/01/21 | — | 40,513,413 | 58,117,261 | |||||||||||
| PG BRPC Investment, LLC +, a, b | Common equity | 08/01/19 | 32,079 | 32,126,730 | 79,140,601 | |||||||||||
| PG Delta HoldCo, LLC +, a, b, e | Common equity | 06/24/21 | 42,616 | 48,694,632 | 101,432,330 | |||||||||||
| Raptor Holding Parent, L.P. +, a | Common equity | 04/01/22 | 11,209 | 1,120,924 | 1,117,568 | |||||||||||
| Real Hero Topco, L.P. +, a, c | Limited partnership interest | 04/01/21 | — | 13,722,831 | 19,382,593 | |||||||||||
| Real Hero Topco, L.P. +, a, c, e | Limited partnership interest | 02/24/25 | — | 1,113,032 | 1,572,084 | |||||||||||
| Safari Co-Investment L.P. +, a, c, e | Limited partnership interest | 03/14/18 | — | 6,996,130 | 5,632,193 | |||||||||||
| Safari Co-Investment L.P. +, a, c | Limited partnership interest | 03/14/18 | — | 2,361,000 | 1,900,709 | |||||||||||
The accompanying notes are an integral part of these Consolidated Financial Statements.
Partners Group Private Equity (Master Fund), LLC
(a Delaware Limited Liability Company)
Consolidated Schedule of Investments —
June 30, 2025 (Unaudited) (continued)
| Investment Type | Acquisition Date | Shares | Cost | Fair Value** | ||||||||||||
| Private Equity Investments (continued) | ||||||||||||||||
| Direct Investments * (continued) | ||||||||||||||||
| Direct Equity (continued) | ||||||||||||||||
| Sandvine Corporation +, a | Common equity | 03/03/25 | 50,291 | $ | 923,247 | $ | 923,247 | |||||||||
| SC Landco Parent, LLC +, a | Common equity | 11/28/16 | 2,672 | 3 | 484,494 | |||||||||||
| SC Landco Parent, LLC +, a | Preferred equity | 04/21/17 | — | 1 | 1 | |||||||||||
| Shermco Intermediate Holdings, Inc. +, a, e | Common equity | 06/05/18 | 11,525 | 1,201,845 | 2,829,842 | |||||||||||
| Shingle Coinvest LP +, a, c, e | Limited partnership interest | 05/29/18 | — | — | 1 | |||||||||||
| SIH RP HoldCo L.P. +, a, e | Common equity | 09/10/19 | 5,995,126 | 47,032,038 | 83,412,919 | |||||||||||
| SLP West Holdings Co-Invest Feeder II, L.P. +, a, c, e | Limited partnership interest | 08/18/17 | — | 23,429 | 1 | |||||||||||
| SLP West Holdings Co-Invest Feeder II, L.P. +, a, c | Limited partnership interest | 08/18/17 | — | 1,946 | 1 | |||||||||||
| SnackTime PG Holdings, Inc. +, a, b, e | Common equity | 05/23/18 | 12 | 55,011,041 | — | |||||||||||
| SnackTime PG Holdings, Inc. +, a, b, c, e | Member interest | 05/23/18 | — | 14,874,473 | — | |||||||||||
| Space Co-Invest LP +, a, c, e | Limited partnership interest | 01/17/25 | — | 20,339,023 | 20,284,311 | |||||||||||
| Specialty Pharma Holdings LP +, a, b, c | Limited partnership interest | 04/01/21 | — | 90,509,738 | 143,833,911 | |||||||||||
| Starfish Intermediate, Inc. +, a | Preferred equity | 06/06/22 | 7,136,374 | 178,485,000 | 238,372,072 | |||||||||||
| Stonepeak Tiger (Co-Invest) Holdings (I-B) L.P. +, a, c, e | Limited partnership interest | 08/17/21 | — | 33,561,996 | 33,870,498 | |||||||||||
| SureWerx Topco, L.P. +, a, b, c | Limited partnership interest | 12/28/22 | — | 54,353,000 | 69,985,412 | |||||||||||
| SureWerx Topco, L.P. +, a, b, c, e | Limited partnership interest | 04/30/24 | — | 301,146 | 387,759 | |||||||||||
| Surveyor Co-Invest SCSp +, a, c, e | Limited partnership interest | 10/17/24 | — | 22,552,209 | 25,336,730 | |||||||||||
| T-VIII Mercury Co-Invest L.P. +, a, c, e | Limited partnership interest | 07/29/21 | — | 5,017,926 | 9,121,310 | |||||||||||
| Thermostat Purchaser, L.P. +, a, b, c | Limited partnership interest | 08/31/21 | — | 71,817,900 | 113,845,160 | |||||||||||
| TKC Topco LLC +, a | Common equity | 10/14/16 | 4,632,829 | 4,632,829 | 2,556,122 | |||||||||||
| VEEF II Co-Invest 2-A, L.P. +, a, c | Limited partnership interest | 03/15/22 | — | 3,627,408 | 7,724,373 | |||||||||||
| Velocity Holdings US LP +, a, c, e | Limited partnership interest | 08/31/22 | — | 22,348,477 | 28,998,476 | |||||||||||
| VEPF VII Co-Invest 2-A, LP +, a, c, e | Limited partnership interest | 09/10/21 | — | 18,807,918 | 12,620 | |||||||||||
| VEPF VII Co-Invest 2-A, LP +, a, c | Limited partnership interest | 04/06/21 | — | 45,804,840 | 30,460 | |||||||||||
| Vistra Group Holdings (BVI) II Limited +, a | Common equity | 11/04/15 | 7,428 | 7,428 | 1 | |||||||||||
| WHCG Purchaser, L.P. +, a, b, e | Preferred equity | 08/02/24 | 10,934,833 | 10,934,833 | 11,929,454 | |||||||||||
| WHCG Purchaser, L.P. +, a, b | Preferred equity | 08/02/24 | — | 3,088,000 | 3,368,881 | |||||||||||
| WHCG Purchaser, L.P. +, a, b, c | Limited partnership interest | 06/22/21 | — | 68,399,200 | 10,685,186 | |||||||||||
| Woof Parent L.P. +, a | Common equity | 12/21/20 | 1,441 | 1,441,200 | 19,437 | |||||||||||
| Total North America (26.10%) | 4,171,330,453 | |||||||||||||||
| Rest of World (1.38%) | ||||||||||||||||
| Carlyle Retail Turkey Partners, L.P. +, a, c | Limited partnership interest | 07/11/13 | — | 7,070,769 | 9,189,150 | |||||||||||
| PG Investment Company 1113B S.à r.l. +, a, e | Common equity | 10/01/24 | 63,259,178 | 70,080,810 | 198,976,814 | |||||||||||
| PG Investment Company 53 S.à.r.l. +, a | Preferred equity | 03/04/24 | 6,084,618 | 6,624,409 | 8,420,611 | |||||||||||
| PG Investment Company 53 S.à.r.l. +, a | Common equity | 03/04/24 | 711,884 | 774,648 | 4,349,335 | |||||||||||
| Velvet LP SCS +, a, c | Limited partnership interest | 03/04/24 | — | 144,157 | 200,250 | |||||||||||
| Total Rest of World (1.38%) | 221,136,160 | |||||||||||||||
| South America (0.03%) | ||||||||||||||||
| Centauro Co-Investment Fund, L.P. +, a, c | Limited partnership interest | 11/28/13 | — | 6,014,065 | 4,407,173 | |||||||||||
| Total South America (0.03%) | 4,407,173 | |||||||||||||||
| Western Europe (26.23%) | ||||||||||||||||
| Akur8 SAS +, a, e | Common equity | 08/28/24 | 684,686 | 7,094,033 | 8,954,637 | |||||||||||
| Akur8 SAS +, a, e | Preferred equity | 08/28/24 | 876,616 | 9,728,692 | 11,464,791 | |||||||||||
| Ark EquityCo SAS +, a, c, e | Limited partnership interest | 02/21/22 | — | 12,366,563 | 18,269,872 | |||||||||||
| Aston Lux Acquisitions S.à.r.l. +, a, c | Limited partnership interest | 11/28/19 | — | 3,796,283 | 4,331,441 | |||||||||||
| Aston Lux Acquisitions S.à.r.l. +, a | Common equity | 01/11/21 | 218,625 | 264,490 | 294,826 | |||||||||||
| Astorg VIII Co-Invest Open Health +, a, c | Limited partnership interest | 08/04/22 | — | 21,849,512 | 12,877,059 | |||||||||||
| Astorg VIII Co-Invest Open Health +, a, c, e | Limited partnership interest | 07/14/23 | — | 402,797 | 216,003 | |||||||||||
| Audiotonix Co-Invest SCSp +, a, c, e | Limited partnership interest | 07/23/24 | — | 13,873,440 | 17,433,805 | |||||||||||
The accompanying notes are an integral part of these Consolidated Financial Statements.
Partners Group Private Equity (Master Fund), LLC
(a Delaware Limited Liability Company)
Consolidated Schedule of Investments —
June 30, 2025 (Unaudited) (continued)
| Investment Type | Acquisition Date | Shares | Cost | Fair Value** | ||||||||||||
| Private Equity Investments (continued) | ||||||||||||||||
| Direct Investments * (continued) | ||||||||||||||||
| Direct Equity (continued) | ||||||||||||||||
| BC European Capital X - Ceramtec Co-Investment (1) LP +, a, e | Common equity | 02/06/18 | 575,918 | $ | 700,484 | $ | 1 | |||||||||
| Blackstone Cornerstone Co-Invest (CYM) L.P. +, a, c, e | Limited partnership interest | 04/16/24 | — | 22,246,954 | 27,315,211 | |||||||||||
| Bock Capital JVCo Nature S.à.r.l. +, a, b | Common equity | 07/01/21 | 12,590,000,000 | 149,423,941 | 295,181,507 | |||||||||||
| Camelia Investment 1 Limited +, a, e | Common equity | 10/12/17 | 3,082 | 4,087 | — | |||||||||||
| Capri Acquisitions Topco Limited +, a, e | Common equity | 11/01/17 | 8,345,985 | 83,995,867 | 35,887,748 | |||||||||||
| CD&R Market Co-Investor, L.P. +, a, c, e | Limited partnership interest | 11/10/21 | — | 78,514,453 | 71,266,548 | |||||||||||
| Ciddan S.à.r.l. +, a, e | Preferred equity | 09/15/17 | 23,249,522 | 27,818,080 | 30,298,791 | |||||||||||
| Ciddan S.à.r.l. +, a, e | Common equity | 09/15/17 | 12,263,240 | 14,672,982 | 52,916,562 | |||||||||||
| Climeworks AG +, a | Common equity | 04/25/22 | 18,455 | 465,142 | 23,814 | |||||||||||
| Climeworks AG +, a, e | Preferred equity | 04/25/22 | 8,155,043 | 68,066,218 | 80,273,374 | |||||||||||
| EQT Future Co-Investment (C) SCSp +, a, c | Limited partnership interest | 02/15/23 | — | 47,438,430 | 96,680,122 | |||||||||||
| EQT Jaguar Co-Investment SCSp +, a, c, e | Limited partnership interest | 11/30/18 | — | 32,709,803 | 77,185,584 | |||||||||||
| EQT Jaguar Co-Investment SCSp +, a, c | Limited partnership interest | 04/18/24 | — | 711,598 | 858,126 | |||||||||||
| EQT VIII Co-Investment (D) SCSp +, a, c, e | Limited partnership interest | 10/01/19 | — | 40,813,520 | 215,832,350 | |||||||||||
| EQT VIII Co-Investment (D) SCSp +, a, c | Limited partnership interest | 10/01/19 | — | 5,830,047 | 10,435,203 | |||||||||||
| Fides S.p.A +, a | Common equity | 12/15/16 | 78,505 | 745,309 | 252,799 | |||||||||||
| Five Arrows Royal FAPI IV Co Invest SCSp +, a, c, e | Limited partnership interest | 07/05/24 | — | 4,660,720 | 4,888,834 | |||||||||||
| Global Blue Group Holding AG +, a | Common equity | 09/11/20 | 97,250 | 1,045,423 | 730,307 | |||||||||||
| Global Blue Holding L.P. +, a, c | Limited partnership interest | 07/31/12 | — | 1 | 11,057,755 | |||||||||||
| Green DC LuxCo S.à.r.l. +, a, b, c, e | Member interest | 01/20/22 | — | 37,402,098 | 42,712,934 | |||||||||||
| Green DC LuxCo S.à.r.l. +, a, b, c, e | Member interest | 03/31/24 | — | 19,648,729 | 20,324,574 | |||||||||||
| Green DC LuxCo S.à.r.l. +, a, b, e | Common equity | 03/31/24 | 19,465,958 | 43,438,321 | 57,985,919 | |||||||||||
| Green DC LuxCo S.à.r.l. +, a, b | Common equity | 01/20/22 | 26,701,331 | 52,426,568 | 159,899,250 | |||||||||||
| Hera Co-investment LP +, a, c, e | Limited partnership interest | 10/25/24 | — | 16,395,896 | 16,338,314 | |||||||||||
| KKR Pegasus Co-Invest L.P. +, a, c | Limited partnership interest | 07/07/22 | — | 11,664,381 | 20,241,404 | |||||||||||
| KKR Sprint Co-Invest L.P. +, a, c | Limited partnership interest | 09/29/22 | — | 42,840,839 | — | |||||||||||
| KKR Traviata Co-invest L.P. +, a, c | Limited partnership interest | 12/18/19 | — | 92,759,254 | 166,890,062 | |||||||||||
| Luxembourg Investment Company 261 S.à.r.l. +, a | Common equity | 07/31/18 | 1,484 | 21,615,986 | 70,798,332 | |||||||||||
| Luxembourg Investment Company 261 S.à.r.l. +, a, c | Member interest | 07/31/18 | — | 48,949,162 | 74,230,968 | |||||||||||
| Luxembourg Investment Company 285 S.à.r.l. +, a, b | Preferred equity | 08/22/19 | 7,865,820 | 17,052,864 | — | |||||||||||
| Luxembourg Investment Company 285 S.à.r.l. +, a, b, c | Member interest | 08/22/19 | — | 17,052,864 | 6,038,310 | |||||||||||
| Luxembourg Investment Company 285 S.à.r.l. +, a, b | Common equity | 08/22/19 | 6,999,953 | 3,377,868 | — | |||||||||||
| Luxembourg Investment Company 293 S.à.r.l. +, a, b, e | Common equity | 06/26/19 | 9,789,622 | 18,472,753 | 37,060,187 | |||||||||||
| Luxembourg Investment Company 293 S.à.r.l. +, a, b, c, e | Member interest | 06/26/19 | — | 1,328,931 | 1,482,127 | |||||||||||
| Luxembourg Investment Company 314 S.à.r.l. +, a, b | Common equity | 08/22/19 | 192,000 | 7,793 | 1 | |||||||||||
| Luxembourg Investment Company 404 S.à.r.l. +, a, b, e | Common equity | 02/14/23 | 145,800 | 1,663,357 | 8,378,593 | |||||||||||
| Luxembourg Investment Company 404 S.à.r.l. +, a, b, e | Preferred equity | 02/14/23 | — | 14,746,472 | 17,546,746 | |||||||||||
| Luxembourg Investment Company 414 S.à.r.l. +, a, b, c, e | Member interest | 07/02/21 | — | 40,092,414 | 47,030,890 | |||||||||||
| Luxembourg Investment Company 414 S.à.r.l. +, a, b, e | Common equity | 07/02/21 | 12,316,087 | 9,766,168 | 79,071,261 | |||||||||||
| Luxembourg Investment Company 430 S.à.r.l. +, a, b, e | Common equity | 05/10/21 | 52,594,635 | 64,616,036 | 66,400,975 | |||||||||||
| Luxembourg Investment Company 430 S.à.r.l. +, a, b, c, e | Member interest | 05/10/21 | — | 15,139,432 | 18,161,107 | |||||||||||
| Magnesium Co-Invest SCSp +, a, c, e | Limited partnership interest | 05/19/22 | — | 78,803,152 | 127,558,584 | |||||||||||
The accompanying notes are an integral part of these Consolidated Financial Statements.
Partners Group Private Equity (Master Fund), LLC
(a Delaware Limited Liability Company)
Consolidated Schedule of Investments —
June 30, 2025 (Unaudited) (continued)
| Investment Type | Acquisition Date | Shares | Cost | Fair Value** | ||||||||||||
| Private Equity Investments (continued) | ||||||||||||||||
| Direct Investments * (continued) | ||||||||||||||||
| Direct Equity (continued) | ||||||||||||||||
| Mauritius (Luxemburg) Investments S.à.r.l. +, a | Common equity | 10/19/21 | 11,698 | $ | 13,620 | $ | 1 | |||||||||
| Menrva Co-Investment, L.P. +, a, c | Limited partnership interest | 11/22/24 | — | 11,034,169 | 11,063,763 | |||||||||||
| Nerve Co-Invest SCSp +, a, c, e | Limited partnership interest | 01/27/21 | — | 41,647,590 | 71,092,519 | |||||||||||
| Nerve Co-Invest SCSp +, a, c | Limited partnership interest | 01/27/21 | — | 5,073,504 | 9,635,580 | |||||||||||
| Oakley Capital V Co-Investment (A) SCSp +, a, c, e | Limited partnership interest | 04/19/24 | — | 51,641,872 | 84,715,157 | |||||||||||
| Orbiter Investments S.à.r.l. +, a, b, e | Common equity | 12/17/21 | 5,699,625 | 95,734,502 | 151,186,285 | |||||||||||
| Orbiter Investments S.à.r.l. +, a, b | Common equity | 12/17/21 | 2,869,232 | 93,661,837 | 76,108,251 | |||||||||||
| OT Luxco 3 & Cy S.C.A. +, a | Warrants | 12/01/17 | 844,553 | — | 844,235 | |||||||||||
| Partners Group Satellite HoldCo S.à.r.l. +, a, b, e | Common equity | 03/22/23 | 7,017,978 | 4,767,325 | — | |||||||||||
| Partners Group Satellite HoldCo S.à.r.l. +, a, b, e | Preferred equity | 03/22/23 | 7,975,901 | 48,753,622 | 43,332,412 | |||||||||||
| Partners Group Satellite Warehouse S.C.S. +, a, b, c | Member interest | 03/22/23 | — | 1,455,807 | 1,128,010 | |||||||||||
| PG Investment Company 18 S.à.r.l. +, a, b, e | Preferred equity | 07/07/22 | 113,856,528 | 115,820,054 | 187,312,118 | |||||||||||
| PG Investment Company 18 S.à.r.l. +, a, b, e | Common equity | 07/07/22 | 12,650,109 | 128,268 | 63,550,652 | |||||||||||
| PG Investment Company 24 S.à.r.l. +, a, b, e | Common equity | 07/13/22 | 883,460 | 1,135,700 | 16,881,044 | |||||||||||
| PG Investment Company 24 S.à.r.l. +, a, b, e | Preferred equity | 07/13/22 | 101,367,616 | 102,497,783 | 157,803,507 | |||||||||||
| PG Investment Company 60 S.à r.l. +, a, b, e | Common equity | 01/31/24 | 109,610 | 119,065 | 819,437 | |||||||||||
| PG Investment Company 60 S.à r.l. +, a, b, e | Preferred equity | 01/31/24 | 784,765 | 7,491,845 | 9,005,830 | |||||||||||
| PG Investment Company 67 S.à.r.l. +, a, e | Preferred equity | 07/16/24 | 9,255,649 | 12,743,394 | 15,069,577 | |||||||||||
| PG Investment Company 67 S.à.r.l. +, a, e | Common equity | 07/16/24 | 1,029,239 | 1,414,770 | 4,612,822 | |||||||||||
| PG Investment Company 69 S.à.r.l. +, a | Preferred equity | 07/16/24 | 646,265 | 328,227 | 115,390 | |||||||||||
| PG Investment Company 69 S.à.r.l. +, a | Common equity | 07/16/24 | 187,735 | 580,738 | 114,149 | |||||||||||
| PG Investment Company 71 S.à.r.l. +, a, e | Common equity | 09/26/24 | 6,385,371 | 7,129,193 | 8,550,497 | |||||||||||
| PG Investment Company 76 S.à.r.l. +, a, b, e | Common equity | 09/03/24 | 358,449 | 395,093 | 1 | |||||||||||
| PG Investment Company 76 S.à.r.l. +, a, b, e | Preferred equity | 09/03/24 | 43,478,798 | 48,005,615 | 52,518,920 | |||||||||||
| PG Lion Management Warehouse S.C.S +, a, b, c | Limited partnership interest | 08/22/19 | — | 1,063,586 | 54,500 | |||||||||||
| PG Polaris TopCo S.à r.l. +, a, e | Common equity | 03/27/24 | 1,941,043 | 1,941,291 | 14,861,668 | |||||||||||
| PG Polaris TopCo S.à r.l. +, a | Preferred equity | 03/27/24 | 36,879,822 | 36,879,819 | 32,645,905 | |||||||||||
| PG Polaris Warehouse SCSp +, a, c, d | Limited partnership interest | 03/27/24 | — | 748,547 | 1,036,153 | |||||||||||
| PG TLP S.à.r.l. +, a, b, c, e | Member interest | 04/14/21 | — | 5,331,705 | 76,134,804 | |||||||||||
| PG TLP S.à.r.l. +, a, b, e | Common equity | 04/14/21 | 6,473,126 | 88,269,190 | 86,551,928 | |||||||||||
| PG Wave Limited +, a, b, e | Common equity | 02/03/22 | 53,215,581 | 73,161,629 | 110,269,718 | |||||||||||
| Pharmathen GP S.à.r.l. +, a, b | Common equity | 01/20/22 | 110,300 | 1,773 | 1 | |||||||||||
| Pharmathen Topco S.à r.l. +, a, b | Preferred equity | 02/21/25 | 3,560,390 | 3,722,755 | 4,483,810 | |||||||||||
| Pharmathen Topco S.à r.l. +, a | Preferred equity | 02/21/25 | 4,069,017 | 4,685,043 | 4,879,102 | |||||||||||
| Pharmathen Topco S.à.r.l. +, a, b | Preferred equity | 01/20/22 | 98,858,068 | 112,190,937 | 146,636,629 | |||||||||||
| Pharmathen Topco S.à.r.l. +, a, b | Common equity | 01/20/22 | 79,910 | 85,739 | 1 | |||||||||||
| Polyusus Lux XVI S.à.r.l. +, a, b | Preferred equity | 07/05/24 | 22 | 24 | 1 | |||||||||||
| Polyusus Lux XVI S.à.r.l. +, a, b, e | Preferred equity | 05/23/18 | 489,319,992 | 26,882,311 | 3,257,450 | |||||||||||
| Polyusus Lux XVI S.à.r.l. +, a, b, e | Common equity | 05/23/18 | 44,442,345 | 6,275,980 | — | |||||||||||
| Polyusus Lux XVI S.à.r.l. +, a, b, c | Member interest | 10/03/22 | — | 333,654 | 1 | |||||||||||
| Polyusus Lux XVI S.à.r.l. +, a, b, c, e | Member interest | 10/01/22 | — | 857,580 | 1 | |||||||||||
| Polyusus Lux XXIII S.à.r.l. +, a, e | Preferred equity | 04/11/22 | 1,155,552 | 42,946 | 63,317 | |||||||||||
| Polyusus Lux XXIII S.à.r.l. +, a | Preferred equity | 08/19/21 | 11,772,986 | 694,245 | 242,940 | |||||||||||
| Polyusus Lux XXIII S.à.r.l. +, a | Common equity | 08/19/21 | 3,936,244 | 231,415 | 45,351 | |||||||||||
| Polyusus Lux XXIII S.à.r.l. +, a, e | Preferred equity | 08/19/21 | 1,341,978 | 77,113 | 871,490 | |||||||||||
| Polyusus Lux XXIII S.à.r.l. +, a, e | Common equity | 08/19/21 | 447,324 | 25,704 | 162,685 | |||||||||||
| Quadriga Capital IV Investment Holding II LP +, a, e | Common equity | 01/15/18 | 238,583 | 282,465 | 2 | |||||||||||
| Quadriga Capital IV Investment Holding II LP +, a | Common equity | 09/09/16 | 1,432,376 | 1,595,951 | 2 | |||||||||||
| Refresco 2 Co-Invest SCSp +, a, c | Limited partnership interest | 07/12/22 | — | 33,461,675 | 59,261,788 | |||||||||||
| Rivage Luxco S.à.r.l. +, a | Common equity | 02/22/22 | 450,000 | 51,009,931 | 63,281,075 | |||||||||||
| Rivage Luxco S.à.r.l. +, a, e | Common equity | 06/28/23 | 450,000 | 312,165 | 402,698 | |||||||||||
| Root JVCo S.à.r.l. +, a, b, c | Member interest | 09/29/20 | — | 36,261,531 | 46,613,475 | |||||||||||
| Root JVCo S.à.r.l. +, a, b | Common equity | 02/07/23 | 2,362,997 | 2,896,582 | 29,011,964 | |||||||||||
The accompanying notes are an integral part of these Consolidated Financial Statements.
Partners Group Private Equity (Master Fund), LLC
(a Delaware Limited Liability Company)
Consolidated Schedule of Investments —
June 30, 2025 (Unaudited) (continued)
| Investment Type | Acquisition Date | Shares | Cost | Fair Value** | ||||||||||||
| Private Equity Investments (continued) | ||||||||||||||||
| Direct Investments * (continued) | ||||||||||||||||
| Direct Equity (continued) | ||||||||||||||||
| Root JVCo S.à.r.l. +, a, b | Preferred equity | 02/07/23 | 27,236,127 | $ | 42,469,064 | $ | 63,915,415 | |||||||||
| Strider Investment 2 +, a, e | Preferred equity | 04/01/23 | 278,539 | 302,803 | 1,116,516 | |||||||||||
| Strider Investment 3 +, a, e | Preferred equity | 04/01/23 | 24,476 | 26,591 | 28,720 | |||||||||||
| Strider Topco S.a.s. +, a, c | Member interest | 04/01/23 | — | 3,389,622 | 4,456,971 | |||||||||||
| Strider Topco S.a.s. +, a, e | Common equity | 04/01/23 | 8,138,656 | 8,834,459 | 32,554,973 | |||||||||||
| Strider Topco S.a.s. +, a, e | Preferred equity | 04/01/23 | 52,067,087 | 56,579,460 | 77,616,117 | |||||||||||
| Surfaces SLP (SCSp) +, a, b, c | Limited partnership interest | 10/01/20 | — | 34,731,898 | 24,190,930 | |||||||||||
| Vanquish Bidco +, a, c | Member interest | 05/25/23 | — | 3,381,170 | 4,131,280 | |||||||||||
| Vanquish Topco +, a | Common equity | 05/25/23 | 379,731 | 936,729 | 1 | |||||||||||
| Vanquish Topco +, a | Preferred equity | 05/25/23 | 34,851,987 | 42,986,878 | 35,397,052 | |||||||||||
| Veonet Co-Invest SCSp (Lux) +, a, c, e | Limited partnership interest | 03/09/22 | — | 26,379,481 | 47,185,646 | |||||||||||
| Zephyr Syndication L.P. +, a, c, e | Limited partnership interest | 08/08/24 | — | 12,374,422 | 17,492,543 | |||||||||||
| Zoncolan Topco S.à.r.l. +, a, b, c | Member interest | 10/28/21 | — | 61,194,518 | 62,048,702 | |||||||||||
| Zoncolan Topco S.à.r.l. +, a, b, e | Common equity | 10/28/21 | 20,383,872 | 40,500,847 | 46,058,287 | |||||||||||
| Zoncolan Topco S.à.r.l. +, a, b, e | Preferred equity | 08/01/24 | 5,384,750 | 5,822,805 | 6,898,669 | |||||||||||
| Total Western Europe (26.23%) | 4,192,398,046 | |||||||||||||||
| Total Direct Equity (57.08%) | $ | 6,319,406,965 | $ | 9,122,525,812 | ||||||||||||
| Direct Debt (6.17%) | Interest | Acquisition Date | Maturity Date | Investment Type | Principal | Cost | Fair Value** | |||||||||||||
| Asia - Pacific (0.29%) | ||||||||||||||||||||
| BYJU's Alpha, Inc. +, a | Cash 8.00% + P (0.75% Floor) | 01/19/22 | 11/24/26 | Senior | $ | — | $ | 1 | $ | — | ||||||||||
| FFML Holdco Limited +, a | Cash 6.25% + BBSY (0.75% Floor)†† | 11/30/22 | 11/30/28 | Senior | 11,564,338 | 11,307,338 | 11,262,861 | |||||||||||||
| Fugue Finance B.V. +, a | Cash 4.50% + SF (0.50% Floor)vv | 03/10/23 | 01/31/28 | Senior | 5,433,680 | 26,553 | — | |||||||||||||
| Fugue Finco Pty Ltd. +, a, e | Cash 5.75% + BBSY†† | 04/10/24 | 04/10/30 | Senior | 966,531 | 966,531 | 928,385 | |||||||||||||
| Fugue Finco Pty Ltd. +, a | Cash 5.75% + BBSY†† | 04/10/24 | 05/30/30 | Senior | 3,621,280 | 3,512,641 | 3,604,502 | |||||||||||||
| Fugue NZ Bidco Limited +, a | Cash 5.75% + BBSY†† | 04/10/24 | 05/30/30 | Senior | 2,370,912 | 2,299,785 | 2,377,079 | |||||||||||||
| Global Academic Group Limited +, a | Cash 6.00% + BBSY (0.50% Floor)†† | 07/26/22 | 07/26/27 | Senior | 12,728,400 | 12,636,901 | 12,369,172 | |||||||||||||
| Global Academic Group Limited +, a | Cash 4.91% + BBSY †† | 01/30/25 | 07/26/27 | Senior | 653,208 | 645,121 | 686,661 | |||||||||||||
| Global Academic Group Limited +, a, e | Cash 6.00% + BBSY (0.50% Floor)†† | 07/26/22 | 07/26/27 | Senior | 395,158 | 395,158 | 425,417 | |||||||||||||
| Global Academic Group Limited +, a | Cash 6.00% + BBSY (0.50% Floor)†† | 07/29/22 | 07/29/27 | Senior | 4,651,970 | 4,617,822 | 4,371,407 | |||||||||||||
| Greencross Limited +, a | Cash 5.75% + BBSY (0.75% Floor)†† | 09/30/24 | 03/23/28 | Senior | 9,364,117 | 9,314,051 | 8,810,628 | |||||||||||||
| UP Education +, a, e | 12/16/24 | 07/29/27 | Senior | — | — | — | ||||||||||||||
| Voyage Australia Pty Ltd. +, a | Cash 3.50% + SF (0.50% Floor)vv | 07/23/21 | 06/18/28 | Senior | 1,640,500 | 1,628,223 | 1,646,477 | |||||||||||||
| Total Asia - Pacific (0.29%) | 46,482,589 | |||||||||||||||||||
| North America (3.79%) | ||||||||||||||||||||
| Aimbridge Acquisition Co., Inc. +, a | Cash 7.5% + SFv | 03/11/25 | 03/11/30 | Senior | 1,680,143 | 1,129,238 | 1,129,238 | |||||||||||||
| Aimbridge Acquisition Co., Inc. +, a | Cash 5.5% + SFv | 03/20/25 | 03/11/30 | Senior | 564,906 | 564,906 | 566,319 | |||||||||||||
| Air Medical Group Holdings, Inc. +, a | Cash 4.25% + SF (1.00% Floor)vv | 02/25/21 | 10/02/25 | Senior | 7,978,852 | 195,052 | — | |||||||||||||
| AlixPartners, LLP +, a | Cash 2.50% + SF (0.50% Floor)v | 06/12/24 | 02/04/28 | Senior | 4,935,555 | 4,960,045 | 4,963,343 | |||||||||||||
The accompanying notes are an integral part of these Consolidated Financial Statements.
Partners Group Private Equity (Master Fund), LLC
(a Delaware Limited Liability Company)
Consolidated Schedule of Investments —
June 30, 2025 (Unaudited) (continued)
| Interest | Acquisition Date | Maturity Date | Investment Type | Principal | Cost | Fair Value** | ||||||||||||||
| Private Equity Investments (continued) | ||||||||||||||||||||
| Direct Investments * (continued) | ||||||||||||||||||||
| Direct Debt (continued) | ||||||||||||||||||||
| Allied Universal Holdco LLC +, a | Cash 3.75% + SFv | 06/12/24 | 05/12/28 | Senior | $ | — | $ | 2,781 | $ | — | ||||||||||
| American Airlines, Inc. +, a | Cash 2.50% + SFvv | 09/06/24 | 06/04/29 | Senior | 4,950,000 | 4,955,229 | 4,932,774 | |||||||||||||
| Apex Tool Group +, a | Cash 5.25% + SF (0.50% Floor)v | 02/22/22 | 02/08/29 | Senior | 3,186,576 | 3,015,192 | 1,680,516 | |||||||||||||
| Apro, LLC +, a | Cash 3.75% + SFvv | 06/26/24 | 07/09/31 | Senior | 3,275,250 | 3,267,926 | 3,274,595 | |||||||||||||
| Aptean, Inc +, a | Cash 4.75% + SF (0.75% Floor)vv | 01/30/24 | 01/30/31 | Senior | 7,040,312 | 6,983,738 | 7,022,711 | |||||||||||||
| Aptean, Inc +, a, e | Cash 4.75% + SF (0.75% Floor)vv | 01/30/24 | 01/30/31 | Senior | 1,231,353 | 1,225,635 | 1,228,274 | |||||||||||||
| AQA Acquisition Holding, Inc. +, a | Cash 4.25% + SF (0.50% Floor)vv | 03/18/21 | 03/03/28 | Senior | — | 6 | — | |||||||||||||
| athenahealth Group, Inc. +, a | Cash 3.25% + SF (0.50% Floor)vv | 02/23/22 | 02/15/29 | Senior | 10,535,778 | 10,493,926 | 10,563,487 | |||||||||||||
| Barracuda Networks, Inc. +, a | Cash 7.00% + SF (0.50% Floor)vvv | 05/17/22 | 08/15/30 | Second Lien | 2,000,000 | 1,955,783 | 1,248,140 | |||||||||||||
| Bausch & Lomb Inc. +, a | Cash 3.25% + SF (0.50% Floor)vv | 05/18/22 | 05/10/27 | Senior | 11,156,431 | 10,612,337 | 10,612,337 | |||||||||||||
| Bausch + Lomb Corp. +, a | Cash 4.00% + SFv | 09/14/23 | 09/14/28 | Senior | 1,965,000 | 1,951,391 | 1,969,913 | |||||||||||||
| BlueConic Holding, Inc. +, a | Cash 6.50% + SF (0.75% Floor)vv | 01/27/22 | 01/27/28 | Senior | 18,912,000 | 18,722,542 | 18,835,436 | |||||||||||||
| BlueConic Holding, Inc. +, a | Cash 6.50% + SF (0.75% Floor)vv | 06/13/23 | 01/27/28 | Senior | 7,092,000 | 6,960,441 | 7,063,288 | |||||||||||||
| Brand Industrial Services, Inc. +, a | Cash 4.50% + SF (0.50% Floor)vv | 04/19/24 | 08/01/30 | Senior | 6,788,695 | 6,702,081 | 5,769,836 | |||||||||||||
| Brown Group Holding, LLC +, a | Cash 3.00% + SF (0.50% Floor)v | 06/09/22 | 07/02/29 | Senior | 2,165,884 | 2,138,815 | 2,169,497 | |||||||||||||
| Brown Group Holding, LLC +, a | Cash 2.75% + SFv | 05/23/24 | 06/07/28 | Senior | 2,976,794 | 2,980,616 | 2,983,419 | |||||||||||||
| Campaign Monitor (UK) Limited +, a | Cash 8.90% + SF (1.00% Floor)vv | 01/01/21 | 11/06/26 | Second Lien | 1,856,677 | 1,854,325 | 1,699,925 | |||||||||||||
| Campaign Monitor (UK) Limited +, a | Cash 8.90% + SF (1.00% Floor)vv; PIK 14.795% | 01/01/21 | 11/06/26 | Second Lien | 232,085 | 8,396 | 212,491 | |||||||||||||
| CapitalSpring Finance Company, LLC +, a, b | PIK 5.00% | 03/01/17 | 02/10/25 | Mezzanine | 3,146,434 | 3,213,295 | 3,213,253 | |||||||||||||
| CD&R Hydra Buyer, Inc. +, a | Cash 4.00% + SFv | 03/15/24 | 03/25/31 | Senior | 1,782,000 | 3,752,491 | 3,747,525 | |||||||||||||
| Cedar Fair, L.P. +, a, f | Cash 2.00% + SFv | 05/23/24 | 05/01/31 | Senior | 2,977,500 | 6,255,330 | 6,276,583 | |||||||||||||
| Cengage Learning, Inc. +, a, f | Cash 3.5% + SF (1.00% Floor)v | 03/28/24 | 03/18/31 | Senior | — | 2,990,611 | 3,007,623 | |||||||||||||
| Central Parent LLC +, a | Cash 3.25% + SFvv | 05/28/24 | 07/06/29 | Senior | — | 1,968,654 | 1,624,345 | |||||||||||||
| Checkers Drive-in Restaurants, Inc. +, a | Cash 7.00% + SFvv | 06/16/23 | 06/16/27 | Senior | 4,456 | 4,462 | 4,284 | |||||||||||||
| Clydesdale Acquisition Holdings, Inc. +, a | Cash 3.675% + SF (0.50% Floor)vv | 04/19/22 | 04/13/29 | Senior | 5,309,787 | 5,297,084 | 5,318,442 | |||||||||||||
| ConnectWise, LLC +, a | Cash 3.50% + SF (0.76% Floor)vv | 10/06/21 | 09/29/28 | Senior | 1,644,750 | 3,611,709 | 3,644,494 | |||||||||||||
| Cornerstone Building Brands, Inc. +, a | Cash 3.25% + SFv | 06/24/24 | 04/12/28 | Senior | 2,969,072 | 3,419,077 | 3,151,157 | |||||||||||||
| Cornerstone Building Brands, Inc. +, a | Cash 4.50% + SFv | 05/17/24 | 05/15/31 | Senior | 1,691,500 | 1,679,888 | 1,455,253 | |||||||||||||
| Cornerstone OnDemand, Inc. +, a | Cash 3.75% + SF (0.50% Floor)v | 10/22/21 | 10/16/28 | Senior | 1,164,000 | 1,157,949 | 1,100,779 | |||||||||||||
| Cornerstone OnDemand, Inc. +, a | Cash 6.00% + SF (1.00% Floor)v | 09/07/23 | 10/16/28 | Senior | 2,947,500 | 2,878,331 | 2,804,310 | |||||||||||||
| Critical Start, Inc. +, a | Cash 3.125% + SF (0.75% Floor)vv + PIK 3.125% | 03/27/23 | 05/17/28 | Senior | 4,852,224 | 4,803,003 | 4,772,902 | |||||||||||||
The accompanying notes are an integral part of these Consolidated Financial Statements.
Partners Group Private Equity (Master Fund), LLC
(a Delaware Limited Liability Company)
Consolidated Schedule of Investments —
June 30, 2025 (Unaudited) (continued)
| Interest | Acquisition Date | Maturity Date | Investment Type | Principal | Cost | Fair Value** | ||||||||||||||
| Private Equity Investments (continued) | ||||||||||||||||||||
| Direct Investments * (continued) | ||||||||||||||||||||
| Direct Debt (continued) | ||||||||||||||||||||
| Critical Start, Inc. +, a, e | Cash 6.25% + SF (0.75% Floor)vv | 03/27/23 | 05/17/28 | Senior | $ | 10,248,409 | $ | 9,756,492 | $ | 9,621,264 | ||||||||||
| CSC Holdings, LLC +, a | Cash 2.50% + SFv | 08/11/21 | 04/15/27 | Senior | — | 27 | — | |||||||||||||
| CSC Holdings, LLC +, a | Cash 4.50% + SFvv | 12/07/18 | 01/15/26 | Senior | 17 | 3,081 | — | |||||||||||||
| Datix Bidco Limited +, a | Cash 5.50% + S>>> | 04/25/24 | 04/30/31 | Senior | 901,982 | 883,942 | 976,385 | |||||||||||||
| Dentive Capital, LLC +, a, e | Cash 6.75% + SF (0.75% Floor)vv | 12/23/22 | 12/22/28 | Senior | 4,360,460 | 5,661,014 | 5,286,873 | |||||||||||||
| Dentive Capital, LLC +, a | Cash 6.75% + SF (0.75% Floor)vv | 12/23/22 | 12/22/28 | Senior | 9,897,599 | 9,751,794 | 9,134,430 | |||||||||||||
| Dentive, LLC +, a, e | Cash 6.75% + SFvv | 05/03/24 | 12/23/28 | Senior | 3,917,430 | 3,837,091 | 3,615,371 | |||||||||||||
| Dexko Global, Inc. +, a, f | Cash 3.75% + SF (0.50% Floor)vv | 10/07/21 | 10/04/28 | Senior | 1,556,000 | 3,938,215 | 3,893,488 | |||||||||||||
| DG Investment Intermediate Holdings 2, Inc. +, a | Cash 3.75% + SF (0.76% Floor)v | 04/23/21 | 03/31/28 | Senior | — | 9,171,097 | 9,177,772 | |||||||||||||
| Dieter’s Metal Fabricating Limited +, a | Cash 5.25% + SF (1.00% Floor)vv | 12/19/23 | 12/19/29 | Senior | 436,086 | 429,135 | 429,109 | |||||||||||||
| Diligent Corporation +, a | Cash 5.00% + SFvv + PIK 3.00% | 05/02/24 | 08/02/30 | Senior | 3,575,690 | 3,553,740 | 3,524,827 | |||||||||||||
| Diligent Corporation +, a, e | Cash 5.00% + SFvv | 04/30/24 | 08/04/30 | Senior | 20,857,887 | 20,895,610 | 21,018,681 | |||||||||||||
| Discovery Energy Holding Corporation +, a, f | Cash 4.75% + SFv | 05/14/24 | 01/30/31 | Senior | 4,396,553 | 6,251,702 | 6,434,549 | |||||||||||||
| Dwyer Instruments, Inc. +, a, e | Cash 3.75% + P | 03/31/25 | 07/20/29 | Senior | 13,438,345 | 174,196 | 174,801 | |||||||||||||
| Eagle Broadband Investments, LLC +, a, e | Cash 3.00% + SF (0.75% Floor)vv | 04/24/24 | 11/12/27 | Senior | 4,948,320 | 4,919,793 | 4,929,281 | |||||||||||||
| Element Materials Technology +, a, e | Cash 4.25% + SFvv | 08/17/22 | 06/22/29 | Senior | 5,886,839 | 5,846,260 | 5,919,982 | |||||||||||||
| Endurance International Group Holdings, Inc. +, a, f | Cash 3.50% + SF (0.75% Floor)vv | 04/28/21 | 02/10/28 | Senior | 2,049,998 | 5,222,773 | 4,208,875 | |||||||||||||
| Engineered Machinery Holdings, Inc. +, a | Cash 3.75% + SF (0.75% Floor)vv | 08/16/21 | 05/21/28 | Senior | 1,548,000 | 1,540,276 | 1,557,109 | |||||||||||||
| Evergreen Services Group LLC +, a | Cash 6.25% + SF (0.75% Floor)vv | 06/15/22 | 06/15/29 | Senior | 9,629,273 | 9,527,989 | 9,601,393 | |||||||||||||
| Evergreen Services Group, LLC +, a | Cash 6.25% + SF (0.75% Floor)vv | 07/31/23 | 06/15/29 | Senior | 4,247,852 | 4,225,764 | 4,235,552 | |||||||||||||
| Evergreen Services Group, LLC +, a, e | Cash 5.75% + SFvv | 02/26/24 | 06/15/29 | Senior | 3,985,586 | 3,953,144 | 3,974,046 | |||||||||||||
| Flynn Restaurant Group LP +, a | Cash 4.25% + SF (0.50% Floor)vv | 12/10/21 | 11/22/28 | Senior | 3,308,456 | 3,281,981 | 3,310,665 | |||||||||||||
| Foundation Building Materials, Inc. +, a | Cash 4.00% + SFv | 03/06/24 | 01/29/31 | Senior | 3,857,437 | 5,791,133 | 5,727,151 | |||||||||||||
| Global Medical Response, Inc. +, a, f | Cash 4.75% + SFvv | 04/18/24 | 10/31/28 | Senior | 13,799,850 | 13,191,707 | 13,846,974 | |||||||||||||
| GoTo Group, Inc. +, a | Cash 4.75% + SFv | 02/05/24 | 04/30/28 | Senior | — | 1 | — | |||||||||||||
| Gurobi Optimization, LLC +, a, e | Cash 4.75% + SFvv | 09/10/24 | 09/10/31 | Senior | 8,283,538 | 8,201,509 | 8,277,150 | |||||||||||||
| Heartland Home Services, Inc. +, a | Cash 6.75% + SF (1.00% Floor)vv | 11/08/22 | 12/15/26 | Senior | 11,730,000 | 11,604,178 | 11,410,925 | |||||||||||||
| Help/Systems Holdings, Inc. +, a | Cash 6.75% + SF (0.75% Floor)vv | 11/05/21 | 11/19/27 | Second Lien | 3,600,000 | 3,600,000 | 2,745,000 | |||||||||||||
| High Bar Brands Operating LLC +, a, e | Cash 5.25% + SF (1.00% Floor)vv | 12/19/23 | 12/19/29 | Senior | 369,102 | 365,979 | 363,196 | |||||||||||||
| High Bar Brands Operating LLC +, a | Cash 5.25% + SF (1.00% Floor)vv | 12/19/23 | 12/19/29 | Senior | 2,093,215 | 2,061,727 | 2,059,723 | |||||||||||||
| High Bar Brands Operating, LLC +, a, e | Cash 5.25% + SF (1.00% Floor)vv | 12/19/23 | 12/19/29 | Senior | 436,086 | 37,639 | 37,594 | |||||||||||||
| Husky Injection Molding Systems Ltd. +, a | Cash 5.00% + SFvvv | 02/01/24 | 02/01/29 | Senior | 2,475,000 | 2,466,966 | 2,488,266 | |||||||||||||
The accompanying notes are an integral part of these Consolidated Financial Statements.
Partners Group Private Equity (Master Fund), LLC
(a Delaware Limited Liability Company)
Consolidated Schedule of Investments —
June 30, 2025 (Unaudited) (continued)
| Interest | Acquisition Date | Maturity Date | Investment Type | Principal | Cost | Fair Value** | ||||||||||||||
| Private Equity Investments (continued) | ||||||||||||||||||||
| Direct Investments * (continued) | ||||||||||||||||||||
| Direct Debt (continued) | ||||||||||||||||||||
| Ineos Quattro Holdings UK Limited +, a | Cash 4.25% + SF (0.50% Floor)v | 03/07/24 | 01/29/26 | Senior | $ | 3,258,750 | $ | 3,207,681 | $ | 3,069,351 | ||||||||||
| Iris Holdings Inc. +, a | Cash 4.75% + SF (0.50% Floor)vv | 06/15/22 | 06/28/28 | Senior | — | 5,530,632 | 5,632,635 | |||||||||||||
| KCIBT Intermediate II, Inc. +, a | Cash 1.00% + SF (1.00% Floor)vv | 12/23/20 | 06/30/27 | Senior | — | 236 | — | |||||||||||||
| Kene Acquisition, Inc. +, a, e | Cash 5.50% + SF (1.00% Floor)vv | 02/13/24 | 02/07/31 | Senior | 3,941,187 | 3,702,582 | 3,723,635 | |||||||||||||
| Kingpin Intermediate Holdings LLC +, a | Cash 3.50% + SFvv | 10/05/18 | 02/08/28 | Senior | 8,199,534 | 8,175,437 | 8,168,529 | |||||||||||||
| Knowlton Development Corp. Inc. +, a | Cash 4.50% + SFv | 06/24/22 | 12/22/25 | Senior | 1,476,919 | 693 | — | |||||||||||||
| KSLB Holdings, LLC +, a | Cash 8.75% + SF (1.00% Floor)vv | 01/01/21 | 01/26/28 | Second Lien | 3,212,308 | 3,195,163 | 2,814,070 | |||||||||||||
| Lakeshore Learning Materials, LLC +, a | Cash 3.50% + SFv | 06/06/24 | 09/29/28 | Senior | 984,681 | 981,182 | 771,596 | |||||||||||||
| LBM Acquisition, LLC +, a | Cash 3.75% + SFv | 08/02/24 | 06/06/31 | Senior | 9,730,130 | 9,617,205 | 9,289,832 | |||||||||||||
| Magenta Buyer LLC +, a | Cash 1.50% + SFvv; PIK 6.25% | 10/01/24 | 07/27/29 | Senior | — | — | — | |||||||||||||
| Magenta Buyer LLC +, a | Cash 1.50% + SFvv; PIK 5.50% | 10/01/24 | 07/27/29 | Senior | 984,699 | 993,876 | 253,707 | |||||||||||||
| Maverick Bidco, Inc. +, a | Cash 6.75% + SF (0.75% Floor)vv | 05/26/21 | 05/18/29 | Second Lien | 6,603,000 | 6,583,728 | 6,508,115 | |||||||||||||
| Max US BidCo, Inc. +, a | Cash 5.00% + SF (0.50% Floor)vv | 10/11/23 | 10/03/30 | Senior | 4,950,000 | 4,737,508 | 4,923,083 | |||||||||||||
| McAfee Corp. +, a | Cash 3.5% + SFvv | 05/22/24 | 03/01/29 | Senior | 31,489 | 10,306,736 | 9,068,981 | |||||||||||||
| Mitchell International, Inc. +, a | Cash 3.25% + SFv | 06/21/24 | 06/06/31 | Senior | 4,975,000 | 4,940,769 | 4,962,450 | |||||||||||||
| Naked Juice LLC +, a | Cash 3.25% + SF (0.50% Floor)vv | 05/23/24 | 01/24/29 | Senior | 1,979,644 | 311,217 | — | |||||||||||||
| National Mentor Holdings, Inc. +, a | Cash 3.75% + SF (0.75% Floor)vv | 04/26/21 | 03/02/28 | Senior | 1,984,930 | 1,922,986 | 1,930,409 | |||||||||||||
| Nelipak Holding Company +, a, e | Cash 5.50% + SF (1.00% Floor)vv | 04/04/24 | 03/26/31 | Senior | 2,744,904 | 3,400,905 | 3,338,571 | |||||||||||||
| NorthStar Group Services, Inc. +, a | Cash 4.75% + SFvv | 06/05/24 | 05/08/30 | Senior | 2,878,250 | 2,858,769 | 2,891,355 | |||||||||||||
| OceanKey (U.S.) II Corp. +, a | Cash 3.50% + SF (0.05% Floor)vv | 01/06/22 | 12/15/28 | Senior | — | 1,984,951 | 1,998,213 | |||||||||||||
| Oscar AcquisitionCo, LLC +, a, e | Cash 4.50% + SF (0.50% Floor)vv | 02/08/24 | 04/29/29 | Senior | 7,397,324 | 7,459,656 | 6,917,533 | |||||||||||||
| Pactiv Evergreen Inc. +, a | Cash 2.50% + SFv | 06/12/24 | 09/24/28 | Senior | 1,511,789 | 484 | — | |||||||||||||
| Pascal Midco 2, LLC +, a | Cash 5.75% + SF (0.75% Floor)vv | 07/01/22 | 07/21/27 | Senior | 13,438,344 | 13,276,043 | 13,316,000 | |||||||||||||
| PDI TA Holdings, Inc. +, a | Cash 5.50% + SF (0.75% Floor)vv | 02/06/24 | 02/01/31 | Senior | 6,435,871 | 6,381,333 | 6,397,256 | |||||||||||||
| PDI TA Holdings, Inc. +, a, e | Cash 5.50% + SF (0.75% Floor)vv | 02/01/24 | 02/03/31 | Senior | 2,415,447 | 2,696,741 | 2,694,057 | |||||||||||||
| Pediatric Associates Holding Company, LLC +, a, f | Cash 3.25% + SFvv | 08/05/24 | 12/29/28 | Senior | 3,959,184 | 5,279,878 | 4,722,467 | |||||||||||||
| Peraton Corp. +, a | Cash 3.75% + SF (0.75% Floor)v | 04/12/21 | 02/01/28 | Senior | 886,611 | 5,659,216 | 5,337,693 | |||||||||||||
| PetSmart LLC +, a | Cash 3.75% + SF (0.75% Floor)v | 05/22/24 | 02/11/28 | Senior | 5,953,728 | 5,958,304 | 5,912,353 | |||||||||||||
| Pre-Paid Legal Services, Inc. +, a, e | Cash 3.75% + SF (0.50% Floor)v | 01/18/22 | 12/15/28 | Senior | 10,675,568 | 10,680,025 | 10,641,039 | |||||||||||||
The accompanying notes are an integral part of these Consolidated Financial Statements.
Partners Group Private Equity (Master Fund), LLC
(a Delaware Limited Liability Company)
Consolidated Schedule of Investments —
June 30, 2025 (Unaudited) (continued)
| Interest | Acquisition Date | Maturity Date | Investment Type | Principal | Cost | Fair Value** | ||||||||||||||
| Private Equity Investments (continued) | ||||||||||||||||||||
| Direct Investments * (continued) | ||||||||||||||||||||
| Direct Debt (continued) | ||||||||||||||||||||
| Pre-Paid Legal Services, Inc. +, a | Cash 3.75% + SF (0.50% Floor)v | 01/18/22 | 12/14/29 | Senior | $ | — | $ | 318 | $ | — | ||||||||||
| Premier Care Dental Management, LLC +, a, e | Cash 5.25% + SFv | 05/31/24 | 08/05/28 | Senior | 11,873,644 | 5,994,211 | 6,009,141 | |||||||||||||
| Pretium PKG Holdings, Inc. +, a | Cash 6.75% + SF (0.50% Floor)vv | 10/05/21 | 10/01/29 | Second Lien | 1,800,000 | 1,788,906 | 311,634 | |||||||||||||
| Project Boost Purchaser, LLC +, a, e | Cash 3.50% + SFvv | 07/29/24 | 07/16/31 | Senior | — | 1 | — | |||||||||||||
| Project Leopard Holdings, Inc. +, a | Cash 5.25% + SF (0.50% Floor)vv | 06/15/22 | 07/20/29 | Senior | 2,730,384 | 2,564,791 | 1,760,967 | |||||||||||||
| Prometric Holdings PIK, Inc. +, a | Cash 7.50% + SF (1.00% Floor)vv; PIK 9.25% | 10/06/23 | 07/31/28 | Mezzanine | 8,577,963 | 8,699,475 | 8,848,240 | |||||||||||||
| PT Intermediate Holdings III, LLC +, a | Cash 3.25% + SFvv + PIK 1.75% | 04/09/24 | 04/09/30 | Senior | 27,442,289 | 27,386,654 | 27,373,684 | |||||||||||||
| PT Intermediate Holdings III, LLC +, a, e | Cash 6.75% + SFvv + PIK 1.75% | 04/09/24 | 04/09/30 | Senior | 2,729,579 | 572,660 | 572,067 | |||||||||||||
| Radwell Parent, LLC +, a, e | Cash 5.50% + SF (0.75% Floor)vv | 12/01/22 | 04/01/29 | Senior | 1,120,924 | 347,537 | 342,815 | |||||||||||||
| Radwell Parent, LLC +, a | Cash 6.525% + SF (0.75% Floor)vv | 04/06/22 | 04/01/29 | Senior | 13,792,374 | 13,663,965 | 13,792,374 | |||||||||||||
| Radwell Parent, LLC +, a | Cash 6.75% + SF (0.75% Floor)vv | 12/01/22 | 04/01/29 | Senior | 5,851,446 | 5,734,535 | 5,851,446 | |||||||||||||
| Raptor Parent, LLC +, a, e | Cash 6.525% + SF (0.75% Floor)vv | 04/06/22 | 04/01/29 | Senior | 1,522,996 | 1,522,996 | 1,522,996 | |||||||||||||
| Recorded Books Inc. +, a, d | Cash 4.00% + SFv | 06/17/22 | 08/29/25 | Senior | — | 375 | — | |||||||||||||
| Red Planet Borrower, LLC +, a | Cash 3.75% + SF (0.50% Floor)v | 10/04/21 | 10/02/28 | Senior | 6,065,553 | 6,673,415 | 6,763,532 | |||||||||||||
| Redstone Holdco 2 L.P. +, a | Cash 4.75% + SF (0.75% Floor)vv | 05/10/21 | 04/27/28 | Senior | 1,083,705 | 1,079,899 | 1 | |||||||||||||
| Redstone Holdco 2 L.P. +, a, e | Cash 7.75% + SF (0.75% Floor)vv | 05/03/21 | 04/16/29 | Second Lien | 2,500,000 | 2,473,916 | 1 | |||||||||||||
| Riverside Assessments, LLC +, a, e | Cash 5.25% + SFvv | 03/19/24 | 03/19/31 | Senior | 2,683,067 | 2,904,571 | 2,905,991 | |||||||||||||
| RL Datix Holdings (USA), Inc. +, a | Cash 5.50% + SFvvv | 04/25/24 | 04/30/31 | Senior | 2,399,040 | 2,356,881 | 2,370,911 | |||||||||||||
| Rocket Software, Inc. +, a | Cash 4.25% + SF (0.00% Floor)v | 12/05/18 | 11/28/28 | Senior | — | 68 | — | |||||||||||||
| Rough Country, LLC +, a | Cash 3.50% + SF (0.75% Floor)v | 08/03/21 | 07/26/28 | Senior | 1,833,197 | 1,816,298 | 1,785,518 | |||||||||||||
| Ryan, LLC +, a, e | Cash 4.50% + SF (0.50% Floor)v | 11/20/23 | 11/14/30 | Senior | 4,031,585 | 3,993,360 | 4,041,986 | |||||||||||||
| Sabre GLBL Inc. +, a | Cash 3.50% + SF (0.50% Floor)v | 08/09/21 | 12/17/27 | Senior | — | 49 | — | |||||||||||||
| Sandvine Corporation +, a | Cash 1.00% + SFvv; PIK 5.00% | 03/03/25 | 03/01/30 | Senior | 593,695 | 557,209 | 534,325 | |||||||||||||
| Sedgwick Claims Management Services, Inc. +, a | Cash 3.75% + SFvv | 08/09/24 | 02/24/28 | Senior | 1,741,250 | 8,391,938 | 8,462,141 | |||||||||||||
| Senneca Holdings, Inc. +, a | PIK 10.00% | 01/01/21 | 11/11/25 | 1.5 Lien | 1,515,278 | 1,509,733 | 395,365 | |||||||||||||
| Senneca Holdings, Inc. +, a | PIK 11.00% | 01/01/21 | 05/11/26 | Second Lien | — | — | 2 | |||||||||||||
| Senneca Holdings, Inc. +, a, d | PIK 11.00% | 01/01/21 | 05/11/26 | Second Lien | 1,276,647 | 1,267,187 | 1 | |||||||||||||
| Sound Inpatient Physicians, Inc +, a | Cash 3.5% + SFv | 07/01/24 | 06/28/28 | Senior | 1,000,422 | 3,788,855 | 4,830,736 | |||||||||||||
| Sound Inpatient Physicians, Inc. +, a | Cash 5.50% + SF (1.00% Floor)vv | 06/04/24 | 06/28/28 | Senior | 578,825 | 551,584 | 605,010 | |||||||||||||
| SS&C Technologies, Inc. +, a | Cash 2.00% + SFv | 05/14/24 | 04/29/31 | Senior | 3,405,337 | 3,374,841 | 3,396,170 | |||||||||||||
| Tank Holding Corp. +, a, e | Cash 5.75% + SF (0.75% Floor)vv | 04/11/22 | 03/31/28 | Senior | 20,899,620 | 20,669,790 | 19,931,900 | |||||||||||||
The accompanying notes are an integral part of these Consolidated Financial Statements.
Partners Group Private Equity (Master Fund), LLC
(a Delaware Limited Liability Company)
Consolidated Schedule of Investments —
June 30, 2025 (Unaudited) (continued)
| Interest | Acquisition Date | Maturity Date | Investment Type | Principal | Cost | Fair Value** | ||||||||||||||
| Private Equity Investments (continued) | ||||||||||||||||||||
| Direct Investments * (continued) | ||||||||||||||||||||
| Direct Debt (continued) | ||||||||||||||||||||
| Telenet Financing USD LLC +, a | Cash 2.00% + SFv | 04/27/20 | 04/30/28 | Senior | $ | 5,400,000 | $ | 5,308,502 | $ | 5,311,116 | ||||||||||
| Tivity Health Inc +, a | Cash 6.00% + SF (0.75% Floor)vv | 06/28/22 | 06/28/29 | Senior | 20,388,166 | 20,239,765 | 20,272,374 | |||||||||||||
| Tory Burch LLC +, a | Cash 3.50% + SF (0.50% Floor)v | 04/30/21 | 04/16/28 | Senior | 962,500 | 955,626 | 962,880 | |||||||||||||
| Trilon Group, LLC +, a, e | Cash 6.25% + SF (0.75% Floor)vv | 06/02/22 | 05/27/29 | Senior | 5,119,570 | 5,533,158 | 5,605,141 | |||||||||||||
| Trilon Group, LLC +, a | Cash 6.25% + SF (0.75% Floor)vv | 06/02/22 | 05/27/29 | Senior | 5,106,609 | 5,045,906 | 5,125,999 | |||||||||||||
| Upstream Newco, Inc. +, a | Cash 4.25% + SFvv | 08/04/21 | 11/20/26 | Senior | 6,125,783 | 6,019,306 | 4,819,162 | |||||||||||||
| Utz Quality Foods, LLC +, a | Cash 3.00% + SFvv | 01/29/21 | 01/20/28 | Senior | 2,932,943 | 2,929,923 | 2,936,609 | |||||||||||||
| Verde Purchaser, LLC +, a | Cash 4.125% | 05/02/24 | 11/15/28 | Senior | 356,000 | 4,735,677 | 4,838,882 | |||||||||||||
| Verde Purchaser, LLC +, a | Cash 4.50% + SFvv | 05/10/24 | 11/30/30 | Senior | 6,666,500 | 6,661,904 | 6,693,638 | |||||||||||||
| Virgin Media Bristol LLC +, a | 2.50% + SFv | 05/06/25 | 01/31/28 | Senior | 5,500,000 | 5,498,686 | 5,471,180 | |||||||||||||
| White Cap Supply Holdings, LLC +, a | Cash 3.25% + SFv | 06/06/24 | 10/19/29 | Senior | 4,577,000 | 4,570,614 | 4,565,466 | |||||||||||||
| YI Group Midco, LLC +, a, e | Cash 5.75% + SF (1.00% Floor)v | 12/01/23 | 12/01/29 | Senior | 6,053,284 | 5,943,114 | 5,832,528 | |||||||||||||
| Total North America (3.79%) | 606,153,780 | |||||||||||||||||||
| Rest of World (0.04%) | ||||||||||||||||||||
| AI Sirona (Luxembourg) Acquisition S.à.r.l. +, a | Cash 5.00% + E# | 05/17/24 | 09/30/28 | Senior | 5,437,714 | 5,448,090 | 5,887,618 | |||||||||||||
| Total Rest of World (0.04%) | 5,887,618 | |||||||||||||||||||
| Western Europe (2.05%) | ||||||||||||||||||||
| AD Education +, a | PIK 8.50% | 06/21/22 | 03/30/29 | Mezzanine | 16,736,735 | 16,660,045 | 18,275,098 | |||||||||||||
| Alloheim Senioren-Residenzen AG +, a | Cash 5.00% + E# | 04/16/25 | 05/19/28 | Senior | 1,296,982 | 1,092,728 | 1,337,393 | |||||||||||||
| Anticimex Global AB +, a | Cash 3.40% + SFvv | 06/18/24 | 11/16/28 | Senior | 8,552,267 | 5,651,229 | 5,685,100 | |||||||||||||
| Asgard Investments B.V. +, a | Cash 5.50% + E## | 03/15/22 | 03/15/29 | Senior | 13,721,320 | 13,532,108 | 14,666,751 | |||||||||||||
| Aston Finco S.à.r.l. +, a | Cash 4.25% + SFv | 11/14/19 | 10/09/26 | Senior | 1,558,774 | 1,555,379 | 1,509,096 | |||||||||||||
| Aston Finco S.à.r.l. +, a | Cash 8.25% + S> | 10/25/19 | 10/09/27 | Second Lien | 36,733,592 | 36,325,484 | 36,131,679 | |||||||||||||
| Athena BidCo GmbH +, a | Cash 2.75% + E### | 05/22/24 | 03/31/27 | Senior | 264,895 | 4,631 | — | |||||||||||||
| Barentz Midco B.V. +, a | Cash 3.25% + SFvv | 04/29/24 | 03/30/31 | Senior | 2,189,000 | — | 1 | |||||||||||||
| Biscuit Holding S.A.S +, a, e | Cash 4.00% + E### | 06/03/24 | 02/12/27 | Senior | 4,325,208 | 4,101,138 | 4,581,396 | |||||||||||||
| BME Group Holding B.V. +, a | Cash 4.75% + E## | 03/22/24 | 10/30/26 | Senior | 39,824 | 4,160,413 | 4,274,670 | |||||||||||||
| CAB +, a | Cash 3.50% + E## | 06/12/24 | 02/09/28 | Senior | 7,463,202 | 7,284,091 | 7,838,561 | |||||||||||||
| CEP V Investment 22 S.à.r.l. (Lux) +, a | PIK 8.25% + E### | 02/28/22 | 08/31/30 | Mezzanine | 1,119,808 | — | — | |||||||||||||
| Constellation BidCo GmbH +, a | Cash 5.25% + E## | 10/26/22 | 06/27/29 | Senior | 26,760,488 | 26,333,447 | 31,092,353 | |||||||||||||
| Constellation HoldCo GmbH +, a, e | Cash 5.15% + E## | 08/08/24 | 08/08/31 | Senior | 1,110,043 | 1,100,935 | 1,165,963 | |||||||||||||
| CTEC III GmbH +, a | Cash 3.50% + E## | 03/29/18 | 03/16/29 | Senior | 14,847,781 | 14,567,197 | 14,926,545 | |||||||||||||
| DataCo AcquiCo GmbH +, a | Cash 6.00% + E## | 01/26/24 | 01/31/31 | Senior | 2,580,666 | 2,549,231 | 2,746,404 | |||||||||||||
| DataCo AcquiCo GmbH +, a | Cash 6.00% + E### | 01/26/24 | 01/31/31 | Senior | 6,892,466 | 6,731,992 | 7,360,364 | |||||||||||||
| Dorna Sports, S.L. +, a | Cash 3.25% + E### | 06/25/24 | 03/30/29 | Senior | 5,374,619 | 5,397,491 | 5,880,108 | |||||||||||||
| Europa University Education Group +, a | Cash 3.75% + E### | 06/13/24 | 06/13/31 | Senior | 3,300,000 | 3,554,594 | 3,890,204 | |||||||||||||
| Financiere Astek +, a, e | Cash 6.50% + E## | 04/25/24 | 04/25/31 | Senior | 2,722,290 | 2,679,777 | 2,896,423 | |||||||||||||
| Financiere Astek +, a | Cash 6.50% + E## | 04/25/24 | 04/25/31 | Senior | 6,333,943 | 6,159,759 | 6,916,876 | |||||||||||||
| Financière Mendel +, a | Cash 3.25% + SFvv | 12/06/23 | 11/12/30 | Senior | — | 1 | — | |||||||||||||
| Fusilli AcquiCo S.à.r.l. +, a | Cash 5.25% + E### | 01/27/22 | 04/12/26 | Senior | 6,845,735 | 6,567,424 | 7,153,143 | |||||||||||||
| Grupo Iberica de Congelados, SA +, a | Cash 7.12% + E### | 06/28/19 | 11/30/27 | Senior | 450,931 | 445,106 | 397,964 | |||||||||||||
| Grupo Iberica de Congelados, SA +, a | Cash 7.75% + E## | 06/28/19 | 11/30/27 | Senior | 503,895 | 496,933 | 444,707 | |||||||||||||
| Gulfstream Bidco AS +, a | Cash 4.5% + SFvv | 01/19/24 | 01/17/31 | Senior | 2,757,000 | 2,722,537 | 2,733,199 | |||||||||||||
The accompanying notes are an integral part of these Consolidated Financial Statements.
Partners Group Private Equity (Master Fund), LLC
(a Delaware Limited Liability Company)
Consolidated Schedule of Investments —
June 30, 2025 (Unaudited) (continued)
| Interest | Acquisition Date | Maturity Date | Investment Type | Principal | Cost | Fair Value** | ||||||||||||||
| Private Equity Investments (continued) | ||||||||||||||||||||
| Direct Investments * (continued) | ||||||||||||||||||||
| Direct Debt (continued) | ||||||||||||||||||||
| Gulfstream Bidco AS +, a | Cash 5.00% + SFvv | 01/19/24 | 01/19/31 | Senior | $ | 3,847,647 | $ | 3,597,724 | $ | 3,644,265 | ||||||||||
| Gulfstream Bidco AS +, a | Cash 5.0% + SFvv | 04/14/25 | 01/23/31 | Senior | 1,296,982 | 2,431,674 | 2,459,879 | |||||||||||||
| HomeVi SAS +, a | Cash 3.25% + E## | 05/10/24 | 10/31/26 | Senior | 4,817,846 | 9,884,332 | 11,560,174 | |||||||||||||
| Hunter Holdco 3 Limited +, a, e | Cash 4.25% + SF (0.50% Floor)vv | 08/26/21 | 08/19/28 | Senior | 10,285,188 | 10,227,946 | 9,925,206 | |||||||||||||
| Ineos Quattro Holdings UK Limited +, a | Cash 3.75% + SFv | 03/17/23 | 03/01/30 | Senior | 1,960,000 | 1,945,749 | 1,804,023 | |||||||||||||
| Infinity Bidco 1 Limited +, a | Cash 3.40% + E# | 07/03/24 | 07/06/28 | Senior | 3,241,938 | 3,240,320 | 3,527,713 | |||||||||||||
| Nobel Bidco B.V. +, a | Cash 3.50% + E### | 06/12/24 | 09/01/28 | Senior | 5,423,992 | 5,390,734 | 5,855,291 | |||||||||||||
| Nord Anglia Education PLC +, a | PIK 10.50% | 01/13/25 | 01/13/33 | Mezzanine | 11,463,751 | 390,021 | 11,441,744 | |||||||||||||
| Nouryon Finance B.V. +, a | Cash 3.50% + E## | 06/20/24 | 04/03/28 | Senior | 33,194 | 2,100,000 | 2,475,757 | |||||||||||||
| PEARLS (Netherlands) Bidco B.V. +, a | Cash 4.00% + SFvvv | 03/30/22 | 03/01/29 | Senior | 2,439,279 | 2,429,183 | 2,442,718 | |||||||||||||
| PEARLS (Netherlands) Bidco B.V. +, a | Cash 4.00% + E## | 06/06/24 | 02/26/29 | Senior | 7,940,783 | 7,639,704 | 8,207,018 | |||||||||||||
| Piolin II S.à.r.l. +, a | Cash 4.50% + E### | 06/11/24 | 09/16/29 | Senior | 10,240,413 | 7,980,248 | 8,875,709 | |||||||||||||
| Planet US Buyer LLC +, a | Cash 3.50% + SFvv | 02/20/24 | 02/07/31 | Senior | 2,878,250 | 2,864,988 | 2,887,881 | |||||||||||||
| Rainbow Jvco Ltd. +, a | Cash 7.25% + E##; PIK 7.25% | 02/24/22 | 02/24/30 | Mezzanine | 212,930 | 4,179 | — | |||||||||||||
| Rainbow UK Holdco Limited +, a | Cash 3.75% + E### | 05/31/24 | 02/26/29 | Senior | 11,935,918 | 11,947,094 | 12,883,318 | |||||||||||||
| RC Acquisition II B.V. +, a | Cash 6.25% + E## | 12/19/23 | 12/18/30 | Senior | 9,234,378 | 9,023,518 | 9,610,293 | |||||||||||||
| Sevetys Invest +, a, e | Cash 6.25% + E## | 12/16/22 | 08/03/29 | Senior | 17,686,276 | 17,371,604 | 19,171,871 | |||||||||||||
| Sigma Holdco B.V. +, a | Cash 4.25% + SFvvv | 08/26/24 | 01/03/28 | Senior | 2,970,266 | 4,051,195 | 4,051,195 | |||||||||||||
| Skywalker BidCo GmbH +, a | Cash 6.00% + E## | 12/20/23 | 12/20/30 | Senior | 2,225,494 | 2,198,269 | 2,410,064 | |||||||||||||
| Skywalker BidCo GmbH +, a | Cash 6.00% + E### | 12/20/23 | 12/20/30 | Senior | 6,537,633 | 6,395,326 | 6,968,637 | |||||||||||||
| Virgin Media Bristol LLC +, a | Cash 3.25% + SFv | 06/25/24 | 01/31/29 | Senior | 10,000,000 | 9,963,546 | 9,978,400 | |||||||||||||
| Ziggo Financing Partnership +, a | Cash 2.50% + SFv | 02/27/20 | 04/30/28 | Senior | 6,000,000 | 6,030,115 | 5,897,220 | |||||||||||||
| Total Western Europe (2.05%) | 327,982,374 | |||||||||||||||||||
| Total Direct Debt (6.17%) | $ | 974,409,729 | $ | 986,506,361 | ||||||||||||||||
| Total Direct Investments (63.25%) | $ | 7,293,816,694 | $ | 10,109,032,173 | ||||||||||||||||
| Secondary Investments *, c (16.89%) | Acquisition Date | Cost | Fair Value | |||||||
| Asia - Pacific (1.30%) | ||||||||||
| Affinity Asia Pacific Fund IV (No.2) L.P. +, a, e | 09/30/24 | $ | 2,284,329 | $ | 4,649,814 | |||||
| Archer Capital Fund 5 +, a, e | 09/30/24 | 1 | 59,144 | |||||||
| Bain Capital Asia Fund II, L.P. +, a, e | 03/31/25 | 455,319 | 946,298 | |||||||
| Baring Asia Private Equity Fund IV, L.P. +, a, e | 11/24/09 | 5,345 | 1 | |||||||
| Carlyle Asia Partners IV, L.P. +, a, e | 12/31/24 | 635,001 | 866,591 | |||||||
| Carlyle Asia Partners V, L.P. +, a, e | 12/31/24 | 2,094,748 | 1,767,259 | |||||||
| Crescent Capital Partners IV, LP +, a, e | 09/30/24 | 200,112 | 109,346 | |||||||
| CVC Capital Partners Asia Pacific III, L.P. +, a, e | 01/11/13 | 1,258,462 | 246,272 | |||||||
| CVC Capital Partners Asia Pacific IV, L.P. +, a, e | 12/31/24 | 1,445,497 | 1,812,020 | |||||||
| Hony Capital Fund VIII (Cayman), L.P. +, a, e | 12/31/24 | 767,204 | 1,089,432 | |||||||
| KKR Asian Fund III L.P. +, a, e | 12/31/24 | 372,023 | 445,903 | |||||||
| KV Asia Capital Fund I L.P. +, a, e | 09/30/24 | 104,571 | 981,099 | |||||||
| MBK Partners Colonel Fund, L.P. +, a, e | 09/20/21 | 47,367,427 | 77,268,542 | |||||||
| Navis Asia Fund VII, L.P. +, a, e | 03/31/25 | 10,362,003 | 16,041,261 | |||||||
| North Haven Private Equity Asia III, L.P. +, a, e | 03/31/25 | 1 | 370,393 | |||||||
| Primavera Capital Fund III L.P. +, a, e | 12/31/24 | 1,139,379 | 1,247,781 | |||||||
| The Baring Asia Private Equity Fund VII, L.P. +, a, e | 03/31/24 | 4,719,912 | 5,691,094 | |||||||
The accompanying notes are an integral part of these Consolidated Financial Statements.
Partners Group Private Equity (Master Fund), LLC
(a Delaware Limited Liability Company)
Consolidated Schedule of Investments —
June 30, 2025 (Unaudited) (continued)
| Acquisition Date | Cost | Fair Value | ||||||||
| Private Equity Investments (continued) | ||||||||||
| Secondary Investments *, c (continued) | ||||||||||
| Asia - Pacific (continued) | ||||||||||
| Tiara CG Private Equity Fund 2017, L.P. +, a, e | 03/31/25 | $ | 7,037,359 | $ | 11,941,787 | |||||
| Tiara CG Private Equity Fund 2019, L.P. +, a, e | 03/31/25 | 16,187,760 | 22,441,891 | |||||||
| Tiara CG Private Equity Fund 2019S, L.P. +, a, e | 03/31/25 | 5,423,912 | 7,456,211 | |||||||
| TPG Asia VII (B), L.P. +, a, e | 12/07/18 | 7,909,741 | 17,361,090 | |||||||
| TRG Growth Partnership (Offshore) II, L.P. +, a, e | 08/02/10 | 1 | 10,342 | |||||||
| TRG Growth Partnership (Offshore), L.P. +, a, e | 08/02/10 | 46,978 | 1 | |||||||
| TRG Growth Partnership II, L.P. +, a, e | 07/08/10 | 1 | 8,038 | |||||||
| Warburg Pincus China L.P. +, a | 12/31/24 | 1,459,768 | 1,629,521 | |||||||
| Yunfeng Capital Fund III, L.P. +, a, e | 05/18/21 | 31,458,156 | 28,723,467 | |||||||
| Yunfeng Capital Fund IV, L.P. +, a, e | 05/31/21 | 5,461,757 | 5,086,141 | |||||||
| Total Asia - Pacific (1.30%) | 208,250,739 | |||||||||
| North America (11.35%) | ||||||||||
| Abingworth Bioventures V, L.P. +, a, e | 06/30/12 | 1,760 | 1 | |||||||
| ACP Investment Fund, L.P. +, a | 09/30/24 | 83,355 | 132,245 | |||||||
| APH Extended Value Fund H LP (US) +, a, e | 12/13/24 | 33,157,420 | 36,732,950 | |||||||
| Apollo Investment Fund IX, L.P. +, a, e | 01/01/25 | 793,231 | 957,115 | |||||||
| Apollo Investment Fund VI, L.P. +, a, e | 01/01/25 | 219,534 | 315,614 | |||||||
| Apollo Investment Fund VII, L.P. +, a, e | 07/01/10 | 60,993 | 1 | |||||||
| Apollo Overseas Partners (Delaware) VII, L.P. +, a, e | 10/01/09 | 1 | 1 | |||||||
| Ardian Co-Investment Fund IV +, a, e | 12/31/24 | 3,545,824 | 5,572,897 | |||||||
| Ares Corporate Opportunities Fund V, L.P. +, a, e | 01/01/25 | 1,449,927 | 1,718,333 | |||||||
| Ares PE Extended Value Fund, L.P. +, a, e | 11/14/19 | 24,017,734 | 37,987,576 | |||||||
| Arroyo Investors Fund IV, L.P. +, a, e | 02/25/25 | 4,498,160 | 4,871,291 | |||||||
| ASP SEC Exchange Fund II LP +, a, e | 09/30/24 | 6,068,544 | 9,518,978 | |||||||
| August Capital V Special Opportunities, L.P. +, a, e | 10/01/24 | 71,291 | 71,849 | |||||||
| Avenue Golden Continuation Fund PV, L.P. +, a, e | 04/26/22 | 2 | 10,600,000 | |||||||
| Bain Capital Fund VII, L.P. +, a | 12/31/24 | 462,822 | 721,269 | |||||||
| Bain Capital Fund X, L.P. +, a, e | 06/30/11 | 471,221 | 3,540,726 | |||||||
| Bain Capital Fund XI, L.P. +, a, e | 12/31/24 | 398,358 | 468,882 | |||||||
| Bain Capital Fund XII, L.P. +, a, e | 12/31/24 | 754,937 | 1,125,574 | |||||||
| Bain Capital Venture Fund 2009, L.P. +, a, e | 09/30/24 | 1 | 61,655 | |||||||
| Bain Capital Venture Fund 2012, L.P. +, a | 09/30/24 | 1,419,228 | 1,858,301 | |||||||
| Bain Capital VIII Coinvestment Fund, L.P. +, a, e | 12/31/15 | 282 | 1 | |||||||
| BC X Private Investors, L.P. +, a, e | 12/31/24 | 327,077 | 452,279 | |||||||
| BC XI Private Investor, L.P. +, a, e | 12/31/24 | 996,001 | 1,302,960 | |||||||
| Berkshire Fund VIII, L.P. +, a, e | 09/03/21 | 1 | 10,647,740 | |||||||
| Berkshire Fund VIII, L.P. +, a, e | 09/30/24 | 39,775 | 567,000 | |||||||
| Berkshire Fund X-A, L.P. +, a, e | 09/03/21 | 19,344,684 | 22,697,098 | |||||||
| Bertram Growth Capital II-A, L.P. +, a, e | 09/30/15 | 1 | 1 | |||||||
| Birch Hill Equity Partners (US) IV, LP +, a, e | 01/13/25 | 1 | 172,020 | |||||||
| Blackstone Capital Partners IV, L.P. +, a, e | 03/31/25 | 7,263 | 11,465 | |||||||
| Blackstone Capital Partners V, L.P. +, a, e | 03/31/25 | 256 | 10,851 | |||||||
| Blackstone Capital Partners V-S, L.P. +, a, e | 03/31/25 | — | 1 | |||||||
| Blackstone Capital Partners VIII +, a, e | 03/31/25 | 2,084,820 | 1,913,071 | |||||||
| BSI II Graduate Co-Invest I L.P. +, a, e | 05/29/25 | 36,342,779 | 49,008,201 | |||||||
| Carlyle Partners V, L.P. +, a, e | 12/31/24 | 416,540 | 350,113 | |||||||
| Carlyle Partners VII, L.P. +, a, e | 03/31/24 | 39,123,042 | 50,363,677 | |||||||
| Carlyle Partners VIII, L.P. +, a, e | 03/10/23 | 4,036,335 | 5,390,360 | |||||||
| Carlyle Syniverse Co-Investment, L.P. +, a | 12/31/24 | 105,536 | 97,310 | |||||||
| CCMP Capital Investors III, L.P. +, a, e | 12/31/24 | 7,517 | 12,537 | |||||||
| Centerbridge Seaport Acquisition Fund, L.P. +, a, e | 05/12/22 | 27,422 | 139,753 | |||||||
| Clayton, Dubilier & Rice Fund VIII, L.P. +, a, e | 03/29/12 | 2 | 2 | |||||||
The accompanying notes are an integral part of these Consolidated Financial Statements.
Partners Group Private Equity (Master Fund), LLC
(a Delaware Limited Liability Company)
Consolidated Schedule of Investments —
June 30, 2025 (Unaudited) (continued)
| Acquisition Date | Cost | Fair Value | ||||||||
| Private Equity Investments (continued) | ||||||||||
| Secondary Investments *, c (continued) | ||||||||||
| North America (continued) | ||||||||||
| Clayton, Dubilier & Rice Fund X, L.P. +, a, e | 12/31/24 | $ | 797,604 | $ | 1,025,701 | |||||
| Cortec Group Fund V, L.P. +, a, e | 09/30/24 | 1 | 106 | |||||||
| Court Square Capital Partners V +, a, e | 12/20/24 | — | — | |||||||
| DST Opportunities Access Offshore L.P. +, a, e | 09/30/20 | 1 | 9,301,003 | |||||||
| ECP Terra-Gen Growth Fund, L.P. +, a, e | 03/23/21 | 1 | 62,947 | |||||||
| EETF Sidecar, L.P. +, a, e | 04/30/21 | 72,245 | 5,641,919 | |||||||
| EnCap Energy Co-Investment Fund I-C, L.P. +, a, e | 04/30/21 | 2,311 | 780,154 | |||||||
| EnCap Energy Transition Fund I, L.P. +, a, e | 04/30/21 | 102,336 | 1,854,323 | |||||||
| Energy Capital Partners Credit Solutions II, L.P. +, a, e | 02/03/21 | 2,083,512 | 2,630,159 | |||||||
| Energy Capital Partners III, L.P. +, a, e | 02/01/21 | 1 | 4,999,188 | |||||||
| Fengate Everest Continuation Fund L.P. +, a, e, d | 06/17/24 | 20,843,716 | 28,382,523 | |||||||
| FFL Capital Partners IV +, a, e | 12/31/24 | 744,428 | 1,134,090 | |||||||
| FFL Parallel Fund CF, L.P. +, a, e | 12/31/24 | 3,573,994 | 5,273,739 | |||||||
| Frazier Healthcare VI, L.P. +, a | 06/30/12 | 1 | 1 | |||||||
| FS Equity Partners V, L.P. +, a, e | 08/07/12 | 204,488 | — | |||||||
| FullBloom +, a | 07/17/19 | 234,811 | 1 | |||||||
| GA Continuity Fund I L.P. (Bermuda) +, a, e | 06/30/21 | 65,737,481 | 92,891,333 | |||||||
| General Atlantic Investment Partners 2021, L.P. +, a, e | 07/02/21 | 9,047,653 | 9,802,517 | |||||||
| General Atlantic Investment Partners 2023, L.P. +, a, e | 12/01/22 | 2,970,827 | 3,260,379 | |||||||
| Genstar Capital Partners IX, L.P. +, a, e | 03/31/24 | 2,239,158 | 2,833,699 | |||||||
| Genstar Capital Partners V, L.P. +, a, e | 09/30/15 | 1 | 1 | |||||||
| Genstar IX Opportunities Fund I +, a, e | 03/31/24 | 1,187,451 | 1,444,969 | |||||||
| Gores Capital Partners III, L.P. +, a, e | 01/01/25 | 41,404 | 146,814 | |||||||
| Green Equity Investors Side CF, L.P. +, a, e | 04/16/21 | 19,775,525 | 46,822,787 | |||||||
| Gridiron Energy Feeder I, L.P. +, a, e | 05/15/17 | 18,635,379 | 55,977,939 | |||||||
| Gridiron Energy, LLC +, a | 10/01/24 | 11,956,199 | 28,852,557 | |||||||
| Gryphon Partners 3.5, L.P. +, a, e | 05/21/13 | 1 | 66,852 | |||||||
| Gryphon Partners IV L.P. +, a, e | 02/08/16 | 116,996 | 13,883,744 | |||||||
| H.I.G. Bayside Debt & LBO Fund II, L.P. +, a, e | 12/30/10 | 1 | 89,356 | |||||||
| Icon Partners IV, L.P. +, a, e | 05/26/21 | 33,752,699 | 37,200,436 | |||||||
| Icon Partners V, L.P. +, a, e | 12/27/21 | 75,612,686 | 102,429,958 | |||||||
| Index Ventures Life VI (Jersey), L.P. +, a, e | 09/30/24 | 345,231 | 532,705 | |||||||
| Insight Venture Partners Continuation Fund, L.P. +, a, e | 09/09/19 | 14,163,763 | 51,620,585 | |||||||
| Insight Venture Partners X, L.P. (Project Solace) +, a, e | 04/01/25 | 9,990,546 | 12,520,413 | |||||||
| Investcorp Technology Partners III (Cayman), L.P. +, a, e | 08/19/11 | 1 | 1 | |||||||
| J.C. Flowers III-B L.P. +, a, e | 12/31/24 | 24,111 | 40,449 | |||||||
| J.C. Flowers IV L.P. +, a, e | 12/31/24 | 735,925 | 914,950 | |||||||
| JVP International 2019E, L.P. +, a | 12/31/24 | 1,135,156 | 2,083,692 | |||||||
| JVP Media V, L.P. +, a | 12/31/24 | 704,405 | 882,770 | |||||||
| JVP VII Opportunity, L.P. +, a, e | 12/31/24 | 3,055,335 | 4,518,780 | |||||||
| KKR Americas Fund XII (EEA) L.P. +, a, e | 12/31/24 | 1,579,705 | 2,375,821 | |||||||
| KKR Associates Indigo Equity Partners, L.P. +, a | 06/09/22 | 123,149,784 | 140,385,827 | |||||||
| KSL Capital Partners CV I, L.P. +, a, e | 05/23/22 | 35,822,715 | 64,882,353 | |||||||
| Lee Equity Partners II, L.P. +, a, e | 06/30/17 | 62,679 | 2,473,549 | |||||||
| Lee Equity Partners Realization Fund, L.P. +, a | 06/30/17 | 1 | 2,475,617 | |||||||
| LEP Captive Co-Invest II, L.P. +, a | 07/01/22 | 13,746,296 | 19,713,879 | |||||||
| LS Power Equity Partners III Feeder 1, L.P. +, a, e | 01/01/25 | 5,899,032 | 9,060,984 | |||||||
| Madison Dearborn Capital Partners V, L.P. +, a, e | 03/31/11 | 4 | 4 | |||||||
| Madison Dearborn Capital Partners VIII, L.P. +, a, e | 03/15/21 | 7,981,415 | 10,562,692 | |||||||
| Mainsail Partners III, L.P. +, a, e | 09/30/24 | 346,868 | 231,899 | |||||||
| Marlin Equity III, L.P. +, a, e | 09/30/24 | 24,892 | 29,006 | |||||||
| MidOcean Partners III, L.P. +, a, e | 06/30/11 | 1 | 1 | |||||||
| MidOcean Partners V, L.P. +, a, e | 12/31/24 | 1,233,084 | 1,412,723 | |||||||
The accompanying notes are an integral part of these Consolidated Financial Statements.
Partners Group Private Equity (Master Fund), LLC
(a Delaware Limited Liability Company)
Consolidated Schedule of Investments —
June 30, 2025 (Unaudited) (continued)
| Acquisition Date | Cost | Fair Value | ||||||||
| Private Equity Investments (continued) | ||||||||||
| Secondary Investments *, c (continued) | ||||||||||
| North America (continued) | ||||||||||
| Monomoy Capital Partners II, L.P. +, a, e | 09/30/15 | $ | 13,021 | $ | 126,579 | |||||
| New Enterprise Associates 14, L.P. +, a, e | 10/01/24 | 3,750,356 | 5,498,743 | |||||||
| New Enterprise Associates 17, L.P. +, a, e | 09/30/20 | 5,902,708 | 7,279,025 | |||||||
| New Mountain Capital V, L.P. +, a, e | 12/31/24 | 336,332 | 423,673 | |||||||
| NewView Capital Fund I, L.P. +, a, e | 01/01/25 | 8,657,632 | 9,177,531 | |||||||
| NGP Natural Resources X, L.P. +, a, e | 09/30/24 | 192,667 | 275,780 | |||||||
| Northgate Growth Fund, L.P. +, a | 12/20/19 | 6,880,500 | 9,360,446 | |||||||
| Northlane Capital Partners II LP +, a, e | 12/31/24 | 2,173,012 | 2,763,094 | |||||||
| NVP VIII PG, L.P. +, a, e | 05/31/19 | 41,920,638 | 91,581,293 | |||||||
| Oaktree Opportunities Fund Xb, L.P. +, a, e | 01/01/25 | 2,803,118 | 1,671,559 | |||||||
| Onex Partners V LP +, a, e | 12/31/24 | 1,827,005 | 2,270,523 | |||||||
| Overbay Capital Partners 2024 Fund Aggregator (AIV IV) LP +, a, e | 12/31/24 | 14,549,760 | 20,628,883 | |||||||
| Overbay Capital Partners 2024 Fund Offshore LP +, a, e | 12/31/24 | 13,839,281 | 16,100,592 | |||||||
| Palladium Equity Partners III, L.P. +, a, e | 08/02/10 | 1 | 1 | |||||||
| Performance Direct Investments V, L.P. +, a, e | 05/01/25 | 1,660,718 | 1,660,718 | |||||||
| Performance Venture Capital Reinvestment Fund, L.P. +, a, e | 03/12/25 | 66,182,820 | 92,578,051 | |||||||
| Performance Venture Capital VI, L.P. +, a, e | 04/18/25 | 1,462,739 | 1,462,739 | |||||||
| PlayCore CV, L.P. +, a, e | 11/21/24 | 18,658,615 | 24,111,054 | |||||||
| Providence Equity Partners IV, L.P. +, a, e | 01/01/25 | 1 | 8,915 | |||||||
| Providence Equity Partners V, L.P. +, a, e | 06/30/11 | 404,780 | — | |||||||
| Providence Equity Partners VI -A, L.P. +, a, e | 01/01/25 | 14,673 | 15,306 | |||||||
| Providence Equity Partners VI-A, L.P. +, a, e | 06/30/13 | 2 | 4,319 | |||||||
| Providence Equity Partners VII-A, L.P. +, a, e | 06/30/13 | 1 | 1 | |||||||
| PT2, L.P. +, a, e | 12/21/21 | 9,302,852 | 12,520,290 | |||||||
| Redpoint Omega II, L.P. +, a | 09/30/24 | 1,271,287 | 2,454,943 | |||||||
| Redpoint Ventures IV, L.P. +, a | 09/30/24 | 532,193 | 533,367 | |||||||
| Revelstoke EPIC Fund I, L.P. +, a, e | 11/20/19 | 44,353,234 | 66,487,050 | |||||||
| Riverstone Global Energy and Power Fund VI, L.P. +, a, e | 01/01/25 | 837,511 | 729,466 | |||||||
| RoundTable Healthcare Partners III, L.P. +, a, e | 09/30/24 | 388,157 | 908,098 | |||||||
| Samson Partners, L.P. +, a, e | 12/21/20 | 31,364,096 | 55,273,887 | |||||||
| SCP Dragon, L.P. +, a | 06/16/25 | 3,891,463 | 3,891,463 | |||||||
| SCP Shield, L.P. +, a | 06/16/25 | 1,881,276 | 1,881,276 | |||||||
| Sigma Partners 6, L.P. +, a | 09/30/24 | 379,874 | 654,066 | |||||||
| Sigma Partners 7, L.P. +, a | 09/30/24 | 211,205 | 177,281 | |||||||
| Sigma Partners 8, L.P. +, a | 09/30/24 | 366,206 | 653,017 | |||||||
| Silver Lake Partners III, L.P. +, a, e | 03/31/13 | 4 | 839,567 | |||||||
| Silver Lake Partners V, L.P. +, a, e | 03/31/24 | 6,940,605 | 10,526,747 | |||||||
| Silver Lake Partners VI, L.P. +, a, e | 09/30/22 | 39,682,475 | 44,240,361 | |||||||
| SL SPV-1, L.P. +, a | 12/01/17 | 116,072 | 5 | |||||||
| SL SPV-2, L.P. +, a | 06/30/10 | 4 | 6,502,561 | |||||||
| Springcoast Partners I-A, L.P. +, a, e | 06/17/25 | 3,768,494 | 3,768,494 | |||||||
| Sterling Capital Partners IV, L.P. +, a, e | 12/01/24 | 320,943 | 1 | |||||||
| Sterling Partners – Small Market Growth 2009, L.P. +, a, e | 12/01/24 | 285,021 | 587,804 | |||||||
| STG IV, L.P. +, a, e | 09/30/24 | 123,084 | 225,173 | |||||||
| Summit Partners Growth Equity Fund IX-B, L.P. +, a, e | 12/31/24 | 1,025,958 | 1,228,678 | |||||||
| Summit Partners Growth Equity Fund VIII-B, L.P. +, a, e | 12/31/24 | 97,514 | 145,024 | |||||||
| Summit Partners Venture Capital Fund III-B, L.P. +, a, e | 12/31/24 | 176,460 | 286,387 | |||||||
| Sun Capital Partners V, L.P. +, a, e | 09/30/13 | 14,639,947 | — | |||||||
| SV Life Sciences Fund IV CF, L.P. +, a, e | 12/31/24 | 3,368,192 | 3,877,352 | |||||||
| SV Life Sciences Fund IV, L.P. +, a, e | 12/31/24 | 22,386 | 76,162 | |||||||
| TA Atlantic & Pacific VI, L.P. +, a, e | 09/30/15 | 1 | 50,044 | |||||||
| TA Atlantic and Pacific VII-A L.P. +, a, e | 09/30/24 | 1,285,296 | 3,009,985 | |||||||
| TA Subordinated Debt Fund III, L.P. +, a, e | 09/30/24 | 1 | 13,531 | |||||||
The accompanying notes are an integral part of these Consolidated Financial Statements.
Partners Group Private Equity (Master Fund), LLC
(a Delaware Limited Liability Company)
Consolidated Schedule of Investments —
June 30, 2025 (Unaudited) (continued)
| Acquisition Date | Cost | Fair Value | ||||||||
| Private Equity Investments (continued) | ||||||||||
| Secondary Investments *, c (continued) | ||||||||||
| North America (continued) | ||||||||||
| TA XI, L.P. +, a, e | 09/30/15 | $ | 189,098 | $ | 804,235 | |||||
| TCV VII (A), L.P. +, a, e | 09/30/13 | 1 | 1 | |||||||
| Thomas H. Lee Parallel (Cayman) Fund VII, L.P. +, a, e | 01/01/25 | 2,783,114 | 3,696,346 | |||||||
| Thomas H. Lee Parallel Fund VII, L.P. +, a, e | 01/01/25 | 981,706 | 1,334,225 | |||||||
| Thomas H. Lee Parallel Fund VIII, L.P. +, a, e | 01/01/25 | 1,030,261 | 1,118,329 | |||||||
| TorQuest Partners Fund (U.S.) II, L.P. +, a, e | 09/30/15 | 895,011 | 211,622 | |||||||
| TPG Healthcare Partners, L.P. +, a, e | 04/01/24 | 2,792,250 | 3,221,310 | |||||||
| TPG Partners V, L.P. +, a, e | 07/11/11 | 1,066,609 | 1 | |||||||
| TPG Partners VI, L.P. +, a, e | 12/31/12 | 3 | 252,045 | |||||||
| TPG Partners VII, L.P. +, a, e | 01/01/25 | 3,168,946 | 7,132,697 | |||||||
| TPG Partners VIII, L.P. +, a, e | 04/01/24 | 12,700,115 | 15,647,039 | |||||||
| Trident VIII, L.P. +, a, e | 09/30/22 | 21,361,581 | 30,874,577 | |||||||
| Trinity Ventures 2024, L.P. +, a, e | 12/20/24 | 38,680,007 | 49,941,769 | |||||||
| Trivest Fund V, L.P. +, a, e | 10/01/24 | 356,877 | 836,627 | |||||||
| TSCP CV II, L.P. +, a | 09/09/24 | 4,016,292 | 4,590,023 | |||||||
| TSCP CV II, L.P. +, a, e | 09/09/24 | 67,203 | 31,684 | |||||||
| Vector Capital V, L.P. +, a, e | 02/26/25 | 16,526,250 | 19,668,882 | |||||||
| Vector Capital VI, L.P. +, a, e | 02/26/25 | 1,585,379 | 1,585,379 | |||||||
| Vista Equity Partners Fund VII, L.P. +, a, e | 04/01/25 | 7,911,977 | 8,620,653 | |||||||
| Vista Equity Partners Fund VIII, L.P. +, a, e | 04/01/25 | 6,162,362 | 6,713,086 | |||||||
| Vistria Fund III, L.P. +, a, e | 07/29/19 | 10,076,545 | 14,128,989 | |||||||
| Vistria Fund IV, L.P. +, a, e | 10/01/22 | 35,069,457 | 42,642,916 | |||||||
| Vistria Fund V, L.P. +, a, e | 03/31/23 | 4,136,937 | 3,832,371 | |||||||
| Warburg Pincus Global Growth, L.P. +, a, e | 12/31/24 | 3,212,740 | 4,598,606 | |||||||
| Warburg Pincus Private Equity X, L.P. +, a | 09/28/12 | 1 | 203,238 | |||||||
| Warburg Pincus Private Equity XI, L.P. +, a | 01/01/25 | 164,203 | 270,781 | |||||||
| Warburg Pincus Private Equity XII, L.P. +, a, e | 03/31/25 | 6,142,861 | 8,464,272 | |||||||
| Welsh, Carson, Anderson & Stowe XI, L.P. +, a | 09/30/24 | 27,573 | 5,069 | |||||||
| Welsh, Carson, Anderson & Stowe XII, L.P. +, a, e | 12/31/18 | 1 | 27,970,299 | |||||||
| Welsh, Carson, Anderson & Stowe XIII, L.P. +, a, e | 12/20/18 | 1,850,238 | 4,607,938 | |||||||
| Total North America (11.35%) | 1,814,445,507 | |||||||||
| Rest of World (0.25%) | ||||||||||
| Advent Latin American Private Equity Fund V, L.P. +, a, e | 10/01/24 | 562,178 | 884,882 | |||||||
| Advent Latin American Private Equity Fund VI-B L.P. +, a, e | 03/31/25 | 9,049,850 | 12,252,329 | |||||||
| Advent Latin American Private Equity Fund VII-A SCSp +, a, e | 03/31/25 | 14,481,798 | 17,090,751 | |||||||
| Carlyle Global Financial Services Partners III, L.P. +, a, e | 12/31/24 | 3,473,559 | 2,945,901 | |||||||
| NG Capital Partners I, L.P. +, a, e | 12/31/24 | 1 | 885 | |||||||
| Pitango Venture Capital Fund VI L.P. +, a, e | 09/30/24 | 4,137,429 | 5,875,298 | |||||||
| Victoria South American Partners II, L.P. +, a, e | 09/30/24 | 422,104 | 123,062 | |||||||
| Total Rest of World (0.25%) | 39,173,108 | |||||||||
| Western Europe (3.99%) | ||||||||||
| 3i Eurofund Vb, L.P. +, a | 09/30/09 | 3 | 183 | |||||||
| 3i Growth Capital B, L.P. +, a, e | 10/01/14 | 1 | 1 | |||||||
| Abingworth Bioventures III, L.P. +, a, e | 09/30/15 | 1 | 3,668 | |||||||
| Abingworth Bioventures V Co-Investment Growth Equity Fund, L.P. +, a, e | 06/30/12 | 1 | 1 | |||||||
| Abingworth Bioventures VI LP +, a, e | 10/01/24 | 163,953 | 327,706 | |||||||
| Advent International GPE IX-A +, a, e | 12/31/24 | 2,016,904 | 2,678,444 | |||||||
| Advent International GPE VI, L.P. +, a | 09/30/10 | 2,178 | 364,638 | |||||||
| Advent International GPE VI, L.P. +, a, e | 10/01/24 | 110,957 | 148,175 | |||||||
| Advent International GPE VII-E, L.P. +, a, e | 10/01/24 | 169,489 | 365,813 | |||||||
The accompanying notes are an integral part of these Consolidated Financial Statements.
Partners Group Private Equity (Master Fund), LLC
(a Delaware Limited Liability Company)
Consolidated Schedule of Investments —
June 30, 2025 (Unaudited) (continued)
| Acquisition Date | Cost | Fair Value | ||||||||
| Private Equity Investments (continued) | ||||||||||
| Secondary Investments *, c (continued) | ||||||||||
| Western Europe (continued) | ||||||||||
| Alchemy Special Opportunities Fund II L.P. +, a, e | 09/30/24 | $ | 302,746 | $ | 445,131 | |||||
| Aparca8 Capital Estacionamientos, S.C.R., S.A. +, a, e, d | 12/15/23 | 6,498,738 | 10,197,176 | |||||||
| Apax Europe VI - A, L.P. +, a, e | 07/01/11 | 2 | 32,317 | |||||||
| APAX Europe VII - B, L.P. +, a, e | 01/01/25 | 28,576 | 55,335 | |||||||
| Apax Europe VII - B, L.P. +, a, e | 04/30/11 | 332,524 | 10,244 | |||||||
| Apax IX USD (Feeder) L.P. +, a, e | 01/01/25 | 901,567 | 1,209,449 | |||||||
| Apax VIII - A L.P. +, a, e | 01/01/25 | 408,001 | 365,670 | |||||||
| Apax X USD L.P. +, a, e | 01/01/25 | 1,924,234 | 2,083,984 | |||||||
| Astorg IQ-EQ Fund SCSp +, a, e | 01/13/22 | 12,749,518 | 33,430,820 | |||||||
| Astorg V FCPR +, a, e | 09/30/24 | 14,942 | 9,606 | |||||||
| Astorg V FCPR +, a | 09/30/15 | 1 | 9,935 | |||||||
| August Capital V, L.P. +, a, e | 10/01/24 | 857,687 | 747,766 | |||||||
| Bain Capital Europe Fund III, L.P. +, a, e | 03/31/25 | 1 | 1,595 | |||||||
| Bain Capital Europe Fund V, SCSp +, a, e | 12/31/24 | 1,195,555 | 1,805,196 | |||||||
| BC European Capital IX, L.P. +, a, e | 10/01/24 | 371,045 | 1,542,012 | |||||||
| BC European Capital X LP +, a, e | 12/31/24 | 1,069,226 | 1,825,040 | |||||||
| Carlyle Europe Partners II, L.P. +, a, e | 12/28/12 | 60,330 | 32,016 | |||||||
| Carlyle Europe Partners III, L.P. +, a, e | 09/30/14 | 1,924,891 | 157,904 | |||||||
| Carlyle Europe Partners IV, L.P. +, a, e | 12/31/24 | 8,716,159 | 7,432,059 | |||||||
| Carlyle Europe Partners V, L.P. +, a, e | 12/31/24 | 2,253,178 | 1,757,281 | |||||||
| CCP IX L.P. No.2 +, a | 09/30/14 | 1,997,564 | 2 | |||||||
| CD&R Value Building Partners I, L.P. +, a | 12/17/21 | 36,983,903 | 65,100,657 | |||||||
| Charterhouse Capital Partners IX +, a, e | 09/30/24 | 16,749 | 21,125 | |||||||
| Charterhouse Capital Partners X L.P. +, a, e | 12/31/24 | 5,466,582 | 7,548,255 | |||||||
| CVC Capital Partners Pachelbel (A) SCSp +, a, e | 07/08/24 | 1,610,663 | 2,160,263 | |||||||
| CVC Capital Partners VII L.P. +, a, e | 03/31/24 | 11,514,161 | 16,330,510 | |||||||
| CVC Capital Partners VIII, L.P. +, a, e | 03/31/24 | 11,960,042 | 13,794,130 | |||||||
| CVC European Equity Partners III L.P. +, a, e | 12/31/24 | 247,167 | 428,124 | |||||||
| CVC European Equity Partners V, L.P. +, a, e | 12/28/12 | 1 | 1 | |||||||
| Daiwa ICP European Infrastructure 1, L.P. +, a, e | 12/22/22 | 33,258,286 | 65,377,386 | |||||||
| DBAG Fund VI (Guernsey) L.P. +, a, e | 09/30/24 | 322,750 | 451,148 | |||||||
| Elvaston Capital Fund V +, a, e | 03/31/25 | 16,898,142 | 22,295,877 | |||||||
| EPIC I-b Fund SLP +, a, e | 11/30/20 | 8,978,333 | 29,306,426 | |||||||
| EQT IX, L.P. (EUR) +, a, e | 03/31/25 | 30,792,320 | 38,953,389 | |||||||
| ESP Golden Bear Europe Fund +, a, e | 12/31/16 | 1 | 317,564 | |||||||
| Eurazeo Capital IV B SCSp +, a, e | 12/31/24 | 8,537,079 | 9,281,204 | |||||||
| F2i III +, a, e | 07/01/24 | 2,669,193 | 5,257,884 | |||||||
| Fourth Cinven Fund, L.P. +, a, e | 04/16/10 | 83,945 | 636 | |||||||
| France Special Situations Fund I FPCI +, a, e | 10/01/24 | 751,333 | 88,066 | |||||||
| G Square Capital I +, a | 12/01/24 | 1,875 | 1,315 | |||||||
| Galileo III FCPR +, a, e | 09/30/15 | 1 | 31,616 | |||||||
| Graphite Capital Partners VII, L.P. +, a, e | 09/30/15 | 1 | 254,692 | |||||||
| HitecVision Asset Solutions, L.P. +, a, e | 09/30/24 | 1 | 3,518 | |||||||
| HitecVision SpringPoint L.P. +, a, e | 09/30/24 | — | 1,617 | |||||||
| HitecVision V, L.P. +, a, e | 09/30/24 | 99,185 | 2,338 | |||||||
| HitecVision VI, L.P. +, a, e | 09/30/24 | 1,387,998 | 1,374,912 | |||||||
| Index Ventures Growth II (Jersey), L.P. +, a | 09/30/24 | 1,494,223 | 1,376,509 | |||||||
| Index Ventures VI (Jersey), L.P. +, a, e | 09/30/24 | 11,606,964 | 15,541,513 | |||||||
| Industrial Opportunity Partners II, L.P. +, a, e | 09/30/24 | 61,236 | 175,773 | |||||||
| Investindustrial V L.P. +, a, e | 09/30/24 | 1,157,013 | 1,024,732 | |||||||
| Italian Private Equity Fund IV, L.P. +, a, e | 01/29/16 | 1 | 4,173 | |||||||
| KKR European Fund III, L.P. +, a, e | 10/01/14 | 563 | 7,494 | |||||||
| KKR European Fund III, L.P. (USD) +, a, e | 12/31/24 | 1 | 22,071 | |||||||
The accompanying notes are an integral part of these Consolidated Financial Statements.
Partners Group Private Equity (Master Fund), LLC
(a Delaware Limited Liability Company)
Consolidated Schedule of Investments —
June 30, 2025 (Unaudited) (continued)
| Acquisition Date | Cost | Fair Value | ||||||||
| Private Equity Investments (continued) | ||||||||||
| Secondary Investments *, c (continued) | ||||||||||
| Western Europe (continued) | ||||||||||
| KKR European Fund IV (EEA) L.P. +, a, e | 12/31/24 | $ | 15,658,846 | $ | 17,048,285 | |||||
| KKR European Fund V (EUR) SCSp +, a, e | 12/31/24 | 3,730,311 | 4,512,515 | |||||||
| L Capital 3 FPCI +, a, e | 12/02/24 | 288,770 | 466,055 | |||||||
| Latour Capital I +, a | 12/31/24 | 71,613 | 4,418 | |||||||
| Living Bridge 5 L.P. +, a, e | 10/01/24 | 313,338 | 759,005 | |||||||
| Montagu III, L.P. +, a, e | 12/09/09 | 72,602 | 1 | |||||||
| Montagu V L.P. +, a, e | 12/31/24 | 2,426,353 | 3,029,816 | |||||||
| Montagu+ SCSp +, a, e | 12/06/21 | 38,226,197 | 81,145,972 | |||||||
| Oaktree European Principal Fund IV Feeder (Cayman), L.P. +, a, e | 01/01/25 | 893,496 | 1,058,407 | |||||||
| PAI Europe VI, L.P. +, a, e | 12/31/24 | 1,973,177 | 2,660,570 | |||||||
| PAI Europe VII-1 +, a, e | 12/31/24 | 370,816 | 494,977 | |||||||
| Permira Europe II, L.P. +, a | 11/29/13 | 77,176 | — | |||||||
| Permira Europe III, L.P. +, a | 09/30/13 | 352,692 | 2,495 | |||||||
| Permira Europe III, L.P. +, a, e | 01/01/25 | 30,535 | 54,969 | |||||||
| Permira VI L.P. 1 +, a, e | 01/01/25 | 2,001,586 | 2,147,591 | |||||||
| Permira VII L.P. +, a, e | 09/29/22 | 35,457,714 | 47,817,668 | |||||||
| Permira VIII SCSp +, a, e | 03/30/25 | 11,868,550 | 14,009,590 | |||||||
| Phoenix Equity Partners 2010 LP +, a | 09/30/24 | 1 | 4,864 | |||||||
| Piper Private Equity Fund V L.P. +, a, e | 10/01/24 | 213,513 | 52,062 | |||||||
| Prime Ventures IV C.V. +, a, e | 09/30/24 | 815,255 | 1,836,142 | |||||||
| PSC III G, LP +, a, e | 12/31/24 | 4,454,538 | 5,184,190 | |||||||
| Rivean Special Opportunity Fund I Coöperatief U.A. +, a, e | 11/29/22 | 22,713,138 | 25,284,512 | |||||||
| Riverside Europe Fund IV, L.P. +, a, e | 09/30/14 | 103,961 | 1 | |||||||
| Sixth Cinven Fund (No.2) Limited Partnership +, a, e | 03/31/24 | 2,011,656 | 3,821,135 | |||||||
| STG Alternative Investments S.C.A. SICAV-RAIF +, a, e | 09/17/21 | 17,305,825 | 35,835,663 | |||||||
| Summit Partners Europe Private Equity Fund, L.P. +, a, e | 03/31/25 | 1 | 1 | |||||||
| TDR Capital III 'B' L.P. +, a, e | 10/01/24 | 2,336,090 | 2,971,595 | |||||||
| The Seventh Cinven Fund, L.P. +, a, e | 03/31/24 | 7,928,084 | 11,051,145 | |||||||
| Trilantic Capital Partners V (Europe) S.C.A., SICAR +, a, e | 11/20/20 | 3,668,622 | 4,440,178 | |||||||
| Trilantic Europe VI SCSp +, a, e | 12/10/20 | 4,166,613 | 4,449,667 | |||||||
| Turkish Private Equity Fund III L.P. +, a, e | 09/30/24 | 1,968,049 | 2,940,306 | |||||||
| WPEF V Feeder LP +, a, e | 01/01/25 | 73,398 | 137,961 | |||||||
| Total Western Europe (3.99%) | 636,795,841 | |||||||||
| Total Secondary Investments (16.89%) | $ | 1,802,751,212 | $ | 2,698,665,195 | ||||||
| Primary Investments *, c (14.30%) | ||||||||||
| Asia - Pacific (0.88%) | ||||||||||
| Bain Capital Asia V, L.P. +, a, e | 09/01/23 | 328,908 | 396,431 | |||||||
| Baring Asia Private Equity Fund IX, L.P. +, a, e | 12/23/24 | — | — | |||||||
| Baring Asia Private Equity Fund V, L.P. +, a, e | 12/01/10 | 1 | 217,233 | |||||||
| BGH Capital Fund I +, a, e | 03/01/18 | 13,984,785 | 18,284,173 | |||||||
| BGH Capital VCLP II +, a, e | 02/01/22 | 1,197,454 | 835,995 | |||||||
| CPEChina Fund III, L.P. +, a, e | 03/28/18 | 18,351,734 | 31,019,074 | |||||||
| CVC Capital Partners Asia VI L.P. +, a, e | 12/23/22 | 819,904 | 701,965 | |||||||
| Hony Capital Fund VIII, L.P. +, a, e | 10/30/15 | 7,636,632 | 9,156,428 | |||||||
| Hony Capital Partners V, L.P. +, a, e | 12/15/11 | 4,634,657 | 2,271,524 | |||||||
| J-STAR No.4-C, L.P. +, a, e | 08/02/19 | 1,707,367 | 13,368,152 | |||||||
| J-STAR No.5-B, L.P. +, a, e | 02/28/22 | 3,726,936 | 4,120,642 | |||||||
| Kedaara Capital Growth Fund IV +, a, e | 04/03/24 | 388,233 | 318,805 | |||||||
| Kedaara Capital III Limited +, a, e | 06/17/21 | 6,472,945 | 7,317,140 | |||||||
| KKR Asian Fund IV SCSp +, a, e | 05/29/20 | 3,508,241 | 5,362,536 | |||||||
| Primavera Capital Fund III L.P. +, a, e | 05/09/18 | 7,770,937 | 10,487,314 | |||||||
| Primavera Capital Fund IV, L.P. +, a, e | 05/20/21 | 6,947,263 | 5,020,134 | |||||||
The accompanying notes are an integral part of these Consolidated Financial Statements.
Partners Group Private Equity (Master Fund), LLC
(a Delaware Limited Liability Company)
Consolidated Schedule of Investments —
June 30, 2025 (Unaudited) (continued)
| Acquisition Date | Cost | Fair Value | ||||||||
| Private Equity Investments (continued) | ||||||||||
| Primary Investments *, c (continued) | ||||||||||
| Asia - Pacific (continued) | ||||||||||
| Southern Capital Fund IV L.P. +, a, e | 01/26/18 | $ | 5,464,380 | $ | 5,578,225 | |||||
| The Baring Asia Private Equity Fund VII, L.P. +, a, e | 07/10/18 | 2,517,343 | 9,566,388 | |||||||
| Tiara CG Private Equity Fund 2024, L.P. +, a, e | 11/29/24 | 26,534 | 28,600 | |||||||
| TPG ASIA VIII (B), L.P. +, a, e | 07/01/22 | 7,535,001 | 8,499,270 | |||||||
| Trustbridge Partners VI, L.P. +, a, e | 04/12/18 | 7,401,515 | 7,914,181 | |||||||
| Total Asia - Pacific (0.88%) | 140,464,210 | |||||||||
| North America (8.41%) | ||||||||||
| Advent Global Technology, L.P. +, a, e | 06/25/19 | 2,124,384 | 3,185,416 | |||||||
| AEA Investors Fund VII L.P. +, a, e | 02/08/19 | 3,335,269 | 3,630,370 | |||||||
| American Industrial Partners Capital Fund VII, L.P. +, a, e | 03/29/19 | 13,336,759 | 28,319,887 | |||||||
| American Industrial Partners Capital Fund VIII, L.P. +, a, e | 07/10/23 | 533,032 | 563,304 | |||||||
| Apollo Investment Fund IX, L.P +, a, e | 06/01/17 | 15,098,443 | 33,593,144 | |||||||
| Apollo Investment Fund VIII, L.P. +, a, e | 06/28/13 | 1 | 2,617,014 | |||||||
| Ares Corporate Opportunities Fund IV, L.P. +, a, e | 04/19/12 | 1 | 1,584,732 | |||||||
| Ares Corporate Opportunities Fund V, L.P. +, a, e | 12/28/15 | 5,419,361 | 8,665,326 | |||||||
| Ares Corporate Opportunities Fund VI, L.P. +, a, e | 06/02/20 | 1,745,593 | 2,807,861 | |||||||
| Avista Capital Partners II, L.P. +, a, e | 01/01/14 | 94,819 | 1 | |||||||
| Bain Capital Fund XII, L.P. +, a, e | 06/30/17 | 1 | 16,555,344 | |||||||
| Bain Capital Fund XIII, L.P. +, a, e | 08/07/20 | 17,253,219 | 19,466,462 | |||||||
| Bain Capital Fund XIV, L.P. +, a, e | 04/01/25 | — | — | |||||||
| Barings Transportation Fund, L.P. +, a, e | 09/23/21 | 6,282,518 | 12,232,635 | |||||||
| Berkshire Fund IX, L.P. +, a, e | 03/18/16 | 4,735,936 | 14,066,378 | |||||||
| Berkshire Fund XI-TE, L.P. +, a, e | 12/18/23 | 488,779 | 488,779 | |||||||
| Caltius Partners V-A, L.P. +, a, e | 12/02/14 | 1,068,047 | 6,275,741 | |||||||
| Carlyle Partners VII, L.P. +, a, e | 11/29/17 | 35,085,227 | 55,969,673 | |||||||
| Carlyle Partners VIII, L.P. +, a, e | 09/10/21 | 6,157,429 | 6,377,379 | |||||||
| Centerbridge Seaport Acquisition Fund, L.P. +, a | 04/27/22 | 988,701 | 1,097,058 | |||||||
| Clayton, Dubilier & Rice Fund IX, L.P. +, a, e | 07/31/13 | 40,903 | 5,310,729 | |||||||
| Clayton, Dubilier & Rice Fund X, L.P. +, a, e | 12/13/16 | 1 | 18,189,859 | |||||||
| Clayton, Dubilier & Rice Fund XI, L.P. +, a, e | 05/15/20 | 17,378,069 | 19,497,950 | |||||||
| Clayton, Dubilier & Rice Fund XII, L.P. +, a, e | 09/02/22 | 8,905,003 | 11,338,767 | |||||||
| Clearlake Capital Partners V, L.P. +, a, e | 12/15/17 | 1 | 27,406,898 | |||||||
| Clearlake Capital Partners VI, L.P. +, a, e | 12/10/19 | 14,325,635 | 21,131,730 | |||||||
| Clearlake Capital Partners VII, L.P. +, a, e | 09/23/21 | 11,006,401 | 12,028,004 | |||||||
| Clearlake Capital Partners VIII, L.P. +, a, e | 04/05/24 | 1,617,637 | 1,360,331 | |||||||
| Crescent Mezzanine Partners VI, L.P. +, a, e | 03/30/12 | 1 | 269,033 | |||||||
| Cressey & Company Fund VII-A L.P. +, a, e | 06/30/22 | 1,417,065 | 977,201 | |||||||
| ECP V, LP +, a, e | 08/19/22 | 3,296,092 | 3,653,174 | |||||||
| Frazier Healthcare Growth Buyout Fund X, L.P. +, a, e | 03/10/21 | 10,473,534 | 12,844,062 | |||||||
| Frazier Healthcare Growth Buyout Fund XI, L.P. +, a, e | 09/20/24 | — | — | |||||||
| Genstar AMBA CV, L.P. +, a | 04/01/23 | 376,953 | 589,460 | |||||||
| Genstar Capital Partners IX, L.P. +, a, e | 02/21/19 | 4,396,214 | 25,103,766 | |||||||
| Genstar Capital Partners VI, L.P. +, a, e | 09/01/12 | 1 | 207,665 | |||||||
| Genstar Capital Partners VII, L.P. +, a, e | 06/26/15 | 1 | 5,650,025 | |||||||
| Genstar Capital Partners VIII, L.P. +, a, e | 03/23/17 | 74,702 | 33,548,254 | |||||||
| Genstar Capital Partners X, L.P. +, a, e | 04/01/21 | 10,471,892 | 11,502,410 | |||||||
| Genstar Capital Partners XI, L.P. +, a, e | 04/26/23 | 759,600 | 823,557 | |||||||
| Genstar X Opportunities Fund, L.P. +, a, e | 08/13/21 | 2,265,591 | 2,775,641 | |||||||
| Genstar XI Opportunities Fund, L.P. +, a, e | 04/26/23 | 534,168 | 625,358 | |||||||
| GI Data Infrastructure Fund II LP +, a, e, d | 01/27/23 | 2,584,376 | 2,740,873 | |||||||
| GoldPoint Mezzanine Partners IV, L.P. +, a, e | 12/30/15 | 326,664 | 5,190,542 | |||||||
| Green Equity Investors IX, L.P. +, a, e | 03/01/22 | 8,973,340 | 10,081,296 | |||||||
The accompanying notes are an integral part of these Consolidated Financial Statements.
Partners Group Private Equity (Master Fund), LLC
(a Delaware Limited Liability Company)
Consolidated Schedule of Investments —
June 30, 2025 (Unaudited) (continued)
| Acquisition Date | Cost | Fair Value | ||||||||
| Private Equity Investments (continued) | ||||||||||
| Primary Investments *, c (continued) | ||||||||||
| North America (continued) | ||||||||||
| Green Equity Investors Side VIII, L.P. +, a, e | 10/18/19 | $ | 22,439,943 | $ | 36,026,117 | |||||
| Gryphon Heritage Partners, L.P. +, a, e | 12/17/20 | 1,007,440 | 5,557,990 | |||||||
| Gryphon Partners V, L.P. +, a, e | 02/23/18 | 3,550,731 | 8,575,960 | |||||||
| Gryphon Partners VI, L.P. +, a, e | 12/17/20 | 8,577,414 | 9,299,024 | |||||||
| Harvest Partners IX, L.P. +, a, e | 09/24/21 | 6,088,418 | 6,298,000 | |||||||
| Harvest Partners VII, L.P. +, a, e | 12/14/15 | 900,652 | 10,208,801 | |||||||
| Harvest Partners VIII, L.P. +, a, e | 12/19/18 | 9,563,093 | 20,230,149 | |||||||
| Hellman & Friedman Capital Partners VII, L.P. +, a, e | 06/30/14 | 1 | 1 | |||||||
| Hellman & Friedman Capital Partners X, L.P. +, a, e | 05/10/21 | 12,240,248 | 13,935,852 | |||||||
| Hellman & Friedman Capital Partners XI, LP +, a, e | 03/31/23 | 7,690 | 7,690 | |||||||
| HGGC Fund IV, L.P. +, a, e | 04/08/22 | 1,185,097 | 2,423,022 | |||||||
| Icon Partners IV, L.P. +, a, e | 09/01/21 | 5,754,300 | 6,343,989 | |||||||
| Icon Partners V, L.P. +, a, e | 12/27/21 | 7,430,156 | 10,068,433 | |||||||
| Insight Partners XII (Co-Investors), L.P. +, a, e | 06/07/21 | 1,643,762 | 2,124,752 | |||||||
| Insight Partners XIII, L.P. +, a, e | 12/23/22 | 2,553,744 | 2,503,825 | |||||||
| Insight Venture Partners X, L.P. +, a, e | 07/06/18 | 1 | 12,721,783 | |||||||
| Insight Venture Partners XI, L.P. +, a, e | 12/17/19 | 4,643,830 | 7,895,709 | |||||||
| Insight Ventures Partners XII, L.P. +, a, e | 06/07/21 | 6,729,777 | 6,809,465 | |||||||
| Jade Equity Investors II, L.P. +, a, e | 03/01/22 | 922,767 | 1,023,554 | |||||||
| K6 Private Investors, L.P. +, a, e | 06/28/24 | — | — | |||||||
| Khosla Ventures VIII, L.P. +, a, e | 01/06/23 | 1,328,861 | 1,430,058 | |||||||
| KKR Americas Fund XII L.P. +, a, e | 01/31/18 | 2,617,507 | 29,788,910 | |||||||
| KKR Associates Indigo Equity Partners, L.P. +, a | 10/01/22 | 1,785,110 | 2,066,793 | |||||||
| KKR North America Fund XI, L.P. +, a, e | 02/01/12 | 6,190 | 3,891,597 | |||||||
| KKR North America Fund XIII, SCSP +, a, e | 04/06/21 | 8,626,025 | 10,220,321 | |||||||
| KKR North America Fund XIV +, a, e | 12/19/24 | — | — | |||||||
| Kleiner Perkins Caufield & Byers XIX LLC +, a, e | 03/05/20 | 7,942,500 | 13,494,562 | |||||||
| Kleiner Perkins Select Fund III, LLC +, a, e | 06/28/24 | 2,600,000 | 2,600,000 | |||||||
| KLEINER PERKINS XXI, LLC +, a, e | 06/28/24 | 1,787,500 | 1,787,500 | |||||||
| Kohlberg TE Investors IX, L.P. +, a, e | 12/20/19 | 15,535,018 | 26,414,206 | |||||||
| Kohlberg TE Investors VIII, L.P. +, a, e | 08/04/16 | 5,508,972 | 24,033,662 | |||||||
| Kohlberg TE Investors X, L.P. +, a, e | 10/06/23 | 340,405 | 367,001 | |||||||
| Lee Equity Partners IV, L.P. +, a, e | 06/28/24 | 5,537,640 | 4,780,872 | |||||||
| Leeds Equity Partners VI, L.P. +, a, e | 11/25/16 | 796,703 | 17,578,595 | |||||||
| Lerer Hippeau Select Fund III, L.P. +, a, e | 12/20/19 | 4,471,898 | 6,295,180 | |||||||
| Lerer Hippeau VII, L.P. +, a, e | 12/20/19 | 3,825,000 | 3,566,529 | |||||||
| Lux Total Opportunities, L.P. +, a, e | 05/28/21 | 3,375,000 | 4,034,897 | |||||||
| Lux Ventures VII, L.P. +, a, e | 05/28/21 | 968,750 | 1,599,981 | |||||||
| Lux Ventures VIII, L.P. +, a, e | 04/03/23 | 1,952,680 | 2,543,385 | |||||||
| Madison Dearborn Capital Partners VIII, L.P. +, a, e | 03/20/20 | 7,546,878 | 10,012,036 | |||||||
| Mayfield Select III, L.P. +, a, e | 05/01/23 | 250,000 | 250,000 | |||||||
| Mayfield XVII, L.P. +, a, e | 05/01/23 | 210,001 | 217,899 | |||||||
| Nautic Partners IX-A, L.P. +, a, e | 03/12/19 | 2,907,347 | 8,387,658 | |||||||
| Nautic Partners VII-A, L.P. +, a, e | 06/27/14 | 357,845 | 2,101,200 | |||||||
| Nautic Partners X-A, L.P. +, a, e | 07/19/21 | 8,868,728 | 10,942,228 | |||||||
| NEA 18 Venture Growth Equity, L.P. +, a, e | 12/22/21 | 2,961,000 | 2,813,877 | |||||||
| New Enterprise Associates 14, L.P. +, a, e | 05/04/12 | 1 | 6,791,680 | |||||||
| New Enterprise Associates 17, L.P. +, a, e | 06/06/19 | 7,537,707 | 9,188,442 | |||||||
| New Enterprise Associates 18, L.P. +, a, e | 12/22/21 | 1,868,596 | 2,921,019 | |||||||
| New Mountain Capital V, L.P. +, a, e | 06/29/17 | 172,601 | 15,263,864 | |||||||
| New Mountain Partners VI, L.P. +, a, e | 10/16/20 | 16,489,294 | 24,652,632 | |||||||
| New Mountain Partners VII, L.P. +, a, e | 04/06/23 | 1,466,268 | 1,442,415 | |||||||
| NexPhase Capital Fund III-A, L.P. +, a, e | 09/01/16 | 1 | 11,980,417 | |||||||
The accompanying notes are an integral part of these Consolidated Financial Statements.
Partners Group Private Equity (Master Fund), LLC
(a Delaware Limited Liability Company)
Consolidated Schedule of Investments —
June 30, 2025 (Unaudited) (continued)
| Acquisition Date | Cost | Fair Value | ||||||||
| Private Equity Investments (continued) | ||||||||||
| Primary Investments *, c (continued) | ||||||||||
| North America (continued) | ||||||||||
| NexPhase Capital Fund V, L.P. +, a, e | 08/04/23 | $ | 325,785 | $ | 285,467 | |||||
| Novacap International Technologies VII L.P. +, a, e | 05/30/25 | — | — | |||||||
| Oak Hill Capital Partners IV, L.P. +, a, e | 04/28/17 | 1 | 5,252,105 | |||||||
| Oak Hill Capital Partners V, L.P. +, a, e | 12/21/18 | 23,220,537 | 37,534,233 | |||||||
| Oak Hill Capital Partners VI, L.P. +, a, e | 02/25/22 | 2,874,793 | 3,376,240 | |||||||
| Pamlico Capital V, L.P. +, a, e | 02/03/20 | 4,417,810 | 4,779,107 | |||||||
| Pamlico Capital VI, L.P. +, a, e | 12/17/24 | — | — | |||||||
| PennantPark Credit Opportunities Fund II, L.P. +, a, e | 08/03/12 | 1 | 663,541 | |||||||
| Revelstoke Capital Partners Fund III, L.P +, a, e | 02/23/22 | 6,055,257 | 6,676,254 | |||||||
| Silver Lake Partners IV, L.P. +, a, e | 07/30/12 | 1 | 11,010,429 | |||||||
| Silver Lake Partners V, L.P. +, a, e | 03/31/17 | 18,154,264 | 45,581,254 | |||||||
| Silver Lake Partners VI, L.P. +, a, e | 06/04/20 | 5,994,592 | 7,585,610 | |||||||
| Silver Lake Partners VII, L.P. +, a, e | 05/26/22 | 4,807,135 | 5,595,784 | |||||||
| Spark Capital Growth Fund IV, L.P. +, a, e | 10/14/21 | 5,740,500 | 7,857,723 | |||||||
| Spark Capital Growth Fund V, L.P. +, a, e | 02/29/24 | 740,000 | 728,447 | |||||||
| Spark Capital VII, L.P. +, a, e | 10/14/21 | 2,660,000 | 3,456,037 | |||||||
| Spark Capital VIII, L.P. +, a, e | 02/29/24 | 315,000 | 314,500 | |||||||
| Sumeru Equity Partners Fund, L.P. +, a, e | 04/27/15 | 8,323 | 3,589,674 | |||||||
| Summit Partners Growth Equity Fund XI, L.P. +, a, e | 10/01/21 | 2,366,837 | 2,549,026 | |||||||
| Summit Partners Growth Equity Fund XII, L.P. +, a, e | 10/01/24 | — | — | |||||||
| TA Select Opportunities Fund II-B, L.P. +, a, e | 05/27/21 | 2,701,875 | 2,797,416 | |||||||
| TA XIII-B, L.P. +, a, e | 05/02/19 | 4,012,500 | 18,129,783 | |||||||
| TA XIV-B, L.P. +, a, e | 05/27/21 | 10,321,250 | 11,758,587 | |||||||
| TCV X, L.P. +, a, e | 08/31/18 | 3,325,954 | 14,870,371 | |||||||
| TCV XI (A), L.P. +, a, e | 10/02/20 | 8,689,126 | 10,000,533 | |||||||
| Thompson Street Capital Partners IV, L.P. +, a, e | 12/10/15 | 1 | 6,269,934 | |||||||
| Thompson Street Capital Partners V, L.P. +, a, e | 05/04/18 | 1,354,320 | 8,531,011 | |||||||
| Thompson Street Capital Partners VI, L.P. +, a, e | 06/11/21 | 12,999,081 | 12,114,182 | |||||||
| TPG Partners IX, L.P. +, a, e | 12/23/22 | 1,287,907 | 1,408,331 | |||||||
| TPG Partners VII, L.P. +, a, e | 03/01/16 | 1 | 2,997,435 | |||||||
| TPG Partners VIII, L.P. +, a, e | 01/31/19 | 6,818,270 | 11,571,593 | |||||||
| Trident IX, L.P. +, a, e | 11/19/21 | 14,038,927 | 17,943,951 | |||||||
| Trident VII, L.P. +, a, e | 09/22/16 | 1,193,097 | 38,826,169 | |||||||
| Trident VIII, L.P. +, a, e | 04/05/19 | 13,125,517 | 24,941,594 | |||||||
| Trident X, L.P. +, a, e | 06/24/24 | — | — | |||||||
| Vista Equity Partners Fund VII, L.P. +, a, e | 08/31/18 | 17,467,290 | 20,990,669 | |||||||
| Vista Equity Partners Fund VIII, L.P. +, a, e | 04/28/22 | 17,310,960 | 19,879,300 | |||||||
| Vistria Fund II, L.P. +, a, e | 12/19/17 | 293,590 | 11,771,837 | |||||||
| Vistria Fund III, L.P. +, a, e | 06/19/19 | 10,076,545 | 14,128,989 | |||||||
| Vistria Fund IV, L.P. +, a, e | 03/31/21 | 12,415,512 | 15,310,436 | |||||||
| Vistria Fund V, L.P. +, a, e | 10/31/23 | 482,769 | 599,536 | |||||||
| Warburg Pincus Global Growth 14, L.P. +, a, e | 01/31/22 | 6,219,000 | 7,838,826 | |||||||
| Warburg Pincus Global Growth, L.P. +, a, e | 11/20/18 | 5,333,215 | 11,574,639 | |||||||
| Welsh, Carson, Anderson & Stowe XII, L.P. +, a | 12/19/14 | 1 | 7,156,124 | |||||||
| Welsh, Carson, Anderson & Stowe XIII, L.P. +, a, e | 12/20/18 | 6,660,857 | 16,588,578 | |||||||
| Welsh, Carson, Anderson & Stowe XIV, L.P. +, a, e | 01/19/22 | 2,157,385 | 2,153,776 | |||||||
| West Street Offshore Infrastructure Partners IV +, a, e | 11/02/22 | 8,335,974 | 9,153,158 | |||||||
| Windjammer Senior Equity Fund IV, L.P. +, a, e | 02/06/13 | 4,855 | 3,057,987 | |||||||
| Total North America (8.41%) | 1,345,056,797 | |||||||||
| Rest of World (0.56%) | ||||||||||
| Advent Latin American Private Equity Fund VI-H L.P. +, a, e | 10/17/14 | 662,130 | 8,502,598 | |||||||
| Patria - Brazilian Private Equity Fund IV, L.P. +, a, e | 06/30/11 | 4,737,450 | 3,295,930 | |||||||
The accompanying notes are an integral part of these Consolidated Financial Statements.
Partners Group Private Equity (Master Fund), LLC
(a Delaware Limited Liability Company)
Consolidated Schedule of Investments —
June 30, 2025 (Unaudited) (continued)
| Acquisition Date | Cost | Fair Value | ||||||||
| Private Equity Investments (continued) | ||||||||||
| Primary Investments *, c (continued) | ||||||||||
| Rest of World (continued) | ||||||||||
| Polish Enterprise Fund VIII, L.P. +, a, e | 09/15/17 | $ | 38,254,188 | $ | 77,129,643 | |||||
| Total Rest of World (0.56%) | 88,928,171 | |||||||||
| Western Europe (4.45%) | ||||||||||
| Adagia Capital Europe S.L.P. +, a, e | 06/01/21 | 5,476,103 | 7,211,088 | |||||||
| Advent International GPE IX-C, L.P. +, a, e | 05/31/19 | 15,380,794 | 28,091,944 | |||||||
| Advent International GPE VII-B, L.P. +, a, e | 07/01/12 | 1 | 1,010,464 | |||||||
| Advent International GPE VIII-C, L.P +, a, e | 03/22/16 | 1 | 6,741,694 | |||||||
| Advent International GPE X (USD) +, a, e | 05/31/22 | 9,529,257 | 11,411,286 | |||||||
| Advent International GPE XI-C SCSp +, a, e | 06/20/25 | — | — | |||||||
| Apax X USD L.P. +, a, e | 07/16/19 | 16,557,941 | 21,018,485 | |||||||
| APAX XI USD L.P. +, a, e | 06/30/22 | 7,540,761 | 8,567,164 | |||||||
| Astorg Mid-Cap +, a, e | 02/22/21 | 4,736,829 | 5,196,248 | |||||||
| Astorg VI, FCPI +, a, e | 06/30/16 | 1 | 3,838,282 | |||||||
| Astorg VIII S.à.r.l. +, a, e | 12/17/21 | 9,499,004 | 10,828,706 | |||||||
| Axcel VI K/S +, a, e | 02/21/20 | 11,584,808 | 24,830,003 | |||||||
| Axcel VII K/S +, a, e | 05/17/23 | 466,435 | 609,020 | |||||||
| Bain Capital Europe Fund IV, L.P. +, a, e | 09/01/14 | 1 | 2,938,646 | |||||||
| Bain Capital Europe Fund VI, SCSp +, a, e | 06/30/22 | 2,104,733 | 2,445,504 | |||||||
| BC Partners XI, L.P. +, a, e | 12/15/21 | 21,097,413 | 27,268,876 | |||||||
| Bregal Unternehmerkapital IV-A SCSP +, a, e | 05/23/24 | 1,296,558 | 601,116 | |||||||
| CapVest Equity Partners III B, L.P. +, a, e | 08/30/13 | 1 | 17,166 | |||||||
| Capvis Equity V L.P. +, a, e | 01/17/18 | 12,151,342 | 22,201,434 | |||||||
| Carlyle Europe Partners IV, L.P. +, a, e | 08/27/13 | 1 | 1 | |||||||
| Carlyle Europe Partners V, L.P. +, a, e | 04/23/18 | 7,269,598 | 7,538,851 | |||||||
| CD&R Value Building Partners I, L.P. +, a | 12/17/21 | 4,595,805 | 8,097,588 | |||||||
| Charterhouse Capital Partners XI +, a, e | 11/26/21 | 4,865,444 | 6,491,853 | |||||||
| CVC Capital Partners IX L.P. +, a, e | 05/12/23 | 140,086 | 149,858 | |||||||
| CVC Capital Partners VI (A) L.P. +, a, e | 07/05/13 | 39,622 | 6,198,028 | |||||||
| CVC Capital Partners VIII, L.P. +, a, e | 06/19/20 | 2,024,086 | 2,508,005 | |||||||
| DPE Deutschland IV +, a, e | 08/24/20 | 3,807,616 | 4,719,524 | |||||||
| Egeria Private Equity Fund VI Coöperatief U.A. +, a, e | 04/14/25 | 1,782,837 | 1,837,822 | |||||||
| EPIC Fund III, SLP +, a, e | 06/25/24 | 1,576,591 | 1,445,394 | |||||||
| EQT IX, L.P. (USD) +, a, e | 05/15/20 | 18,109,404 | 23,677,954 | |||||||
| EQT Mid-Market (No.1) Feeder L.P. +, a, e | 07/01/16 | 1 | 12,487,625 | |||||||
| EQT X, L.P. (USD) +, a, e | 04/28/22 | 12,017,054 | 12,562,628 | |||||||
| Exponent Private Equity Partners V, L.P. +, a, e | 06/28/24 | 2,964,382 | 3,743,396 | |||||||
| GHO Capital IV +, a, e | 04/11/25 | — | — | |||||||
| Gilde Buy-Out Fund VI C.V. +, a, e | 06/28/19 | 19,734,153 | 26,317,802 | |||||||
| Graphite Capital Partners IX L.P. +, a, e | 04/11/18 | 10,452,452 | 14,453,348 | |||||||
| Hg Genesis 10 L.P. +, a, e | 04/14/22 | 3,844,170 | 4,848,356 | |||||||
| Hg Mercury 4 L.P. +, a, e | 01/12/23 | 2,269,704 | 2,621,964 | |||||||
| Hg Saturn 3 L.P. +, a, e | 02/25/22 | 12,589,286 | 15,804,096 | |||||||
| Hg Saturn 4 L.P. +, a, e | 03/01/25 | — | — | |||||||
| Hg Saturn I L.P. +, a, e | 06/28/18 | 1 | 12,874,434 | |||||||
| HgCapital 8 L.P. +, a, e | 12/19/16 | 1 | 15,642,640 | |||||||
| HgCapital Mercury 2 +, a, e | 02/15/17 | 1 | 16,752,405 | |||||||
| Impilo Healthcare AB +, a, e | 02/28/25 | — | — | |||||||
| Index Ventures Growth III (Jersey) L.P. +, a | 03/18/15 | 1 | 25,621,344 | |||||||
| KKR European Fund V (EUR) SCSp +, a, e | 11/05/18 | 17,783,555 | 30,723,083 | |||||||
| KKR European Fund VI (USD) +, a, e | 11/01/21 | 14,707,823 | 12,860,140 | |||||||
| Livingbridge 7 L.P. +, a, e | 09/04/20 | 10,418,659 | 11,356,155 | |||||||
| MCH Iberian Capital Fund V FCR +, a, e | 12/10/21 | 12,177,145 | 21,152,290 | |||||||
The accompanying notes are an integral part of these Consolidated Financial Statements.
Partners Group Private Equity (Master Fund), LLC
(a Delaware Limited Liability Company)
Consolidated Schedule of Investments —
June 30, 2025 (Unaudited) (continued)
| Acquisition Date | Cost | Fair Value | ||||||||
| Private Equity Investments (continued) | ||||||||||
| Primary Investments *, c (continued) | ||||||||||
| Western Europe (continued) | ||||||||||
| Nordic Capital Evo GP, SCSp +, a, e | 06/30/21 | $ | 6,291,608 | $ | 8,098,142 | |||||
| Nordic Capital Evolution II +, a, e | 12/14/24 | — | — | |||||||
| Nordic Capital IX, L.P. +, a, e | 07/18/17 | 12,416,891 | 38,495,868 | |||||||
| Nordic Capital X, L.P. +, a, e | 09/30/20 | 15,071,651 | 25,328,275 | |||||||
| Nordic Capital XI, L.P. +, a, e | 05/01/22 | 19,112,165 | 22,861,472 | |||||||
| Oakley Capital Fund V, SCSp +, a, e | 04/28/22 | 5,646,414 | 6,583,787 | |||||||
| Oakley Capital Private Equity Fund VI +, a, e | 12/17/24 | 243,774 | 253,249 | |||||||
| PAI Europe VI-1, L.P. +, a, e | 03/12/15 | 1 | 4,027,696 | |||||||
| PAI Partners VIII-1 SCSp +, a, e | 05/12/22 | 10,598,970 | 12,328,049 | |||||||
| Permira VII L.P. +, a, e | 06/21/19 | 23,338,239 | 32,806,208 | |||||||
| Permira VIII SCSp +, a, e | 02/10/22 | 12,662,258 | 15,573,297 | |||||||
| ProA Capital Iberian Buyout Fund IV, F.C.R. +, a, e | 05/31/23 | 3,427,558 | 3,223,132 | |||||||
| Rivean Capital Fund VII Cooperatief U.A. +, a, e | 05/24/23 | 6,949,788 | 7,914,819 | |||||||
| Sixth Cinven Fund (No.3) L.P. +, a, e | 05/01/16 | 1 | 5,338,683 | |||||||
| The Eighth Cinven Fund, L.P. +, a, e | 07/05/22 | 2,424,726 | 2,429,014 | |||||||
| The Paragon Partners Fund IV GmbH & Co. KG +, a, e | 04/29/22 | 1,738,260 | 1,732,669 | |||||||
| The Seventh Cinven Fund, L.P. +, a, e | 04/16/19 | 23,504,783 | 34,806,019 | |||||||
| Vitruvian Investment Partnership V +, a, e | 10/07/22 | 2,520,530 | 2,450,371 | |||||||
| Total Western Europe (4.45%) | 711,564,460 | |||||||||
| Total Primary Investments (14.30%) | $ | 1,242,772,684 | $ | 2,286,013,638 | ||||||
| Total Private Equity Investments (Cost $10,339,340,590)(94.44%) | $ | 15,093,711,006 | ||||||||
| Total Investments (Cost $12,134,855,453)(106.26%) | 16,983,588,174 | |||||||||
| Other Assets in Excess of Liabilities ((6.26)%) | (1,000,533,666 | ) | ||||||||
| Net Assetsg (100.00%) | $ | 15,983,054,508 | ||||||||
| * | Direct Investments are private investments directly into the equity or debt of selected operating companies, often together with the management of the company. Primary Investments are investments in newly established private equity partnerships where underlying portfolio companies are not known as of the time of investment. Secondary Investments are portfolios of assets on the secondary market. |
| ** | The Fair Value of any Direct Investment may not necessarily reflect the current or expected future performance of such Direct Investment or the Fair Value of the Fund’s interest in such Direct Investment. Furthermore, the Fair Value of any Direct Investment has not been calculated, reviewed, verified or in any way approved by such Direct Investment or its general partner, manager or sponsor (including any of its affiliates). Please see below for further details regarding the valuation policy of the Fund. |
| *** | Security exempt from registration under Rule 144A of the Securities Act of 1933, as amended (the "Securities Act"). These securities may be sold in certain transactions in reliance on an exemption from registration (normally to "qualified institutional buyers" in accordance with Rule 144(a)(1) under the Securities Act). At June 30, 2025, the aggregate value of these securities is $ 211,878,996 or 1.28% of the Fund's net assets. |
| # | As of June 30, 2025, 1 month EURIBOR was 1.93%. |
| ## | As of June 30, 2025, 3 month EURIBOR was 1.94%. |
| ### | As of June 30, 2025, 6 month EURIBOR was 2.05%. |
| #### | As of June 30, 2025, 12 month EURIBOR was 2.07%. |
The accompanying notes are an integral part of these Consolidated Financial Statements.
Partners Group Private Equity (Master Fund), LLC
(a Delaware Limited Liability Company)
Consolidated Schedule of Investments —
June 30, 2025 (Unaudited) (continued)
| + | The fair value of the investment was determined using significant unobservable inputs. |
| † | As of June 30, 2025, 1 month Bank Bill Swap Rate was 3.61%. |
| †† | As of June 30, 2025, 3 month Bank Bill Swap Rate was 3.60%. |
| > | As of June 30, 2025, 1 month Sterling Overnight Interbank Average Rate was 4.21%. |
| >> | As of June 30, 2025, 3 month Sterling Overnight Interbank Average Rate was 4.31%. |
| >>> | As of June 30, 2025, 6 month Sterling Overnight Interbank Average Rate was 4.43%. |
| ¤ ¤ | As of June 30, 2025, 3 month Stockholm Interbank Offered Rate was 2.14%. |
| v | As of June 30, 2025, 1 month Secured Overnight Financing Rate was 4.32%. |
| vv | As of June 30, 2025, 3 month Secured Overnight Financing Rate was 4.29%. |
| vvv | As of June 30, 2025, 6 month Secured Overnight Financing Rate was 4.15%. |
| vvvv | As of June 30, 2025, 12 month Secured Overnight Financing Rate was 3.88%. |
| a | Private equity investments are generally issued in private placement transactions and as such are generally restricted as to resale. Each investment may have been purchased on various dates and for different amounts. The date of the first purchase is reflected under Acquisition Date as shown in the Schedule of Investments. Total fair value of restricted investments as of June 30, 2025 was is $15,093,711,006 or 94.44% of net assets. Total aggregated cost of restricted securities as of June 30, 2025 was $10,339,340,590. |
| b | Represents an affiliated issuer. |
| c | Investment does not issue shares. |
| d | Non-income producing. |
| e | Investment has been committed to but has not been fully funded by the Fund. |
| f | Security or a portion thereof is unsettled at June 30, 2025. |
| g | Net Assets include $562,326,905 of Repurchase amounts payable for tender offers. |
A summary of outstanding financial instruments at June 30, 2025 is as follows:
Forward Foreign Currency Contracts
| Settlement Date | Counterparty | Currency Purchased | Currency Sold | Value | Unrealized Appreciation (Depreciation) | |||||||||||||
| July 16, 2025 | BNY Mellon | $ | 25,624,402 | zl | 100,000,000 | $ | 26,779,076 | $ | (1,154,673 | ) | ||||||||
| July 16, 2025 | BNY Mellon | zl | 90,000,000 | $ | 24,102,174 | $ | 24,101,168 | $ | (1,006 | ) | ||||||||
| July 16, 2025 | BNY Mellon | zl | 10,000,000 | $ | 2,678,020 | $ | 2,677,907 | $ | (112 | ) | ||||||||
| July 16, 2025 | Barclays | $ | 98,285,733 | € | 90,000,000 | $ | 102,954,383 | $ | (4,668,650 | ) | ||||||||
| July 16, 2025 | Barclays | $ | 32,762,016 | € | 30,000,000 | $ | 34,318,128 | $ | (1,556,112 | ) | ||||||||
| July 16, 2025 | Barclays | $ | 43,569,240 | £ | 33,000,000 | $ | 44,588,194 | $ | (1,018,954 | ) | ||||||||
| July 16, 2025 | Barclays | £ | 20,000,000 | $ | 27,023,746 | $ | 27,023,148 | $ | (598 | ) | ||||||||
| July 16, 2025 | Barclays | £ | 13,000,000 | $ | 17,565,435 | $ | 17,565,046 | $ | (389 | ) | ||||||||
| July 16, 2025 | Barclays | € | 70,000,000 | $ | 80,045,182 | $ | 80,075,631 | $ | 30,449 | |||||||||
| July 16, 2025 | Barclays | € | 80,000,000 | $ | 91,485,816 | $ | 91,515,007 | $ | 29,191 | |||||||||
| July 16, 2025 | ING Barings (U.S.) Capital Markets | $ | 51,501,825 | € | 45,000,000 | $ | 51,477,192 | $ | 24,633 | |||||||||
| July 16, 2025 | ING Barings (U.S.) Capital Markets | $ | 51,501,825 | € | 45,000,000 | $ | 51,477,192 | $ | 24,633 | |||||||||
The accompanying notes are an integral part of these Consolidated Financial Statements.
Partners Group Private Equity (Master Fund), LLC
(a Delaware Limited Liability Company)
Consolidated Schedule of Investments —
June 30, 2025 (Unaudited) (continued)
| Settlement Date | Counterparty | Currency Purchased | Currency Sold | Value | Unrealized Appreciation (Depreciation) | |||||||||||||
| July 16, 2025 | ING Barings (U.S.) Capital Markets | € | 60,000,000 | $ | 68,618,010 | $ | 68,636,255 | $ | 18,245 | |||||||||
| July 16, 2025 | Nomura International PLC | $ | 98,254,800 | € | 90,000,000 | $ | 102,954,383 | $ | (4,699,583 | ) | ||||||||
| July 16, 2025 | Nomura International PLC | € | 45,000,000 | $ | 51,521,400 | $ | 51,477,192 | $ | (44,208 | ) | ||||||||
| July 16, 2025 | Nomura International PLC | € | 45,000,000 | $ | 51,521,400 | $ | 51,477,192 | $ | (44,208 | ) | ||||||||
| July 23, 2025 | BNY Mellon | $ | 25,638,153 | zl | 100,000,000 | $ | 26,785,130 | $ | (1,146,977 | ) | ||||||||
| July 23, 2025 | BNY Mellon | zl | 39,200,000 | $ | 10,496,973 | $ | 10,499,771 | $ | 2,798 | |||||||||
| July 23, 2025 | BNY Mellon | zl | 20,000,000 | $ | 5,355,598 | $ | 5,357,026 | $ | 1,428 | |||||||||
| July 23, 2025 | BNY Mellon | zl | 80,000,000 | $ | 21,434,458 | $ | 21,428,104 | $ | (6,354 | ) | ||||||||
| July 23, 2025 | Bank of America | $ | 21,887,455 | Fr. | 18,000,000 | $ | 22,038,474 | $ | (151,019 | ) | ||||||||
| July 23, 2025 | Bank of America | Fr. | 18,000,000 | $ | 22,037,766 | $ | 22,038,474 | $ | 708 | |||||||||
| July 23, 2025 | Barclays | $ | 98,338,761 | € | 90,000,000 | $ | 103,043,787 | $ | (4,705,026 | ) | ||||||||
| July 23, 2025 | Barclays | $ | 32,787,315 | € | 30,000,000 | $ | 34,347,929 | $ | (1,560,614 | ) | ||||||||
| July 23, 2025 | Barclays | $ | 98,335,665 | € | 90,000,000 | $ | 103,043,787 | $ | (4,708,122 | ) | ||||||||
| July 23, 2025 | Barclays | $ | 10,121,917 | zl | 39,200,000 | $ | 10,499,770 | $ | (377,853 | ) | ||||||||
| July 23, 2025 | Barclays | $ | 24,316,816 | Fr. | 20,000,000 | $ | 24,487,193 | $ | (170,377 | ) | ||||||||
| July 23, 2025 | Barclays | Fr. | 20,000,000 | $ | 24,488,350 | $ | 24,487,194 | $ | (1,156 | ) | ||||||||
| July 23, 2025 | Barclays | € | 60,000,000 | $ | 68,638,386 | $ | 68,695,858 | $ | 57,472 | |||||||||
| July 23, 2025 | Barclays | € | 70,000,000 | $ | 80,151,813 | $ | 80,145,168 | $ | (6,645 | ) | ||||||||
| July 23, 2025 | Barclays | € | 80,000,000 | $ | 91,660,624 | $ | 91,594,477 | $ | (66,147 | ) | ||||||||
| July 30, 2025 | BNY Mellon | $ | 48,658,722 | Fr. | 40,000,000 | $ | 49,011,066 | $ | (352,344 | ) | ||||||||
| July 30, 2025 | BNY Mellon | Fr. | 30,000,000 | $ | 36,758,444 | $ | 36,758,299 | $ | (145 | ) | ||||||||
| July 30, 2025 | BNY Mellon | Fr. | 10,000,000 | $ | 12,253,266 | $ | 12,252,766 | $ | (499 | ) | ||||||||
| July 30, 2025 | Bank of America | $ | 20,970,482 | zl | 80,000,000 | $ | 21,436,335 | $ | (465,853 | ) | ||||||||
| July 30, 2025 | Bank of America | $ | 26,152,494 | zl | 100,000,000 | $ | 26,795,420 | $ | (642,925 | ) | ||||||||
| July 30, 2025 | Bank of America | zl | 60,000,000 | $ | 16,075,874 | $ | 16,077,252 | $ | 1,378 | |||||||||
| July 30, 2025 | Bank of America | zl | 30,000,000 | $ | 8,042,238 | $ | 8,038,626 | $ | (3,612 | ) | ||||||||
| July 30, 2025 | Bank of America | zl | 70,000,000 | $ | 18,754,176 | $ | 18,756,793 | $ | 2,617 | |||||||||
| July 30, 2025 | Bank of America | zl | 20,000,000 | $ | 5,361,492 | $ | 5,359,084 | $ | (2,408 | ) | ||||||||
| July 30, 2025 | Barclays | $ | 16,804,696 | £ | 13,000,000 | $ | 17,569,167 | $ | (764,471 | ) | ||||||||
| July 30, 2025 | Barclays | $ | 98,407,413 | € | 90,000,000 | $ | 103,201,565 | $ | (4,794,152 | ) | ||||||||
| July 30, 2025 | Barclays | $ | 76,531,651 | € | 70,000,000 | $ | 80,267,884 | $ | (3,736,233 | ) | ||||||||
| July 30, 2025 | Barclays | $ | 35,649,650 | £ | 27,000,000 | $ | 36,489,807 | $ | (840,157 | ) | ||||||||
| July 30, 2025 | Barclays | £ | 20,000,000 | $ | 27,030,952 | $ | 27,029,487 | $ | (1,465 | ) | ||||||||
| July 30, 2025 | Barclays | £ | 20,000,000 | $ | 27,030,952 | $ | 27,029,487 | $ | (1,465 | ) | ||||||||
| July 30, 2025 | Barclays | € | 10,000,000 | $ | 11,469,133 | $ | 11,466,841 | $ | (2,292 | ) | ||||||||
| July 30, 2025 | Barclays | € | 70,000,000 | $ | 80,262,833 | $ | 80,267,884 | $ | 5,051 | |||||||||
| July 30, 2025 | Barclays | € | 80,000,000 | $ | 91,753,064 | $ | 91,734,725 | $ | (18,339 | ) | ||||||||
| August 13, 2025 | BNY Mellon | $ | 36,555,497 | Fr. | 30,000,000 | $ | 37,861,652 | $ | (1,306,155 | ) | ||||||||
| August 13, 2025 | BNY Mellon | $ | 26,221,324 | zl | 100,000,000 | $ | 27,626,526 | $ | (1,405,202 | ) | ||||||||
| August 13, 2025 | BNY Mellon | $ | 36,823,144 | Fr. | 30,000,000 | $ | 37,861,653 | $ | (1,038,508 | ) | ||||||||
| August 13, 2025 | Bank of America | $ | 44,473,236 | € | 40,000,000 | $ | 47,053,643 | $ | (2,580,407 | ) | ||||||||
| August 13, 2025 | Bank of America | $ | 5,245,392 | zl | 20,000,000 | $ | 5,525,306 | $ | (279,913 | ) | ||||||||
| August 13, 2025 | Barclays | $ | 76,767,294 | £ | 60,000,000 | $ | 82,191,192 | $ | (5,423,898 | ) | ||||||||
| August 13, 2025 | Barclays | $ | 100,421,127 | € | 90,000,000 | $ | 105,870,697 | $ | (5,449,570 | ) | ||||||||
| August 13, 2025 | Barclays | $ | 77,827,925 | € | 70,000,000 | $ | 82,343,876 | $ | (4,515,951 | ) | ||||||||
| August 13, 2025 | Barclays | $ | 12,186,743 | Fr. | 10,000,000 | $ | 12,620,551 | $ | (433,808 | ) | ||||||||
| August 13, 2025 | Macquarie Bank Limited | $ | 81,040,050 | € | 70,000,000 | $ | 82,343,876 | $ | (1,303,826 | ) | ||||||||
| August 13, 2025 | Macquarie Bank Limited | € | 70,000,000 | $ | 80,907,540 | $ | 82,343,876 | $ | 1,436,336 | |||||||||
| August 20, 2025 | Bank of America | $ | 23,462,056 | zl | 90,000,000 | $ | 24,859,798 | $ | (1,397,742 | ) | ||||||||
| August 20, 2025 | Bank of America | $ | 18,744,750 | zl | 70,000,000 | $ | 19,335,399 | $ | (590,649 | ) | ||||||||
| August 20, 2025 | Bank of America | $ | 5,358,634 | zl | 20,000,000 | $ | 5,524,399 | $ | (165,766 | ) | ||||||||
| August 20, 2025 | Barclays | $ | 84,761,258 | Fr. | 70,000,000 | $ | 88,412,760 | $ | (3,651,502 | ) | ||||||||
| August 20, 2025 | Barclays | $ | 100,471,428 | € | 90,000,000 | $ | 105,915,904 | $ | (5,444,476 | ) | ||||||||
| August 20, 2025 | Barclays | $ | 22,246,118 | € | 20,000,000 | $ | 23,536,868 | $ | (1,290,750 | ) | ||||||||
The accompanying notes are an integral part of these Consolidated Financial Statements.
Partners Group Private Equity (Master Fund), LLC
(a Delaware Limited Liability Company)
Consolidated Schedule of Investments —
June 30, 2025 (Unaudited) (continued)
| Settlement Date | Counterparty | Currency Purchased | Currency Sold | Value | Unrealized Appreciation (Depreciation) | |||||||||||||
| August 20, 2025 | Barclays | $ | 33,399,213 | € | 30,000,000 | $ | 35,305,301 | $ | (1,906,088 | ) | ||||||||
| August 20, 2025 | ING Barings (U.S.) Capital Markets | $ | 19,584,282 | € | 17,500,000 | $ | 20,594,760 | $ | (1,010,478 | ) | ||||||||
| August 20, 2025 | Macquarie Bank Limited | $ | 81,076,450 | € | 70,000,000 | $ | 82,379,037 | $ | (1,302,587 | ) | ||||||||
| August 20, 2025 | Macquarie Bank Limited | € | 70,000,000 | $ | 80,962,910 | $ | 82,379,037 | $ | 1,416,127 | |||||||||
| August 27, 2025 | Bank of America | $ | 25,592,748 | zl | 100,000,000 | $ | 27,610,473 | $ | (2,017,726 | ) | ||||||||
| August 27, 2025 | Barclays | $ | 84,808,291 | Fr. | 70,000,000 | $ | 88,486,306 | $ | (3,678,015 | ) | ||||||||
| August 27, 2025 | Barclays | $ | 100,596,033 | € | 90,000,000 | $ | 105,957,624 | $ | (5,361,591 | ) | ||||||||
| August 27, 2025 | Barclays | $ | 55,690,730 | € | 50,000,000 | $ | 58,865,346 | $ | (3,174,616 | ) | ||||||||
| August 27, 2025 | Macquarie Bank Limited | $ | 81,112,850 | € | 70,000,000 | $ | 82,411,485 | $ | (1,298,635 | ) | ||||||||
| August 27, 2025 | Macquarie Bank Limited | € | 85,000,000 | $ | 98,355,540 | $ | 100,071,089 | $ | 1,715,549 | |||||||||
| September 10, 2025 | Bank of America | $ | 2,614,110 | zl | 10,000,000 | $ | 2,760,597 | $ | (146,487 | ) | ||||||||
| September 10, 2025 | Bank of America | $ | 20,937,059 | zl | 80,000,000 | $ | 22,084,777 | $ | (1,147,718 | ) | ||||||||
| September 10, 2025 | Bank of America | $ | 16,060,791 | zl | 60,000,000 | $ | 16,563,583 | $ | (502,792 | ) | ||||||||
| September 10, 2025 | Bank of America | $ | 8,034,376 | zl | 30,000,000 | $ | 8,281,791 | $ | (247,415 | ) | ||||||||
| September 10, 2025 | Barclays | $ | 52,820,420 | £ | 40,000,000 | $ | 54,811,811 | $ | (1,991,391 | ) | ||||||||
| September 10, 2025 | Barclays | $ | 27,039,178 | £ | 20,000,000 | $ | 27,405,906 | $ | (366,728 | ) | ||||||||
| September 10, 2025 | Barclays | $ | 91,829,960 | € | 80,000,000 | $ | 94,277,379 | $ | (2,447,419 | ) | ||||||||
| September 10, 2025 | ING Barings (U.S.) Capital Markets | $ | 89,525,072 | € | 80,000,000 | $ | 94,277,379 | $ | (4,752,307 | ) | ||||||||
| September 10, 2025 | ING Barings (U.S.) Capital Markets | $ | 89,582,712 | € | 80,000,000 | $ | 94,277,379 | $ | (4,694,667 | ) | ||||||||
| September 10, 2025 | ING Barings (U.S.) Capital Markets | € | 80,000,000 | $ | 91,399,240 | $ | 94,277,379 | $ | 2,878,139 | |||||||||
| September 10, 2025 | ING Barings (U.S.) Capital Markets | € | 80,000,000 | $ | 91,349,400 | $ | 94,277,379 | $ | 2,927,979 | |||||||||
| September 10, 2025 | ING Barings (U.S.) Capital Markets | $ | 68,867,214 | € | 60,000,000 | $ | 70,708,034 | $ | (1,840,820 | ) | ||||||||
| September 10, 2025 | Macquarie Bank Limited | $ | 81,188,450 | € | 70,000,000 | $ | 82,492,706 | $ | (1,304,256 | ) | ||||||||
| September 10, 2025 | Macquarie Bank Limited | € | 85,000,000 | $ | 98,452,950 | $ | 100,169,715 | $ | 1,716,765 | |||||||||
| September 10, 2025 | Nomura International PLC | $ | 28,771,150 | € | 25,700,000 | $ | 30,286,608 | $ | (1,515,458 | ) | ||||||||
| September 10, 2025 | Nomura International PLC | $ | 62,231,215 | € | 55,700,000 | $ | 65,640,625 | $ | (3,409,410 | ) | ||||||||
| September 10, 2025 | Nomura International PLC | $ | 5,592,900 | € | 5,000,000 | $ | 5,892,336 | $ | (299,436 | ) | ||||||||
| September 10, 2025 | Nomura International PLC | € | 8,640,000 | $ | 94,582,080 | $ | 101,819,569 | $ | 7,237,489 | |||||||||
| September 17, 2025 | BNY Mellon | $ | 10,484,266 | zl | 39,200,000 | $ | 10,819,227 | $ | (334,961 | ) | ||||||||
| September 17, 2025 | BNY Mellon | $ | 5,349,116 | zl | 20,000,000 | $ | 5,520,013 | $ | (170,898 | ) | ||||||||
| September 17, 2025 | Bank of America | $ | 19,469,386 | zl | 74,400,000 | $ | 20,534,451 | $ | (1,065,065 | ) | ||||||||
| September 17, 2025 | Bank of America | $ | 4,081,227 | zl | 15,600,000 | $ | 4,305,611 | $ | (224,384 | ) | ||||||||
| September 17, 2025 | Barclays | $ | 26,411,446 | £ | 20,000,000 | $ | 27,406,600 | $ | (995,154 | ) | ||||||||
| September 17, 2025 | Barclays | $ | 26,410,966 | £ | 20,000,000 | $ | 27,406,600 | $ | (995,634 | ) | ||||||||
| September 17, 2025 | Barclays | $ | 27,040,454 | £ | 20,000,000 | $ | 27,406,600 | $ | (366,146 | ) | ||||||||
| September 17, 2025 | Barclays | $ | 80,383,961 | € | 70,000,000 | $ | 82,520,930 | $ | (2,136,969 | ) | ||||||||
| September 17, 2025 | Barclays | $ | 80,453,667 | € | 70,000,000 | $ | 82,520,930 | $ | (2,067,263 | ) | ||||||||
| September 17, 2025 | ING Barings (U.S.) Capital Markets | $ | 70,020,094 | € | 62,500,000 | $ | 73,679,402 | $ | (3,659,308 | ) | ||||||||
| September 17, 2025 | ING Barings (U.S.) Capital Markets | $ | 19,611,016 | € | 17,500,000 | $ | 20,630,232 | $ | (1,019,216 | ) | ||||||||
| September 17, 2025 | ING Barings (U.S.) Capital Markets | $ | 89,683,560 | € | 80,000,000 | $ | 94,309,634 | $ | (4,626,074 | ) | ||||||||
| September 17, 2025 | ING Barings (U.S.) Capital Markets | € | 80,000,000 | $ | 91,448,320 | $ | 94,309,634 | $ | 2,861,314 | |||||||||
| September 17, 2025 | ING Barings (U.S.) Capital Markets | € | 80,000,000 | $ | 91,285,560 | $ | 94,309,634 | $ | 3,024,074 | |||||||||
| September 17, 2025 | Macquarie Bank Limited | $ | 34,810,500 | € | 30,000,000 | $ | 35,366,113 | $ | (555,613 | ) | ||||||||
| September 17, 2025 | Macquarie Bank Limited | € | 15,000,000 | $ | 17,385,000 | $ | 17,683,056 | $ | 298,056 | |||||||||
The accompanying notes are an integral part of these Consolidated Financial Statements.
Partners Group Private Equity (Master Fund), LLC
(a Delaware Limited Liability Company)
Consolidated Schedule of Investments —
June 30, 2025 (Unaudited) (continued)
| Settlement Date | Counterparty | Currency Purchased | Currency Sold | Value | Unrealized Appreciation (Depreciation) | |||||||||||||
| September 17, 2025 | Macquarie Bank Limited | € | 15,000,000 | $ | 17,386,650 | $ | 17,683,056 | $ | 296,406 | |||||||||
| September 24, 2025 | BNY Mellon | $ | 12,339,600 | Fr. | 10,000,000 | $ | 12,683,903 | $ | (344,302 | ) | ||||||||
| September 24, 2025 | Bank of America | $ | 7,959,186 | zl | 30,400,000 | $ | 8,388,095 | $ | (428,909 | ) | ||||||||
| September 24, 2025 | Bank of America | $ | 3,979,594 | zl | 15,200,000 | $ | 4,194,047 | $ | (214,454 | ) | ||||||||
| September 24, 2025 | Bank of America | $ | 5,236,307 | zl | 20,000,000 | $ | 5,518,484 | $ | (282,177 | ) | ||||||||
| September 24, 2025 | Bank of America | $ | 6,376,904 | zl | 24,400,000 | $ | 6,732,550 | $ | (355,646 | ) | ||||||||
| September 24, 2025 | Barclays | $ | 48,995,950 | Fr. | 40,000,000 | $ | 50,735,608 | $ | (1,739,658 | ) | ||||||||
| September 24, 2025 | Barclays | $ | 52,823,468 | £ | 40,000,000 | $ | 54,814,544 | $ | (1,991,076 | ) | ||||||||
| September 24, 2025 | Barclays | $ | 27,036,440 | £ | 20,000,000 | $ | 27,407,272 | $ | (370,832 | ) | ||||||||
| September 24, 2025 | Barclays | $ | 24,682,411 | Fr. | 20,000,000 | $ | 25,367,804 | $ | (685,393 | ) | ||||||||
| September 24, 2025 | Barclays | $ | 68,929,908 | € | 60,000,000 | $ | 70,760,619 | $ | (1,830,711 | ) | ||||||||
| September 24, 2025 | Barclays | $ | 92,049,672 | € | 80,000,000 | $ | 94,347,492 | $ | (2,297,820 | ) | ||||||||
| September 24, 2025 | ING Barings (U.S.) Capital Markets | $ | 70,116,456 | € | 62,500,000 | $ | 73,708,978 | $ | (3,592,522 | ) | ||||||||
| September 24, 2025 | ING Barings (U.S.) Capital Markets | $ | 19,616,840 | € | 17,500,000 | $ | 20,638,514 | $ | (1,021,674 | ) | ||||||||
| September 24, 2025 | ING Barings (U.S.) Capital Markets | $ | 89,779,064 | € | 80,000,000 | $ | 94,347,492 | $ | (4,568,428 | ) | ||||||||
| September 24, 2025 | ING Barings (U.S.) Capital Markets | € | 80,000,000 | $ | 91,435,400 | $ | 94,347,492 | $ | 2,912,092 | |||||||||
| September 24, 2025 | ING Barings (U.S.) Capital Markets | € | 80,000,000 | $ | 91,341,080 | $ | 94,347,492 | $ | 3,006,412 | |||||||||
| September 24, 2025 | Macquarie Bank Limited | $ | 81,260,900 | € | 70,000,000 | $ | 82,554,055 | $ | (1,293,155 | ) | ||||||||
| September 24, 2025 | Macquarie Bank Limited | € | 85,000,000 | $ | 98,566,850 | $ | 100,244,210 | $ | 1,677,360 | |||||||||
| October 22, 2025 | BNY Mellon | $ | 24,053,174 | zl | 90,000,000 | $ | 24,820,401 | $ | (767,227 | ) | ||||||||
| October 22, 2025 | Bank of America | $ | 22,290,177 | Fr. | 18,000,000 | $ | 22,907,087 | $ | (616,910 | ) | ||||||||
| October 22, 2025 | Barclays | $ | 11,534,303 | € | 10,000,000 | $ | 11,816,465 | $ | (282,162 | ) | ||||||||
| October 22, 2025 | Barclays | $ | 92,274,424 | € | 80,000,000 | $ | 94,531,718 | $ | (2,257,294 | ) | ||||||||
| October 29, 2025 | BNY Mellon | $ | 2,672,255 | zl | 10,000,000 | $ | 2,757,339 | $ | (85,083 | ) | ||||||||
| October 29, 2025 | BNY Mellon | $ | 21,392,010 | zl | 80,000,000 | $ | 22,058,706 | $ | (666,696 | ) | ||||||||
| October 29, 2025 | Barclays | $ | 17,577,879 | £ | 13,000,000 | $ | 17,819,829 | $ | (241,950 | ) | ||||||||
| October 29, 2025 | Barclays | $ | 80,756,669 | € | 70,000,000 | $ | 82,749,717 | $ | (1,993,048 | ) | ||||||||
| December 10, 2025 | ING Barings (U.S.) Capital Markets | $ | 91,941,856 | € | 80,000,000 | $ | 93,035,728 | $ | (1,093,872 | ) | ||||||||
| December 10, 2025 | ING Barings (U.S.) Capital Markets | $ | 99,189,180 | € | 85,700,000 | $ | 99,664,523 | $ | (475,343 | ) | ||||||||
| December 10, 2025 | ING Barings (U.S.) Capital Markets | € | 85,700,000 | $ | 99,900,490 | $ | 99,664,523 | $ | (235,967 | ) | ||||||||
| December 10, 2025 | ING Barings (U.S.) Capital Markets | € | 80,000,000 | $ | 93,256,000 | $ | 93,035,728 | $ | (220,272 | ) | ||||||||
| December 10, 2025 | Nomura International PLC | $ | 56,813,913 | € | 50,700,000 | $ | 58,961,392 | $ | (2,147,479 | ) | ||||||||
| December 10, 2025 | Nomura International PLC | $ | 39,238,850 | € | 35,000,000 | $ | 40,703,131 | $ | (1,464,281 | ) | ||||||||
| December 10, 2025 | Nomura International PLC | € | 85,700,000 | $ | 99,259,454 | $ | 99,664,523 | $ | 405,069 | |||||||||
| March 11, 2026 | ING Barings (U.S.) Capital Markets | $ | 92,447,536 | € | 80,000,000 | $ | 95,210,334 | $ | (2,762,798 | ) | ||||||||
| March 11, 2026 | Nomura International PLC | $ | 62,576,165 | € | 55,700,000 | $ | 66,290,195 | $ | (3,714,030 | ) | ||||||||
| March 11, 2026 | Nomura International PLC | $ | 23,268,870 | € | 20,700,000 | $ | 24,635,674 | $ | (1,366,804 | ) | ||||||||
| March 11, 2026 | Nomura International PLC | $ | 11,228,500 | € | 10,000,000 | $ | 11,901,292 | $ | (672,792 | ) | ||||||||
| June 10, 2026 | ING Barings (U.S.) Capital Markets | $ | 92,853,800 | € | 80,000,000 | $ | 95,633,501 | $ | (2,779,701 | ) | ||||||||
| June 10, 2026 | Macquarie Bank Limited | $ | 100,073,050 | € | 85,000,000 | $ | 101,610,595 | $ | (1,537,545 | ) | ||||||||
| June 10, 2026 | Nomura International PLC | $ | 45,076,000 | € | 40,000,000 | $ | 47,816,750 | $ | (2,740,750 | ) | ||||||||
| June 10, 2026 | Nomura International PLC | $ | 51,526,979 | € | 45,700,000 | $ | 54,630,637 | $ | (3,103,658 | ) | ||||||||
| September 9, 2026 | ING Barings (U.S.) Capital Markets | $ | 93,260,776 | € | 80,000,000 | $ | 96,085,472 | $ | (2,824,696 | ) | ||||||||
The accompanying notes are an integral part of these Consolidated Financial Statements.
Partners Group Private Equity (Master Fund), LLC
(a Delaware Limited Liability Company)
Consolidated Schedule of Investments —
June 30, 2025 (Unaudited) (continued)
| Settlement Date | Counterparty | Currency Purchased | Currency Sold | Value | Unrealized Appreciation (Depreciation) | |||||||||||||
| September 9, 2026 | Macquarie Bank Limited | $ | 100,480,200 | € | 85,000,000 | $ | 102,090,814 | $ | (1,610,614 | ) | ||||||||
| September 9, 2026 | Nomura International PLC | $ | 62,872,768 | € | 55,700,000 | $ | 66,899,510 | $ | (4,026,742 | ) | ||||||||
| September 9, 2026 | Nomura International PLC | $ | 17,735,505 | € | 15,700,000 | $ | 18,856,774 | $ | (1,121,269 | ) | ||||||||
| September 9, 2026 | Nomura International PLC | $ | 16,950,450 | € | 15,000,000 | $ | 18,016,026 | $ | (1,065,576 | ) | ||||||||
| December 2, 2026 | ING Barings (U.S.) Capital Markets | $ | 93,487,960 | € | 80,000,000 | $ | 96,426,658 | $ | (2,938,698 | ) | ||||||||
| December 2, 2026 | Macquarie Bank Limited | $ | 100,839,886 | € | 85,000,000 | $ | 102,453,324 | $ | (1,613,438 | ) | ||||||||
| December 2, 2026 | Nomura International PLC | $ | 93,757,943 | € | 85,700,000 | $ | 103,297,058 | $ | (9,539,115 | ) | ||||||||
| March 10, 2027 | ING Barings (U.S.) Capital Markets | $ | 93,825,448 | € | 80,000,000 | $ | 96,675,315 | $ | (2,849,867 | ) | ||||||||
| March 10, 2027 | Macquarie Bank Limited | $ | 83,361,278 | € | 70,000,000 | $ | 84,590,901 | $ | (1,229,623 | ) | ||||||||
| March 10, 2027 | Macquarie Bank Limited | $ | 17,873,400 | € | 15,000,000 | $ | 18,126,622 | $ | (253,222 | ) | ||||||||
| March 10, 2027 | Nomura International PLC | $ | 96,847,488 | € | 86,400,000 | $ | 104,409,340 | $ | (7,561,852 | ) | ||||||||
| June 16, 2027 | ING Barings (U.S.) Capital Markets | $ | 102,532,637 | € | 85,700,000 | $ | 103,923,166 | $ | (1,390,529 | ) | ||||||||
| June 16, 2027 | ING Barings (U.S.) Capital Markets | $ | 95,697,080 | € | 80,000,000 | $ | 97,011,123 | $ | (1,314,043 | ) | ||||||||
| June 16, 2027 | Macquarie Bank Limited | $ | 83,694,506 | € | 70,000,000 | $ | 84,884,733 | $ | (1,190,227 | ) | ||||||||
| June 16, 2027 | Macquarie Bank Limited | $ | 17,938,350 | € | 15,000,000 | $ | 18,189,586 | $ | (251,236 | ) | ||||||||
| $ | (195,641,387 | ) | ||||||||||||||||
Legend:
| £ | - British Pound |
| € | - Euro |
| BBSY | - Bank Bill Swap Rate |
| E | - EURIBOR |
| Fr. | - Swiss Franc |
| PIK | - Payment-in-kind |
| S | - Sterling Overnight Interbank Average Rate |
| SF | - Secured Overnight Financing Rate |
| SR | - Stockholm Interbank Offered Rate |
| zl | - Polish Zloty |
The accompanying notes are an integral part of these Consolidated Financial Statements.
The information contained in this section should be read in conjunction with the Fund’s audited consolidated financial statements contained in its annual report for the year ended March 31, 2025.
Investments held by the Fund include short-term investments, publicly traded equity (“Public Investments”), direct equity and debt investments in operating companies (“Direct Investments”) and primary and secondary investments in private equity funds (“Primary Investments” and “Secondary Investments”, respectively, and together, “Private Equity Fund Investments”; Direct Investments and Private Equity Fund Investments, collectively, “Private Equity Investments”).
Partners Group (USA) Inc. (the “Adviser”) determines the fair value of the Fund’s Private Equity Investments in conformity with U.S. generally accepted accounting principles (“U.S. GAAP”) and the Fund's valuation procedures (the “Valuation Procedures”), which have been approved by the board of managers of the Fund (the “Board”). As authorized by the Valuation Procedures, the Adviser values the Fund’s Private Equity Investments in consultation with its affiliates. The Valuation Procedures require evaluation of all relevant factors reasonably available to the Adviser and its affiliates at the time the Fund’s Private Equity Investments are valued.
The Valuation Procedures are implemented by the Adviser and State Street Bank and Trust Company, as the Fund’s administrator (the “Administrator”). Both the Adviser and the Administrator are subject to the oversight of, and report to, the Board. The Adviser and the Administrator monitor and review the methodologies of the various third-party pricing services that are employed by the Fund.
The Adviser and certain of its affiliates act as investment advisers to clients other than the Fund. However, the valuation attributed to a Private Equity Investment held by the Fund and the valuation attributable to the same Private Equity Investment held by another client or by one of its affiliates or by a client of one of its affiliates might differ due to differences in accounting, regulatory and other factors applicable to the Fund and to such other client or the Adviser’s affiliate.
In conformity with U.S. GAAP, investments are classified in their entirety based on the lowest level of input that is significant to the fair value measurement. Estimated fair values may differ from the values that would have been used if a ready market existed or if the investments were liquidated at the valuation date. A three-level hierarchy is used to distinguish between (A) inputs that reflect the assumptions market participants would use in pricing an asset or liability developed based on market data obtained from sources independent of the reporting entity (observable inputs) and (B) inputs that reflect the reporting entity’s own assumptions about the assumptions market participants would use in pricing an asset or liability developed based on the best information available in the circumstances (unobservable inputs). This distinction determines the classification of fair value measurements for disclosure purposes.
The various types of inputs used in determining the value of the Fund’s investments are summarized below for each of the three levels:
| ● | Level 1 – Pricing inputs are quoted prices available in active markets for identical investments as of the measurement date. The type of investments included in Level 1 include marketable securities that are primarily traded on one or more of the U.S. national securities exchanges, the Nasdaq Stock Market or any foreign stock exchange. The fair value is determined to be the last sale price on the determination date, or, if no sales occurred on that date, the closing bid price on the determination date. In accordance with authoritative guidance, the Fund does not apply a blockage discount to the quoted price for these investments, even in situations where the Fund holds a large position in an investment and a sale could reasonably impact the quoted price. |
| ● | Level 2 – Pricing inputs are observable inputs other than quoted prices for identical assets in active markets (i.e., not Level 1 inputs). Fair value is determined using models or other valuation methodologies through direct or indirect corroboration with observable market data. Investments that are generally included in this category include corporate notes, convertible notes, warrants and restricted public equity securities. The fair value of legally restricted equity securities may be discounted depending on the likely impact of the restrictions on liquidity and the Adviser’s estimates. |
| ● | Level 3 – Pricing inputs are unobservable for the investment and include situations where there is little, if any, market activity for the investment. The inputs into the determination of fair value require significant management judgment and/or estimation. Investments that are included in this category are private equity and debt investments, as well as convertible notes and warrants that are not actively traded. The fair value for investments using Level 3 pricing inputs is based on the Adviser’s estimates that consider a combination of various factors and performance measurements. These factors and measurements include the timing of the transaction; the market in which the investment operates; comparable market transactions; operational performance and projections of the investments; various performance multiples as applied to earnings before interest, taxes, depreciation, and amortization or a similar measure of earnings for the latest reporting period or a forward period; brokers’ quotes; and discounted cash flow analysis. |
Due to the inherent uncertainty of estimates, fair value determinations based on estimates may materially differ from the values that would have been used had a ready market for the securities existed. The following is a summary of the Fund's investments classified in the fair value hierarchy as of June 30, 2025:
| Investments | Level 1 | Level 2 | Level 3 | Total | ||||||||||||
| Common Stocks | $ | 624,235,728 | $ | — | $ | — | $ | 624,235,728 | ||||||||
| High Yield Bonds | — | 171,255,971 | — | 171,255,971 | ||||||||||||
| Asset-Backed Securities | — | — | 79,036,744 | 79,036,744 | ||||||||||||
| Floating Rate Loans | — | — | 1,015,348,725 | 1,015,348,725 | ||||||||||||
| Direct Investments: | — | — | — | — | ||||||||||||
| Direct Equity | 71,285,085 | 730,307 | 9,050,510,420 | 9,122,525,812 | ||||||||||||
| Direct Debt | — | 4,838,882 | 981,667,479 | 986,506,361 | ||||||||||||
| Total Direct Investments | $ | 71,285,085 | $ | 5,569,189 | $ | 10,032,177,899 | $ | 10,109,032,173 | ||||||||
| Secondary Investments | — | — | 2,698,665,195 | 2,698,665,195 | ||||||||||||
| Primary Investments | — | — | 2,286,013,638 | 2,286,013,638 | ||||||||||||
| Total Investments | $ | 695,520,813 | $ | 176,825,160 | $ | 16,111,242,201 | $ | 16,983,588,174 | ||||||||
| Other Financial Instruments | ||||||||||||||||
| Assets | ||||||||||||||||
| Foreign Currency Exchange Contracts | $ | — | $ | 34,007,770 | $ | — | $ | 34,007,770 | ||||||||
| Total Assets | $ | — | $ | 34,007,770 | $ | — | $ | 34,007,770 | ||||||||
| Liabilities | ||||||||||||||||
| Foreign Currency Exchange Contracts | $ | — | $ | (229,649,157 | ) | $ | — | $ | (229,649,157 | ) | ||||||
| Total Liabilities | $ | — | $ | (229,649,157 | ) | $ | — | $ | (229,649,157 | ) | ||||||
| Total Investments Net of Foreign Currency Exchange Contracts | $ | 695,520,813 | $ | (18,816,227 | ) | $ | 16,111,242,201 | $ | 16,787,946,787 | |||||||
The following is a reconciliation of the amount of the account balances on April 1, 2025 and June 30, 2025 of those investments in which significant unobservable inputs (Level 3) were used in determining value:
| Balance as of April 1, 2025 | Realized Gain/(Loss) | Net Change in Unrealized Appreciation / (Depreciation) | Gross Purchases | Gross Sales | Net Amortization of Discount / (Premium) | Net Transfers In or Out of Level 3 | Balance as of June 30, 2025 | |||||||||||||||||||||||||
| Asset-Backed Securities | $ | 77,121,627 | $ | 25,928 | $ | 1,438,251 | $ | 3,930,000 | $ | (3,483,468 | ) | $ | 4,406 | $ | — | $ | 79,036,744 | |||||||||||||||
| Floating Rate Loans | $ | 326,426,005 | $ | (106,987 | ) | $ | 30,268,268 | $ | 964,726,363 | $ | (309,406,982 | ) | $ | 480,055 | $ | 2,962,003 | $ | 1,015,348,725 | ||||||||||||||
| Direct Investments: | ||||||||||||||||||||||||||||||||
| Direct Equity Investments | $ | 8,585,997,164 | $ | 78,798,842 | $ | 458,976,986 | $ | 81,044,995 | $ | (154,307,567 | ) | $ | — | $ | — | $ | 9,050,510,420 | |||||||||||||||
| Direct Debt Investments | $ | 1,404,999,348 | $ | 213,101 | $ | 33,602,653 | $ | 468,847,917 | $ | (923,826,973 | ) | $ | 793,436 | $ | (2,962,003 | ) | $ | 981,667,479 | ||||||||||||||
| Total Direct Investments* | $ | 9,990,996,512 | $ | 79,011,943 | $ | 492,579,639 | $ | 549,892,912 | $ | (1,078,134,540 | ) | $ | 793,436 | $ | (2,962,003 | ) | $ | 10,032,177,899 | ||||||||||||||
| Secondary Investments* | $ | 2,671,931,827 | $ | 1,000,570 | $ | 43,475,873 | $ | 100,564,765 | $ | (118,307,840 | ) | $ | — | $ | — | $ | 2,698,665,195 | |||||||||||||||
| Primary Investments* | $ | 2,201,976,666 | $ | 251,178 | $ | 60,008,183 | $ | 59,794,006 | $ | (36,016,395 | ) | $ | — | $ | — | $ | 2,286,013,638 | |||||||||||||||
| Total | $ | 15,268,452,637 | $ | 80,182,632 | $ | 627,770,214 | $ | 1,678,908,046 | $ | (1,545,349,225 | ) | $ | 1,277,897 | $ | — | $ | 16,111,242,201 | |||||||||||||||
| * | For the purposes of the tables above: (i) “Direct Investments” are private investments directly in the equity or debt of selected operating companies, often together with the management of the investee operating company; (ii) “Primary Investments” are investments in newly established private equity partnerships where underlying portfolio companies are generally not known as of the time of investment; and “Secondary Investments” are single or portfolios of assets acquired on the secondary market. However, in the private equity market sector the term “Secondary Investments” is generally understood to mean Private Equity Fund Investments acquired in the secondary market. Notwithstanding the foregoing, if the Fund reasonably determines that the strict application of the above definitions would not reflect the economic substance of any investment, the Fund may re-classify such investment as it deems appropriate. |
Changes in inputs or methods used for valuing investments may result in transfers in or out of levels within the fair value hierarchy. The inputs or methods used for valuing investments may not necessarily be an indication of the risk associated with investing in those investments. Transfers between levels of the fair value hierarchy are reported at the beginning of the reporting period in which they occur. For the three months ended June 30, 2025, transfers out of Level 3 were due to increased price transparency.
The amount of the net change in unrealized appreciation (depreciation) for the three months ended June 30, 2025 relating to investments in Level 3 assets still held at June 30, 2025 is $612,621,000, which is included as a component of net change in accumulated unrealized depreciation on investments on the Consolidated Statement of Operations.
The following is a summary of quantitative information about significant unobservable valuation inputs approved by the Adviser for Level 3 Fair Value Measurements for investments held as of June 30, 2025:
| Type of Security | Fair Value at June 30, 2025 (000’s)* | Valuation Technique(s) | Unobservable Input | Range (weighted average) | ||||||
| Asset Backed Securities | $ | 79,037 | Adjusted reported net asset value | Reported net asset value | n/a | |||||
| Floating Rate Loans | $ | 406,088 | Adjusted reported net asset value | Reported net asset value | n/a | |||||
| Direct Equity | $ | 1,015,349 | Discounted cash flow | Discount factor | 9.20% – 20.31% (15.56%) | |||||
| 7,158,019 | Market comparable companies | Enterprise value to EBITDA multiple | 3.20x – 32.50x (17.59x) | |||||||
| 106,820 | Market comparable companies | Price to book ratio | 1.90x – 1.90x (1.90x) | |||||||
| 224,899 | Exit price | Recent transaction price | n/a | |||||||
| 553,550 | Recent financing/transaction | Recent transaction price | n/a | |||||||
| 7,865 | Reported fair value | Reported fair value | n/a | |||||||
| 168,761 | Market comparable companies | Enterprise value to sales multiple | 1.34x– 18.50x (10.28x) | |||||||
| Direct Debt | $ | 524,398 | Broker quotes | Indicative quotes for an inactive market | n/a | |||||
| 370,182 | Discounted cash flow | Discount factor | 8.00% – 28.00% (9.87%) | |||||||
| 738 | Market comparable companies | Enterprise value to EBITDA multiple | 8.00x – 14.00x (10.79x) | |||||||
| 46,538 | Exit price | Recent transaction price | n/a | |||||||
| 30,190 | Recent financing/transaction | Recent transaction price | n/a | |||||||
| 9,621 | Market comparable companies | Enterprise value to sales multiple | 14.10x – 14.10x (14.10x) | |||||||
| Primary and Secondary Investments | $ | 4,984,679 | Adjusted reported net asset value | Reported net asset value | n/a | |||||
| * | Level 3 fair value includes accrued interest. |
Level 3 Direct Equity Investments valued using an unobservable input are directly affected by a change in that input. For Level 3 Direct Debt Investments, the Fund estimates fair value utilizing earnings and multiples analysis or an analysis of discounted cash flows that considers the credit risk and interest rate risk of the particular investment. For Direct Investments, significant increases or decreases in these inputs in isolation would result in a significantly lower or higher fair value measurements.
Forward Foreign Currency Exchange Contracts
The Fund may enter into forward foreign currency exchange contracts to manage foreign exchange rate risk. These contracts for the purchase or sale of a specific foreign currency at a fixed price on a future date may be entered into as a hedge against either specific transactions or portfolio positions. The objective of the Fund’s foreign currency hedging transactions is to reduce the risk that the U.S. Dollar value of the Fund’s foreign currency denominated investments will decline due to changes in foreign currency exchange rates. All forward foreign currency exchange contracts are “marked-to-market” daily at the applicable translation rates resulting in unrealized gains or losses. Realized gains or losses are recorded at the time the forward foreign currency exchange contract is offset by entering into a closing transaction or by the delivery or receipt of the currency. The potential inability of counterparties to meet the terms of their contracts and unanticipated movements in the value of a foreign currency relative to the U.S. Dollar are inherent in forward foreign currency exchange contracts.
During the three months ended June 30, 2025, the Fund entered into 192 long/short forward foreign currency exchange contracts. The Fund had $(120,416,671) in net realized gains (losses) and $(141,904,903) net change in unrealized appreciation (depreciation) on forward foreign currency exchange contracts. The outstanding forward foreign currency exchange contract amounts at June 30, 2025 are representative of contract amounts during the period.
Affiliated Investments
Under Section 2(a)(3) of the Investment Company Act, a portfolio company is considered “affiliated” with the Fund if the Fund owns five percent or more of such portfolio company's outstanding voting securities. The Fund held at least five percent of the outstanding voting securities of the following portfolio companies as of June 30, 2025:
| Shares/ Principal as of June 30, 2025 | Fair Value as of March 31, 2025 | Gross Additions(1) | Gross Reductions(2) | Realized Gains/ Losses | Change in Unrealized Gains (Losses) | Fair Value as of June 30, 2025 | Affiliated Income/ Accretion of Discount | |||||||||||||||||||||||||
| Non-Controlled Affiliates | ||||||||||||||||||||||||||||||||
| Bock Capital JVCo Nature S.à.r.l. | 12,590,000,000 | $ | 241,107,667 | $ | - | $ | - | $ | - | $ | 54,073,840 | $ | 295,181,507 | $ | - | |||||||||||||||||
| CapitalSpring Finance Company, LLC | 6,166,980 | 5,209,283 | 155,851 | - | - | 100,103 | 5,465,237 | 155,851 | ||||||||||||||||||||||||
| Confluent Health Holdings LP | 30,344 | 70,678,267 | - | - | - | 863,423 | 71,541,690 | 400,432 | ||||||||||||||||||||||||
| Dermatology Holdings, L.P.(4) | - | 171,952,426 | - | - | - | 71,651 | 172,024,077 | - | ||||||||||||||||||||||||
| Ecom Express Private Limited(4)(5) | 63,417 | 7,672,908 | 1 | - | - | (7,672,909 | ) | - | - | |||||||||||||||||||||||
| ECP Parent, LLC | 114,028,360 | 116,129,850 | - | - | - | 751,203 | 116,881,053 | 162,120 | ||||||||||||||||||||||||
| EdgeCore Holdings LP(4) | - | 155,593,184 | 2,386,547 | - | - | 21,057,397 | 179,037,128 | - | ||||||||||||||||||||||||
| Encore Holdings LP | 67,986 | 151,981,910 | - | - | - | 8,460,394 | 160,442,304 | - | ||||||||||||||||||||||||
| EnfraGen LLC | 37,786 | 90,596,577 | 32,063 | - | - | (37,712 | ) | 90,590,928 | 2,138,365 | |||||||||||||||||||||||
| Gateway Fleets Holdings, LP(4) | - | 1,816,000 | 17,960 | - | - | (17,960 | ) | 1,816,000 | - | |||||||||||||||||||||||
| Green DC LuxCo Sarl | 46,167,289 | 249,885,870 | 5,124,990 | (6,156 | ) | - | 25,917,973 | 280,922,677 | - | |||||||||||||||||||||||
| Icebox Holdco I Inc(4) | - | 62,798,626 | - | - | - | 199,082 | 62,997,708 | 760,180 | ||||||||||||||||||||||||
| Icebox Parent LP(4) | - | 303,143,923 | - | - | - | 1,155,136 | 304,299,059 | - | ||||||||||||||||||||||||
| Idera, Inc.(4) | - | 1,136,766 | - | (1,219,975 | ) | - | 83,209 | - | 732,017 | |||||||||||||||||||||||
| Idera Parent L.P.(4) | - | 180,121,935 | - | - | - | (11,440,792 | ) | 168,681,143 | 203,748 | |||||||||||||||||||||||
| KPOCH Holdings, L.P.(4) | - | 200,518,312 | - | - | - | (583,312 | ) | 199,935,000 | 1,279,511 | |||||||||||||||||||||||
| KPSKY Holdings L.P.(4) | - | 45,279,023 | - | - | - | 59,472 | 45,338,495 | 148,950 | ||||||||||||||||||||||||
| Luxembourg Investment Company 285 S.à.r.l.(6) | 14,865,773 | 9,221,658 | - | - | - | (3,183,348 | ) | 6,038,310 | - | |||||||||||||||||||||||
| Luxembourg Investment Company 293 S.à.r.l. | 9,789,622 | 53,001,474 | 1 | (7,909,820 | ) | (1,135,995 | ) | (5,413,346 | ) | 38,542,314 | - | |||||||||||||||||||||
| Luxembourg Investment Company 314 S.à.r.l.(6) | 192,000 | 1 | - | - | - | - | 1 | - | ||||||||||||||||||||||||
| Luxembourg Investment Company 404 S.à r.l. | 145,800 | 23,771,673 | - | (4,659 | ) | 197 | 2,158,128 | 25,925,339 | - | |||||||||||||||||||||||
| Luxembourg Investment Company 414 S.à r.l. | 12,316,087 | 113,657,149 | - | (3,927 | ) | (229 | ) | 12,449,158 | 126,102,151 | - | ||||||||||||||||||||||
| Luxembourg Investment Company 430 S.à r.l. | 52,594,635 | 79,722,892 | - | (2,874 | ) | (249 | ) | 4,842,313 | 84,562,082 | 62,148 | ||||||||||||||||||||||
| MHS Acquisition Holdings, LLC | 35,641 | 510,423 | - | - | - | (70,954 | ) | 439,469 | - | |||||||||||||||||||||||
| MHS Blocker Purchaser L.P.(4) | - | 39,465,468 | - | - | - | (5,486,095 | ) | 33,979,373 | - | |||||||||||||||||||||||
| Orbiter Investments S.à.r.l. | 8,568,857 | 225,400,615 | - | - | - | 1,893,921 | 227,294,536 | - | ||||||||||||||||||||||||
| Partners Group Satellite HoldCo S.à.r.l. | 14,993,879 | 39,639,485 | 27,940 | - | - | 3,664,987 | 43,332,412 | - | ||||||||||||||||||||||||
| Partners Group Satellite Warehouse S.C.S.(4) | - | 1,061,955 | 677 | - | - | 65,378 | 1,128,010 | - | ||||||||||||||||||||||||
| Partners Terra Pte. Ltd. | 7,980,885 | 11,267,935 | - | (5,004 | ) | (838 | ) | 316,741 | 11,578,834 | - | ||||||||||||||||||||||
| PG BRPC Investment, LLC | 32,079 | 76,446,421 | - | - | - | 2,694,180 | 79,140,601 | 402,739 | ||||||||||||||||||||||||
| PG Delta Holdco, LLC | 42,616 | 111,748,823 | - | - | - | (10,316,493 | ) | 101,432,330 | 461,039 | |||||||||||||||||||||||
| PG Esmeralda Pte. Ltd. | 12,790,872 | 13,641,842 | - | (3,906 | ) | - | 7,906,663 | 21,544,599 | - | |||||||||||||||||||||||
| PG Investment Company 18 S.à.r.l. | 126,506,637 | 221,932,059 | - | (455 | ) | 41 | 28,931,125 | 250,862,770 | 483,074 | |||||||||||||||||||||||
| PG Investment Company 24 S.à.r.l. | 102,251,076 | 152,967,457 | - | - | - | 21,717,094 | 174,684,551 | 700,666 | ||||||||||||||||||||||||
| PG Investment Company 60 S.à.r.l. | 894,375 | 6,835,284 | 1,677,409 | - | - | 1,312,574 | 9,825,267 | - | ||||||||||||||||||||||||
| PG Investment Company 76 S.à.r.l. | 43,837,247 | 47,907,475 | - | (686 | ) | 9 | 4,612,123 | 52,518,921 | - | |||||||||||||||||||||||
| PG Lion Management Warehouse S.C.S(4)(6) | - | 64,839 | - | - | - | (10,339 | ) | 54,500 | - | |||||||||||||||||||||||
| PG TLP S.à r.l. | 6,473,126 | 141,565,096 | (1 | ) | (5,193 | ) | (361 | ) | 21,127,191 | 162,686,732 | - | |||||||||||||||||||||
| PG Wave Limited | 53,215,581 | 103,594,992 | - | - | - | 6,674,726 | 110,269,718 | - | ||||||||||||||||||||||||
| Pharmathen GP S.à r.l. | 110,300 | 1 | - | - | - | - | 1 | - | ||||||||||||||||||||||||
| Pharmathen Topco S.à r.l. | 102,498,368 | 132,405,722 | - | (3,128 | ) | (45 | ) | 18,717,890 | 151,120,439 | - | ||||||||||||||||||||||
| Polyusus Lux XVI S.à.r.l. | 533,762,359 | 2,998,142 | 7,961 | (434 | ) | 53 | 251,731 | 3,257,453 | - | |||||||||||||||||||||||
| Root JVCo S.à r.l. | 29,599,124 | 126,884,066 | 40,865 | (3,021 | ) | (104 | ) | 12,619,048 | 139,540,854 | 125,018 | ||||||||||||||||||||||
| SnackTime PG Holdings, Inc. | 12 | - | (1 | ) | - | - | 1 | - | 54,523 | |||||||||||||||||||||||
| Specialty Pharma Holdings LP(4) | - | 143,805,401 | - | - | - | 28,510 | 143,833,911 | 225,908 | ||||||||||||||||||||||||
| Sunsure Energy Private Limited | 4,942,819 | 22,603,243 | 6,857 | (2,288 | ) | - | 1,204,749 | 23,812,561 | 71,700 | |||||||||||||||||||||||
| SureWerx Topco, L.P.(4) | - | 65,339,470 | - | - | - | 5,033,701 | 70,373,171 | 335,299 | ||||||||||||||||||||||||
| Surfaces SLP (SCSp)(4) | - | 23,277,717 | - | - | - | 913,213 | 24,190,930 | - | ||||||||||||||||||||||||
| Thermostat Purchaser, L.P.(4) | - | 113,403,193 | - | - | - | 441,967 | 113,845,160 | - | ||||||||||||||||||||||||
| WHCG Purchaser, L.P. | 10,934,833 | 27,437,454 | - | - | - | (1,453,933 | ) | 25,983,521 | - | |||||||||||||||||||||||
| Zenith Longitude Limited | 26,838,037 | 364,712,669 | - | - | - | (7,099,735 | ) | 357,612,934 | 4,299,165 | |||||||||||||||||||||||
| Zoncolan Topco S.à r.l. | 25,768,622 | 105,475,627 | 33,891,851 | (33,899,088 | ) | (2,397,778 | ) | 11,935,046 | 115,005,658 | - | ||||||||||||||||||||||
| Total Non-Controlled Affiliates | $ | 4,657,390,248 | $ | 43,370,971 | $ | (43,070,614 | ) | $ | (3,535,299 | ) | $ | 231,518,113 | $ | 4,885,673,419 | $ | 13,202,453 | ||||||||||||||||
| (1) | Gross additions may include increases in the cost basis of investments resulting from new portfolio investments, the accretion of discounts and the exchange of one or more existing securities for one or more new securities. |
| (2) | Gross reductions may include decreases in the cost basis of investments resulting from principal collections related to investment repayments or sales and the exchange of one or more existing securities for one or more new securities. |
| (3) | Investment was exited during the period ended June 30, 2025. |
| (4) | Investment does not issue shares. |
| (5) | This investment is associated with PG Esmeralda Pte. Ltd. |
| (6) | Luxembourg Investment Company 285 S.à.r.l, Luxembourg Investment Company 314 S.à.r.l and PG Lion Management Warehouse S.C.S. are related to the same investment. |
Subsequent Events
Management has evaluated the impact of all subsequent events on the Fund and determined that there were no subsequent events that require disclosure in the consolidated financial statements.