Year Ended December 31, 2018 Year Ended December 31, 2019 Year Ended
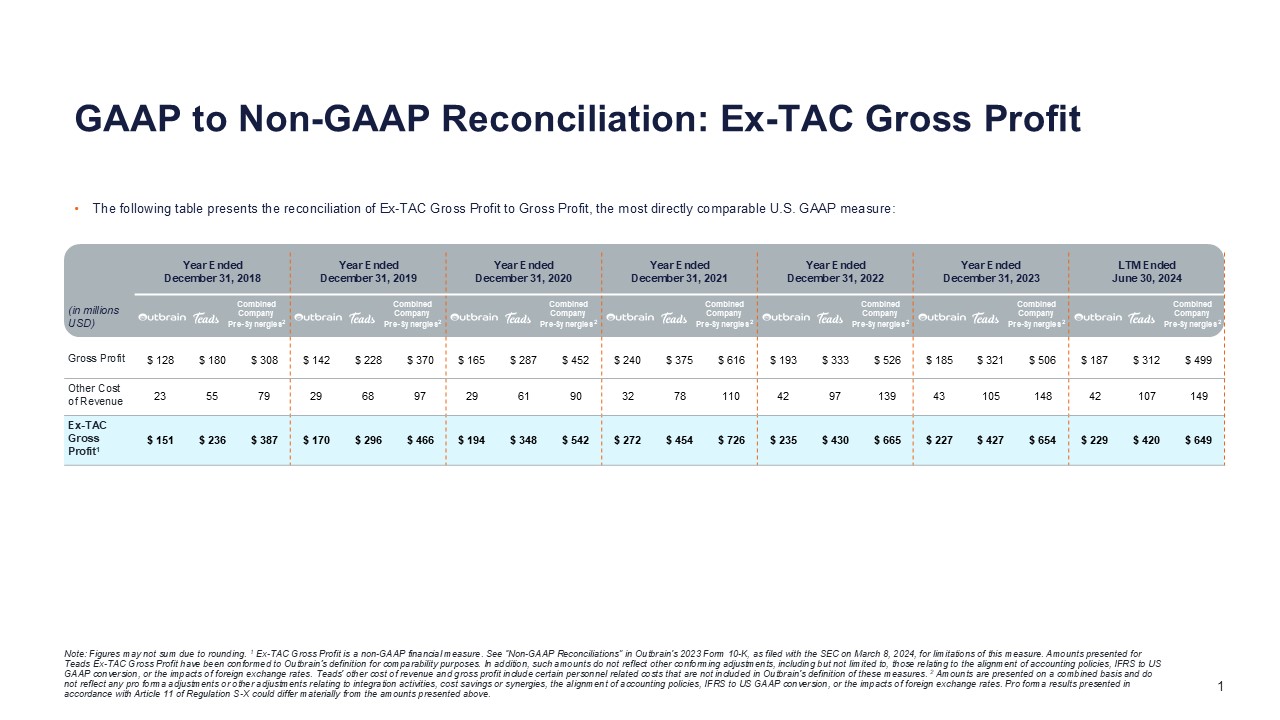
December 31, 2020 Year Ended December 31, 2021 Year Ended December 31, 2022 Year Ended December 31, 2023 LTM Ended June 30, 2024 (in millions USD) Gross Profit $ 128 $ 180 $ 308 $ 142 $ 228 $ 370 $ 165 $ 287 $
452 $ 240 $ 375 $ 616 $ 193 $ 333 $ 526 $ 185 $ 321 $ 506 $ 187 $ 312 $ 499 Other Cost of Revenue 23 55 79 29 68 97 29 61 90 32 78 110 42 97 139 43 105 148 42 107 149 Ex-TAC
Gross Profit1 $ 151 $ 236 $ 387 $ 170 $ 296 $ 466 $ 194 $ 348 $ 542 $ 272 $ 454 $ 726 $ 235 $ 430 $ 665 $ 227 $ 427 $ 654 $ 229 $ 420 $ 649 GAAP to Non-GAAP Reconciliation: Ex-TAC Gross Profit Note:
Figures may not sum due to rounding. 1 Ex-TAC Gross Profit is a non-GAAP financial measure. See “Non-GAAP Reconciliations” in Outbrain's 2023 Form 10-K, as filed with the SEC on March 8, 2024, for limitations of this measure. Amounts presented
for Teads Ex-TAC Gross Profit have been conformed to Outbrain’s definition for comparability purposes. In addition, such amounts do not reflect other conforming adjustments, including but not limited to, those relating to the alignment of
accounting policies, IFRS to US GAAP conversion, or the impacts of foreign exchange rates. Teads' other cost of revenue and gross profit include certain personnel related costs that are not included in Outbrain's definition of these measures. 2
Amounts are presented on a combined basis and do not reflect any pro forma adjustments or other adjustments relating to integration activities, cost savings or synergies, the alignment of accounting policies, IFRS to US GAAP conversion, or the
impacts of foreign exchange rates. Pro forma results presented in accordance with Article 11 of Regulation S-X could differ materially from the amounts presented above. The following table presents the reconciliation of Ex-TAC Gross Profit to
Gross Profit, the most directly comparable U.S. GAAP measure: Combined Company Pre-Synergies2 Combined Company Pre-Synergies2 Combined Company Pre-Synergies2 Combined Company Pre-Synergies2 Combined Company Pre-Synergies2 Combined
Company Pre-Synergies2 Combined Company Pre-Synergies2
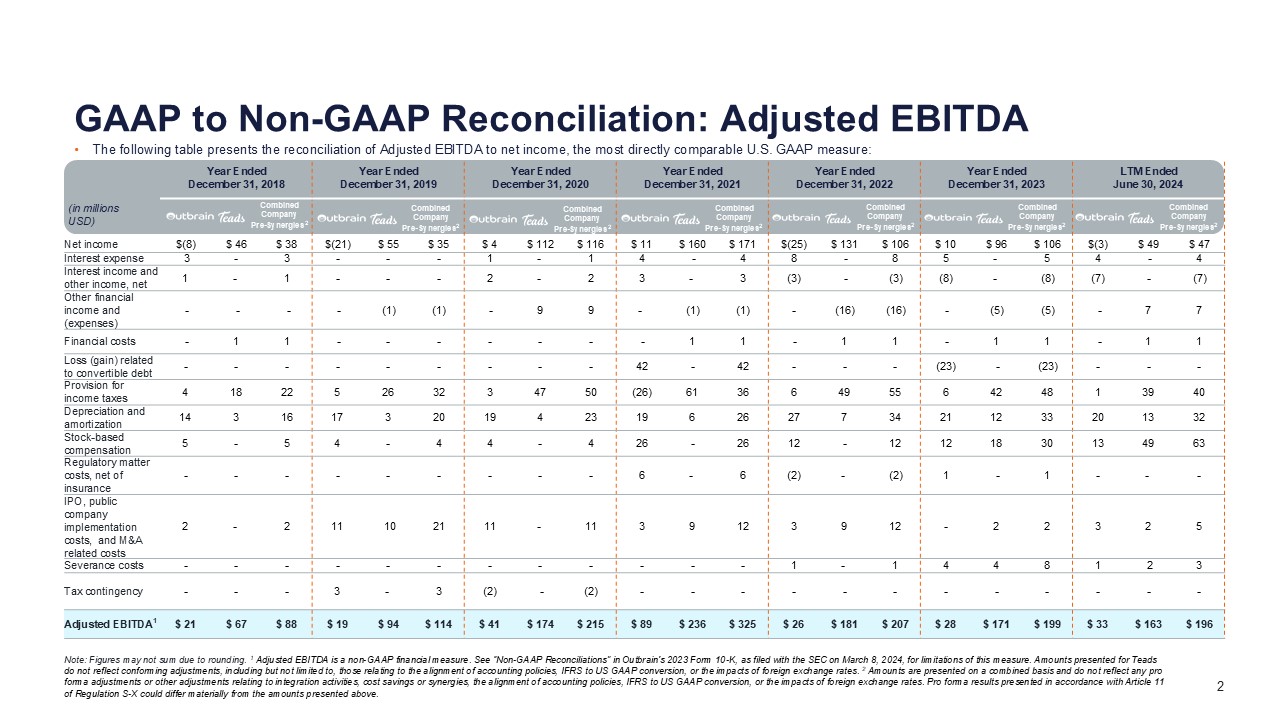
Year Ended December 31, 2018 Year Ended December 31, 2019 Year Ended
December 31, 2020 Year Ended December 31, 2021 Year Ended December 31, 2022 Year Ended December 31, 2023 LTM Ended June 30, 2024 (in millions USD) Net income $(8) $ 46 $ 38 $(21) $ 55 $ 35 $ 4 $ 112 $ 116 $ 11
$ 160 $ 171 $(25) $ 131 $ 106 $ 10 $ 96 $ 106 $(3) $ 49 $ 47 Interest expense 3 - 3 - - - 1 - 1 4 - 4 8 - 8 5 - 5 4 - 4 Interest income and other income, net 1 - 1 - - - 2
- 2 3 - 3 (3) - (3) (8) - (8) (7) - (7) Other financial income and (expenses) - - - - (1) (1) - 9 9 - (1) (1) - (16) (16) - (5) (5) - 7 7 Financial costs - 1 1
- - - - - - - 1 1 - 1 1 - 1 1 - 1 1 Loss (gain) related to convertible debt - - - - - - - - - 42 - 42 - - - (23) - (23) - - - Provision for income taxes 4 18 22 5 26 32 3 47
50 (26) 61 36 6 49 55 6 42 48 1 39 40 Depreciation and amortization 14 3 16 17 3 20 19 4 23 19 6 26 27 7 34 21 12 33 20 13 32 Stock-based compensation 5 - 5 4 - 4
4 - 4 26 - 26 12 - 12 12 18 30 13 49 63 Regulatory matter costs, net of insurance - - - - - - - - - 6 - 6 (2) - (2) 1 - 1 - - - IPO, public company implementation costs, and M&A
related costs 2 - 2 11 10 21 11 - 11 3 9 12 3 9 12 - 2 2 3 2 5 Severance costs - - - - - - - - - - - - 1 - 1 4 4 8 1 2 3 Tax contingency - - - 3 - 3
(2) - (2) - - - - - - - - - - - - Adjusted EBITDA1 $ 21 $ 67 $ 88 $ 19 $ 94 $ 114 $ 41 $ 174 $ 215 $ 89 $ 236 $ 325 $ 26 $ 181 $ 207 $ 28 $ 171 $ 199 $ 33 $ 163 $ 196 GAAP to Non-GAAP
Reconciliation: Adjusted EBITDA Note: Figures may not sum due to rounding. 1 Adjusted EBITDA is a non-GAAP financial measure. See “Non-GAAP Reconciliations” in Outbrain's 2023 Form 10-K, as filed with the SEC on March 8, 2024, for limitations
of this measure. Amounts presented for Teads do not reflect conforming adjustments, including but not limited to, those relating to the alignment of accounting policies, IFRS to US GAAP conversion, or the impacts of foreign exchange rates. 2
Amounts are presented on a combined basis and do not reflect any pro forma adjustments or other adjustments relating to integration activities, cost savings or synergies, the alignment of accounting policies, IFRS to US GAAP conversion, or the
impacts of foreign exchange rates. Pro forma results presented in accordance with Article 11 of Regulation S-X could differ materially from the amounts presented above. The following table presents the reconciliation of Adjusted EBITDA to net
income, the most directly comparable U.S. GAAP measure: Combined Company Pre-Synergies2 Combined Company Pre-Synergies2 Combined Company Pre-Synergies2 Combined Company Pre-Synergies2 Combined Company Pre-Synergies2 Combined
Company Pre-Synergies2 Combined Company Pre-Synergies2
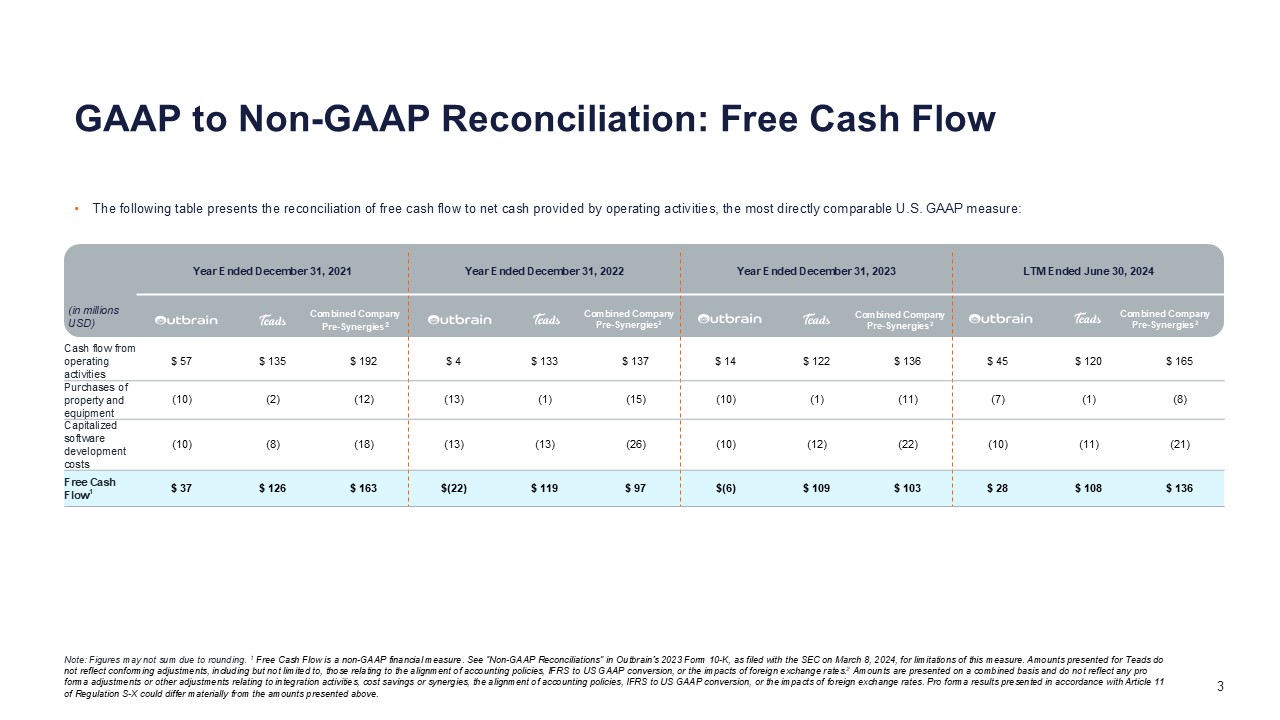
GAAP to Non-GAAP Reconciliation: Free Cash Flow Note: Figures may not sum due to
rounding. 1 Free Cash Flow is a non-GAAP financial measure. See “Non-GAAP Reconciliations” in Outbrain’s 2023 Form 10-K, as filed with the SEC on March 8, 2024, for limitations of this measure. Amounts presented for Teads do not reflect
conforming adjustments, including but not limited to, those relating to the alignment of accounting policies, IFRS to US GAAP conversion, or the impacts of foreign exchange rates.2 Amounts are presented on a combined basis and do not reflect
any pro forma adjustments or other adjustments relating to integration activities, cost savings or synergies, the alignment of accounting policies, IFRS to US GAAP conversion, or the impacts of foreign exchange rates. Pro forma results
presented in accordance with Article 11 of Regulation S-X could differ materially from the amounts presented above. The following table presents the reconciliation of free cash flow to net cash provided by operating activities, the most
directly comparable U.S. GAAP measure: Year Ended December 31, 2021 Year Ended December 31, 2022 Year Ended December 31, 2023 LTM Ended June 30, 2024 (in millions USD) Cash flow from operating activities $ 57 $ 135 $ 192 $ 4 $
133 $ 137 $ 14 $ 122 $ 136 $ 45 $ 120 $ 165 Purchases of property and equipment (10) (2) (12) (13) (1) (15) (10) (1) (11) (7) (1) (8) Capitalized software development
costs (10) (8) (18) (13) (13) (26) (10) (12) (22) (10) (11) (21) Free Cash Flow1 $ 37 $ 126 $ 163 $(22) $ 119 $ 97 $(6) $ 109 $ 103 $ 28 $ 108 $ 136 Combined Company Pre-Synergies2 Combined
Company Pre-Synergies2 Combined Company Pre-Synergies2 Combined Company Pre-Synergies2