
 | ||||||||
| Financial Supplement | Second Quarter 2025 | |||||||
| Table of Contents | PAGE | ||||
| Corporate Profile | |||||
| Earnings Release (including guidance information) | |||||
| Financial Information | |||||
Condensed Consolidated Balance Sheets | |||||
Condensed Consolidated Statements of Operations | |||||
Reconciliation of Net Income (Loss) to NAREIT FFO, Core FFO and Adjusted FFO | |||||
Reconciliation of Net Income (Loss) to NAREIT EBITDAre and Core EBITDA | |||||
| Debt Detail and Maturities | |||||
| Operations Overview | |||||
| Global Warehouse Portfolio | |||||
| Fixed Commitment and Lease Maturity Schedules | |||||
Capital Expenditures and Repair and Maintenance Expenses | |||||
| External Growth and Capital Deployment | |||||
Other Supplemental Information | |||||
Same Store Historical Performance Trend | |||||
Unconsolidated Joint Ventures (Investments in Partially Owned Entities) | |||||
Reconciliations, Notes and Definitions | |||||
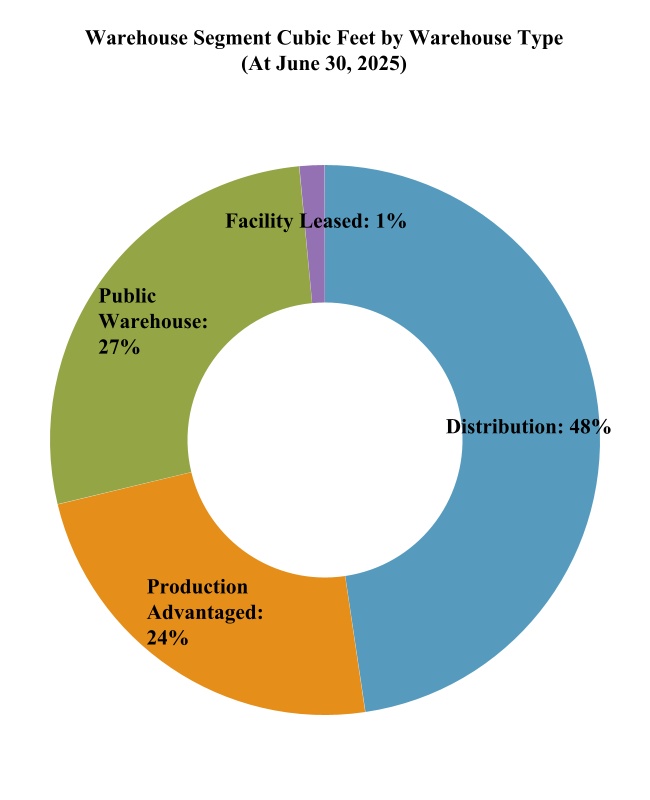
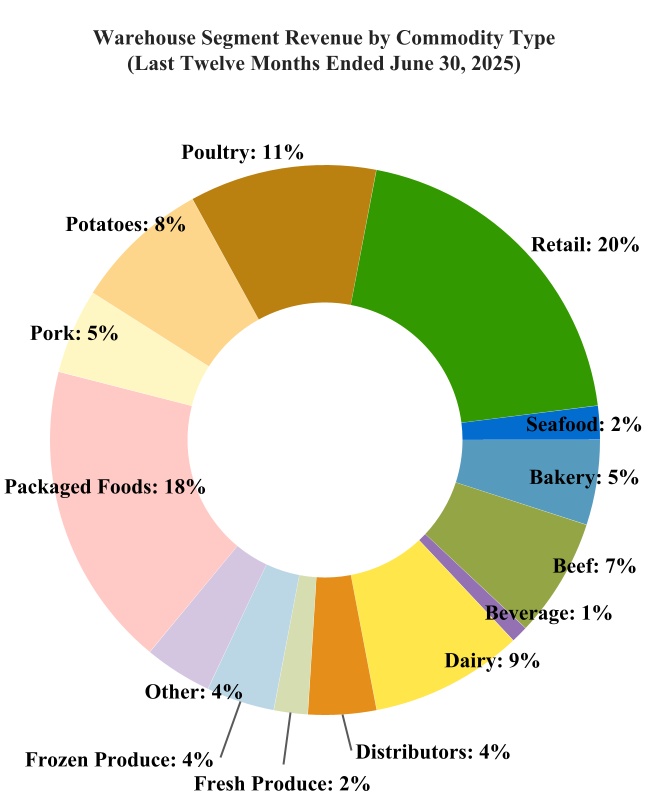
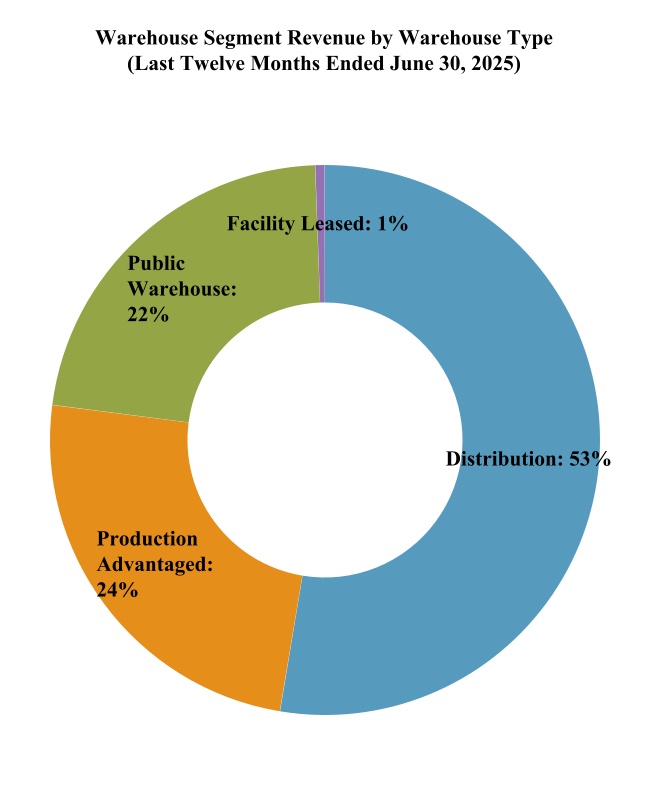
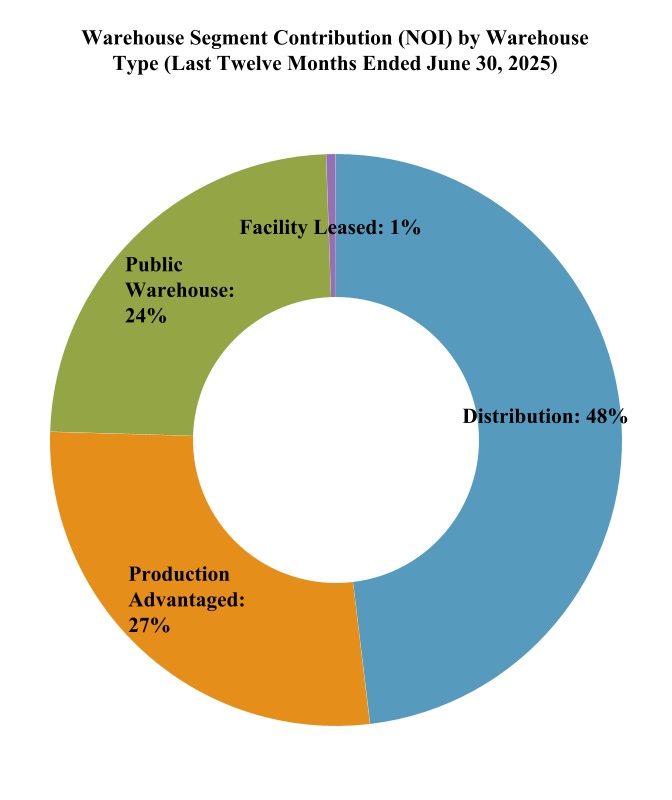
Revenues and Contribution (NOI) by Segment | |||||
Notes and Definitions | |||||
| ||||||||
| Financial Supplement | Second Quarter 2025 | |||||||
| ||||||||
| Financial Supplement | Second Quarter 2025 | |||||||
| Analyst Coverage | ||||||||||||||
| Firm | Analyst Name | Contact | ||||||||||||
| Baird Equity Research | Nicholas Thillman | 414-298-5053 | nthillman@rwbaird.com | |||||||||||
| Bank of America Merrill Lynch | Samir Khanal | 646-855-1497 | samir.khanal@bofa.com | |||||||||||
| Barclays | Brendan Lynch | 212-526-9428 | brendan.lynch@barclays.com | |||||||||||
| BNP Paribas Exane Research | Nate Crossett | 646-725-3716 | nate.crossett@exanebnpparibas.com | |||||||||||
| Citi | Craig Mailman | 212-816-4471 | craig.mailman@citi.com | |||||||||||
| Evercore ISI | Steve Sakwa/ Michael Griffin | 212-446-9462 / 212-752-0886 | steve.sakwa@evercoreisi.com / michael.griffin@evercoreisi.com | |||||||||||
| Green Street Advisors | Vince Tibone | 949-640-8780 | vtibone@greenstreet.com | |||||||||||
| J.P. Morgan | Michael W. Mueller | 212-622-6689 | michael.w.mueller@jpmorgan.com | |||||||||||
| KeyBanc | Todd Thomas | 917-368-2286 | tthomas@key.com | |||||||||||
| MorningStar Research Services | Suryansh Sharma | 314-585-6793 | suryansh.sharma@morningstar.com | |||||||||||
| Raymond James | Jonathan Hughes | 727-567-2438 | jonathan.hughes@raymondjames.com | |||||||||||
| RBC | Michael Carroll | 440-715-2649 | michael.carroll@rbccm.com | |||||||||||
Scotiabank | Greg McGinniss | 212-225-6906 | greg.mcginniss@scotiabank.com | |||||||||||
| Truist | Ki Bin Kim | 212-303-4124 | kibin.kim@truist.com | |||||||||||
Wells Fargo Securities | Blaine Heck | 410-662-2556 | blaine.heck@wellsfargo.com | |||||||||||
| Wolfe Research | Andy Liu | 646-582-9257 | aliu@wolferesearch.com | |||||||||||
| DBRS Morningstar | ||||||||
| Credit Rating: | BBB | (Positive Trend) | ||||||
| Fitch | ||||||||
| Issuer Default Rating: | BBB | (Stable Outlook) | ||||||
| Moody’s | ||||||||
| Issuer Rating: | Baa3 | (Stable Outlook) | ||||||
| ||||||||
| Financial Supplement | Second Quarter 2025 | |||||||
| ||||||||
| Financial Supplement | Second Quarter 2025 | |||||||
| As of | ||||||||
| August 7, 2025 | May 8, 2025 | |||||||
Warehouse segment same store revenue growth (constant currency) | (4.0)% - 0.0% | 0.0% - 2.0% | ||||||
Warehouse segment same store NOI growth (constant currency) | 50 to 100 bps lower than associated revenues | 100 bps higher than associated revenues | ||||||
Warehouse segment non-same store NOI | $7M - $13M | $7M - $13M | ||||||
Transportation and Third-Party Managed segment NOI | $40M - $44M | $40M - $44M | ||||||
Total selling, general and administrative expense (guidance as of August 7, 2025 is inclusive of share-based compensation expense of $30M - $32M and $14M - $16M of Project Orion amortization) | $270M - $280M | $270M - $280M | ||||||
| Interest expense | $153M - $157M | $153M - $157M | ||||||
| Current income tax expense | $6M - $8M | $8M - $10M | ||||||
| Non real estate depreciation and amortization expense | $139M - $149M | $139M - $149M | ||||||
| Total maintenance capital expenditures | $60M - $70M | $80M - $85M | ||||||
Development starts(1) | $200M - $300M | $200M - $300M | ||||||
Adjusted FFO per share | $1.39 - $1.45 | $1.42 - $1.52 | ||||||
| ||||||||
| Financial Supplement | Second Quarter 2025 | |||||||
| ||||||||
| Financial Supplement | Second Quarter 2025 | |||||||
| Three Months Ended June 30, | Change | ||||||||||||||||||||||||||||
Dollars and units in thousands, except per pallet data | 2025 Actual | 2025 Constant Currency(1) | 2024 Actual | Actual | Constant Currency | ||||||||||||||||||||||||
| TOTAL WAREHOUSE SEGMENT | |||||||||||||||||||||||||||||
| Global Warehouse revenues: | |||||||||||||||||||||||||||||
| Rent and storage | $ | 256,732 | $ | 256,861 | $ | 267,671 | (4.1) | % | (4.0) | % | |||||||||||||||||||
| Warehouse services | 337,338 | 337,527 | 332,716 | 1.4 | % | 1.4 | % | ||||||||||||||||||||||
Total revenues | $ | 594,070 | $ | 594,388 | $ | 600,387 | (1.1) | % | (1.0) | % | |||||||||||||||||||
| Global Warehouse cost of operations: | |||||||||||||||||||||||||||||
| Power | 35,544 | 35,500 | 37,082 | (4.1) | % | (4.3) | % | ||||||||||||||||||||||
Other facilities costs(2) | 59,675 | 59,739 | 62,385 | (4.3) | % | (4.2) | % | ||||||||||||||||||||||
| Labor | 248,241 | 248,573 | 245,626 | 1.1 | % | 1.2 | % | ||||||||||||||||||||||
Other services costs(3) | 49,605 | 49,533 | 50,763 | (2.3) | % | (2.4) | % | ||||||||||||||||||||||
| Total warehouse segment cost of operations | $ | 393,065 | $ | 393,345 | $ | 395,856 | (0.7) | % | (0.6) | % | |||||||||||||||||||
| Global Warehouse contribution (NOI) | $ | 201,005 | $ | 201,043 | $ | 204,531 | (1.7) | % | (1.7) | % | |||||||||||||||||||
Rent and storage contribution (NOI)(4) | $ | 161,513 | $ | 161,622 | $ | 168,204 | (4.0) | % | (3.9) | % | |||||||||||||||||||
Services contribution (NOI)(5) | $ | 39,492 | $ | 39,421 | $ | 36,327 | 8.7 | % | 8.5 | % | |||||||||||||||||||
| Global Warehouse margin | 33.8 | % | 33.8 | % | 34.1 | % | -30 bps | -30 bps | |||||||||||||||||||||
Rent and storage margin(6) | 62.9 | % | 62.9 | % | 62.8 | % | 10 bps | 10 bps | |||||||||||||||||||||
Warehouse services margin(7) | 11.7 | % | 11.7 | % | 10.9 | % | 80 bps | 80 bps | |||||||||||||||||||||
| Global Warehouse rent and storage metrics: | |||||||||||||||||||||||||||||
Average economic occupied pallets(8) | 4,057 | n/a | 4,311 | (5.9) | % | n/a | |||||||||||||||||||||||
Average physical occupied pallets(9) | 3,454 | n/a | 3,740 | (7.6) | % | n/a | |||||||||||||||||||||||
| Average physical pallet positions | 5,499 | n/a | 5,519 | (0.4) | % | n/a | |||||||||||||||||||||||
Economic occupancy percentage(8) | 73.8 | % | n/a | 78.1 | % | -430 bps | n/a | ||||||||||||||||||||||
Physical occupancy percentage(9) | 62.8 | % | n/a | 67.8 | % | -500 bps | n/a | ||||||||||||||||||||||
Total rent and storage revenues per average economic occupied pallet | $ | 63.28 | $ | 63.31 | $ | 62.09 | 1.9 | % | 2.0 | % | |||||||||||||||||||
Total rent and storage revenues per average physical occupied pallet | $ | 74.33 | $ | 74.37 | $ | 71.57 | 3.9 | % | 3.9 | % | |||||||||||||||||||
| Global Warehouse services metrics: | |||||||||||||||||||||||||||||
| Throughput pallets | 8,784 | n/a | 9,024 | (2.7) | % | n/a | |||||||||||||||||||||||
Total warehouse services revenues per throughput pallet | $ | 38.40 | $ | 38.43 | $ | 36.87 | 4.1 | % | 4.2 | % | |||||||||||||||||||
| ||||||||
| Financial Supplement | Second Quarter 2025 | |||||||
| Three Months Ended June 30, | Change | ||||||||||||||||||||||||||||
| Dollars and units in thousands, except per pallet data | 2025 Actual | 2025 Constant Currency(1) | 2024 Actual | Actual | Constant Currency | ||||||||||||||||||||||||
SAME STORE WAREHOUSE | |||||||||||||||||||||||||||||
Number of same store warehouses | 223 | 223 | |||||||||||||||||||||||||||
Same store revenues: | |||||||||||||||||||||||||||||
| Rent and storage | $ | 247,212 | $ | 247,335 | $ | 259,427 | (4.7) | % | (4.7) | % | |||||||||||||||||||
| Warehouse services | 325,882 | 326,010 | 322,446 | 1.1 | % | 1.1 | % | ||||||||||||||||||||||
Total same store revenues | $ | 573,094 | $ | 573,345 | $ | 581,873 | (1.5) | % | (1.5) | % | |||||||||||||||||||
Same store cost of operations: | |||||||||||||||||||||||||||||
| Power | 34,106 | 34,059 | 35,379 | (3.6) | % | (3.7) | % | ||||||||||||||||||||||
| Other facilities costs | 57,262 | 57,320 | 56,025 | 2.2 | % | 2.3 | % | ||||||||||||||||||||||
| Labor | 237,173 | 237,455 | 235,609 | 0.7 | % | 0.8 | % | ||||||||||||||||||||||
| Other services costs | 45,327 | 45,250 | 46,857 | (3.3) | % | (3.4) | % | ||||||||||||||||||||||
Total same store cost of operations | $ | 373,868 | $ | 374,084 | $ | 373,870 | — | % | 0.1 | % | |||||||||||||||||||
Same store contribution (NOI) | $ | 199,226 | $ | 199,261 | $ | 208,003 | (4.2) | % | (4.2) | % | |||||||||||||||||||
Same store rent and storage contribution (NOI)(2) | $ | 155,844 | $ | 155,956 | $ | 168,023 | (7.2) | % | (7.2) | % | |||||||||||||||||||
Same store services contribution (NOI)(3) | $ | 43,382 | $ | 43,305 | $ | 39,980 | 8.5 | % | 8.3 | % | |||||||||||||||||||
Same store margin | 34.8 | % | 34.8 | % | 35.7 | % | -90 bps | -90 bps | |||||||||||||||||||||
Same store rent and storage margin(4) | 63.0 | % | 63.1 | % | 64.8 | % | -180 bps | -170 bps | |||||||||||||||||||||
Same store services margin(5) | 13.3 | % | 13.3 | % | 12.4 | % | 90 bps | 90 bps | |||||||||||||||||||||
Same store rent and storage metrics: | |||||||||||||||||||||||||||||
Average economic occupied pallets(6) | 3,972 | n/a | 4,203 | (5.5) | % | n/a | |||||||||||||||||||||||
Average physical occupied pallets(7) | 3,387 | n/a | 3,637 | (6.9) | % | n/a | |||||||||||||||||||||||
| Average physical pallet positions | 5,263 | n/a | 5,278 | (0.3) | % | n/a | |||||||||||||||||||||||
Economic occupancy percentage(6) | 75.5 | % | n/a | 79.6 | % | -410 bps | n/a | ||||||||||||||||||||||
Physical occupancy percentage(7) | 64.4 | % | n/a | 68.9 | % | -450 bps | n/a | ||||||||||||||||||||||
Same store rent and storage revenues per average economic occupied pallet | $ | 62.24 | $ | 62.27 | $ | 61.72 | 0.8 | % | 0.9 | % | |||||||||||||||||||
Same store rent and storage revenues per average physical occupied pallet | $ | 72.99 | $ | 73.02 | $ | 71.33 | 2.3 | % | 2.4 | % | |||||||||||||||||||
Same store services metrics: | |||||||||||||||||||||||||||||
| Throughput pallets | 8,577 | n/a | 8,819 | (2.7) | % | n/a | |||||||||||||||||||||||
Same store warehouse services revenues per throughput pallet | $ | 37.99 | $ | 38.01 | $ | 36.56 | 3.9 | % | 4.0 | % | |||||||||||||||||||
| ||||||||
| Financial Supplement | Second Quarter 2025 | |||||||
| Three Months Ended June 30, | Change | ||||||||||||||||||||||||||||
| Dollars and units in thousands, except per pallet data | 2025 Actual | 2025 Constant Currency(1) | 2024 Actual | Actual | Constant Currency | ||||||||||||||||||||||||
NON-SAME STORE WAREHOUSE | |||||||||||||||||||||||||||||
Number of non-same store warehouses(2) | 11 | 12 | |||||||||||||||||||||||||||
Non-same store revenues: | |||||||||||||||||||||||||||||
| Rent and storage | $ | 9,520 | $ | 9,526 | $ | 8,244 | n/r | n/r | |||||||||||||||||||||
| Warehouse services | 11,456 | 11,517 | 10,270 | n/r | n/r | ||||||||||||||||||||||||
Total non-same store revenues | $ | 20,976 | $ | 21,043 | $ | 18,514 | n/r | n/r | |||||||||||||||||||||
Non-same store cost of operations: | |||||||||||||||||||||||||||||
| Power | 1,438 | 1,441 | 1,703 | n/r | n/r | ||||||||||||||||||||||||
| Other facilities costs | 2,413 | 2,419 | 6,360 | n/r | n/r | ||||||||||||||||||||||||
| Labor | 11,068 | 11,118 | 10,017 | n/r | n/r | ||||||||||||||||||||||||
| Other services costs | 4,278 | 4,283 | 3,906 | n/r | n/r | ||||||||||||||||||||||||
Total non-same store cost of operations | $ | 19,197 | $ | 19,261 | $ | 21,986 | n/r | n/r | |||||||||||||||||||||
Non-same store contribution (NOI) | $ | 1,779 | $ | 1,782 | $ | (3,472) | n/r | n/r | |||||||||||||||||||||
Non-same store rent and storage contribution (NOI)(3) | $ | 5,669 | $ | 5,666 | $ | 181 | n/r | n/r | |||||||||||||||||||||
Non-same store services contribution (NOI)(4) | $ | (3,890) | $ | (3,884) | $ | (3,653) | n/r | n/r | |||||||||||||||||||||
Non-same store rent and storage metrics: | |||||||||||||||||||||||||||||
Average economic occupied pallets(5) | 85 | n/a | 108 | n/r | n/a | ||||||||||||||||||||||||
Average physical occupied pallets(6) | 67 | n/a | 103 | n/r | n/a | ||||||||||||||||||||||||
| Average physical pallet positions | 236 | n/a | 241 | n/r | n/a | ||||||||||||||||||||||||
Economic occupancy percentage(5) | 36.0 | % | n/a | 44.8 | % | n/r | n/a | ||||||||||||||||||||||
Physical occupancy percentage(6) | 28.4 | % | n/a | 42.7 | % | n/r | n/a | ||||||||||||||||||||||
Non-same store rent and storage revenues per average economic occupied pallet | $ | 112.00 | $ | 112.07 | $ | 76.33 | n/r | n/r | |||||||||||||||||||||
Non-same store rent and storage revenues per average physical occupied pallet | $ | 142.09 | $ | 142.18 | $ | 80.04 | n/r | n/r | |||||||||||||||||||||
Non-same store services metrics: | |||||||||||||||||||||||||||||
| Throughput pallets | 207 | n/a | 205 | n/r | n/a | ||||||||||||||||||||||||
Non-same store warehouse services revenues per throughput pallet | $ | 55.34 | $ | 55.64 | $ | 50.10 | n/r | n/r | |||||||||||||||||||||
| ||||||||
| Financial Supplement | Second Quarter 2025 | |||||||
| Six Months Ended June 30, | Change | ||||||||||||||||||||||||||||
| Dollars and units in thousands, except per pallet data | 2025 Actual | 2025 Constant Currency(1) | 2024 Actual | Actual | Constant Currency | ||||||||||||||||||||||||
| TOTAL WAREHOUSE SEGMENT | |||||||||||||||||||||||||||||
| Global Warehouse revenues: | |||||||||||||||||||||||||||||
| Rent and storage | $ | 511,311 | $ | 513,762 | $ | 537,095 | (4.8) | % | (4.3) | % | |||||||||||||||||||
| Warehouse services | 658,116 | 661,494 | 661,002 | (0.4) | % | 0.1 | % | ||||||||||||||||||||||
Total revenues | $ | 1,169,427 | $ | 1,175,256 | $ | 1,198,097 | (2.4) | % | (1.9) | % | |||||||||||||||||||
| Global Warehouse cost of operations: | |||||||||||||||||||||||||||||
| Power | 67,253 | 67,586 | 70,415 | (4.5) | % | (4.0) | % | ||||||||||||||||||||||
Other facilities costs(2) | 117,225 | 117,834 | 127,980 | (8.4) | % | (7.9) | % | ||||||||||||||||||||||
| Labor | 489,153 | 491,966 | 493,799 | (0.9) | % | (0.4) | % | ||||||||||||||||||||||
Other services costs(3) | 98,206 | 98,628 | 104,241 | (5.8) | % | (5.4) | % | ||||||||||||||||||||||
| Total warehouse segment cost of operations | $ | 771,837 | $ | 776,014 | $ | 796,435 | (3.1) | % | (2.6) | % | |||||||||||||||||||
| Global Warehouse contribution (NOI) | $ | 397,590 | $ | 399,242 | $ | 401,662 | (1.0) | % | (0.6) | % | |||||||||||||||||||
Rent and storage contribution (NOI)(4) | $ | 326,833 | $ | 328,342 | $ | 338,700 | (3.5) | % | (3.1) | % | |||||||||||||||||||
Services contribution (NOI)(5) | $ | 70,757 | $ | 70,900 | $ | 62,962 | 12.4 | % | 12.6 | % | |||||||||||||||||||
| Global Warehouse margin | 34.0 | % | 34.0 | % | 33.5 | % | 50 bps | 50 bps | |||||||||||||||||||||
Rent and storage margin(6) | 63.9 | % | 63.9 | % | 63.1 | % | 80 bps | 80 bps | |||||||||||||||||||||
Warehouse services margin(7) | 10.8 | % | 10.7 | % | 9.5 | % | 130 bps | 120 bps | |||||||||||||||||||||
| Global Warehouse rent and storage metrics: | |||||||||||||||||||||||||||||
Average economic occupied pallets(8) | 4,093 | n/a | 4,353 | (6.0) | % | n/a | |||||||||||||||||||||||
Average physical occupied pallets(9) | 3,477 | n/a | 3,775 | (7.9) | % | n/a | |||||||||||||||||||||||
| Average physical pallet positions | 5,512 | n/a | 5,525 | (0.2) | % | n/a | |||||||||||||||||||||||
Economic occupancy percentage(8) | 74.3 | % | n/a | 78.8 | % | -450 bps | n/a | ||||||||||||||||||||||
Physical occupancy percentage(9) | 63.1 | % | n/a | 68.3 | % | -520 bps | n/a | ||||||||||||||||||||||
Total rent and storage revenues per average economic occupied pallet | $ | 124.92 | $ | 125.52 | $ | 123.39 | 1.2 | % | 1.7 | % | |||||||||||||||||||
Total rent and storage revenues per average physical occupied pallet | $ | 147.06 | $ | 147.76 | $ | 142.28 | 3.4 | % | 3.9 | % | |||||||||||||||||||
| Global Warehouse services metrics: | |||||||||||||||||||||||||||||
| Throughput pallets | 17,515 | n/a | 18,075 | (3.1) | % | n/a | |||||||||||||||||||||||
Total warehouse services revenues per throughput pallet | $ | 37.57 | $ | 37.77 | $ | 36.57 | 2.7 | % | 3.3 | % | |||||||||||||||||||
| ||||||||
| Financial Supplement | Second Quarter 2025 | |||||||
| Six Months Ended June 30, | Change | ||||||||||||||||||||||||||||
| Dollars and units in thousands, except per pallet data | 2025 Actual | 2025 Constant Currency(1) | 2024 Actual | Actual | Constant Currency | ||||||||||||||||||||||||
SAME STORE WAREHOUSE | |||||||||||||||||||||||||||||
Number of same store warehouses | 223 | 223 | |||||||||||||||||||||||||||
Same store revenues: | |||||||||||||||||||||||||||||
| Rent and storage | $ | 492,408 | $ | 494,852 | $ | 516,198 | (4.6) | % | (4.1) | % | |||||||||||||||||||
| Warehouse services | 640,705 | 644,015 | 638,938 | 0.3 | % | 0.8 | % | ||||||||||||||||||||||
Total same store revenues | $ | 1,133,113 | $ | 1,138,867 | $ | 1,155,136 | (1.9) | % | (1.4) | % | |||||||||||||||||||
Same store cost of operations: | |||||||||||||||||||||||||||||
| Power | 64,762 | 65,093 | 66,292 | (2.3) | % | (1.8) | % | ||||||||||||||||||||||
| Other facilities costs | 114,507 | 115,110 | 112,592 | 1.7 | % | 2.2 | % | ||||||||||||||||||||||
| Labor | 471,813 | 474,573 | 471,026 | 0.2 | % | 0.8 | % | ||||||||||||||||||||||
| Other services costs | 90,090 | 90,504 | 96,021 | (6.2) | % | (5.7) | % | ||||||||||||||||||||||
Total same store cost of operations | $ | 741,172 | $ | 745,280 | $ | 745,931 | (0.6) | % | (0.1) | % | |||||||||||||||||||
Same store contribution (NOI) | $ | 391,941 | $ | 393,587 | $ | 409,205 | (4.2) | % | (3.8) | % | |||||||||||||||||||
Same store rent and storage contribution (NOI)(2) | $ | 313,139 | $ | 314,649 | $ | 337,314 | (7.2) | % | (6.7) | % | |||||||||||||||||||
Same store services contribution (NOI)(3) | $ | 78,802 | $ | 78,938 | $ | 71,891 | 9.6 | % | 9.8 | % | |||||||||||||||||||
Same store margin | 34.6 | % | 34.6 | % | 35.4 | % | -80 bps | -80 bps | |||||||||||||||||||||
Same store rent and storage margin(4) | 63.6 | % | 63.6 | % | 65.3 | % | -170 bps | -170 bps | |||||||||||||||||||||
Same store services margin(5) | 12.3 | % | 12.3 | % | 11.3 | % | 100 bps | 100 bps | |||||||||||||||||||||
Same store rent and storage metrics: | |||||||||||||||||||||||||||||
Average economic occupied pallets(6) | 4,008 | n/a | 4,235 | (5.4) | % | n/a | |||||||||||||||||||||||
Average physical occupied pallets(7) | 3,411 | n/a | 3,668 | (7.0) | % | n/a | |||||||||||||||||||||||
| Average physical pallet positions | 5,271 | n/a | 5,279 | (0.2) | % | n/a | |||||||||||||||||||||||
Economic occupancy percentage(6) | 76.0 | % | n/a | 80.2 | % | -420 bps | n/a | ||||||||||||||||||||||
Physical occupancy percentage(7) | 64.7 | % | n/a | 69.5 | % | -480 bps | n/a | ||||||||||||||||||||||
Same store rent and storage revenues per average economic occupied pallet | $ | 122.86 | $ | 123.47 | $ | 121.89 | 0.8 | % | 1.3 | % | |||||||||||||||||||
Same store rent and storage revenues per average physical occupied pallet | $ | 144.36 | $ | 145.08 | $ | 140.73 | 2.6 | % | 3.1 | % | |||||||||||||||||||
Same store services metrics: | |||||||||||||||||||||||||||||
| Throughput pallets | 17,138 | n/a | 17,634 | (2.8) | % | n/a | |||||||||||||||||||||||
Same store warehouse services revenues per throughput pallet | $ | 37.39 | $ | 37.58 | $ | 36.23 | 3.2 | % | 3.7 | % | |||||||||||||||||||
| ||||||||
| Financial Supplement | Second Quarter 2025 | |||||||
| Six Months Ended June 30, | Change | ||||||||||||||||||||||||||||
| Dollars and units in thousands, except per pallet data | 2025 Actual | 2025 Constant Currency(1) | 2024 Actual | Actual | Constant Currency | ||||||||||||||||||||||||
NON-SAME STORE WAREHOUSE | |||||||||||||||||||||||||||||
Number of non-same store warehouses(2) | 11 | 12 | |||||||||||||||||||||||||||
Non-same store revenues: | |||||||||||||||||||||||||||||
| Rent and storage | $ | 18,903 | $ | 18,910 | $ | 20,897 | n/r | n/r | |||||||||||||||||||||
| Warehouse services | 17,411 | 17,479 | 22,064 | n/r | n/r | ||||||||||||||||||||||||
Total non-same store revenues | $ | 36,314 | $ | 36,389 | $ | 42,961 | n/r | n/r | |||||||||||||||||||||
Non-same store cost of operations: | |||||||||||||||||||||||||||||
| Power | 2,491 | 2,493 | 4,123 | n/r | n/r | ||||||||||||||||||||||||
| Other facilities costs | 2,718 | 2,724 | 15,388 | n/r | n/r | ||||||||||||||||||||||||
| Labor | 17,340 | 17,393 | 22,773 | n/r | n/r | ||||||||||||||||||||||||
| Other services costs | 8,116 | 8,124 | 8,220 | n/r | n/r | ||||||||||||||||||||||||
Total non-same store cost of operations | $ | 30,665 | $ | 30,734 | $ | 50,504 | n/r | n/r | |||||||||||||||||||||
Non-same store contribution (NOI) | $ | 5,649 | $ | 5,655 | $ | (7,543) | n/r | n/r | |||||||||||||||||||||
Non-same store rent and storage contribution (NOI)(3) | $ | 13,694 | $ | 13,693 | $ | 1,386 | n/r | n/r | |||||||||||||||||||||
Non-same store services contribution (NOI)(4) | $ | (8,045) | $ | (8,038) | $ | (8,929) | n/r | n/r | |||||||||||||||||||||
Non-same store rent and storage metrics: | |||||||||||||||||||||||||||||
Average economic occupied pallets(5) | 85 | n/a | 118 | n/r | n/a | ||||||||||||||||||||||||
Average physical occupied pallets(6) | 66 | n/a | 107 | n/r | n/a | ||||||||||||||||||||||||
| Average physical pallet positions | 241 | n/a | 246 | n/r | n/a | ||||||||||||||||||||||||
Economic occupancy percentage(5) | 35.3 | % | n/a | 48.0 | % | n/r | n/a | ||||||||||||||||||||||
Physical occupancy percentage(6) | 27.4 | % | n/a | 43.5 | % | n/r | n/a | ||||||||||||||||||||||
Non-same store rent and storage revenues per average economic occupied pallet | $ | 222.39 | $ | 222.47 | $ | 177.09 | n/r | n/r | |||||||||||||||||||||
Non-same store rent and storage revenues per average physical occupied pallet | $ | 286.41 | $ | 286.52 | $ | 195.30 | n/r | n/r | |||||||||||||||||||||
Non-same store services metrics: | |||||||||||||||||||||||||||||
| Throughput pallets | 377 | n/a | 441 | n/r | n/a | ||||||||||||||||||||||||
Non-same store warehouse services revenues per throughput pallet | $ | 46.18 | $ | 46.36 | $ | 50.03 | n/r | n/r | |||||||||||||||||||||
| ||||||||
| Financial Supplement | Second Quarter 2025 | |||||||
| ||||||||
| Financial Supplement | Second Quarter 2025 | |||||||
| ||||||||
| Financial Supplement | Second Quarter 2025 | |||||||
| ||||||||
| Financial Supplement | Second Quarter 2025 | |||||||
| Americold Realty Trust, Inc. and Subsidiaries | |||||||||||
| Condensed Consolidated Balance Sheets (Unaudited) | |||||||||||
| (In thousands, except shares and per share amounts) | |||||||||||
| June 30, 2025 | December 31, 2024 | ||||||||||
| Assets | |||||||||||
| Property, buildings, and equipment: | |||||||||||
| Land | $ | 832,480 | $ | 806,981 | |||||||
| Buildings and improvements | 4,577,009 | 4,462,565 | |||||||||
| Machinery and equipment | 1,671,187 | 1,598,502 | |||||||||
| Assets under construction | 886,925 | 606,233 | |||||||||
| 7,967,601 | 7,474,281 | ||||||||||
| Accumulated depreciation | (2,616,706) | (2,453,597) | |||||||||
| Property, buildings, and equipment – net | 5,350,895 | 5,020,684 | |||||||||
| Operating leases - net | 178,868 | 222,294 | |||||||||
| Financing leases - net | 122,440 | 104,216 | |||||||||
| Cash, cash equivalents, and restricted cash | 101,376 | 47,652 | |||||||||
Accounts receivable – net of allowance of $19,117 and $24,426 at June 30, 2025 and December 31, 2024, respectively | 366,456 | 386,924 | |||||||||
| Identifiable intangible assets – net | 839,730 | 838,660 | |||||||||
| Goodwill | 828,457 | 784,042 | |||||||||
| Investments in and advances to partially owned entities | 35,618 | 40,252 | |||||||||
| Other assets | 265,779 | 291,230 | |||||||||
| Total assets | $ | 8,089,619 | $ | 7,735,954 | |||||||
| Liabilities and Equity | |||||||||||
| Liabilities | |||||||||||
| Borrowings under revolving line of credit | $ | 293,570 | $ | 255,052 | |||||||
| Accounts payable and accrued expenses | 579,642 | 603,411 | |||||||||
Senior unsecured notes and term loans – net of deferred financing costs of $17,486 and $13,882 at June 30, 2025 and December 31, 2024, respectively | 3,544,831 | 3,031,462 | |||||||||
| Sale-leaseback financing obligations | 77,031 | 79,001 | |||||||||
| Financing lease obligations | 116,133 | 95,784 | |||||||||
| Operating lease obligations | 175,963 | 219,099 | |||||||||
| Unearned revenues | 21,952 | 21,979 | |||||||||
| Deferred tax liability - net | 127,596 | 115,772 | |||||||||
| Other liabilities | 7,581 | 7,389 | |||||||||
| Total liabilities | 4,944,299 | 4,428,949 | |||||||||
| Equity | |||||||||||
| Stockholders' equity: | |||||||||||
Common stock, $0.01 par value per share – 500,000,000 authorized shares; 284,745,001 and 284,265,041 shares issued and outstanding at June 30, 2025 and December 31, 2024, respectively | 2,847 | 2,842 | |||||||||
| Paid-in capital | 5,657,220 | 5,646,879 | |||||||||
| Accumulated deficit and distributions in excess of net earnings | (2,487,951) | (2,341,654) | |||||||||
| Accumulated other comprehensive loss | (58,468) | (27,279) | |||||||||
| Total stockholders’ equity | 3,113,648 | 3,280,788 | |||||||||
| Noncontrolling interests | 31,672 | 26,217 | |||||||||
| Total equity | 3,145,320 | 3,307,005 | |||||||||
| Total liabilities and equity | $ | 8,089,619 | $ | 7,735,954 | |||||||
| ||||||||
| Financial Supplement | Second Quarter 2025 | |||||||
| Americold Realty Trust, Inc. and Subsidiaries | |||||||||||||||||||||||
| Condensed Consolidated Statements of Operations (Unaudited) | |||||||||||||||||||||||
| (In thousands, except per share amounts) | |||||||||||||||||||||||
| Three Months Ended June 30, | Six Months Ended June 30, | ||||||||||||||||||||||
| 2025 | 2024 | 2025 | 2024 | ||||||||||||||||||||
| Revenues: | |||||||||||||||||||||||
| Rent, storage, and warehouse services | $ | 594,070 | $ | 600,387 | $ | 1,169,427 | $ | 1,198,097 | |||||||||||||||
| Transportation services | 48,097 | 50,637 | 92,090 | 107,490 | |||||||||||||||||||
| Third-party managed services | 8,581 | 9,931 | 18,211 | 20,348 | |||||||||||||||||||
| Total revenues | 650,748 | 660,955 | 1,279,728 | 1,325,935 | |||||||||||||||||||
| Operating expenses: | |||||||||||||||||||||||
| Rent, storage, and warehouse services cost of operations | 393,065 | 395,856 | 771,837 | 796,435 | |||||||||||||||||||
| Transportation services cost of operations | 39,355 | 41,787 | 76,094 | 87,118 | |||||||||||||||||||
| Third-party managed services cost of operations | 6,672 | 7,829 | 14,293 | 16,063 | |||||||||||||||||||
| Depreciation and amortization | 90,462 | 89,649 | 179,444 | 181,744 | |||||||||||||||||||
| Selling, general, and administrative | 66,907 | 59,453 | 136,142 | 124,879 | |||||||||||||||||||
| Acquisition, cyber incident, and other, net | 23,226 | 3,013 | 48,640 | 18,011 | |||||||||||||||||||
| Impairment of long-lived assets | 5,226 | — | 5,226 | — | |||||||||||||||||||
| Net gain from sale of real estate | (11,760) | — | (11,760) | (3,514) | |||||||||||||||||||
| Total operating expenses | 613,153 | 597,587 | 1,219,916 | 1,220,736 | |||||||||||||||||||
| Operating Income | 37,595 | 63,368 | 59,812 | 105,199 | |||||||||||||||||||
| Other income (expense): | |||||||||||||||||||||||
| Interest expense | (38,245) | (33,180) | (74,362) | (66,610) | |||||||||||||||||||
| Loss on debt extinguishment and termination of derivative instruments | — | (110,682) | — | (115,864) | |||||||||||||||||||
| Loss from investments in partially owned entities | (335) | (1,034) | (1,698) | (1,983) | |||||||||||||||||||
| Other, net | 5,775 | 14,623 | 7,071 | 24,149 | |||||||||||||||||||
| Income (loss) before income taxes | 4,790 | (66,905) | (9,177) | (55,109) | |||||||||||||||||||
Income tax (expense) benefit: | |||||||||||||||||||||||
| Current income tax | (1,995) | (1,857) | (3,928) | (3,232) | |||||||||||||||||||
| Deferred income tax | (1,245) | 4,353 | (1,818) | 3,734 | |||||||||||||||||||
| Total income tax (expense) benefit | (3,240) | 2,496 | (5,746) | 502 | |||||||||||||||||||
| Net income (loss) | $ | 1,550 | $ | (64,409) | $ | (14,923) | $ | (54,607) | |||||||||||||||
| Net income (loss) attributable to noncontrolling interests | 11 | (300) | (82) | (238) | |||||||||||||||||||
| Net income (loss) attributable to Americold Realty Trust, Inc. | $ | 1,539 | $ | (64,109) | $ | (14,841) | $ | (54,369) | |||||||||||||||
| Weighted average common stock outstanding – basic | 285,604 | 284,683 | 285,484 | 284,664 | |||||||||||||||||||
| Weighted average common stock outstanding – diluted | 285,794 | 284,683 | 285,484 | 284,664 | |||||||||||||||||||
| Net income (loss) per common share - basic | $ | 0.01 | $ | (0.23) | $ | (0.05) | $ | (0.19) | |||||||||||||||
| Net income (loss) per common share - diluted | $ | 0.01 | $ | (0.23) | $ | (0.05) | $ | (0.19) | |||||||||||||||
| ||||||||
| Financial Supplement | Second Quarter 2025 | |||||||
Reconciliation of Net Income (Loss) to NAREIT FFO, Core FFO, and Adjusted FFO | |||||||||||||||||
| (In thousands, except per share amounts) | |||||||||||||||||
| Three Months Ended June 30, | Six Months Ended June 30, | ||||||||||||||||
| 2025 | 2024 | 2025 | 2024 | ||||||||||||||
| Net income (loss) | $ | 1,550 | $ | (64,409) | $ | (14,923) | $ | (54,607) | |||||||||
| Adjustments: | |||||||||||||||||
| Real estate related depreciation | 55,292 | 56,410 | 110,891 | 112,685 | |||||||||||||
| Net gain from sale of real estate | (11,760) | — | (11,760) | (3,514) | |||||||||||||
| Net loss on real estate related asset disposals | — | 53 | 1 | 93 | |||||||||||||
| Impairment charges on certain real estate assets | 3,739 | — | 3,739 | — | |||||||||||||
| Our share of reconciling items related to partially owned entities | 279 | 418 | 494 | 566 | |||||||||||||
| NAREIT FFO | $ | 49,100 | $ | (7,528) | $ | 88,442 | $ | 55,223 | |||||||||
| Adjustments: | |||||||||||||||||
| Net gain on sale of non-real assets | (163) | (548) | (29) | (568) | |||||||||||||
| Acquisition, cyber incident, and other, net | 23,226 | 3,013 | 48,640 | 18,011 | |||||||||||||
| Impairment of long-lived assets (excluding certain real estate assets) | 1,487 | — | 1,487 | — | |||||||||||||
| Loss on debt extinguishment and termination of derivative instruments | — | 110,682 | — | 115,864 | |||||||||||||
| Foreign currency exchange (gain) loss | (192) | (11,321) | 29 | (10,948) | |||||||||||||
| Gain on legal settlement related to prior period operations | — | — | — | (6,104) | |||||||||||||
| Project Orion deferred costs amortization | 4,762 | 581 | 6,871 | 581 | |||||||||||||
| Our share of reconciling items related to partially owned entities | 27 | 144 | 145 | 280 | |||||||||||||
| Gain from sale of partially owned entity | (2,420) | — | (2,420) | — | |||||||||||||
| Core FFO | $ | 75,827 | $ | 95,023 | $ | 143,165 | $ | 172,339 | |||||||||
| Adjustments: | |||||||||||||||||
| Amortization of deferred financing costs and pension withdrawal liability | 1,523 | 1,294 | 2,923 | 2,583 | |||||||||||||
| Amortization of below/above market leases | 363 | 360 | 714 | 728 | |||||||||||||
| Straight-line rent adjustment | 77 | 367 | 161 | 956 | |||||||||||||
| Deferred income tax expense (benefit) | 1,245 | (4,353) | 1,818 | (3,734) | |||||||||||||
Stock-based compensation expense(1) | 6,594 | 6,064 | 13,853 | 12,683 | |||||||||||||
| Non-real estate depreciation and amortization | 35,170 | 33,239 | 68,553 | 69,059 | |||||||||||||
Maintenance capital expenditures(2) | (17,283) | (22,832) | (32,082) | (40,765) | |||||||||||||
| Our share of reconciling items related to partially owned entities | 71 | 235 | 208 | 461 | |||||||||||||
| Adjusted FFO | $ | 103,587 | $ | 109,397 | $ | 199,313 | $ | 214,310 | |||||||||
| ||||||||
| Financial Supplement | Second Quarter 2025 | |||||||
Reconciliation of Net Income (Loss) to NAREIT FFO, Core FFO, and Adjusted FFO (continued) | |||||||||||||||||
(In thousands, except per share amounts) | |||||||||||||||||
| Three Months Ended June 30, | Six Months Ended June 30, | ||||||||||||||||
| 2025 | 2024 | 2025 | 2024 | ||||||||||||||
| NAREIT FFO | $ | 49,100 | $ | (7,528) | $ | 88,442 | $ | 55,223 | |||||||||
| Core FFO | $ | 75,827 | $ | 95,023 | $ | 143,165 | $ | 172,339 | |||||||||
| Adjusted FFO | $ | 103,587 | $ | 109,397 | $ | 199,313 | $ | 214,310 | |||||||||
| Reconciliation of weighted average shares: | |||||||||||||||||
| Weighted average basic shares for net income calculation | 285,604 | 284,683 | 285,484 | 284,664 | |||||||||||||
| Dilutive stock options and unvested restricted stock units | 190 | 327 | 228 | 280 | |||||||||||||
| Weighted average dilutive shares | 285,794 | 285,010 | 285,712 | 284,944 | |||||||||||||
NAREIT FFO - basic per share | $ | 0.17 | $ | (0.03) | $ | 0.31 | $ | 0.19 | |||||||||
NAREIT FFO - diluted per share | $ | 0.17 | $ | (0.03) | $ | 0.31 | $ | 0.19 | |||||||||
Core FFO - basic per share | $ | 0.27 | $ | 0.33 | $ | 0.50 | $ | 0.61 | |||||||||
Core FFO - diluted per share | $ | 0.27 | $ | 0.33 | $ | 0.50 | $ | 0.60 | |||||||||
Adjusted FFO - basic per share | $ | 0.36 | $ | 0.38 | $ | 0.70 | $ | 0.75 | |||||||||
Adjusted FFO - diluted per share | $ | 0.36 | $ | 0.38 | $ | 0.70 | $ | 0.75 | |||||||||
| ||||||||
| Financial Supplement | Second Quarter 2025 | |||||||
Reconciliation of Net Income (Loss) to NAREIT EBITDAre and Core EBITDA | |||||||||||||||||
| (In thousands) | |||||||||||||||||
| Three Months Ended June 30, | Six Months Ended June 30, | ||||||||||||||||
| 2025 | 2024 | 2025 | 2024 | ||||||||||||||
| Net income (loss) | $ | 1,550 | $ | (64,409) | $ | (14,923) | $ | (54,607) | |||||||||
| Adjustments: | |||||||||||||||||
| Depreciation and amortization | 90,462 | 89,649 | 179,444 | 181,744 | |||||||||||||
| Interest expense | 38,245 | 33,180 | 74,362 | 66,610 | |||||||||||||
| Income tax expense (benefit) | 3,240 | (2,496) | 5,746 | (502) | |||||||||||||
| Net gain from sale of real estate | (11,760) | — | (11,760) | (3,514) | |||||||||||||
| Adjustment to reflect share of EBITDAre of partially owned entities | 976 | 1,520 | 2,492 | 2,990 | |||||||||||||
| NAREIT EBITDAre | $ | 122,713 | $ | 57,444 | $ | 235,361 | $ | 192,721 | |||||||||
| Adjustments: | |||||||||||||||||
| Acquisition, cyber incident, and other, net | 23,226 | 3,013 | 48,640 | 18,011 | |||||||||||||
| Loss from investments in partially owned entities | 335 | 1,034 | 1,698 | 1,983 | |||||||||||||
| Impairment of long-lived assets | 5,226 | — | 5,226 | — | |||||||||||||
| Foreign currency exchange (gain) loss | (192) | (11,321) | 29 | (10,948) | |||||||||||||
Stock-based compensation expense(1) | 6,594 | 6,064 | 13,853 | 12,683 | |||||||||||||
| Loss on debt extinguishment and termination of derivative instruments | — | 110,682 | — | 115,864 | |||||||||||||
| Loss on other asset disposals | (163) | (495) | (28) | (475) | |||||||||||||
| Gain on legal settlement related to prior period operations | — | — | — | (6,104) | |||||||||||||
| Project Orion deferred costs amortization | 4,762 | 581 | 6,871 | 581 | |||||||||||||
| Reduction in EBITDAre from partially owned entities | (976) | (1,520) | (2,492) | (2,990) | |||||||||||||
| Gain from sale of partially owned entity | (2,420) | — | (2,420) | — | |||||||||||||
| Core EBITDA | $ | 159,105 | $ | 165,482 | $ | 306,738 | $ | 321,326 | |||||||||
Total revenues | $ | 650,748 | $ | 660,955 | $ | 1,279,728 | $ | 1,325,935 | |||||||||
| Core EBITDA margin | 24.4 | % | 25.0 | % | 24.0 | % | 24.2 | % | |||||||||
| ||||||||
| Financial Supplement | Second Quarter 2025 | |||||||
Debt Detail and Maturities | |||||||||||||||||||||||
As of June 30, 2025 | |||||||||||||||||||||||
Indebtedness(1): (In thousands) | Carrying Value | Contractual Interest Rate(2) | Effective Interest Rate(3) | Maturity Date(4) | |||||||||||||||||||
Senior Unsecured Revolving Credit Facility - C$65M(5) | $ | 47,764 | CORRA + 0.84% | 4.70% | 08/2027 | ||||||||||||||||||
Senior Unsecured Revolving Credit Facility - A$207.5M(5) | 136,545 | BBSW + 0.84% | 5.37% | 08/2027 | |||||||||||||||||||
Senior Unsecured Revolving Credit Facility - €70.5M(5) | 83,059 | EURIBOR + 0.84% | 3.58% | 08/2027 | |||||||||||||||||||
Senior Unsecured Revolving Credit Facility - NZ$43M(5) | 26,202 | BKBM + 0.84% | 5.05% | 08/2027 | |||||||||||||||||||
Senior Unsecured Term Loan A Facility Tranche A-1 - USD(6) | 375,000 | SOFR + 0.94% | 4.58% | 08/2027 | |||||||||||||||||||
Senior Unsecured Term Loan A Facility Tranche A-2 - C$250M | 183,706 | CORRA + 0.94% | 4.79% | 01/2028 | |||||||||||||||||||
| Senior Unsecured Term Loan A Facility Tranche A-3 - USD | 270,000 | SOFR + 0.94% | 4.27% | 01/2028 | |||||||||||||||||||
Private Series A Unsecured Notes - USD | 200,000 | 4.68% | 4.77% | 01/2026 | |||||||||||||||||||
Private Series B Unsecured Notes - USD | 400,000 | 4.86% | 4.92% | 01/2029 | |||||||||||||||||||
Private Series C Unsecured Notes - USD | 350,000 | 4.10% | 4.15% | 01/2030 | |||||||||||||||||||
Private Series D Unsecured Notes - €400M | 471,259 | 1.62% | 1.67% | 01/2031 | |||||||||||||||||||
Private Series E Unsecured Notes - €350M | 412,352 | 1.65% | 1.70% | 01/2033 | |||||||||||||||||||
Public 5.600% Notes - USD | 400,000 | 5.60% | 5.69% | 05/2032 | |||||||||||||||||||
Public 5.409% Notes - USD | 500,000 | 5.41% | 5.50% | 09/2034 | |||||||||||||||||||
Total Unsecured Debt | $ | 3,855,887 | 3.99% | 4.16% | 4.9 years | ||||||||||||||||||
Sale-leaseback financing obligations | 77,031 | 10.07% | |||||||||||||||||||||
Financing lease obligations | 116,133 | 4.95% | |||||||||||||||||||||
Total Secured Debt | $ | 193,164 | 6.99% | ||||||||||||||||||||
Total Debt Outstanding | $ | 4,049,051 | 4.14% | ||||||||||||||||||||
Less: unamortized deferred financing costs | (17,486) | ||||||||||||||||||||||
Total Book Value of Debt | $ | 4,031,565 | |||||||||||||||||||||
Rate Type: | June 30, 2025 | % of Total | ||||||
Fixed(7) | $ | 3,755,481 | 92.7% | |||||
Variable-unhedged | 293,570 | 7.3% | ||||||
Total Debt Outstanding | $ | 4,049,051 | 100% | |||||
Debt Type: | June 30, 2025 | % of Total | ||||||
Unsecured | $ | 3,855,887 | 95.2% | |||||
Secured | 193,164 | 4.8% | ||||||
Total Debt Outstanding | $ | 4,049,051 | 100% | |||||
Capitalization: | June 30, 2025 | ||||
Total Debt Outstanding | $ | 4,049,051 | |||
| Less: Cash, cash equivalents and restricted cash | 101,376 | ||||
| Net Debt | $ | 3,947,675 | |||
Pro forma Core EBITDA - last twelve months(9) | $ | 626,366 | |||
| Net Debt to Pro Forma Core EBITDA | 6.3x | ||||
Enterprise Value: | June 30, 2025 | ||||
Fully Diluted Common Stock(8) | 288,607 | ||||
| Common Stock Share Price | $ | 16.63 | |||
Market Value of Common Equity | $ | 4,799,534 | |||
| Net Debt | $ | 3,947,675 | |||
| Total Enterprise Value | $ | 8,747,209 | |||
| ||||||||
| Financial Supplement | Second Quarter 2025 | |||||||
| ||||||||
| Financial Supplement | Second Quarter 2025 | |||||||
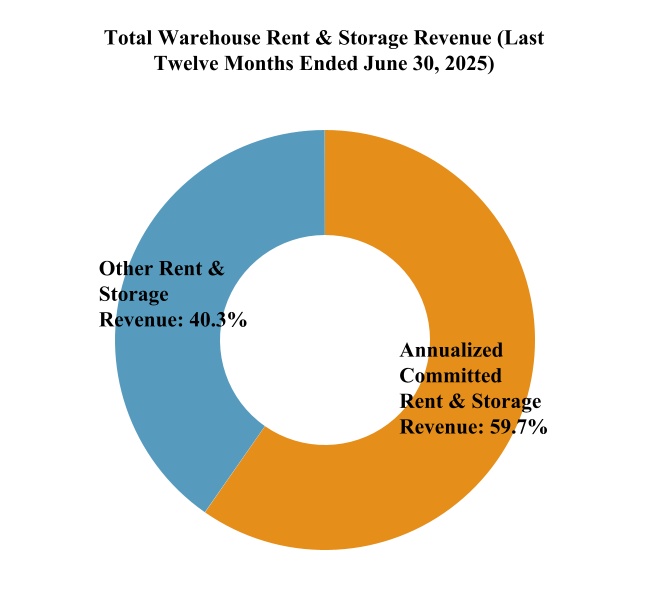
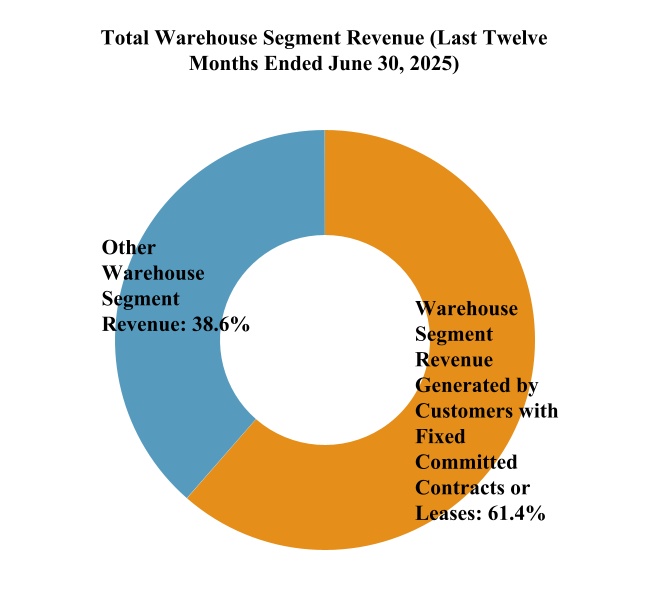
| Contract Expiration Year | Number of Contracts | Annualized Committed Rent & Storage Revenues | % of Total Warehouse Segment Rent & Storage Revenues for the twelve months ended June 30, 2025 | Total Warehouse Segment Revenues Generated by Customers with Fixed Commitment Contracts & Leases for the twelve months ended June 30, 2025(1) | Annualized Committed Rent & Storage Revenues at Expiration(2) | |||||||||||||||||||||||||||
(Dollars in thousands) | ||||||||||||||||||||||||||||||||
| Month-to-Month | 177 | $ | 100,095 | 9.7 | % | $ | 286,140 | $ | 100,095 | |||||||||||||||||||||||
| 2025 | 98 | 59,918 | 5.8 | % | 131,195 | 58,525 | ||||||||||||||||||||||||||
| 2026 | 168 | 199,812 | 19.3 | % | 415,408 | 200,633 | ||||||||||||||||||||||||||
| 2027 | 66 | 61,296 | 5.9 | % | 154,469 | 63,036 | ||||||||||||||||||||||||||
| 2028 | 46 | 47,483 | 4.6 | % | 144,007 | 50,105 | ||||||||||||||||||||||||||
| 2029+ | 49 | 148,775 | 14.4 | % | 335,750 | 159,081 | ||||||||||||||||||||||||||
| Total | 604 | $ | 617,379 | 59.7 | % | $ | 1,466,969 | $ | 631,475 | |||||||||||||||||||||||
| ||||||||
| Financial Supplement | Second Quarter 2025 | |||||||
| Lease Expiration Year | No. of Leases Expiring | Annualized Rent(1) | % of Total Warehouse Rent & Storage Segment Revenues for the twelve months ended June 30, 2025 | Leased Square Footage | % Leased Square Footage | Annualized Rent at Expiration(2) | ||||||||||||||||||||||||||||||||
(Dollars in thousands) | ||||||||||||||||||||||||||||||||||||||
| Month-to-Month | 14 | $ | 1,087 | 0.1 | % | 47 | 1.1 | % | $ | 1,087 | ||||||||||||||||||||||||||||
| 2025 | 26 | 5,751 | 0.6 | % | 408 | 10.0 | % | 5,779 | ||||||||||||||||||||||||||||||
| 2026 | 34 | 11,130 | 1.1 | % | 758 | 18.5 | % | 11,264 | ||||||||||||||||||||||||||||||
| 2027 | 17 | 5,256 | 0.5 | % | 414 | 10.1 | % | 5,513 | ||||||||||||||||||||||||||||||
| 2028 | 26 | 10,484 | 1.0 | % | 1,251 | 30.6 | % | 10,974 | ||||||||||||||||||||||||||||||
| 2029+ | 23 | 20,876 | 2.0 | % | 1,212 | 29.7 | % | 24,893 | ||||||||||||||||||||||||||||||
| Total | 140 | $ | 54,584 | 5.3 | % | 4,090 | 100 | % | $ | 59,510 | ||||||||||||||||||||||||||||
| ||||||||
| Financial Supplement | Second Quarter 2025 | |||||||
| Three Months Ended June 30, | Six Months Ended June 30, | ||||||||||||||||
| 2025 | 2024 | 2025 | 2024 | ||||||||||||||
| (In thousands) | |||||||||||||||||
| Real estate | $ | 9,389 | $ | 10,349 | $ | 20,995 | $ | 24,937 | |||||||||
| Personal property | 21,224 | 18,919 | 41,139 | 35,223 | |||||||||||||
| Total repair and maintenance expenses | $ | 30,613 | $ | 29,268 | $ | 62,134 | $ | 60,160 | |||||||||
| ||||||||
| Financial Supplement | Second Quarter 2025 | |||||||
| Three Months Ended June 30, | Six Months Ended June 30, | ||||||||||||||||
| 2025 | 2024 | 2025 | 2024 | ||||||||||||||
| (In thousands) | |||||||||||||||||
| Maintenance | $ | 17,283 | $ | 22,832 | $ | 32,082 | $ | 40,765 | |||||||||
| External growth and integration | — | — | 108,448 | — | |||||||||||||
| Expansion, development and organic growth | 177,211 | 32,881 | 271,469 | 62,833 | |||||||||||||
| Technological upgrades and enhancements | 5,324 | 2,759 | 9,835 | 3,739 | |||||||||||||
Total capital expenditures(1) | $ | 199,818 | $ | 58,472 | $ | 421,834 | $ | 107,337 | |||||||||
| ||||||||
| Financial Supplement | Second Quarter 2025 | |||||||
Recently Completed Expansion and Development Projects - Non-Same Store | ||||||||||||||||||||||||||||||||||||||||||||||||||||||||
| Facility | Opportunity Type | Facility Type (A = Automated) (C = Conventional) | Tenant Opportunity | Cubic Feet (In millions) | Pallet Positions (In thousands) | Completion Costs (In millions)(1) | Expected Stabilized NOI ROIC | Completion Date | Expected Full Stabilized Quarter | |||||||||||||||||||||||||||||||||||||||||||||||
| Lancaster, PA | Development | Distribution (A) | Build-to-suit | 11.4 | 28 | $164 | 10-12% | Q1 2023 | Q3 2025 | |||||||||||||||||||||||||||||||||||||||||||||||
| Plainville, CT | Development | Distribution (A) | Build-to-suit | 12.1 | 31 | $161 | 10-12% | Q4 2023 | Q2 2026 | |||||||||||||||||||||||||||||||||||||||||||||||
| Allentown, PA | Expansion | Distribution (C) | Multi-tenant | 14.6 | 37 | $79 | 10-12% | Q2 2025 | Q3 2026 | |||||||||||||||||||||||||||||||||||||||||||||||
| Kansas City, MO | Development | Distribution (C) | Multi-tenant | 13.5 | 22 | $100 | 10-12% | Q2 2025 | Q1 2026 | |||||||||||||||||||||||||||||||||||||||||||||||
Expansion and Development Projects In Process and Announced - Non-Same Store | ||||||||||||||||||||||||||||||||||||||||||||||||||||||||||||||||||||
| Facility Type (A = Automated) (C = Conventional) | Under Construction | Investment in Expansion / Development (In millions) | Expected Stabilized NOI ROIC | Target Completion Date | Expected Full Stabilized Quarter | |||||||||||||||||||||||||||||||||||||||||||||||||||||||||||||||
| Facility | Opportunity Type | Tenant Opportunity | Cubic Feet (In millions) (1) | Pallet Positions (In thousands) (1) | Cost to Date (2) | Estimate to Complete | Total Estimated Cost | |||||||||||||||||||||||||||||||||||||||||||||||||||||||||||||
| Sydney, Australia | Expansion | Distribution (C) | Multi-tenant | 2.8 | 13 | A$35 | A$9 - A$11 | A$44 - A$46 | 10-12% | Q1 2026 | Q1 2027 | |||||||||||||||||||||||||||||||||||||||||||||||||||||||||
Christchurch, New Zealand | Expansion | Distribution (C) | Multi-tenant | 3.8 | 16 | NZ$14 | NZ$42 - NZ$46 | NZ$56 - NZ$60 | 10-12% | Q1 2026 | Q3 2027 | |||||||||||||||||||||||||||||||||||||||||||||||||||||||||
Saint John, NB, Canada | Development | Distribution (C) | Multi-tenant | 7.4 | 22 | C$26 | C$77 - C$87 | C$103 - C$113 | 10-12% | Q3 2026 | Q1 2028 | |||||||||||||||||||||||||||||||||||||||||||||||||||||||||
| Dallas Ft. Worth, TX | Expansion | Distribution (A) | Multi-tenant | 18.8 | 50 | $33 | $112 - $122 | $145 - $155 | 10-12% | Q4 2026 | Q2 2028 | |||||||||||||||||||||||||||||||||||||||||||||||||||||||||
Recent Acquisitions - Non-Same Store | ||||||||||||||||||||||||||||||||||||||||||||||||||||||||
| Facility | Metropolitan Area | No. of Facilities | Cubic Feet (In millions) | Pallet Positions (In thousands) | Acquisition Price (In millions) (1) | Net Entry NOI Yield (1) | Expected Three Year Stabilized NOI ROIC | Date Purchased | Expected Full Stabilized Quarter | |||||||||||||||||||||||||||||||||||||||||||||||
| Baytown, TX | Houston, TX | 1 | 10.7 | 36 | $ | 127 | <2% | 10-12% | 3/17/2025 | Q1 2027 | ||||||||||||||||||||||||||||||||||||||||||||||
| ||||||||
| Financial Supplement | Second Quarter 2025 | |||||||
(Dollars in thousands)(1) | Q2 25 | Q1 25 | Q4 24 | Q3 24 | Q2 24 | Q1 24 | |||||||||||||||||||||||||||||
Number of same store warehouses | 223 | 223 | 223 | 223 | 223 | 223 | |||||||||||||||||||||||||||||
Same store revenues: | |||||||||||||||||||||||||||||||||||
| Rent and storage | $247,212 | $245,196 | $254,226 | $256,287 | $259,427 | $256,771 | |||||||||||||||||||||||||||||
| Warehouse services | 325,882 | 314,823 | 338,351 | 339,542 | 322,446 | 316,492 | |||||||||||||||||||||||||||||
Total same store revenues | $573,094 | $560,019 | $592,577 | $595,829 | $581,873 | $573,263 | |||||||||||||||||||||||||||||
Same store cost of operations: | |||||||||||||||||||||||||||||||||||
| Power | 34,106 | 30,656 | 34,287 | 39,991 | 35,379 | 30,913 | |||||||||||||||||||||||||||||
| Other facilities costs | 57,262 | 57,245 | 56,170 | 61,492 | 56,025 | 56,567 | |||||||||||||||||||||||||||||
| Labor | 237,173 | 234,640 | 243,021 | 245,330 | 235,609 | 235,417 | |||||||||||||||||||||||||||||
| Other services costs | 45,327 | 44,763 | 52,706 | 47,919 | 46,857 | 49,164 | |||||||||||||||||||||||||||||
Total same store cost of operations | $373,868 | $367,304 | $386,184 | $394,732 | $373,870 | $372,061 | |||||||||||||||||||||||||||||
Same store contribution (NOI) | $199,226 | $192,715 | $206,393 | $201,097 | $208,003 | $201,202 | |||||||||||||||||||||||||||||
Same store rent and storage contribution (NOI)(2) | $155,844 | $157,295 | $163,769 | $154,804 | $168,023 | $169,291 | |||||||||||||||||||||||||||||
Same store services contribution (NOI)(3) | $43,382 | $35,420 | $42,624 | $46,293 | $39,980 | $31,911 | |||||||||||||||||||||||||||||
Same store margin | 34.8 | % | 34.4 | % | 34.8 | % | 33.8 | % | 35.7 | % | 35.1 | % | |||||||||||||||||||||||
Same store rent and storage margin(4) | 63.0 | % | 64.2 | % | 64.4 | % | 60.4 | % | 64.8 | % | 65.9 | % | |||||||||||||||||||||||
Same store services margin(5) | 13.3 | % | 11.3 | % | 12.6 | % | 13.6 | % | 12.4 | % | 10.1 | % | |||||||||||||||||||||||
Same store rent and storage metrics: | |||||||||||||||||||||||||||||||||||
| Economic occupancy | |||||||||||||||||||||||||||||||||||
Average economic occupied pallets(6) | 3,972 | 4,044 | 4,190 | 4,137 | 4,203 | 4,267 | |||||||||||||||||||||||||||||
Economic occupancy percentage(6) | 75.5 | % | 76.6 | % | 79.3 | % | 78.3 | % | 79.6 | % | 80.8 | % | |||||||||||||||||||||||
Same store rent and storage revenues per economic occupied pallet | $62.24 | $60.63 | $60.67 | $61.95 | $61.72 | $60.18 | |||||||||||||||||||||||||||||
| Physical occupancy | |||||||||||||||||||||||||||||||||||
Average physical occupied pallets(7) | 3,387 | 3,434 | 3,612 | 3,584 | 3,637 | 3,698 | |||||||||||||||||||||||||||||
| Average physical pallet positions | 5,263 | 5,279 | 5,284 | 5,284 | 5,278 | 5,279 | |||||||||||||||||||||||||||||
Physical occupancy percentage(7) | 64.4 | % | 65.1 | % | 68.4 | % | 67.8 | % | 68.9 | % | 70.1 | % | |||||||||||||||||||||||
Same store rent and storage revenues per physical occupied pallet | $72.99 | $71.40 | $70.38 | $71.51 | $71.33 | $69.44 | |||||||||||||||||||||||||||||
Same store services metrics: | |||||||||||||||||||||||||||||||||||
| Throughput pallets | 8,577 | 8,561 | 9,047 | 8,999 | 8,819 | 8,815 | |||||||||||||||||||||||||||||
Same store warehouse services revenues per throughput pallet | $37.99 | $36.77 | $37.40 | $37.73 | $36.56 | $35.90 | |||||||||||||||||||||||||||||
Total non-same store results: | |||||||||||||||||||||||||||||||||||
Non-same store revenues | $20,976 | $15,338 | $13,888 | $16,352 | $18,514 | $24,447 | |||||||||||||||||||||||||||||
Non-same store cost of operations | $19,197 | $11,468 | $18,854 | $18,825 | $21,986 | $28,518 | |||||||||||||||||||||||||||||
Non-same store contribution NOI | $1,779 | $3,870 | $(4,966) | $(2,473) | $(3,472) | $(4,071) | |||||||||||||||||||||||||||||
| ||||||||
| Financial Supplement | Second Quarter 2025 | |||||||
| SuperFrio | ||||||||||||||
| June 30, | ||||||||||||||
| Summary Balance Sheet - at the JV’s 100% share in BRLs | 2025 | 2024 | ||||||||||||
| (In thousands) | ||||||||||||||
Net book value of property, buildings, and equipment | R$ | — | R$ | 1,133,020 | ||||||||||
| Other assets | — | 493,244 | ||||||||||||
| Total assets | R$ | — | R$ | 1,626,264 | ||||||||||
| Debt | R$ | — | R$ | 725,877 | ||||||||||
| Other liabilities | — | 538,700 | ||||||||||||
| Equity | — | 361,687 | ||||||||||||
| Total liabilities and equity | R$ | — | R$ | 1,626,264 | ||||||||||
| Americold’s ownership percentage | — | 14.99% | ||||||||||||
BRL/USD end of period rate | 0.1841 | 0.1789 | ||||||||||||
| Americold’s pro rata share of debt at BRL/USD rate | $ | — | $ | 19,466 | ||||||||||
| Three Months Ended | Six Months Ended | |||||||||||||
| Summary Statement of Operations - at the JV’s 100% share in BRLs | Q2 25 | Q2 24 | Q2 25 | Q2 24 | ||||||||||
| (In thousands) | ||||||||||||||
| Revenues | R$ | 48,625 | R$ | 149,150 | R$ | 190,783 | R$ | 294,424 | ||||||
| Cost of operations | 41,220 | 112,283 | 159,727 | 223,895 | ||||||||||
Selling, general, and administrative expense | 2,771 | 6,126 | 10,823 | 13,526 | ||||||||||
M&A expense & other | 3,325 | 5,664 | 7,575 | 8,892 | ||||||||||
| Depreciation & amortization | 4,973 | 17,084 | 20,582 | 35,738 | ||||||||||
| Total operating expenses | 52,289 | 141,157 | 198,707 | 282,051 | ||||||||||
Operating (loss) income | (3,664) | 7,993 | (7,924) | 12,373 | ||||||||||
| Interest expense | (15,787) | (36,683) | (61,231) | (67,032) | ||||||||||
Other income | 19 | 1,023 | 543 | 1,802 | ||||||||||
Income tax (expense) benefit | (51) | (88) | (282) | (40) | ||||||||||
| Non-operating expenses | (15,819) | (35,748) | (60,970) | (65,270) | ||||||||||
| Net loss | R$ | (19,483) | R$ | (27,755) | R$ | (68,894) | R$ | (52,897) | ||||||
| Americold’s ownership percentage | 14.99 | % | 14.99 | % | 14.99 | % | 14.99 | % | ||||||
| BRL/USD average rate | 0.1766 | 0.1917 | 0.1738 | 0.1968 | ||||||||||
| Americold’s pro rata share of NOI | $ | 196 | $ | 1,059 | $ | 802 | $ | 2,081 | ||||||
| Americold’s pro rata share of Net loss | $ | (516) | $ | (798) | $ | (1,782) | $ | (1,560) | ||||||
| Americold’s pro rata share of Core FFO | $ | (358) | $ | (370) | $ | (1,294) | $ | (741) | ||||||
Americold’s pro rata share of Adjusted FFO | $ | (305) | $ | (227) | $ | (1,099) | $ | (386) | ||||||
| ||||||||
| Financial Supplement | Second Quarter 2025 | |||||||
| RSA | ||||||||||||||
| June 30, | ||||||||||||||
| Summary Balance Sheet - at the JV’s 100% share in AED | 2025 | 2024 | ||||||||||||
| (In thousands) | ||||||||||||||
Net book value of property, buildings, and equipment | 181,642 | 67,102 | ||||||||||||
| Other assets | 12,965 | 11,043 | ||||||||||||
| Total assets | 194,607 | 78,145 | ||||||||||||
| Debt | 139,802 | 49,793 | ||||||||||||
| Other liabilities | 25,007 | 10,871 | ||||||||||||
| Equity | 29,798 | 17,481 | ||||||||||||
| Total liabilities and equity | 194,607 | 78,145 | ||||||||||||
| Americold’s ownership percentage | 49 | % | 49 | % | ||||||||||
AED/USD end of period rate | 0.2723 | 0.2723 | ||||||||||||
| Americold’s pro rata share of debt at AED/USD rate | $ | 18,653 | $ | 6,644 | ||||||||||
| Three Months Ended | Six Months Ended | |||||||||||||
| Summary Statement of Operations - at the JV’s 100% share in AED | Q2 25 | Q2 24 | Q2 25 | Q2 24 | ||||||||||
| (In thousands) | ||||||||||||||
| Revenues | 8,863 | 3,835 | 15,371 | 6,597 | ||||||||||
| Cost of operations | 6,770 | 4,313 | 12,031 | 8,068 | ||||||||||
Depreciation & amortization | 915 | 415 | 1,797 | 829 | ||||||||||
| Total operating expenses | 7,685 | 4,728 | 13,828 | 8,897 | ||||||||||
| Operating income (loss) | 1,178 | (893) | 1,543 | (2,300) | ||||||||||
| Interest expense | (676) | (216) | (1,329) | (409) | ||||||||||
| Non-operating expenses | (676) | (216) | (1,329) | (409) | ||||||||||
Net income (loss) | 502 | (1,109) | 214 | (2,709) | ||||||||||
| Americold’s ownership percentage | 49 | % | 49 | % | 49 | % | 49 | % | ||||||
| AED/USD average rate | 0.2723 | 0.2723 | 0.2723 | 0.2723 | ||||||||||
| Americold’s pro rata share of NOI | $ | 279 | $ | (64) | $ | 446 | $ | (196) | ||||||
Americold’s pro rata share of Net loss | $ | 67 | $ | (148) | $ | 29 | $ | (361) | ||||||
| Americold’s pro rata share of Core FFO | $ | 167 | $ | (99) | $ | 228 | $ | (263) | ||||||
Americold’s pro rata share of Adjusted FFO | $ | 168 | $ | (97) | $ | 244 | $ | (256) | ||||||
| ||||||||
| Financial Supplement | Second Quarter 2025 | |||||||
| Revenues and Contribution (NOI) by Segment | |||||||||||||||||||||||
(In thousands) | |||||||||||||||||||||||
| Three Months Ended June 30, | Six Months Ended June 30, | ||||||||||||||||||||||
| 2025 | 2024 | 2025 | 2024 | ||||||||||||||||||||
| Segment revenues: | |||||||||||||||||||||||
| Warehouse | $ | 594,070 | $ | 600,387 | $ | 1,169,427 | $ | 1,198,097 | |||||||||||||||
| Transportation | 48,097 | 50,637 | 92,090 | 107,490 | |||||||||||||||||||
| Third-party managed | 8,581 | 9,931 | 18,211 | 20,348 | |||||||||||||||||||
| Total revenues | 650,748 | 660,955 | 1,279,728 | 1,325,935 | |||||||||||||||||||
| Segment contribution: | |||||||||||||||||||||||
| Warehouse | 201,005 | 204,531 | 397,590 | 401,662 | |||||||||||||||||||
| Transportation | 8,742 | 8,850 | 15,996 | 20,372 | |||||||||||||||||||
| Third-party managed | 1,909 | 2,102 | 3,918 | 4,285 | |||||||||||||||||||
| Total segment contribution (NOI) | 211,656 | 215,483 | 417,504 | 426,319 | |||||||||||||||||||
| Reconciling items: | |||||||||||||||||||||||
| Depreciation and amortization expense | (90,462) | (89,649) | (179,444) | (181,744) | |||||||||||||||||||
Selling, general, and administrative expense | (66,907) | (59,453) | (136,142) | (124,879) | |||||||||||||||||||
| Acquisition, cyber incident, and other, net | (23,226) | (3,013) | (48,640) | (18,011) | |||||||||||||||||||
| Impairment of long-lived assets | (5,226) | — | (5,226) | — | |||||||||||||||||||
| Net gain from sale of real estate | 11,760 | — | 11,760 | 3,514 | |||||||||||||||||||
| Interest expense | (38,245) | (33,180) | (74,362) | (66,610) | |||||||||||||||||||
| Loss on debt extinguishment and termination of derivative instruments | — | (110,682) | — | (115,864) | |||||||||||||||||||
| Loss from investments in partially owned entities | (335) | (1,034) | (1,698) | (1,983) | |||||||||||||||||||
| Other, net | 5,775 | 14,623 | 7,071 | 24,149 | |||||||||||||||||||
| Income (loss) before income taxes | $ | 4,790 | $ | (66,905) | $ | (9,177) | $ | (55,109) | |||||||||||||||
| ||||||||
| Financial Supplement | Second Quarter 2025 | |||||||
| Notes and Definitions | ||
We use the following non-GAAP financial measures as supplemental performance measures of our business: NAREIT FFO, Core FFO, Adjusted FFO, NAREIT EBITDAre, Core EBITDA, Core EBITDA margin, net debt to pro-forma Core EBITDA, segment contribution (“NOI”) and margin, same store revenues and NOI, certain constant currency metrics, and maintenance capital expenditures. | ||
We calculate NAREIT funds from operations, or NAREIT FFO, in accordance with the standards established by the Board of Governors of the National Association of Real Estate Investment Trusts, or NAREIT. NAREIT defines FFO as net income or loss determined in accordance with U.S. GAAP, excluding extraordinary items as defined under U.S. GAAP and gains or losses from sales of previously depreciated operating real estate and other assets, plus specified non-cash items, such as real estate asset depreciation and amortization, impairment charges on real estate related assets, and our share of reconciling items for partially owned entities. We believe that NAREIT FFO is helpful to investors as a supplemental performance measure because it excludes the effect of real estate related depreciation, amortization and gains or losses from sales of real estate or real estate related assets, all of which are based on historical costs, which implicitly assumes that the value of real estate diminishes predictably over time. Since real estate values instead have historically risen or fallen with market conditions, NAREIT FFO can facilitate comparisons of operating performance between periods and among other equity REITs. | ||
We calculate core funds from operations, or Core FFO, as NAREIT FFO adjusted for the effects of Net gain on sale of non-real assets; Acquisition, cyber incident, and other, net; Impairment of long-lived assets (excluding certain real estate assets); Loss on debt extinguishment and termination of derivative instruments; Foreign currency exchange (gain) loss; Gain on legal settlement related to prior period operations; Project Orion deferred costs amortization; Our share of reconciling items related to partially owned entities; and Gain from sale of partially owned entity. We believe that Core FFO is helpful to investors as a supplemental performance measure because it excludes the effects of certain items which can create significant earnings volatility, but which do not directly relate to our core business operations. We believe Core FFO can facilitate comparisons of operating performance between periods, while also providing a more meaningful predictor of future earnings potential. | ||
| However, because NAREIT FFO and Core FFO add back real estate depreciation and amortization and do not capture the level of maintenance capital expenditures necessary to maintain the operating performance of our properties, both of which have material economic impacts on our results from operations, we believe the utility of NAREIT FFO and Core FFO measures of our performance may be limited. | ||
We calculate adjusted funds from operations, or Adjusted FFO, as Core FFO adjusted for the effects of Amortization of deferred financing costs and pension withdrawal liability; Amortization of below/above market leases; Straight-line rent adjustment; Deferred income tax expense (benefit); Stock-based compensation expense; Non-real estate depreciation and amortization; Maintenance capital expenditures; and Our share of reconciling items related to partially owned entities. We believe that Adjusted FFO is helpful to investors as a meaningful supplemental comparative performance measure of our ability to make incremental capital investments in our business and to assess our ability to fund distribution requirements from our operating activities. | ||
NAREIT FFO, Core FFO and Adjusted FFO are used by management, investors and industry analysts as supplemental measures of operating performance of equity REITs. NAREIT FFO, Core FFO and Adjusted FFO should be evaluated along with U.S. GAAP net income and net income per diluted share (the most directly comparable U.S. GAAP measures) in evaluating our operating performance. NAREIT FFO, Core FFO and Adjusted FFO do not represent net income or cash flows from operating activities in accordance with U.S. GAAP and are not indicative of our results of operations or cash flows from operating activities as disclosed in our consolidated statements of operations included in our quarterly and annual reports. NAREIT FFO, Core FFO and Adjusted FFO should be considered as supplements, but not alternatives, to our net income or cash flows from operating activities as indicators of our operating performance. Moreover, other REITs may not calculate FFO in accordance with the NAREIT definition or may interpret the NAREIT definition differently than we do. Accordingly, our NAREIT FFO may not be comparable to FFO as calculated by other REITs. In addition, there is no industry definition of Core FFO or Adjusted FFO and, as a result, other REITs may also calculate Core FFO or Adjusted FFO, or other similarly-captioned metrics, in a manner different than we do. We reconcile NAREIT FFO, Core FFO and Adjusted FFO to Net income (loss), which is the most directly comparable financial measure calculated in accordance with U.S. GAAP. | ||
We calculate NAREIT EBITDA for Real Estate, or NAREIT EBITDAre, in accordance with the standards established by the Board of Governors of NAREIT, defined as, Net income (loss) before Depreciation and amortization; Interest expense; Income tax expense (benefit); Net gain from sale of real estate; and Adjustment to reflect share of EBITDAre of partially owned entities. NAREIT EBITDAre is a measure commonly used in our industry, and we present NAREIT EBITDAre to enhance investor understanding of our operating performance. We believe that NAREIT EBITDAre provides investors and analysts with a measure of operating results unaffected by differences in capital structures, capital investment cycles and useful life of related assets among otherwise comparable companies. | ||
We also calculate our Core EBITDA as NAREIT EBITDAre further adjusted for Acquisition, cyber incident, and other, net; Loss from investments in partially owned entities; Impairment of long-lived assets; Foreign currency exchange (gain) loss; Stock-based compensation expense; Loss on debt extinguishment and termination of derivative instruments; Loss on other asset disposals; Gain on legal settlement related to prior period operations; Project Orion deferred costs amortization; Reduction in EBITDAre from partially owned entities; and Gain from sale of partially owned entity. We believe that the presentation of Core EBITDA provides a measurement of our operations that is meaningful to investors because it excludes the effects of certain items that are otherwise included in NAREIT EBITDAre but which we do not believe are indicative of our core business operations. We calculate Core EBITDA margin as Core EBITDA divided by revenues. NAREIT EBITDAre and Core EBITDA are not measurements of financial performance or liquidity under U.S. GAAP, and our NAREIT EBITDAre and Core EBITDA may not be comparable to similarly titled measures of other companies. You should not consider our NAREIT EBITDAre and Core EBITDA as alternatives to net income or cash flows from operating activities determined in accordance with U.S. GAAP. Our calculations of NAREIT EBITDAre and Core EBITDA have limitations as analytical tools, including: | ||
•these measures do not reflect our historical or future cash requirements for maintenance capital expenditures or growth and expansion capital expenditures; •these measures do not reflect changes in, or cash requirements for, our working capital needs; •these measures do not reflect the interest expense, or the cash requirements necessary to service interest or principal payments, on our indebtedness; •these measures do not reflect our tax expense or the cash requirements to pay our taxes; and •although depreciation and amortization are non-cash charges, the assets being depreciated will often have to be replaced in the future and these measures do not reflect any cash requirements for such replacements. | ||
| ||||||||
| Financial Supplement | Second Quarter 2025 | |||||||
| Net debt to proforma Core EBITDA is calculated using total debt outstanding less cash, cash equivalents, and restricted cash divided by pro-forma and/or Core EBITDA. If applicable, we calculate pro-forma Core EBITDA as Core EBITDA further adjusted for acquisitions. The pro-forma adjustment for acquisitions reflects the Core EBITDA for the period of time prior to acquisition. | ||
NOI is calculated as earnings/loss before interest expense, taxes, Depreciation and amortization, and excluding corporate Selling, general, and administrative expense; Acquisition, cyber incident, and other, net; Impairment of long-lived assets; Net gain from sale of real estate and all components of non-operating other income and expense. Management believes that this is a helpful metric to measure period to period operating performance of the business. | ||
We define our “same store” population once annually at the beginning of the current calendar year. Our population includes properties owned or leased for the entirety of two comparable periods with at least twelve consecutive months of normalized operations prior to January 1 of the current calendar year. We define “normalized operations” as properties that have been open for operation or lease, after development, expansion, or significant modification (e.g., rehabilitation subsequent to a natural disaster). Acquired properties are included in the “same store” population if owned by us as of the first business day of the prior calendar year (e.g. January 1, 2024) and are still owned by us as of the end of the current reporting period, unless the property is under development. The “same store” pool is also adjusted to remove properties that are being exited (e.g. non-renewal of warehouse lease or held for sale to third parties), were sold, or entered development subsequent to the beginning of the current calendar year. Changes in ownership structure (e.g., purchase of a previously leased warehouse) does not result in a facility being excluded from the same store population, as management believes that actively managing its real estate is normal course of operations. Additionally, management classifies new developments (both conventional and automated facilities) as a component of the same store pool once the facility is considered fully operational and both inbounding and outbounding product for at least twelve consecutive months prior to January 1 of the current calendar year. | ||
We calculate “same store revenues” as revenues for the same store population. We calculate “same store contribution (NOI)” as revenues for the same store population less its cost of operations (excluding any Depreciation and amortization, Impairment of long-lived assets, Selling, general, and administrative, Acquisition, cyber incident, and other, net and Net gain from sale of real estate). In order to derive an appropriate measure of period-to-period operating performance, we also calculate our same store contribution (NOI) on a constant currency basis to remove the effects of foreign currency exchange rate movements by using the comparable prior period exchange rate to translate from local currency into U.S. dollars for both periods. We evaluate the performance of the warehouses we own or lease using a “same store” analysis, and we believe that same store contribution (NOI) is helpful to investors as a supplemental performance measure because it includes the operating performance from the population of properties that is consistent from period to period and also on a constant currency basis, thereby eliminating the effects of changes in the composition of our warehouse portfolio and currency fluctuations on performance measures. Same store contribution (NOI) is not a measurement of financial performance under U.S. GAAP. In addition, other companies providing temperature-controlled warehouse storage and handling and other warehouse services may not define same store or calculate same store contribution (NOI) in a manner consistent with our definition or calculation. Same store contribution (NOI) should be considered as a supplement, but not as an alternative, to our results calculated in accordance with U.S. GAAP. | ||
| We define “maintenance capital expenditures” as capital expenditures made to extend the life of, and provide future economic benefit from, our existing temperature-controlled warehouse network and its existing supporting personal property and information technology. Maintenance capital expenditures do not include acquisition costs contemplated when underwriting the purchase of a building or costs which are incurred to bring a building up to Americold’s operating standards. | ||
| All quarterly amounts and non-GAAP disclosures within this filing shall be deemed unaudited. | ||