Management’s Discussion and Analysis |
This Management’s Discussion and Analysis (“MD&A”) of financial position and results of operations of Franco-Nevada Corporation (“Franco-Nevada”, the “Company”, “we” or “our”) has been prepared based upon information available to Franco-Nevada as at August 11, 2026 and should be read in conjunction with Franco-Nevada’s unaudited condensed consolidated interim financial statements and related notes as at and for the three and six months ended June 30, 2026 and 2025 (the “financial statements”). The financial statements and this MD&A are presented in U.S. dollars and the financial statements have been prepared in accordance with International Financial Reporting Standards as issued by the International Accounting Standards Board (“IASB”) (“IFRS Accounting Standards”) applicable to the presentation of condensed interim financial statements, including IAS 34, Interim Financial Reporting.
Readers are cautioned that this MD&A contains forward-looking statements and that actual events may vary from management’s expectations. Readers are encouraged to read the “Cautionary Statement on Forward-Looking Information” at the end of this MD&A and to consult Franco-Nevada’s financial statements which are available on our website at www.franco-nevada.com, on SEDAR+ at www.sedarplus.com and on Form 6-K furnished to the United States Securities and Exchange Commission (“SEC”) on EDGAR at www.sec.gov.
Additional information related to Franco-Nevada, including our Annual Information Form and Form 40-F, is available on SEDAR+ at www.sedarplus.com and on EDGAR at www.sec.gov, respectively. These documents contain descriptions of certain aspects of Franco-Nevada’s producing and advanced royalty and stream assets, as well as a description of risk factors affecting the Company. For additional information, please see our website at www.franco-nevada.com.
3 | |
4 | |
5 | |
6 | |
10 | |
10 | |
11 | |
13 | |
17 | |
22 | General and Administrative and Share-Based Compensation Expenses |
23 | |
24 | |
25 | |
25 | |
29 | |
29 | |
30 | Internal Control Over Financial Reporting and Disclosure Controls and Procedures |
30 | |
31 | |
34 |
Abbreviations Used in this Report |
The following abbreviations may be used throughout this MD&A:
Abbreviated Definitions | | | | | | ||
Periods under review | | Measurement | | Interest types | |||
"Q4" | The three-month period ended December 31 | | "GEO" | Gold equivalent ounce | | "NSR" | Net smelter return royalty |
"Q3" | The three-month period ended September 30 | | "PGM" | Platinum group metals | | "GR" | Gross royalty |
"Q2" | The three-month period ended June 30 | | "NGL" | Natural gas liquids | | "ORR" | Overriding royalty |
"Q1" | The three-month period ended March 31 | | "oz" | Ounce | | "GORR" | Gross overriding royalty |
"H2" | The six-month period ended December 31 | | "oz Au" | Ounce of gold | | "FH" | Freehold or lessor royalty |
"H1" | The six-month period ended June 30 | | "oz Ag" | Ounce of silver | | "GMR" | Gross margin royalty |
| | | "oz Pt" | Ounce of platinum | | "NPI" | Net profits interest |
| | | "oz Pd" | Ounce of palladium | | "NRI" | Net royalty interest |
Places and currencies | | | "62% Fe" | 62% Fe iron ore fines, dry metric | | "WI" | Working interest |
"U.S." | United States | | | tonnes CFR China | | | |
"$" or "USD" | United States dollars | | "LBMA" | London Bullion Market Association | | | |
"C$" or "CAD" | Canadian dollars | | "bbl" | Barrel | | | |
"R$" or "BRL" | Brazilian reais | | "mcf" | Thousand cubic feet | | | |
"A$" or "AUD" | Australian dollars | | "WTI" | West Texas Intermediate | | | |
| | | | | | | |
For definitions of the various types of agreements, please refer to our most recent Annual Information Form filed on SEDAR+ at www.sedarplus.com or our Form 40-F filed on EDGAR at www.sec.gov.
Second Quarter 2026 Management’s Discussion and Analysis | 2 |
Franco-Nevada is the leading gold-focused royalty and streaming company with the largest and most diversified portfolio of cash-flow producing assets.
Our Portfolio (at August 11, 2026) | ||||||||
| | Precious Metals | | Other Mining | | Energy | | TOTAL |
Producing | | 53 | | 13 | | 55 | | 121 |
Advanced | | 38 | | 9 | | — | | 47 |
Exploration | | 166 | | 85 | | 28 | | 279 |
TOTAL | | 257 | | 107 | | 83 | | 447 |
Our shares are listed on the Toronto and New York stock exchanges under the symbol FNV. An investment in our shares is expected to provide investors with yield and exposure to commodity price and exploration optionality while limiting exposure to cost inflation and other operating risks.
Second Quarter 2026 Management’s Discussion and Analysis | 3 |
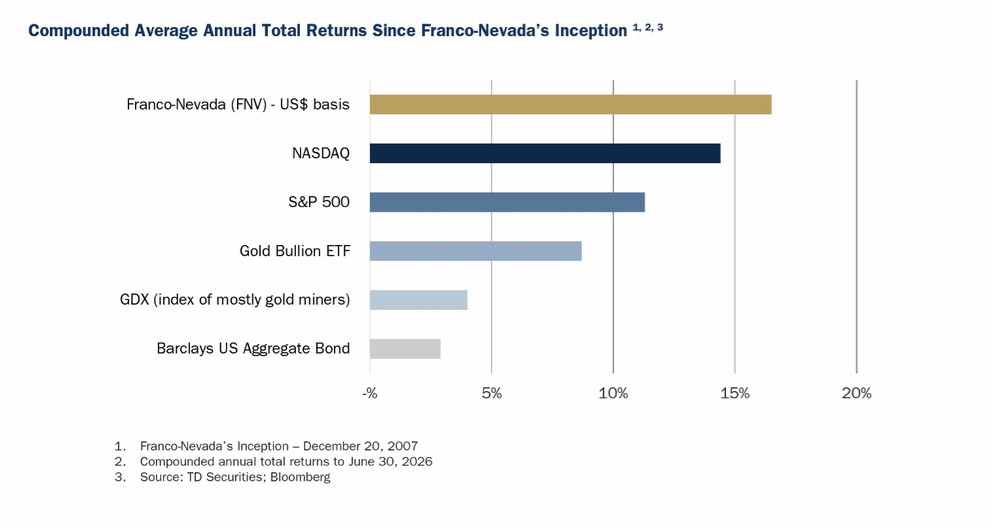
We believe that combining lower risk gold investments with a strong balance sheet, progressively growing dividends and exposure to exploration optionality is the right mix to appeal to investors seeking to hedge market instability. Since our Initial Public Offering over 18 years ago, we have increased our dividend annually and our share price has outperformed the gold price and all relevant gold equity benchmarks. Creating successful long-term partnerships with operators is a core objective. The alignment and the natural flexibility of royalty and stream financing has made it an attractive source of capital for the cyclical resource sector. We also work to be a positive force in all our communities, providing a safe and diverse workplace, promoting responsible mining and contributing to build community support for the operations in which we invest.
Our revenue is generated from various forms of agreements, ranging from net smelter return royalties, gross margin royalties, streams, profit-based royalty interests, net royalty interests, working interests and other types of arrangements. We do not operate mines, develop projects or conduct exploration. Franco-Nevada has a free cash flow generating business with no additional capital requirements other than the initial commitment and limited cash calls with respect to its working interests. Management is focused on managing and growing its portfolio of royalties and streams for the long-term. We recognize the cyclical nature of the industry and have a long-term investment outlook. We maintain a strong balance sheet to minimize financial risk and to provide capital to the industry when it is otherwise scarce.
The advantages of this business model are:
| ● | Exposure to commodity price optionality; |
| ● | A perpetual discovery option over large areas of geologically prospective lands; |
| ● | No additional capital requirements other than the initial commitment and limited cash calls; |
| ● | Limited exposure to cost inflation; |
| ● | A free cash-flow business with limited cash calls; |
| ● | A high-margin business that can generate cash through the entire commodity cycle; |
| ● | A scalable and diversified business in which a large number of assets can be managed with a small stable overhead; and |
| ● | Management that focuses on forward-looking growth opportunities rather than operational or development issues. |
Our short-term financial results are primarily tied to the price of commodities and the amount of production from our portfolio of assets. Our attributable production has typically been supplemented by acquisitions of new assets. Over the longer term, our results are impacted by the amount of exploration and development capital available to operators to expand or extend our producing assets or to progress our advanced and exploration assets into production.
The focus of our business is to create exposure to gold and precious metal resource optionality. This principally involves investments in gold mines and providing capital to copper and other base metal mines to obtain exposure to by-product gold, silver and platinum group metals production. We also invest in other metals and energy to expose our shareholders to additional resource optionality. In H1 2026, 89% of our revenue was earned from mining assets, of which 87% was earned from precious metals.
A strength of our business model is that our margins are not generally impacted when producer costs increase. The majority of our interests are royalty and streams with payments/deliveries that are based on production levels with no adjustments for the operator’s operating costs. In H1 2026, these interests accounted for 88% of our revenue (H1 2025 – 92%). The remainder of our revenue was earned from WI, NPI, NRI and GMR royalties which are based on the margin or profit of the underlying operations.
Second Quarter 2026 Management’s Discussion and Analysis | 4 |
Selected Financial Information
| | For the three months ended | | | For the six months ended | |||||||||||
(in millions, except Adjusted EBITDA Margin, Adjusted Net Income Margin, | | June 30, | | | June 30, | |||||||||||
per ounce amounts and per share amounts) | | 2026 | | | 2025 | | | 2026 | | | 2025 | | ||||
Operational Measures | | | | | | | | | | | | | | | | |
Sales by commodity | | | | | | | | | | | | | | | | |
Gold ounces sold | | | 91,224 | | | | 78,738 | | | | 182,382 | | | | 164,261 | |
Silver ounces sold | | | 1,181,458 | | | | 1,140,041 | | | | 2,598,799 | | | | 2,285,705 | |
PGMs ounces sold | | | 7,865 | | | | 7,109 | | | | 15,699 | | | | 14,308 | |
Diversified revenue | | $ | 82.2 | | | $ | 62.7 | | | $ | 164.8 | | | $ | 137.5 | |
Gold equivalent ounces sold(1) | |
| 132,405 | | |
| 112,093 | | |
| 268,758 | | |
| 238,678 | |
Net gold equivalent ounces sold(1) | | | 122,205 | | | | 101,876 | | | | 248,225 | | | | 215,014 | |
Statement of Comprehensive Income | | | | | | | | | | | | | | | | |
Revenue | | $ | 580.9 | | | $ | 369.4 | | | $ | 1,231.6 | | | $ | 737.8 | |
Costs of sales | |
| 45.9 | | |
| 33.5 | | |
| 92.4 | | |
| 72.0 | |
Depletion and depreciation | |
| 84.0 | | |
| 64.0 | | |
| 161.9 | | |
| 132.4 | |
Operating income | |
| 445.7 | | |
| 305.8 | | |
| 1,023.5 | | |
| 559.3 | |
Net income | |
| 354.0 | | |
| 247.1 | | |
| 822.6 | | |
| 456.9 | |
Basic earnings per share | | $ | 1.84 | | | $ | 1.28 | | | $ | 4.27 | | | $ | 2.37 | |
Diluted earnings per share | | $ | 1.83 | | | $ | 1.28 | | | $ | 4.26 | | | $ | 2.37 | |
Statement of Shareholders' Equity | | | | | | | | | | | | | | | | |
Dividends declared per share | | $ | 0.44 | | | $ | 0.38 | | | $ | 0.88 | | | $ | 0.76 | |
Dividends declared (including DRIP) | | $ | 84.0 | | | $ | 72.9 | | | $ | 168.4 | | | $ | 146.3 | |
Weighted average shares outstanding | |
| 192.9 | | |
| 192.7 | | |
| 192.8 | | |
| 192.6 | |
Non-GAAP Measures | | | | | | | | | | | | | | | | |
Cash Costs(2) | | $ | 45.9 | | | $ | 33.5 | | | $ | 92.4 | | | $ | 72.0 | |
Cash Costs(2) per GEO sold | | $ | 347 | | | $ | 299 | | | $ | 344 | | | $ | 302 | |
Adjusted EBITDA(2) | | $ | 529.7 | | | $ | 365.7 | | | $ | 1,121.6 | | | $ | 687.6 | |
Adjusted EBITDA(2) per share | | $ | 2.75 | | | $ | 1.90 | | | $ | 5.82 | | | $ | 3.57 | |
Adjusted EBITDA Margin(2) | |
| 91.2 | % | |
| 99.0 | % | |
| 91.1 | % | |
| 93.2 | % |
Adjusted Net Income(2)(3) | | $ | 349.2 | | | $ | 238.5 | | | $ | 807.5 | | | $ | 444.0 | |
Adjusted Net Income(2)(3) per share | | $ | 1.81 | | | $ | 1.24 | | | $ | 4.19 | | | $ | 2.31 | |
Adjusted Net Income Margin(2)(3) | | | 60.1 | % | | | 64.6 | % | | | 65.6 | % | | | 60.2 | % |
Statement of Cash Flows | | | | | | | | | | | | | | | | |
Net cash provided by operating activities | | $ | 482.5 | | | $ | 430.3 | | | $ | 1,002.9 | | | $ | 719.2 | |
Net cash used in investing activities | | $ | (101.4) | | | $ | (1,338.1) | | | $ | (499.3) | | | $ | (1,889.1) | |
Net cash used in financing activities | | $ | (81.2) | | | $ | (66.1) | | | $ | (162.0) | | | $ | (132.9) | |
| | | As at | | | As at | | | ||
| | | June 30, | | | December 31, | | | ||
(expressed in millions) | | | 2026 | | | 2025 | | | ||
Statement of Financial Position | | | | | | | | | | |
Cash and cash equivalents | | | $ | 1,014.2 | | | $ | 670.9 | | |
Investments | | |
| 1,215.1 | | |
| 1,141.3 | | |
Royalty, stream and working interests, net | | | | 6,262.3 | | | | 6,043.1 | | |
Total assets | | | | 8,922.2 | | | | 8,241.4 | | |
Deferred income tax liabilities | | | | 503.8 | | | | 440.7 | | |
Total shareholders’ equity | | | | 8,240.7 | | | | 7,635.3 | | |
Available capital(4) | | | | 4,305.4 | | | | 2,840.1 | | |
| 1 | 2026 GEOs are presented based on fixed GEO conversion ratios using the commodity prices assumed in our guidance presented in our 2025 year-end MD&A filed on March 10, 2026. Comparative periods are presented based on our previous methodology which was based on variable GEO conversion ratios using prevailing market prices. Net GEOs sold are GEOs sold, net of direct operating costs. Refer to the “Gold Equivalent Ounces and Net Gold Equivalent Ounces” section of this MD&A for more information on our methodology for calculating GEOs sold and Net GEOs sold. |
| 2 | Cash Costs, Cash Costs per GEO sold, Adjusted EBITDA, Adjusted EBITDA per share, Adjusted EBITDA Margin, Adjusted Net Income, Adjusted Net Income per share and Adjusted Net Income Margin are non-GAAP financial measures with no standardized meaning under IFRS Accounting Standards and might not be comparable to similar financial measures disclosed by other issuers. Refer to the “Non-GAAP Financial Measures” section of this MD&A for more information on each non-GAAP financial measure. |
| 3 | Our definition of Adjusted Net Income, Adjusted Net Income per share and Adjusted Net Income Margin were amended as of Q1 2026 to no longer adjust for gains on contractual buy-backs of royalty and stream interests. Prior period comparatives have been restated accordingly, as applicable. Refer to the “Non-GAAP Financial Measures” section of this MD&A for more information. |
| 4 | Available capital comprises our cash and cash equivalents of $1,014.2 million, our equity investments (excluding our long-term investment in Labrador Iron Ore Royalty Corporation (“LIORC”)) of $1,041.2 million, and the amount available to borrow under our two unsecured revolving credit facilities of $1.5 billion and the accordion features of $750.0 million, as referenced in the “Credit Facilities” section of this MD&A. |
Second Quarter 2026 Management’s Discussion and Analysis | 5 |
Financial Update –Q2 2026 compared to Q2 2025
| ● | Revenue increased 57% to $580.9 million primarily due to higher realized commodity prices as well as higher sales volumes. |
| ● | GEOs sold increased 18% to 132,405 GEOs primarily due to higher stream deliveries from Antapaccay and Antamina and higher contributions from our Côté Gold, South Arturo, Porcupine, and Musselwhite royalties. |
| ● | Net GEOs Sold, which represent GEOs sold net of direct operating costs, increased 20% to 122,205 GEOs. |
| ● | Net cash provided by operating activities increased 12% to $482.5 million. We benefited from an increase in revenue partly offset by a proportionate increase in costs of sales, contributing to a growth in gross profit and an increase in taxes paid when compared to Q2 2025. This benefit was partly offset by lower proceeds from the sale of gold and silver bullion when compared to Q2 2025. |
| ● | Adjusted EBITDA increased 45% to $529.7 million, or $2.75 per share, reflecting an increase in gross profit. |
| ● | Adjusted EBITDA Margin decreased to 91.2% compared to 99.0% in Q2 2025. |
| ● | Net income increased 43% to $354.0 million, or $1.84 per share, primarily due to an increase in gross profit, partly offset by an increase in income tax expense. In the prior year period, we recognized a $42.2 million gain on the sale of gold and silver bullion. |
| ● | Adjusted Net Income increased 46% to $349.2 million, or $1.81 per share. |
| ● | Adjusted Net Income Margin decreased to 60.1% compared to 64.6% in Q2 2025. |
| ● | Available capital amounted to $4.3 billion as at June 30, 2026, compared to $2.8 billion as at December 31, 2025. |
Financial Update –H1 2026 compared to H1 2025
| ● | $1,231.6 million in revenue (a new half-year record), +67% compared to $737.8 million primarily due to higher realized commodity prices and sales volumes. |
| ● | 268,758 GEOs sold, +13% compared to 238,678 GEOs sold primarily due to higher stream deliveries from Antamina and Antapaccay, contributions from our recently acquired royalties on Côté Gold and Porcupine, and higher contributions from our Musselwhite and South Arturo royalties. |
| ● | 248,225 Net GEOs Sold, +15% from 215,014 Net GEOs in H1 2025. |
| ● | $1,002.9 million in net cash provided by operating activities (a new half-year record), +39% compared to $719.2 million, primarily due to an increase in gross profit and the collection of $49.5 million of deposits and interests as a result of our settlement with the Canada Revenue Agency (“CRA”). These benefits were partly offset by an increase in taxes paid and lower proceeds from the sale of gold and silver bullion when compared to H1 2025. |
| ● | $1,121.6 million, or $5.82 per share, in Adjusted EBITDA (new half-year records), +63% compared to $687.6 million, or $3.57 per share, respectively; |
| ● | Adjusted EBITDA Margin decreased to 91.1% compared to 93.2% in H1 2025. |
| ● | $822.6 million, or $4.27 per share, in net income (new half-year records), +80% compared to $456.9 million and $2.37 per share, respectively. The increase was primarily due to an increase in gross profit, a gain of $63.8 million on the partial buy-backs of the Cascabel stream and royalty, partly offset by an increase in income tax expense. |
| ● | $807.5 million, or $4.19 per share, in Adjusted Net Income (new half-year records), +82% and +81%, respectively, compared to $444.0 million and $2.31 per share, respectively; |
| ● | Adjusted Net Income Margin (a new half-year record) increased to 65.6% during H1 2026 compared to 60.2% in H1 2025. |
Second Quarter 2026 Management’s Discussion and Analysis | 6 |
Corporate Developments
Acquisition of Royalty on Comet Vale Gold Mine – Australia
On July 15, 2026, we acquired, through a wholly owned Australian subsidiary, a 2.0% gross royalty on all gold production from the majority of the mining leases of Gorilla Gold Mines Ltd’s Comet Vale gold project, including the Sovereign and Cheer deposits, in the north Kalgoorlie region of Western Australia for $8.4 million (A$12.0 million), plus a contingent payment of $2.1 million (A$3.0 million).
Acquisition of Royalty on the Greenstone Gold Mine – Ontario, Canada
On June 22, 2026, we acquired from Old Steelco Inc. a 5.0% NPI and 2.0% NSR that cover part of Equinox Gold Corp.’s broader Greenstone Gold Mine property for total cash consideration of $2.0 million. The 5.0% NPI area overlaps with a portion of the Company’s existing 3.0% NSR on Greenstone.
Margin Term Loan Facility with Life of Mine Investments Inc.
On June 8, 2026, we extended a margin term loan facility to Life of Mine Investments Inc. (“LOMI”), a private company owned by the Gignac family and affiliated with G Mining Capital, in the amount of C$25.0 million (the “LOMI Facility”). On June 17, 2026, the LOMI Facility was fully drawn and we advanced $17.8 million (C$25.0 million) to LOMI. The LOMI Facility has a 3-year term and bears interest based on the CIBC prime rate plus 0.40% per annum. The LOMI Facility is fully secured by a pledge of securities held by LOMI. Interest earned on the LOMI Facility is included within interest revenue on the statement of income and comprehensive income.
Acquisition of Royalty on Youanmi Gold Mine – Australia
On May 29, 2026, we acquired, through a wholly owned Australian subsidiary, a 1.0% NSR on all gold production from the mining leases of Rox Resources Limited’s Youanmi gold project in the Murchinson region of Western Australia for $32.9 million (A$47.0 million).
Acquisition of Royalty Portfolio from Victoria Gold Corp.– Canada and U.S.
On April 16, 2026, we closed the previously announced acquisition of a portfolio of six royalties held by Victoria Gold Corp. for $40.0 million (C$55.0 million). The portfolio includes a 6.0% NSR (subject to a 5.0% buy-back at the operator’s election for $7.3 million (C$10.0 million)) on Banyan Gold Corp.’s AurMac property and a 1.0% NSR on Banyan Gold’s Hyland property both in the Yukon. The portfolio also includes milestone payments on i-80 Gold Corp.’s (“i-80 Gold”) Cove project in Nevada and three additional royalties on early-stage exploration properties in Nevada and the Yukon.
Partial Buy-Backs of Cascabel Stream and NSR – Ecuador
In March 2026, following the acquisition of SolGold plc (“SolGold”) by Jiangxi Copper (Hong Kong) Investment Company Limited, for and on behalf of Jiangxi Copper Company Limited (“JCC”), SolGold and JCC exercised their option to buy back 50% of the Cascabel stream and NSR. As a result, Franco-Nevada received the equivalent of $40.7 million (net of the ongoing payment of 20% of spot price per ounce delivered) as a one-time delivery of gold ounces for the buy-back of 50% of the Cascabel stream, and $97.5 million in cash for the buy-back of 50% of the Cascabel NSR. As a result of these buy-backs, the net book values of these assets were reduced by 50% and resulted in a gain of $63.8 million recognized in net income and Adjusted Net Income for Q1 2026 but excluded from Adjusted EBITDA.
Following the buy-backs, key terms of the remaining Cascabel Stream and Cascabel NSR include:
Cascabel Stream
| ● | 7.0% of gold produced in concentrate until 262,500 ounces of gold have been delivered; |
| ● | Thereafter, 4.2% of gold produced in concentrate for the remaining life of mine; |
| ● | Gold ounces delivered will be subject to an ongoing payment of 20% of spot price for each ounce of gold delivered. |
Cascabel NSR
| ● | 0.5% NSR on all minerals produced, subject to adjustments based on the production rate, with the option, exercisable for a period of time, to convert to a gold only NSR; |
| ● | Annual minimum royalty payments of $5.0 million starting from 2028, subject to certain conditions. |
Second Quarter 2026 Management’s Discussion and Analysis | 7 |
Acquisition of Stream on the Casa Berardi Gold Mine with Orezone Gold Corporation – Quebec, Canada
On March 24, 2026, we, through a wholly-owned Canadian subsidiary, closed the previously announced acquisition of a $100.0 million gold stream (the “Casa Berardi Stream”) from a subsidiary of Orezone Gold Corporation (“Orezone”). The stream transaction supported Orezone’s acquisition of Hecla Mining Company’s producing Casa Berardi gold mine and other Quebec assets, including the Heva-Hosco gold project (“Heva-Hosco”).
Key terms of the Casa Berardi Stream include:
| ● | Fixed Deliveries: 1,625 ounces of gold per quarter (6,500 ounces of gold per year) for the first five years, followed by, |
| ● | Variable Deliveries: 5.0% of gold produced from the Casa Berardi mine and other Quebec assets (excluding Heva-Hosco) and 2.5% of gold produced from Heva-Hosco. |
| ● | Gold ounces delivered will be subject to an ongoing payment of 20% of spot price for each ounce of gold delivered. |
Deliveries are due 15 days following the end of each quarter. The effective date of the Casa Berardi Stream was January 1, 2026.
Acquisition of Royalty with i-80 Gold Corp. – Nevada, U.S.
On March 16, 2026, we, through a wholly-owned U.S. subsidiary, closed the previously announced acquisition of a $250.0 million NSR (the “i-80 Gold Royalty”) from i-80 Gold Corp. The royalty consists of a 1.5% NSR on all minerals produced, increasing to 3.0% in perpetuity beginning on January 1, 2031, and applies to Granite Creek, the Ruby Hill Property (including Archimedes and Mineral Point), Cove and Lone Tree. Franco-Nevada funded the upfront payment of $225.0 million upon closing, with a further $25.0 million payable contingent on the incurrence, before the end of 2026, of an initial $25.0 million of budgeted expenditures to advance Mineral Point by i-80 Gold.
Financing Package with Minerals 260 Limited on the Bullabulling Gold Project – Australia
On February 26, 2026, we acquired, through a wholly-owned Australian subsidiary, a $119.9 million (A$170 million) gross royalty (the “Bullabulling Royalty”) from Minerals 260 Limited (“Minerals 260”) to support its development of the Bullabulling gold project located approximately 65 km from Kalgoorlie, in the Eastern Goldfields, Western Australia. Additionally, Franco-Nevada subscribed to $35.3 million (A$50 million) of Minerals 260’s ordinary shares.
The royalty consists of an incremental 1.45% gross royalty over certain Bullabulling tenements on which Franco-Nevada already held a 1.00% royalty and a new 2.45% gross royalty over Bullabulling tenements where Franco-Nevada did not already hold an existing royalty. Upon production of an aggregate of 4.0 Moz Au from royalty lands, the aggregate royalty burden on the royalty lands will step down from 2.45% to 1.63%. The royalties cover a Bullabulling land package inclusive of all mineral resources, plus an area of interest that includes the Phoenix, Bacchus, Dicksons, Kraken and Gibraltar deposits.
The purchase price was funded in two tranches, with $53.3 million (A$75 million) funded on February 26, 2026, and the remaining $66.6 million (A$95 million) funded on March 26, 2026, upon receipt of the approval from the Foreign Investment Review Board.
Minerals 260 Shares
On February 26, 2026, Franco-Nevada purchased 111.1 million shares of Minerals 260 at an issue price of A$0.45 per share for an aggregate purchase price of $35.3 million (A$50 million). Upon closing of the transaction, Franco-Nevada owned approximately 4.9% of Minerals 260’s issued and outstanding shares.
Acquisition of Mineral Rights with Continental Resources, Inc. – U.S.
Through a wholly-owned subsidiary, we have a strategic relationship with Continental Resources, Inc. (“Continental”) to acquire, through a jointly-owned entity (the “Royalty Acquisition Venture”), royalty rights within Continental’s areas of operation. Franco-Nevada recorded contributions to the Royalty Acquisition Venture of $1.5 million and $6.4 million in Q2 2026 and H1 2026, respectively (Q2 2025 and H1 2025 – $2.8 million and $4.4 million, respectively). As at June 30, 2026, Franco-Nevada has remaining commitments of up to $30.1 million.
Canada Revenue Agency Audit
On September 11, 2025, we reached the CRA Settlement which provided for a final resolution of Franco-Nevada’s tax dispute in connection with reassessments under transfer pricing rules for the 2013 to 2019 taxation years (the “Reassessments”) in relation to its Mexican and Barbadian subsidiaries. For further details, please refer to the “Contingencies – Canada Revenue Agency Audit” section of this MD&A.
During Q1 2026, the amounts that were posted as security for the Reassessments in the form of standby letters of credit totaling $47.3 million (C$66.0 million) were released, and cash totaling $44.1 million (C$61.4 million) plus interest of approximately $5.4 million (C$7.5 million) was received.
On March 26, 2026, the Canadian Federal Government enacted changes to the transfer pricing legislation which are effective beginning from 2026 onward. The Company is in the process of evaluating the potential impact of these legislative changes.
Second Quarter 2026 Management’s Discussion and Analysis | 8 |
Credit Facilities
On March 10, 2026, we extended the maturity date of our $1.0 billion unsecured revolving term credit facility (“Corporate Revolver”) from June 3, 2029 to March 10, 2031, increased the amount available under the accordion from $250.0 million to $500.0 million, and reduced the applicable margin for U.S. advances based on the Secured Overnight Financing Rate (“SOFR”) from between 1.10% and 2.15% to between 1.00% and 2.05%, depending on the Company’s leverage ratio.
On May 8, 2026, the Company’s wholly owned subsidiary, Franco-Nevada International Corporation (“FNIC”) entered into an unsecured revolving credit facility agreement, (the “FNIC Revolver”), which provides for the availability over a three-year period of up to $500.0 million in borrowings with an accordion of $250.0 million. The credit facility has a 3-year tenor maturing on May 8, 2029. Advances are based on SOFR with an applicable margin of between 1.20% and 2.25%, depending on FNIC’s leverage ratio.
Dividends
In Q2 2026, we declared a quarterly dividend of $0.44 per share (Q2 2025 - $0.38). During the quarter, we paid total dividends of $84.0 million, of which $80.6 million was paid in cash and $3.4 million was settled in common shares under our Dividend Reinvestment Plan (the “DRIP”).
In H1 2026, the Company declared dividends of $0.88 per share (H1 2025 - $0.76). During this time, we paid total dividends of $168.4 million, of which $161.1 million was paid in cash and $7.3 million was settled in common shares under our DRIP.
Portfolio Updates
Additional updates related to our portfolio of assets are available in our News Release issued on August 11, 2026, available on SEDAR+ at www.sedarplus.com and EDGAR at www.sec.gov.
Cobre Panamá remains on preservation and safe management (“P&SM”) with production halted since November 2023. First Quantum Minerals Ltd. (“First Quantum”) has been working with the Government of Panama (the “GOP”) and the Ministry of Commerce and Industry (the “MICI”) to implement a plan that would allow for the execution of environmental and asset integrity measures during the P&SM phase of Cobre Panamá (the “P&SM Plan”). On May 30, 2025, the GOP approved and formally instructed the execution of the P&SM plan. The implementation of the P&SM Plan is now underway.
In the State of the Nation address on January 2, 2026, President José Raúl Mulino announced that the GOP would authorize the removal, processing and export of stockpiled ore at Cobre Panamá that was previously extracted before operations were suspended. On April 7, 2026, the GOP, through Resolution No. 27 issued by the MICI, authorized the removal, processing, and export of stockpiled ore (the “Processing Program”) currently stored on site at the Cobre Panamá mine as part of the P&SM Plan. Resolution No. 27 further confirms that the stockpiled material was mined during the validity of the concession.
In August 2025, Panama’s Ministry of Environment (“MiAmbiente”) launched a process to contract an independent expert to conduct an integral audit of the Cobre Panamá mine. Subsequently, on October 10, 2025, MiAmbiente contracted SGS, an internationally recognized testing, inspection and certification company, to proceed with the integral audit. The integral audit was completed in the second quarter of 2026 and on June 19, 2026, MiAmbiente published SGS’ final integral audit report, confirming that 361 of 370 environmental commitments were fulfilled, representing an overall compliance rate of 87.7%.
During the quarter, the GOP established a high-level ministerial commission comprising the Ministers of Commerce and Industries, Economy and Finance, and Environment to evaluate matters relating to the future of the Cobre Panamá mine, including consideration of the integral audit findings and associated economic, environmental, and legal implications.
The execution of the P&SM plan included the restart of Cobre Panamá’s power plant, which has remained fully operational. At the end of the second quarter, both generating units have demonstrated reliable operations, meeting the power demands of the site with excess energy sold to the national grid.
A key development during the quarter was the continued progress of the “Suma tu Talento” recruitment initiative to support hiring of staff for the preservation activities. At the end of the second quarter, direct employment at Cobre Panamá reached approximately 3,000 employees.
In addition, during the second quarter of 2026, after two years of halted operations, Cobre Panamá transitioned to the execution of the approved Processing Program under the P&SM stage. Commissioning of the first processing train was completed during May 2026, followed by the commencement of stockpile processing and the production of the first copper concentrate. Approximately 2.1 million tonnes of ore were processed with an average head grade of 0.23% and recoveries of 67%, resulting in the production of 3,216 tonnes of copper. Production reflected the successful commissioning and restart of one of the three milling circuits while First Quantum continued to execute the P&SM plan in accordance with regulatory requirements.
First Quantum estimates that Cobre Panamá will produce between 30,000 and 40,000 tonnes of copper in 2026, with the remaining balance to be processed in 2027 for a total of approximately 70,000 tonnes. Based on these estimates, Cobre Panamá stream deliveries to Franco-Nevada are expected to total approximately 23,100 gold ounces and 265,000 silver ounces. Deliveries of stream ounces to Franco-Nevada, which are determined based on the sale of copper concentrate by First Quantum under its offtake agreements, are expected to commence in Q3 2026, with one-third of deliveries anticipated in H2 2026.
Second Quarter 2026 Management’s Discussion and Analysis | 9 |
The following contains forward-looking statements. For a description of material factors that could cause our actual results to differ materially from the forward-looking statements below, please see the “Cautionary Statement on Forward-Looking Information” section at the end of this MD&A and the “Risk Factors” section of our most recent Annual Information Form filed with the Canadian securities regulatory authorities on www.sedarplus.com and our most recent Form 40-F filed with the SEC on www.sec.gov. The 2026 guidance is based on assumptions including the forecasted state of operations from our assets based on public statements and other disclosures by the third-party owners and operators of the underlying properties and our assessment thereof.
We present our guidance in reference to commodity sales. For streams, our guidance reflects metals to be delivered from the operators of our assets and subsequently sold. Our deliveries may differ from operators’ production based on timing of deliveries and due to recovery and payability factors. Sales may differ from deliveries based on the timing of the sales. For royalties, our guidance reflects the timing of royalty payments or accruals.
Production for the portfolio is expected to be weighted to the second half of the year, as previously guided, largely due to production profiles at Candelaria, Tocantinzinho, Côté Gold, Greenstone and Valentine. We also expect to benefit from the commencement of processing of stockpiled ore at Cobre Panamá, as outlined in the section above. With the inclusion of the anticipated Cobre Panamá deliveries, we are tracking towards the upper half of our 2026 Total GEOs guidance range. Furthermore, we are benefiting from elevated oil and natural gas liquids prices, with H1 2026 oil revenue of $78.8 million increasing 20% relative to H1 2025. Should oil prices remain elevated, we would expect a continued positive impact on our Energy revenue. An increase of $10 relative to our assumed WTI price of $70 per barrel is estimated to increase oil revenue by approximately 12%.
The following table presents our H1 2026 actual performance compared to our 2026 guidance.
| | | 2026 Guidance (1) (2) | | | H1 2026 Actual | |
Commodity | | | | | | | |
Gold ounces sold (oz) | | | 360,000 to 400,000 | | | 182,382 | |
Silver ounces sold (oz) | | | 4,700,000 to 5,500,000 | | | 2,598,799 | |
PGMs ounces sold (oz) | | | 32,000 to 37,000 | | | 15,699 | |
Diversified revenue (millions) | | | $245 to $285 | | | $164.8 | |
| | | | | | | |
GEOs Sold (oz) | | | 510,000 to 570,000 | | | 268,758 | |
| 1 | Our 2026 guidance, as disclosed in our 2025 MD&A filed on March 10, 2026, assumed the following commodity prices: $4,500/oz Au, $75.00/oz Ag, $2,000/oz Pt, $1,650/oz Pd, $100/tonne Fe 62% CFR China, $70/bbl WTI oil and $3.00/mcf Henry Hub natural gas. GEOs for the 2026 period are calculated based on fixed conversion ratios based on the prices assumed in this 2026 guidance. |
| 2 | Our guidance does not reflect any incremental revenue from additional contributions we may make to the Royalty Acquisition Venture with Continental. Our guidance does not reflect any buy-backs which may be elected at the discretion of our operators with the exception of the partial buy-back of the Cascabel royalty and stream, which occurred in March 2026. |
Depletion expense: We expect to be in line with our previously stated depletion and depreciation expense estimate which ranged between $310.0 million and $340.0 million for 2026. Depletion rates may be updated throughout the year as updated mineral reserve estimates become available. Depletion expense during H1 2026 was $161.9 million.
Income tax: We expect our annual effective tax rate to be between 20% and 23%.
Capital commitments: We anticipate making the third pre-construction payment for the Cascabel stream of $11.7 million in 2026. As of June 30, 2026, our remaining capital commitment to the Royalty Acquisition Venture with Continental was $30.1 million. We also expect to fund part of the contingent consideration we are committed to for our Copper World royalty and the $25.0 million contingent payment to i-80 Gold. Refer to the “Capital Commitments” section of this MD&A and in the 2025 Annual Report for further details on our commitments.
The prices of gold and other precious metals are the largest factors in determining profitability and cash flow from operations for Franco-Nevada. The price of gold can be volatile and is affected by macroeconomic and industry factors that are beyond our control. Major influences on the gold price include interest rates, fiscal and monetary stimulus, inflation expectations, currency exchange rate fluctuations including the relative strength of the U.S. dollar and supply and demand for gold.
Early in the year, gold prices reached record highs and benefited from strong safe haven demand, central bank buying, and U.S. interest rate cuts. Gold was volatile in H1 2026, hitting record highs on heavy central-bank buying followed by a reversal as the Federal Reserve signaled rate cuts amid rising inflation due to ongoing conflicts in the Middle East.
Silver prices largely followed gold during this same time, while also benefiting from robust industrial demand. Oil prices were driven primarily by geopolitical disruptions due to the Iran war and inflation expectations. During H1 2026, natural gas prices fell due to robust supply and storage levels, without a significant change to demand.
Refer to the commodity price tables on pages 13 and 17 of this MD&A for average commodity prices during the period.
Second Quarter 2026 Management’s Discussion and Analysis | 10 |
The following table details metal sales for the three and six months ended June 30, 2026, and 2025:
(expressed in ounces) | | For the three months ended | | | For the six months ended |
| |||||||||||||
| | June 30, | | | June 30, |
| |||||||||||||
Property | | Interest and % | | | 2026 | | | 2025 | | | 2026 | | | 2025 |
| ||||
Gold | | | | | | | | | | | | | | | | | | | |
South America | | | | | | | | | | | | | | | | | | | |
Candelaria |
| Stream 68% Gold | | | | 10,492 | | | | 13,750 | | | | 22,461 | | | | 30,276 | |
Antapaccay |
| Stream (indexed) Gold | | | | 8,620 | | | | 4,850 | | | | 15,920 | | | | 13,390 | |
Tocantinzinho | | Stream 12.5% | | | | 4,766 | | | | 4,500 | | | | 10,001 | | | | 9,662 | |
Condestable | | Stream 63% Gold | | | | 2,403 | | | | 2,190 | | | | 2,403 | | | | 4,380 | |
Yanacocha | | NSR 1.8% | | | | 2,337 | | | | 2,412 | | | | 4,875 | | | | 4,238 | |
Salares Norte | | NSR 1-2% | | | | 1,571 | | | | 253 | | | | 3,048 | | | | 1,369 | |
Other | | | | | | 356 | | | | 722 | | | | 972 | | | | 1,113 | |
Central America & Mexico | | | | | | | | | | | | | | | | | | | |
Guadalupe-Palmarejo |
| Stream 50% | | | | 10,084 | | | | 12,986 | | | | 21,776 | | | | 25,434 | |
Cobre Panamá |
| Stream (indexed) Gold | | | | — | | | | — | | | | 783 | | | | — | |
Canada | | | | | | | | | | | | | | | | | | | |
Detour Lake |
| NSR 2% | | | | 4,043 | | | | 3,151 | | | | 7,775 | | | | 6,566 | |
Hemlo |
| NSR 3%, NPI 50% | | | | 1,830 | | | | 3,561 | | | | 7,671 | | | | 9,908 | |
Côté Gold | | GMR 7.5% | | | | 4,867 | | | | 418 | | | | 8,797 | | | | 418 | |
Porcupine | | NSR 4.25% | | | | 2,820 | | | | 1,984 | | | | 5,329 | | | | 1,984 | |
Greenstone | | NSR 3% | | | | 1,779 | | | | 1,494 | | | | 3,813 | | | | 2,492 | |
Musselwhite | | NPI 5% | | | | 5,198 | | | | 2,820 | | | | 6,375 | | | | 3,128 | |
Casa Berardi | | Stream 5% Fixed through 2030 | | | | 1,625 | | | | — | | | | 1,625 | | | | — | |
Valentine |
| NSR 3% | | | | 1,026 | | | | — | | | | 1,801 | | | | — | |
Kirkland Lake (Macassa) |
| NSR 1.5-5.5%, NPI 20% | | | | 943 | | | | 1,159 | | | | 1,807 | | | | 2,374 | |
Sudbury |
| Stream 50% Gold | | | | 600 | | | | 237 | | | | 1,025 | | | | 582 | |
Brucejack |
| NSR 1.2% | | | | 666 | | | | 572 | | | | 1,353 | | | | 1,125 | |
Magino | | NSR 3% | | | | 965 | | | | 432 | | | | 1,557 | | | | 1,116 | |
Other | | | | | | 604 | | | | 706 | | | | 1,322 | | | | 1,525 | |
United States | | | | | | | | | | | | | | | | | | | |
South Arturo | | GR 4-9% | | | | 3,123 | | | | 1,207 | | | | 7,430 | | | | 2,227 | |
Goldstrike |
| NSR 2-4%, NPI 2.4-6% | | | | 3,208 | | | | 1,800 | | | | 5,438 | | | | 2,609 | |
Bald Mountain |
| NSR/GR 0.875-5% | | | | 1,287 | | | | 1,169 | | | | 2,568 | | | | 3,031 | |
Marigold |
| NSR 1.75-5%, GR 0.5-4% | | | | 964 | | | | 765 | | | | 1,707 | | | | 1,352 | |
Gold Quarry |
| NSR 7.29% | | | | 54 | | | | 41 | | | | 157 | | | | 103 | |
Other | | | | | | 472 | | | | 675 | | | | 834 | | | | 1,018 | |
Rest of World | | | | | | | | | | | | | | | | | | | |
Western Limb |
| Stream Gold (indexed) | | | | 3,601 | | | | 2,752 | | | | 8,014 | | | | 8,314 | |
Subika (Ahafo) |
| NSR 2% | | | | 1,734 | | | | 4,298 | | | | 4,095 | | | | 8,606 | |
Tasiast |
| NSR 2% | | | | 2,893 | | | | 2,089 | | | | 5,700 | | | | 4,728 | |
Sabodala |
| Stream 6%, Fixed to 105,750 oz | | | | 2,350 | | | | 2,350 | | | | 4,700 | | | | 4,700 | |
Duketon |
| NSR 2% | | | | 1,008 | | | | 447 | | | | 1,814 | | | | 1,320 | |
Other | | | | | | 2,935 | | | | 2,948 | | | | 7,436 | | | | 5,173 | |
Total Gold Ounces Sold | | | | 91,224 | | | | 78,738 | | | | 182,382 | | | | 164,261 | | ||
Silver | | | | | | | | | | | | | | | | | | | |
Antamina |
| Stream 22.5% Silver | | | | 825,000 | | | | 700,000 | | | | 1,865,000 | | | | 1,350,000 | |
Candelaria |
| Stream 68% Silver | | | | 164,457 | | | | 278,456 | | | | 407,143 | | | | 558,553 | |
Antapaccay |
| Stream (indexed) Silver | | | | 135,000 | | | | 76,000 | | | | 250,000 | | | | 210,000 | |
Condestable | | Stream 63% Silver | | | | 47,793 | | | | 72,750 | | | | 47,793 | | | | 145,500 | |
Cobre Panamá |
| Stream (indexed) Silver | | | | — | | | | — | | | | 8,976 | | | | — | |
Other | | | | | | 9,208 | | | | 12,835 | | | | 19,887 | | | | 21,652 | |
Total Silver Ounces Sold | | | | 1,181,458 | | | | 1,140,041 | | | | 2,598,799 | | | | 2,285,705 | | ||
PGMs | | | | | | | | | | | | | | | | | | | |
Sudbury |
| Stream 50% PGM | | | | 3,018 | | | | 1,965 | | | | 5,430 | | | | 3,796 | |
Stillwater |
| NSR 5% PGM | | | | 2,782 | | | | 2,900 | | | | 5,681 | | | | 5,255 | |
Western Limb |
| Stream 1% Platinum | | | | 1,959 | | | | 1,499 | | | | 4,350 | | | | 4,512 | |
Pandora | | NSR 1% PGM | | | | 106 | | | | 745 | | | | 238 | | | | 745 | |
Total PGMs Ounces Sold | | | | 7,865 | | | | 7,109 | | | | 15,699 | | | | 14,308 | | ||
Precious Metal GEOs Sold | | | | 114,111 | | | | 92,449 | | | | 232,091 | | | | 193,072 | | ||
Diversified GEOs Sold | | | | 18,294 | | | | 19,644 | | | | 36,667 | | | | 45,606 | | ||
Total GEOs Sold | | | | | | 132,405 | | | | 112,093 | | | | 268,758 | | | | 238,678 | |
Second Quarter 2026 Management’s Discussion and Analysis | 11 |
Revenue by Asset
The following table details revenue for the three and six months ended June 30, 2026 and 2025:
| | | | | For the three months ended | | For the six months ended |
| ||||||||||
(expressed in millions) | | Interest and % | | | June 30, | | June 30, |
| ||||||||||
Property | | (Gold unless otherwise indicated) | | | 2026 | | | 2025 | | 2026 | | | 2025 |
| ||||
PRECIOUS METALS | | | | | | | | | | | | | | | | | | |
South America | | | | | | | | | | | | | | | | | | |
Candelaria |
| Stream 68% Gold & Silver | | | $ | 59.2 | | | $ | 55.0 | | $ | 136.5 | | | $ | 110.9 | |
Antapaccay |
| Stream (indexed) Gold & Silver | | | | 47.7 | | | | 18.8 | | | 95.5 | | | | 47.4 | |
Antamina |
| Stream 22.5% Silver | | |
| 57.4 | | |
| 23.3 | |
| 139.7 | | |
| 44.6 | |
Tocantinzinho | | Stream 12.5% | | | | 20.7 | | | | 14.8 | | | 45.9 | | | | 29.7 | |
Condestable | | Stream 63% Gold & Silver | | | | 15.3 | | | | 10.1 | | | 15.3 | | | | 19.2 | |
Yanacocha | | NSR 1.8% | | | | 10.6 | | | | 7.9 | | | 22.9 | | | | 13.2 | |
Salares Norte | | NSR 1-2% | | | | 7.5 | | | | 1.2 | | | 15.2 | | | | 4.3 | |
Other | | | | | | 1.7 | | | | 2.4 | | | 5.2 | | | | 3.7 | |
Central America & Mexico | | | | | | | | | | | | | | | | | | |
Guadalupe-Palmarejo |
| Stream 50% | | | $ | 43.4 | | | $ | 43.1 | | $ | 98.8 | | | $ | 79.4 | |
Cobre Panamá |
| Stream (indexed) Gold & Silver | | | | — | | | | — | | | 4.7 | | | | — | |
Canada | | | | | | | | | | | | | | | | | | |
Detour Lake |
| NSR 2% | | | $ | 18.2 | | | $ | 10.4 | | $ | 36.5 | | | $ | 20.1 | |
Hemlo |
| NSR 3%, NPI 50% | | |
| 8.1 | | |
| 11.4 | |
| 34.8 | | |
| 29.1 | |
Côté Gold | | GMR 7.5% | | | | 22.0 | | | | 1.4 | | | 41.2 | | | | 1.4 | |
Porcupine | | NSR 4.25% | | | | 12.8 | | | | 6.6 | | | 25.1 | | | | 6.6 | |
Greenstone | | NSR 3% | | | | 8.0 | | | | 4.9 | | | 17.9 | | | | 7.8 | |
Kirkland Lake (Macassa) |
| NSR 1.5-5.5%, NPI 20% | | |
| 4.2 | | |
| 3.8 | |
| 8.6 | | |
| 7.3 | |
Musselwhite | | NPI 5% | | | | 19.3 | | | | 7.7 | | | 25.0 | | | | 8.6 | |
Casa Berardi | | Stream 5% Fixed through 2030 | | | | 6.8 | | | | — | | | 6.8 | | | | — | |
Sudbury |
| Stream 50% PGM & Gold | | | | 6.4 | | | | 2.7 | | | 14.9 | | | | 5.9 | |
Valentine Gold | | NSR 3% | | | | 4.6 | | | | — | | | 8.4 | | | | — | |
Brucejack |
| NSR 1.2% | | | | 3.0 | | | | 1.9 | | | 6.4 | | | | 3.5 | |
Magino | | NSR 3% | | | | 4.3 | | | | 1.5 | | | 7.1 | | | | 3.4 | |
Other | | | | |
| 2.7 | | |
| 2.3 | |
| 6.1 | | |
| 4.5 | |
United States | | | | | | | | | | | | | | | | | | |
South Arturo | | GR 4-9% | | | $ | 13.6 | | | $ | 4.0 | | $ | 35.4 | | | $ | 6.9 | |
Goldstrike |
| NSR 2-4%, NPI 2.4-6% | | | | 14.7 | | | | 5.9 | | | 25.6 | | | | 8.2 | |
Bald Mountain |
| NSR/GR 0.875-5% | | |
| 5.8 | | |
| 3.8 | |
| 12.0 | | |
| 9.1 | |
Stillwater |
| NSR 5% PGM | | |
| 4.6 | | | | 3.3 | | | 10.6 | | | | 5.9 | |
Marigold |
| NSR 1.75-5%, GR 0.5-4% | | |
| 4.2 | | |
| 2.5 | |
| 7.9 | | |
| 4.2 | |
Gold Quarry |
| NSR 7.29% | | |
| 0.3 | | |
| 0.1 | |
| 0.7 | | |
| 0.3 | |
Other | | | | |
| 2.2 | | |
| 2.2 | |
| 3.9 | | |
| 3.2 | |
Rest of World | | | | | | | | | | | | | | | | | | |
Western Limb |
| Stream Gold (indexed) & 1% Platinum | | | $ | 19.8 | | | $ | 10.6 | | $ | 46.5 | | | $ | 30.4 | |
Subika (Ahafo) |
| NSR 2% | | |
| 7.8 | | |
| 13.9 | | | 19.3 | | | | 26.0 | |
Tasiast |
| NSR 2% | | |
| 13.1 | | |
| 6.8 | | | 26.8 | | | | 14.4 | |
Sabodala |
| Stream 6%, Fixed to 105,750 oz | | |
| 10.5 | | |
| 7.7 | |
| 21.7 | | |
| 14.6 | |
Duketon |
| NSR 2% | | |
| 4.7 | | |
| 1.6 | |
| 8.6 | | |
| 4.1 | |
Other | | | | |
| 13.5 | | |
| 10.4 | |
| 29.3 | | |
| 16.8 | |
| | | | | $ | 498.7 | | | $ | 304.0 | | $ | 1,066.8 | | | $ | 594.7 | |
DIVERSIFIED | | | | | | | | | | | | | | | | | | |
Vale | | Various Royalty Rates | | | $ | 7.8 | | | $ | 5.8 | | $ | 23.5 | | | $ | 16.0 | |
LIORC | | GORR 0.7% Iron Ore, IOC Equity 1.5%(1) | | | | 1.3 | | | | 1.4 | | | 2.7 | | | | 3.6 | |
Other mining assets | | | | |
| 2.7 | | |
| 3.0 | |
| 8.8 | | |
| 7.4 | |
United States (Energy) | | | | | | | | | | | | | | | | | | |
Marcellus | | GORR 1% | | | $ | 7.6 | | | $ | 7.3 | | $ | 18.6 | | | $ | 16.2 | |
Haynesville | | Various Royalty Rates | | | | 9.1 | | | | 8.0 | | | 18.4 | | | | 14.3 | |
SCOOP/STACK | | Various Royalty Rates | | | | 15.4 | | | | 9.9 | | | 26.6 | | | | 22.9 | |
Permian | | Various Royalty Rates | | | | 14.0 | | | | 13.2 | | | 25.4 | | | | 26.7 | |
Other | | | | |
| 0.1 | | |
| 0.1 | |
| 0.2 | | |
| 0.2 | |
Canada (Energy) | | | | | | | | | | | | | | | | | | |
Weyburn |
| NRI 11.71%, ORR 0.44%, WI 2.56% | | | $ | 17.4 | | | $ | 8.9 | | $ | 28.4 | | | $ | 19.5 | |
Orion | | GORR 4% | | | | 4.3 | | | | 3.2 | | | 7.5 | | | | 6.3 | |
Other | | | | |
| 2.5 | | |
| 1.9 | |
| 4.7 | | |
| 4.4 | |
| | | | | $ | 82.2 | | | $ | 62.7 | | $ | 164.8 | | | $ | 137.5 | |
Revenue from royalty, stream and working interests | | | $ | 580.9 | | | $ | 366.7 | | $ | 1,231.6 | | | $ | 732.2 | | ||
Interest revenue and other interest income | | | $ | — | | | $ | 2.7 | | $ | — | | | $ | 5.6 | | ||
Total revenue | | | | | $ | 580.9 | | | $ | 369.4 | | $ | 1,231.6 | | | $ | 737.8 | |
| 1 | Includes interest attributable to Franco-Nevada’s 9.9% equity ownership of Labrador Iron Ore Royalty Corporation. |
Second Quarter 2026 Management’s Discussion and Analysis | 12 |
Review of Quarterly Financial Performance
The prices of precious metals, iron ore, oil, and gas and production from our assets are the largest factors in determining our profitability and cash flow from operations. The following table summarizes average commodity prices and average exchange rates during the periods presented.
| | | | | | | | | | | |||
Quarterly average prices and rates | | | | | Q2 2026 | | | Q2 2025 | | Variance | |||
Gold(1) |
| ($/oz) | | | $ | 4,517 | | | $ | 3,279 | | 37.8 | % |
Silver(1) |
| ($/oz) | | |
| 73.44 | | |
| 33.64 | | 118.3 | % |
Platinum(1) |
| ($/oz) | | |
| 1,919 | | |
| 1,073 | | 78.8 | % |
Palladium(1) |
| ($/oz) | | |
| 1,413 | | |
| 990 | | 42.7 | % |
Iron Ore Fines 62% Fe CFR China | | ($/tonne) | | | | 106 | | | | 98 | | 8.2 | % |
| | | | | | | | | | | | | |
Edmonton Light |
| (C$/bbl) | | |
| 131.28 | | |
| 85.81 | | 53.0 | % |
West Texas Intermediate | | ($/bbl) | | | | 92.79 | | | | 63.74 | | 45.6 | % |
Henry Hub | | ($/mcf) | | | | 2.94 | | | | 3.51 | | (16.2) | % |
| | | | | | | | | | | | | |
CAD/USD exchange rate(2) | | | | |
| 0.7228 | | |
| 0.7226 | | 0.0 | % |
| 1 | Based on LBMA PM Fix for gold, platinum and palladium. Based on LBMA Fix for silver. |
| 2 | Based on Bank of Canada daily rates. |
Revenue and GEOs
Revenue and GEO sales by commodity, geographical location and type of interest for the three months ended June 30, 2026 and 2025 were as follows:
| | | Gold Equivalent Ounces | | | Revenue (in millions) |
| |||||||||||
For the three months ended June 30, | | | 2026 | 2025 | | Variance | | | 2026 | | | 2025 | | Variance | | |||
| | | | | | | | | | | | | | | | | | |
Commodity | | | | | | | | | | | | | | | | | | |
Gold |
| | 91,224 | 78,738 |
| 12,486 | | | $ | 403.0 | | | $ | 258.4 | | $ | 144.6 | |
Silver |
| | 19,695 | 11,520 |
| 8,175 | | |
| 83.5 | | |
| 38.1 | |
| 45.4 | |
PGM |
| | 3,192 | 2,191 |
| 1,001 | | |
| 12.2 | | |
| 7.5 | |
| 4.7 | |
Precious Metals | | | 114,111 | 92,449 | | 21,662 | | | $ | 498.7 | | | $ | 304.0 | | $ | 194.7 | |
Iron ore(1) |
| | 2,037 | 2,197 |
| (160) | | | $ | 9.1 | | | $ | 7.2 | | $ | 1.9 | |
Other mining assets | | | 573 | 900 | | (327) | | | | 2.7 | | | | 3.0 | | | (0.3) | |
Oil | | | 10,057 | 10,337 | | (280) | | | | 45.3 | | | | 30.6 | | | 14.7 | |
Gas | | | 4,398 | 4,243 | | 155 | | | | 19.8 | | | | 16.9 | | | 2.9 | |
NGL | | | 1,229 | 1,967 | | (738) | | | | 5.3 | | | | 5.0 | | | 0.3 | |
Diversified | | | 18,294 | 19,644 | | (1,350) | | | $ | 82.2 | | | $ | 62.7 | | $ | 19.5 | |
Revenue from royalty, stream and working interests | | | 132,405 | 112,093 | | 20,312 | | | $ | 580.9 | | | $ | 366.7 | | $ | 214.2 | |
Interest revenue and other interest income | | | — | — | | — | | | $ | — | | | $ | 2.7 | | $ | (2.7) | |
Total GEOs and Revenue |
| | 132,405 | 112,093 |
| 20,312 | | | $ | 580.9 | | | $ | 369.4 | | $ | 211.5 | |
| | | | | | | | | | | | | | | | | | |
Geography | | | | | | | | | | | | | | | | | | |
South America |
| | 52,342 | 42,429 |
| 9,913 | | | $ | 229.6 | | | $ | 140.7 | | $ | 88.9 | |
Central America & Mexico | | | 10,122 | 13,064 | | (2,942) | | | | 43.6 | | | | 43.4 | | | 0.2 | |
Canada(1) |
| | 33,903 | 21,659 |
| 12,244 | | | | 145.9 | | |
| 72.7 | | | 73.2 | |
United States |
| | 20,557 | 18,990 |
| 1,567 | | |
| 92.0 | | | | 60.8 | |
| 31.2 | |
Rest of World |
| | 15,481 | 15,951 |
| (470) | | |
| 69.8 | | |
| 51.8 | |
| 18.0 | |
Total GEOs and Revenue |
| | 132,405 | 112,093 |
| 20,312 | | | $ | 580.9 | | | $ | 369.4 | | $ | 211.5 | |
| | | | | | | | | | | | | | | | | | |
Type | | | | | | | | | | | | | | | | | | |
Revenue-based royalties |
| | 47,079 | 43,662 |
| 3,417 | | | $ | 211.5 | | | $ | 142.0 | | $ | 69.5 | |
Streams |
| | 66,166 | 56,004 |
| 10,162 | | |
| 287.1 | | |
| 186.2 | |
| 100.9 | |
Profit-based royalties |
| | 16,537 | 9,235 |
| 7,302 | | |
| 70.5 | | |
| 28.1 | |
| 42.4 | |
Interest revenue and other(1) |
| | 2,623 | 3,192 |
| (569) | | |
| 11.8 | | |
| 13.1 | |
| (1.3) | |
Total GEOs and Revenue |
| | 132,405 | 112,093 |
| 20,312 | | | $ | 580.9 | | | $ | 369.4 | | $ | 211.5 | |
| 1 | Includes interest attributable to Franco-Nevada’s 9.9% equity ownership of Labrador Iron Ore Royalty Corporation. |
Second Quarter 2026 Management’s Discussion and Analysis | 13 |
We recognized $580.9 million in revenue in Q2 2026, an increase of 57% from Q2 2025 due to higher precious metal and oil prices, and higher contributions from our Precious Metal assets, including from assets which were acquired or that commenced production approximately in the past year. While we benefited from the increase in commodity prices compared to Q2 2025, our average realized price was lower than the Q2 2026 LBMA average as our sales were weighted towards the latter half of the quarter as prices were declining.
In Q2 2026, we earned 86% of our revenue from Precious Metals, compared to 82% in Q2 2025. Geographically, 88% of our revenue was derived from the Americas in Q2 2026, compared to 86% in Q2 2025.
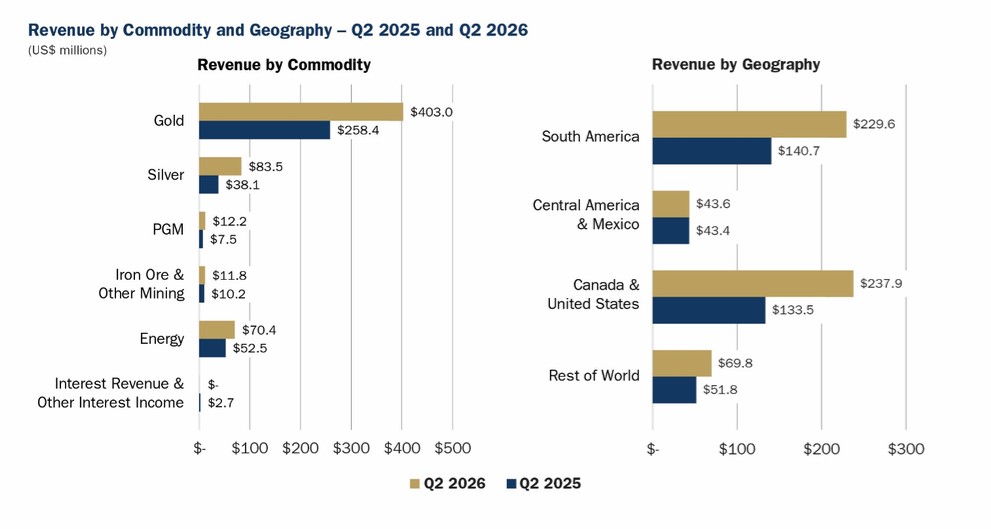
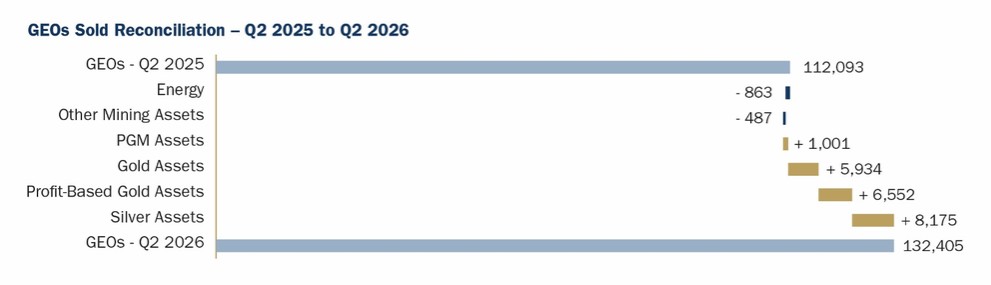
We sold 132,405 GEOs in Q2 2026, an increase of 18% compared to 112,093 GEOs in Q2 2025. The increase was driven by higher contributions from our Precious Metal assets. Contributions from our silver assets, when converted to GEOs, also reflect a more favorable silver to gold conversion ratio based on our assumed commodity prices for 2026. This increase was partly offset by lower GEOs from our Diversified assets, as higher Diversified revenue compared to Q2 2025 resulted in fewer GEOs based on our assumed commodity prices for 2026. A comparison of our sources of GEOs in Q2 2026 to Q2 2025 is shown below:
Second Quarter 2026 Management’s Discussion and Analysis | 14 |
Precious Metals
Our Precious Metal assets contributed 114,111 GEOs in Q2 2026, an increase of 23% compared to 92,449 GEOs in Q2 2025, primarily due to the following:
| ● | Antapaccay – We sold 10,870 GEOs in Q2 2026 compared to 5,630 GEOs in Q2 2025. The increase was due to processing of higher-grade ore in the current period. In addition, delivery shortfalls were experienced in Q2 2025. |
| ● | Côté Gold – We earned 4,871 GEOs from our Côté Gold royalty, compared to 418 GEOs in Q2 2025. We acquired the Côté gross margin royalty in late June 2025. Production (on a 100% basis) from Côté Gold in Q2 2026 was 96,200 gold ounces, in line with the prior year period, where production was 96,000 gold ounces. The replacement of the conveyor belt in May 2026 and the commissioning of a second cone crusher allowed the plant to operate at near full capacity in June 2026. IAMGOLD expects production to increase and unit costs to decline through H2 2026 after having discontinued the use of external contractor crushing during the quarter. |
| ● | Musselwhite – We recognized 5,198 GEOs from our Musselwhite NPI royalty, compared to 2,820 GEOs in Q2 2025. Production at the mine was higher in Q2 2026 compared to Q2 2025 due to improvements in stope sequencing and underground development rates. In addition, the current quarter includes 3,951 GEOs which related to the 2025 annual period. |
| ● | Antamina – We sold 825,000 silver ounces in Q2 2026 compared to 700,000 silver ounces in Q2 2025. The increase in deliveries is attributable to higher silver grades in the current period and timing of shipments. Q3 2026 deliveries to Franco-Nevada are expected to be lower based on lower concentrator throughput at the mine in Q2 2026. |
| ● | South Arturo – We earned 3,123 GEOs from South Arturo compared to 1,207 GEOs in Q2 2025 as Nevada Gold Mines continues to process ore from the South Arturo pit in 2026, in accordance with the Carlin mine plan. Production from Phase 1 is expected to continue through to the end of 2026. |
The above increases were partly offset by the following:
| ● | Guadalupe-Palmarejo – We sold 10,084 GEOs in Q2 2026 compared to 12,986 GEOs in Q2 2025. The decrease in GEOs was primarily due to the processing of a larger quantity of higher-grade ore in the previous year period. |
| ● | Subika (Ahafo) – We earned 1,734 GEOs in Q2 2026 compared to 4,298 GEOs in Q2 2025. Mining activities ended at the Subika open pit as planned in July 2025. Mining continues from the Subika Underground. |
Diversified
Our Diversified assets, primarily comprising our Iron Ore and Energy interests, generated $82.2 million in revenue compared to $62.7 million in Q2 2025, an increase of 31%.
Iron Ore and Other Mining
Our Iron Ore and Other Mining assets generated $11.8 million in Q2 2026 compared to $10.2 million in Q2 2025.
| ● | Vale Royalty – We recorded $7.8 million in revenue in Q2 2026 compared to $5.8 million in Q2 2025. The increase is largely driven by the inclusion of sales from the Southeastern System following the achievement of the cumulative sales threshold of 1.7 billion tonnes of iron ore in April 2025, partly offset by higher transportation costs. |
| ● | LIORC – LIORC contributed $1.3 million in revenue, consistent with Q2 2025. LIORC declared a cash dividend of C$0.30 per common share in both periods. Production at IOC in Q2 2026 was lower than Q2 2025 but improved relative to Q1 2026 as IOC is implementing a multi-year program to address operating challenges. |
Energy
Our Energy interests contributed $70.4 million in revenue in Q2 2026, an increase of 34% from $52.5 million in Q2 2025.
| ● | U.S. – Revenue from our U.S. Energy interests increased to $46.2 million in Q2 2026, compared to $38.5 million in Q2 2025. The increase was primarily due to a higher share of production earned from our Continental Resources interests and stronger realized oil prices, including the benefit of higher natural gas liquids pricing across our principal gas assets. Overall, we continue to see steady production across the basins. |
| ● | Canada – Revenue from our Canadian Energy interests was $24.2 million in Q2 2026, compared to $14.0 million in Q2 2025. In particular, we earned higher revenue from our Weyburn interests due to the leverage of the NRI royalty to the increase in oil prices in the quarter. |
Second Quarter 2026 Management’s Discussion and Analysis | 15 |
Costs of Sales
The following table provides a breakdown of costs of sales, excluding depletion and depreciation, incurred in the periods presented:
| | | For the three months ended June 30, |
| ||||||||
(expressed in millions) | | | 2026 | | | 2025 | | Variance | | |||
Costs of stream sales | | | $ | 40.6 | | | $ | 30.3 | | $ | 10.3 | |
Mineral production taxes | | |
| 1.9 | | |
| 0.8 | |
| 1.1 | |
Mining costs of sales | | | $ | 42.5 | | | $ | 31.1 | | $ | 11.4 | |
Energy costs of sales | | |
| 3.4 | | |
| 2.4 | |
| 1.0 | |
| | | $ | 45.9 | | | $ | 33.5 | | $ | 12.4 | |
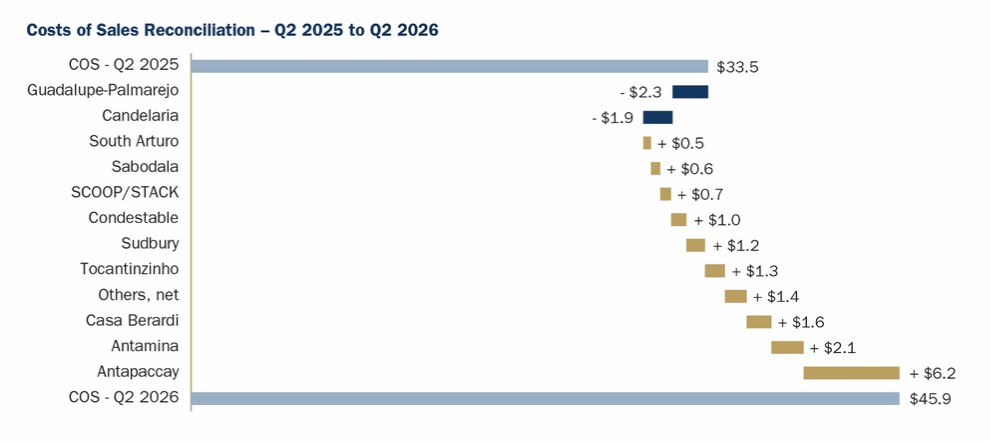
Costs of sales related to our streams increased in Q2 2026 compared to Q2 2025, reflecting higher costs per ounce for streams where the ongoing purchase price varies as a function of spot prices as well as an increase in stream ounces sold in the quarter. Costs of sales also include production taxes and energy royalties payable which vary based on revenue, and property taxes which are reassessed from time to time. Costs of sales incurred in Q2 2026 compared to Q2 2025 are shown below:
Depletion and Depreciation
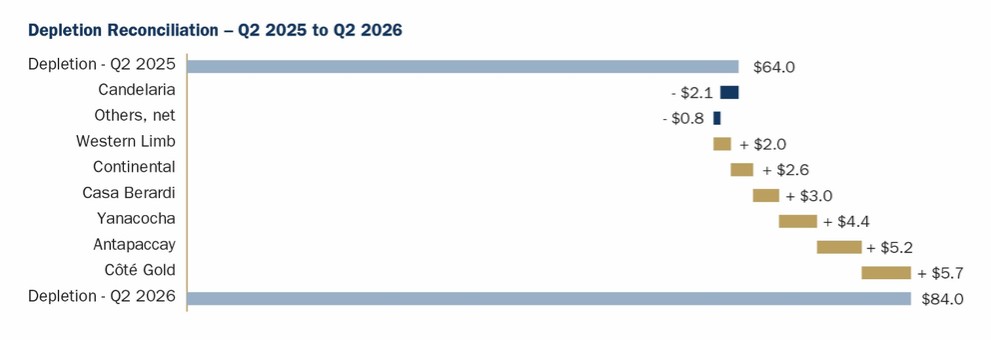
Depletion and depreciation expense totaled $84.0 million in Q2 2026 compared to $64.0 million in Q2 2025. The increase compared to the prior year period is primarily due to a higher proportion of our GEOs being generated from recently acquired assets which carry a relatively higher depletion rate per ounce. Depletion rates per unit of production generally decrease over time when resources are converted into reserves. The increase in depletion expense incurred in Q2 2026 compared to Q2 2025 is shown below:
Second Quarter 2026 Management’s Discussion and Analysis | 16 |
Certain of our royalties are settled with in-kind payments of gold and silver bullion rather than cash. During Q2 2026, we sold 14,000 gold ounces for proceeds of $59.8 million, recognizing a loss of $1.0 million. Comparatively, in Q2 2025, we sold 44,484 gold ounces for proceeds of $147.1 million and recognized a gain of $42.2 million. The timing of bullion sales varies based on gold prices and the Company’s liquidity needs. As at June 30, 2026, inventory included 24,618 gold ounces and 17,010 silver ounces with a carrying value of $112.1 million.
Income Taxes
Income tax expense was $104.9 million in Q2 2026, compared to $68.6 million in Q2 2025, reflecting higher net income before taxes earned in the current period.
Net Income and Adjusted Net Income
Net income for Q2 2026 was $354.0 million, or $1.84 per share, compared to $247.1 million, or $1.28 per share, in Q2 2025. The increase is primarily attributable to strong revenue growth, which more than offset the associated increase in costs of sales, resulting in meaningful operating leverage.
Adjusted Net Income for the same period was $349.2 million, or $1.81 per share, compared to $238.5 million, or $1.24 per share, in Q2 2025. Please refer to the “Non-GAAP Financial Measures” section of this MD&A for further details on the computation of Adjusted Net Income.
Review of Year-to-Date Financial Performance
The following table summarizes average commodity prices and average exchange rates during the periods presented.
| | | | | | | | | | | |||
Average prices and rates | | | | | H1 2026 | | | H1 2025 | | Variance | | ||
Gold(1) |
| ($/oz) | | | $ | 4,696 | | | $ | 3,071 |
| 52.9 | % |
Silver(1) |
| ($/oz) | | |
| 78.91 | | |
| 32.77 |
| 140.8 | % |
Platinum(1) |
| ($/oz) | | |
| 2,064 | | |
| 1,021 |
| 102.2 | % |
Palladium(1) |
| ($/oz) | | |
| 1,564 | | |
| 976 |
| 60.2 | % |
Iron Ore Fines 62% Fe CFR China | | ($/tonne) | | | | 105 | | | | 101 | | 4.0 | % |
| | | | | | | | | | | | | |
Edmonton Light |
| (C$/bbl) | | | | 112.81 | | |
| 90.40 |
| 24.8 | % |
West Texas Intermediate | | ($/bbl) | | | | 82.36 | | | | 67.58 | | 21.9 | % |
Henry Hub | | ($/mcf) | | | | 3.21 | | | | 3.69 | | (13.0) | % |
| | | | | | | | | | | | | |
CAD/USD exchange rate(2) | | | | |
| 0.7260 | | |
| 0.7098 |
| 2.3 | % |
| 1 | Based on LBMA PM Fix for gold, platinum and palladium. Based on LBMA Fix for silver. |
| 2 | Based on Bank of Canada daily rates. |
Second Quarter 2026 Management’s Discussion and Analysis | 17 |
Revenue and GEOs
Revenue and GEO sales by commodity, geographical location and type of interest for the six months ended June 30, 2026 and 2025 were as follows:
| | | Gold Equivalent Ounces(1) | | | Revenue (in millions) |
| |||||||||||
For the six months ended June 30, | | | 2026 | 2025 | | Variance | | | 2026 | | | 2025 | | Variance | | |||
| | | | | | | | | | | | | | | | | | |
Commodity | | | | | | | | | | | | | | | | | | |
Gold |
| | 182,382 | 164,261 |
| 18,121 | | | $ | 839.9 | | | $ | 504.2 | | $ | 335.7 | |
Silver |
| | 43,313 | 24,011 |
| 19,302 | | |
| 197.0 | | |
| 75.2 | |
| 121.8 | |
PGM |
| | 6,396 | 4,800 |
| 1,596 | | |
| 29.9 | | |
| 15.3 | |
| 14.6 | |
Precious Metals | | | 232,091 | 193,072 | | 39,019 | | | $ | 1,066.8 | | | $ | 594.7 | | $ | 472.1 | |
Iron ore(2) |
| | 5,831 | 6,085 |
| (254) | | | $ | 26.2 | | | $ | 19.6 | | $ | 6.6 | |
Other mining assets | | | 1,976 | 2,457 | | (481) | | | | 8.8 | | | | 7.4 | | | 1.4 | |
Oil | | | 17,463 | 23,830 | | (6,367) | | | | 78.8 | | | | 65.5 | | | 13.3 | |
Gas | | | 8,977 | 8,742 | | 235 | | | | 40.4 | | | | 34.3 | | | 6.1 | |
NGL | | | 2,420 | 4,492 | | (2,072) | | | | 10.6 | | | | 10.7 | | | (0.1) | |
Diversified | | | 36,667 | 45,606 | | (8,939) | | | $ | 164.8 | | | $ | 137.5 | | $ | 27.3 | |
Revenue from royalty, stream and working interests | | | 268,758 | 238,678 | | 30,080 | | | $ | 1,231.6 | | | $ | 732.2 | | $ | 499.4 | |
Interest revenue and other interest income | | | — | — | | — | | | $ | — | | | $ | 5.6 | | $ | (5.6) | |
Total GEOs and Revenue |
| | 268,758 | 238,678 |
| 30,080 | | | $ | 1,231.6 | | | $ | 737.8 | | $ | 493.8 | |
| | | | | | | | | | | | | | | | | | |
Geography | | | | | | | | | | | | | | | | | | |
South America |
| | 109,069 | 94,405 |
| 14,664 | | | $ | 504.4 | | | $ | 292.2 | | $ | 212.2 | |
Central America & Mexico |
| | 22,788 | 25,594 |
| (2,806) | | | | 103.9 | | | | 79.9 | | | 24.0 | |
Canada(2) |
| | 62,140 | 43,436 |
| 18,704 | | | | 282.1 | | |
| 137.6 | |
| 144.5 | |
United States |
| | 40,322 | 39,624 |
| 698 | | |
| 186.1 | | | | 119.0 | | | 67.1 | |
Rest of World |
| | 34,439 | 35,619 |
| (1,180) | | |
| 155.1 | | |
| 109.1 | |
| 46.0 | |
Total GEOs and Revenue |
| | 268,758 | 238,678 |
| 30,080 | | | $ | 1,231.6 | | | $ | 737.8 | | $ | 493.8 | |
| | | | | | | | | | | | | | | | | | |
Type | | | | | | | | | | | | | | | | | | |
Revenue-based royalties |
| | 97,710 | 90,810 |
| 6,900 | | | $ | 446.2 | | | $ | 277.0 | | $ | 169.2 | |
Streams |
| | 135,811 | 123,304 |
| 12,507 | | |
| 626.1 | | |
| 382.1 | |
| 244.0 | |
Profit-based royalties |
| | 29,838 | 18,345 |
| 11,493 | | |
| 133.2 | | |
| 53.8 | |
| 79.4 | |
Interest revenue and other(2) |
| | 5,399 | 6,219 |
| (820) | | |
| 26.1 | | |
| 24.9 | |
| 1.2 | |
Total GEOs and Revenue |
| | 268,758 | 238,678 |
| 30,080 | | | $ | 1,231.6 | | | $ | 737.8 | | $ | 493.8 | |
| 1 | Refer to the “Gold Equivalent Ounces and Net Gold Equivalent Ounces” section of this MD&A for more information on our methodology for calculating GEOs. |
| 2 | Includes interest attributable to Franco-Nevada’s 9.9% equity ownership of Labrador Iron Ore Royalty Corporation. |
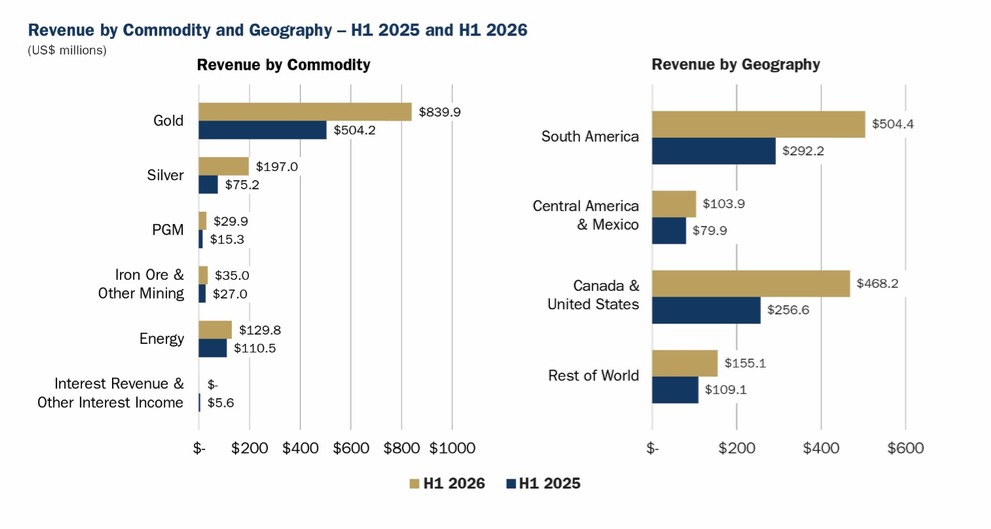
We recognized $1,231.6 million in revenue in H1 2026, up 67% from H1 2025. Revenue in the current period benefited from record Precious Metal prices achieved earlier in the year, higher Precious Metal contributions, including from recently acquired assets, and higher oil prices compared to the prior year period.
We earned 87% of our H1 2026 revenue from Precious Metal assets, compared to 81% in H1 2025. Geographically, we remain heavily invested in the Americas, with 87% of revenue in H1 2026, compared to 85% in H1 2025.
Second Quarter 2026 Management’s Discussion and Analysis | 18 |
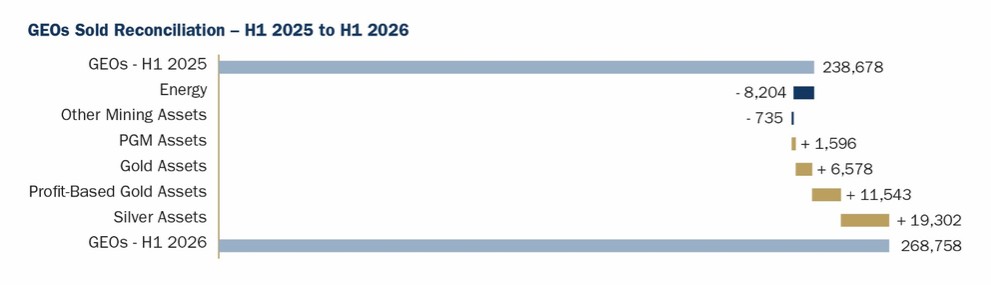
We sold 268,758 GEOs in H1 2026, up 13% from 238,678 GEOs in H1 2025. The increase was driven by higher contributions from our Precious Metal assets, including Côté Gold, South Arturo, Antapaccay, Porcupine, and Musselwhite. GEOs from our silver assets benefited from higher production at Antamina and a more favorable silver to gold ratio compared to the prior year period. These increases were partly offset by lower GEO contributions from our Diversified assets. A comparison of our sources of GEOs in H1 2026 to H1 2025 is shown below:
Precious Metals
Our Precious Metal assets contributed 232,091 GEOs in H1 2026, up 20% from 193,072 GEOs in H1 2025, primarily due to the following:
| ● | Antamina – We sold 1,865,000 silver ounces in H1 2026 compared to 1,350,000 silver ounces in H1 2025. Silver production at the mine increased compared to the prior year period due to higher silver grades as expected in the life of mine plan. When converted to GEOs, our silver deliveries amounted to 31,083 GEOs in H1 2026 and 14,101 GEOs in H1 2025. |
| ● | Côté Gold – We earned 8,805 GEOs in H1 2026 from our Côté Gold royalty, compared to 418 GEOs in H1 2025, reflecting our acquisition of the royalty in late June 2025. |
| ● | South Arturo – We earned 7,430 GEOs from South Arturo in H1 2026 compared to 2,227 GEOs in H1 2025, with the increase driven by production from the Phase 1 open pit. |
| ● | Porcupine – We earned 5,345 GEOs from Porcupine in H1 2026 compared to 1,984 GEOs. We started earning royalties from Porcupine when Discovery Mining Ltd. acquired the assets from Newmont Corporation in April 2025. |
The above increases were partly offset by the following factors:
Second Quarter 2026 Management’s Discussion and Analysis | 19 |
| ● | Candelaria – We sold 29,247 GEOs in H1 2026 compared to 36,320 GEOs in H1 2025. Lundin Mining expects production to be weighted towards H2 2026 due to increased availability of higher-grade Phase 12 ore, combined with increased underground mining rates as the underground insourcing initiative nears completion. |
| ● | Subika (Ahafo) – We earned 4,095 GEOs in H1 2026 compared to 8,606 GEOs in H1 2025. Mining activities ended at the Subika open pit as planned in July 2025. |
Diversified
Our Diversified assets, primarily comprising our Iron Ore and Energy interests, generated $164.8 million in revenue in H1 2026, a 20% increase compared to $137.5 million in H1 2025.
Iron Ore and Other Mining
Our Iron Ore and Other Mining assets generated $35.0 million in H1 2026, compared to $27.0 million in H1 2025.
| ● | Vale Royalty – Revenue from Vale was $23.5 million in H1 2026, compared to $16.0 million in H1 2025. Sales from the Southeastern System were attributed to the royalty after the cumulative threshold of 1.7 billion tonnes of iron ore was reached in April 2025. |
| ● | LIORC – LIORC contributed $2.7 million in revenue in H1 2026 compared to $3.6 million in H1 2025. |
| ● | Caserones – Revenue from our effective NSR on the Caserones mine was $4.8 million in H1 2026, an increase compared to $3.2 million in H1 2025. |
Energy
Our Energy interests contributed $129.8 million in revenue in H1 2026, compared to $110.5 million in H1 2025.
| ● | U.S. – Revenue from our U.S. Energy interests increased to $89.2 million in H1 2026, compared to $80.3 million in H1 2025. The increase was primarily driven by higher realized oil prices, higher production at our Haynesville interests, and a higher share of production from our interests with Continental Resources. |
| ● | Canada – Revenue from our Canadian Energy interests increased to $40.6 million in H1 2026, compared to $30.2 million in H1 2025. The increase in revenue is primarily due to our Weyburn interest, which benefited from higher oil prices. |
Costs of Sales
The following table provides a breakdown of costs of sales, excluding depletion and depreciation, incurred in the periods presented:
| | | For the six months ended June 30, |
| ||||||||
(expressed in millions) | | | 2026 | | | 2025 | | Variance |
| |||
Costs of stream sales | | | $ | 80.6 | | | $ | 63.7 | | $ | 16.9 | |
Mineral production taxes | | |
| 4.1 | | |
| 1.4 | |
| 2.7 | |
Mining costs of sales | | | $ | 84.7 | | | $ | 65.1 | | $ | 19.6 | |
Energy costs of sales | | |
| 7.7 | | |
| 6.9 | |
| 0.8 | |
| | | $ | 92.4 | | | $ | 72.0 | | $ | 20.4 | |
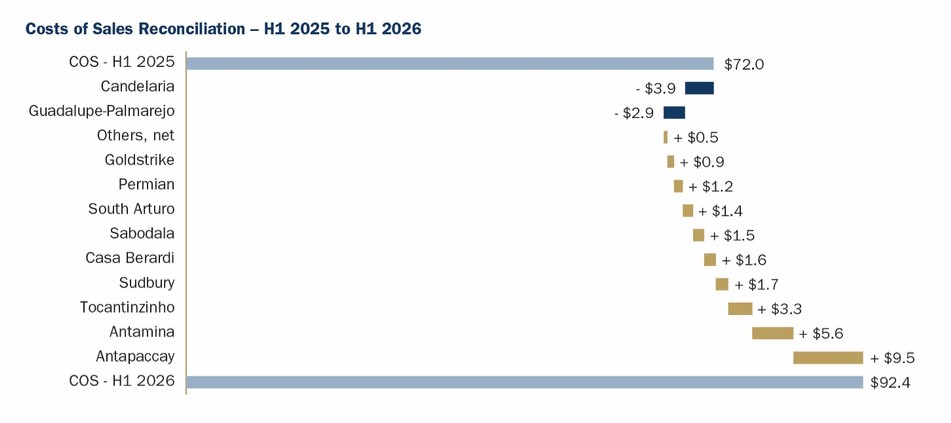
Costs of sales related to our streams in H1 2026 increased relative to H1 2025, reflecting the increase in stream GEOs and higher costs per ounce for streams where the ongoing purchase price varies as a function of spot prices. Costs of sales also include royalties payable and production taxes which vary based on revenue, and property taxes which may be reassessed from time to time. Costs of sales incurred in H1 2026 compared to H1 2025 are shown below:
Second Quarter 2026 Management’s Discussion and Analysis | 20 |
Depletion and Depreciation
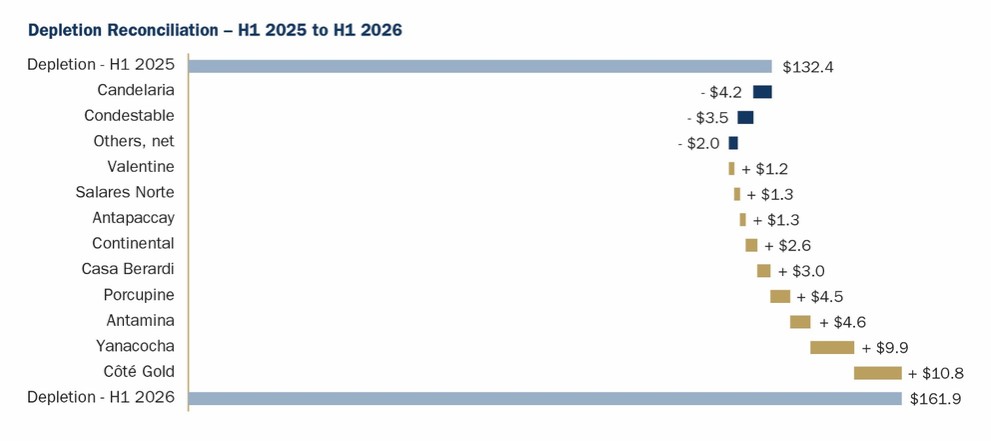
Depletion and depreciation expense increased to $161.9 million in H1 2026 from $132.4 million in H1 2025, primarily due to the increase in production volumes in the current period. In addition, recently acquired assets initially carry a relatively higher depletion rate per ounce. As mineral resources are converted into mineral reserves, depletion rates per ounce decrease over time. Depletion expense incurred in H1 2026 compared to H1 2025 is shown below:
Second Quarter 2026 Management’s Discussion and Analysis | 21 |
Gold and Silver Bullion
During H1 2026, we sold 17,000 gold ounces for proceeds of $74.9 million, recognized a gain of $2.1 million. Comparatively, in H1 2025, we sold 54,984 gold ounces for proceeds of $177.3 million and recognized a gain of $49.3 million. As at June 30, 2026, inventory included 24,618 gold ounces and 17,010 silver ounces with a carrying value of $112.1 million. Included in inventory are 10,006 gold ounces we received in March 2026 in connection with the partial buy-back of the Cascabel stream, further discussed below.
Gain on Buy-Back of Royalty and Stream Interests
During H1 2026, we recognized a gain of $63.8 million related to the buy-back of 50% of the Cascabel royalty and 50% of the Cascabel stream. Proceeds from the buy-back of the royalty of $97.5 million were received in cash. Consideration for the buy-back of the stream (net of the ongoing 20% payment per ounce) was received in-kind through the delivery of 10,006 gold ounces. As these ounces received represented payment in-kind for the exercise of a buy-back right, proceeds from the sale of these ounces will not be recognized as stream revenue. Instead, the Company will recognize the difference between the sales proceeds and the carrying value at the time of sale as a gain or loss on the sale of gold bullion.
Income Taxes
Income tax expense was $231.2 million in H1 2026, compared to $128.4 million in H1 2025, reflecting higher net income before taxes earned in the current period.
Net Income and Adjusted Net Income
Net income in H1 2026 was $822.6 million, or $4.27 per share, compared to $456.9 million, or $2.37 per share in H1 2025. The increase is primarily attributable to higher revenue as well as a gain of $63.8 million recognized on the Cascabel buy-backs. These benefits were partly offset by higher costs of sales, depletion and income tax expense.
During H1 2026, Adjusted Net Income was $807.5 million, or $4.19 per share, compared to $444.0 million, or $2.31 per share, in H1 2025. Please refer to the “Non-GAAP Financial Measures” section of this MD&A for further details on the computation of Adjusted Net Income.
General and Administrative and Share-Based Compensation Expenses
The following table provides a breakdown of general and administrative (“G&A”) expenses and share-based compensation (“SBC”) expenses incurred for the periods presented:
| | | For the three months ended June 30, |
| | For the six months ended June 30, |
| ||||||||||||||||
(expressed in millions) | | | 2026 | | | 2025 | | Variance | | | 2026 | | | 2025 | | Variance | | ||||||
Salaries and benefits | | | $ | 2.7 | | | $ | 3.0 | | $ | (0.3) | | | $ | 7.6 | | | $ | 7.6 | | $ | — | |
Professional fees | | |
| 2.9 | | |
| 5.2 | |
| (2.3) | | |
| 4.9 | | |
| 7.4 | |
| (2.5) | |
Community contributions | | | | 0.3 | | | | 0.1 | | | 0.2 | | | | 0.4 | | | | 0.5 | | | (0.1) | |
Board of Directors' costs | | | | 0.2 | | | | 0.1 | | | 0.1 | | | | 0.3 | | | | 0.2 | | | 0.1 | |
Office expenses | | | | 0.2 | | | | 0.2 | | | — | | | | 0.8 | | | | 0.8 | | | — | |
Insurance costs | | | | 0.2 | | | | 0.2 | | | — | | | | 0.4 | | | | 0.4 | | | — | |
Other expenses | | |
| 1.3 | | |
| 0.8 | |
| 0.5 | | |
| 2.6 | | |
| 2.1 | |
| 0.5 | |
General and administrative expenses | | | $ | 7.8 | | | $ | 9.6 | | $ | (1.8) | | | $ | 17.0 | | | $ | 19.0 | | $ | (2.0) | |
Share-based compensation (recovery) expenses | | |
| (3.5) | | |
| 2.8 | |
| (6.3) | | |
| 2.7 | | |
| 8.5 | |
| (5.8) | |
| | | $ | 4.3 | | | $ | 12.4 | | $ | (8.1) | | | $ | 19.7 | | | $ | 27.5 | | $ | (7.8) | |
G&A expenses (including SBC), decreased to $19.7 million in H1 2026 compared to $27.5 million in H1 2025, representing 1.6% of revenue in H1 2026, compared to 3.7% in H1 2025. The decrease was primarily due to lower SBC expenses. SBC expenses amounted to $2.7 million in H1 2026 compared to $8.5 million in H1 2025. SBC expenses include expenses related to equity-settled stock options, restricted share units (“RSUs”) and deferred share units (“DSUs”). DSUs are marked to market based on the Company’s share price. The expense related to the DSU mark-to-market was lower in H1 2026 compared to H1 2025 as a result of a decrease in the Company’s share price in Q2 2026.
Included in G&A expenses are business development expenses and community contributions. Business development expenses vary based on the level of business development related activities in the period and the timing of the closing of transactions. Community contributions relate to the environmental and social initiatives we contribute to for the benefit of the communities where we operate, or own assets.
Second Quarter 2026 Management’s Discussion and Analysis | 22 |
Foreign Exchange Gain and Other Income
The following table provides a list of foreign exchange and other income (expenses) incurred for the periods presented:
| | | For the three months ended June 30, |
| | For the six months ended June 30, |
| ||||||||||||||||
(expressed in millions) | | | 2026 | | | 2025 | | Variance | | | 2026 | | | 2025 | | Variance | | ||||||
Gain on derivative financial instruments | | | $ | 4.1 | | | $ | 5.7 | | $ | (1.6) | | | $ | 15.1 | | | $ | 5.6 | | $ | 9.5 | |
Foreign exchange gain (loss) | | | | 2.8 | | | | (1.4) | | | 4.2 | | | | 4.3 | | | | 4.4 | | | (0.1) | |
Other income (expenses) | | |
| 0.2 | | |
| (0.2) | |
| 0.4 | | |
| 0.1 | | |
| (0.2) | |
| 0.3 | |
| | | $ | 7.1 | | | $ | 4.1 | | $ | 3.0 | | | $ | 19.5 | | | $ | 9.8 | | $ | 9.7 | |
The gain on derivative instruments includes the mark-to-market of financial instruments that are designated at Fair Value Through Profit and Loss. The instruments include warrants such as those held in Discovery and Elemental Altus and other derivative instruments. The Company recognized a significant gain during the current period due to the increase in the share price of the underlying common shares.
The foreign exchange gain of $4.3 million recognized in H1 2026, is largely related to our cash and account receivable balances held in Brazilian Reais received from our Vale royalty, which strengthened relative to the U.S. dollar during this period.
Finance Income and Finance Expenses
The following table provides a breakdown of finance income and expenses incurred for the periods presented:
| | | For the three months ended June 30, | | | For the six months ended June 30, |
| ||||||||||||||||
(expressed in millions) | | | 2026 | | | 2025 | | Variance | | | 2026 | | | 2025 | | Variance | | ||||||
Finance income |
| | | |
| | | |
| | | | | | | | | | | | | | |
Interest | | | $ | 6.8 | | | $ | 6.6 | | $ | 0.2 | | | $ | 12.3 | | | $ | 17.7 | | $ | (5.4) | |
| | | $ | 6.8 | | | $ | 6.6 | | $ | 0.2 | | | $ | 12.3 | | | $ | 17.7 | | $ | (5.4) | |
Finance expenses |
| | | |
| | | |
| | | | | | | | | | | | | | |
Standby charges | | | $ | 0.5 | | | $ | 0.6 | | $ | (0.1) | | | $ | 1.1 | | | $ | 1.2 | | $ | (0.1) | |
Amortization of debt issue costs | | |
| 0.2 | | |
| 0.1 | | | 0.1 | | |
| 0.3 | | |
| 0.2 | |
| 0.1 | |
Accretion of lease liabilities | | |
| — | | |
| 0.1 | |
| (0.1) | | |
| 0.1 | | |
| 0.1 | |
| — | |
| | | $ | 0.7 | | | $ | 0.8 | | $ | (0.1) | | | $ | 1.5 | | | $ | 1.5 | | $ | — | |
Finance income includes interest earned on our cash and cash equivalents. We earned less interest income in the current period due to a decrease in yields and average cash and cash equivalents balances held compared to H1 2025.
Finance expenses consist of standby charges, which represent the costs of maintaining our revolvers based on the unutilized portion of the facility, fees incurred in connection with standby letters of credit outstanding during Q1 2026, and the amortization of costs incurred with respect to amendments and set up of the revolvers.
Second Quarter 2026 Management’s Discussion and Analysis | 23 |
Summary of Quarterly Information
Selected quarterly financial and statistical information for the most recent eight quarters(1) is set out below:
(in millions, except Average Gold Price, Adjusted EBITDA Margin, Adjusted Net Income Margin, GEOs sold, Net GEOs sold, | | | Q2 | | | | Q1 | | | | Q4 | | | | Q3 | | | | Q2 | | | | Q1 | | | | Q4 | | | | Q3 | |
per GEO amounts and per share amounts) | | | 2026 | | | | 2026 | | | | 2025 | | | | 2025 | | | | 2025 | | | | 2025 | | | | 2024 | | | | 2024 | |
Revenue | | $ | 580.9 | | | $ | 650.7 | | | $ | 597.3 | | | $ | 487.7 | | | $ | 369.4 | | | $ | 368.4 | | | $ | 321.0 | | | $ | 275.7 | |
Costs of sales | | | 129.9 | | | | 124.4 | | | | 136.9 | | | | 134.2 | | | | 97.5 | | | | 106.9 | | | | 94.4 | | | | 86.1 | |
Other operating expenses (income)(2) | |
| 5.3 | | |
| (51.5) | | |
| 6.5 | | |
| 12.5 | | |
| (33.9) | | |
| 8.0 | | |
| 9.2 | | |
| 7.6 | |
Operating income | |
| 445.7 | | |
| 577.8 | | |
| 453.9 | | |
| 341.0 | | |
| 305.8 | | |
| 253.5 | | |
| 217.4 | | |
| 182.0 | |
Other income | |
| 13.2 | | |
| 17.1 | | |
| 14.4 | | |
| 21.4 | | |
| 9.9 | | |
| 16.1 | | |
| 4.8 | | |
| 12.9 | |
Income tax expense | |
| 104.9 | | |
| 126.3 | | |
| 100.6 | | |
| 74.9 | | |
| 68.6 | | |
| 59.8 | | |
| 46.8 | | |
| 42.2 | |
Net income | |
| 354.0 | | |
| 468.6 | | |
| 367.7 | | |
| 287.5 | | |
| 247.1 | | |
| 209.8 | | |
| 175.4 | | |
| 152.7 | |
Basic earnings per share | | $ | 1.84 | | | $ | 2.43 | | | $ | 1.91 | | | $ | 1.49 | | | $ | 1.28 | | | $ | 1.09 | | | $ | 0.91 | | | $ | 0.79 | |
Diluted earnings per share | | $ | 1.83 | | | $ | 2.43 | | | $ | 1.90 | | | $ | 1.49 | | | $ | 1.28 | | | $ | 1.09 | | | $ | 0.91 | | | $ | 0.79 | |
Net cash provided by operating activities | | $ | 482.5 | | | $ | 520.4 | | | $ | 426.5 | | | $ | 348.0 | | | $ | 430.3 | | | $ | 288.9 | | | $ | 243.0 | | | $ | 213.6 | |
Net cash (used in) provided by investing activities | | | (101.4) | | | | (397.9) | | | | 64.1 | | | | (208.0) | | | | (1,338.1) | | | | (551.0) | | | | (31.1) | | | | (279.0) | |
Net cash used in financing activities | | | (81.2) | | | | (80.8) | | | | (70.3) | | | | (64.2) | | | | (66.1) | | | | (66.8) | | | | (62.0) | | | | (61.1) | |
Average Gold Price(3) | | $ | 4,517 | | | $ | 4,875 | | | $ | 4,145 | | | $ | 3,456 | | | $ | 3,279 | | | $ | 2,863 | | | $ | 2,662 | | | $ | 2,477 | |
GEOs sold(4) | |
| 132,405 | | |
| 136,353 | | |
| 141,656 | | |
| 138,772 | | |
| 112,093 | | |
| 126,585 | | |
| 120,063 | | |
| 110,110 | |
Net GEOs sold(4) | | | 122,205 | | | | 126,020 | | | | 129,690 | | | | 125,115 | | | | 101,876 | | | | 113,138 | | | | 107,140 | | | | 97,232 | |
Cash Costs(5) | | $ | 45.9 | | | $ | 46.5 | | | $ | 49.6 | | | $ | 47.2 | | | $ | 33.5 | | | $ | 38.5 | | | $ | 34.4 | | | $ | 31.9 | |
Cash Costs(5) per GEO sold | | $ | 347 | | | $ | 341 | | | $ | 350 | | | $ | 340 | | | $ | 299 | | | $ | 304 | | | $ | 287 | | | $ | 290 | |
Adjusted EBITDA(5) | | $ | 529.7 | | | $ | 591.9 | | | $ | 541.2 | | | $ | 427.3 | | | $ | 365.7 | | | $ | 321.9 | | | $ | 277.4 | | | $ | 236.2 | |
Adjusted EBITDA(5) per share | | $ | 2.75 | | | $ | 3.07 | | | $ | 2.81 | | | $ | 2.22 | | | $ | 1.90 | | | $ | 1.67 | | | $ | 1.44 | | | $ | 1.23 | |
Adjusted EBITDA Margin(5) | |
| 91.2 | % | |
| 91.0 | % | |
| 90.6 | % | |
| 87.6 | % | |
| 99.0 | % | |
| 87.4 | % | |
| 86.4 | % | |
| 85.7 | % |
Adjusted Net Income(5)(6) | | $ | 349.2 | | | $ | 458.3 | | | $ | 356.2 | | | $ | 275.0 | | | $ | 238.5 | | | $ | 205.6 | | | $ | 183.3 | | | $ | 153.9 | |
Adjusted Net Income(5)(6) per share | | $ | 1.81 | | | $ | 2.38 | | | $ | 1.85 | | | $ | 1.43 | | | $ | 1.24 | | | $ | 1.07 | | | $ | 0.95 | | | $ | 0.80 | |
Adjusted Net Income Margin(5)(6) | |
| 60.1 | % | |
| 70.4 | % | |
| 59.6 | % | |
| 56.4 | % | |
| 64.6 | % | |
| 55.8 | % | |
| 57.1 | % | |
| 55.8 | % |
| 1 | Sum of the quarters may not add up to yearly total due to rounding. |
| 2 | Includes an impairment reversal of $0.7 million Q3 2025, an impairment reversal of $4.1 million in Q2 2025. |
| 3 | Based on LBMA Gold Price PM Fix. |
| 4 | Refer to the “Gold Equivalent Ounces and Net Gold Equivalent Ounces” section of this MD&A for more information on our methodology for calculating GEOs sold and Net GEOs sold. |
| 5 | Cash Costs, Cash Costs per GEO sold, Adjusted EBITDA, Adjusted EBITDA per share, Adjusted EBITDA Margin, Adjusted Net Income, Adjusted Net Income per share and Adjusted Net Income Margin are non-GAAP financial measures with no standardized meaning under IFRS Accounting Standards and might not be comparable to similar financial measures disclosed by other issuers. Refer to the “Non-GAAP Financial Measures” section of this MD&A for more information on each non-GAAP financial measure. |
| 6 | Our definition of Adjusted Net Income, Adjusted Net Income per share and Adjusted Net Income Margin were amended to no longer adjust for gains on contractual buy-backs of royalty and stream interests. Prior period comparatives have been restated accordingly, as applicable. Refer to the “Non-GAAP Financial Measures” section of this MD&A for more information. |
Second Quarter 2026 Management’s Discussion and Analysis | 24 |
Summary Balance Sheet and Key Financial Metrics
| | At June 30, | | | At December 31, | ||
(expressed in millions, except debt-to-equity ratio) | | 2026 | | 2025 |
| ||
Cash and cash equivalents | | $ | 1,014.2 | | $ | 670.9 | |
Other current assets | |
| 373.7 | |
| 350.5 | |
Non-current assets | |
| 7,534.3 | |
| 7,220.0 | |
Total assets | | $ | 8,922.2 | | $ | 8,241.4 | |
| | | | | | | |
Current liabilities | | $ | 148.0 | | $ | 123.0 | |
Non-current liabilities | |
| 533.5 | |
| 483.1 | |
Total liabilities | | $ | 681.5 | | $ | 606.1 | |
| | | | | | | |
Total shareholders’ equity | | $ | 8,240.7 | | $ | 7,635.3 | |
| | | | | | | |
Total common shares outstanding | |
| 192.9 | |
| 192.8 | |
Capital management measures | | | | | | | |
Available capital | | $ | 4,305.4 | | $ | 2,840.1 | |
Debt-to-equity | |
| — | |
| — | |
Assets
Total assets were $8,922.2 million as at June 30, 2026, compared to $8,241.4 million as at December 31, 2025. Our non-current asset base is primarily comprised of royalty, stream and working interests, and investments, while our current assets are primarily comprised of cash and cash equivalents, receivables, gold and silver bullion and stream inventory.
Current assets increased compared to December 31, 2025, primarily driven by an increase in cash and cash equivalents and bullion inventory, reflecting record revenues earned in H1 2026, the receipt of cash and in-kind consideration for the Cascabel buy-backs, and the collection of cash deposits we had posted as security with the CRA.
Non-current assets increased primarily due to the additions of the Casa Berardi stream, the i-80 Gold royalty, the Bullabulling royalty, the Victoria Gold portfolio and advanced under the LOMI Facility, partly offset by the depletion of our royalty, stream and working interests. During H1 2026, our equity investments increased due to the acquisition of common shares of Minerals 260 in connection with the Bullabulling financing package, as well as the mark-to-market gain of our equity investments of $64.6 million.
Liabilities
Total liabilities as at June 30, 2026, increased compared to December 31, 2025, largely due to an increase in deferred income tax liabilities as a result of the Company earning higher net income before taxes. Current income tax liabilities as at June 30, 2026 include $32.8 million in connection to the Qualified Domestic Minimum Top-up Tax in Barbados for the fiscal year ended December 31, 2024, which remains outstanding at quarter-end. The Barbados Revenue Authority has announced that no penalties or interest will apply to amounts paid on or before September 30, 2026.
Shareholders’ Equity
Shareholders’ equity increased compared to December 31, 2025, as a result of earning net income of $822.6 million in H1 2026, partly offset by other comprehensive loss of $59.0 million and dividend payments of $168.4 million of which $7.3 million was settled through the issuance of common shares pursuant to the DRIP.
Liquidity and Capital Resources
Cash flows for the periods ended June 30, 2026, and 2025 were as follows:
| | For the three months ended | | | For the six months ended |
| ||||||||||
| | June 30, | | | June 30, | | ||||||||||
(expressed in millions) | | 2026 | | | 2025 | | | 2026 | | | 2025 | | ||||
Net cash provided by operating activities | | $ | 482.5 | | | $ | 430.3 | | | $ | 1,002.9 | | | $ | 719.2 | |
Net cash used in investing activities | |
| (101.4) | | |
| (1,338.1) | | |
| (499.3) | | |
| (1,889.1) | |
Net cash used in financing activities | |
| (81.2) | | |
| (66.1) | | |
| (162.0) | | |
| (132.9) | |
Effect of exchange rate changes on cash and cash equivalents | | | (0.4) | | | | 6.1 | | | | 1.7 | | | | 11.8 | |
Net change in cash and cash equivalents | | $ | 299.5 | | | $ | (967.8) | | | $ | 343.3 | | | $ | (1,291.0) | |
Operating Activities
Net cash provided by operating activities was $482.5 million in Q2 2026 (Q2 2025 – $430.3 million) and $1,002.9 million during H1 2026 (H1 2025 – $719.2 million). Operating cash flow in the current periods were higher than the same periods in 2025
Second Quarter 2026 Management’s Discussion and Analysis | 25 |
primarily due to higher gross profit, partly offset by lower proceeds from the sale of gold bullion. The timing of bullion sales varies based on gold prices and the Company’s liquidity requirements. Operating cash flow in H1 2026 also included the receipt of cash deposits from the CRA.
Investing Activities
Net cash used in investing activities was $101.4 million in Q2 2026 (Q2 2025 – $1,338.1 million) and $499.3 million in H1 2026 (H1 2025 - $1,889.1 million). Investing activities in Q2 2026 included cash used in various acquisitions including the Victoria Gold royalty portfolio and advances under the LOMI Facility. Investing activities in Q1 2026 included the acquisition of the i-80 Gold and the Bullabulling royalties, and the Casa Berardi Stream, partially offset the $97.5 million received in connection with the 50% Cascabel royalty buy-back. This compares to the 2025 periods where investing activities included the acquisitions of the Côté Gold and the Porcupine royalties in Q2 2025 and the closing of the Western Limb stream in Q1 2025.
Financing Activities
For Q2 2026, net cash used in financing activities was $81.2 million (Q2 2025 – $66.1 million) and $162.0 million in H1 2026 (H1 2025 – $132.9 million). Financing activities primarily related to the payment of dividends offset by proceeds from the exercise of stock options held by employees of the Company.
Capital Resources
Management’s objectives when managing capital are:
| (a) | when capital is not being used for long-term investments, ensure its preservation and availability by investing in low-risk investments with high liquidity; and |
| (b) | to ensure that adequate levels of capital are maintained to meet Franco-Nevada’s operating requirements and other current liabilities. |
Our capital resources comprise cash and cash equivalents, equity investments other than those held as long-term strategic investments, gold and silver bullion we receive for payments in-kind, and our revolving credit facilities.
Our cash and cash equivalents totaled $1,014.2 million as at June 30, 2026 (December 31, 2025 – $670.9 million). As at June 30, 2026, our cash and cash equivalents are held in cash and term deposits with several financial institutions. Certain investments with maturities upon acquisition of 3 months, or 92 days or less, were classified as term deposits within cash and cash equivalents on the statement of financial position.
Our equity investments totaled $1,215.1 million as at June 30, 2026 (December 31, 2025 – $1,141.3 million). Of the total investments held, $1,154.0 million was held in publicly-traded equity instruments (December 31, 2025 – $1,093.3 million). Of the $1,154.0 million held in publicly-traded equity instruments, $124.3 million relates to our holdings of LIORC (December 31, 2025 – $138.0 million) which we consider equivalent to a royalty and therefore hold as a long-term strategic investment.
As at the date of this MD&A, we have two unsecured revolving credit facilities providing a total of $1.5 billion in available capital, and accordions totaling $750.0 million. The Corporate Revolver has a maturity date of March 10, 2031, and the FNIC Revolver has a maturity date of May 8, 2029.
Our near-term cash requirements include purchase commitments for the ongoing cost per ounce under stream agreements as outlined in the “Purchase Commitments” section, corporate administration costs, certain costs of operations, commitments under our various environmental and social initiatives, payment of dividends and income taxes directly related to the recognition of royalty, stream and working interest revenues and interest income. We also have capital commitments in connection with royalty and stream agreements we have entered into, as detailed in the “Capital Commitments” section. We believe that our current cash resources, available credit facilities, and future cash flows will be sufficient to cover the costs of our commitments, operating and administrative expenses, and dividend payments for the foreseeable future.
As a royalty and stream company, we are subject to limited requirements for capital expenditures beyond our initial commitments at the time of entering into our agreements. Other than the capital commitments detailed in the “Capital Commitments” section of this MD&A, the acquisition of additional royalties, streams or other investments is entirely discretionary and will be consummated through the use of cash, proceeds from the sale of equity investments and gold and silver bullion, as available, or through the issuance of common shares or other equity or debt securities, or the use of our Corporate Revolver or the FNIC Revolver.
Our results are impacted by foreign currency fluctuations relative to the U.S. dollar. Our largest exposure is with respect to the Canadian-U.S. dollar exchange rates as we hold a significant amount of our assets in Canada and report our results in U.S. dollars. The effect of volatility in these currencies against the U.S. dollar impacts our corporate general and administrative expenses and the depletion of our royalty, stream and working interests. We also have exposure to the Australian dollar due to our Australian subsidiary and to the Brazilian real due to our Vale royalty which is paid in Brazilian reales. We also have nominal exposure to the Chilean peso, the Peruvian sol, and the South African rand. During Q2 2026, the Canadian dollar traded in a range of $0.7025 to $0.7366, ending at $0.7037; the Australian dollar traded between $0.6887 and $0.7247, ending at $0.6894; and the Brazilian real traded between 0.1923 and 0.2040, ending at 0.1931.
Second Quarter 2026 Management’s Discussion and Analysis | 26 |
Purchase Commitments
The following table summarizes Franco-Nevada’s commitments to pay for gold, silver and PGM pursuant to the associated precious metal agreements as at June 30, 2026.
| | Attributable payable | | | | | | | | | | | | | | | |
| ||||
| | production to be purchased | | Per ounce cash payment (1),(2) | | | Term of | | Date of |
| ||||||||||||
Interest | | Gold | | Silver | | PGM | | Gold | | Silver | | | PGM | | | agreement(3) | | contract |
| |||
Antamina |
| — | % | 22.5 | % (4) | — | % | | n/a | | | 5 | | % (5) | | n/a | |
| 40 years | | 7-Oct-15 | |
Antapaccay |
| — | % (6) | — | % (7) | — | % |
| 20 | % (8) | | 20 | | % (9) | | n/a | |
| 40 years | | 10-Feb-16 | |
Candelaria |
| 68 | % (10) | 68 | % (10) | — | % | $ | 400 | | $ | 4.00 | | | | n/a | |
| 40 years | | 6-Oct-14 | |
Casa Berardi | | — | % (11) | — | % | — | % | | 20 | % | | n/a | | | | n/a | | | 40 years | | 26-Jan-26 | |
Cascabel | | 14 | % (12) | — | % | — | % | | 20 | % (13) | | n/a | | | | n/a | | | 40 years | | 15-Jul-24 | |
Cooke 4 |
| 7 | % | — | % | — | % | $ | 400 | | | n/a |
| | | n/a | |
| 40 years | | 5-Nov-09 | |
Cobre Panamá Fixed Payment Stream |
| — | % (14) | — | % (15) | — | % | $ | 418 | (16) | $ | 6.27 |
| (17) | | n/a | |
| 40 years | | 19-Jan-18 | |
Cobre Panamá Floating Payment Stream | | — | % (18) | — | % (19) | — | % | | 20 | % (20) | | 20 | | % (21) | | n/a | |
| 40 years | | 19-Jan-18 | |
Condestable | | 63 | % (22) | 63 | % (23) | — | % | | 20 | % (24) | | 20 | | % (25) | | n/a | |
| 40 years | | 27-Mar-24 | |
Guadalupe-Palmarejo |
| 50 | % | — | % | — | % | $ | 800 | | | n/a |
| | | n/a | |
| 40 years | | 2-Oct-14 | |
Karma |
| 4.875 | % | — | % | — | % |
| 20 | % (26) | | n/a |
| | | n/a | |
| 40 years | | 11-Aug-14 | |
New Prosperity | | 22 | % (27) | — | % | — | % | $ | 400 | (28) | | n/a |
| | | n/a | |
| 40 years | | 12-May-10 | |
Sabodala |
| — | % (29) | — | % | — | % |
| 20 | % (30) | | n/a |
| | | n/a | |
| 40 years | | 25-Sep-20 | |
Sudbury (31) |
| 50 | % | — | % | 50 | % | $ | 400 | | | n/a | | | $ | 400 | |
| 40 years | | 15-Jul-08 | |
Tocantinzinho |
| 12.5 | % (32) | — | % | — | % | | 20 | % (33) | | n/a | | | | n/a | |
| 40 years | | 18-Jul-22 | |
Western Limb |
| — | % (34) | — | % | 1 | % (35) | | 5 | % (36) | | n/a |
| | | 5 | % |
| 40 years | | 28-Feb-25 | |
| 1 | Subject to an annual inflationary adjustment except for Antamina, Antapaccay, Casa Berardi, Cascabel, Guadalupe-Palmarejo, Karma, Sabodala, Sudbury, Tocantinzinho, and Western Limb. |
| 2 | Should the prevailing market price for gold be lower than this amount, the per ounce cash payment will be reduced to the prevailing market price. |
| 3 | Subject to successive extensions. |
| 4 | Subject to a fixed payability of 90%. Percentage decreases to 15% after 86.0 million ounces of silver have been delivered under the agreement. At June 30, 2026, a cumulative total of 34.0 million silver ounces have been delivered. |
| 5 | Purchase price is 5% of the average silver price at the time of delivery. |
| 6 | Gold deliveries are referenced to copper in concentrate shipped with 300 ounces of gold delivered for each 1,000 tonnes of copper in concentrate shipped, until 630,000 ounces of gold has been delivered. Thereafter, percentage is 30% of gold shipped. At June 30, a cumulative total of 547,730 gold ounces have been delivered. |
| 7 | Silver deliveries are referenced to copper in concentrate shipped with 4,700 ounces of silver delivered for each 1,000 tonnes of copper in concentrate shipped, until 10.0 million ounces of silver has been delivered. Thereafter, percentage is 30% of silver shipped. At June 30, 2026, a cumulative total of 8.6 million silver ounces have been delivered. |
| 8 | Purchase price is 20% of the spot price of gold until 750,000 ounces of gold have been delivered, thereafter the purchase price is 30% of the spot price of gold. At June 30, a cumulative total of 547,730 gold ounces have been delivered. |
| 9 | Purchase price is 20% of the spot price of silver until 12.8 million ounces of silver have been delivered, thereafter the purchase price is 30% of the spot price of silver. At June 30, 2026, a cumulative total of 8.6 million silver ounces have been delivered. |
| 10 | Percentage decreases to 40% after 720,000 ounces of gold and 12.0 million ounces of silver have been delivered under the agreement. At June 30, 2026, a cumulative total of 672,550 gold ounces and 11.4 million silver ounces have been delivered. |
| 11 | Gold deliveries are fixed at 6,500 ounces per annum from January 1, 2026, to December 31, 2030. Thereafter, 5.0% of gold produced from the Casa Berardi mine and Orezone Gold Corporation’s other Quebec assets (excluding Heva-Hosco) and 2.5% of gold produced from Heva-Hosco. As at June 30, 2026, 1,625 ounces have been delivered. |
| 12 | Percentage decreases to 8.4% after 525,000 ounces of gold have been delivered to Franco-Nevada International Corporation under the agreement. As at June 30, 2026, NIL ounces have been delivered. |
| 13 | Purchase price is 20% of the spot price of gold at the time of delivery. |
| 14 | Gold deliveries are indexed to copper in concentrate produced from the project. 120 ounces of gold per every 1 million pounds of copper produced until 808,000 ounces of gold delivered. Thereafter, 81 ounces of gold per 1 million pounds of copper produced until 1,716,188 ounces of gold delivered. Thereafter, 63.4% of the gold in concentrate. At June 30, 2026, a cumulative total of 361,011 gold ounces have been delivered. |
| 15 | Silver deliveries are indexed to copper in concentrate produced from the project. 1,376 ounces of silver per every 1 million pounds of copper produced until 9,842,000 ounces of silver delivered. Thereafter 1,776 ounces of silver per 1 million pounds of copper produced until 29,731,000 ounces of silver delivered. Thereafter, 62.1% of the silver in concentrate. At June 30, 2026, a cumulative total of 4.1 million silver ounces have been delivered. |
| 16 | After 1,341,000 ounces of gold delivered, purchase price is the greater of 50% of spot and $418.27 per ounce, subject to an annual inflationary adjustment. At June 30, 2026, a cumulative total of 361,011 gold ounces have been delivered. |
| 17 | After 21,510,000 ounces of silver delivered, purchase price is the greater of 50% of spot and $6.27 per ounce, subject to an annual inflationary adjustment. At June 30, 2026, a cumulative total of 4.1 million silver ounces have been delivered. |
| 18 | Gold deliveries are indexed to copper in concentrate produced from the project. 30 ounces of gold per every 1 million pounds of copper produced until 202,000 ounces of gold delivered. Thereafter 20.25 ounces of gold per 1 million pounds of copper produced until 429,047 ounces of gold delivered. Thereafter, 15.85% of the gold in concentrate. At June 30, 2026, a cumulative total of 90,253 gold ounces have been delivered. |
| 19 | Silver deliveries are indexed to copper in concentrate produced from the project. 344 ounces of silver per every 1 million pounds of copper produced until 2,460,500 ounces of silver delivered. Thereafter, 444 ounces of silver per 1 million pounds of copper produced until 7,432,750 ounces of silver delivered. Thereafter 15.53% of the silver in concentrate. At June 30, 2026, a cumulative total of 1.0 million silver ounces have been delivered. |
| 20 | After 604,000 ounces of gold delivered, purchase price is 50% of the spot price of gold. At June 30, 2026, a cumulative total of 90,253 gold ounces have been delivered. |
| 21 | After 9,618,000 ounces of silver delivered, purchase price is 50% of the spot price of silver. At June 30, 2026, a cumulative total of 1.0 million silver ounces have been delivered. |
| 22 | Gold deliveries were fixed at 8,760 ounces per annum from January 1, 2021, to December 31, 2025. Commencing January 1, 2026, 63% of the gold in concentrate until a cumulative total of 87,600 ounces of gold delivered. Thereafter, 37.5% of the gold in concentrate. At June 30, 2026, a cumulative total of 46,203 gold ounces have been delivered. |
| 23 | Silver deliveries were fixed at 291,000 ounces per annum from January 1, 2021, to December 31, 2025. Commencing January 1, 2026, 63% of the silver in concentrate until a cumulative total of 2,910,000 ounces of silver delivered. Thereafter, 37.5% of the silver in concentrate. At June 30, 2026, a cumulative total of 1.5 million ounces have been delivered. |
| 24 | Purchase price is 20% of the spot price of gold at the time of delivery. |
| 25 | Purchase price is 20% of the spot price of silver at the time of delivery. |
| 26 | Purchase price is 20% of the average gold price at the time of delivery. |
Second Quarter 2026 Management’s Discussion and Analysis | 27 |
| 27 | Franco-Nevada has the right to acquire a 22% gold stream on New Prosperity for $350.0 million. |
| 28 | Purchase price is subject to a 1% annual increase, compounding annually, that commenced in May 2014. |
| 29 | Based on amended agreement with an effective date of September 1, 2020, gold deliveries are fixed at 783.33 ounces per month until 105,750 ounces of gold is delivered. At June 30, 2026, a cumulative total of 55,616 ounces have been delivered under the amended agreement since September 1, 2020. Thereafter, percentage is 6% of gold production (subject to reconciliation after fixed delivery period to determine if Franco-Nevada would have received more or less than 105,750 ounces of gold under the original 6% variable stream for such period, entitling the operator to a credit for an over-delivery applied against future stream deliveries or a one-time additional delivery to Franco-Nevada for an under-delivery). |
| 30 | Purchase price is 20% of prevailing market price at the time of delivery. |
| 31 | Franco-Nevada is committed to purchase 50% of the precious metals contained in ore from the properties. Payment is based on gold equivalent ounces. For McCreedy West, effective June 1, 2021, purchase price per gold equivalent ounce is determined based on the monthly average gold spot price: (i) when the gold spot price is less than $800 per ounce, the purchase price is the prevailing monthly average gold spot price; (ii) when the gold spot price is greater than $800 per ounce but less than $1,333 per ounce, the purchase price is $800 per ounce; (iii) when the gold spot price is greater than $1,333 per ounce but less than $2,000 per ounce, the purchase price is 60% of the prevailing monthly average gold spot price; and (iv) when the gold spot price is greater than $2,000, the purchase price is $1,200 per ounce. |
| 32 | Percentage decreases to 7.5% after 300,000 ounces of gold have been delivered under the agreement. At June 30, 2026, a cumulative total of 36,714 ounces have been delivered. |
| 33 | Purchase price is 20% of the spot price of gold at the time of delivery. |
| 34 | Gold deliveries are referenced to platinum, palladium, rhodium and gold (“4E”) ounces contained in concentrate with deliveries of gold ounces initially equal to 1.1% of 4E PGM ounces contained in concentrate, until 87,500 ounces of gold delivered. Thereafter, deliveries of gold ounces equal to 0.75% of 4E PGM ounces contained in concentrate, until a total of 237,000 ounces of gold delivered. Thereafter, 80.0% of gold contained in concentrate. At June 30, 2026, a cumulative total of 24,948 ounces of gold have been delivered. |
| 35 | Percentage increases to 2.1% of platinum contained in concentrate after 48,000 ounces of platinum delivered. Platinum deliveries are capped at 294,000 ounces of platinum. At June 30, 2026, a cumulative total of 13,524 platinum ounces have been delivered. |
| 36 | After 237,000 ounces of gold delivered, purchase price is 10% of the spot price of gold. At June 30, 2026, a cumulative total of 24,948 ounces of gold have been delivered. |
Capital Commitments
The Company’s capital commitments as at June 30, 2026, remain substantially consistent with those disclosed in the 2025 MD&A. The following table provides an update on significant new capital commitments and material changes to existing capital commitments since the year ended December 31, 2025:
Asset | | Commitment | | Obligating Event |
|
Cascabel stream | | $239.1 million | | Without limitation, completion of key development milestones, receipt of all material permits, a construction decision approved by the board of directors of JCC, and availability of the remainder of the required project financing | |
Royalty Acquisition Venture with Continental | | $30.1 million | | Acquisition of mineral rights acquired through the Royalty Acquisition Venture with Continental, triggering funding requirements by the Company | |
i-80 Gold Royalty | | $25.0 million | | The incurrence by i-80 Gold of an initial $25.0 million of budgeted expenditures to advance Mineral Point technical and permitting work in 2026 | |
Contingencies
The Company’s contingencies as at June 30, 2026, remain substantially consistent with those disclosed in the 2025 MD&A, with the exception of the following updates:
Canada Revenue Agency Audit
Settlement of Canada Revenue Agency Transfer Pricing Tax Dispute
On September 11, 2025, the Company reached the CRA Settlement which provides for a final resolution of the Company’s tax dispute in connection with the Reassessments under the transfer pricing rules of the 2013 to 2019 taxation years in relation to its Mexican and Barbadian subsidiaries.
Under the terms of the CRA Settlement for the 2013 to 2019 taxation years, no tax payment in Canada was required on the foreign earnings of the Company’s Mexican and Barbadian subsidiaries. Additionally, the service fee charged by the Company for certain services provided to the Mexican and Barbadian subsidiaries was adjusted to increase the mark-up applied to the Company’s cost of providing those services from the current range of 7-20% to 30%. For more information on the settlement with the CRA, please refer to the 2025 MD&A.
During the first quarter of 2026, amounts that were posted as security with the CRA for the prior years’ reassessments in the form of standby letters of credit totaling $47.3 million (C$66.0 million) were released, and cash totaling $44.1 million (C$61.4 million) plus interest of approximately $5.4 million (C$7.5 million), which was classified as a receivable within “other current assets” at December 31, 2025, was received.
The CRA Settlement is not legally binding on the CRA for years after 2019, however, the Company believes the transfer pricing principles established by the CRA Settlement will apply to years after 2019, provided there are no material changes to the facts or law. On March 26, 2026, the Canadian Federal Government enacted changes to the transfer pricing legislation which apply from 2026 onward. The Company is in the process of evaluating the potential impact of these legislative changes.
Second Quarter 2026 Management’s Discussion and Analysis | 28 |
Critical Accounting Policies and Estimates
The preparation of consolidated financial statements in accordance with IFRS Accounting Standards requires the Company to make judgments, estimates and assumptions that affect the reported amounts of assets and liabilities and disclosures of contingent assets and liabilities at the date of the consolidated financial statements and the reported amounts of revenues and expenses during the reporting period. Estimates and assumptions are continuously evaluated and are based on management’s best knowledge of the relevant facts and circumstances, having regard to previous experience. However, actual outcomes may differ from the amounts included in the consolidated financial statements.
Our material accounting policies and estimates are disclosed in Notes 2 of our unaudited consolidated financial statements for the three and six months ended June 30, 2026, and Notes 2 and 3 of our 2025 audited consolidated financial statements.
New and Amended Accounting Standards Adopted by the Company
The Company adopted the following accounting standards in the period.
Amendments to IFRS 9 and IFRS 7 - Amendments to the Classification and Measurement of Financial Instruments
In May 2024, the IASB issued amendments to IFRS 9 Financial Instruments (“IFRS 9”) and IFRS 7 Financial Instruments: Disclosures (“IFRS 7”). The amendments clarify the date of recognition and derecognition of financial assets and liabilities with an exception that permits an entity to derecognize a financial liability before the settlement date when the financial liability is settled with cash, using an electronic payment system that meets specific criteria. The Company has elected to apply the exception of the adoption of these amendments.
The amendments also clarify and add further guidance for assessing whether a financial asset meets the solely payments of principal and interest criterion, add new disclosures for financial instruments with contractual terms that can change cash flows, and update the disclosure for equity investments designated at fair value through other comprehensive income (“FVTOCI”). The amendments are effective for annual reporting periods beginning on or after January 1, 2026. These amendments did not have a material impact on the Company’s condensed consolidated interim financial statements.
New Accounting Standards Issued But Not Yet Effective
Certain new accounting standards and interpretations have been published that are not mandatory for the current period and have not been early adopted.
IFRS 18 – Presentation and Disclosure in Financial Statements
In April 2024, IFRS 18 Presentation and Disclosure in Financial Statements (“IFRS 18”) was issued to achieve comparability of the financial performance of similar entities. The standard, which replaces IAS 1, impacts the presentation of primary financial statements and notes, including the statement of income where companies will be required to present separate categories of income and expense for operating, investing, and financing activities with prescribed subtotals for each new category. The standard will also require management-defined performance measures to be explained and included in a separate note within the consolidated financial statements. The standard is effective for annual reporting periods beginning on or after January 1, 2027, including interim financial statements, and requires retrospective application. The Company is currently assessing the impact of the new standard.
Franco-Nevada is authorized to issue an unlimited number of common and preferred shares. A detailed description of the rights, privileges, restrictions and conditions attached to each class of authorized shares is included in our most recent Annual Information Form, a copy of which can be found on SEDAR+ at www.sedarplus.com and in our Form 40-F, a copy of which can be found on EDGAR at www.sec.gov.
As of August 11, 2026, the number of common shares outstanding or issuable pursuant to other outstanding securities is as follows:
Common Shares | | Number | |
Outstanding |
| 192,873,810 | |
Issuable upon exercise of Franco-Nevada options(1) |
| 542,212 | |
Issuable upon vesting of Franco-Nevada RSUs(2) |
| 88,258 | |
Diluted common shares |
| 193,504,280 | |
| 1 | There were 542,212 stock options under our share compensation plan outstanding to directors, officers, employees and others with exercise prices ranging from C$75.45 to C$336.13 per share. The above table assumes all stock options are exercisable. |
| 2 | There were 26,777 time-based RSUs and 61,481 performance-based RSUs. Vesting of the performance-based RSUs is subject to the achievement of certain performance criteria and a performance multiplier which will range from 0% to 200% of the number granted. The above table assumes a performance multiplier of 100% of performance-based RSUs granted. |
During the six months ended June 30, 2026, we did not issue or have any outstanding preferred shares.
Second Quarter 2026 Management’s Discussion and Analysis | 29 |
Internal Control Over Financial Reporting and Disclosure Controls and Procedures
Our management is responsible for establishing and maintaining Franco-Nevada’s internal control over financial reporting and other financial disclosure and our disclosure controls and procedures.
Internal control over financial reporting is a process designed to provide reasonable assurance regarding the reliability of financial reporting and the preparation of financial statements for external purposes in accordance with IFRS Accounting Standards. Franco-Nevada’s internal control over financial reporting includes those policies and procedures that (i) pertain to the maintenance of records that, in reasonable detail, accurately and fairly reflect the transactions and dispositions of the assets of Franco-Nevada; (ii) are designed to provide reasonable assurance that transactions are recorded as necessary to permit preparation of financial statements in accordance with IFRS Accounting Standards, and that receipts and expenditures of Franco-Nevada are being made only in accordance with authorizations of management and directors of Franco-Nevada; and (iii) are designed to provide reasonable assurance regarding prevention or timely detection of unauthorized acquisition, use or disposition of Franco-Nevada’s assets that could have a material effect on Franco-Nevada’s financial statements. Internal control over other financial disclosure is a process designed to ensure that other financial information included in this Quarterly Report fairly represents, in all material respects, the financial condition, results of operations and cash flows of Franco-Nevada for the periods presented in this Quarterly Report.
Franco-Nevada’s disclosure controls and procedures are designed to provide reasonable assurance that material information relating to Franco-Nevada, including its consolidated subsidiaries, is made known to management by others within those entities, particularly during the period in which this Quarterly Report is prepared and that information required to be disclosed by Franco-Nevada in its annual filings, interim filings or other reports filed or submitted by it under securities legislation is recorded, processed, summarized and reported within the time periods specified in securities legislation.
Due to its inherent limitations, internal control over financial reporting and other financial disclosure may not prevent or detect all misstatements. Also, projections of any evaluation of effectiveness to future periods are subject to the risk that controls may become inadequate because of changes in conditions, or that the degree of compliance with the policies or procedures may change.
For the three and six months ended June 30, 2026, there has been no change in Franco-Nevada’s internal control over financial reporting that has materially affected, or is reasonably likely to materially affect, Franco-Nevada’s internal control over financial reporting.
Gold Equivalent Ounces and Net Gold Equivalent Ounces
Gold Equivalent Ounces
GEOs include Franco-Nevada’s attributable share of production from all of our royalties, streams and working interests, after applicable recovery and payability factors. GEOs are estimated on a gross basis for NSRs and, in the case of stream ounces, before the payment of the per ounce contractual price paid by the Company. For NPI royalties, GEOs are calculated taking into account the NPI economics. Where the Company receives gold and silver bullion as payment in-kind, GEOs are recognized at the time of receipt of such bullion.
Beginning in 2026, the Company adopted fixed GEO conversion ratios based on the pricing assumptions outlined in our guidance. This methodology replaces our previous methodology which was based on variable GEO conversion ratios using prevailing market prices.
Net Gold Equivalent Ounces
Net GEOs are GEOs sold, net of direct operating costs. We use Net GEOs to reflect that GEOs from royalty interests have different economics than GEOs from stream interests due to the ongoing cost per ounce associated with GEOs from streams. We calculate Net GEOs on a quarterly basis by dividing Cash Costs (as defined below in the “Non-GAAP Financial Measures” section) by the gold price used in the computation of GEOs, and subtracting this total from GEOs sold in the period.
Calculation of Net Gold Equivalent Ounces:
(expressed in millions, except GEOs and Average Gold Price) | | Q1 2026 | | | Q2 2026 | | | | For the six months ended June 30, 2026 | ||
GEOs | | | 136,353 | | | | 132,405 | | | | 268,758 |
Less: | | | | | | | | | | | |
Cash Costs | | $ | 46.5 | | | $ | 45.9 | | | $ | 92.4 |
Divided by: Average gold price per ounce | | $ | 4,500 | | | $ | 4,500 | | | $ | 4,500 |
| | | 10,333 | | | | 10,200 | | | | 20,533 |
Net GEOs | | | 126,020 | | | | 122,205 | | | | 248,225 |
Second Quarter 2026 Management’s Discussion and Analysis | 30 |
(expressed in millions, except GEOs and Average Gold Price) | | Q1 2025 | | | Q2 2025 | | | | For the six months ended June 30, 2025 | ||
GEOs | | | 126,585 | | | | 112,093 | | | | 238,678 |
Less: | | | | | | | | | | | |
Cash Costs | | $ | 38.5 | | | $ | 33.5 | | | $ | 72.0 |
Divided by: Average gold price per ounce | | $ | 2,863 | | | $ | 3,279 | | | $ | 3,043 |
| | | 13,447 | | | | 10,217 | | | | 23,664 |
Net GEOs | | | 113,138 | | | | 101,876 | | | | 215,014 |
Adjusted EBITDA and Adjusted EBITDA per Share
Adjusted EBITDA and Adjusted EBITDA per share are non-GAAP financial measures, which is defined by Franco-Nevada by excluding the following from net income and earnings per share (“EPS”):
| ● | Income tax expense/recovery; |
| ● | Finance expenses; |
| ● | Finance income; |
| ● | Depletion and depreciation; |
| ● | Impairment losses and reversals related to royalty, stream and working interests; |
| ● | Impairment losses and expected credit losses related to investments, loans receivable and other financial instruments; |
| ● | Gains on buy-backs of royalty and stream interests; |
| ● | Gains and losses on disposal of royalty, stream and working interests; |
| ● | Changes in fair value of equity investments, loans receivable and other financial instruments; and |
| ● | Foreign exchange gains/losses and other income/expenses. |
Management uses Adjusted EBITDA and Adjusted EBITDA per share to evaluate the underlying operating performance of Franco-Nevada as a whole for the reporting periods presented, to assist with the planning and forecasting of future operating results, and to supplement information in its financial statements. Management believes that in addition to measures prepared in accordance with IFRS Accounting Standards such as net income and EPS, our investors and analysts use Adjusted EBITDA and Adjusted EBITDA per share to evaluate the results of the underlying business of Franco-Nevada and its ability to generate liquidity by producing operating cash flow to fund working capital needs, service debt obligations and fund acquisitions. While the adjustments to net income and EPS in these measures include items that are both recurring and non-recurring, management believes that Adjusted EBITDA and Adjusted EBITDA per share are useful measures of Franco-Nevada’s performance because they adjust for items which may not relate to or have a disproportionate effect on the period in which they are recognized, impact the comparability of our core operating results from period to period, are not always reflective of the underlying operating performance of our business and/or are not necessarily indicative of future operating results. Adjusted EBITDA and Adjusted EBITDA per share are only intended to provide additional information to investors and analysts and should not be considered in isolation or as a substitute for measures of performance prepared in accordance with IFRS Accounting Standards. They do not have any standardized meaning under IFRS Accounting Standards and may not be comparable to similar measures presented by other issuers.
Reconciliation of Net Income to Adjusted EBITDA:
| | For the three months ended | | | For the six months ended |
| ||||||||||
| | June 30, | | | June 30, | | ||||||||||
(expressed in millions, except per share amounts) | | 2026 | | | 2025 | | | 2026 | | | 2025 | | ||||
Net income | | $ | 354.0 | | | $ | 247.1 | | | $ | 822.6 | | | $ | 456.9 | |
Income tax expense | |
| 104.9 | | | | 68.6 | | | | 231.2 | | | | 128.4 | |
Finance income | |
| (6.8) | | | | (6.6) | | | | (12.3) | | | | (17.7) | |
Finance expenses | |
| 0.7 | | | | 0.8 | | | | 1.5 | | | | 1.5 | |
Depletion and depreciation | |
| 84.0 | | | | 64.0 | | | | 161.9 | | | | 132.4 | |
Impairment reversal | |
| — | | | | (4.1) | | | | — | | | | (4.1) | |
Gain on buy-back of royalty and stream interests | | | — | | | | — | | | | (63.8) | | | | — | |
Foreign exchange gain and other income | |
| (7.1) | | | | (4.1) | | | | (19.5) | | | | (9.8) | |
Adjusted EBITDA | | $ | 529.7 | | | $ | 365.7 | | | $ | 1,121.6 | | | $ | 687.6 | |
Basic weighted average shares outstanding | |
| 192.9 | | |
| 192.7 | | |
| 192.8 | | |
| 192.6 | |
| | | | | | | | | | | | | | | | |
Basic earnings per share | | $ | 1.84 | | | $ | 1.28 | | | $ | 4.27 | | | $ | 2.37 | |
Income tax expense | |
| 0.54 | | | | 0.36 | | | | 1.20 | | | | 0.67 | |
Finance income | |
| (0.04) | | | | (0.03) | | | | (0.06) | | | | (0.09) | |
Finance expenses | |
| — | | | | — | | | | 0.01 | | | | 0.01 | |
Depletion and depreciation | |
| 0.44 | | | | 0.33 | | | | 0.84 | | | | 0.69 | |
Impairment reversal | |
| — | | | | (0.02) | | | | — | | | | (0.02) | |
Gain on buy-back of royalty and stream interests | | | — | | | | — | | | | (0.33) | | | | — | |
Foreign exchange gain and other income | |
| (0.03) | | |
| (0.02) | | | | (0.11) | | | | (0.06) | |
Adjusted EBITDA per share | | $ | 2.75 | | | $ | 1.90 | | | $ | 5.82 | | | $ | 3.57 | |
Second Quarter 2026 Management’s Discussion and Analysis | 31 |
Adjusted EBITDA Margin
Adjusted EBITDA Margin is a non-GAAP ratio which is defined by Franco-Nevada as Adjusted EBITDA divided by revenue. Management believes that in addition to measures prepared in accordance with IFRS Accounting Standards, our investors and analysts use Adjusted EBITDA Margin to evaluate the Company’s ability to contain costs relative to revenue. Adjusted EBITDA Margin is intended to provide additional information to investors and analysts and should not be considered in isolation or as a substitute for measures of performance prepared in accordance with IFRS Accounting Standards. It does not have any standardized meaning under IFRS Accounting Standards and may not be comparable to similar measures presented by other issuers.
Calculation of Adjusted EBITDA Margin:
| | For the three months ended | | | For the six months ended | |
| ||||||||||
| | June 30, | | | June 30, | |
| ||||||||||
(expressed in millions, except Adjusted EBITDA Margin) | | 2026 | | | 2025 | | | 2026 | | | 2025 | |
| ||||
Adjusted EBITDA | | $ | 529.7 | | | $ | 365.7 | | | $ | 1,121.6 | | | $ | 687.6 | | |
Divided by: Revenue | |
| 580.9 | | |
| 369.4 | | |
| 1,231.6 | | |
| 737.8 | | |
Adjusted EBITDA Margin | |
| 91.2 | % | |
| 99.0 | % | |
| 91.1 | % | |
| 93.2 | % | |
Adjusted Net Income and Adjusted Net Income per Share
Change in Composition of Adjusted Net Income – Gains on buy-backs of royalty and stream interests
Effective Q1 2026, the Company updated the composition of its Adjusted Net Income (and related per share and margin amounts) to no longer adjust for gains on contractual buy-backs of royalty and stream interests. Previously, gains on buy-backs were an adjusting item when calculating Adjusted Net Income (and related per share and margin amounts). Management continues to adjust for gains or losses on discretionary sales of mineral interests when calculating these non-GAAP measures. Management believes that this change more appropriately reflects the Company’s operating performance as contractual buy-backs are embedded in the terms of many of the Company’s royalty and stream interest agreements, such that they occur in the ordinary course and are an integral part of Franco-Nevada’s royalty and stream business. Unlike less common discretionary sales of mineral interests, these transactions are evaluated by management when assessing overall returns from our royalty and stream interests, and accordingly, we believe such gains should not be eliminated for purposes of calculating Adjusted Net Income and related per share amounts, when evaluating performance for investors. This change is reflected on a full retrospective basis.
Adjusted Net Income and Adjusted Net Income Per Share
Adjusted Net Income and Adjusted Net Income per share are non-GAAP financial measures, which are defined by Franco-Nevada by excluding the following from net income and EPS:
| ● | Foreign exchange gains/losses and other income/expenses; |
| ● | Impairment losses and reversals related to royalty, stream and working interests; |
| ● | Impairment losses and expected credit losses related to investments, loans receivable and other financial instruments; |
| ● | Gains and losses on disposal of royalty, stream and working interests (excluding gains on buy-backs of royalty and stream interests); |
| ● | Changes in fair value of equity investments, loans receivable and other financial instruments; |
| ● | Impact of income taxes on these items; |
| ● | Income taxes related to the reassessment of the probability of realization of previously recognized or de-recognized deferred income tax assets; and |
| ● | Income taxes relating to the revaluation of deferred income tax assets and liabilities as a result of statutory income tax rate changes in the countries in which the Company operates. |
Management uses Adjusted Net Income and Adjusted Net Income per share to evaluate the underlying operating performance of Franco-Nevada as a whole for the reporting periods presented, to assist with the planning and forecasting of future operating results, and to supplement information in its financial statements. Management believes that, in addition to measures prepared in accordance with IFRS Accounting Standards such as net income and EPS, our investors and analysts use Adjusted Net Income and Adjusted Net Income per share to evaluate the results of the underlying business of Franco-Nevada, particularly since the items that are adjusted for are typically not included in our guidance. While the adjustments to net income and EPS in these measures include items that are both recurring and non-recurring, management believes that Adjusted Net Income and Adjusted Net Income per share are useful measures of Franco-Nevada’s performance because they adjust for items which may not relate to or have a disproportionate effect on the period in which they are recognized, impact the comparability of our core operating results from period to period, are not always reflective of the underlying operating performance of our business and/or are not necessarily indicative of future operating results. Adjusted Net Income and Adjusted Net Income per share are intended to provide additional information to investors and analysts and should not be considered in isolation or as a substitute for measures of performance prepared in accordance with IFRS Accounting Standards. They do not have any standardized meaning under IFRS Accounting Standards and may not be comparable to similar measures presented by other issuers.
Second Quarter 2026 Management’s Discussion and Analysis | 32 |
Reconciliation of Net Income to Adjusted Net Income:
| | For the three months ended | | For the six months ended | | |||||||||||
| | June 30, | | | June 30, | | ||||||||||
(expressed in millions, except per share amounts) | | 2026 | | | 2025 | | | 2026 | | | 2025 | | ||||
Net income | | $ | 354.0 | | | $ | 247.1 | | | $ | 822.6 | | | $ | 456.9 | |
Impairment reversal | |
| — | | |
| (4.1) | | |
| — | | |
| (4.1) | |
Foreign exchange gain and other income | |
| (7.1) | | |
| (4.1) | | |
| (19.5) | | |
| (9.8) | |
Tax effect of adjustments | | | 2.3 | | | | (0.4) | | | | 4.4 | | | | 1.0 | |
Adjusted Net Income | | $ | 349.2 | | | $ | 238.5 | | | $ | 807.5 | | | $ | 444.0 | |
Basic weighted average shares outstanding | |
| 192.9 | | |
| 192.7 | | |
| 192.8 | | |
| 192.6 | |
| | | | | | | | | | | | | | | | |
Basic earnings per share | | $ | 1.84 | | | $ | 1.28 | | | $ | 4.27 | | | $ | 2.37 | |
Impairment reversal | | | — | | | | (0.02) | | | | — | | | | (0.02) | |
Foreign exchange gain and other income | |
| (0.04) | | |
| (0.02) | | |
| (0.10) | | |
| (0.05) | |
Tax effect of adjustments | | | 0.01 | | | | — | | | | 0.02 | | | | 0.01 | |
Adjusted Net Income per share | | $ | 1.81 | | | $ | 1.24 | | | $ | 4.19 | | | $ | 2.31 | |
Adjusted Net Income Margin
Adjusted Net Income Margin is a non-GAAP ratio which is defined by Franco-Nevada as Adjusted Net Income divided by revenue. Management believes that in addition to measures prepared in accordance with IFRS Accounting Standards, our investors and analysts use Adjusted Net Income Margin to evaluate the Company’s ability to contain costs relative to revenue. Adjusted Net Income Margin is intended to provide additional information to investors and analysts and should not be considered in isolation or as a substitute for measures of performance prepared in accordance with IFRS Accounting Standards. It does not have any standardized meaning under IFRS Accounting Standards and may not be comparable to similar measures presented by other issuers.
Calculation of Adjusted Net Income Margin:
| | For the three months ended | | | For the six months ended | |
| ||||||||||
| | June 30, | | | June 30, | |
| ||||||||||
(expressed in millions, except Adjusted Net Income Margin) | | 2026 | | | 2025 | | | 2026 | | | 2025 | |
| ||||
Adjusted Net Income | | $ | 349.2 | | | $ | 238.5 | | | $ | 807.5 | | | $ | 444.0 | | |
Divided by: Revenue | |
| 580.9 | | |
| 369.4 | | |
| 1,231.6 | | |
| 737.8 | | |
Adjusted Net Income Margin | |
| 60.1 | % | |
| 64.6 | % | |
| 65.6 | % | |
| 60.2 | % | |
Cash Costs and Cash Costs per GEO Sold
Cash Costs and Cash Costs per GEO sold are non-GAAP financial measures. Cash Costs is defined by Franco-Nevada as total costs of sales less depletion and depreciation expense. Cash Costs per GEO sold is calculated by dividing Cash Costs by the number of GEOs sold in the period, excluding prepaid GEOs.
Management uses Cash Costs and Cash Costs per GEO sold to evaluate Franco-Nevada’s ability to generate positive cash flow from its royalty, stream and working interests. Management and certain investors also use this information to evaluate Franco-Nevada’s performance relative to peers in the mining industry who present this measure on a similar basis. Cash Costs and Cash Costs per GEO sold are only intended to provide additional information to investors and analysts and should not be considered in isolation or as a substitute for measures of performance prepared in accordance with IFRS Accounting Standards. They do not have any standardized meaning under IFRS Accounting Standards and may not be comparable to similar measures presented by other issuers.
Reconciliation of Cash Costs and Cash Costs per GEO sold:
| | For the three months ended | | For the six months ended | |||||||||||
| | June 30, | | | June 30, | ||||||||||
(expressed in millions, except per GEO amounts) | | 2026 | | | 2025 | | | 2026 | | | 2025 | ||||
Total costs of sales | | $ | 129.9 | | | $ | 97.5 | | | $ | 254.3 | | | $ | 204.4 |
Depletion and depreciation | | | (84.0) | | | | (64.0) | | | | (161.9) | | | | (132.4) |
Cash Costs | | $ | 45.9 | | | $ | 33.5 | | | $ | 92.4 | | | $ | 72.0 |
Divided by: GEOs | |
| 132,405 | | |
| 112,093 | | |
| 268,758 | | |
| 238,678 |
Cash Costs per GEO sold | | $ | 347 | | | $ | 299 | | | $ | 344 | | | $ | 302 |
Second Quarter 2026 Management’s Discussion and Analysis | 33 |
Cautionary Statement on Forward-Looking Information
This MD&A contains “forward-looking information” and “forward-looking statements” within the meaning of applicable Canadian securities laws and the United States Private Securities Litigation Reform Act of 1995, respectively, which may include, but are not limited to, statements with respect to future events or future performance, management’s expectations regarding Franco-Nevada’s growth, results of operations, estimated future revenues, performance, guidance, carrying value of assets, future dividends and requirements for additional capital, mineral resources and mineral reserves estimates, production estimates, production costs and revenue, future demand for and prices of commodities, expected mining sequences, business prospects and opportunities, the performance and plans of third party operators, any ongoing or future audits being conducted by the CRA, the expected exposure for current and future tax assessments and available remedies, and statements with respect to the future status and any potential restart of the Cobre Panamá mine. In addition, statements relating to mineral resources and mineral reserves, GEOs or mine lives are forward-looking statements, as they involve implied assessment, based on certain estimates and assumptions, and no assurance can be given that the estimates and assumptions are accurate and that such mineral resources and mineral reserves, GEOs or mine lives will be realized. Such forward-looking statements reflect management’s current beliefs and are based on information currently available to management. Often, but not always, forward-looking statements can be identified by the use of words such as “plans”, “expects”, “is expected”, “budgets”, “potential for”, “scheduled”, “estimates”, “forecasts”, “predicts”, “projects”, “intends”, “targets”, “aims”, “anticipates” or “believes” or variations (including negative variations) of such words and phrases or may be identified by statements to the effect that certain actions “may”, “could”, “should”, “would”, “might” or “will” be taken, occur or be achieved. Forward-looking statements involve known and unknown risks, uncertainties and other factors, which may cause the actual results, performance or achievements of Franco-Nevada to be materially different from any future results, performance or achievements expressed or implied by the forward-looking statements. A number of factors could cause actual events or results to differ materially from any forward-looking statement, including, without limitation: fluctuations in the prices of the primary commodities that drive royalty and stream revenue (gold, platinum group metals, copper, nickel, silver, iron-ore and oil and gas); fluctuations in the value of the Canadian and Australian dollar, Brazilian real, Mexican peso and any other currency in which revenue is generated, relative to the U.S. dollar; changes in national and local government legislation, including permitting and licensing regimes and taxation policies and the enforcement thereof; tariff and other trade measures that may be imposed by the United States and proposed retaliatory measures that may be adopted by its trading partners; the adoption and implementation of a global minimum tax on corporations; regulatory, political or economic developments in any of the countries where properties in which Franco-Nevada holds a royalty, stream or other interest are located or through which they are held; risks related to the operators of the properties in which Franco-Nevada holds a royalty, stream or other interest, including changes in the ownership and control of such operators; relinquishment or sale of mineral properties; influence of macroeconomic developments; business opportunities that become available to, or are pursued by Franco-Nevada; reduced access to debt and equity capital; litigation; title, permit or license disputes related to interests on any of the properties in which Franco-Nevada holds a royalty, stream or other interest; whether or not the Company is determined to have “passive foreign investment company” (“PFIC”) status as defined in Section 1297 of the United States Internal Revenue Code of 1986, as amended; potential changes in Canadian tax treatment of offshore streams; excessive cost escalation as well as development, permitting, infrastructure, operating or technical difficulties on any of the properties in which Franco-Nevada holds a royalty, stream or other interest; access to sufficient pipeline capacity; actual mineral content may differ from the mineral resources and mineral reserves contained in technical reports; rate and timing of production differences from mineral resource estimates, other technical reports and mine plans; risks and hazards associated with the business of development and mining on any of the properties in which Franco-Nevada holds a royalty, stream or other interest, including, but not limited to unusual or unexpected geological and metallurgical conditions, slope failures or cave-ins, sinkholes, flooding and other natural disasters, terrorism, civil unrest or an outbreak of contagious disease; the impact of future pandemics; and the integration of acquired assets. The forward-looking statements contained herein are based upon assumptions management believes to be reasonable, including, without limitation: the ongoing operation of the properties in which Franco-Nevada holds a royalty, stream or other interest by the owners or operators of such properties in a manner consistent with past practice; the accuracy of public statements and disclosures made by the owners or operators of such underlying properties; no material adverse change in the market price of the commodities that underlie the asset portfolio; the Company’s ongoing income and assets relating to determination of its PFIC status; no material changes to existing tax treatment; the expected application of tax laws and regulations by taxation authorities; the expected assessment and outcome of any audit by any taxation authority; no adverse development in respect of any significant property in which Franco-Nevada holds a royalty, stream or other interest; the accuracy of publicly disclosed expectations for the development of underlying properties that are not yet in production; integration of acquired assets; and the absence of any other factors that could cause actions, events or results to differ from those anticipated, estimated or intended. However, there can be no assurance that forward-looking statements will prove to be accurate, as actual results and future events could differ materially from those anticipated in such statements. Investors are cautioned that forward-looking statements are not guarantees of future performance. In addition, there can be no assurance as to (i) the outcome of any ongoing or future audits by the CRA or the Company’s exposure as a result thereof, or (ii) the future status and any potential restart of the Cobre Panamá mine. Franco-Nevada cannot assure investors that actual results will be consistent with these forward-looking statements. Accordingly, investors should not place undue reliance on forward-looking statements due to the inherent uncertainty therein.
For additional information with respect to risks, uncertainties and assumptions, please refer to Franco-Nevada’s most recent Annual Information Form filed with the Canadian securities regulatory authorities on www.sedarplus.com and Franco-Nevada’s most recent Annual Report filed on Form 40-F filed with the SEC on www.sec.gov. The forward-looking statements herein are made as of the date hereof only and Franco-Nevada does not assume any obligation to update or revise them to reflect new information, estimates or opinions, future events or results or otherwise, except as required by applicable law.
Second Quarter 2026 Management’s Discussion and Analysis | 34 |