Please wait
FORM 6-K
U.S. SECURITIES AND EXCHANGE COMMISSION
Washington, D.C. 20549
Report of Foreign Private Issuer
Pursuant to Rule 13a-16 or 15d-16 of
the Securities Exchange Act of 1934
Commission File Number:
333-163336
For the month of December 2010.
NKSJ Holdings, Inc.
(Translation of registrant’s name into English)
26-1,
Nishi-Shinjuku 1-chome
Shinjuku-ku, Tokyo 160-8338
Japan
(Address of principal executive offices)
Indicate by
check mark whether the registrant files or will file annual reports under cover Form 20-F or Form 40-F.
Form
20-F X Form 40-F
Indicate by check mark if the registrant is submitting the Form 6-K in paper as permitted by Regulation S-T Rule
101(b)(1):
Indicate by
check mark if the registrant is submitting the Form 6-K in paper as permitted by Regulation S-T Rule 101(b)(7):
Indicate by check mark whether by furnishing the information contained in this Form, the registrant is also thereby furnishing the
information to the Commission pursuant to Rule 12g3-2(b) under the Securities Exchange Act of 1934.
Yes
No X
If “Yes” is marked, indicate below
the file number assigned to the registrant in connection with Rule 12g3-2(b): 82-
Information furnished on this form:
Table of Contents
Summary of Consolidated Financial Results for the six months ended September 30, 2010
Summary of Consolidated Financial Results for the six months ended September 30, 2010
(Supplementary Information)
Quarterly Securities Report for the Three Months Ended September 30, 2010
SIGNATURES
Pursuant to the requirements of the Securities Exchange Act of 1934, the registrant has duly caused this report to be signed on its behalf by the undersigned, thereunto duly authorized.
|
|
|
|
|
|
|
|
|
| |
|
|
|
NKSJ Holdings, Inc. |
|
|
| Date: December 3, 2010 |
|
|
|
|
|
|
|
|
|
|
|
|
By: |
|
/S/ HIROHISA
KURUMIDA |
|
|
|
|
|
|
|
|
Hirohisa Kurumida |
|
|
|
|
|
|
|
|
Manager of Corporate Legal Department |
|
|
[Translation]
Summary of Consolidated Financial Results for the six months ended September 30, 2010
UNOFFICIAL TRANSLATION
This document is an unofficial English translation of the Japanese original.
November 19, 2010
NKSJ Holdings, Inc.
Summary of Consolidated Financial Results for the
six months ended September 30, 2010
[under Japanese GAAP]
|
|
|
| Company Name: |
|
NKSJ Holdings, Inc. |
| Listed on: |
|
Tokyo and Osaka Stock Exchange |
| Stock Code Number: |
|
8630 |
| URL: |
|
http://www.nksj-hd.com/ |
| Representative Director: |
|
Masatoshi Sato, President & CEO |
| Contact: |
|
Kazuhisa Tamura, Manager, Accounting Department |
|
|
|
|
|
|
|
|
|
|
|
|
|
| Scheduled date to file Quarterly Securities Report: |
|
November 26, 2010 |
|
|
|
|
|
|
|
|
|
|
| Scheduled date to start payment of dividends: |
|
——— |
|
|
|
|
|
|
|
|
|
|
| Supplementary information for quarterly financial statements: |
|
Yes |
|
|
|
|
|
|
|
|
|
|
| Schedule for quarterly investor meeting: |
|
Yes (for institutional investors and analysts) |
|
|
|
|
|
|
|
|
|
|
Note) Any amounts less than one million yen are rounded down, unless otherwise noted.
| 1. |
Consolidated Financial Results for the six months ended September 30, 2010 (April 1 to September 30, 2010) |
| (1) |
Consolidated Results of Operations |
Note) The percentages are changes from corresponding period of previous fiscal year.
|
|
|
|
|
|
|
|
|
|
|
|
|
|
|
|
|
|
|
|
|
|
|
|
|
| |
|
Ordinary income |
|
|
Ordinary profit |
|
|
Net income |
|
| |
|
millions of yen |
|
|
% |
|
|
millions of yen |
|
|
% |
|
|
millions of yen |
|
|
% |
|
| Six months ended September 30, 2010 |
|
|
1,329,799 |
|
|
|
— |
|
|
|
38,888 |
|
|
|
— |
|
|
|
24,116 |
|
|
|
— |
|
| Six months ended September 30, 2009 |
|
|
— |
|
|
|
— |
|
|
|
— |
|
|
|
— |
|
|
|
— |
|
|
|
— |
|
|
|
|
|
|
|
|
|
|
| |
|
Net income
per share |
|
|
Diluted net income
per share |
|
| |
|
yen |
|
|
yen |
|
| Six months ended September 30, 2010 |
|
|
14.52 |
|
|
|
14.50 |
|
| Six months ended September 30, 2009 |
|
|
— |
|
|
|
— |
|
| (2) |
Consolidated Financial Conditions |
|
|
|
|
|
|
|
|
|
|
|
|
|
|
|
|
|
| |
|
Total assets |
|
|
Total net assets |
|
|
Equity ratio |
|
|
Total net assets
per share |
|
| |
|
millions of yen |
|
|
millions of yen |
|
|
% |
|
|
yen |
|
| As of September 30, 2010 |
|
|
9,026,824 |
|
|
|
1,122,876 |
|
|
|
12.4 |
|
|
|
673.01 |
|
| As of March 31, 2010 |
|
|
— |
|
|
|
— |
|
|
|
— |
|
|
|
— |
|
|
|
|
|
|
| Reference) Equity capital: |
|
As of September 30, 2010 |
|
1,117,540 million yen |
|
|
As of March 31, 2010 |
|
— million yen |
|
|
|
|
|
|
|
|
|
|
|
|
|
|
|
|
|
|
|
|
|
| |
|
Dividends per share |
|
| |
|
First
quarter-end |
|
|
Second
quarter-end |
|
|
Third
quarter-end |
|
|
Fiscal
year-end |
|
|
Annual |
|
| |
|
yen |
|
|
yen |
|
|
yen |
|
|
yen |
|
|
yen |
|
| Fiscal year ended March 31, 2010 |
|
|
— |
|
|
|
— |
|
|
|
— |
|
|
|
— |
|
|
|
— |
|
| Fiscal year ending March 31, 2011 |
|
|
— |
|
|
|
— |
|
|
|
|
|
|
|
|
|
|
|
|
|
| Fiscal year ending March 31, 2011 (Forecast) |
|
|
|
|
|
|
|
|
|
|
— |
|
|
|
20.00 |
|
|
|
20.00 |
|
| Note) Revision |
to the forecasts for dividends during the second quarter: None |
| 3. |
Consolidated Forecasts for the fiscal year ending March 31, 2011 (April 1, 2010 to March 31, 2011) |
Note) The percentages are changes from corresponding period of previous fiscal year.
|
|
|
|
|
|
|
|
|
|
|
|
|
|
|
|
|
|
|
|
|
|
|
|
|
|
|
|
|
| |
|
Ordinary income |
|
|
Ordinary profit |
|
|
Net income |
|
|
Net income
per share |
|
| |
|
millions of yen |
|
|
% |
|
|
millions of yen |
|
|
% |
|
|
millions of yen |
|
|
% |
|
|
yen |
|
| Fiscal year ending March 31, 2011 (April 1, 2010 to March 31, 2011) |
|
|
2,625,000 |
|
|
|
— |
|
|
|
48,000 |
|
|
|
— |
|
|
|
25,000 |
|
|
|
— |
|
|
|
15.05 |
|
| Note) |
Revision to the forecasts for the fiscal year during the second quarter: Yes |
| Note) |
Please refer to “Other Information” on page 3 for details. |
| (1) |
Changes in significant subsidiaries during the six months ended September 30, 2010: None |
Note) The above shows changes in specified subsidiaries resulting in the change in the scope of
consolidation during the six months ended September 30, 2010.
| (2) |
Changes in accounting policies, procedures and methods of presentation |
|
|
|
| Changes due to revisions to accounting standards: |
|
None |
|
|
| ‚ Changes due to other reasons: |
|
None |
| |
Note) |
The above shows changes which are shown in “Changes in significant accounting policies for the preparation of the interim consolidated financial statements”.
|
| (3) |
Number of shares outstanding (Common stock) : |
|
|
|
|
|
|
|
|
|
Total shares outstanding including treasury stock: |
|
|
|
|
|
|
|
|
|
As of September 30, 2010 |
|
|
1,661,409,178 shares |
|
|
|
|
|
|
As of March 31, 2010 |
|
|
— shares |
|
|
|
|
|
|
‚ Treasury stock: |
|
|
|
|
|
|
|
|
|
As of September 30, 2010 |
|
|
907,549 shares |
|
|
|
|
|
|
As of March 31, 2010 |
|
|
— shares |
|
|
|
|
|
|
ƒ Average number of shares outstanding: |
|
|
|
|
|
|
|
|
|
For the six months ended September 30,
2010 |
|
|
1,660,781,785 shares |
|
|
|
|
|
|
For the six months ended September 30,
2009 |
|
|
— shares |
|
(Summary of Non-consolidated Financial Results)
| 1. |
Non-consolidated Financial Results for the six months ended September 30, 2010 (April 1 to September 30, 2010) |
| (1) |
Non-consolidated Results of Operations |
Note) The percentages are changes from corresponding period of previous fiscal year.
|
|
|
|
|
|
|
|
|
|
|
|
|
|
|
|
|
|
|
|
|
|
|
|
|
|
|
|
|
|
|
|
|
| |
|
Operating income |
|
|
Operating profit |
|
|
Ordinary profit |
|
|
Net income |
|
| |
|
millions of yen |
|
|
% |
|
|
millions of yen |
|
|
% |
|
|
millions of yen |
|
|
% |
|
|
millions of yen |
|
|
% |
|
| Six months ended September 30, 2010 |
|
|
2,423 |
|
|
|
— |
|
|
|
1,187 |
|
|
|
— |
|
|
|
478 |
|
|
|
— |
|
|
|
476 |
|
|
|
— |
|
| Six months ended September 30, 2009 |
|
|
— |
|
|
|
— |
|
|
|
— |
|
|
|
— |
|
|
|
— |
|
|
|
— |
|
|
|
— |
|
|
|
— |
|
|
|
|
|
|
| |
|
Net income per share |
|
| |
|
yen |
|
| Six months ended September 30, 2010 |
|
|
0.28 |
|
| Six months ended September 30, 2009 |
|
|
— |
|
| (2) |
Non-consolidated Financial Conditions |
|
|
|
|
|
|
|
|
|
|
|
|
|
|
|
|
|
| |
|
Total assets |
|
|
Total net assets |
|
|
Equity ratio |
|
|
Total net assets
per share |
|
| |
|
millions of yen |
|
|
millions of yen |
|
|
% |
|
|
yen |
|
| As of September 30, 2010 |
|
|
881,652 |
|
|
|
879,217 |
|
|
|
99.5 |
|
|
|
528.06 |
|
| As of March 31, 2010 |
|
|
— |
|
|
|
— |
|
|
|
— |
|
|
|
— |
|
|
|
|
|
|
| Reference) Equity capital: |
|
As of September 30, 2010 |
|
876,854 million yen |
|
|
As of March 31, 2010 |
|
— million yen |
(Disclosure regarding the execution of the interim audit process)
This summary is
outside the scope of the interim audit procedure which is required by “Financial Instruments and Exchange Act”. The interim audit process of the interim consolidated financial statements and the interim non-consolidated financial
statements was not completed as of the date of the disclosure of this summary.
(Notes for using forecasted information etc.)
The forecasts included in this document are based on the currently available information and certain assumptions that we believe
reasonable. Accordingly, the actual results may differ materially from those projected herein depending on various factors.
For assumptions underlying the forecasts and notes for using forecasted information, please refer to “Qualitative information related
to the consolidated forecasts” on page 2 and “Note Regarding Forward-looking Statements” on page 21.
Non-consolidated forecasts for the fiscal year ending March 31, 2011 (April 1, 2010 to March 31, 2011) are not disclosed.
NKSJ Holdings, Inc. prepares the interim consolidated financial statements and the interim non-consolidated financial
statements for the six months ended September 30, 2010, since it conducts business defined in the provision of Article 17-15 Paragraph 2 of the Cabinet Office Ordinance on Disclosure of Corporate Information, etc.
NKSJ Holdings, Inc. was established on April 1, 2010 as a holding company of Sompo Japan Insurance Inc. and NIPPONKOA Insurance Co.,
Ltd. This consolidated fiscal year is the first period, so there are no results for the fiscal year ended March 31, 2010 and the six months ended September 30, 2009.
Contents
1
| 1. |
Qualitative Information related to the Consolidated Financial Results for the six months ended September 30, 2010 |
| (1) |
Qualitative information related to the consolidated results of operations |
During the six months ended September 30, 2010, the Japanese economy continued facing severe difficulties, with high unemployment rate and growing risk of an economic downturn due to fluctuations in
exchange rates and stock prices, even though corporate earnings and consumer spending improved because of recovery in overseas economies, mainly in Asia, and the effect of various fiscal stimulus measures.
Under such conditions, the consolidated results of operations for the six months ended September 30, 2010 are as follows.
1,261.3 billion yen of underwriting income, 63.2 billion yen of investment income and 5.1 billion yen of other ordinary income resulted in
1,329.7 billion yen of ordinary income. In contrast, 1,048.0 billion yen of underwriting expenses, 24.9 billion yen of investment expenses, 212.0 billion yen of operating, general and administrative expenses and 5.9 billion yen of other ordinary
expenses resulted in 1,290.9 billion yen of ordinary expenses.
As a result, ordinary profit amounted to 38.8 billion yen. Net
income after extraordinary items, net of total income taxes and non-controlling interests, resulted in 24.1 billion yen.
The
information by reportable segments for the six months ended September 30, 2010 was as follows.
| |
(a) |
Property and casualty insurance business |
In property and casualty insurance business, net premiums written amounted to 987.8 billion yen and net income amounted to 27.6 billion yen.
| |
(b) |
Life insurance business |
In life
insurance business, life insurance premiums written amounted to 108.9 billion yen and net loss amounted to 2.3 billion yen.
| (2) |
Qualitative information related to the consolidated financial conditions |
As of September 30, 2010, the total assets amounted to 9,026.8 billion yen and the total net assets amounted to 1,122.8 billion yen.
| (3) |
Qualitative information related to the consolidated forecasts |
We forecast 2,625.0 billion yen of consolidated ordinary income, 48.0 billion yen of consolidated ordinary profit and 25.0 billion yen of consolidated net profit for the fiscal year ending March 31,
2011. Our assumptions relating to insurance underwriting are based on an extrapolation from past trends, while we have allowed for 11.5 billion yen in net claims paid due to natural disasters. Our forecasts relating to asset investment performance
assume that market interest rates, exchange rates and stock prices remain at or near their levels as of end-September 2010.
2
| (1) |
Summary of changes in significant subsidiaries |
None.
| (2) |
Summary of changes in accounting policies, procedures and methods of presentation |
NKSJ Holdings, Inc. is a sole parent company of Sompo Japan Insurance Inc. and NIPPONKOA Insurance Co., Ltd. established through share exchange on April 1, 2010. This consolidated fiscal year is the
first period, so there is no change in accounting policies, procedures and methods of presentation.
3
| 3. |
Interim Consolidated Financial Statements |
| (1) |
Interim Consolidated Balance Sheets |
|
|
|
|
|
| |
|
(Millions of yen) |
|
| |
|
As of September 30, 2010 |
|
| Assets: |
|
|
|
|
| Cash and deposits |
|
|
270,872 |
|
| Call loans |
|
|
98,497 |
|
| Receivables under resale agreements |
|
|
82,982 |
|
| Receivables under securities borrowing transactions |
|
|
27,146 |
|
| Monetary receivables bought |
|
|
37,253 |
|
| Money trusts |
|
|
84,648 |
|
| Securities |
|
|
6,511,189 |
|
| Loans |
|
|
713,053 |
|
| Tangible fixed assets |
|
|
362,176 |
|
| Intangible fixed assets |
|
|
31,566 |
|
| Other assets |
|
|
571,200 |
|
| Deferred tax assets |
|
|
242,078 |
|
| Allowance for possible loan losses |
|
|
(5,839 |
) |
|
|
|
|
|
| Total assets |
|
|
9,026,824 |
|
|
|
|
|
|
| Liabilities: |
|
|
|
|
| Underwriting funds: |
|
|
7,352,175 |
|
| Reserve for outstanding losses and claims |
|
|
993,986 |
|
| Underwriting reserves |
|
|
6,358,188 |
|
| Bonds |
|
|
128,000 |
|
| Other liabilities |
|
|
269,655 |
|
| Reserve for retirement benefits |
|
|
106,503 |
|
| Reserve for retirement benefits to directors |
|
|
113 |
|
| Reserve for bonus payments |
|
|
25,510 |
|
| Reserves under the special laws: |
|
|
21,336 |
|
| Reserve for price fluctuation |
|
|
21,336 |
|
| Deferred tax liabilities |
|
|
654 |
|
|
|
|
|
|
| Total liabilities |
|
|
7,903,947 |
|
|
|
|
|
|
| Net assets: |
|
|
|
|
| Shareholders’ equity: |
|
|
|
|
| Common stock |
|
|
100,045 |
|
| Capital surplus |
|
|
438,555 |
|
| Retained earnings |
|
|
335,209 |
|
| Treasury stock |
|
|
(527 |
) |
|
|
|
|
|
| Total shareholders’ equity |
|
|
873,282 |
|
|
|
|
|
|
| Valuation and translation adjustments: |
|
|
|
|
| Unrealized gains on securities available for sale, net of tax |
|
|
266,889 |
|
| Deferred gains on hedges |
|
|
5,330 |
|
| Foreign currency translation adjustments |
|
|
(27,962 |
) |
|
|
|
|
|
| Total valuation and translation adjustments |
|
|
244,258 |
|
|
|
|
|
|
| Stock acquisition rights |
|
|
2,362 |
|
| Non-controlling interests |
|
|
2,973 |
|
|
|
|
|
|
| Total net assets |
|
|
1,122,876 |
|
|
|
|
|
|
| Total liabilities and net assets |
|
|
9,026,824 |
|
|
|
|
|
|
4
| (2) |
Interim Consolidated Statements of Income |
|
|
|
|
|
| |
|
(Millions of yen) |
|
| |
|
Six months ended
September 30, 2010
(April 1 to September
30, 2010) |
|
| Ordinary income: |
|
|
1,329,799 |
|
| Underwriting income: |
|
|
1,261,384 |
|
| Net premiums written |
|
|
987,832 |
|
| Deposits of premiums by policyholders |
|
|
79,398 |
|
| Interest and dividend income on deposits of premiums, etc. |
|
|
30,061 |
|
| Life insurance premiums written |
|
|
108,905 |
|
| Reversal of reserve for outstanding losses and claims |
|
|
35,643 |
|
| Reversal of underwriting reserves |
|
|
16,454 |
|
| Investment income: |
|
|
63,222 |
|
| Interest and dividend income |
|
|
78,453 |
|
| Investment gains on money trusts |
|
|
896 |
|
| Investment gains on trading securities |
|
|
67 |
|
| Gains on sales of securities |
|
|
5,839 |
|
| Transfer of interest and dividend income on deposits of premiums, etc. |
|
|
(30,061 |
) |
| Other ordinary income |
|
|
5,191 |
|
| Ordinary expenses: |
|
|
1,290,910 |
|
| Underwriting expenses: |
|
|
1,048,058 |
|
| Net claims paid |
|
|
607,279 |
|
| Loss adjustment expenses |
|
|
65,449 |
|
| Net commissions and brokerage fees |
|
|
176,065 |
|
| Maturity refunds to policyholders |
|
|
165,853 |
|
| Life insurance claims paid |
|
|
28,735 |
|
| Investment expenses: |
|
|
24,913 |
|
| Investment losses on money trusts |
|
|
581 |
|
| Losses on sales of securities |
|
|
2,201 |
|
| Impairment losses on securities |
|
|
6,827 |
|
| Operating, general and administrative expenses |
|
|
212,008 |
|
| Other ordinary expenses: |
|
|
5,929 |
|
| Interest paid |
|
|
3,619 |
|
|
|
|
|
|
| Ordinary profit |
|
|
38,888 |
|
|
|
|
|
|
| Extraordinary gains: |
|
|
2,015 |
|
| Gains on disposal of fixed assets |
|
|
79 |
|
| Gains on negative goodwill |
|
|
149 |
|
| Other extraordinary gains |
|
|
1,785 |
|
| Extraordinary losses: |
|
|
4,923 |
|
| Losses on disposal of fixed assets |
|
|
324 |
|
| Impairment losses |
|
|
662 |
|
| Provision for reserves under the special laws: |
|
|
2,843 |
|
| Provision for reserve for price fluctuation |
|
|
2,843 |
|
| Other extraordinary losses |
|
|
1,093 |
|
|
|
|
|
|
| Income before income taxes and non-controlling interests |
|
|
35,980 |
|
|
|
|
|
|
| Income taxes |
|
|
2,793 |
|
| Deferred income taxes |
|
|
9,250 |
|
|
|
|
|
|
| Total income taxes |
|
|
12,043 |
|
|
|
|
|
|
| Income before non-controlling interests |
|
|
23,936 |
|
|
|
|
|
|
| Non-controlling interests |
|
|
(180 |
) |
|
|
|
|
|
| Net income |
|
|
24,116 |
|
|
|
|
|
|
5
| (3) |
Interim Consolidated Statements of Changes in Net Assets |
|
|
|
|
|
| |
|
(Millions of yen) |
|
| |
|
Six months ended
September 30, 2010
(April 1 to September 30, 2010) |
|
| Shareholders’ equity: |
|
|
|
|
| Common stock: |
|
|
|
|
| Balance at the beginning of the period |
|
|
70,000 |
|
| Changes during the period |
|
|
|
|
| Issuance of new stocks—exercise of stock acquisition rights |
|
|
45 |
|
| Increase due to share exchange |
|
|
30,000 |
|
|
|
|
|
|
| Total changes during the period |
|
|
30,045 |
|
|
|
|
|
|
| Balance at the end of the period |
|
|
100,045 |
|
|
|
|
|
|
| Capital surplus: |
|
|
|
|
| Balance at the beginning of the period |
|
|
24,229 |
|
| Changes during the period |
|
|
|
|
| Issuance of new stocks—exercise of stock acquisition rights |
|
|
45 |
|
| Disposal of treasury stock |
|
|
31 |
|
| Increase due to share exchange |
|
|
414,248 |
|
|
|
|
|
|
| Total changes during the period |
|
|
414,325 |
|
|
|
|
|
|
| Balance at the end of the period |
|
|
438,555 |
|
|
|
|
|
|
| Retained earnings: |
|
|
|
|
| Balance at the beginning of the period |
|
|
336,793 |
|
| Changes during the period |
|
|
|
|
| Dividends |
|
|
(25,700 |
) |
| Net income |
|
|
24,116 |
|
|
|
|
|
|
| Total changes during the period |
|
|
(1,584 |
) |
|
|
|
|
|
| Balance at the end of the period |
|
|
335,209 |
|
|
|
|
|
|
| Treasury stock: |
|
|
|
|
| Balance at the beginning of the period |
|
|
— |
|
| Changes during the period |
|
|
|
|
| Acquisition of treasury stock |
|
|
(708 |
) |
| Disposal of treasury stock |
|
|
180 |
|
|
|
|
|
|
| Total changes during the period |
|
|
(527 |
) |
|
|
|
|
|
| Balance at the end of the period |
|
|
(527 |
) |
|
|
|
|
|
| Total shareholders’ equity: |
|
|
|
|
| Balance at the beginning of the period |
|
|
431,023 |
|
| Changes during the period |
|
|
|
|
| Issuance of new stocks—exercise of stock acquisition rights |
|
|
91 |
|
| Dividends |
|
|
(25,700 |
) |
| Net income |
|
|
24,116 |
|
| Acquisition of treasury stock |
|
|
(708 |
) |
| Disposal of treasury stock |
|
|
212 |
|
| Increase due to share exchange |
|
|
444,248 |
|
|
|
|
|
|
| Total changes during the period |
|
|
442,259 |
|
|
|
|
|
|
| Balance at the end of the period |
|
|
873,282 |
|
|
|
|
|
|
6
|
|
|
|
|
| |
|
(Millions of yen) |
|
| |
|
Six months ended
September 30, 2010
(April 1 to September 30, 2010) |
|
| Valuation and translation adjustments: |
|
|
|
|
| Unrealized gains on securities available for sale, net of tax: |
|
|
|
|
| Balance at the beginning of the period |
|
|
389,352 |
|
| Changes during the period |
|
|
|
|
| Net changes in items other than shareholders’ equity |
|
|
(122,463 |
) |
|
|
|
|
|
| Total changes during the period |
|
|
(122,463 |
) |
|
|
|
|
|
| Balance at the end of the period |
|
|
266,889 |
|
|
|
|
|
|
| Deferred gains on hedges |
|
|
|
|
| Balance at the beginning of the period |
|
|
— |
|
| Changes during the period |
|
|
|
|
| Net changes in items other than shareholders’ equity |
|
|
5,330 |
|
|
|
|
|
|
| Total changes during the period |
|
|
5,330 |
|
|
|
|
|
|
| Balance at the end of the period |
|
|
5,330 |
|
|
|
|
|
|
| Foreign currency translation adjustments: |
|
|
|
|
| Balance at the beginning of the period |
|
|
(21,674 |
) |
| Changes during the period |
|
|
|
|
| Net changes in items other than shareholders’ equity |
|
|
(6,287 |
) |
|
|
|
|
|
| Total changes during the period |
|
|
(6,287 |
) |
|
|
|
|
|
| Balance at the end of the period |
|
|
(27,962 |
) |
|
|
|
|
|
| Total valuation and translation adjustments: |
|
|
|
|
| Balance at the beginning of the period |
|
|
367,678 |
|
| Changes during the period |
|
|
|
|
| Net changes in items other than shareholders’ equity |
|
|
(123,420 |
) |
|
|
|
|
|
| Total changes during the period |
|
|
(123,420 |
) |
|
|
|
|
|
| Balance at the end of the period |
|
|
244,258 |
|
|
|
|
|
|
| Stock acquisition rights: |
|
|
|
|
| Balance at the beginning of the period |
|
|
1,302 |
|
| Changes during the period |
|
|
|
|
| Net changes in items other than shareholders’ equity |
|
|
1,059 |
|
|
|
|
|
|
| Total changes during the period |
|
|
1,059 |
|
|
|
|
|
|
| Balance at the end of the period |
|
|
2,362 |
|
|
|
|
|
|
| Non-controlling interests: |
|
|
|
|
| Balance at the beginning of the period |
|
|
2,839 |
|
| Changes during the period |
|
|
|
|
| Net changes in items other than shareholders’ equity |
|
|
133 |
|
|
|
|
|
|
| Total changes during the period |
|
|
133 |
|
|
|
|
|
|
| Balance at the end of the period |
|
|
2,973 |
|
|
|
|
|
|
7
|
|
|
|
|
| |
|
(Millions of yen) |
|
| |
|
Six months ended
September 30, 2010
(April 1 to September 30, 2010) |
|
| Total net assets: |
|
|
|
|
| Balance at the beginning of the period |
|
|
802,843 |
|
| Changes during the period |
|
|
|
|
| Issuance of new stocks—exercise of stock acquisition rights |
|
|
91 |
|
| Dividends |
|
|
(25,700 |
) |
| Net income |
|
|
24,116 |
|
| Acquisition of treasury stock |
|
|
(708 |
) |
| Disposal of treasury stock |
|
|
212 |
|
| Increase due to share exchange |
|
|
444,248 |
|
| Net changes in items other than shareholders’ equity |
|
|
(122,226 |
) |
|
|
|
|
|
| Total changes during the period |
|
|
320,032 |
|
|
|
|
|
|
| Balance at the end of the period |
|
|
1,122,876 |
|
|
|
|
|
|
8
| (4) |
Notes on Going-Concern Assumption |
None.
As of September 30, 2010
| 1. |
Bonds held to maturity |
|
|
|
|
|
|
|
|
|
|
|
|
|
| |
|
(Millions of yen) |
|
| |
|
Carrying amount
on balance sheet |
|
|
Fair value |
|
|
Unrealized
gains
(losses) |
|
| Securities whose fair value exceeds their carrying amount on balance sheet |
|
|
|
|
|
|
|
|
|
|
|
|
| Domestic bonds |
|
|
1,074,635 |
|
|
|
1,153,057 |
|
|
|
78,421 |
|
| Foreign securities |
|
|
46,701 |
|
|
|
47,441 |
|
|
|
740 |
|
|
|
|
|
|
|
|
|
|
|
|
|
|
| Subtotal |
|
|
1,121,337 |
|
|
|
1,200,499 |
|
|
|
79,161 |
|
|
|
|
|
|
|
|
|
|
|
|
|
|
| Securities whose fair value doesn’t exceed their carrying amount on balance sheet |
|
|
|
|
|
|
|
|
|
|
|
|
| Domestic bonds |
|
|
2,291 |
|
|
|
2,227 |
|
|
|
(64 |
) |
| Foreign securities |
|
|
24,336 |
|
|
|
24,203 |
|
|
|
(133 |
) |
|
|
|
|
|
|
|
|
|
|
|
|
|
| Subtotal |
|
|
26,628 |
|
|
|
26,430 |
|
|
|
(197 |
) |
|
|
|
|
|
|
|
|
|
|
|
|
|
| Total |
|
|
1,147,965 |
|
|
|
1,226,930 |
|
|
|
78,964 |
|
|
|
|
|
|
|
|
|
|
|
|
|
|
| 2. |
Policy reserve matching bonds |
|
|
|
|
|
|
|
|
|
|
|
|
|
| |
|
(Millions of yen) |
|
| |
|
Carrying amount
on balance sheet |
|
|
Fair value |
|
|
Unrealized
gains
(losses) |
|
| Securities whose fair value exceeds their carrying amount on balance sheet |
|
|
|
|
|
|
|
|
|
|
|
|
| Domestic bonds |
|
|
12,079 |
|
|
|
12,872 |
|
|
|
792 |
|
|
|
|
|
|
|
|
|
|
|
|
|
|
| Securities whose fair value doesn’t exceed their carrying amount on balance sheet |
|
|
|
|
|
|
|
|
|
|
|
|
| Domestic bonds |
|
|
— |
|
|
|
— |
|
|
|
— |
|
|
|
|
|
|
|
|
|
|
|
|
|
|
| Total |
|
|
12,079 |
|
|
|
12,872 |
|
|
|
792 |
|
|
|
|
|
|
|
|
|
|
|
|
|
|
| 3. |
Securities available for sale |
|
|
|
|
|
|
|
|
|
|
|
|
|
| |
|
(Millions of yen) |
|
| |
Carrying amount
on balance sheet |
|
|
Cost |
|
|
Unrealized
gains
(losses) |
|
| Securities whose carrying amount on balance sheet exceeds their cost |
|
|
|
|
|
|
|
|
|
|
|
|
| Domestic bonds |
|
|
2,486,904 |
|
|
|
2,390,706 |
|
|
|
96,197 |
|
| Domestic stocks |
|
|
913,245 |
|
|
|
463,232 |
|
|
|
450,012 |
|
| Foreign securities |
|
|
524,338 |
|
|
|
487,609 |
|
|
|
36,728 |
|
| Others |
|
|
69,030 |
|
|
|
64,353 |
|
|
|
4,677 |
|
|
|
|
|
|
|
|
|
|
|
|
|
|
| Subtotal |
|
|
3,993,518 |
|
|
|
3,405,901 |
|
|
|
587,617 |
|
|
|
|
|
|
|
|
|
|
|
|
|
|
| Securities whose carrying amount on balance sheet doesn’t exceed their cost |
|
|
|
|
|
|
|
|
|
|
|
|
| Domestic bonds |
|
|
55,228 |
|
|
|
55,943 |
|
|
|
(715 |
) |
| Domestic stocks |
|
|
576,687 |
|
|
|
675,493 |
|
|
|
(98,806 |
) |
| Foreign securities |
|
|
540,011 |
|
|
|
607,468 |
|
|
|
(67,457 |
) |
| Others |
|
|
34,100 |
|
|
|
35,298 |
|
|
|
(1,198 |
) |
|
|
|
|
|
|
|
|
|
|
|
|
|
| Subtotal |
|
|
1,206,027 |
|
|
|
1,374,204 |
|
|
|
(168,177 |
) |
|
|
|
|
|
|
|
|
|
|
|
|
|
| Total |
|
|
5,199,546 |
|
|
|
4,780,106 |
|
|
|
419,439 |
|
|
|
|
|
|
|
|
|
|
|
|
|
|
Notes)
| 1. |
Securities available for sale, which are considered extremely difficult to figure out their fair value are not included in the above table. |
| 2. |
Certificate of deposit, which are classified as cash and deposits and beneficial interests in the loan trusts, which are classified as monetary receivables bought in
the interim consolidated balance sheet, are included in “Others” above. |
| 3. |
Impairment losses on securities available for sale which have readily determinable fair value amount to 6,401 million yen (domestic stocks: 5,123 million yen,
foreign securities: 1,277 million yen). Impairment losses on securities available for sale which are considered extremely difficult to figure out their fair value amount to 413 million yen (domestic stocks: 317 million yen, foreign
securities: 47 million yen, others: 48 million yen). |
NKSJ Holdings, Inc. and its domestic consolidated
subsidiaries recognize impairment losses on securities available for sale which have readily determinable fair value if fair value declines by 30% or more of their cost as of the interim balance sheet date, as a rule.
9
| (6) |
Derivatives Transactions |
As of
September 30, 2010
|
|
|
|
|
|
|
|
|
|
|
|
|
|
|
|
|
| |
|
(Millions of yen) |
|
| |
|
Notional
amount |
|
|
Due after
1 year of
notional
amount |
|
|
Fair value |
|
|
Unrealized
gains (losses) |
|
| Over-the-counter transactions: |
|
|
|
|
|
|
|
|
|
|
|
|
|
|
|
|
| Forward foreign exchanges: |
|
|
|
|
|
|
|
|
|
|
|
|
|
|
|
|
| Short |
|
|
|
|
|
|
|
|
|
|
|
|
|
|
|
|
| EUR |
|
|
66,892 |
|
|
|
— |
|
|
|
(3,062 |
) |
|
|
(3,062 |
) |
| USD |
|
|
29,161 |
|
|
|
— |
|
|
|
760 |
|
|
|
760 |
|
| Long |
|
|
|
|
|
|
|
|
|
|
|
|
|
|
|
|
| TRY |
|
|
19,956 |
|
|
|
— |
|
|
|
281 |
|
|
|
281 |
|
| USD |
|
|
19,389 |
|
|
|
— |
|
|
|
(53 |
) |
|
|
(53 |
) |
|
|
|
|
|
|
|
|
|
|
|
|
|
|
|
|
|
| Total |
|
|
— |
|
|
|
— |
|
|
|
(2,073 |
) |
|
|
(2,073 |
) |
|
|
|
|
|
|
|
|
|
|
|
|
|
|
|
|
|
Notes)
| 1. |
Information on currency derivatives transactions other than the above-mentioned transactions is omitted because of no transactions. |
| 2. |
Calculation methods for the fair value |
| |
The fair value is calculated using forward exchange rate. |
| |
As for forward foreign exchanges transactions between foreign currency and the other foreign currency, the fair value is calculated using forward exchange rate of the
other foreign currency and yen on the day of forward foreign exchanges transactions. |
| 3. |
Derivatives transactions to which hedge accounting is applied are excluded. |
| 2. |
Interest rate derivatives |
|
|
|
|
|
|
|
|
|
|
|
|
|
|
|
|
|
| |
|
(Millions of yen) |
|
| |
|
Notional
amount |
|
|
Due after
1 year of
notional
amount |
|
|
Fair value |
|
|
Unrealized
gains (losses) |
|
| Over-the-counter transactions: |
|
|
|
|
|
|
|
|
|
|
|
|
|
|
|
|
| Interest rate swaps: |
|
|
|
|
|
|
|
|
|
|
|
|
|
|
|
|
| Receive fix / Pay float |
|
|
15,000 |
|
|
|
— |
|
|
|
63 |
|
|
|
63 |
|
|
|
|
|
|
|
|
|
|
|
|
|
|
|
|
|
|
| Total |
|
|
— |
|
|
|
— |
|
|
|
63 |
|
|
|
63 |
|
|
|
|
|
|
|
|
|
|
|
|
|
|
|
|
|
|
Notes)
| 1. |
Information on interest rate derivatives transactions other than the above-mentioned transactions is omitted because of no transactions. |
| 2. |
Calculation methods for the fair value |
| |
The fair value is calculated by discounting future cash flow to the present value. |
| 3. |
Derivatives transactions to which hedge accounting is applied are excluded. |
10
|
|
|
|
|
|
|
|
|
|
|
|
|
|
|
|
|
| |
|
(Millions of yen) |
|
| |
|
Notional
amount |
|
|
Due after
1 year of
notional
amount |
|
|
Fair value |
|
|
Unrealized
gains (losses) |
|
| Market transactions: |
|
|
|
|
|
|
|
|
|
|
|
|
|
|
|
|
| Equity index futures: |
|
|
|
|
|
|
|
|
|
|
|
|
|
|
|
|
| Short |
|
|
5,209 |
|
|
|
— |
|
|
|
14 |
|
|
|
14 |
|
| Equity index options: |
|
|
|
|
|
|
|
|
|
|
|
|
|
|
|
|
| Short |
|
|
|
|
|
|
|
|
|
|
|
|
|
|
|
|
| Call |
|
|
5,417 |
|
|
|
— |
|
|
|
|
|
|
|
|
|
|
|
|
205 |
* |
|
|
— |
* |
|
|
(6 |
) |
|
|
199 |
|
| Long |
|
|
|
|
|
|
|
|
|
|
|
|
|
|
|
|
| Put |
|
|
4,400 |
|
|
|
— |
|
|
|
|
|
|
|
|
|
|
|
|
205 |
* |
|
|
— |
* |
|
|
406 |
|
|
|
201 |
|
|
|
|
|
|
|
|
|
|
|
|
|
|
|
|
|
|
| Total |
|
|
— |
|
|
|
— |
|
|
|
414 |
|
|
|
414 |
|
|
|
|
|
|
|
|
|
|
|
|
|
|
|
|
|
|
Notes)
| 1. |
Information on equity derivatives transactions other than the above-mentioned transactions is omitted because of no transactions. |
| 2. |
Calculation methods for the fair value |
The fair
value is based on the closing price at major exchanges.
The fair
value is based on the closing price at major exchanges.
| 3. |
Amounts with an asterisk (*) represent the amount of the option premiums. |
|
|
|
|
|
|
|
|
|
|
|
|
|
|
|
|
|
| |
|
(Millions of yen) |
|
| |
|
Notional
amount |
|
|
Due after
1 year of
notional
amount |
|
|
Fair value |
|
|
Unrealized
gains (losses) |
|
| Market transactions: |
|
|
|
|
|
|
|
|
|
|
|
|
|
|
|
|
| Bond futures: |
|
|
|
|
|
|
|
|
|
|
|
|
|
|
|
|
| Long |
|
|
1,500 |
|
|
|
— |
|
|
|
3 |
|
|
|
3 |
|
|
|
|
|
|
|
|
|
|
|
|
|
|
|
|
|
|
| Total |
|
|
— |
|
|
|
— |
|
|
|
3 |
|
|
|
3 |
|
|
|
|
|
|
|
|
|
|
|
|
|
|
|
|
|
|
Notes)
| 1. |
Information on bond derivatives transactions other than the above-mentioned transactions is omitted because of no transactions. |
| 2. |
Calculation methods for the fair value |
The fair value is based on the closing price at major exchanges.
None.
11
|
|
|
|
|
|
|
|
|
|
|
|
|
|
|
|
|
| |
|
(Millions of yen) |
|
| |
|
Notional
amount |
|
|
Due after
1 year of
notional
amount |
|
|
Fair value |
|
|
Unrealized
gains (losses) |
|
| Over-the-counter transactions: |
|
|
|
|
|
|
|
|
|
|
|
|
|
|
|
|
| Credit derivatives: |
|
|
|
|
|
|
|
|
|
|
|
|
|
|
|
|
| Short |
|
|
7,000 |
|
|
|
7,000 |
|
|
|
18 |
|
|
|
18 |
|
| Long |
|
|
3,000 |
|
|
|
1,000 |
|
|
|
3 |
|
|
|
3 |
|
| Weather derivatives: |
|
|
|
|
|
|
|
|
|
|
|
|
|
|
|
|
| Short |
|
|
480 |
|
|
|
— |
|
|
|
|
|
|
|
|
|
|
|
|
28 |
* |
|
|
— |
* |
|
|
(14 |
) |
|
|
13 |
|
| Earthquake derivatives: |
|
|
|
|
|
|
|
|
|
|
|
|
|
|
|
|
| Short |
|
|
5,000 |
|
|
|
1,050 |
|
|
|
|
|
|
|
|
|
|
|
|
141 |
* |
|
|
21 |
* |
|
|
(24 |
) |
|
|
116 |
|
| Long |
|
|
3,555 |
|
|
|
3,033 |
|
|
|
|
|
|
|
|
|
|
|
|
366 |
* |
|
|
290 |
* |
|
|
138 |
|
|
|
(227 |
) |
|
|
|
|
|
|
|
|
|
|
|
|
|
|
|
|
|
| Total |
|
|
— |
|
|
|
— |
|
|
|
121 |
|
|
|
(75 |
) |
|
|
|
|
|
|
|
|
|
|
|
|
|
|
|
|
|
Notes)
| 1. |
Calculation methods for the fair value |
The fair value is based on the price quoted by counterparties.
The fair value is calculated based on the contract term and the element of the contract.
| |
(3) |
Earthquake derivatives |
The fair value is calculated based on the contract term and the element of the contract.
| 2. |
Amounts with an asterisk (*) represent the amount of the option premiums. |
12
| 4. |
Interim Financial Statements (Non-consolidated) |
| (1) |
Interim Balance Sheets (Non-consolidated) |
|
|
|
|
|
| |
|
(Millions of yen) |
|
| |
|
As of September 30, 2010 |
|
| Assets: |
|
|
|
|
| Current assets: |
|
|
|
|
| Cash and bank deposits |
|
|
2,269 |
|
| Accounts receivable |
|
|
240 |
|
|
|
|
|
|
| Total current assets |
|
|
2,509 |
|
|
|
|
|
|
| Fixed assets: |
|
|
|
|
| Tangible fixed assets |
|
|
275 |
|
| Investments and other assets: |
|
|
|
|
| Investments in subsidiaries and affiliates |
|
|
878,799 |
|
| Others |
|
|
67 |
|
|
|
|
|
|
| Total investments and other assets |
|
|
878,866 |
|
|
|
|
|
|
| Total fixed assets |
|
|
879,142 |
|
|
|
|
|
|
| Total assets |
|
|
881,652 |
|
|
|
|
|
|
| Liabilities: |
|
|
|
|
| Current liabilities: |
|
|
|
|
| Short-term borrowings |
|
|
2,200 |
|
| Income taxes payable |
|
|
7 |
|
| Reserve for bonus payments |
|
|
104 |
|
| Others |
|
|
123 |
|
|
|
|
|
|
| Total current liabilities |
|
|
2,435 |
|
|
|
|
|
|
| Total liabilities |
|
|
2,435 |
|
|
|
|
|
|
| Net assets: |
|
|
|
|
| Shareholders’ equity: |
|
|
|
|
| Common stock |
|
|
100,045 |
|
| Capital surplus: |
|
|
|
|
| Capital reserves |
|
|
25,045 |
|
| Other capital surplus |
|
|
751,814 |
|
|
|
|
|
|
| Total capital surplus |
|
|
776,859 |
|
|
|
|
|
|
| Retained earnings: |
|
|
|
|
| Other retained earnings: |
|
|
|
|
| Retained earnings carried forward |
|
|
476 |
|
|
|
|
|
|
| Total retained earnings |
|
|
476 |
|
|
|
|
|
|
| Treasury stock |
|
|
(527 |
) |
|
|
|
|
|
| Total shareholders’ equity |
|
|
876,854 |
|
|
|
|
|
|
| Stock acquisition rights |
|
|
2,362 |
|
|
|
|
|
|
| Total net assets |
|
|
879,217 |
|
|
|
|
|
|
| Total liabilities and net assets |
|
|
881,652 |
|
|
|
|
|
|
13
| (2) |
Interim Statements of Income (Non-consolidated) |
|
|
|
|
|
| |
|
(Millions of yen) |
|
| |
|
Six months ended
September 30, 2010
(April 1 to September
30, 2010) |
|
| Operating income: |
|
|
|
|
| Dividends received from subsidiaries and affiliates |
|
|
1,200 |
|
| Fees received from subsidiaries and affiliates |
|
|
1,223 |
|
|
|
|
|
|
| Total operating income |
|
|
2,423 |
|
|
|
|
|
|
| Operating expenses: |
|
|
|
|
| Operating, general and administrative expenses |
|
|
1,235 |
|
|
|
|
|
|
| Total operating expenses |
|
|
1,235 |
|
|
|
|
|
|
| Operating profit |
|
|
1,187 |
|
|
|
|
|
|
| Non-operating income |
|
|
0 |
|
| Non-operating expenses: |
|
|
|
|
| Amortization of establishment costs |
|
|
704 |
|
| Others |
|
|
4 |
|
|
|
|
|
|
| Total non-operating expenses |
|
|
709 |
|
|
|
|
|
|
| Ordinary profit |
|
|
478 |
|
|
|
|
|
|
| Income before income taxes |
|
|
478 |
|
|
|
|
|
|
| Income taxes |
|
|
1 |
|
|
|
|
|
|
| Total income taxes |
|
|
1 |
|
|
|
|
|
|
| Net income |
|
|
476 |
|
|
|
|
|
|
14
| (3) |
Interim Statements of Changes in Net Assets (Non-consolidated) |
|
|
|
|
|
| |
|
(Millions of yen) |
|
| |
|
Six months ended
September 30, 2010
(April 1 to September
30, 2010) |
|
| Shareholders’ equity: |
|
|
|
|
| Common stock: |
|
|
|
|
| Balance at the beginning of the period |
|
|
— |
|
| Changes during the period |
|
|
|
|
| Issuance of new stocks—exercise of stock acquisition rights |
|
|
45 |
|
| Increase due to share exchange |
|
|
100,000 |
|
|
|
|
|
|
| Total changes during the period |
|
|
100,045 |
|
|
|
|
|
|
| Balance at the end of the period |
|
|
100,045 |
|
|
|
|
|
|
| Capital surplus: |
|
|
|
|
| Capital reserves |
|
|
|
|
| Balance at the beginning of the period |
|
|
— |
|
| Changes during the period |
|
|
|
|
| Issuance of new stocks—exercise of stock acquisition rights |
|
|
45 |
|
| Increase due to share exchange |
|
|
25,000 |
|
|
|
|
|
|
| Total changes during the period |
|
|
25,045 |
|
|
|
|
|
|
| Balance at the end of the period |
|
|
25,045 |
|
|
|
|
|
|
| Other capital surplus: |
|
|
|
|
| Balance at the beginning of the period |
|
|
— |
|
| Changes during the period |
|
|
|
|
| Disposal of treasury stock |
|
|
31 |
|
| Increase due to share exchange |
|
|
751,782 |
|
|
|
|
|
|
| Total changes during the period |
|
|
751,814 |
|
|
|
|
|
|
| Balance at the end of the period |
|
|
751,814 |
|
|
|
|
|
|
| Retained earnings: |
|
|
|
|
| Other retained earnings: |
|
|
|
|
| Retained earnings carried forward: |
|
|
|
|
| Balance at the beginning of the period |
|
|
— |
|
| Changes during the period |
|
|
|
|
| Net income |
|
|
476 |
|
|
|
|
|
|
| Total changes during the period |
|
|
476 |
|
|
|
|
|
|
| Balance at the end of the period |
|
|
476 |
|
|
|
|
|
|
| Treasury stock: |
|
|
|
|
| Balance at the beginning of the period |
|
|
— |
|
| Changes during the period |
|
|
|
|
| Acquisition of treasury stock |
|
|
(708 |
) |
| Disposal of treasury stock |
|
|
180 |
|
|
|
|
|
|
| Total changes during the period |
|
|
(527 |
) |
|
|
|
|
|
| Balance at the end of the period |
|
|
(527 |
) |
|
|
|
|
|
15
|
|
|
|
|
| |
|
(Millions of yen) |
|
| |
|
Six months
ended
September 30, 2010
(April 1 to September 30, 2010) |
|
| |
| Total shareholders’ equity: |
|
|
|
|
| Balance at the beginning of the period |
|
|
— |
|
| Changes during the period |
|
|
|
|
| Issuance of new stocks—exercise of stock acquisition rights |
|
|
91 |
|
| Net income |
|
|
476 |
|
| Acquisition of treasury stock |
|
|
(708 |
) |
| Disposal of treasury stock |
|
|
212 |
|
| Increase due to share exchange |
|
|
876,782 |
|
|
|
|
|
|
| Total changes during the period |
|
|
876,854 |
|
|
|
|
|
|
| Balance at the end of the period |
|
|
876,854 |
|
|
|
|
|
|
| Stock acquisition rights: |
|
|
|
|
| Balance at the beginning of the period |
|
|
— |
|
| Changes during the period |
|
|
|
|
| Net changes in items other than shareholders’ equity |
|
|
2,362 |
|
|
|
|
|
|
| Total changes during the period |
|
|
2,362 |
|
|
|
|
|
|
| Balance at the end of the period |
|
|
2,362 |
|
|
|
|
|
|
| Total net assets: |
|
|
|
|
| Balance at the beginning of the period |
|
|
— |
|
| Changes during the period |
|
|
|
|
| Issuance of new stocks—exercise of stock acquisition rights |
|
|
91 |
|
| Net income |
|
|
476 |
|
| Acquisition of treasury stock |
|
|
(708 |
) |
| Disposal of treasury stock |
|
|
212 |
|
| Increase due to share exchange |
|
|
876,782 |
|
| Net changes in items other than shareholders’ equity |
|
|
2,362 |
|
|
|
|
|
|
| Total changes during the period |
|
|
879,217 |
|
|
|
|
|
|
| Balance at the end of the period |
|
|
879,217 |
|
|
|
|
|
|
16
| (4) |
Notes on Going-Concern Assumption |
None.
17
| 5. |
Supplementary Information |
| (1) |
Summary of Results of Operations |
|
|
|
|
|
| |
|
(Millions of yen) |
|
| |
|
Six months ended
September 30, 2010
(April 1 to September 30, 2010) |
|
| Ordinary income and expenses: |
|
|
|
|
| Underwriting income: |
|
|
1,261,384 |
|
| Net premiums written |
|
|
987,832 |
|
| Deposits of premiums by policyholders |
|
|
79,398 |
|
| Life insurance premiums written |
|
|
108,905 |
|
| Underwriting expenses: |
|
|
1,048,058 |
|
| Net claims paid |
|
|
607,279 |
|
| Loss adjustment expenses |
|
|
65,449 |
|
| Net commissions and brokerage fees |
|
|
176,065 |
|
| Maturity refunds to policyholders |
|
|
165,853 |
|
| Life insurance claims paid |
|
|
28,735 |
|
|
|
|
|
|
| Investment income: |
|
|
63,222 |
|
| Interest and dividend income |
|
|
78,453 |
|
| Gains on sales of securities |
|
|
5,839 |
|
| Investment expenses: |
|
|
24,913 |
|
| Losses on sales of securities |
|
|
2,201 |
|
| Impairment losses on securities |
|
|
6,827 |
|
|
|
|
|
|
| Operating, general and administrative expenses |
|
|
212,008 |
|
|
|
|
|
|
| Other ordinary income and expenses |
|
|
(737 |
) |
|
|
|
|
|
| Ordinary profit |
|
|
38,888 |
|
|
|
|
|
|
| Extraordinary gains and losses: |
|
|
|
|
| Extraordinary gains |
|
|
2,015 |
|
| Extraordinary losses |
|
|
4,923 |
|
|
|
|
|
|
| Net extraordinary losses |
|
|
(2,908 |
) |
|
|
|
|
|
| Income before income taxes and non-controlling interests |
|
|
35,980 |
|
| Income taxes |
|
|
2,793 |
|
| Deferred income taxes |
|
|
9,250 |
|
| Total income taxes |
|
|
12,043 |
|
| Income before non-controlling interests |
|
|
23,936 |
|
| Non-controlling interests |
|
|
(180 |
) |
|
|
|
|
|
| Net income |
|
|
24,116 |
|
|
|
|
|
|
18
| (2) |
Premiums Written and Claims Paid by Lines of Business (Consolidated) |
Direct premiums written (including deposits of premiums by policyholders)
|
|
|
|
|
|
|
|
|
|
|
|
|
| |
|
(Millions of yen) |
|
| |
|
Six months ended September 30, 2010
(April 1 to September 30,
2010) |
|
| Business line |
|
Amount |
|
|
% of total
amount |
|
|
Rate of
change |
|
| |
|
|
|
|
% |
|
|
% |
|
| Fire and allied insurance |
|
|
175,867 |
|
|
|
15.5 |
|
|
|
— |
|
| Marine insurance |
|
|
29,665 |
|
|
|
2.6 |
|
|
|
— |
|
| Personal accident insurance |
|
|
151,217 |
|
|
|
13.4 |
|
|
|
— |
|
| Voluntary automobile insurance |
|
|
491,237 |
|
|
|
43.4 |
|
|
|
— |
|
| Compulsory automobile liability insurance |
|
|
130,407 |
|
|
|
11.5 |
|
|
|
— |
|
| Others |
|
|
153,474 |
|
|
|
13.6 |
|
|
|
— |
|
|
|
|
|
|
|
|
|
|
|
|
|
|
| Total |
|
|
1,131,870 |
|
|
|
100.0 |
|
|
|
— |
|
| Deposits of premiums by policyholders |
|
|
79,398 |
|
|
|
7.0 |
|
|
|
— |
|
|
|
|
|
|
|
|
|
|
|
|
|
|
| Net premiums
written |
|
|
|
|
|
|
|
|
|
|
|
|
| |
|
(Millions of yen) |
|
| |
|
Six months ended September 30, 2010
(April 1 to September 30, 2010) |
|
| Business line |
|
Amount |
|
|
% of total
amount |
|
|
Rate of
change |
|
| |
|
|
|
|
% |
|
|
% |
|
| Fire and allied insurance |
|
|
114,169 |
|
|
|
11.6 |
|
|
|
— |
|
| Marine insurance |
|
|
23,893 |
|
|
|
2.4 |
|
|
|
— |
|
| Personal accident insurance |
|
|
96,874 |
|
|
|
9.8 |
|
|
|
— |
|
| Voluntary automobile insurance |
|
|
490,656 |
|
|
|
49.7 |
|
|
|
— |
|
| Compulsory automobile liability insurance |
|
|
124,069 |
|
|
|
12.6 |
|
|
|
— |
|
| Others |
|
|
138,170 |
|
|
|
14.0 |
|
|
|
— |
|
|
|
|
|
|
|
|
|
|
|
|
|
|
| Total |
|
|
987,832 |
|
|
|
100.0 |
|
|
|
— |
|
|
|
|
|
|
|
|
|
|
|
|
|
|
| Net claims
paid |
|
|
|
|
|
|
|
|
|
|
|
|
| |
|
(Millions of yen) |
|
| |
|
Six months ended September 30, 2010
(April 1 to September 30,
2010) |
|
| Business line |
|
Amount |
|
|
% of total
amount |
|
|
Rate of
change |
|
| |
|
|
|
|
% |
|
|
% |
|
| Fire and allied insurance |
|
|
48,136 |
|
|
|
7.9 |
|
|
|
— |
|
| Marine insurance |
|
|
11,798 |
|
|
|
1.9 |
|
|
|
— |
|
| Personal accident insurance |
|
|
50,343 |
|
|
|
8.3 |
|
|
|
— |
|
| Voluntary automobile insurance |
|
|
299,816 |
|
|
|
49.4 |
|
|
|
— |
|
| Compulsory automobile liability insurance |
|
|
114,290 |
|
|
|
18.8 |
|
|
|
— |
|
| Others |
|
|
82,893 |
|
|
|
13.7 |
|
|
|
— |
|
|
|
|
|
|
|
|
|
|
|
|
|
|
| Total |
|
|
607,279 |
|
|
|
100.0 |
|
|
|
— |
|
|
|
|
|
|
|
|
|
|
|
|
|
|
Note to
the above three tables:
The above figures represent amounts before offsetting internal transactions among consolidated
segments.
19
| (3) |
Life Insurance Business (Consolidated) |
Life
insurance premiums
|
|
|
|
|
|
|
|
|
| |
|
(Millions of yen) |
|
| |
|
Six months ended September 30, 2010
(April 1 to September
30, 2010) |
|
| |
|
Amount |
|
|
Rate of change |
|
| |
|
|
|
|
% |
|
| Life insurance premiums |
|
|
108,905 |
|
|
|
— |
|
Note) The above figures represent amounts before offsetting internal transactions among consolidated segments.
Total amount of policies in force
|
|
|
|
|
|
|
|
|
| |
|
(Millions of yen) |
|
| |
|
As of
September 30, 2010 |
|
| |
|
Amount |
|
|
Rate of change |
|
| |
|
|
|
|
% |
|
| Individual insurance |
|
|
15,902,856 |
|
|
|
— |
|
| Individual annuities |
|
|
277,171 |
|
|
|
— |
|
| Group insurance |
|
|
3,024,206 |
|
|
|
— |
|
| Group annuities |
|
|
— |
|
|
|
— |
|
Notes)
| 1. |
The above figures represent amounts before offsetting internal transactions among consolidated segments. |
| 2. |
Amount of “Individual annuities” represents the sum of annuity fund at the beginning of annuity payment of contracts before the beginning of annuity payment
and policy reserves for the contracts after the beginning of annuity payment. |
Total amount of new policies
|
|
|
|
|
|
|
|
|
|
|
|
|
| |
|
(Millions of yen) |
|
| |
|
Six months ended September 30, 2010
(April 1 to September 30,
2010) |
|
| |
|
Net increase by
new policies
and conversion |
|
|
New policies |
|
|
Net increase
by conversion |
|
| Individual insurance |
|
|
1,536,763 |
|
|
|
1,536,763 |
|
|
|
— |
|
| Individual annuities |
|
|
6,580 |
|
|
|
6,580 |
|
|
|
— |
|
| Group insurance |
|
|
17,702 |
|
|
|
17,702 |
|
|
|
— |
|
| Group annuities |
|
|
— |
|
|
|
— |
|
|
|
— |
|
Notes)
| 1. |
The above figures represent amounts before offsetting internal transactions among consolidated segments. |
| 2. |
Amount of “Net increase by new policies and conversion” for “Individual annuities” represents the amount of annuity fund at the beginning of annuity
payment. |
Annualized premiums of new policies (individual insurance and individual annuities)
|
|
|
|
|
|
|
|
|
| |
|
(Millions of yen) |
|
| |
|
Six months ended September 30, 2010
(April 1 to September 30,
2010) |
|
| |
|
Amount |
|
|
Rate of change |
|
| |
|
|
|
|
% |
|
| Annualized premiums of new policies |
|
|
18,031 |
|
|
|
— |
|
Note) The above figures represent amounts before offsetting internal transactions among consolidated segments.
20
Note Regarding Forward-looking Statements
This document includes “forward-looking statements” that reflect the information in relation to the NKSJ Holdings, Inc.
(“NKSJ”). To the extent that statements in this document do not relate to historical or current facts, they constitute forward-looking statements. These forward-looking statements are based on the current assumptions and beliefs of NKSJ in
light of the information currently available to NKSJ, and involve known and unknown risks, uncertainties and other factors. Such risks, uncertainties and other factors may cause the actual results, performance, achievements or financial position of
NKSJ, as the case may be, to be materially different from any future results, performance, achievements or financial position expressed or implied by these forward-looking statements. NKSJ does not undertake or will not undertake any obligation to
publicly update any forward-looking statements after the date of this document. Investors are advised to consult any further disclosures by NKSJ in their subsequent domestic filings in Japan and filings with, or submissions to, the U.S. Securities
Exchange Commission pursuant to the U.S. Securities Exchange Act of 1934.
The risks, uncertainties and other factors referred
to above include, but are not limited to, those below. The risks, uncertainties and other factors are also referred to in our domestic Quarterly Securities Reports.
| (1) |
Effects of deterioration of economic and business conditions in Japan |
| (2) |
Risk of intensification of competition in the property and casualty insurance business |
| (3) |
Changes to laws, regulations, and systems |
| (4) |
Natural catastrophe risks related to insurance products |
| (5) |
Occurrence of losses exceeding projection |
| (7) |
Effects of declining stock price |
| (8) |
Effects of fluctuation in interest rate |
| (10) |
Effects of fluctuation in foreign exchange rate |
| (12) |
Life insurance business risks |
| (13) |
Overseas business risk |
| (14) |
Non-insurance business risk |
| (15) |
Credit rating downgrade |
| (16) |
Business interruption risk in case of natural disasters, etc. |
| (17) |
Information security risk |
| (19) |
System integration risk |
| (20) |
Risk of failure to adequately realize business integration synergies |
| (21) |
Risks related to merger of life insurance subsidiaries |
21
[English Translation]
Summary of Consolidated Financial Results for the six months ended September 30, 2010
(Supplementary Information)
UNOFFICIAL TRANSLATION
This document is an unofficial English translation of the Japanese original.
Summary of Consolidated Financial Results
for the six months ended September 30, 2010
Supplementary
Information
November 19, 2010
NKSJ Holdings, Inc.
(Stock code number : 8630)
Summary of Consolidated Financial Results for the six months ended
September 30, 2010
Supplementary Information Contents
1. Overview of Consolidated Financial Results for the six months ended September 30, 2010
|
|
|
|
|
| NKSJ Holdings, Inc. |
|
|
|
|
| Overview of Consolidated Financial Results for the six months ended September 30,
2010 |
|
|
3 |
|
| Summary of Results of Operations by Lines of Business Segments |
|
|
3 |
|
|
|
| Sompo Japan Insurance Inc. (Non-consolidated) |
|
|
|
|
| Overview of Financial Results for the six months ended September 30, 2010 |
|
|
4 |
|
| Summary of Results of Operations |
|
|
4 |
|
| Premiums Written and Claims Paid by Lines of Business |
|
|
5 |
|
| Net Incurred Loss related to Natural Disasters (which occurred in the period) |
|
|
6 |
|
| Breakdown of Operating, General and Administrative Expenses and Loss Adjustment
Expenses |
|
|
6 |
|
| Reserve for Outstanding Losses and Claims |
|
|
6 |
|
| Ordinary Underwriting Reserves |
|
|
6 |
|
| Catastrophic Loss Reserve |
|
|
6 |
|
|
|
| NIPPONKOA Insurance Co., Ltd. (Non-consolidated) |
|
|
|
|
| Overview of Financial Results for the six months ended September 30, 2010 |
|
|
7 |
|
| Summary of Results of Operations |
|
|
7 |
|
| Premiums Written and Claims Paid by Lines of Business |
|
|
8 |
|
| Net Incurred Loss related to Natural Disasters (which occurred in the period) |
|
|
9 |
|
| Breakdown of Operating, General and Administrative Expenses and Loss Adjustment
Expenses |
|
|
9 |
|
| Reserve for Outstanding Losses and Claims |
|
|
9 |
|
| Ordinary Underwriting Reserves |
|
|
9 |
|
| Catastrophic Loss Reserve |
|
|
9 |
|
|
|
| 2. Forecasts for the fiscal year ending March 31, 2011 (April 1, 2010 to March 31, 2011) |
|
|
|
|
|
|
| NKSJ Holdings, Inc. (Consolidated) |
|
|
10 |
|
| Sompo Japan Insurance Inc. (Non-consolidated) |
|
|
10 |
|
| NIPPONKOA Insurance Co., Ltd. (Non-consolidated) |
|
|
10 |
|
|
|
| 3. Overview of Business Results of Principal Consolidated Subsidiaries |
|
|
|
|
|
|
| Sompo Japan Insurance Inc. (Non-consolidated) |
|
|
11 |
|
| Interim Balance Sheets |
|
|
11 |
|
| Interim Statements of Income |
|
|
12 |
|
| Premiums Written and Claims Paid by Lines of Business |
|
|
13 |
|
| Solvency Margin Ratio |
|
|
14 |
|
| Exposure to Structured Finance (As of September 30, 2010) |
|
|
15 |
|
|
|
| NIPPONKOA Insurance Co., Ltd. (Non-consolidated) |
|
|
19 |
|
| Interim Balance Sheets |
|
|
19 |
|
| Interim Statements of Income |
|
|
20 |
|
| Premiums Written and Claims Paid by Lines of Business |
|
|
21 |
|
| Solvency Margin Ratio |
|
|
22 |
|
| Investments in the securitized paper and subprime loans (As of September 30,
2010) |
|
|
23 |
|
1
|
|
|
|
|
| SONPO 24 Insurance Co., Ltd. (Non-Consolidated) |
|
|
24 |
|
| Interim Balance Sheets |
|
|
24 |
|
| Interim Statements of Income |
|
|
25 |
|
| Premiums Written and Claims Paid by Lines of Business |
|
|
26 |
|
| Solvency Margin Ratio |
|
|
27 |
|
|
|
| Saison Automobile and Fire Insurance Company, Limited (Non-consolidated) |
|
|
28 |
|
| Interim Balance Sheets |
|
|
28 |
|
| Interim Statements of Income |
|
|
29 |
|
| Premiums Written and Claims Paid by Lines of Business |
|
|
30 |
|
| Solvency Margin Ratio |
|
|
31 |
|
|
|
| Sompo Japan Himawari Life Insurance Co., Ltd. (Non-consolidated) |
|
|
32 |
|
| Interim Balance Sheets |
|
|
32 |
|
| Interim Statements of Income |
|
|
33 |
|
| Major Business Results |
|
|
|
|
| (Total amount of policies in force and total amount of new policies, Annualized
premiums) |
|
|
34 |
|
| Solvency Margin Ratio |
|
|
35 |
|
|
|
| NIPPONKOA Life Insurance Co., Ltd. (Non-consolidated) |
|
|
36 |
|
| Interim Balance Sheets |
|
|
36 |
|
| Interim Statements of Income |
|
|
37 |
|
| Major Business Results |
|
|
|
|
| (Total amount of policies in force and total amount of new policies, Annualized
premiums) |
|
|
38 |
|
| Solvency Margin Ratio |
|
|
39 |
|
|
|
| Sompo Japan DIY Life Insurance Co., Ltd. (Non-consolidated) |
|
|
40 |
|
| Interim Balance Sheets |
|
|
40 |
|
| Interim Statements of Income |
|
|
41 |
|
| Major Business Results |
|
|
|
|
| (Total amount of policies in force and total amount of new policies, Annualized
premiums) |
|
|
42 |
|
| Solvency Margin Ratio |
|
|
43 |
|
|
|
| Supplementary Explanation |
|
|
44 |
|
| Calculation of ratios |
|
|
44 |
|
| Solvency margin ratio |
|
|
44 |
|
|
|
| 4. Supplementary Data about Financial Results for the six months ended September 30, 2010 at Press Conference |
|
|
|
|
|
|
| Sompo Japan Insurance Inc. (Non-consolidated) |
|
|
45 |
|
| NIPPONKOA Insurance Co., Ltd. (Non-consolidated) |
|
|
48 |
|
| Sompo Japan Insurance Inc. and NIPPONKOA Insurance Co., Ltd. (Combined) |
|
|
51 |
|
|
|
| Note Regarding Forward-looking Statements |
|
|
52 |
|
2
| 1. |
Overview of Consolidated Financial Results for the six months ended September 30, 2010 |
NKSJ Holdings, Inc.
Overview of Consolidated Financial Results for the six months ended September 30, 2010
|
|
|
|
|
|
|
|
|
| |
|
|
(Millions of yen) |
|
| |
Six months ended
September 30, 2010
(April 1 to September
30, 2010) |
|
| Ordinary income: |
|
|
(1 |
) |
|
|
1,329,799 |
|
| Net premiums written |
|
|
(2 |
) |
|
|
987,832 |
|
| Life insurance premiums written |
|
|
(3 |
) |
|
|
108,905 |
|
| Ordinary profit |
|
|
(4 |
) |
|
|
38,888 |
|
| Net income |
|
|
(5 |
) |
|
|
24,116 |
|
|
|
|
|
|
|
|
|
|
|
|
|
|
| |
|
|
(Millions of yen) |
|
| |
Ordinary profit |
|
|
Net income |
|
| Sompo Japan Insurance Inc. (Consolidated) |
|
|
(6 |
) |
|
|
22,216 |
|
|
|
15,355 |
|
| + |
|
|
|
|
|
|
|
|
|
|
|
|
| NIPPONKOA Insurance Co., Ltd. (Consolidated) |
|
|
(7 |
) |
|
|
20,444 |
|
|
|
12,910 |
|
| + |
|
|
|
|
|
|
|
|
|
|
|
|
| Consolidation adjustment |
|
|
(8 |
) |
|
|
(3,772 |
) |
|
|
(4,148 |
) |
| = |
|
|
|
|
|
|
|
|
|
|
|
|
| NKSJ Holdings, Inc. (Consolidated) |
|
|
(9 |
) |
|
|
38,888 |
|
|
|
24,116 |
|
| Note) |
The transaction related to the establishment of NKSJ Holdings, Inc. is accounted for under the purchase method as accounting methods for business combination.
|
The major component of the above “Consolidation adjustment” is the amount of adjustments due to the
application of the purchase method.
Summary of Results of Operations by Lines of Business Segments
|
|
|
|
|
|
|
|
|
|
|
|
|
|
|
|
|
|
|
|
|
|
|
|
|
|
|
|
|
|
|
|
|
| |
|
|
(Millions of yen) |
|
| |
Property and casualty insurance business |
|
|
Life
insurance
business |
|
|
Others |
|
|
Total |
|
| |
Domestic property and casualty
insurance business |
|
|
Overseas
property
and
casualty
insurance
business |
|
|
|
|
| |
|
|
|
Sompo
Japan |
|
|
NIPPONKOA |
|
|
|
|
|
| Net premiums written |
|
|
(10 |
) |
|
|
972,875 |
|
|
|
643,682 |
|
|
|
316,583 |
|
|
|
14,957 |
|
|
|
— |
|
|
|
— |
|
|
|
987,832 |
|
| Life insurance premiums written |
|
|
(11 |
) |
|
|
— |
|
|
|
— |
|
|
|
— |
|
|
|
— |
|
|
|
108,905 |
|
|
|
— |
|
|
|
108,905 |
|
| Ordinary profit |
|
|
(12 |
) |
|
|
41,929 |
|
|
|
25,331 |
|
|
|
17,584 |
|
|
|
496 |
|
|
|
(2,369 |
) |
|
|
(1,167 |
) |
|
|
38,888 |
|
| Net income |
|
|
(13 |
) |
|
|
27,467 |
|
|
|
17,230 |
|
|
|
11,064 |
|
|
|
149 |
|
|
|
(2,379 |
) |
|
|
(1,121 |
) |
|
|
24,116 |
|
| Note) |
Ordinary profit and net income represent amounts after consolidation adjustments. |
3
Sompo Japan Insurance Inc. (Non-consolidated)
Overview of Financial Results for the six months ended September 30, 2010
Summary of Results of Operations
|
|
|
|
|
|
|
|
|
|
|
|
|
|
|
|
|
|
|
|
|
|
|
|
|
| |
|
|
|
|
|
|
|
(Millions of yen) |
|
| |
|
|
|
|
|
|
|
Six months ended
September 30, 2009
(April 1
to
September 30, 2009) |
|
|
Six months ended
September 30, 2010
(April 1
to
September 30, 2010) |
|
|
Increase
(Decrease) |
|
|
Rate of
change |
|
| Ordinary income and expenses: |
|
|
|
|
|
|
|
|
|
|
|
|
|
|
|
|
|
|
|
|
|
|
|
|
| Underwriting income and expenses: |
|
|
|
|
|
|
|
|
|
|
|
|
|
|
|
|
|
|
|
|
|
|
|
|
| Direct premiums written
(including deposits of premiums by policyholders) |
|
|
|
|
|
|
(1) |
|
|
|
727,313 |
|
|
|
737,131 |
|
|
|
9,817 |
|
|
|
1.3 |
% |
| Direct premiums written |
|
|
|
|
|
|
(2) |
|
|
|
673,086 |
|
|
|
677,684 |
|
|
|
4,598 |
|
|
|
0.7 |
|
| (+) Net premiums written |
|
|
|
|
|
|
(3) |
|
|
|
641,665 |
|
|
|
643,682 |
|
|
|
2,017 |
|
|
|
0.3 |
|
| (–) Net claims paid |
|
|
|
|
|
|
(4) |
|
|
|
440,894 |
|
|
|
399,085 |
|
|
|
(41,808 |
) |
|
|
(9.5 |
) |
| (–) Loss adjustment expenses |
|
|
|
|
|
|
(5) |
|
|
|
38,347 |
|
|
|
46,843 |
|
|
|
8,496 |
|
|
|
22.2 |
|
| (–) Net commissions and brokerage fees |
|
|
|
|
|
|
(6) |
|
|
|
107,227 |
|
|
|
107,566 |
|
|
|
339 |
|
|
|
0.3 |
|
| (+) Deposits of premiums by policyholders |
|
|
|
|
|
|
(7) |
|
|
|
54,227 |
|
|
|
59,446 |
|
|
|
5,218 |
|
|
|
9.6 |
|
| (+) Interest and dividend income on deposits of premiums, etc. |
|
|
|
|
|
|
(8) |
|
|
|
21,141 |
|
|
|
19,612 |
|
|
|
(1,529 |
) |
|
|
(7.2 |
) |
| (–) Maturity refunds and dividends to policyholders |
|
|
|
|
|
|
(9) |
|
|
|
74,707 |
|
|
|
109,736 |
|
|
|
35,029 |
|
|
|
46.9 |
|
| (–) Provision for reserve for outstanding losses and claims |
|
|
|
|
|
|
(10) |
|
|
|
(72,297 |
) |
|
|
(33,344 |
) |
|
|
38,953 |
|
|
|
— |
|
| (–) Provision for underwriting reserves |
|
|
|
|
|
|
(11) |
|
|
|
(10,780 |
) |
|
|
(31,319 |
) |
|
|
(20,538 |
) |
|
|
— |
|
| (+) Other underwriting income and expenses |
|
|
|
|
|
|
(12) |
|
|
|
(7,102 |
) |
|
|
(682 |
) |
|
|
6,420 |
|
|
|
— |
|
| Gross underwriting margin |
|
|
|
|
|
|
(13) |
|
|
|
131,834 |
|
|
|
123,491 |
|
|
|
(8,342 |
) |
|
|
(6.3 |
) |
|
|
|
|
|
|
|
|
|
|
|
|
|
|
|
|
|
|
|
|
|
|
|
|
|
| Operating, general and administrative expenses related to underwriting |
|
|
|
|
|
|
(14) |
|
|
|
111,925 |
|
|
|
107,074 |
|
|
|
(4,850 |
) |
|
|
(4.3 |
) |
| Other income and expenses |
|
|
|
|
|
|
(15) |
|
|
|
(1,701 |
) |
|
|
(2,243 |
) |
|
|
(542 |
) |
|
|
— |
|
| Underwriting profit |
|
|
|
|
|
|
(16) |
|
|
|
18,207 |
|
|
|
14,173 |
|
|
|
(4,034 |
) |
|
|
(22.2 |
) |
|
|
|
|
|
|
|
|
|
|
|
|
|
|
|
|
|
|
|
|
|
|
|
|
|
| Investment income and expenses: |
|
|
|
|
|
|
|
|
|
|
|
|
|
|
|
|
|
|
|
|
|
|
|
|
| (+) Interest and dividend income |
|
|
|
|
|
|
(17) |
|
|
|
46,319 |
|
|
|
43,199 |
|
|
|
(3,120 |
) |
|
|
(6.7 |
) |
| (+) Investment gains and losses on money trusts |
|
|
|
|
|
|
(18) |
|
|
|
(1,262 |
) |
|
|
(414 |
) |
|
|
848 |
|
|
|
— |
|
| (+) Gains and losses on sales of securities |
|
|
|
|
|
|
(19) |
|
|
|
1,216 |
|
|
|
1,456 |
|
|
|
240 |
|
|
|
19.8 |
|
| (–) Impairment losses on securities |
|
|
|
|
|
|
(20) |
|
|
|
4,148 |
|
|
|
3,789 |
|
|
|
(359 |
) |
|
|
(8.7 |
) |
| (+) Transfer of interest and dividend income on deposits of premiums, etc. |
|
|
|
|
|
|
(21) |
|
|
|
(21,141 |
) |
|
|
(19,612 |
) |
|
|
1,529 |
|
|
|
— |
|
| (+) Gains and losses on derivatives |
|
|
|
|
|
|
(22) |
|
|
|
7,329 |
|
|
|
7,044 |
|
|
|
(284 |
) |
|
|
(3.9 |
) |
| (+) Other investment income and expenses |
|
|
|
|
|
|
(23) |
|
|
|
(9,066 |
) |
|
|
(12,750 |
) |
|
|
(3,684 |
) |
|
|
— |
|
| Gross investment margin |
|
|
|
|
|
|
(24) |
|
|
|
19,245 |
|
|
|
15,133 |
|
|
|
(4,112 |
) |
|
|
(21.4 |
) |
|
|
|
|
|
|
|
|
|
|
|
|
|
|
|
|
|
|
|
|
|
|
|
|
|
| (–) Operating, general and administrative expenses |
|
|
|
|
|
|
(25) |
|
|
|
118,006 |
|
|
|
112,706 |
|
|
|
(5,299 |
) |
|
|
(4.5 |
) |
|
|
|
|
|
|
|
|
|
|
|
|
|
|
|
|
|
|
|
|
|
|
|
|
|
| (+) Other ordinary income and expenses |
|
|
|
|
|
|
(26) |
|
|
|
(934 |
) |
|
|
(813 |
) |
|
|
121 |
|
|
|
— |
|
|
|
|
|
|
|
|
|
|
|
|
|
|
|
|
|
|
|
|
|
|
|
|
|
|
| Ordinary profit |
|
|
|
|
|
|
(27) |
|
|
|
32,138 |
|
|
|
25,105 |
|
|
|
(7,033 |
) |
|
|
(21.9 |
) |
|
|
|
|
|
|
|
|
|
|
|
|
|
|
|
|
|
|
|
|
|
|
|
|
|
| Extraordinary gains and losses: |
|
|
|
|
|
|
|
|
|
|
|
|
|
|
|
|
|
|
|
|
|
|
|
|
| (+) Extraordinary gains |
|
|
|
|
|
|
(28) |
|
|
|
15,205 |
|
|
|
3,129 |
|
|
|
(12,075 |
) |
|
|
(79.4 |
) |
| (–) Extraordinary losses |
|
|
|
|
|
|
(29) |
|
|
|
3,156 |
|
|
|
2,392 |
|
|
|
(763 |
) |
|
|
(24.2 |
) |
|
|
|
|
|
|
|
|
|
|
|
|
|
|
|
|
|
|
|
|
|
|
|
|
|
| Net extraordinary gains |
|
|
|
|
|
|
(30) |
|
|
|
12,049 |
|
|
|
737 |
|
|
|
(11,312 |
) |
|
|
(93.9 |
) |
|
|
|
|
|
|
|
|
|
|
|
|
|
|
|
|
|
|
|
|
|
|
|
|
|
| Income before income taxes |
|
|
|
|
|
|
(31) |
|
|
|
44,188 |
|
|
|
25,842 |
|
|
|
(18,345 |
) |
|
|
(41.5 |
) |
|
|
|
|
|
|
|
|
|
|
|
|
|
|
|
|
|
|
|
|
|
|
|
|
|
| (–) Income taxes |
|
|
|
|
|
|
(32) |
|
|
|
257 |
|
|
|
218 |
|
|
|
(39 |
) |
|
|
(15.1 |
) |
| (–) Refunded income taxes for prior period |
|
|
|
|
|
|
(33) |
|
|
|
(733 |
) |
|
|
— |
|
|
|
733 |
|
|
|
— |
|
| (–) Deferred income taxes |
|
|
|
|
|
|
(34) |
|
|
|
13,948 |
|
|
|
7,309 |
|
|
|
(6,638 |
) |
|
|
(47.6 |
) |
|
|
|
|
|
|
|
|
|
|
|
|
|
|
|
|
|
|
|
|
|
|
|
|
|
| Total income taxes |
|
|
|
|
|
|
(35) |
|
|
|
13,472 |
|
|
|
7,528 |
|
|
|
(5,944 |
) |
|
|
(44.1 |
) |
|
|
|
|
|
|
|
|
|
|
|
|
|
|
|
|
|
|
|
|
|
|
|
|
|
| Net income |
|
|
|
|
|
|
(36) |
|
|
|
30,715 |
|
|
|
18,313 |
|
|
|
(12,401 |
) |
|
|
(40.4 |
) |
|
|
|
|
|
|
|
|
|
|
|
|
|
|
|
|
|
|
|
|
|
|
|
|
|
|
|
|
|
|
|
|
| Underwriting result: |
|
|
|
|
|
|
|
|
|
|
|
|
|
|
|
|
|
|
|
|
|
|
|
|
| (+) Net premiums written |
|
|
|
|
|
|
(37) |
|
|
|
641,665 |
|
|
|
643,682 |
|
|
|
2,017 |
|
|
|
0.3 |
|
|
|
|
|
|
|
|
|
|
|
|
|
|
|
|
|
|
|
|
|
|
|
|
|
|
| (–) Net claims paid |
|
|
|
|
|
|
(38) |
|
|
|
440,894 |
|
|
|
399,085 |
|
|
|
(41,808 |
) |
|
|
(9.5 |
) |
|
|
|
|
|
|
|
|
|
|
|
|
|
|
|
|
|
|
|
|
|
|
|
|
|
| (–) Loss adjustment expenses |
|
|
|
|
|
|
(39) |
|
|
|
38,347 |
|
|
|
46,843 |
|
|
|
8,496 |
|
|
|
22.2 |
|
|
|
|
|
|
|
|
|
|
|
|
|
|
|
|
|
|
|
|
|
|
|
|
|
|
| (–) Operating expenses: |
|
|
|
|
|
|
(40) |
|
|
|
219,152 |
|
|
|
214,641 |
|
|
|
(4,511 |
) |
|
|
(2.1 |
) |
|
|
|
|
|
|
|
|
|
|
|
|
|
|
|
|
|
|
|
|
|
|
|
|
|
| Net commissions and brokerage fees |
|
|
|
|
|
|
(41) |
|
|
|
107,227 |
|
|
|
107,566 |
|
|
|
339 |
|
|
|
0.3 |
|
| Operating, general and administrative expenses related to underwriting |
|
|
|
|
|
|
(42) |
|
|
|
111,925 |
|
|
|
107,074 |
|
|
|
(4,850 |
) |
|
|
(4.3 |
) |
|
|
|
|
|
|
|
|
|
|
|
|
|
|
|
|
|
|
|
|
|
|
|
|
|
| Underwriting result |
|
|
|
|
|
|
(43) |
|
|
|
(56,728 |
) |
|
|
(16,887 |
) |
|
|
39,840 |
|
|
|
— |
|
|
|
|
|
|
|
|
|
|
|
|
|
|
|
|
|
|
|
|
|
|
|
|
|
|
| Ratios: |
|
|
|
|
|
|
|
|
|
|
|
|
|
|
|
|
|
|
|
|
|
|
|
|
| Net loss ratio |
|
|
(%) |
|
|
|
(44) |
|
|
|
74.7 |
|
|
|
69.3 |
|
|
|
(5.4 |
) |
|
|
|
|
| Net expense ratio |
|
|
(%) |
|
|
|
(45) |
|
|
|
34.2 |
|
|
|
33.3 |
|
|
|
(0.8 |
) |
|
|
|
|
| Underwriting result ratio |
|
|
(%) |
|
|
|
(46) |
|
|
|
(8.8 |
) |
|
|
(2.6 |
) |
|
|
6.2 |
|
|
|
|
|
4
Sompo Japan Insurance Inc. (Non-consolidated)
Premiums Written and Claims Paid by Lines of Business
Direct premiums
written (excluding deposits of premiums by policyholders)
|
|
|
|
|
|
|
|
|
|
|
|
|
|
|
|
|
|
|
|
|
|
|
|
|
| |
|
(Millions of yen) |
|
| |
|
Six months ended September 30, 2009
(April 1 to September 30, 2009) |
|
|
Six months ended September 30, 2010
(April 1 to September 30, 2010) |
|
| Business line |
|
Amount |
|
|
% of total
amount |
|
|
Rate of
change |
|
|
Amount |
|
|
% of total
amount |
|
|
Rate of
change |
|
| Fire and allied insurance |
|
|
85,962 |
|
|
|
12.8 |
% |
|
|
(1.3 |
)% |
|
|
83,312 |
|
|
|
12.3 |
% |
|
|
(3.1 |
)% |
| Marine insurance |
|
|
14,498 |
|
|
|
2.2 |
|
|
|
(26.7 |
) |
|
|
16,095 |
|
|
|
2.4 |
|
|
|
11.0 |
|
| Personal accident insurance |
|
|
68,055 |
|
|
|
10.1 |
|
|
|
(1.5 |
) |
|
|
68,042 |
|
|
|
10.0 |
|
|
|
(0.0 |
) |
| Voluntary automobile insurance |
|
|
321,841 |
|
|
|
47.8 |
|
|
|
(2.7 |
) |
|
|
319,815 |
|
|
|
47.2 |
|
|
|
(0.6 |
) |
| Compulsory automobile liability insurance |
|
|
88,480 |
|
|
|
13.1 |
|
|
|
(16.5 |
) |
|
|
90,794 |
|
|
|
13.4 |
|
|
|
2.6 |
|
| Others |
|
|
94,248 |
|
|
|
14.0 |
|
|
|
(0.1 |
) |
|
|
99,624 |
|
|
|
14.7 |
|
|
|
5.7 |
|
|
|
|
|
|
|
|
|
|
|
|
|
|
|
|
|
|
|
|
|
|
|
|
|
|
| Total |
|
|
673,086 |
|
|
|
100.0 |
|
|
|
(4.8 |
) |
|
|
677,684 |
|
|
|
100.0 |
|
|
|
0.7 |
|
| Deposits of premiums by policyholders |
|
|
54,227 |
|
|
|
— |
|
|
|
(26.7 |
) |
|
|
59,446 |
|
|
|
— |
|
|
|
9.6 |
|
|
|
|
|
|
|
|
|
|
|
|
|
|
|
|
|
|
|
|
|
|
|
|
|
|
|
|
|
|
|
|
|
| Net premiums written |
|
|
|
|
|
|
|
|
|
|
|
|
|
|
|
|
|
|
|
|
|
|
|
|
| |
|
(Millions of yen) |
|
| |
|
Six months ended September 30, 2009
(April 1 to September
30, 2009) |
|
|
Six months ended September 30, 2010
(April 1 to September 30,
2010) |
|
| Business line |
|
Amount |
|
|
% of total
amount |
|
|
Rate of
change |
|
|
Amount |
|
|
% of total
amount |
|
|
Rate of
change |
|
| Fire and allied insurance |
|
|
67,676 |
|
|
|
10.5 |
% |
|
|
(3.2 |
)% |
|
|
67,519 |
|
|
|
10.5 |
% |
|
|
(0.2 |
)% |
| Marine insurance |
|
|
12,167 |
|
|
|
1.9 |
|
|
|
(27.5 |
) |
|
|
12,939 |
|
|
|
2.0 |
|
|
|
6.3 |
|
| Personal accident insurance |
|
|
67,482 |
|
|
|
10.5 |
|
|
|
(1.6 |
) |
|
|
67,788 |
|
|
|
10.5 |
|
|
|
0.5 |
|
| Voluntary automobile insurance |
|
|
322,609 |
|
|
|
50.3 |
|
|
|
(2.1 |
) |
|
|
319,777 |
|
|
|
49.7 |
|
|
|
(0.9 |
) |
| Compulsory automobile liability insurance |
|
|
82,320 |
|
|
|
12.8 |
|
|
|
(18.3 |
) |
|
|
85,466 |
|
|
|
13.3 |
|
|
|
3.8 |
|
| Others |
|
|
89,407 |
|
|
|
13.9 |
|
|
|
0.1 |
|
|
|
90,191 |
|
|
|
14.0 |
|
|
|
0.9 |
|
|
|
|
|
|
|
|
|
|
|
|
|
|
|
|
|
|
|
|
|
|
|
|
|
|
| Total |
|
|
641,665 |
|
|
|
100.0 |
|
|
|
(4.9 |
) |
|
|
643,682 |
|
|
|
100.0 |
|
|
|
0.3 |
|
|
|
|
|
|
|
|
|
|
|
|
|
|
|
|
|
|
|
|
|
|
|
|
|
|
|
|
|
|
|
|
|
| Net claims paid |
|
|
|
|
|
|
|
|
|
|
|
|
|
|
|
|
|
|
|
|
|
|
|
|
| |
|
(Millions of yen) |
|
| |
|
Six months ended September 30, 2009
(April 1 to September 30,
2009) |
|
|
Six months ended September 30, 2010
(April 1 to September 30,
2010) |
|
| Business line |
|
Amount |
|
|
Rate of
change |
|
|
Net loss
ratio |
|
|
Amount |
|
|
Rate of
change |
|
|
Net loss
ratio |
|
| Fire and allied insurance |
|
|
28,980 |
|
|
|
1.5 |
% |
|
|
44.5 |
% |
|
|
27,943 |
|
|
|
(3.6 |
)% |
|
|
43.3 |
% |
| Marine insurance |
|
|
6,320 |
|
|
|
(12.6 |
) |
|
|
56.5 |
|
|
|
7,448 |
|
|
|
17.8 |
|
|
|
61.2 |
|
| Personal accident insurance |
|
|
33,179 |
|
|
|
0.1 |
|
|
|
54.3 |
|
|
|
34,190 |
|
|
|
3.0 |
|
|
|
55.8 |
|
| Voluntary automobile insurance |
|
|
194,223 |
|
|
|
(2.0 |
) |
|
|
67.6 |
|
|
|
190,544 |
|
|
|
(1.9 |
) |
|
|
69.4 |
|
| Compulsory automobile liability insurance |
|
|
77,744 |
|
|
|
(4.7 |
) |
|
|
101.8 |
|
|
|
78,071 |
|
|
|
0.4 |
|
|
|
98.8 |
|
| Others |
|
|
100,444 |
|
|
|
139.0 |
|
|
|
116.1 |
|
|
|
60,887 |
|
|
|
(39.4 |
) |
|
|
71.8 |
|
|
|
|
|
|
|
|
|
|
|
|
|
|
|
|
|
|
|
|
|
|
|
|
|
|
| Total |
|
|
440,894 |
|
|
|
12.8 |
|
|
|
74.7 |
|
|
|
399,085 |
|
|
|
(9.5 |
) |
|
|
69.3 |
|
|
|
|
|
|
|
|
|
|
|
|
|
|
|
|
|
|
|
|
|
|
|
|
|
|
5
Sompo Japan Insurance Inc. (Non-consolidated)
Net Incurred Loss related to Natural Disasters (which occurred in the period)
|
|
|
|
|
|
|
|
|
|
|
|
|
|
|
|
|
|
|
|
|
|
|
|
|
| |
|
(Millions of yen) |
|
| |
|
Six months ended September 30, 2009 |
|
|
Six months ended September 30, 2010 |
|
| |
|
Net claims
paid |
|
|
Reserve for
outstanding
losses and
claims |
|
|
Net incurred
loss |
|
|
Net claims
paid |
|
|
Reserve for
outstanding
losses and
claims |
|
|
Net incurred
loss |
|
| Fire and allied insurance |
|
|
1,210 |
|
|
|
300 |
|
|
|
1,511 |
|
|
|
1,046 |
|
|
|
385 |
|
|
|
1,432 |
|
| Voluntary automobile insurance |
|
|
1,252 |
|
|
|
130 |
|
|
|
1,383 |
|
|
|
260 |
|
|
|
56 |
|
|
|
316 |
|
| Others |
|
|
66 |
|
|
|
44 |
|
|
|
110 |
|
|
|
97 |
|
|
|
14 |
|
|
|
111 |
|
|
|
|
|
|
|
|
|
|
|
|
|
|
|
|
|
|
|
|
|
|
|
|
|
|
| Total |
|
|
2,529 |
|
|
|
475 |
|
|
|
3,005 |
|
|
|
1,404 |
|
|
|
456 |
|
|
|
1,860 |
|
|
|
|
|
|
|
|
|
|
|
|
|
|
|
|
|
|
|
|
|
|
|
|
|
|
Notes)
| 1. |
This table represents net claims paid and reserve for outstanding losses and claims related to natural disasters which occurred in the period. |
| 2. |
Net incurred loss = Net claims paid + Reserve for outstanding losses and claims |
“Reserve for outstanding losses and claims” represents amounts deducting reinsurance recoverable on unpaid loss from direct insurance reserve for outstanding losses and claims.
Breakdown of
Operating, General and Administrative Expenses and Loss Adjustment Expenses
|
|
|
|
|
|
|
|
|
|
|
|
|
|
|
|
|
|
|
|
|
|
|
|
|
| |
|
(Millions of yen) |
|
| |
|
Six months ended September 30, 2009 |
|
|
Six months ended September 30, 2010 |
|
| |
|
Amount |
|
|
Increase
(Decrease) |
|
|
Rate of
change |
|
|
Amount |
|
|
Increase
(Decrease) |
|
|
Rate of
change |
|
| |
|
|
|
|
|
|
|
% |
|
|
|
|
|
|
|
|
% |
|
| Personnel expenses |
|
|
82,420 |
|
|
|
(1,993 |
) |
|
|
(2.4 |
) |
|
|
89,881 |
|
|
|
7,461 |
|
|
|
9.1 |
|
| Non-personnel expenses |
|
|
66,181 |
|
|
|
(3,211 |
) |
|
|
(4.6 |
) |
|
|
61,784 |
|
|
|
(4,397 |
) |
|
|
(6.6 |
) |
| Others |
|
|
7,751 |
|
|
|
(436 |
) |
|
|
(5.3 |
) |
|
|
7,884 |
|
|
|
132 |
|
|
|
1.7 |
|
|
|
|
|
|
|
|
|
|
|
|
|
|
|
|
|
|
|
|
|
|
|
|
|
|
| Total |
|
|
156,353 |
|
|
|
(5,641 |
) |
|
|
(3.5 |
) |
|
|
159,550 |
|
|
|
3,196 |
|
|
|
2.0 |
|
|
|
|
|
|
|
|
|
|
|
|
|
|
|
|
|
|
|
|
|
|
|
|
|
|
Reserve for Outstanding Losses and Claims
|
|
|
|
|
|
|
|
|
|
|
|
|
|
|
|
|
| |
|
(Millions of yen) |
|
| |
|
Six months ended September 30, 2009 |
|
|
Six months ended September 30, 2010 |
|
| |
|
Balance
|
|
|
Change
|
|
|
Balance
|
|
|
Change
|
|
| Fire and allied insurance |
|
|
25,641 |
|
|
|
(6,962 |
) |
|
|
25,359 |
|
|
|
(973 |
) |
| Marine insurance |
|
|
12,244 |
|
|
|
(407 |
) |
|
|
11,103 |
|
|
|
(729 |
) |
| Personal accident insurance |
|
|
49,219 |
|
|
|
(1,417 |
) |
|
|
54,333 |
|
|
|
691 |
|
| Voluntary automobile insurance |
|
|
298,650 |
|
|
|
4,073 |
|
|
|
305,687 |
|
|
|
3,628 |
|
| Compulsory automobile liability insurance |
|
|
55,775 |
|
|
|
(1,543 |
) |
|
|
55,210 |
|
|
|
(608 |
) |
| Others |
|
|
244,708 |
|
|
|
(66,040 |
) |
|
|
202,763 |
|
|
|
(35,353 |
) |
|
|
|
|
|
|
|
|
|
|
|
|
|
|
|
|
|
| Total |
|
|
686,240 |
|
|
|
(72,297 |
) |
|
|
654,456 |
|
|
|
(33,344 |
) |
|
|
|
|
|
|
|
|
|
|
|
|
|
|
|
|
|
Notes)
| 1. |
“Balance” of financial guarantee insurance is included in “Others”. |
|
|
|
|
|
|
|
| Six months ended September 30, 2009: |
|
75,127 million yen |
|
Six months ended September 30, 2010: |
|
47,260 million yen |
| 2. |
“Change” of financial guarantee insurance is included in “Others”. |
|
|
|
|
|
|
|
| Six months ended September 30, 2009: |
|
(65,055) million yen |
|
Six months ended September 30, 2010: |
|
(33,404) million yen |
Ordinary
Underwriting Reserves
|
|
|
|
|
|
|
|
|
|
|
|
|
|
|
|
|
| |
|
(Millions of yen) |
|
| |
|
Six months ended September 30, 2009 |
|
|
Six months ended September 30, 2010 |
|
| |
|
Balance
|
|
|
Change
|
|
|
Balance
|
|
|
Change
|
|
| Fire and allied insurance |
|
|
493,842 |
|
|
|
(6,806 |
) |
|
|
489,156 |
|
|
|
(5,365 |
) |
| Marine insurance |
|
|
10,477 |
|
|
|
557 |
|
|
|
9,412 |
|
|
|
636 |
|
| Personal accident insurance |
|
|
79,480 |
|
|
|
7,066 |
|
|
|
83,576 |
|
|
|
6,784 |
|
| Voluntary automobile insurance |
|
|
188,585 |
|
|
|
(1,825 |
) |
|
|
185,107 |
|
|
|
1,555 |
|
| Compulsory automobile liability insurance |
|
|
405,704 |
|
|
|
(19,324 |
) |
|
|
367,201 |
|
|
|
(19,413 |
) |
| Others |
|
|
200,715 |
|
|
|
11,350 |
|
|
|
206,951 |
|
|
|
13,214 |
|
|
|
|
|
|
|
|
|
|
|
|
|
|
|
|
|
|
| Total |
|
|
1,378,806 |
|
|
|
(8,981 |
) |
|
|
1,341,405 |
|
|
|
(2,588 |
) |
|
|
|
|
|
|
|
|
|
|
|
|
|
|
|
|
|
| Note) |
This table excludes reserve for maturity refunds and reserve for dividends to policyholders of savings-type insurance and includes underwriting reserves of household
earthquake and compulsory automobile liability insurance. |
Catastrophic Loss Reserve
|
|
|
|
|
|
|
|
|
|
|
|
|
|
|
|
|
|
|
|
|
|
|
|
|
|
|
|
|
|
|
|
|
|
|
|
|
|
|
|
|
| |
|
(Millions of yen) |
|
| |
|
Six months ended September 30, 2009 |
|
|
Six months ended September 30, 2010 |
|
|
Year ended
March 31, 2010 |
|
| |
|
Reversal |
|
|
Provision |
|
|
Balance |
|
|
Balance
ratio |
|
|
Reversal |
|
|
Provision |
|
|
Balance |
|
|
Balance
ratio |
|
|
Balance |
|
|
Balance
ratio |
|
| |
|
|
|
|
|
|
|
|
|
|
% |
|
|
|
|
|
|
|
|
|
|
|
% |
|
|
|
|
|
% |
|
| Fire and allied insurance |
|
|
— |
|
|
|
9,388 |
|
|
|
138,939 |
|
|
|
105.1 |
|
|
|
— |
|
|
|
9,554 |
|
|
|
158,079 |
|
|
|
119.9 |
|
|
|
148,525 |
|
|
|
105.4 |
|
| Marine insurance |
|
|
— |
|
|
|
454 |
|
|
|
25,795 |
|
|
|
106.0 |
|
|
|
280 |
|
|
|
474 |
|
|
|
26,425 |
|
|
|
102.1 |
|
|
|
26,231 |
|
|
|
110.5 |
|
| Personal accident insurance |
|
|
159 |
|
|
|
2,112 |
|
|
|
89,638 |
|
|
|
66.4 |
|
|
|
946 |
|
|
|
2,125 |
|
|
|
85,766 |
|
|
|
63.3 |
|
|
|
84,587 |
|
|
|
67.5 |
|
| Voluntary automobile insurance |
|
|
33,938 |
|
|
|
19,611 |
|
|
|
33,182 |
|
|
|
5.1 |
|
|
|
31,552 |
|
|
|
19,472 |
|
|
|
26,528 |
|
|
|
4.1 |
|
|
|
38,609 |
|
|
|
6.0 |
|
| Others |
|
|
1,168 |
|
|
|
6,072 |
|
|
|
92,605 |
|
|
|
51.8 |
|
|
|
741 |
|
|
|
6,113 |
|
|
|
102,105 |
|
|
|
56.6 |
|
|
|
96,733 |
|
|
|
60.2 |
|
|
|
|
|
|
|
|
|
|
|
|
|
|
|
|
|
|
|
|
|
|
|
|
|
|
|
|
|
|
|
|
|
|
|
|
|
|
|
|
|
|
| Total |
|
|
35,265 |
|
|
|
37,639 |
|
|
|
380,162 |
|
|
|
34.1 |
|
|
|
33,521 |
|
|
|
37,740 |
|
|
|
398,906 |
|
|
|
35.8 |
|
|
|
394,687 |
|
|
|
36.2 |
|
|
|
|
|
|
|
|
|
|
|
|
|
|
|
|
|
|
|
|
|
|
|
|
|
|
|
|
|
|
|
|
|
|
|
|
|
|
|
|
|
|
| Note) |
Balance ratio = Balance of catastrophic loss reserve / Net premiums written (excluding household earthquake and compulsory automobile liability insurance) × 100
|
As for the interim fiscal year, net premiums written are doubled for the calculation of balance ratio.
6
NIPPONKOA Insurance Co., Ltd. (Non-consolidated)
Overview of Financial Results for the six months ended September 30, 2010
Summary of Results of Operations
|
|
|
|
|
|
|
|
|
|
|
|
|
|
|
|
|
|
|
|
|
|
|
|
|
| |
|
|
|
|
|
|
|
(Millions of yen) |
|
| |
|
|
|
|
|
|
|
Six months ended
September 30, 2009
(April 1
to
September 30, 2009) |
|
|
Six months ended
September 30, 2010
(April 1 to
September 30, 2010) |
|
|
Increase
(Decrease) |
|
|
Rate of
change |
|
| Ordinary income and expenses: |
|
|
|
|
|
|
|
|
|
|
|
|
|
|
|
|
|
|
|
|
|
|
|
|
| Underwriting income and expenses: |
|
|
|
|
|
|
|
|
|
|
|
|
|
|
|
|
|
|
|
|
|
|
|
|
| Direct premiums written
(including deposits of premiums by policyholders) |
|
|
|
|
|
|
(1 |
) |
|
|
353,205 |
|
|
|
353,189 |
|
|
|
(15 |
) |
|
|
(0.0 |
)% |
| Direct premiums written |
|
|
|
|
|
|
(2 |
) |
|
|
335,424 |
|
|
|
333,562 |
|
|
|
(1,862 |
) |
|
|
(0.6 |
) |
| (+) Net premiums written |
|
|
|
|
|
|
(3 |
) |
|
|
319,749 |
|
|
|
316,583 |
|
|
|
(3,165 |
) |
|
|
(1.0 |
) |
| (–) Net claims paid |
|
|
|
|
|
|
(4 |
) |
|
|
194,075 |
|
|
|
194,837 |
|
|
|
762 |
|
|
|
0.4 |
|
| (–) Loss adjustment expenses |
|
|
|
|
|
|
(5 |
) |
|
|
17,577 |
|
|
|
17,628 |
|
|
|
51 |
|
|
|
0.3 |
|
| (–) Net commissions and brokerage fees |
|
|
|
|
|
|
(6 |
) |
|
|
54,069 |
|
|
|
52,746 |
|
|
|
(1,323 |
) |
|
|
(2.4 |
) |
| (+) Deposits of premiums by policyholders |
|
|
|
|
|
|
(7 |
) |
|
|
17,780 |
|
|
|
19,627 |
|
|
|
1,846 |
|
|
|
10.4 |
|
| (+) Interest and dividend income on deposits of premiums, etc. |
|
|
|
|
|
|
(8 |
) |
|
|
11,575 |
|
|
|
10,419 |
|
|
|
(1,155 |
) |
|
|
(10.0 |
) |
| (–) Maturity refunds and dividends to policyholders |
|
|
|
|
|
|
(9 |
) |
|
|
58,508 |
|
|
|
55,661 |
|
|
|
(2,847 |
) |
|
|
(4.9 |
) |
| (–) Reversal of reserve for outstanding losses and claims |
|
|
|
|
|
|
(10 |
) |
|
|
(10,649 |
) |
|
|
(4,031 |
) |
|
|
6,617 |
|
|
|
— |
|
| (–) Reversal of underwriting reserves |
|
|
|
|
|
|
(11 |
) |
|
|
(43,664 |
) |
|
|
(42,272 |
) |
|
|
1,391 |
|
|
|
— |
|
| (+) Other underwriting income and expenses |
|
|
|
|
|
|
(12 |
) |
|
|
(217 |
) |
|
|
(1,039 |
) |
|
|
(822 |
) |
|
|
— |
|
| Gross underwriting margin |
|
|
|
|
|
|
(13 |
) |
|
|
78,970 |
|
|
|
71,021 |
|
|
|
(7,949 |
) |
|
|
(10.1 |
) |
|
|
|
|
|
|
|
|
|
|
|
|
|
|
|
|
|
|
|
|
|
|
|
|
|
| Operating, general and administrative expenses related to underwriting |
|
|
|
|
|
|
(14 |
) |
|
|
59,015 |
|
|
|
59,118 |
|
|
|
103 |
|
|
|
0.2 |
|
| Other income and expenses |
|
|
|
|
|
|
(15 |
) |
|
|
(1,382 |
) |
|
|
(796 |
) |
|
|
586 |
|
|
|
— |
|
| Underwriting profit |
|
|
|
|
|
|
(16 |
) |
|
|
18,573 |
|
|
|
11,107 |
|
|
|
(7,466 |
) |
|
|
(40.2 |
) |
|
|
|
|
|
|
|
|
|
|
|
|
|
|
|
|
|
|
|
|
|
|
|
|
|
| Investment income and expenses: |
|
|
|
|
|
|
|
|
|
|
|
|
|
|
|
|
|
|
|
|
|
|
|
|
| (+) Interest and dividend income |
|
|
|
|
|
|
(17 |
) |
|
|
22,722 |
|
|
|
21,644 |
|
|
|
(1,077 |
) |
|
|
(4.7 |
) |
| (+) Investment gains and losses on money trusts |
|
|
|
|
|
|
(18 |
) |
|
|
530 |
|
|
|
471 |
|
|
|
(58 |
) |
|
|
(11.1 |
) |
| (+) Gains and losses on sales of securities |
|
|
|
|
|
|
(19 |
) |
|
|
5,130 |
|
|
|
1,784 |
|
|
|
(3,345 |
) |
|
|
(65.2 |
) |
| (–) Impairment losses on securities |
|
|
|
|
|
|
(20 |
) |
|
|
363 |
|
|
|
1,177 |
|
|
|
813 |
|
|
|
223.5 |
|
| (+) Transfer of interest and dividend income on deposits of premiums, etc. |
|
|
|
|
|
|
(21 |
) |
|
|
(11,575 |
) |
|
|
(10,419 |
) |
|
|
1,155 |
|
|
|
— |
|
| (+) Gains and losses on derivatives |
|
|
|
|
|
|
(22 |
) |
|
|
1,147 |
|
|
|
997 |
|
|
|
(150 |
) |
|
|
(13.1 |
) |
| (+) Other investment income and expenses |
|
|
|
|
|
|
(23 |
) |
|
|
(3,324 |
) |
|
|
(1,961 |
) |
|
|
1,363 |
|
|
|
— |
|
| Gross investment margin |
|
|
|
|
|
|
(24 |
) |
|
|
14,266 |
|
|
|
11,339 |
|
|
|
(2,927 |
) |
|
|
(20.5 |
) |
|
|
|
|
|
|
|
|
|
|
|
|
|
|
|
|
|
|
|
|
|
|
|
|
|
| (–) Operating, general and administrative expenses |
|
|
|
|
|
|
(25 |
) |
|
|
62,080 |
|
|
|
62,153 |
|
|
|
73 |
|
|
|
0.1 |
|
|
|
|
|
|
|
|
|
|
|
|
|
|
|
|
|
|
|
|
|
|
|
|
|
|
| (+) Other ordinary income and expenses |
|
|
|
|
|
|
(26 |
) |
|
|
25 |
|
|
|
338 |
|
|
|
313 |
|
|
|
1,243.0 |
|
|
|
|
|
|
|
|
|
|
|
|
|
|
|
|
|
|
|
|
|
|
|
|
|
|
| Ordinary profit |
|
|
|
|
|
|
(27 |
) |
|
|
31,182 |
|
|
|
20,546 |
|
|
|
(10,636 |
) |
|
|
(34.1 |
) |
|
|
|
|
|
|
|
|
|
|
|
|
|
|
|
|
|
|
|
|
|
|
|
|
|
| Extraordinary gains and losses: |
|
|
|
|
|
|
|
|
|
|
|
|
|
|
|
|
|
|
|
|
|
|
|
|
| (+) Extraordinary gains |
|
|
|
|
|
|
(28 |
) |
|
|
169 |
|
|
|
600 |
|
|
|
431 |
|
|
|
254.9 |
|
| (–) Extraordinary losses |
|
|
|
|
|
|
(29 |
) |
|
|
3,809 |
|
|
|
2,204 |
|
|
|
(1,605 |
) |
|
|
(42.1 |
) |
|
|
|
|
|
|
|
|
|
|
|
|
|
|
|
|
|
|
|
|
|
|
|
|
|
| Net extraordinary losses |
|
|
|
|
|
|
(30 |
) |
|
|
(3,640 |
) |
|
|
(1,603 |
) |
|
|
2,036 |
|
|
|
— |
|
|
|
|
|
|
|
|
|
|
|
|
|
|
|
|
|
|
|
|
|
|
|
|
|
|
| Income before income taxes |
|
|
|
|
|
|
(31 |
) |
|
|
27,541 |
|
|
|
18,942 |
|
|
|
(8,599 |
) |
|
|
(31.2 |
) |
|
|
|
|
|
|
|
|
|
|
|
|
|
|
|
|
|
|
|
|
|
|
|
|
|
| (–) Income taxes |
|
|
|
|
|
|
(32 |
) |
|
|
6,475 |
|
|
|
1,244 |
|
|
|
(5,231 |
) |
|
|
(80.8 |
) |
| (–) Refunded income taxes for prior period |
|
|
|
|
|
|
(33 |
) |
|
|
— |
|
|
|
— |
|
|
|
— |
|
|
|
— |
|
| (–) Deferred income taxes |
|
|
|
|
|
|
(34 |
) |
|
|
2,569 |
|
|
|
4,548 |
|
|
|
1,978 |
|
|
|
77.0 |
|
|
|
|
|
|
|
|
|
|
|
|
|
|
|
|
|
|
|
|
|
|
|
|
|
|
| Total income taxes |
|
|
|
|
|
|
(35 |
) |
|
|
9,045 |
|
|
|
5,793 |
|
|
|
(3,252 |
) |
|
|
(36.0 |
) |
|
|
|
|
|
|
|
|
|
|
|
|
|
|
|
|
|
|
|
|
|
|
|
|
|
| Net income |
|
|
|
|
|
|
(36 |
) |
|
|
18,496 |
|
|
|
13,148 |
|
|
|
(5,347 |
) |
|
|
(28.9 |
) |
|
|
|
|
|
|
|
|
|
|
|
|
|
|
|
|
|
|
|
|
|
|
|
|
|
|
|
|
|
|
|
|
| Underwriting result: |
|
|
|
|
|
|
|
|
|
|
|
|
|
|
|
|
|
|
|
|
|
|
|
|
| (+) Net premiums written |
|
|
|
|
|
|
(37 |
) |
|
|
319,749 |
|
|
|
316,583 |
|
|
|
(3,165 |
) |
|
|
(1.0 |
) |
|
|
|
|
|
|
|
|
|
|
|
|
|
|
|
|
|
|
|
|
|
|
|
|
|
| (–) Net claims paid |
|
|
|
|
|
|
(38 |
) |
|
|
194,075 |
|
|
|
194,837 |
|
|
|
762 |
|
|
|
0.4 |
|
|
|
|
|
|
|
|
|
|
|
|
|
|
|
|
|
|
|
|
|
|
|
|
|
|
| (–) Loss adjustment expenses |
|
|
|
|
|
|
(39 |
) |
|
|
17,577 |
|
|
|
17,628 |
|
|
|
51 |
|
|
|
0.3 |
|
|
|
|
|
|
|
|
|
|
|
|
|
|
|
|
|
|
|
|
|
|
|
|
|
|
| (–) Operating expenses: |
|
|
|
|
|
|
(40 |
) |
|
|
113,084 |
|
|
|
111,864 |
|
|
|
(1,219 |
) |
|
|
(1.1 |
) |
|
|
|
|
|
|
|
|
|
|
|
|
|
|
|
|
|
|
|
|
|
|
|
|
|
| Net commissions and brokerage fees |
|
|
|
|
|
|
(41 |
) |
|
|
54,069 |
|
|
|
52,746 |
|
|
|
(1,323 |
) |
|
|
(2.4 |
) |
| Operating, general and administrative expenses related to
underwriting |
|
|
|
|
|
|
(42 |
) |
|
|
59,015 |
|
|
|
59,118 |
|
|
|
103 |
|
|
|
0.2 |
|
|
|
|
|
|
|
|
|
|
|
|
|
|
|
|
|
|
|
|
|
|
|
|
|
|
| Underwriting result |
|
|
|
|
|
|
(43 |
) |
|
|
(4,987 |
) |
|
|
(7,747 |
) |
|
|
(2,759 |
) |
|
|
— |
|
|
|
|
|
|
|
|
|
|
|
|
|
|
|
|
|
|
|
|
|
|
|
|
|
|
| Ratios: |
|
|
|
|
|
|
|
|
|
|
|
|
|
|
|
|
|
|
|
|
|
|
|
|
| Net loss ratio |
|
|
(%) |
|
|
|
(44 |
) |
|
|
66.2 |
|
|
|
67.1 |
|
|
|
0.9 |
|
|
|
|
|
| Net expense ratio |
|
|
(%) |
|
|
|
(45 |
) |
|
|
35.4 |
|
|
|
35.3 |
|
|
|
(0.1 |
) |
|
|
|
|
| Underwriting result ratio |
|
|
(%) |
|
|
|
(46 |
) |
|
|
(1.6 |
) |
|
|
(2.4 |
) |
|
|
(0.8 |
) |
|
|
|
|
7
NIPPONKOA Insurance Co., Ltd. (Non-consolidated)
Premiums Written and Claims Paid by Lines of Business
Direct premiums
written (excluding deposits of premiums by policyholders)
|
|
|
|
|
|
|
|
|
|
|
|
|
|
|
|
|
|
|
|
|
|
|
|
|
| |
|
(Millions of yen) |
|
| |
|
Six months ended September 30, 2009
(April 1 to September 30,
2009) |
|
|
Six months ended September 30, 2010
(April 1 to September 30,
2010) |
|
| Business line |
|
Amount |
|
|
% of total
amount |
|
|
Rate of
change |
|
|
Amount |
|
|
% of total
amount |
|
|
Rate of
change |
|
| Fire and allied insurance |
|
|
55,255 |
|
|
|
16.5 |
% |
|
|
(5.0 |
)% |
|
|
55,550 |
|
|
|
16.7 |
% |
|
|
0.5 |
% |
| Marine insurance |
|
|
6,859 |
|
|
|
2.0 |
|
|
|
(30.4 |
) |
|
|
7,410 |
|
|
|
2.2 |
|
|
|
8.0 |
|
| Personal accident insurance |
|
|
27,236 |
|
|
|
8.1 |
|
|
|
(5.5 |
) |
|
|
26,810 |
|
|
|
8.0 |
|
|
|
(1.6 |
) |
| Voluntary automobile insurance |
|
|
160,714 |
|
|
|
47.9 |
|
|
|
(1.8 |
) |
|
|
158,024 |
|
|
|
47.4 |
|
|
|
(1.7 |
) |
| Compulsory automobile liability insurance |
|
|
38,816 |
|
|
|
11.6 |
|
|
|
(15.1 |
) |
|
|
39,452 |
|
|
|
11.8 |
|
|
|
1.6 |
|
| Others |
|
|
46,542 |
|
|
|
13.9 |
|
|
|
(3.7 |
) |
|
|
46,314 |
|
|
|
13.9 |
|
|
|
(0.5 |
) |
|
|
|
|
|
|
|
|
|
|
|
|
|
|
|
|
|
|
|
|
|
|
|
|
|
| Total |
|
|
335,424 |
|
|
|
100.0 |
|
|
|
(5.4 |
) |
|
|
333,562 |
|
|
|
100.0 |
|
|
|
(0.6 |
) |
| Deposits of premiums by policyholders |
|
|
17,780 |
|
|
|
— |
|
|
|
(52.7 |
) |
|
|
19,627 |
|
|
|
— |
|
|
|
10.4 |
|
|
|
|
|
|
|
|
|
|
|
|
|
|
|
|
|
|
|
|
|
|
|
|
|
|
|
|
|
|
|
|
|
| Net premiums written |
|
|
|
|
|
|
|
|
|
|
|
|
|
|
|
|
|
|
|
|
|
|
|
|
| |
|
(Millions of yen) |
|
| |
|
Six months ended September 30, 2009
(April 1 to September 30, 2009) |
|
|
Six months ended September 30, 2010
(April 1 to September 30, 2010) |
|
| Business line |
|
Amount |
|
|
% of total
amount |
|
|
Rate of
change |
|
|
Amount |
|
|
% of total
amount |
|
|
Rate of
change |
|
| Fire and allied insurance |
|
|
43,771 |
|
|
|
13.7 |
% |
|
|
(5.5 |
)% |
|
|
42,394 |
|
|
|
13.4 |
% |
|
|
(3.1 |
)% |
| Marine insurance |
|
|
6,646 |
|
|
|
2.1 |
|
|
|
(28.3 |
) |
|
|
6,948 |
|
|
|
2.2 |
|
|
|
4.5 |
|
| Personal accident insurance |
|
|
27,583 |
|
|
|
8.6 |
|
|
|
(5.0 |
) |
|
|
27,340 |
|
|
|
8.6 |
|
|
|
(0.9 |
) |
| Voluntary automobile insurance |
|
|
160,451 |
|
|
|
50.2 |
|
|
|
(1.9 |
) |
|
|
157,942 |
|
|
|
49.9 |
|
|
|
(1.6 |
) |
| Compulsory automobile liability insurance |
|
|
37,132 |
|
|
|
11.6 |
|
|
|
(18.1 |
) |
|
|
38,280 |
|
|
|
12.1 |
|
|
|
3.1 |
|
| Others |
|
|
44,164 |
|
|
|
13.8 |
|
|
|
(3.4 |
) |
|
|
43,679 |
|
|
|
13.8 |
|
|
|
(1.1 |
) |
|
|
|
|
|
|
|
|
|
|
|
|
|
|
|
|
|
|
|
|
|
|
|
|
|
| Total |
|
|
319,749 |
|
|
|
100.0 |
|
|
|
(5.7 |
) |
|
|
316,583 |
|
|
|
100.0 |
|
|
|
(1.0 |
) |
|
|
|
|
|
|
|
|
|
|
|
|
|
|
|
|
|
|
|
|
|
|
|
|
|
|
|
|
|
|
|
|
| Net claims paid |
|
|
|
|
|
|
|
|
|
|
|
|
|
|
|
|
|
|
|
|
|
|
|
|
|
|
| |
|
(Millions of yen) |
|
| |
|
Six months ended September 30, 2009
(April 1 to September 30, 2009) |
|
|
Six months ended September 30, 2010
(April 1 to September 30, 2010) |
|
| Business line |
|
Amount |
|
|
Rate of
change |
|
|
Net loss
ratio |
|
|
Amount |
|
|
Rate of
change |
|
|
Net loss
ratio |
|
| Fire and allied insurance |
|
|
20,526 |
|
|
|
5.4 |
% |
|
|
50.5 |
% |
|
|
19,076 |
|
|
|
(7.1 |
)% |
|
|
48.6 |
% |
| Marine insurance |
|
|
3,398 |
|
|
|
3.8 |
|
|
|
53.4 |
|
|
|
2,930 |
|
|
|
(13.7 |
) |
|
|
44.1 |
|
| Personal accident insurance |
|
|
15,323 |
|
|
|
(6.3 |
) |
|
|
60.8 |
|
|
|
15,230 |
|
|
|
(0.6 |
) |
|
|
60.7 |
|
| Voluntary automobile insurance |
|
|
97,268 |
|
|
|
0.4 |
|
|
|
66.4 |
|
|
|
101,635 |
|
|
|
4.5 |
|
|
|
70.5 |
|
| Compulsory automobile liability insurance |
|
|
35,612 |
|
|
|
(4.9 |
) |
|
|
103.1 |
|
|
|
35,912 |
|
|
|
0.8 |
|
|
|
100.9 |
|
| Others |
|
|
21,945 |
|
|
|
(9.3 |
) |
|
|
55.2 |
|
|
|
20,051 |
|
|
|
(8.6 |
) |
|
|
51.0 |
|
|
|
|
|
|
|
|
|
|
|
|
|
|
|
|
|
|
|
|
|
|
|
|
|
|
| Total |
|
|
194,075 |
|
|
|
(1.8 |
) |
|
|
66.2 |
|
|
|
194,837 |
|
|
|
0.4 |
|
|
|
67.1 |
|
|
|
|
|
|
|
|
|
|
|
|
|
|
|
|
|
|
|
|
|
|
|
|
|
|
8
NIPPONKOA Insurance Co., Ltd. (Non-consolidated)
Net Incurred Loss related to Natural Disasters (which occurred in the period)
|
|
|
|
|
|
|
|
|
|
|
|
|
|
|
|
|
|
|
|
|
|
|
|
|
| |
|
(Millions of yen) |
|
| |
|
Six months ended September 30, 2009 |
|
|
Six months ended September 30, 2010 |
|
| |
|
Net claims
paid |
|
|
Reserve for
outstanding
losses and
claims |
|
|
Net incurred
loss |
|
|
Net claims
paid |
|
|
Reserve for
outstanding
losses and
claims |
|
|
Net incurred
loss |
|
| Fire and allied insurance |
|
|
1,426 |
|
|
|
810 |
|
|
|
2,236 |
|
|
|
1,312 |
|
|
|
413 |
|
|
|
1,725 |
|
| Voluntary automobile insurance |
|
|
564 |
|
|
|
58 |
|
|
|
623 |
|
|
|
124 |
|
|
|
17 |
|
|
|
141 |
|
| Others |
|
|
157 |
|
|
|
95 |
|
|
|
253 |
|
|
|
119 |
|
|
|
352 |
|
|
|
471 |
|
|
|
|
|
|
|
|
|
|
|
|
|
|
|
|
|
|
|
|
|
|
|
|
|
|
| Total |
|
|
2,148 |
|
|
|
964 |
|
|
|
3,113 |
|
|
|
1,557 |
|
|
|
782 |
|
|
|
2,339 |
|
|
|
|
|
|
|
|
|
|
|
|
|
|
|
|
|
|
|
|
|
|
|
|
|
|
Notes)
| 1. |
This table represents net claims paid and reserve for outstanding losses and claims related to natural disasters which occurred in the period. |
| 2. |
Net incurred loss = Net claims paid + Reserve for outstanding losses and claims “Reserve for outstanding losses and claims” represents amounts deducting
reinsurance recoverable on unpaid loss from direct insurance reserve for outstanding losses and claims. |
Breakdown of Operating, General and Administrative Expenses and Loss Adjustment Expenses
|
|
|
|
|
|
|
|
|
|
|
|
|
|
|
|
|
|
|
|
|
|
|
|
|
| |
|
(Millions of yen) |
|
| |
|
Six months ended September 30, 2009 |
|
|
Six months ended September 30, 2010 |
|
| |
|
Amount |
|
|
Increase
(Decrease) |
|
|
Rate of
change |
|
|
Amount |
|
|
Increase
(Decrease) |
|
|
Rate of
change |
|
| Personnel expenses |
|
|
42,587 |
|
|
|
1,178 |
|
|
|
2.8 |
% |
|
|
44,369 |
|
|
|
1,781 |
|
|
|
4.2 |
% |
| Non-personnel expenses |
|
|
33,122 |
|
|
|
(784 |
) |
|
|
(2.3 |
) |
|
|
31,469 |
|
|
|
(1,653 |
) |
|
|
(5.0 |
) |
| Others |
|
|
3,947 |
|
|
|
(179 |
) |
|
|
(4.3 |
) |
|
|
3,943 |
|
|
|
(3 |
) |
|
|
(0.1 |
) |
|
|
|
|
|
|
|
|
|
|
|
|
|
|
|
|
|
|
|
|
|
|
|
|
|
| Total |
|
|
79,657 |
|
|
|
214 |
|
|
|
0.3 |
|
|
|
79,782 |
|
|
|
124 |
|
|
|
0.2 |
|
|
|
|
|
|
|
|
|
|
|
|
|
|
|
|
|
|
|
|
|
|
|
|
|
|
Reserve for Outstanding Losses and Claims
|
|
|
|
|
|
|
|
|
|
|
|
|
|
|
|
|
| |
|
(Millions of yen) |
|
| |
|
Six months ended September 30, 2009 |
|
|
Six months ended September 30, 2010 |
|
| |
|
Balance |
|
|
Change |
|
|
Balance |
|
|
Change |
|
| Fire and allied insurance |
|
|
22,628 |
|
|
|
(4,382 |
) |
|
|
20,443 |
|
|
|
(1,768 |
) |
| Marine insurance |
|
|
8,111 |
|
|
|
(467 |
) |
|
|
5,262 |
|
|
|
(1,176 |
) |
| Personal accident insurance |
|
|
20,398 |
|
|
|
(1,708 |
) |
|
|
18,171 |
|
|
|
(1,092 |
) |
| Voluntary automobile insurance |
|
|
134,642 |
|
|
|
(5,138 |
) |
|
|
131,684 |
|
|
|
1,048 |
|
| Compulsory automobile liability insurance |
|
|
25,639 |
|
|
|
(663 |
) |
|
|
25,526 |
|
|
|
(190 |
) |
| Others |
|
|
60,956 |
|
|
|
1,711 |
|
|
|
62,752 |
|
|
|
(851 |
) |
|
|
|
|
|
|
|
|
|
|
|
|
|
|
|
|
|
| Total |
|
|
272,377 |
|
|
|
(10,649 |
) |
|
|
263,840 |
|
|
|
(4,031 |
) |
|
|
|
|
|
|
|
|
|
|
|
|
|
|
|
|
|
Ordinary Underwriting Reserves
|
|
|
|
|
|
|
|
|
|
|
|
|
|
|
|
|
| |
|
(Millions of yen) |
|
| |
|
Six months ended September 30, 2009 |
|
|
Six months ended September 30, 2010 |
|
| |
|
Balance |
|
|
Change |
|
|
Balance |
|
|
Change |
|
| Fire and allied insurance |
|
|
356,610 |
|
|
|
(4,627 |
) |
|
|
358,455 |
|
|
|
(4,232 |
) |
| Marine insurance |
|
|
5,339 |
|
|
|
(516 |
) |
|
|
4,797 |
|
|
|
787 |
|
| Personal accident insurance |
|
|
30,521 |
|
|
|
1,842 |
|
|
|
31,041 |
|
|
|
2,144 |
|
| Voluntary automobile insurance |
|
|
91,896 |
|
|
|
(2,058 |
) |
|
|
91,586 |
|
|
|
(109 |
) |
| Compulsory automobile liability insurance |
|
|
186,223 |
|
|
|
(8,960 |
) |
|
|
168,363 |
|
|
|
(8,763 |
) |
| Others |
|
|
82,480 |
|
|
|
3,273 |
|
|
|
80,254 |
|
|
|
2,889 |
|
|
|
|
|
|
|
|
|
|
|
|
|
|
|
|
|
|
| Total |
|
|
753,071 |
|
|
|
(11,047 |
) |
|
|
734,499 |
|
|
|
(7,284 |
) |
|
|
|
|
|
|
|
|
|
|
|
|
|
|
|
|
|
| Note) |
This table excludes reserve for maturity refunds and reserve for dividends to policyholders of savings-type insurance and includes underwriting reserves of household
earthquake and compulsory automobile liability insurance. |
Catastrophic Loss Reserve
|
|
|
|
|
|
|
|
|
|
|
|
|
|
|
|
|
|
|
|
|
|
|
|
|
|
|
|
|
|
|
|
|
|
|
|
|
|
|
|
|
| |
|
(Millions of yen) |
|
| |
|
Six months ended September 30, 2009 |
|
|
Six months ended September 30, 2010 |
|
|
Year ended
March 31, 2010 |
|
| |
|
Reversal |
|
|
Provision |
|
|
Balance |
|
|
Balance
ratio |
|
|
Reversal |
|
|
Provision |
|
|
Balance |
|
|
Balance
ratio |
|
|
Balance |
|
|
Balance
ratio |
|
| Fire and allied insurance |
|
|
— |
|
|
|
2,963 |
|
|
|
117,544 |
|
|
|
137.7 |
% |
|
|
— |
|
|
|
2,865 |
|
|
|
124,003 |
|
|
|
150.2 |
% |
|
|
121,138 |
|
|
|
128.4 |
% |
| Marine insurance |
|
|
— |
|
|
|
305 |
|
|
|
18,941 |
|
|
|
142.5 |
|
|
|
301 |
|
|
|
307 |
|
|
|
19,035 |
|
|
|
137.0 |
|
|
|
19,028 |
|
|
|
141.1 |
|
| Personal accident insurance |
|
|
1,851 |
|
|
|
862 |
|
|
|
24,659 |
|
|
|
44.7 |
|
|
|
1,890 |
|
|
|
855 |
|
|
|
19,981 |
|
|
|
36.5 |
|
|
|
21,016 |
|
|
|
41.5 |
|
| Voluntary automobile insurance |
|
|
16,142 |
|
|
|
11,070 |
|
|
|
17,285 |
|
|
|
5.4 |
|
|
|
21,861 |
|
|
|
10,889 |
|
|
|
10,936 |
|
|
|
3.5 |
|
|
|
21,909 |
|
|
|
6.9 |
|
| Others |
|
|
294 |
|
|
|
2,119 |
|
|
|
50,200 |
|
|
|
56.8 |
|
|
|
394 |
|
|
|
2,107 |
|
|
|
53,214 |
|
|
|
60.9 |
|
|
|
51,501 |
|
|
|
64.6 |
|
|
|
|
|
|
|
|
|
|
|
|
|
|
|
|
|
|
|
|
|
|
|
|
|
|
|
|
|
|
|
|
|
|
|
|
|
|
|
|
|
|
| Total |
|
|
18,288 |
|
|
|
17,322 |
|
|
|
228,632 |
|
|
|
40.6 |
|
|
|
24,448 |
|
|
|
17,025 |
|
|
|
227,170 |
|
|
|
41.0 |
|
|
|
234,593 |
|
|
|
42.1 |
|
|
|
|
|
|
|
|
|
|
|
|
|
|
|
|
|
|
|
|
|
|
|
|
|
|
|
|
|
|
|
|
|
|
|
|
|
|
|
|
|
|
| Note) |
Balance ratio = Balance of catastrophic loss reserve / Net premiums written (excluding household earthquake and compulsory automobile liability insurance) × 100
|
As for the interim fiscal year, net premiums written are doubled for the calculation of balance ratio.
9
| 2. |
Forecasts for the fiscal year ending March 31, 2011 (April 1, 2010 to March 31, 2011) |
NKSJ Holdings, Inc. (Consolidated)
|
|
|
|
|
|
|
|
|
|
|
|
|
|
|
|
|
| |
|
(Yen in hundred millions) |
|
| |
|
Fiscal year ended
March 31, 2010
Result |
|
|
Fiscal year ending
March 31, 2011
Original forecast
(A) |
|
|
Fiscal year ending
March 31, 2011
Revised forecast
(B) |
|
|
Increase
(Decrease)
(B)-(A)
|
|
| Full-year |
|
|
|
|
|
|
|
|
|
|
|
|
|
|
|
|
| Ordinary income: |
|
|
— |
|
|
|
26,420 |
|
|
|
26,250 |
|
|
|
(170 |
) |
| Net premiums written |
|
|
— |
|
|
|
19,620 |
|
|
|
19,520 |
|
|
|
(100 |
) |
| Life insurance premiums written |
|
|
— |
|
|
|
1,820 |
|
|
|
2,060 |
|
|
|
240 |
|
| Ordinary profit |
|
|
— |
|
|
|
480 |
|
|
|
480 |
|
|
|
— |
|
| Net income |
|
|
— |
|
|
|
250 |
|
|
|
250 |
|
|
|
— |
|
| Dividends per share |
|
|
— |
yen |
|
|
20 |
yen |
|
|
20 |
yen |
|
|
— |
yen |
|
|
|
|
|
|
|
|
|
| Fiscal year ending March 31, 2011
Revised forecast |
|
Ordinary profit |
|
|
Net income |
|
| Sompo Japan Insurance Inc. (Consolidated) |
|
|
430 |
|
|
|
220 |
|
|
+ |
|
|
|
|
|
|
|
|
| NIPPONKOA Insurance Co., Ltd. (Consolidated) |
|
|
220 |
|
|
|
130 |
|
|
+ |
|
|
|
|
|
|
|
|
| Consolidation adjustment |
|
|
(170 |
) |
|
|
(100 |
) |
|
= |
|
|
|
|
|
|
|
|
|
|
|
|
|
|
|
|
|
| NKSJ Holdings, Inc. (Consolidated) |
|
|
480 |
|
|
|
250 |
|
|
|
|
|
|
|
|
|
|
| Note) |
Sompo Japan Insurance Inc. (Consolidated) includes Sompo Japan Nipponkoa Asset Management Co., Ltd. |
<Note to consolidation adjustment>
The transaction related to the establishment of NKSJ Holdings, Inc. is accounted for under the purchase method as accounting methods for
business combination. The major component of the “Consolidation adjustment” of the consolidated forecasts for the fiscal year ending March 31, 2011 is the amount of adjustments due to the application of the purchase method.
Sompo Japan Insurance Inc. (Non-consolidated)
|
|
|
|
|
|
|
|
|
|
|
|
|
|
|
|
|
| |
|
(Yen in hundred millions) |
|
| |
|
Fiscal year ended
March 31, 2010
Result |
|
|
Fiscal year ending
March 31, 2011
Original forecast
(A) |
|
|
Fiscal year ending
March 31, 2011
Revised forecast
(B) |
|
|
Increase
(Decrease)
(B)-(A)
|
|
| Full-year |
|
|
|
|
|
|
|
|
|
|
|
|
|
|
|
|
| Net premiums written |
|
|
12,588 |
|
|
|
12,680 |
|
|
|
12,650 |
|
|
|
(30 |
) |
| (excluding compulsory automobile liability insurance) |
|
|
10,941 |
|
|
|
11,045 |
|
|
|
10,965 |
|
|
|
(80 |
) |
| Net loss ratio |
|
|
73.9 |
% |
|
|
72.9 |
% |
|
|
70.8 |
% |
|
|
(2.2 |
)% |
| (excluding financial guarantee insurance and compulsory automobile liability insurance) |
|
|
63.9 |
% |
|
|
64.0 |
% |
|
|
63.5 |
% |
|
|
(0.5 |
)% |
| Net expense ratio |
|
|
34.1 |
% |
|
|
33.1 |
% |
|
|
33.2 |
% |
|
|
0.1 |
% |
| (excluding compulsory automobile liability insurance) |
|
|
35.2 |
% |
|
|
34.2 |
% |
|
|
34.4 |
% |
|
|
0.2 |
% |
| Combined ratio |
|
|
107.9 |
% |
|
|
106.1 |
% |
|
|
104.0 |
% |
|
|
(2.1 |
)% |
| (excluding financial guarantee insurance and compulsory automobile liability insurance) |
|
|
99.1 |
% |
|
|
98.3 |
% |
|
|
98.0 |
% |
|
|
(0.3 |
)% |
| Underwriting profit |
|
|
(25 |
) |
|
|
(140 |
) |
|
|
60 |
|
|
|
200 |
|
| Investment income and expenses |
|
|
652 |
|
|
|
590 |
|
|
|
540 |
|
|
|
(50 |
) |
| Ordinary profit |
|
|
503 |
|
|
|
315 |
|
|
|
470 |
|
|
|
155 |
|
| Net income |
|
|
427 |
|
|
|
170 |
|
|
|
270 |
|
|
|
100 |
|
| Note) |
Net claims paid of financial guarantee insurance is excluded from the figures of net loss ratio and combined ratio, but net premiums written and loss adjustment
expenses of it are not excluded. |
NIPPONKOA Insurance Co., Ltd. (Non-consolidated)
|
|
|
|
|
|
|
|
|
|
|
|
|
|
|
|
|
| |
|
(Yen in hundred millions) |
|
| |
|
Fiscal year ended
March 31, 2010
Result |
|
|
Fiscal year ending
March 31, 2011
Original forecast
(A) |
|
|
Fiscal year ending
March 31, 2011
Revised forecast
(B) |
|
|
Increase
(Decrease)
(B)-(A)
|
|
| Full-year |
|
|
|
|
|
|
|
|
|
|
|
|
|
|
|
|
| Net premiums written |
|
|
6,333 |
|
|
|
6,350 |
|
|
|
6,340 |
|
|
|
(10 |
) |
| (excluding compulsory automobile liability insurance) |
|
|
5,591 |
|
|
|
5,601 |
|
|
|
5,594 |
|
|
|
(7 |
) |
| Net loss ratio |
|
|
69.4 |
% |
|
|
67.5 |
% |
|
|
69.0 |
% |
|
|
1.5 |
% |
| (excluding compulsory automobile liability insurance) |
|
|
65.0 |
% |
|
|
62.8 |
% |
|
|
64.4 |
% |
|
|
1.6 |
% |
| Net expense ratio |
|
|
35.8 |
% |
|
|
35.6 |
% |
|
|
35.6 |
% |
|
|
— |
|
| (excluding compulsory automobile liability insurance) |
|
|
37.3 |
% |
|
|
37.1 |
% |
|
|
37.0 |
% |
|
|
(0.1 |
)% |
| Combined ratio |
|
|
105.2 |
% |
|
|
103.2 |
% |
|
|
104.6 |
% |
|
|
1.4 |
% |
| (excluding compulsory automobile liability insurance) |
|
|
102.2 |
% |
|
|
99.9 |
% |
|
|
101.5 |
% |
|
|
1.6 |
% |
| Underwriting profit |
|
|
22 |
|
|
|
(20 |
) |
|
|
(60 |
) |
|
|
(40 |
) |
| Investment income and expenses |
|
|
312 |
|
|
|
320 |
|
|
|
320 |
|
|
|
— |
|
| Ordinary profit |
|
|
293 |
|
|
|
250 |
|
|
|
220 |
|
|
|
(30 |
) |
| Net income |
|
|
131 |
|
|
|
150 |
|
|
|
130 |
|
|
|
(20 |
) |
10
| 3. |
Overview of Business Results of Principal Consolidated Subsidiaries |
Sompo Japan Insurance Inc. (Non-consolidated)
Interim Balance Sheets
|
|
|
|
|
|
|
|
|
|
|
|
|
| |
|
(Millions of yen) |
|
| |
|
As of September 30, 2010 |
|
|
As of March 31, 2010 |
|
|
Increase
(Decrease) |
|
| |
|
Amount |
|
|
Amount |
|
|
|
|
| Assets: |
|
|
|
|
|
|
|
|
|
|
|
|
| Cash and deposits |
|
|
73,594 |
|
|
|
118,455 |
|
|
|
(44,860 |
) |
| Call loans |
|
|
57,800 |
|
|
|
46,800 |
|
|
|
11,000 |
|
| Receivables under resale agreements |
|
|
82,982 |
|
|
|
61,489 |
|
|
|
21,492 |
|
| Monetary receivables bought |
|
|
33,459 |
|
|
|
34,585 |
|
|
|
(1,126 |
) |
| Money trusts |
|
|
6,170 |
|
|
|
6,773 |
|
|
|
(603 |
) |
| Securities |
|
|
3,418,123 |
|
|
|
3,525,735 |
|
|
|
(107,612 |
) |
| Loans |
|
|
468,196 |
|
|
|
476,173 |
|
|
|
(7,976 |
) |
| Tangible fixed assets |
|
|
210,865 |
|
|
|
212,244 |
|
|
|
(1,379 |
) |
| Intangible fixed assets |
|
|
96 |
|
|
|
758 |
|
|
|
(662 |
) |
| Other assets |
|
|
354,294 |
|
|
|
437,671 |
|
|
|
(83,377 |
) |
| Deferred tax assets |
|
|
163,130 |
|
|
|
121,347 |
|
|
|
41,782 |
|
| Allowance for possible loan losses |
|
|
(3,549 |
) |
|
|
(5,068 |
) |
|
|
1,519 |
|
| Allowance for possible investment losses |
|
|
(7,907 |
) |
|
|
(7,734 |
) |
|
|
(172 |
) |
|
|
|
|
|
|
|
|
|
|
|
|
|
| Total assets |
|
|
4,857,255 |
|
|
|
5,029,232 |
|
|
|
(171,976 |
) |
|
|
|
|
|
|
|
|
|
|
|
|
|
| Liabilities: |
|
|
|
|
|
|
|
|
|
|
|
|
| Underwriting funds: |
|
|
3,732,921 |
|
|
|
3,797,586 |
|
|
|
(64,664 |
) |
| Reserve for outstanding losses and claims |
|
|
654,456 |
|
|
|
687,801 |
|
|
|
(33,344 |
) |
| Underwriting reserves |
|
|
3,078,465 |
|
|
|
3,109,784 |
|
|
|
(31,319 |
) |
| Bonds |
|
|
128,000 |
|
|
|
128,000 |
|
|
|
— |
|
| Other liabilities |
|
|
161,779 |
|
|
|
181,855 |
|
|
|
(20,075 |
) |
| Reserve for retirement benefits |
|
|
79,011 |
|
|
|
76,741 |
|
|
|
2,269 |
|
| Reserve for bonus payments |
|
|
17,365 |
|
|
|
13,405 |
|
|
|
3,959 |
|
| Reserves under the special laws: |
|
|
12,621 |
|
|
|
11,462 |
|
|
|
1,159 |
|
| Reserve for price fluctuation |
|
|
12,621 |
|
|
|
11,462 |
|
|
|
1,159 |
|
|
|
|
|
|
|
|
|
|
|
|
|
|
| Total liabilities |
|
|
4,131,699 |
|
|
|
4,209,051 |
|
|
|
(77,351 |
) |
|
|
|
|
|
|
|
|
|
|
|
|
|
| Net assets: |
|
|
|
|
|
|
|
|
|
|
|
|
| Shareholders’ equity: |
|
|
|
|
|
|
|
|
|
|
|
|
| Common stock |
|
|
70,000 |
|
|
|
70,000 |
|
|
|
— |
|
| Capital surplus |
|
|
24,229 |
|
|
|
24,229 |
|
|
|
— |
|
| Retained earnings |
|
|
336,337 |
|
|
|
338,304 |
|
|
|
(1,967 |
) |
| Total shareholders’ equity |
|
|
430,567 |
|
|
|
432,534 |
|
|
|
(1,967 |
) |
| Valuation and translation adjustments: |
|
|
|
|
|
|
|
|
|
|
|
|
| Unrealized gains on securities available for sale, net of tax |
|
|
294,988 |
|
|
|
386,343 |
|
|
|
(91,355 |
) |
| Total valuation and translation adjustments |
|
|
294,988 |
|
|
|
386,343 |
|
|
|
(91,355 |
) |
| Stock acquisition rights |
|
|
— |
|
|
|
1,302 |
|
|
|
(1,302 |
) |
|
|
|
|
|
|
|
|
|
|
|
|
|
| Total net assets |
|
|
725,555 |
|
|
|
820,181 |
|
|
|
(94,625 |
) |
|
|
|
|
|
|
|
|
|
|
|
|
|
| Total liabilities and net assets |
|
|
4,857,255 |
|
|
|
5,029,232 |
|
|
|
(171,976 |
) |
|
|
|
|
|
|
|
|
|
|
|
|
|
11
Sompo Japan Insurance Inc. (Non-consolidated)
Interim Statements of Income
|
|
|
|
|
|
|
|
|
|
|
|
|
|
|
|
|
|
|
| |
|
|
|
(Millions of yen) |
|
| |
|
|
|
Six months ended
September 30, 2009
(April 1 to
September 30, 2009) |
|
|
Six months ended
September 30, 2010
(April 1
to
September 30, 2010) |
|
|
Increase
(Decrease) |
|
|
Rate of
change |
|
| |
|
|
|
Amount |
|
|
Amount |
|
|
|
|
|
|
|
| Ordinary income: |
|
|
|
|
841,828 |
|
|
|
827,255 |
|
|
|
(14,573 |
) |
|
|
(1.7 |
)% |
| Underwriting income: |
|
|
|
|
800,641 |
|
|
|
790,050 |
|
|
|
(10,591 |
) |
|
|
(1.3 |
) |
| Net premiums written |
|
|
|
|
641,665 |
|
|
|
643,682 |
|
|
|
2,017 |
|
|
|
0.3 |
|
| Deposits of premiums by policyholders |
|
|
|
|
54,227 |
|
|
|
59,446 |
|
|
|
5,218 |
|
|
|
9.6 |
|
| Interest and dividend income on deposits of premiums, etc. |
|
|
|
|
21,141 |
|
|
|
19,612 |
|
|
|
(1,529 |
) |
|
|
(7.2 |
) |
| Reversal of reserve for outstanding losses and claims |
|
|
|
|
72,297 |
|
|
|
33,344 |
|
|
|
(38,953 |
) |
|
|
(53.9 |
) |
| Reversal of underwriting reserves |
|
|
|
|
10,780 |
|
|
|
31,319 |
|
|
|
20,538 |
|
|
|
190.5 |
|
| Investment income: |
|
|
|
|
37,523 |
|
|
|
33,840 |
|
|
|
(3,682 |
) |
|
|
(9.8 |
) |
| Interest and dividend income |
|
|
|
|
46,319 |
|
|
|
43,199 |
|
|
|
(3,120 |
) |
|
|
(6.7 |
) |
| Investment gains on money trusts |
|
|
|
|
0 |
|
|
|
0 |
|
|
|
0 |
|
|
|
3,591.6 |
|
| Investment gains on trading securities |
|
|
|
|
77 |
|
|
|
62 |
|
|
|
(14 |
) |
|
|
(18.8 |
) |
| Gains on sales of securities |
|
|
|
|
4,622 |
|
|
|
3,066 |
|
|
|
(1,556 |
) |
|
|
(33.7 |
) |
| Transfer of interest and dividend income on deposits of premiums, etc. |
|
|
|
|
(21,141 |
) |
|
|
(19,612 |
) |
|
|
1,529 |
|
|
|
— |
|
| Other ordinary income |
|
|
|
|
3,663 |
|
|
|
3,363 |
|
|
|
(299 |
) |
|
|
(8.2 |
) |
|
|
|
|
|
|
|
|
|
|
|
|
|
|
|
|
|
|
|
| Ordinary expenses: |
|
|
|
|
809,690 |
|
|
|
802,150 |
|
|
|
(7,540 |
) |
|
|
(0.9 |
) |
| Underwriting expenses: |
|
|
|
|
668,807 |
|
|
|
666,558 |
|
|
|
(2,248 |
) |
|
|
(0.3 |
) |
| Net claims paid |
|
|
|
|
440,894 |
|
|
|
399,085 |
|
|
|
(41,808 |
) |
|
|
(9.5 |
) |
| Loss adjustment expenses |
|
|
|
|
38,347 |
|
|
|
46,843 |
|
|
|
8,496 |
|
|
|
22.2 |
|
| Net commissions and brokerage fees |
|
|
|
|
107,227 |
|
|
|
107,566 |
|
|
|
339 |
|
|
|
0.3 |
|
| Maturity refunds to policyholders |
|
|
|
|
74,646 |
|
|
|
109,687 |
|
|
|
35,041 |
|
|
|
46.9 |
|
| Investment expenses: |
|
|
|
|
18,277 |
|
|
|
18,707 |
|
|
|
429 |
|
|
|
2.4 |
|
| Investment losses on money trusts |
|
|
|
|
1,262 |
|
|
|
414 |
|
|
|
(847 |
) |
|
|
(67.1 |
) |
| Losses on sales of securities |
|
|
|
|
3,406 |
|
|
|
1,609 |
|
|
|
(1,797 |
) |
|
|
(52.8 |
) |
| Impairment losses on securities |
|
|
|
|
4,148 |
|
|
|
3,789 |
|
|
|
(359 |
) |
|
|
(8.7 |
) |
| Operating, general and administrative expenses |
|
|
|
|
118,006 |
|
|
|
112,706 |
|
|
|
(5,299 |
) |
|
|
(4.5 |
) |
| Other ordinary expenses: |
|
|
|
|
4,598 |
|
|
|
4,177 |
|
|
|
(421 |
) |
|
|
(9.2 |
) |
| Interest paid |
|
|
|
|
2,492 |
|
|
|
3,552 |
|
|
|
1,059 |
|
|
|
42.5 |
|
|
|
|
|
|
|
|
|
|
|
|
|
|
|
|
|
|
|
|
| Ordinary profit |
|
|
|
|
32,138 |
|
|
|
25,105 |
|
|
|
(7,033 |
) |
|
|
(21.9 |
) |
|
|
|
|
|
|
|
|
|
|
|
|
|
|
|
|
|
|
|
| Extraordinary gains: |
|
|
|
|
15,205 |
|
|
|
3,129 |
|
|
|
(12,075 |
) |
|
|
(79.4 |
) |
| Gains on disposal of fixed assets |
|
|
|
|
191 |
|
|
|
40 |
|
|
|
(150 |
) |
|
|
(78.7 |
) |
| Other extraordinary gains |
|
|
|
|
15,013 |
|
|
|
3,088 |
|
|
|
(11,925 |
) |
|
|
(79.4 |
) |
| Extraordinary losses: |
|
|
|
|
3,156 |
|
|
|
2,392 |
|
|
|
(763 |
) |
|
|
(24.2 |
) |
| Losses on disposal of fixed assets |
|
|
|
|
287 |
|
|
|
206 |
|
|
|
(81 |
) |
|
|
(28.3 |
) |
| Impairment losses |
|
|
|
|
— |
|
|
|
259 |
|
|
|
259 |
|
|
|
— |
|
| Provision for reserves under the special laws: |
|
|
|
|
2,868 |
|
|
|
1,159 |
|
|
|
(1,709 |
) |
|
|
(59.6 |
) |
| Provision for reserve for price fluctuation |
|
|
|
|
2,868 |
|
|
|
1,159 |
|
|
|
(1,709 |
) |
|
|
(59.6 |
) |
| Other extraordinary losses |
|
|
|
|
— |
|
|
|
767 |
|
|
|
767 |
|
|
|
— |
|
|
|
|
|
|
|
|
|
|
|
|
|
|
|
|
|
|
|
|
| Income before income taxes |
|
|
|
|
44,188 |
|
|
|
25,842 |
|
|
|
(18,345 |
) |
|
|
(41.5 |
) |
| Income taxes |
|
|
|
|
257 |
|
|
|
218 |
|
|
|
(39 |
) |
|
|
(15.1 |
) |
| Refunded income taxes for prior period |
|
|
|
|
(733 |
) |
|
|
— |
|
|
|
733 |
|
|
|
— |
|
| Deferred income taxes |
|
|
|
|
13,948 |
|
|
|
7,309 |
|
|
|
(6,638 |
) |
|
|
(47.6 |
) |
| Total income taxes |
|
|
|
|
13,472 |
|
|
|
7,528 |
|
|
|
(5,944 |
) |
|
|
(44.1 |
) |
| Net income |
|
|
|
|
30,715 |
|
|
|
18,313 |
|
|
|
(12,401 |
) |
|
|
(40.4 |
) |
|
|
|
|
|
|
| Underwriting result: |
|
|
|
|
|
|
|
|
|
|
|
|
|
|
|
|
|
|
| Net premiums written |
|
(+) |
|
|
641,665 |
|
|
|
643,682 |
|
|
|
2,017 |
|
|
|
0.3 |
|
| Net claims paid |
|
(–) |
|
|
440,894 |
|
|
|
399,085 |
|
|
|
(41,808 |
) |
|
|
(9.5 |
) |
| Loss adjustment expenses |
|
(–) |
|
|
38,347 |
|
|
|
46,843 |
|
|
|
8,496 |
|
|
|
22.2 |
|
| Operating expenses: |
|
(–) |
|
|
219,152 |
|
|
|
214,641 |
|
|
|
(4,511 |
) |
|
|
(2.1 |
) |
| Net commissions and brokerage fees |
|
|
|
|
107,227 |
|
|
|
107,566 |
|
|
|
339 |
|
|
|
0.3 |
|
| Operating, general and administrative expenses related to underwriting |
|
|
|
|
111,925 |
|
|
|
107,074 |
|
|
|
(4,850 |
) |
|
|
(4.3 |
) |
| Underwriting result |
|
|
|
|
(56,728 |
) |
|
|
(16,887 |
) |
|
|
39,840 |
|
|
|
— |
|
|
|
|
|
|
|
|
|
|
|
|
|
|
|
|
|
|
|
|
| Underwriting profit |
|
|
|
|
18,207 |
|
|
|
14,173 |
|
|
|
(4,034 |
) |
|
|
(22.2 |
) |
|
|
|
|
|
|
|
|
|
|
|
|
|
|
|
|
|
|
|
| Ratios: |
|
|
|
|
|
|
|
|
|
|
|
|
|
|
|
|
|
|
| Net loss ratio |
|
(%) |
|
|
74.7 |
|
|
|
69.3 |
|
|
|
(5.4 |
) |
|
|
|
|
| Net expense ratio |
|
(%) |
|
|
34.2 |
|
|
|
33.3 |
|
|
|
(0.8 |
) |
|
|
|
|
| Underwriting result ratio |
|
(%) |
|
|
(8.8 |
) |
|
|
(2.6 |
) |
|
|
6.2 |
|
|
|
|
|
12
Sompo Japan Insurance Inc. (Non-consolidated)
Premiums Written and Claims Paid by Lines of Business
Direct premiums
written (excluding deposits of premiums by policyholders)
|
|
|
|
|
|
|
|
|
|
|
|
|
|
|
|
|
|
|
|
|
|
|
|
|
| |
|
(Millions of yen) |
|
| |
|
Six months ended September 30, 2009
(April 1 to September 30,
2009) |
|
|
Six months ended September 30, 2010
(April 1 to September 30,
2010) |
|
| Business line |
|
Amount |
|
|
% of total
amount |
|
|
Rate of
change |
|
|
Amount |
|
|
% of total
amount |
|
|
Rate of
change |
|
| Fire and allied insurance |
|
|
85,962 |
|
|
|
12.8 |
% |
|
|
(1.3 |
)% |
|
|
83,312 |
|
|
|
12.3 |
% |
|
|
(3.1 |
)% |
| Marine insurance |
|
|
14,498 |
|
|
|
2.2 |
|
|
|
(26.7 |
) |
|
|
16,095 |
|
|
|
2.4 |
|
|
|
11.0 |
|
| Personal accident insurance |
|
|
68,055 |
|
|
|
10.1 |
|
|
|
(1.5 |
) |
|
|
68,042 |
|
|
|
10.0 |
|
|
|
(0.0 |
) |
| Voluntary automobile insurance |
|
|
321,841 |
|
|
|
47.8 |
|
|
|
(2.7 |
) |
|
|
319,815 |
|
|
|
47.2 |
|
|
|
(0.6 |
) |
| Compulsory automobile liability insurance |
|
|
88,480 |
|
|
|
13.1 |
|
|
|
(16.5 |
) |
|
|
90,794 |
|
|
|
13.4 |
|
|
|
2.6 |
|
| Others |
|
|
94,248 |
|
|
|
14.0 |
|
|
|
(0.1 |
) |
|
|
99,624 |
|
|
|
14.7 |
|
|
|
5.7 |
|
|
|
|
|
|
|
|
|
|
|
|
|
|
|
|
|
|
|
|
|
|
|
|
|
|
| Total |
|
|
673,086 |
|
|
|
100.0 |
|
|
|
(4.8 |
) |
|
|
677,684 |
|
|
|
100.0 |
|
|
|
0.7 |
|
| Deposits of premiums by policyholders |
|
|
54,227 |
|
|
|
— |
|
|
|
(26.7 |
) |
|
|
59,446 |
|
|
|
— |
|
|
|
9.6 |
|
|
|
|
|
|
|
|
|
|
|
|
|
|
|
|
|
|
|
|
|
|
|
|
|
|
| Net premiums
written |
|
|
|
|
|
|
|
|
|
|
|
|
|
|
|
|
|
|
|
|
|
|
|
|
| |
|
(Millions of yen) |
|
| |
|
Six
months ended September 30, 2009
(April 1 to September 30, 2009) |
|
|
Six months ended September 30, 2010
(April 1 to September 30, 2010) |
|
| Business line |
|
Amount |
|
|
% of total
amount |
|
|
Rate of
change |
|
|
Amount |
|
|
% of total
amount |
|
|
Rate of
change |
|
| Fire and allied insurance |
|
|
67,676 |
|
|
|
10.5 |
% |
|
|
(3.2 |
)% |
|
|
67,519 |
|
|
|
10.5 |
% |
|
|
(0.2 |
)% |
| Marine insurance |
|
|
12,167 |
|
|
|
1.9 |
|
|
|
(27.5 |
) |
|
|
12,939 |
|
|
|
2.0 |
|
|
|
6.3 |
|
| Personal accident insurance |
|
|
67,482 |
|
|
|
10.5 |
|
|
|
(1.6 |
) |
|
|
67,788 |
|
|
|
10.5 |
|
|
|
0.5 |
|
| Voluntary automobile insurance |
|
|
322,609 |
|
|
|
50.3 |
|
|
|
(2.1 |
) |
|
|
319,777 |
|
|
|
49.7 |
|
|
|
(0.9 |
) |
| Compulsory automobile liability insurance |
|
|
82,320 |
|
|
|
12.8 |
|
|
|
(18.3 |
) |
|
|
85,466 |
|
|
|
13.3 |
|
|
|
3.8 |
|
| Others |
|
|
89,407 |
|
|
|
13.9 |
|
|
|
0.1 |
|
|
|
90,191 |
|
|
|
14.0 |
|
|
|
0.9 |
|
|
|
|
|
|
|
|
|
|
|
|
|
|
|
|
|
|
|
|
|
|
|
|
|
|
| Total |
|
|
641,665 |
|
|
|
100.0 |
|
|
|
(4.9 |
) |
|
|
643,682 |
|
|
|
100.0 |
|
|
|
0.3 |
|
|
|
|
|
|
|
|
|
|
|
|
|
|
|
|
|
|
|
|
|
|
|
|
|
|
| Net claims
paid |
|
|
|
|
|
|
|
|
|
|
|
|
|
|
|
|
|
|
|
|
|
|
|
|
| |
|
(Millions of yen) |
|
| |
|
Six months ended September 30, 2009
(April 1 to September 30, 2009) |
|
|
Six months ended September 30, 2010
(April 1 to September 30,
2010) |
|
| Business line |
|
Amount |
|
|
Rate of
change |
|
|
Net loss
ratio |
|
|
Amount |
|
|
Rate of
change |
|
|
Net loss
ratio |
|
| Fire and allied insurance |
|
|
28,980 |
|
|
|
1.5 |
% |
|
|
44.5 |
% |
|
|
27,943 |
|
|
|
(3.6 |
)% |
|
|
43.3 |
% |
| Marine insurance |
|
|
6,320 |
|
|
|
(12.6 |
) |
|
|
56.5 |
|
|
|
7,448 |
|
|
|
17.8 |
|
|
|
61.2 |
|
| Personal accident insurance |
|
|
33,179 |
|
|
|
0.1 |
|
|
|
54.3 |
|
|
|
34,190 |
|
|
|
3.0 |
|
|
|
55.8 |
|
| Voluntary automobile insurance |
|
|
194,223 |
|
|
|
(2.0 |
) |
|
|
67.6 |
|
|
|
190,544 |
|
|
|
(1.9 |
) |
|
|
69.4 |
|
| Compulsory automobile liability insurance |
|
|
77,744 |
|
|
|
(4.7 |
) |
|
|
101.8 |
|
|
|
78,071 |
|
|
|
0.4 |
|
|
|
98.8 |
|
| Others |
|
|
100,444 |
|
|
|
139.0 |
|
|
|
116.1 |
|
|
|
60,887 |
|
|
|
(39.4 |
) |
|
|
71.8 |
|
|
|
|
|
|
|
|
|
|
|
|
|
|
|
|
|
|
|
|
|
|
|
|
|
|
| Total |
|
|
440,894 |
|
|
|
12.8 |
|
|
|
74.7 |
|
|
|
399,085 |
|
|
|
(9.5 |
) |
|
|
69.3 |
|
|
|
|
|
|
|
|
|
|
|
|
|
|
|
|
|
|
|
|
|
|
|
|
|
|
13
Sompo Japan Insurance Inc. (Non-consolidated)
Solvency Margin Ratio
|
|
|
|
|
|
|
|
|
| |
|
(Millions of yen) |
|
| |
|
As of September 30, 2010 |
|
|
As of March 31, 2010 |
|
| (A) Total Solvency Margin |
|
|
1,511,968 |
|
|
|
1,671,429 |
|
| Capital and funds, etc. |
|
|
428,908 |
|
|
|
414,156 |
|
| Reserve for price fluctuation |
|
|
12,621 |
|
|
|
11,462 |
|
| Contingency reserve |
|
|
611 |
|
|
|
611 |
|
| Catastrophic loss reserve |
|
|
472,834 |
|
|
|
466,702 |
|
| General allowance for possible loan losses |
|
|
279 |
|
|
|
992 |
|
| Unrealized gains on securities (before tax effect deductions) |
|
|
424,689 |
|
|
|
536,605 |
|
| Net unrealized gains and losses on real estate |
|
|
30,249 |
|
|
|
52,252 |
|
| Excess amount of reserve for maturity refunds |
|
|
— |
|
|
|
— |
|
| Subordinated debt, etc. |
|
|
128,000 |
|
|
|
128,000 |
|
| Deductions |
|
|
157,460 |
|
|
|
101,616 |
|
| Others |
|
|
171,234 |
|
|
|
162,261 |
|
| (B) Total Risks |
|
|
401,197 |
|
|
|
417,827 |
|
|
|
|
|
|
|
|
|
|
|
| Underwriting risk (R1) |
|
|
83,977 |
|
|
|
83,975 |
|
| Underwriting risk for third-sector insurance products including accident, sickness and nursing-care insurance (R2)
|
|
|
— |
|
|
|
— |
|
| Guaranteed interest rate risk (R3) |
|
|
5,332 |
|
|
|
5,368 |
|
| Investment risk (R4) |
|
|
168,651 |
|
|
|
185,633 |
|
| Business management risk (R5) |
|
|
9,136 |
|
|
|
9,493 |
|
| Major catastrophe risk (R6) |
|
|
198,869 |
|
|
|
199,686 |
|
| (C) Solvency Margin Ratio
[ (A) / {(B) × 1/2} ] × 100 |
|
|
753.7 |
% |
|
|
800.0 |
% |
| Note) |
The above figures are calculated based on Articles 86 and 87 of the Ordinance for Enforcement of the Insurance Business Law and the provisions of Notification
No. 50 of the Ministry of Finance (1996). |
14
Exposure to Structured Finance
As of September 30, 2010
November 19, 2010
Summary of Financial Guarantee
Insurance
Gains/Losses for FY2010 1H
(Overall financial guarantee)
12.6 billion yen
gain
Primarily due to some recovery from the past fiscal year’s loss payment for ABS-CDO guarantee.
(Unit: billions of yen)
Overall financial guarantee (Gains/Losses)
FY2007
FY2008
FY2009
FY2009 1H
FY2010 1H
Loss payment (*1)
0.1
(37.9)
(63.8)
(59.2)
(18.5)
Provision/Reversal of Loss Reserves (*2)
(30.0)
(109.9)
55.7
60.4
31.1
Gains/Losses
(29.9)
(147.9)
(8.0)
1.1
12.6
*1 Including commutation.
*2 Iincluding
gains/losses of exchange hedge transaction.
Net exposure to ABS-CDOs
Net exposure to ABS-CDOs (after deduction of loss reserves) reduced to 37.1 billion yen. (Decreased by 6.4 billion yen
since March 31, 2010)
(unit: billions of yen)
300.0
259.4
200.0
100.0
78.9
43.5
37.1
0.0
(Unit: billions of yen)
ABS-CDOs (Insured Amount)
3/31/2008
3/31/2009
3/31/2010
9/30/2010
Total of Insured Amount
289.4
218.0
123.1
91.0
Outstanding Loss Reserves
(30.0)
(139.0)
(79.5)
(53.9)
Insured Amount Net of Loss Reserves
259.4
78.9
43.5
37.1
15
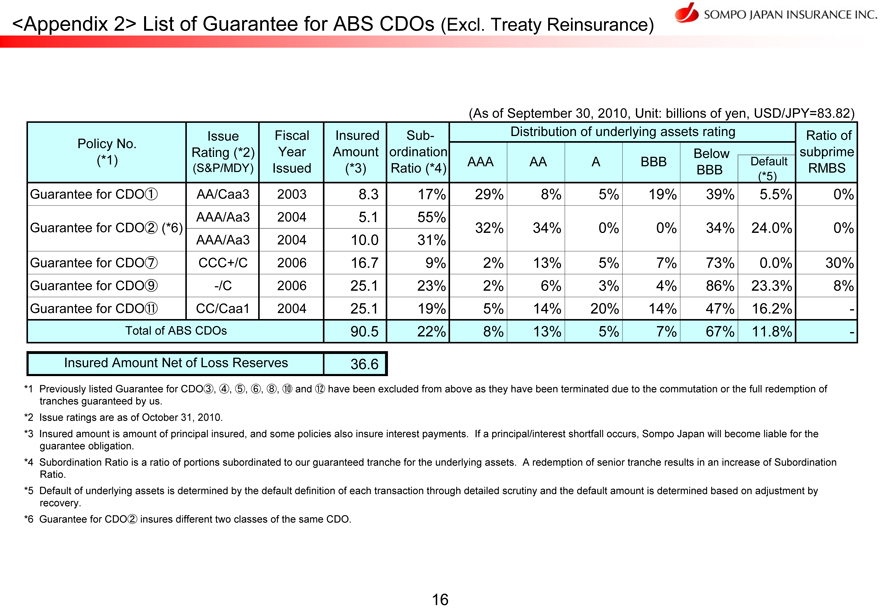
<Appendix1> Financial Guarantee Insurance
(As of September 30, 2010, Unit: billions of yen, USD/JPY=83.82)
Insured Amount
Gains/Losses
Categories
Outstanding
Insured
for FY2010 1H
Direct Insurance
Treaty Reinsurance
Total
Loss Reserve
Amount Net of
(*9)
(*6)
(*7)
(*8)
Loss Reserves
ABS CDOs (backed by pools of asset backed securities) (*1)
90.5
0.5
91.0
53.9
37.1
13.0
CDOs
Corporate CDOs (backed by pools of single
corporate credits)
(*2)
140.4
1.1
141.6
-
141.6
-
CDOs Total
231.0
1.6
232.6
53.9
178.7
13.0
RMBS (*3)
Global RMBS
-
9.8
9.8
0.5
9.2
(0.2)
Domestic RMBS
34.0
-
34.0
-
34.0
-
RMBS Total
34.0
9.8
43.9
0.5
43.3
(0.2)
ABS
CMBS (*4)
-
-
-
-
-
-
Other ABS
Global ABS (*5)
3.0
22.8
25.8
0.5
25.3
0.0
Domestic ABS
7.5
-
7.5
-
7.5
-
Other ABS Total
10.5
22.8
33.3
0.5
32.8
0.0
ABS Total
44.6
32.7
77.3
1.1
76.2
-
Public Finance
-
169.1
169.1
0.1
168.9
(0.1)
Total
275.6
203.4
479.1
55.2
423.8
12.6
*1 ABS CDOs (backed by pools of asset backed securities): The securities backed by securitized assets such as the RMBS,
CDOs and CLOs.
*2 Corporate CDOs (backed by pools of single corporate credits): The securities backed by
assets such as corporate bonds, loans and CDS.
*3 RMBS: Asset Backed Securities where underlying assets are
residential mortgages. 93% of RMBS are rated investment grade (BBB or above) including AAA ratings for 79%.
*4
CMBS: Asset-backed securities where underlying assets are commercial mortgage loans.
*5 5% of global ABS are
U.S. consumer loan-related ABS, while others are mainly related to corporate credit (e.g., leasing receivables).
*6 “Direct Insurance” includes facultative reinsurance policies and 8.5 billion yen of Direct Insurance to cover
U.S. monoline guaranteed notes.
*7 “Treaty Reinsurance” is a portfolio-based reinsuranceis wherea
certain parts of policies underwritten by an primary insurer are ceded automatically to the reinsurer, Sompo Japan, in accordance with the conditions agreed by the primary insurer and the reinsurer.
*8 Recoverable reserve for the transaction which was terminated by claim payment is not included in “Outstanding Loss
Reserve”.
*9 Total amount of 12.6 billion yen gain is comprised of 18.5 billion yen of loss payment
offset by 33.4 billion yen of reversal of loss reserve and 2.2 billion yen losses of foreign exchange hedge transaction for loss reserve. Financial Guarantee Insurance is not supposed to book mark-to-market unrealized gains/losses through income
statement as it is an insurance policy.
<Appendix2> List of Guarantee for ABS CDOs (Excl. Treaty
Reinsurance)
(As of September 30, 2010, Unit: billions of yen, USD/JPY=83.82)
Policy No. Issue Fiscal Insured Sub- Distribution of underlying assets rating Ratio of
Rating (*2) Year Amount ordination Below subprime
(*1) AAA AA A BBB Default
(S&P/MDY) Issued
(*3) Ratio (*4) BBB RMBS
(*5)
Guarantee for CDO(1) AA/Caa3 2003 8.3 17% 29% 8% 5% 19% 39% 5.5% 0%
AAA/Aa3 2004 5.1 55%
Guarantee for CDO(2) (*6)
32% 34% 0% 0% 34% 24.0% 0%
AAA/Aa3 2004 10.0 31%
Guarantee for CDO(7) CCC+/C 2006 16.7 9% 2% 13% 5% 7% 73% 0.0% 30%
Guarantee for CDO(9) -/C 2006 25.1 23% 2% 6% 3% 4% 86% 23.3% 8%
Guarantee for CDO(11) CC/Caa1 2004 25.1 19% 5% 14% 20% 14% 47% 16.2% -
Total of ABS CDOs 90.5 22% 8% 13% 5% 7% 67% 11.8% -
Insured Amount Net of Loss Reserves 36.6
*1 Previously listed Guarantee for CDO (3), (4), (5), (6), (8), (10) and (12) have been excluded from above as they have been terminated due to the commutation or the full redemption of
tranches guaranteed by us.
*2 Issue ratings are as of October 31, 2010.
*3 Insured amount is amount of principal insured, and some policies also insure interest payments. If a principal/interest
shortfall occurs, Sompo Japan will become liable for the guarantee obligation.
*4 Subordination Ratio is a
ratio of portions subordinated to our guaranteed tranche for the underlying assets. A redemption of senior tranche results in an increase of Subordination Ratio.
*5 Default of underlying assets is determined by the default definition of each transaction through detailed scrutiny and the default amount is determined based on adjustment by recovery.
*6 Guarantee for CDO(2) insures different two classes of the same CDO.
16
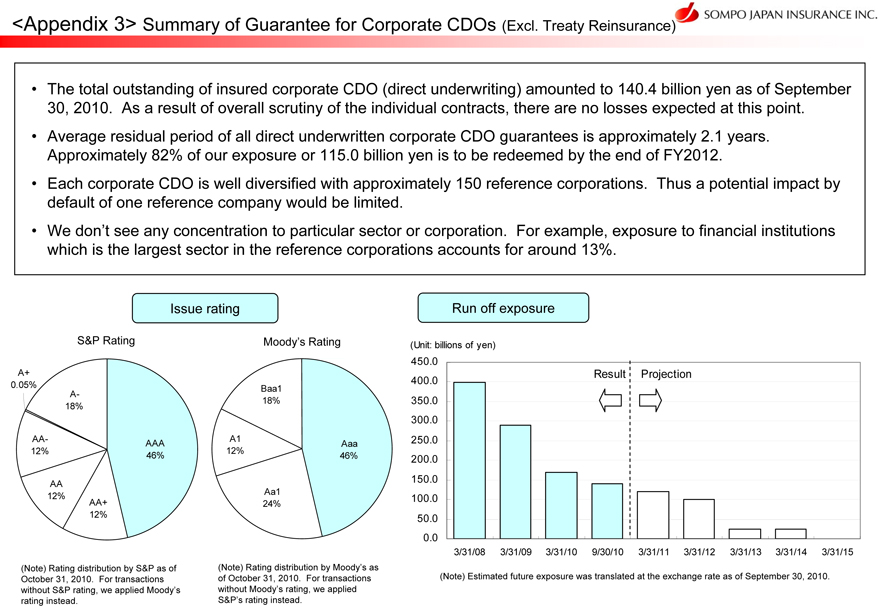
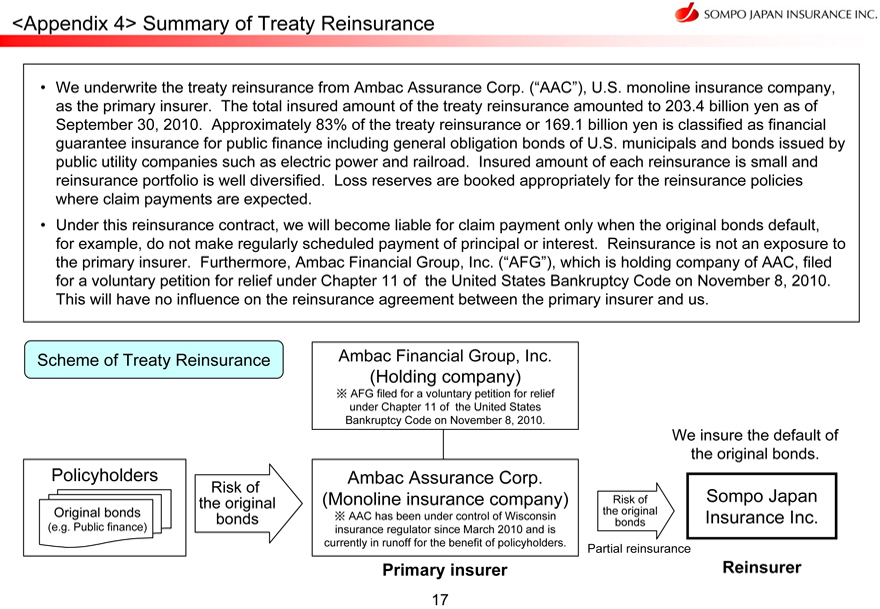
<Appendix3> Summary of Guarantee for Corporate CDOs (Excl. Treaty Reinsurance)
The total outstanding of insured corporate CDO (direct underwriting) amounted to 140.4 billion yen as of
September 30, 2010. As a result of overall scrutiny of the individual contracts, there are no losses expected at this point.
Average residual period of all direct underwritten corporate CDO guarantees is approximately 2.1 years. Approximately 82% of our exposure or 115.0 billion yen is to be redeemed by the end
of FY2012.
Each corporate CDO is well diversified with approximately 150 reference corporations. Thus a
potential impact by default of one reference company would be limited.
We don’t see any concentration to
particular sector or corporation. For example, exposure to financial institutions which is the largest sector in the reference corporations accounts for around 13%.
Issue rating
S&P Rating
A+
0.05%
A-
18%
AA- AAA
12% 46%
AA
12%
AA+
12%
Moody’s Rating
Baa1
18%
A1 Aaa
12% 46%
Aa1
24%
Run off exposure
(Unit: billions of yen)
450.0
400.0 Result Projection
350.0
300.0
250.0
200.0
150.0
100.0
50.0
0.0
3/31/08 3/31/09 3/31/10 9/30/10 3/31/11
3/31/12 3/31/13 3/31/14 3/31/15
(Note) Rating distribution by S&P as of October 31, 2010. For transactions
without S&P rating, we applied Moody’s rating instead.
(Note) Rating distribution by Moody’s as
of October 31, 2010. For transactions we without applied Moody’s rating, S&P’s rating instead.
(Note) Estimated future exposure was translated at the exchange rate as of September 30, 2010.
<Appendix4> Summary of Treaty Reinsurance
We underwrite the treaty reinsurance from Ambac Assuance Corp. (“AAC”), U.S. monoline insurance company, as the primary insurer. The total insured amount of the treaty
reinsurance amounted to 203.4 billion yen as of September 30, 2010. Approximately 83% of the treaty reinsurance or 169.1 billion yen is classified as financial guarantee insurance for public finance including general obligation bonds of U.S.
municipals and bonds issued by public utility companies such as electric power and railroad. Insured amount of each reinsurance is small and reinsurance portfolio is well diversified. Loss reserves are booked appropriately for the reinsurance
policies where claim payments are expected.
Under this reinsurance contract, we will become liable for claim
payment only when the original bonds default, for example, do not make regularly scheduled payment of principal or interest. Reinsurance is not an exposure to the primary insurer. Furthermore, Ambac Financial Group, Inc. (“AFG”), which is
holding company of AAC, filed for a voluntary petition for relief under Chapter 11 of the United States Bankruptcy Code on November 8, 2010.
This will have no influence on the reinsurance agreement between the primary insurer and us.
Scheme of Treaty Reinsurance
Ambac Financial
Group, Inc. (Holding company)
AFG filed for a voluntary petition for relief under Chapter 11 of the United
States Bankruptcy Code on November 8, 2010.
Policyholders
Original bonds
(e.g. Public finance)
Risk of the original bonds
Ambac Assurance Corp. (Monoline insurance company)
AAC has been under control of Wisconsin insurance regulator since March 2010 and is currently in runoff for the benefit of
policyholders.
Primary insurer
Risk of the original bonds
Partial reinsurance
We insure the default of the original bonds.
Sompo Japan Insurance Inc.
Reinsurer
17
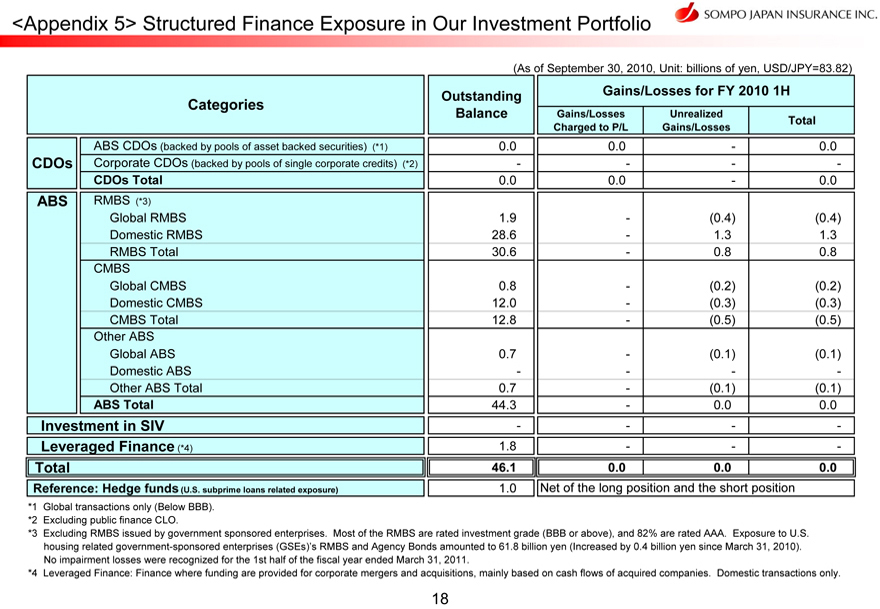
<Appendix 5> Structured Finance Exposure in Our Investment Portfolio
(As of September 30, 2010, Unit: billions of yen, USD/JPY=83.82)
Outstanding Gains/Losses for FY 2010 1H
Categories Balance Gains/Losses Unrealized
Charged to P/L Gains/Losses Total
ABS CDOs (backed by pools of asset backed securities) (*1) 0.0 0.0 - 0.0
CDOs Corporate CDOs (backed by pools of single corporate credits) (*2) - - - -
CDOs Total 0.0 0.0 - 0.0
ABS RMBS (*3)
Global RMBS 1.9 - (0.4) (0.4)
Domestic RMBS 28.6 - 1.3 1.3
RMBS Total 30.6 -
0.8 0.8
CMBS
Global CMBS 0.8 - (0.2) (0.2)
Domestic CMBS 12.0
- - (0.3) (0.3)
CMBS Total 12.8 - (0.5) (0.5)
Other ABS
Global ABS 0.7 - (0.1) (0.1)
Domestic ABS - - - -
Other ABS Total 0.7 - (0.1) (0.1)
ABS Total 44.3 - 0.0 0.0
Investment in SIV - - -
- -
Leveraged Finance (*4) 1.8 - - -
Total 46.1 0.0 0.0 0.0
Reference: Hedge funds
(U.S. subprime loans related exposure) 1.0 Net of the long position and the short position
*1 Global
transactions only (Below BBB).
*2 Excluding public finance CLO.
*3 Excluding RMBS issued by government sponsored enterprises. Most of the RMBS are rated investment grade (BBB or above),
and 82% are rated AAA. Exposure to U.S. housing related government-sponsored enterprises (GSEs)’s RMBS and Agency Bonds amounted to 61.8 billion yen (increased by 0.4 billion yen since March 31, 2010).
No impairment losses were recognized for the 1st half of the fiscal year ended March 31, 2011.
*4 Leveraged Finance: Finance where funding are provided for corporate mergers and acquisitions, mainly based on cash
flows of acquired companies. Domestic transactions only.
18
NIPPONKOA Insurance Co., Ltd. (Non-consolidated)
Interim Balance Sheets
|
|
|
|
|
|
|
|
|
|
|
|
|
| |
|
(Millions of yen) |
|
| |
|
As of September 30, 2010 |
|
|
As of March 31, 2010 |
|
|
Increase
(Decrease) |
|
| |
|
Amount |
|
|
Amount |
|
|
|
|
| Assets: |
|
|
|
|
|
|
|
|
|
|
|
|
| Cash and deposits |
|
|
90,069 |
|
|
|
80,793 |
|
|
|
9,275 |
|
| Call loans |
|
|
40,000 |
|
|
|
50,000 |
|
|
|
(10,000 |
) |
| Monetary receivables bought |
|
|
3,794 |
|
|
|
6,129 |
|
|
|
(2,334 |
) |
| Money trusts |
|
|
56,792 |
|
|
|
56,752 |
|
|
|
40 |
|
| Securities |
|
|
1,746,517 |
|
|
|
1,822,848 |
|
|
|
(76,331 |
) |
| Loans |
|
|
212,653 |
|
|
|
227,417 |
|
|
|
(14,764 |
) |
| Tangible fixed assets |
|
|
127,902 |
|
|
|
130,437 |
|
|
|
(2,535 |
) |
| Intangible fixed assets |
|
|
529 |
|
|
|
534 |
|
|
|
(4 |
) |
| Other assets |
|
|
158,196 |
|
|
|
159,263 |
|
|
|
(1,067 |
) |
| Deferred tax assets |
|
|
73,915 |
|
|
|
60,392 |
|
|
|
13,522 |
|
| Allowance for possible loan losses |
|
|
(2,173 |
) |
|
|
(2,106 |
) |
|
|
(66 |
) |
|
|
|
|
|
|
|
|
|
|
|
|
|
| Total assets |
|
|
2,508,197 |
|
|
|
2,592,464 |
|
|
|
(84,267 |
) |
|
|
|
|
|
|
|
|
|
|
|
|
|
| Liabilities: |
|
|
|
|
|
|
|
|
|
|
|
|
| Underwriting funds: |
|
|
2,012,985 |
|
|
|
2,059,290 |
|
|
|
(46,304 |
) |
| Reserve for outstanding losses and claims |
|
|
263,840 |
|
|
|
267,872 |
|
|
|
(4,031 |
) |
| Underwriting reserves |
|
|
1,749,145 |
|
|
|
1,791,418 |
|
|
|
(42,272 |
) |
| Other liabilities |
|
|
54,142 |
|
|
|
65,184 |
|
|
|
(11,041 |
) |
| Reserve for retirement benefits |
|
|
23,640 |
|
|
|
22,583 |
|
|
|
1,056 |
|
| Reserve for bonus payments |
|
|
5,780 |
|
|
|
6,078 |
|
|
|
(297 |
) |
| Reserve for bonus payments to directors |
|
|
— |
|
|
|
41 |
|
|
|
(41 |
) |
| Reserves under the special laws: |
|
|
7,183 |
|
|
|
5,643 |
|
|
|
1,540 |
|
| Reserve for price fluctuation |
|
|
7,183 |
|
|
|
5,643 |
|
|
|
1,540 |
|
|
|
|
|
|
|
|
|
|
|
|
|
|
| Total liabilities |
|
|
2,103,732 |
|
|
|
2,158,821 |
|
|
|
(55,088 |
) |
|
|
|
|
|
|
|
|
|
|
|
|
|
| Net assets: |
|
|
|
|
|
|
|
|
|
|
|
|
| Shareholders’ equity: |
|
|
|
|
|
|
|
|
|
|
|
|
| Common stock |
|
|
91,249 |
|
|
|
91,249 |
|
|
|
— |
|
| Capital surplus |
|
|
46,702 |
|
|
|
46,702 |
|
|
|
— |
|
| Retained earnings |
|
|
123,731 |
|
|
|
117,202 |
|
|
|
6,529 |
|
| Total shareholders’ equity |
|
|
261,682 |
|
|
|
255,153 |
|
|
|
6,529 |
|
| Valuation and translation adjustments: |
|
|
|
|
|
|
|
|
|
|
|
|
| Unrealized gains on securities available for sale, net of tax |
|
|
137,451 |
|
|
|
175,808 |
|
|
|
(38,357 |
) |
| Deferred gains or losses on hedges |
|
|
5,330 |
|
|
|
2,115 |
|
|
|
3,214 |
|
| Total valuation and translation adjustments |
|
|
142,781 |
|
|
|
177,924 |
|
|
|
(35,142 |
) |
| Stock acquisition rights |
|
|
— |
|
|
|
565 |
|
|
|
(565 |
) |
|
|
|
|
|
|
|
|
|
|
|
|
|
| Total net assets |
|
|
404,464 |
|
|
|
433,642 |
|
|
|
(29,178 |
) |
|
|
|
|
|
|
|
|
|
|
|
|
|
| Total liabilities and net assets |
|
|
2,508,197 |
|
|
|
2,592,464 |
|
|
|
(84,267 |
) |
|
|
|
|
|
|
|
|
|
|
|
|
|
19
NIPPONKOA Insurance Co., Ltd. (Non-consolidated)
Interim Statements of Income
|
|
|
|
|
|
|
|
|
|
|
|
|
|
|
|
|
|
|
| |
|
|
|
(Millions of yen) |
|
| |
|
|
|
Six months ended
September 30, 2009
(April 1
to
September 30, 2009) |
|
|
Six months ended
September 30, 2010
(April 1
to
September 30, 2010) |
|
|
Increase
(Decrease) |
|
|
Rate of
change |
|
| |
|
|
|
Amount |
|
|
Amount |
|
|
|
|
|
|
|
| Ordinary income: |
|
|
|
|
423,767 |
|
|
|
412,305 |
|
|
|
(11,461 |
) |
|
|
(2.7 |
)% |
| Underwriting income: |
|
|
|
|
403,425 |
|
|
|
392,950 |
|
|
|
(10,474 |
) |
|
|
(2.6 |
) |
| Net premiums written |
|
|
|
|
319,749 |
|
|
|
316,583 |
|
|
|
(3,165 |
) |
|
|
(1.0 |
) |
| Deposits of premiums by policyholders |
|
|
|
|
17,780 |
|
|
|
19,627 |
|
|
|
1,846 |
|
|
|
10.4 |
|
| Interest and dividend income on deposits of premiums, etc. |
|
|
|
|
11,575 |
|
|
|
10,419 |
|
|
|
(1,155 |
) |
|
|
(10.0 |
) |
| Reversal of reserve for outstanding losses and claims |
|
|
|
|
10,649 |
|
|
|
4,031 |
|
|
|
(6,617 |
) |
|
|
(62.1 |
) |
| Reversal of underwriting reserves |
|
|
|
|
43,664 |
|
|
|
42,272 |
|
|
|
(1,391 |
) |
|
|
(3.2 |
) |
| Investment income: |
|
|
|
|
19,662 |
|
|
|
18,613 |
|
|
|
(1,049 |
) |
|
|
(5.3 |
) |
| Interest and dividend income |
|
|
|
|
22,722 |
|
|
|
21,644 |
|
|
|
(1,077 |
) |
|
|
(4.7 |
) |
| Investment gains on money trusts |
|
|
|
|
732 |
|
|
|
609 |
|
|
|
(122 |
) |
|
|
(16.8 |
) |
| Gains on sales of securities |
|
|
|
|
6,627 |
|
|
|
5,712 |
|
|
|
(914 |
) |
|
|
(13.8 |
) |
| Transfer of interest and dividend income on deposits of premiums, etc. |
|
|
|
|
(11,575 |
) |
|
|
(10,419 |
) |
|
|
1,155 |
|
|
|
— |
|
| Other ordinary income |
|
|
|
|
678 |
|
|
|
741 |
|
|
|
62 |
|
|
|
9.2 |
|
|
|
|
|
|
|
|
|
|
|
|
|
|
|
|
|
|
|
|
| Ordinary expenses: |
|
|
|
|
392,584 |
|
|
|
391,759 |
|
|
|
(825 |
) |
|
|
(0.2 |
) |
| Underwriting expenses: |
|
|
|
|
324,454 |
|
|
|
321,928 |
|
|
|
(2,525 |
) |
|
|
(0.8 |
) |
| Net claims paid |
|
|
|
|
194,075 |
|
|
|
194,837 |
|
|
|
762 |
|
|
|
0.4 |
|
| Loss adjustment expenses |
|
|
|
|
17,577 |
|
|
|
17,628 |
|
|
|
51 |
|
|
|
0.3 |
|
| Net commissions and brokerage fees |
|
|
|
|
54,069 |
|
|
|
52,746 |
|
|
|
(1,323 |
) |
|
|
(2.4 |
) |
| Maturity refunds to policyholders |
|
|
|
|
58,503 |
|
|
|
55,646 |
|
|
|
(2,856 |
) |
|
|
(4.9 |
) |
| Investment expenses: |
|
|
|
|
5,395 |
|
|
|
7,273 |
|
|
|
1,877 |
|
|
|
34.8 |
|
| Investment losses on money trusts |
|
|
|
|
202 |
|
|
|
138 |
|
|
|
(63 |
) |
|
|
(31.6 |
) |
| Losses on sales of securities |
|
|
|
|
1,496 |
|
|
|
3,928 |
|
|
|
2,431 |
|
|
|
162.5 |
|
| Impairment losses on securities |
|
|
|
|
363 |
|
|
|
1,177 |
|
|
|
813 |
|
|
|
223.5 |
|
| Operating, general and administrative expenses |
|
|
|
|
62,080 |
|
|
|
62,153 |
|
|
|
73 |
|
|
|
0.1 |
|
| Other ordinary expenses: |
|
|
|
|
653 |
|
|
|
402 |
|
|
|
(250 |
) |
|
|
(38.4 |
) |
| Interest paid |
|
|
|
|
27 |
|
|
|
16 |
|
|
|
(10 |
) |
|
|
(39.0 |
) |
|
|
|
|
|
|
|
|
|
|
|
|
|
|
|
|
|
|
|
| Ordinary profit |
|
|
|
|
31,182 |
|
|
|
20,546 |
|
|
|
(10,636 |
) |
|
|
(34.1 |
) |
|
|
|
|
|
|
|
|
|
|
|
|
|
|
|
|
|
|
|
| Extraordinary gains: |
|
|
|
|
169 |
|
|
|
600 |
|
|
|
431 |
|
|
|
254.9 |
|
| Gains on disposal of fixed assets |
|
|
|
|
169 |
|
|
|
35 |
|
|
|
(133 |
) |
|
|
(79.1 |
) |
| Other extraordinary gains |
|
|
|
|
— |
|
|
|
565 |
|
|
|
565 |
|
|
|
— |
|
| Extraordinary losses: |
|
|
|
|
3,809 |
|
|
|
2,204 |
|
|
|
(1,605 |
) |
|
|
(42.1 |
) |
| Losses on disposal of fixed assets |
|
|
|
|
106 |
|
|
|
98 |
|
|
|
(7 |
) |
|
|
(6.9 |
) |
| Impairment losses |
|
|
|
|
68 |
|
|
|
402 |
|
|
|
334 |
|
|
|
489.5 |
|
| Provision for reserves under the special laws: |
|
|
|
|
1,293 |
|
|
|
1,540 |
|
|
|
246 |
|
|
|
19.1 |
|
| Provision for reserve for price fluctuation |
|
|
|
|
1,293 |
|
|
|
1,540 |
|
|
|
246 |
|
|
|
19.1 |
|
| Other extraordinary losses |
|
|
|
|
2,341 |
|
|
|
162 |
|
|
|
(2,179 |
) |
|
|
(93.1 |
) |
|
|
|
|
|
|
|
|
|
|
|
|
|
|
|
|
|
|
|
| Income before income taxes |
|
|
|
|
27,541 |
|
|
|
18,942 |
|
|
|
(8,599 |
) |
|
|
(31.2 |
) |
| Income taxes |
|
|
|
|
6,475 |
|
|
|
1,244 |
|
|
|
(5,231 |
) |
|
|
(80.8 |
) |
| Deferred income taxes |
|
|
|
|
2,569 |
|
|
|
4,548 |
|
|
|
1,978 |
|
|
|
77.0 |
|
| Total income taxes |
|
|
|
|
9,045 |
|
|
|
5,793 |
|
|
|
(3,252 |
) |
|
|
(36.0 |
) |
| Net income |
|
|
|
|
18,496 |
|
|
|
13,148 |
|
|
|
(5,347 |
) |
|
|
(28.9 |
) |
|
|
|
|
|
|
|
|
|
|
|
|
|
|
|
|
|
|
|
|
|
|
|
|
|
| Underwriting result: |
|
|
|
|
|
|
|
|
|
|
|
|
|
|
|
|
|
|
| Net premiums written |
|
(+) |
|
|
319,749 |
|
|
|
316,583 |
|
|
|
(3,165 |
) |
|
|
(1.0 |
) |
| Net claims paid |
|
(–) |
|
|
194,075 |
|
|
|
194,837 |
|
|
|
762 |
|
|
|
0.4 |
|
| Loss adjustment expenses |
|
(–) |
|
|
17,577 |
|
|
|
17,628 |
|
|
|
51 |
|
|
|
0.3 |
|
| Operating expenses: |
|
(–) |
|
|
113,084 |
|
|
|
111,864 |
|
|
|
(1,219 |
) |
|
|
(1.1 |
) |
| Net commissions and brokerage fees |
|
|
|
|
54,069 |
|
|
|
52,746 |
|
|
|
(1,323 |
) |
|
|
(2.4 |
) |
| Operating, general and administrative expenses related to underwriting |
|
|
|
|
59,015 |
|
|
|
59,118 |
|
|
|
103 |
|
|
|
0.2 |
|
| Underwriting result |
|
|
|
|
(4,987 |
) |
|
|
(7,747 |
) |
|
|
(2,759 |
) |
|
|
— |
|
|
|
|
|
|
|
|
|
|
|
|
|
|
|
|
|
|
|
|
| Underwriting profit |
|
|
|
|
18,573 |
|
|
|
11,107 |
|
|
|
(7,466 |
) |
|
|
(40.2 |
) |
|
|
|
|
|
|
|
|
|
|
|
|
|
|
|
|
|
|
|
| Ratios: |
|
|
|
|
|
|
|
|
|
|
|
|
|
|
|
|
|
|
| Net loss ratio |
|
(%) |
|
|
66.2 |
|
|
|
67.1 |
|
|
|
0.9 |
|
|
|
|
|
| Net expense ratio |
|
(%) |
|
|
35.4 |
|
|
|
35.3 |
|
|
|
(0.1 |
) |
|
|
|
|
| Underwriting result ratio |
|
(%) |
|
|
(1.6 |
) |
|
|
(2.4 |
) |
|
|
(0.8 |
) |
|
|
|
|
20
NIPPONKOA Insurance Co., Ltd. (Non-consolidated)
Premiums Written and Claims Paid by Lines of Business
Direct premiums
written (excluding deposits of premiums by policyholders)
|
|
|
|
|
|
|
|
|
|
|
|
|
|
|
|
|
|
|
|
|
|
|
|
|
| |
|
(Millions of yen) |
|
| |
|
Six months ended September 30, 2009
(April 1 to September 30,
2009) |
|
|
Six months ended September 30, 2010
(April 1 to September 30,
2010) |
|
| Business line |
|
Amount |
|
|
% of total
amount |
|
|
Rate of
change |
|
|
Amount |
|
|
% of total
amount |
|
|
Rate of
change |
|
| Fire and allied insurance |
|
|
55,255 |
|
|
|
16.5 |
% |
|
|
(5.0 |
)% |
|
|
55,550 |
|
|
|
16.7 |
% |
|
|
0.5 |
% |
| Marine insurance |
|
|
6,859 |
|
|
|
2.0 |
|
|
|
(30.4 |
) |
|
|
7,410 |
|
|
|
2.2 |
|
|
|
8.0 |
|
| Personal accident insurance |
|
|
27,236 |
|
|
|
8.1 |
|
|
|
(5.5 |
) |
|
|
26,810 |
|
|
|
8.0 |
|
|
|
(1.6 |
) |
| Voluntary automobile insurance |
|
|
160,714 |
|
|
|
47.9 |
|
|
|
(1.8 |
) |
|
|
158,024 |
|
|
|
47.4 |
|
|
|
(1.7 |
) |
| Compulsory automobile liability insurance |
|
|
38,816 |
|
|
|
11.6 |
|
|
|
(15.1 |
) |
|
|
39,452 |
|
|
|
11.8 |
|
|
|
1.6 |
|
| Others |
|
|
46,542 |
|
|
|
13.9 |
|
|
|
(3.7 |
) |
|
|
46,314 |
|
|
|
13.9 |
|
|
|
(0.5 |
) |
|
|
|
|
|
|
|
|
|
|
|
|
|
|
|
|
|
|
|
|
|
|
|
|
|
| Total |
|
|
335,424 |
|
|
|
100.0 |
|
|
|
(5.4 |
) |
|
|
333,562 |
|
|
|
100.0 |
|
|
|
(0.6 |
) |
| Deposits of premiums by policyholders |
|
|
17,780 |
|
|
|
— |
|
|
|
(52.7 |
) |
|
|
19,627 |
|
|
|
— |
|
|
|
10.4 |
|
|
|
|
|
|
|
|
|
|
|
|
|
|
|
|
|
|
|
|
|
|
|
|
|
|
|
| Net premiums written |
|
|
|
| |
|
(Millions of yen) |
|
| |
|
Six months ended September 30, 2009
(April 1 to September 30,
2009) |
|
|
Six months ended September 30, 2010
(April 1 to September 30,
2010) |
|
| Business line |
|
Amount |
|
|
% of total
amount |
|
|
Rate of
change |
|
|
Amount |
|
|
% of total
amount |
|
|
Rate of
change |
|
| Fire and allied insurance |
|
|
43,771 |
|
|
|
13.7 |
% |
|
|
(5.5 |
)% |
|
|
42,394 |
|
|
|
13.4 |
% |
|
|
(3.1 |
)% |
| Marine insurance |
|
|
6,646 |
|
|
|
2.1 |
|
|
|
(28.3 |
) |
|
|
6,948 |
|
|
|
2.2 |
|
|
|
4.5 |
|
| Personal accident insurance |
|
|
27,583 |
|
|
|
8.6 |
|
|
|
(5.0 |
) |
|
|
27,340 |
|
|
|
8.6 |
|
|
|
(0.9 |
) |
| Voluntary automobile insurance |
|
|
160,451 |
|
|
|
50.2 |
|
|
|
(1.9 |
) |
|
|
157,942 |
|
|
|
49.9 |
|
|
|
(1.6 |
) |
| Compulsory automobile liability insurance |
|
|
37,132 |
|
|
|
11.6 |
|
|
|
(18.1 |
) |
|
|
38,280 |
|
|
|
12.1 |
|
|
|
3.1 |
|
| Others |
|
|
44,164 |
|
|
|
13.8 |
|
|
|
(3.4 |
) |
|
|
43,679 |
|
|
|
13.8 |
|
|
|
(1.1 |
) |
|
|
|
|
|
|
|
|
|
|
|
|
|
|
|
|
|
|
|
|
|
|
|
|
|
| Total |
|
|
319,749 |
|
|
|
100.0 |
|
|
|
(5.7 |
) |
|
|
316,583 |
|
|
|
100.0 |
|
|
|
(1.0 |
) |
|
|
|
|
|
|
|
|
|
|
|
|
|
|
|
|
|
|
|
|
|
|
|
|
|
|
| Net claims paid |
|
|
|
| |
|
(Millions of yen) |
|
| |
|
Six months ended September 30, 2009
(April 1 to September
30, 2009) |
|
|
Six months ended September 30, 2010
(April 1 to September
30, 2010) |
|
| Business line |
|
Amount |
|
|
Rate of
change |
|
|
Net loss
ratio |
|
|
Amount |
|
|
Rate of
change |
|
|
Net loss
ratio |
|
| Fire and allied insurance |
|
|
20,526 |
|
|
|
5.4 |
% |
|
|
50.5 |
% |
|
|
19,076 |
|
|
|
(7.1 |
)% |
|
|
48.6 |
% |
| Marine insurance |
|
|
3,398 |
|
|
|
3.8 |
|
|
|
53.4 |
|
|
|
2,930 |
|
|
|
(13.7 |
) |
|
|
44.1 |
|
| Personal accident insurance |
|
|
15,323 |
|
|
|
(6.3 |
) |
|
|
60.8 |
|
|
|
15,230 |
|
|
|
(0.6 |
) |
|
|
60.7 |
|
| Voluntary automobile insurance |
|
|
97,268 |
|
|
|
0.4 |
|
|
|
66.4 |
|
|
|
101,635 |
|
|
|
4.5 |
|
|
|
70.5 |
|
| Compulsory automobile liability insurance |
|
|
35,612 |
|
|
|
(4.9 |
) |
|
|
103.1 |
|
|
|
35,912 |
|
|
|
0.8 |
|
|
|
100.9 |
|
| Others |
|
|
21,945 |
|
|
|
(9.3 |
) |
|
|
55.2 |
|
|
|
20,051 |
|
|
|
(8.6 |
) |
|
|
51.0 |
|
|
|
|
|
|
|
|
|
|
|
|
|
|
|
|
|
|
|
|
|
|
|
|
|
|
| Total |
|
|
194,075 |
|
|
|
(1.8 |
) |
|
|
66.2 |
|
|
|
194,837 |
|
|
|
0.4 |
|
|
|
67.1 |
|
|
|
|
|
|
|
|
|
|
|
|
|
|
|
|
|
|
|
|
|
|
|
|
|
|
21
NIPPONKOA Insurance Co., Ltd. (Non-consolidated)
Solvency Margin Ratio
|
|
|
|
|
|
|
|
|
| |
|
(Millions of yen) |
|
| |
|
As of September 30, 2010 |
|
|
As of March 31, 2010 |
|
| (A) Total Solvency Margin |
|
|
800,633 |
|
|
|
840,210 |
|
| Capital and funds, etc. |
|
|
261,007 |
|
|
|
249,698 |
|
| Reserve for price fluctuation |
|
|
7,183 |
|
|
|
5,643 |
|
| Contingency reserve |
|
|
13 |
|
|
|
12 |
|
| Catastrophic loss reserve |
|
|
279,573 |
|
|
|
285,675 |
|
| General allowance for possible loan losses |
|
|
154 |
|
|
|
40 |
|
| Unrealized gains on securities (before tax effect deductions) |
|
|
189,711 |
|
|
|
242,132 |
|
| Net unrealized gains and losses on real estate |
|
|
23,551 |
|
|
|
24,275 |
|
| Excess amount of reserve for maturity refunds |
|
|
— |
|
|
|
— |
|
| Subordinated debt, etc. |
|
|
— |
|
|
|
— |
|
| Deductions |
|
|
13,269 |
|
|
|
13,269 |
|
| Others |
|
|
52,707 |
|
|
|
46,002 |
|
| (B) Total Risks |
|
|
|
|
|
|
|
|
|
|
|
|
228,494 |
|
|
|
226,293 |
|
| Underwriting risk (R1) |
|
|
39,282 |
|
|
|
39,271 |
|
| Underwriting risk for third-sector insurance products including accident, sickness and nursing-care insurance (R2)
|
|
|
1 |
|
|
|
1 |
|
| Guaranteed interest rate risk (R3) |
|
|
3,055 |
|
|
|
3,088 |
|
| Investment risk (R4) |
|
|
77,583 |
|
|
|
85,444 |
|
| Business management risk (R5) |
|
|
5,072 |
|
|
|
7,492 |
|
| Major catastrophe risk (R6) |
|
|
133,722 |
|
|
|
121,948 |
|
| (C) Solvency Margin Ratio |
|
|
|
|
|
|
|
|
| [ (A) / {(B) × 1/2} ] × 100 |
|
|
700.7 |
% |
|
|
742.5 |
% |
| Note) |
The above figures are calculated based on Articles 86 and 87 of the Ordinance for Enforcement of the Insurance Business Law and the provisions of Notification
No. 50 of the Ministry of Finance (1996). |
22
NIPPONKOA Insurance Co., Ltd. (Non-consolidated)
Investments in the securitized paper and subprime loans (As of September 30, 2010)
Investments by NIPPONKOA in the securitized paper, as of September 30, 2010, are as follows.
| 1. |
SPEs (Special Purpose Entities) |
None.
| 2. |
CDOs (Collateralized Debt Obligations) |
|
|
|
|
|
|
|
|
|
|
|
|
|
|
|
|
|
|
|
|
|
|
|
|
|
| |
|
(Billions of yen) |
|
| |
|
As of September 30, 2010 |
|
|
(Reference) As of March 31, 2010 |
|
| |
|
Fair value |
|
|
Unrealized
gains or losses |
|
|
Impairment
losses |
|
|
Fair value |
|
|
Unrealized
gains or losses |
|
|
Impairment
losses |
|
| CDOs |
|
|
8.4 |
|
|
|
0.1 |
|
|
|
— |
|
|
|
7.8 |
|
|
|
0.1 |
|
|
|
— |
|
| Rated |
|
|
8.0 |
|
|
|
— |
|
|
|
— |
|
|
|
7.2 |
|
|
|
— |
|
|
|
— |
|
| Non-rated |
|
|
0.4 |
|
|
|
0.1 |
|
|
|
— |
|
|
|
0.6 |
|
|
|
0.1 |
|
|
|
— |
|
(Notes)
| (1) |
NIPPONKOA recognized impairment on securities whose fair value is determinable as of the balance sheet date if the fair value declined by 30% or more from carrying
value. Also 30% rule is applied to the securities in the table below. |
| (2) |
Out of the rated CDOs, 12% is rated AAA, 13% is rated AA, 63% is rated A, and 12% is rated BB. |
| (3) |
All of the underlying collateral pool for CDOs are assets supported by the corporate credits. |
| (4) |
95% of the CDOs is domestic and 5% is overseas. |
| (5) |
The ratios for categorizations of the rated CDOs and categorizations of the CDOs by region are calculated using the fair value. |
| (6) |
Other than the figures in the table above, related to CDOs, NIPPONKOA recorded 0.7 billion yen of gains on derivative financial instruments. |
| 3. |
Other subprime/Alt-A exposure |
None.
| 4. |
CMBS (Commercial Mortgage-Backed Security) |
|
|
|
|
|
|
|
|
|
|
|
|
|
|
|
|
|
|
|
|
|
|
|
|
|
| |
|
(Billions of yen) |
|
| |
|
As of September 30, 2010 |
|
|
(Reference) As of March 31, 2010 |
|
| |
Fair value |
|
|
Unrealized
gains or losses |
|
|
Impairment
losses |
|
|
Fair value |
|
|
Unrealized
gains or losses |
|
|
Impairment
losses |
|
| CMBS |
|
|
6.4 |
|
|
|
(0.3 |
) |
|
|
— |
|
|
|
8.8 |
|
|
|
(0.3 |
) |
|
|
(0.1 |
) |
| Domestic |
|
|
6.4 |
|
|
|
(0.3 |
) |
|
|
— |
|
|
|
8.8 |
|
|
|
(0.3 |
) |
|
|
(0.1 |
) |
| Foreign |
|
|
— |
|
|
|
— |
|
|
|
— |
|
|
|
— |
|
|
|
— |
|
|
|
— |
|
| (Note) |
Amount in impairment losses includes the loss on evaluation of securities and other investment expenses. |
None.
| 6. |
CDS (Credit Default Swap) |
NIPPONKOA does not hold CDS that reference the securitized paper including CDOs. NIPPONKOA holds CDS that reference a single credit of a
firm (7.0 billion yen of short commitment notional value, 0.0 billion yen of fair value, 0.0 billion yen of valuation gain).
[Definitions of
securitized assets]
| |
• |
|
SPEs: Special Purpose Entities. A general term of special purpose entities including SIV (Structured Investment Vehicle) that are specialized in
investment of securitized papers. |
| |
• |
|
CDOs: Collateralized Debt Obligations. A securitized notes, which was supported, by asset pool of number of underlying debt securities and loans.
|
| |
• |
|
Alt-A: A type of U.S. mortgage. Alt-A (Mezzanine) is placed in the middle of prime loan, a loan for borrowers with higher credit score, and subprime
loan, a loan for borrowers with lower credit score. |
| |
• |
|
CMBS: Commercial Mortgage-Backed Security. An instrument that securitized the mortgage loans for commercial real estate. |
| |
• |
|
CDS: Credit Default Swap. A swap contract involving trading of credits, which reference the creditworthiness of a corporate or securitized paper,
called a reference credit (entity). |
23
SONPO 24 Insurance Co., Ltd. (Non-consolidated)
Interim Balance Sheets
|
|
|
|
|
|
|
|
|
|
|
|
|
| |
|
(Millions of yen) |
|
| |
|
As of September 30, 2010 |
|
|
As of March 31, 2010 |
|
|
Increase
(Decrease) |
|
| |
|
Amount |
|
|
Amount |
|
|
|
|
| Assets: |
|
|
|
|
|
|
|
|
|
|
|
|
| Cash and deposits |
|
|
2,002 |
|
|
|
1,851 |
|
|
|
150 |
|
| Securities |
|
|
15,907 |
|
|
|
15,618 |
|
|
|
288 |
|
| Tangible fixed assets |
|
|
167 |
|
|
|
182 |
|
|
|
(15 |
) |
| Other assets |
|
|
631 |
|
|
|
810 |
|
|
|
(179 |
) |
|
|
|
|
|
|
|
|
|
|
|
|
|
| Total assets |
|
|
18,708 |
|
|
|
18,463 |
|
|
|
245 |
|
|
|
|
|
|
|
|
|
|
|
|
|
|
| Liabilities: |
|
|
|
|
|
|
|
|
|
|
|
|
| Underwriting funds: |
|
|
8,757 |
|
|
|
8,538 |
|
|
|
218 |
|
| Reserve for outstanding losses and claims |
|
|
2,645 |
|
|
|
2,333 |
|
|
|
312 |
|
| Underwriting reserves |
|
|
6,111 |
|
|
|
6,204 |
|
|
|
(93 |
) |
| Other liabilities |
|
|
1,311 |
|
|
|
1,443 |
|
|
|
(132 |
) |
| Reserve for retirement benefits |
|
|
90 |
|
|
|
79 |
|
|
|
11 |
|
| Reserve for bonus payments |
|
|
82 |
|
|
|
92 |
|
|
|
(10 |
) |
| Reserves under the special laws: |
|
|
21 |
|
|
|
20 |
|
|
|
1 |
|
| Reserve for price fluctuation |
|
|
21 |
|
|
|
20 |
|
|
|
1 |
|
| Deferred tax liabilities |
|
|
87 |
|
|
|
18 |
|
|
|
68 |
|
|
|
|
|
|
|
|
|
|
|
|
|
|
| Total liabilities |
|
|
10,350 |
|
|
|
10,193 |
|
|
|
156 |
|
|
|
|
|
|
|
|
|
|
|
|
|
|
| Net assets: |
|
|
|
|
|
|
|
|
|
|
|
|
| Shareholders’ equity: |
|
|
|
|
|
|
|
|
|
|
|
|
| Common stock |
|
|
19,000 |
|
|
|
19,000 |
|
|
|
— |
|
| Capital surplus |
|
|
19,000 |
|
|
|
19,000 |
|
|
|
— |
|
| Retained earnings |
|
|
(29,795 |
) |
|
|
(29,763 |
) |
|
|
(32 |
) |
| Total shareholders’ equity |
|
|
8,204 |
|
|
|
8,236 |
|
|
|
(32 |
) |
| Valuation and translation adjustments: |
|
|
|
|
|
|
|
|
|
|
|
|
| Unrealized gains on securities available for sale, net of tax |
|
|
154 |
|
|
|
32 |
|
|
|
121 |
|
| Total valuation and translation adjustments |
|
|
154 |
|
|
|
32 |
|
|
|
121 |
|
|
|
|
|
|
|
|
|
|
|
|
|
|
| Total net assets |
|
|
8,358 |
|
|
|
8,269 |
|
|
|
88 |
|
|
|
|
|
|
|
|
|
|
|
|
|
|
| Total liabilities and net assets |
|
|
18,708 |
|
|
|
18,463 |
|
|
|
245 |
|
|
|
|
|
|
|
|
|
|
|
|
|
|
24
SONPO 24 Insurance Co., Ltd. (Non-consolidated)
Interim Statements of Income
|
|
|
|
|
|
|
|
|
|
|
|
|
|
|
|
|
|
|
|
|
| |
|
|
|
|
(Millions of yen) |
|
| |
|
|
|
|
Six months ended
September 30, 2009
(April 1
to
September 30, 2009) |
|
|
Six months ended
September 30, 2010
(April 1
to
September 30, 2010) |
|
|
Increase
(Decrease) |
|
|
Rate of
change |
|
| |
|
|
|
|
Amount |
|
|
Amount |
|
|
|
|
|
|
|
| Ordinary income: |
|
|
|
|
|
|
4,756 |
|
|
|
5,298 |
|
|
|
542 |
|
|
|
11.4 |
% |
| Underwriting income: |
|
|
|
|
|
|
4,708 |
|
|
|
5,223 |
|
|
|
514 |
|
|
|
10.9 |
|
| Net premiums written |
|
|
|
|
|
|
4,703 |
|
|
|
5,124 |
|
|
|
421 |
|
|
|
9.0 |
|
| Interest and dividend income on deposits of premiums, etc. |
|
|
|
|
|
|
5 |
|
|
|
4 |
|
|
|
(0 |
) |
|
|
(15.9 |
) |
| Reversal of underwriting reserves |
|
|
|
|
|
|
— |
|
|
|
93 |
|
|
|
93 |
|
|
|
— |
|
| Investment income: |
|
|
|
|
|
|
47 |
|
|
|
75 |
|
|
|
28 |
|
|
|
60.2 |
|
| Interest and dividend income |
|
|
|
|
|
|
52 |
|
|
|
49 |
|
|
|
(2 |
) |
|
|
(5.4 |
) |
| Gains on sales of securities |
|
|
|
|
|
|
— |
|
|
|
30 |
|
|
|
30 |
|
|
|
— |
|
| Transfer of interest and dividend income on deposits of premiums, etc. |
|
|
|
|
|
|
(5 |
) |
|
|
(4 |
) |
|
|
0 |
|
|
|
— |
|
| Other ordinary income |
|
|
|
|
|
|
0 |
|
|
|
0 |
|
|
|
(0 |
) |
|
|
(6.3 |
) |
|
|
|
|
|
|
|
|
|
|
|
|
|
|
|
|
|
|
|
|
|
| Ordinary expenses: |
|
|
|
|
|
|
4,813 |
|
|
|
5,327 |
|
|
|
514 |
|
|
|
10.7 |
|
| Underwriting expenses: |
|
|
|
|
|
|
3,384 |
|
|
|
4,021 |
|
|
|
636 |
|
|
|
18.8 |
|
| Net claims paid |
|
|
|
|
|
|
2,525 |
|
|
|
3,065 |
|
|
|
539 |
|
|
|
21.4 |
|
| Loss adjustment expenses |
|
|
|
|
|
|
300 |
|
|
|
315 |
|
|
|
14 |
|
|
|
4.7 |
|
| Net commissions and brokerage fees |
|
|
|
|
|
|
308 |
|
|
|
328 |
|
|
|
19 |
|
|
|
6.4 |
|
| Provision for reserve for outstanding losses and claims |
|
|
|
|
|
|
51 |
|
|
|
312 |
|
|
|
260 |
|
|
|
506.4 |
|
| Provision for underwriting reserves |
|
|
|
|
|
|
197 |
|
|
|
— |
|
|
|
(197 |
) |
|
|
(100.0 |
) |
| Operating, general and administrative expenses |
|
|
|
|
|
|
1,429 |
|
|
|
1,306 |
|
|
|
(122 |
) |
|
|
(8.6 |
) |
| Other ordinary expenses: |
|
|
|
|
|
|
0 |
|
|
|
0 |
|
|
|
(0 |
) |
|
|
(94.4 |
) |
|
|
|
|
|
|
|
|
|
|
|
|
|
|
|
|
|
|
|
|
|
| Ordinary loss |
|
|
|
|
|
|
(57 |
) |
|
|
(28 |
) |
|
|
28 |
|
|
|
— |
|
|
|
|
|
|
|
|
|
|
|
|
|
|
|
|
|
|
|
|
|
|
| Extraordinary losses: |
|
|
|
|
|
|
5 |
|
|
|
2 |
|
|
|
(3 |
) |
|
|
(59.2 |
) |
| Losses on disposal of fixed assets |
|
|
|
|
|
|
0 |
|
|
|
0 |
|
|
|
(0 |
) |
|
|
(16.2 |
) |
| Provision for reserves under the special laws: |
|
|
|
|
|
|
1 |
|
|
|
1 |
|
|
|
0 |
|
|
|
0.5 |
|
| Provision for reserve for price fluctuation |
|
|
|
|
|
|
1 |
|
|
|
1 |
|
|
|
0 |
|
|
|
0.5 |
|
| Other extraordinary losses |
|
|
|
|
|
|
2 |
|
|
|
— |
|
|
|
(2 |
) |
|
|
(100.0 |
) |
|
|
|
|
|
|
|
|
|
|
|
|
|
|
|
|
|
|
|
|
|
| Loss before income taxes |
|
|
|
|
|
|
(62 |
) |
|
|
(30 |
) |
|
|
31 |
|
|
|
— |
|
| Income taxes |
|
|
|
|
|
|
1 |
|
|
|
1 |
|
|
|
— |
|
|
|
— |
|
| Total income taxes |
|
|
|
|
|
|
1 |
|
|
|
1 |
|
|
|
— |
|
|
|
— |
|
| Net loss |
|
|
|
|
|
|
(64 |
) |
|
|
(32 |
) |
|
|
31 |
|
|
|
— |
|
|
|
|
|
|
|
|
|
|
|
|
|
|
|
|
|
|
|
|
|
|
|
|
|
|
|
|
| Underwriting result: |
|
|
|
|
|
|
|
|
|
|
|
|
|
|
|
|
|
|
|
|
| Net premiums written |
|
|
(+ |
) |
|
|
4,703 |
|
|
|
5,124 |
|
|
|
421 |
|
|
|
9.0 |
|
| Net claims paid |
|
|
(– |
) |
|
|
2,525 |
|
|
|
3,065 |
|
|
|
539 |
|
|
|
21.4 |
|
| Loss adjustment expenses |
|
|
(– |
) |
|
|
300 |
|
|
|
315 |
|
|
|
14 |
|
|
|
4.7 |
|
| Operating expenses: |
|
|
(– |
) |
|
|
1,737 |
|
|
|
1,633 |
|
|
|
(104 |
) |
|
|
(6.0 |
) |
| Net commissions and brokerage fees |
|
|
|
|
|
|
308 |
|
|
|
328 |
|
|
|
19 |
|
|
|
6.4 |
|
| Operating, general and administrative expenses related to underwriting |
|
|
|
|
|
|
1,429 |
|
|
|
1,305 |
|
|
|
(123 |
) |
|
|
(8.7 |
) |
| Underwriting result |
|
|
|
|
|
|
139 |
|
|
|
111 |
|
|
|
(27 |
) |
|
|
(20.1 |
) |
|
|
|
|
|
|
|
|
|
|
|
|
|
|
|
|
|
|
|
|
|
| Underwriting profit |
|
|
|
|
|
|
(104 |
) |
|
|
(103 |
) |
|
|
1 |
|
|
|
— |
|
|
|
|
|
|
|
|
|
|
|
|
|
|
|
|
|
|
|
|
|
|
| Ratios: |
|
|
|
|
|
|
|
|
|
|
|
|
|
|
|
|
|
|
|
|
| Net loss ratio |
|
|
(% |
) |
|
|
60.1 |
|
|
|
66.0 |
|
|
|
5.9 |
|
|
|
|
|
| Net expense ratio |
|
|
(% |
) |
|
|
36.9 |
|
|
|
31.9 |
|
|
|
(5.0 |
) |
|
|
|
|
| Underwriting result ratio |
|
|
(% |
) |
|
|
3.0 |
|
|
|
2.2 |
|
|
|
(0.8 |
) |
|
|
|
|
25
SONPO 24 Insurance Co., Ltd. (Non-consolidated)
Premiums Written and Claims Paid by Lines of Business
Direct premiums
written (excluding deposits of premiums by policyholders)
|
|
|
|
|
|
|
|
|
|
|
|
|
|
|
|
|
|
|
|
|
|
|
|
|
| |
|
(Millions of yen) |
|
| |
|
Six months ended September 30, 2009
(April 1 to September 30,
2009) |
|
|
Six months ended September 30, 2010
(April 1 to September 30,
2010) |
|
| Business line |
|
Amount |
|
|
% of total
amount |
|
|
Rate of
change |
|
|
Amount |
|
|
% of total
amount |
|
|
Rate of
change |
|
| Fire and allied insurance |
|
|
— |
|
|
|
— |
% |
|
|
— |
% |
|
|
— |
|
|
|
— |
% |
|
|
— |
% |
| Marine insurance |
|
|
— |
|
|
|
— |
|
|
|
— |
|
|
|
— |
|
|
|
— |
|
|
|
— |
|
| Personal accident insurance |
|
|
— |
|
|
|
— |
|
|
|
— |
|
|
|
— |
|
|
|
— |
|
|
|
— |
|
| Voluntary automobile insurance |
|
|
4,663 |
|
|
|
100.0 |
|
|
|
19.5 |
|
|
|
5,081 |
|
|
|
100.0 |
|
|
|
9.0 |
|
| Compulsory automobile liability insurance |
|
|
— |
|
|
|
— |
|
|
|
— |
|
|
|
— |
|
|
|
— |
|
|
|
— |
|
| Others |
|
|
— |
|
|
|
— |
|
|
|
— |
|
|
|
— |
|
|
|
— |
|
|
|
— |
|
|
|
|
|
|
|
|
|
|
|
|
|
|
|
|
|
|
|
|
|
|
|
|
|
|
| Total |
|
|
4,663 |
|
|
|
100.0 |
|
|
|
19.5 |
|
|
|
5,081 |
|
|
|
100.0 |
|
|
|
9.0 |
|
| Deposits of premiums by policyholders |
|
|
— |
|
|
|
— |
|
|
|
— |
|
|
|
— |
|
|
|
— |
|
|
|
— |
|
|
|
|
|
|
|
|
|
|
|
|
|
|
|
|
|
|
|
|
|
|
|
|
|
|
Net premiums written
|
|
|
|
|
|
|
|
|
|
|
|
|
|
|
|
|
|
|
|
|
|
|
|
|
| |
|
(Millions of yen) |
|
| |
|
Six months ended September 30, 2009
(April 1 to September 30,
2009) |
|
|
Six months ended September 30, 2010
(April 1 to September 30,
2010) |
|
| Business line |
|
Amount |
|
|
% of total
amount |
|
|
Rate of
change |
|
|
Amount |
|
|
% of total
amount |
|
|
Rate of
change |
|
| Fire and allied insurance |
|
|
— |
|
|
|
— |
% |
|
|
— |
% |
|
|
— |
|
|
|
— |
% |
|
|
— |
% |
| Marine insurance |
|
|
— |
|
|
|
— |
|
|
|
— |
|
|
|
— |
|
|
|
— |
|
|
|
— |
|
| Personal accident insurance |
|
|
— |
|
|
|
— |
|
|
|
— |
|
|
|
— |
|
|
|
— |
|
|
|
— |
|
| Voluntary automobile insurance |
|
|
4,623 |
|
|
|
98.3 |
|
|
|
19.7 |
|
|
|
5,037 |
|
|
|
98.3 |
|
|
|
9.0 |
|
| Compulsory automobile liability insurance |
|
|
79 |
|
|
|
1.7 |
|
|
|
(11.9 |
) |
|
|
87 |
|
|
|
1.7 |
|
|
|
9.8 |
|
| Others |
|
|
— |
|
|
|
— |
|
|
|
— |
|
|
|
— |
|
|
|
— |
|
|
|
— |
|
|
|
|
|
|
|
|
|
|
|
|
|
|
|
|
|
|
|
|
|
|
|
|
|
|
| Total |
|
|
4,703 |
|
|
|
100.0 |
|
|
|
19.0 |
|
|
|
5,124 |
|
|
|
100.0 |
|
|
|
9.0 |
|
|
|
|
|
|
|
|
|
|
|
|
|
|
|
|
|
|
|
|
|
|
|
|
|
|
Net claims paid
|
|
|
|
|
|
|
|
|
|
|
|
|
|
|
|
|
|
|
|
|
|
|
|
|
| |
|
(Millions of yen) |
|
| |
|
Six months ended September 30, 2009
(April 1 to September 30,
2009) |
|
|
Six months ended September 30, 2010
(April 1 to September 30,
2010) |
|
| Business line |
|
Amount |
|
|
Rate of
change |
|
|
Net loss
ratio |
|
|
Amount |
|
|
Rate of
change |
|
|
Net loss
ratio |
|
| Fire and allied insurance |
|
|
— |
|
|
|
— |
% |
|
|
— |
% |
|
|
— |
|
|
|
— |
% |
|
|
— |
% |
| Marine insurance |
|
|
— |
|
|
|
— |
|
|
|
— |
|
|
|
— |
|
|
|
— |
|
|
|
— |
|
| Personal accident insurance |
|
|
— |
|
|
|
— |
|
|
|
— |
|
|
|
— |
|
|
|
— |
|
|
|
— |
|
| Voluntary automobile insurance |
|
|
2,436 |
|
|
|
3.9 |
|
|
|
59.2 |
|
|
|
2,964 |
|
|
|
21.7 |
|
|
|
65.1 |
|
| Compulsory automobile liability insurance |
|
|
89 |
|
|
|
5.7 |
|
|
|
112.1 |
|
|
|
100 |
|
|
|
13.0 |
|
|
|
115.4 |
|
| Others |
|
|
— |
|
|
|
— |
|
|
|
— |
|
|
|
— |
|
|
|
— |
|
|
|
— |
|
|
|
|
|
|
|
|
|
|
|
|
|
|
|
|
|
|
|
|
|
|
|
|
|
|
| Total |
|
|
2,525 |
|
|
|
4.0 |
|
|
|
60.1 |
|
|
|
3,065 |
|
|
|
21.4 |
|
|
|
66.0 |
|
|
|
|
|
|
|
|
|
|
|
|
|
|
|
|
|
|
|
|
|
|
|
|
|
|
26
SONPO 24 Insurance Co., Ltd. (Non-consolidated)
Solvency Margin Ratio
|
|
|
|
|
|
|
|
|
| |
|
(Millions of yen) |
|
| |
|
As of September 30, 2010 |
|
|
As of March 31, 2010 |
|
| (A) Total Solvency Margin |
|
|
8,605 |
|
|
|
8,616 |
|
| Capital and funds, etc. |
|
|
8,204 |
|
|
|
8,236 |
|
| Reserve for price fluctuation |
|
|
21 |
|
|
|
20 |
|
| Contingency reserve |
|
|
— |
|
|
|
— |
|
| Catastrophic loss reserve |
|
|
161 |
|
|
|
312 |
|
| General allowance for possible loan losses |
|
|
— |
|
|
|
— |
|
| Unrealized gains on securities (before tax effect deductions) |
|
|
217 |
|
|
|
46 |
|
| Net unrealized gains and losses on real estate |
|
|
— |
|
|
|
— |
|
| Excess amount of reserve for maturity refunds |
|
|
— |
|
|
|
— |
|
| Subordinated debt, etc. |
|
|
— |
|
|
|
— |
|
| Deductions |
|
|
— |
|
|
|
— |
|
| Others |
|
|
— |
|
|
|
— |
|
| (B) Total Risks
|
|
|
928 |
|
|
|
895 |
|
| Underwriting risk (R1) |
|
|
775 |
|
|
|
734 |
|
| Underwriting risk for third-sector insurance products including accident, sickness and nursing-care
insurance (R2) |
|
|
— |
|
|
|
— |
|
| Guaranteed interest rate risk (R3) |
|
|
— |
|
|
|
— |
|
| Investment risk (R4) |
|
|
157 |
|
|
|
193 |
|
| Business management risk (R5) |
|
|
31 |
|
|
|
30 |
|
| Major catastrophe risk (R6) |
|
|
105 |
|
|
|
104 |
|
| (C) Solvency Margin Ratio
[(A) / {(B) × 1/2}] × 100 |
|
|
1,854.2 |
% |
|
|
1,924.8 |
% |
| Note) |
The above figures are calculated based on Articles 86 and 87 of the Ordinance for Enforcement of the Insurance Business Law and the provisions of Notification
No. 50 of the Ministry of Finance (1996). |
27
Saison Automobile and Fire Insurance Company, Limited (Non-consolidated)
Interim Balance Sheets
|
|
|
|
|
|
|
|
|
|
|
|
|
| |
|
(Millions of yen) |
|
| |
|
As of September 30, 2010 |
|
|
As of March 31, 2010 |
|
|
Increase
(Decrease) |
|
| |
|
Amount |
|
|
Amount |
|
|
|
|
| Assets: |
|
|
|
|
|
|
|
|
|
|
|
|
| Cash and deposits |
|
|
6,080 |
|
|
|
10,796 |
|
|
|
(4,716 |
) |
| Money trusts |
|
|
1,288 |
|
|
|
1,316 |
|
|
|
(27 |
) |
| Securities |
|
|
22,828 |
|
|
|
19,223 |
|
|
|
3,605 |
|
| Loans |
|
|
16 |
|
|
|
20 |
|
|
|
(4 |
) |
| Tangible fixed assets |
|
|
461 |
|
|
|
171 |
|
|
|
290 |
|
| Intangible fixed assets |
|
|
1,465 |
|
|
|
897 |
|
|
|
567 |
|
| Other assets |
|
|
2,154 |
|
|
|
1,917 |
|
|
|
237 |
|
| Allowance for possible loan losses |
|
|
(0 |
) |
|
|
(0 |
) |
|
|
— |
|
|
|
|
|
|
|
|
|
|
|
|
|
|
| Total assets |
|
|
34,295 |
|
|
|
34,342 |
|
|
|
(47 |
) |
|
|
|
|
|
|
|
|
|
|
|
|
|
| Liabilities: |
|
|
|
|
|
|
|
|
|
|
|
|
| Underwriting funds: |
|
|
20,081 |
|
|
|
19,359 |
|
|
|
721 |
|
| Reserve for outstanding losses and claims |
|
|
5,116 |
|
|
|
4,946 |
|
|
|
169 |
|
| Underwriting reserves |
|
|
14,965 |
|
|
|
14,413 |
|
|
|
551 |
|
| Other liabilities |
|
|
1,649 |
|
|
|
1,431 |
|
|
|
218 |
|
| Reserve for retirement benefits |
|
|
267 |
|
|
|
364 |
|
|
|
(96 |
) |
| Reserve for retirement benefits to directors |
|
|
38 |
|
|
|
34 |
|
|
|
3 |
|
| Reserve for bonus payments |
|
|
218 |
|
|
|
206 |
|
|
|
12 |
|
| Reserves under the special laws: |
|
|
4 |
|
|
|
14 |
|
|
|
(10 |
) |
| Reserve for price fluctuation |
|
|
4 |
|
|
|
14 |
|
|
|
(10 |
) |
| Deferred tax liabilities |
|
|
104 |
|
|
|
100 |
|
|
|
4 |
|
|
|
|
|
|
|
|
|
|
|
|
|
|
| Total liabilities |
|
|
22,363 |
|
|
|
21,510 |
|
|
|
853 |
|
|
|
|
|
|
|
|
|
|
|
|
|
|
| Net assets: |
|
|
|
|
|
|
|
|
|
|
|
|
| Shareholders’ equity: |
|
|
|
|
|
|
|
|
|
|
|
|
| Common stock |
|
|
8,610 |
|
|
|
8,610 |
|
|
|
— |
|
| Capital surplus |
|
|
6,848 |
|
|
|
6,848 |
|
|
|
— |
|
| Retained earnings |
|
|
(3,783 |
) |
|
|
(2,925 |
) |
|
|
(858 |
) |
| Total shareholders’ equity |
|
|
11,674 |
|
|
|
12,532 |
|
|
|
(858 |
) |
| Valuation and translation adjustments: |
|
|
|
|
|
|
|
|
|
|
|
|
| Unrealized gains on securities available for sale, net of tax |
|
|
256 |
|
|
|
299 |
|
|
|
(42 |
) |
| Total valuation and translation adjustments |
|
|
256 |
|
|
|
299 |
|
|
|
(42 |
) |
|
|
|
|
|
|
|
|
|
|
|
|
|
| Total net assets |
|
|
11,931 |
|
|
|
12,831 |
|
|
|
(900 |
) |
|
|
|
|
|
|
|
|
|
|
|
|
|
| Total liabilities and net assets |
|
|
34,295 |
|
|
|
34,342 |
|
|
|
(47 |
) |
|
|
|
|
|
|
|
|
|
|
|
|
|
28
Saison Automobile and Fire Insurance Company, Limited (Non-consolidated)
Interim Statements of Income
|
|
|
|
|
|
|
|
|
|
|
|
|
|
|
|
|
|
|
| |
|
|
|
(Millions of yen) |
|
| |
|
|
|
Six months ended
September 30, 2009
(April 1
to
September 30, 2009) |
|
|
Six months ended
September 30, 2010
(April 1
to
September 30, 2010) |
|
|
Increase
(Decrease) |
|
|
Rate of
change |
|
| |
|
|
|
Amount |
|
|
Amount |
|
|
|
|
|
|
|
| Ordinary income: |
|
|
|
|
8,081 |
|
|
|
8,124 |
|
|
|
42 |
|
|
|
0.5 |
% |
| Underwriting income: |
|
|
|
|
7,759 |
|
|
|
7,834 |
|
|
|
74 |
|
|
|
1.0 |
|
| Net premiums written |
|
|
|
|
6,969 |
|
|
|
7,483 |
|
|
|
514 |
|
|
|
7.4 |
|
| Deposits of premiums by policyholders |
|
|
|
|
380 |
|
|
|
324 |
|
|
|
(56 |
) |
|
|
(14.8 |
) |
| Interest and dividend income on deposits of premiums, etc. |
|
|
|
|
31 |
|
|
|
25 |
|
|
|
(5 |
) |
|
|
(18.1 |
) |
| Reversal of reserve for outstanding losses and claims |
|
|
|
|
377 |
|
|
|
— |
|
|
|
(377 |
) |
|
|
(100.0 |
) |
| Investment income: |
|
|
|
|
214 |
|
|
|
184 |
|
|
|
(30 |
) |
|
|
(14.3 |
) |
| Interest and dividend income |
|
|
|
|
161 |
|
|
|
155 |
|
|
|
(5 |
) |
|
|
(3.7 |
) |
| Investment gains on money trusts |
|
|
|
|
48 |
|
|
|
— |
|
|
|
(48 |
) |
|
|
(100.0 |
) |
| Investment gains on trading securities |
|
|
|
|
3 |
|
|
|
0 |
|
|
|
(3 |
) |
|
|
(78.9 |
) |
| Gains on sales of securities |
|
|
|
|
32 |
|
|
|
52 |
|
|
|
20 |
|
|
|
64.0 |
|
| Transfer of interest and dividend income on deposits of premiums, etc. |
|
|
|
|
(31 |
) |
|
|
(25 |
) |
|
|
5 |
|
|
|
— |
|
| Other ordinary income |
|
|
|
|
107 |
|
|
|
106 |
|
|
|
(1 |
) |
|
|
(1.3 |
) |
|
|
|
|
|
|
|
|
|
|
|
|
|
|
|
|
|
|
|
| Ordinary expenses: |
|
|
|
|
7,911 |
|
|
|
8,980 |
|
|
|
1,068 |
|
|
|
13.5 |
|
| Underwriting expenses: |
|
|
|
|
5,636 |
|
|
|
6,404 |
|
|
|
767 |
|
|
|
13.6 |
|
| Net claims paid |
|
|
|
|
3,729 |
|
|
|
3,784 |
|
|
|
54 |
|
|
|
1.5 |
|
| Loss adjustment expenses |
|
|
|
|
366 |
|
|
|
479 |
|
|
|
112 |
|
|
|
30.8 |
|
| Net commissions and brokerage fees |
|
|
|
|
887 |
|
|
|
896 |
|
|
|
8 |
|
|
|
1.0 |
|
| Maturity refunds to policyholders |
|
|
|
|
463 |
|
|
|
519 |
|
|
|
55 |
|
|
|
12.0 |
|
| Provision for reserve for outstanding losses and claims |
|
|
|
|
— |
|
|
|
169 |
|
|
|
169 |
|
|
|
— |
|
| Provision for underwriting reserves |
|
|
|
|
184 |
|
|
|
551 |
|
|
|
367 |
|
|
|
199.9 |
|
| Investment expenses: |
|
|
|
|
98 |
|
|
|
98 |
|
|
|
(0 |
) |
|
|
(0.9 |
) |
| Investment losses on money trusts |
|
|
|
|
— |
|
|
|
27 |
|
|
|
27 |
|
|
|
— |
|
| Losses on sales of securities |
|
|
|
|
76 |
|
|
|
— |
|
|
|
(76 |
) |
|
|
(100.0 |
) |
| Operating, general and administrative expenses |
|
|
|
|
2,069 |
|
|
|
2,472 |
|
|
|
402 |
|
|
|
19.5 |
|
| Other ordinary expenses: |
|
|
|
|
106 |
|
|
|
5 |
|
|
|
(101 |
) |
|
|
(95.2 |
) |
| Interest paid |
|
|
|
|
2 |
|
|
|
2 |
|
|
|
0 |
|
|
|
21.6 |
|
|
|
|
|
|
|
|
|
|
|
|
|
|
|
|
|
|
|
|
| Ordinary profit (loss) |
|
|
|
|
169 |
|
|
|
(855 |
) |
|
|
(1,025 |
) |
|
|
(604.9 |
) |
|
|
|
|
|
|
|
|
|
|
|
|
|
|
|
|
|
|
|
| Extraordinary gains: |
|
|
|
|
4 |
|
|
|
10 |
|
|
|
6 |
|
|
|
159.2 |
|
| Reversal of reserves under the special laws: |
|
|
|
|
4 |
|
|
|
10 |
|
|
|
6 |
|
|
|
159.2 |
|
| Reversal of reserve for price fluctuation |
|
|
|
|
4 |
|
|
|
10 |
|
|
|
6 |
|
|
|
159.2 |
|
| Extraordinary losses: |
|
|
|
|
0 |
|
|
|
2 |
|
|
|
1 |
|
|
|
200.5 |
|
| Losses on disposal of fixed assets |
|
|
|
|
0 |
|
|
|
2 |
|
|
|
1 |
|
|
|
691.4 |
|
| Impairment losses |
|
|
|
|
0 |
|
|
|
— |
|
|
|
(0 |
) |
|
|
(100.0 |
) |
|
|
|
|
|
|
|
|
|
|
|
|
|
|
|
|
|
|
|
| Income (loss) before income taxes |
|
|
|
|
172 |
|
|
|
(847 |
) |
|
|
(1,020 |
) |
|
|
(590.4 |
) |
| Income taxes |
|
|
|
|
10 |
|
|
|
10 |
|
|
|
— |
|
|
|
— |
|
| Total income taxes |
|
|
|
|
10 |
|
|
|
10 |
|
|
|
— |
|
|
|
— |
|
| Net income (loss) |
|
|
|
|
162 |
|
|
|
(858 |
) |
|
|
(1,020 |
) |
|
|
(629.5 |
) |
|
|
|
|
|
|
|
|
|
|
|
|
|
|
|
|
|
|
|
|
|
|
|
|
|
| Underwriting result: |
|
|
|
|
|
|
|
|
|
|
|
|
|
|
|
|
|
|
| Net premiums written |
|
(+) |
|
|
6,969 |
|
|
|
7,483 |
|
|
|
514 |
|
|
|
7.4 |
|
| Net claims paid |
|
(–) |
|
|
3,729 |
|
|
|
3,784 |
|
|
|
54 |
|
|
|
1.5 |
|
| Loss adjustment expenses |
|
(–) |
|
|
366 |
|
|
|
479 |
|
|
|
112 |
|
|
|
30.8 |
|
| Operating expenses: |
|
(–) |
|
|
2,807 |
|
|
|
3,225 |
|
|
|
418 |
|
|
|
14.9 |
|
| Net commissions and brokerage fees |
|
|
|
|
887 |
|
|
|
896 |
|
|
|
8 |
|
|
|
1.0 |
|
| Operating, general and administrative expenses related to underwriting |
|
|
|
|
1,919 |
|
|
|
2,328 |
|
|
|
409 |
|
|
|
21.3 |
|
| Underwriting result |
|
|
|
|
65 |
|
|
|
(5 |
) |
|
|
(71 |
) |
|
|
(108.3 |
) |
|
|
|
|
|
|
|
|
|
|
|
|
|
|
|
|
|
|
|
| Underwriting profit |
|
|
|
|
247 |
|
|
|
(859 |
) |
|
|
(1,107 |
) |
|
|
(446.6 |
) |
|
|
|
|
|
|
|
|
|
|
|
|
|
|
|
|
|
|
|
| Ratios: |
|
|
|
|
|
|
|
|
|
|
|
|
|
|
|
|
|
|
| Net loss ratio (%) |
|
|
|
|
58.8 |
|
|
|
57.0 |
|
|
|
(1.8 |
) |
|
|
|
|
| Net expense ratio (%) |
|
|
|
|
40.3 |
|
|
|
43.1 |
|
|
|
2.8 |
|
|
|
|
|
| Underwriting result ratio (%) |
|
|
|
|
0.9 |
|
|
|
(0.1 |
) |
|
|
(1.0 |
) |
|
|
|
|
29
Saison Automobile and Fire Insurance Company, Limited (Non-consolidated)
Premiums Written and Claims Paid by Lines of Business
Direct premiums written (excluding deposits of premiums by policyholders)
|
|
|
|
|
|
|
|
|
|
|
|
|
|
|
|
|
|
|
|
|
|
|
|
|
| |
|
(Millions of yen) |
|
| |
|
Six months ended September 30, 2009
(April 1 to September
30, 2009) |
|
|
Six months ended September 30, 2010
(April 1 to September
30, 2010) |
|
| Business line |
|
Amount |
|
|
% of total
amount |
|
|
Rate of
change |
|
|
Amount |
|
|
% of total
amount |
|
|
Rate of
change |
|
| Fire and allied insurance |
|
|
1,059 |
|
|
|
13.5 |
% |
|
|
79.7 |
% |
|
|
1,699 |
|
|
|
19.7 |
% |
|
|
60.4 |
% |
| Marine insurance |
|
|
0 |
|
|
|
0.0 |
|
|
|
6.2 |
|
|
|
0 |
|
|
|
0.0 |
|
|
|
46.0 |
|
| Personal accident insurance |
|
|
1,866 |
|
|
|
23.7 |
|
|
|
25.4 |
|
|
|
2,143 |
|
|
|
24.8 |
|
|
|
14.9 |
|
| Voluntary automobile insurance |
|
|
4,374 |
|
|
|
55.6 |
|
|
|
(4.7 |
) |
|
|
4,191 |
|
|
|
48.5 |
|
|
|
(4.2 |
) |
| Compulsory automobile liability insurance |
|
|
166 |
|
|
|
2.1 |
|
|
|
(20.8 |
) |
|
|
160 |
|
|
|
1.9 |
|
|
|
(4.1 |
) |
| Others |
|
|
393 |
|
|
|
5.0 |
|
|
|
(11.1 |
) |
|
|
438 |
|
|
|
5.1 |
|
|
|
11.3 |
|
|
|
|
|
|
|
|
|
|
|
|
|
|
|
|
|
|
|
|
|
|
|
|
|
|
| Total |
|
|
7,861 |
|
|
|
100.0 |
|
|
|
7.4 |
|
|
|
8,634 |
|
|
|
100.0 |
|
|
|
9.8 |
|
| Deposits of premiums by policyholders |
|
|
380 |
|
|
|
— |
|
|
|
(3.6 |
) |
|
|
324 |
|
|
|
— |
|
|
|
(14.8 |
) |
|
|
|
|
|
|
|
|
|
|
|
|
|
|
|
|
|
|
|
|
|
|
|
|
|
Net premiums written
|
|
|
|
|
|
|
|
|
|
|
|
|
|
|
|
|
|
|
|
|
|
|
|
|
| |
|
(Millions of yen) |
|
| |
|
Six months ended September 30, 2009
(April 1 to September 30, 2009) |
|
|
Six months ended September 30, 2010
(April 1 to September
30, 2010) |
|
| Business line |
|
Amount |
|
|
% of total
amount |
|
|
Rate of
change |
|
|
Amount |
|
|
% of total
amount |
|
|
Rate of
change |
|
| Fire and allied insurance |
|
|
771 |
|
|
|
11.1 |
% |
|
|
79.3 |
% |
|
|
1,275 |
|
|
|
17.0 |
% |
|
|
65.3 |
% |
| Marine insurance |
|
|
13 |
|
|
|
0.2 |
|
|
|
(39.9 |
) |
|
|
9 |
|
|
|
0.1 |
|
|
|
(31.3 |
) |
| Personal accident insurance |
|
|
1,252 |
|
|
|
18.0 |
|
|
|
11.0 |
|
|
|
1,379 |
|
|
|
18.4 |
|
|
|
10.1 |
|
| Voluntary automobile insurance |
|
|
4,343 |
|
|
|
62.3 |
|
|
|
(4.7 |
) |
|
|
4,161 |
|
|
|
55.6 |
|
|
|
(4.2 |
) |
| Compulsory automobile liability insurance |
|
|
208 |
|
|
|
3.0 |
|
|
|
(15.1 |
) |
|
|
235 |
|
|
|
3.2 |
|
|
|
12.9 |
|
| Others |
|
|
379 |
|
|
|
5.4 |
|
|
|
(11.8 |
) |
|
|
422 |
|
|
|
5.6 |
|
|
|
11.3 |
|
|
|
|
|
|
|
|
|
|
|
|
|
|
|
|
|
|
|
|
|
|
|
|
|
|
| Total |
|
|
6,969 |
|
|
|
100.0 |
|
|
|
2.3 |
|
|
|
7,483 |
|
|
|
100.0 |
|
|
|
7.4 |
|
|
|
|
|
|
|
|
|
|
|
|
|
|
|
|
|
|
|
|
|
|
|
|
|
|
Net claims paid
|
|
|
|
|
|
|
|
|
|
|
|
|
|
|
|
|
|
|
|
|
|
|
|
|
| |
|
(Millions of yen) |
|
| |
|
Six months ended September 30, 2009
(April 1 to September
30, 2009) |
|
|
Six months ended September 30, 2010
(April 1 to September
30, 2010) |
|
| Business line |
|
Amount |
|
|
Rate of
change |
|
|
Net loss
ratio |
|
|
Amount |
|
|
Rate of
change |
|
|
Net loss
ratio |
|
| Fire and allied insurance |
|
|
74 |
|
|
|
(48.2 |
)% |
|
|
10.5 |
% |
|
|
143 |
|
|
|
92.5 |
% |
|
|
12.4 |
% |
| Marine insurance |
|
|
10 |
|
|
|
(2.9 |
) |
|
|
78.5 |
|
|
|
10 |
|
|
|
(4.4 |
) |
|
|
108.0 |
|
| Personal accident insurance |
|
|
716 |
|
|
|
22.2 |
|
|
|
62.2 |
|
|
|
790 |
|
|
|
10.3 |
|
|
|
64.7 |
|
| Voluntary automobile insurance |
|
|
2,659 |
|
|
|
4.0 |
|
|
|
67.5 |
|
|
|
2,574 |
|
|
|
(3.2 |
) |
|
|
69.9 |
|
| Compulsory automobile liability insurance |
|
|
195 |
|
|
|
(5.6 |
) |
|
|
101.5 |
|
|
|
205 |
|
|
|
5.0 |
|
|
|
93.7 |
|
| Others |
|
|
72 |
|
|
|
(17.1 |
) |
|
|
21.6 |
|
|
|
60 |
|
|
|
(17.5 |
) |
|
|
17.9 |
|
|
|
|
|
|
|
|
|
|
|
|
|
|
|
|
|
|
|
|
|
|
|
|
|
|
| Total |
|
|
3,729 |
|
|
|
3.8 |
|
|
|
58.8 |
|
|
|
3,784 |
|
|
|
1.5 |
|
|
|
57.0 |
|
|
|
|
|
|
|
|
|
|
|
|
|
|
|
|
|
|
|
|
|
|
|
|
|
|
30
Saison Automobile and Fire Insurance Company, Limited (Non-consolidated)
Solvency Margin Ratio
|
|
|
|
|
|
|
|
|
| |
|
(Millions of yen) |
|
| |
|
As of September 30, 2010 |
|
|
As of March 31, 2010 |
|
| (A) Total Solvency Margin |
|
|
13,609 |
|
|
|
15,333 |
|
| Capital and funds, etc. |
|
|
10,231 |
|
|
|
11,658 |
|
| Reserve for price fluctuation |
|
|
4 |
|
|
|
14 |
|
| Contingency reserve |
|
|
8 |
|
|
|
8 |
|
| Catastrophic loss reserve |
|
|
3,037 |
|
|
|
3,291 |
|
| General allowance for possible loan losses |
|
|
0 |
|
|
|
0 |
|
| Unrealized gains on securities (before tax effect deductions) |
|
|
325 |
|
|
|
359 |
|
| Net unrealized gains and losses on real estate |
|
|
— |
|
|
|
— |
|
| Excess amount of reserve for maturity refunds |
|
|
— |
|
|
|
— |
|
| Subordinated debt, etc. |
|
|
— |
|
|
|
— |
|
| Deductions |
|
|
— |
|
|
|
— |
|
| Others |
|
|
2 |
|
|
|
2 |
|
| (B) Total Risks
|
|
|
1,661 |
|
|
|
1,653 |
|
| Underwriting risk (R1) |
|
|
841 |
|
|
|
838 |
|
| Underwriting risk for third-sector insurance products including accident, sickness and nursing-care
insurance (R2) |
|
|
— |
|
|
|
— |
|
| Guaranteed interest rate risk (R3) |
|
|
6 |
|
|
|
6 |
|
| Investment risk (R4) |
|
|
516 |
|
|
|
530 |
|
| Business management risk (R5) |
|
|
59 |
|
|
|
59 |
|
| Major catastrophe risk (R6) |
|
|
611 |
|
|
|
598 |
|
| (C) Solvency Margin Ratio
[ (A) / {(B) × 1/2} ] × 100 |
|
|
1,638.3 |
% |
|
|
1,854.7 |
% |
| Note) |
The above figures are calculated based on Articles 86 and 87 of the Ordinance for Enforcement of the Insurance Business Law and the provisions of Notification
No. 50 of the Ministry of Finance (1996). |
31
Sompo Japan Himawari Life Insurance Co., Ltd. (Non-consolidated)
Interim Balance Sheets
|
|
|
|
|
|
|
|
|
|
|
|
|
| |
|
(Millions of yen) |
|
| |
|
As of September 30, 2010 |
|
|
As of March 31, 2010 |
|
|
Increase
(Decrease) |
|
| |
|
Amount |
|
|
Amount |
|
|
|
|
| Assets: |
|
|
|
|
|
|
|
|
|
|
|
|
| Cash and deposits |
|
|
36,646 |
|
|
|
32,988 |
|
|
|
3,657 |
|
| Securities: |
|
|
1,057,808 |
|
|
|
1,030,306 |
|
|
|
27,502 |
|
| Government bonds |
|
|
609,410 |
|
|
|
560,887 |
|
|
|
48,522 |
|
| Municipal bonds |
|
|
69,924 |
|
|
|
70,489 |
|
|
|
(564 |
) |
| Corporate bonds |
|
|
310,542 |
|
|
|
310,212 |
|
|
|
329 |
|
| Domestic stocks |
|
|
4,679 |
|
|
|
5,140 |
|
|
|
(460 |
) |
| Foreign securities |
|
|
63,251 |
|
|
|
83,576 |
|
|
|
(20,324 |
) |
| Loans: |
|
|
17,601 |
|
|
|
17,162 |
|
|
|
438 |
|
| Policy loans |
|
|
17,601 |
|
|
|
17,162 |
|
|
|
438 |
|
| Tangible fixed assets |
|
|
1,224 |
|
|
|
1,197 |
|
|
|
26 |
|
| Intangible fixed assets |
|
|
4,620 |
|
|
|
4,625 |
|
|
|
(5 |
) |
| Agency accounts receivable |
|
|
142 |
|
|
|
174 |
|
|
|
(31 |
) |
| Reinsurance accounts receivable |
|
|
969 |
|
|
|
1,206 |
|
|
|
(237 |
) |
| Other assets |
|
|
19,515 |
|
|
|
21,401 |
|
|
|
(1,886 |
) |
| Deferred tax assets |
|
|
12,267 |
|
|
|
13,164 |
|
|
|
(897 |
) |
| Allowance for possible loan losses |
|
|
(35 |
) |
|
|
(94 |
) |
|
|
59 |
|
|
|
|
|
|
|
|
|
|
|
|
|
|
| Total assets |
|
|
1,150,759 |
|
|
|
1,122,133 |
|
|
|
28,626 |
|
|
|
|
|
|
|
|
|
|
|
|
|
|
| Liabilities: |
|
|
|
|
|
|
|
|
|
|
|
|
| Policy reserves: |
|
|
1,083,639 |
|
|
|
1,054,852 |
|
|
|
28,786 |
|
| Reserve for outstanding claims |
|
|
20,591 |
|
|
|
20,155 |
|
|
|
435 |
|
| Policy reserves |
|
|
1,061,058 |
|
|
|
1,032,371 |
|
|
|
28,687 |
|
| Reserve for dividends to policyholders |
|
|
1,989 |
|
|
|
2,325 |
|
|
|
(336 |
) |
| Agency accounts payable |
|
|
1,428 |
|
|
|
1,591 |
|
|
|
(163 |
) |
| Reinsurance accounts payable |
|
|
1,155 |
|
|
|
1,205 |
|
|
|
(49 |
) |
| Other liabilities |
|
|
5,817 |
|
|
|
7,564 |
|
|
|
(1,746 |
) |
| Reserve for retirement benefits |
|
|
804 |
|
|
|
663 |
|
|
|
141 |
|
| Reserve for retirement benefits to directors |
|
|
61 |
|
|
|
45 |
|
|
|
15 |
|
| Reserves under the special laws: |
|
|
904 |
|
|
|
794 |
|
|
|
110 |
|
| Reserve for price fluctuation |
|
|
904 |
|
|
|
794 |
|
|
|
110 |
|
|
|
|
|
|
|
|
|
|
|
|
|
|
| Total liabilities |
|
|
1,093,810 |
|
|
|
1,066,716 |
|
|
|
27,093 |
|
|
|
|
|
|
|
|
|
|
|
|
|
|
| Net assets: |
|
|
|
|
|
|
|
|
|
|
|
|
| Shareholders’ equity: |
|
|
|
|
|
|
|
|
|
|
|
|
| Common stock |
|
|
17,250 |
|
|
|
17,250 |
|
|
|
— |
|
| Capital surplus |
|
|
10,000 |
|
|
|
10,000 |
|
|
|
— |
|
| Retained earnings |
|
|
25,983 |
|
|
|
27,283 |
|
|
|
(1,300 |
) |
| Total shareholders’ equity |
|
|
53,233 |
|
|
|
54,533 |
|
|
|
(1,300 |
) |
| Valuation and translation adjustments: |
|
|
|
|
|
|
|
|
|
|
|
|
| Unrealized gains on securities available for sale, net of tax |
|
|
3,716 |
|
|
|
882 |
|
|
|
2,833 |
|
| Total valuation and translation adjustments |
|
|
3,716 |
|
|
|
882 |
|
|
|
2,833 |
|
|
|
|
|
|
|
|
|
|
|
|
|
|
| Total net assets |
|
|
56,949 |
|
|
|
55,416 |
|
|
|
1,532 |
|
|
|
|
|
|
|
|
|
|
|
|
|
|
| Total liabilities and net assets |
|
|
1,150,759 |
|
|
|
1,122,133 |
|
|
|
28,626 |
|
|
|
|
|
|
|
|
|
|
|
|
|
|
32
Sompo Japan Himawari Life Insurance Co., Ltd. (Non-consolidated)
Interim Statements of Income
|
|
|
|
|
|
|
|
|
|
|
|
|
|
|
|
|
| |
|
(Millions of yen) |
|
| |
|
Six months ended
September 30, 2009
(April 1
to
September 30, 2009) |
|
|
Six months ended
September 30, 2010
(April 1
to
September 30, 2010) |
|
|
Increase
(Decrease) |
|
|
Rate of
change |
|
| |
|
Amount |
|
|
Amount |
|
|
|
|
|
|
|
| Ordinary income: |
|
|
125,424 |
|
|
|
129,656 |
|
|
|
4,232 |
|
|
|
3.4 |
% |
| Insurance premiums and other: |
|
|
114,050 |
|
|
|
119,876 |
|
|
|
5,825 |
|
|
|
5.1 |
|
| Insurance premiums |
|
|
112,610 |
|
|
|
118,347 |
|
|
|
5,737 |
|
|
|
5.1 |
|
| Investment income: |
|
|
11,356 |
|
|
|
9,711 |
|
|
|
(1,644 |
) |
|
|
(14.5 |
) |
| Interest and dividend income |
|
|
8,955 |
|
|
|
9,413 |
|
|
|
457 |
|
|
|
5.1 |
|
| Gains on sales of securities |
|
|
895 |
|
|
|
297 |
|
|
|
(597 |
) |
|
|
(66.7 |
) |
| Investment gains on special account |
|
|
1,505 |
|
|
|
— |
|
|
|
(1,505 |
) |
|
|
(100.0 |
) |
| Other ordinary income |
|
|
18 |
|
|
|
69 |
|
|
|
51 |
|
|
|
281.3 |
|
|
|
|
|
|
|
|
|
|
|
|
|
|
|
|
|
|
| Ordinary expenses: |
|
|
123,768 |
|
|
|
130,186 |
|
|
|
6,417 |
|
|
|
5.2 |
|
| Insurance claims and other: |
|
|
77,273 |
|
|
|
69,805 |
|
|
|
(7,468 |
) |
|
|
(9.7 |
) |
| Insurance claims |
|
|
11,002 |
|
|
|
11,225 |
|
|
|
222 |
|
|
|
2.0 |
|
| Annuity payments |
|
|
421 |
|
|
|
512 |
|
|
|
91 |
|
|
|
21.7 |
|
| Insurance benefits |
|
|
10,202 |
|
|
|
11,124 |
|
|
|
921 |
|
|
|
9.0 |
|
| Surrender benefits |
|
|
52,495 |
|
|
|
44,154 |
|
|
|
(8,340 |
) |
|
|
(15.9 |
) |
| Other refunds |
|
|
676 |
|
|
|
482 |
|
|
|
(194 |
) |
|
|
(28.7 |
) |
| Provision for policy reserves and other: |
|
|
17,318 |
|
|
|
29,122 |
|
|
|
11,804 |
|
|
|
68.2 |
|
| Provision for reserve for outstanding claims |
|
|
1,692 |
|
|
|
435 |
|
|
|
(1,257 |
) |
|
|
(74.3 |
) |
| Provision for policy reserves |
|
|
15,625 |
|
|
|
28,687 |
|
|
|
13,061 |
|
|
|
83.6 |
|
| Provision for interest portion of reserve for dividends to policyholders |
|
|
0 |
|
|
|
0 |
|
|
|
0 |
|
|
|
72.7 |
|
| Investment expenses: |
|
|
944 |
|
|
|
1,088 |
|
|
|
144 |
|
|
|
15.3 |
|
| Interest paid |
|
|
16 |
|
|
|
28 |
|
|
|
11 |
|
|
|
71.4 |
|
| Losses on sales of securities |
|
|
— |
|
|
|
83 |
|
|
|
83 |
|
|
|
— |
|
| Impairment losses on securities |
|
|
716 |
|
|
|
— |
|
|
|
(716 |
) |
|
|
(100.0 |
) |
| Losses on derivatives |
|
|
173 |
|
|
|
26 |
|
|
|
(147 |
) |
|
|
(84.9 |
) |
| Investment losses on special account |
|
|
— |
|
|
|
935 |
|
|
|
935 |
|
|
|
— |
|
| Operating, general and administrative expenses |
|
|
27,418 |
|
|
|
28,901 |
|
|
|
1,482 |
|
|
|
5.4 |
|
| Other ordinary expenses |
|
|
813 |
|
|
|
1,267 |
|
|
|
454 |
|
|
|
55.9 |
|
|
|
|
|
|
|
|
|
|
|
|
|
|
|
|
|
|
| Ordinary profit (loss) |
|
|
1,655 |
|
|
|
(529 |
) |
|
|
(2,185 |
) |
|
|
(132.0 |
) |
|
|
|
|
|
|
|
|
|
|
|
|
|
|
|
|
|
| Extraordinary gains: |
|
|
2 |
|
|
|
5 |
|
|
|
3 |
|
|
|
127.4 |
|
| Other extraordinary gains |
|
|
2 |
|
|
|
5 |
|
|
|
3 |
|
|
|
127.4 |
|
| Extraordinary losses: |
|
|
91 |
|
|
|
390 |
|
|
|
299 |
|
|
|
328.0 |
|
| Losses on disposal of fixed assets |
|
|
5 |
|
|
|
15 |
|
|
|
9 |
|
|
|
156.3 |
|
| Provision for reserves under the special laws: |
|
|
85 |
|
|
|
110 |
|
|
|
24 |
|
|
|
29.2 |
|
| Provision for reserve for price fluctuation |
|
|
85 |
|
|
|
110 |
|
|
|
24 |
|
|
|
29.2 |
|
| Other extraordinary losses |
|
|
— |
|
|
|
264 |
|
|
|
264 |
|
|
|
— |
|
|
|
|
|
|
|
|
|
|
|
|
|
|
|
|
|
|
| Provision for reserve for dividends to policyholders |
|
|
660 |
|
|
|
799 |
|
|
|
139 |
|
|
|
21.1 |
|
| Income (loss) before income taxes |
|
|
907 |
|
|
|
(1,713 |
) |
|
|
(2,621 |
) |
|
|
(289.0 |
) |
| Income taxes |
|
|
1,414 |
|
|
|
297 |
|
|
|
(1,117 |
) |
|
|
(79.0 |
) |
| Deferred income taxes |
|
|
(949 |
) |
|
|
(710 |
) |
|
|
238 |
|
|
|
— |
|
| Total income taxes |
|
|
465 |
|
|
|
(413 |
) |
|
|
(878 |
) |
|
|
(188.8 |
) |
| Net income (loss) |
|
|
441 |
|
|
|
(1,300 |
) |
|
|
(1,742 |
) |
|
|
(394.5 |
) |
|
|
|
|
|
|
|
|
|
|
|
|
|
|
|
|
|
33
Sompo Japan Himawari Life Insurance Co., Ltd. (Non-consolidated)
Major Business Results
Total amount of policies in force and total amount of new policies
Total amount of policies in force
|
|
|
|
|
|
|
|
|
|
|
|
|
|
|
|
|
|
|
|
|
|
|
|
|
|
|
|
|
|
|
|
|
| |
|
(Number in thousands, Yen in hundred millions, %) |
|
| |
|
As of September 30, 2010 |
|
|
As of March 31, 2010 |
|
| |
|
Number |
|
|
Amount |
|
|
Number |
|
|
Amount |
|
| |
|
|
|
|
Rate of
change |
|
|
|
|
|
Rate of
change |
|
|
|
|
|
Rate of
change |
|
|
|
|
|
Rate of
change |
|
| Individual insurance |
|
|
1,819 |
|
|
|
105.0 |
|
|
|
109,680 |
|
|
|
105.4 |
|
|
|
1,732 |
|
|
|
109.9 |
|
|
|
104,049 |
|
|
|
110.1 |
|
| Individual annuities |
|
|
15 |
|
|
|
99.6 |
|
|
|
798 |
|
|
|
99.5 |
|
|
|
15 |
|
|
|
98.2 |
|
|
|
801 |
|
|
|
98.5 |
|
| Group insurance |
|
|
— |
|
|
|
— |
|
|
|
18,580 |
|
|
|
101.1 |
|
|
|
— |
|
|
|
— |
|
|
|
18,379 |
|
|
|
92.0 |
|
| Group annuities |
|
|
— |
|
|
|
— |
|
|
|
— |
|
|
|
— |
|
|
|
— |
|
|
|
— |
|
|
|
— |
|
|
|
— |
|
| Note) |
Amount of “Individual annuities” represents the sum of annuity fund at the beginning of annuity payment of contracts before the beginning of annuity payment
and policy reserves for the contracts after the beginning of annuity payment. |
Total amount of new policies
|
|
|
|
|
|
|
|
|
|
|
|
|
|
|
|
|
|
|
|
|
|
|
|
|
|
|
|
|
|
|
|
|
| |
|
(Number in thousands, Yen in hundred millions, %) |
|
| |
|
Six months ended September 30, 2009
(April 1 to September 30, 2009) |
|
|
Six months ended September 30, 2010
(April 1 to September 30, 2010) |
|
| |
|
Number |
|
|
Amount |
|
|
Number |
|
|
Amount |
|
| |
|
|
|
|
Rate of
change |
|
|
|
|
|
Rate of
change |
|
|
|
|
|
Rate of
change |
|
|
|
|
|
Rate of
change |
|
| Individual insurance |
|
|
159 |
|
|
|
169.4 |
|
|
|
10,519 |
|
|
|
135.4 |
|
|
|
159 |
|
|
|
100.1 |
|
|
|
11,268 |
|
|
|
107.1 |
|
| Individual annuities |
|
|
0 |
|
|
|
105.9 |
|
|
|
9 |
|
|
|
97.2 |
|
|
|
0 |
|
|
|
117.3 |
|
|
|
10 |
|
|
|
108.7 |
|
| Group insurance |
|
|
— |
|
|
|
— |
|
|
|
331 |
|
|
|
634.0 |
|
|
|
— |
|
|
|
— |
|
|
|
93 |
|
|
|
28.2 |
|
| Group annuities |
|
|
— |
|
|
|
— |
|
|
|
— |
|
|
|
— |
|
|
|
— |
|
|
|
— |
|
|
|
— |
|
|
|
— |
|
| Note) |
Amount of “Individual annuities” represents the amount of annuity fund at the beginning of annuity payment. |
Annualized premiums
Policies in force
|
|
|
|
|
|
|
|
|
|
|
|
|
|
|
|
|
| |
|
(Millions of yen, %) |
|
| |
|
As of September 30, 2010 |
|
|
As of March 31, 2010 |
|
| |
|
|
|
|
Rate of
change |
|
|
|
|
|
Rate of
change |
|
| Individual insurance |
|
|
193,896 |
|
|
|
100.6 |
|
|
|
192,742 |
|
|
|
98.1 |
|
| Individual annuities |
|
|
3,519 |
|
|
|
102.3 |
|
|
|
3,439 |
|
|
|
98.9 |
|
|
|
|
|
|
|
|
|
|
|
|
|
|
|
|
|
|
| Total |
|
|
197,416 |
|
|
|
100.6 |
|
|
|
196,181 |
|
|
|
98.2 |
|
|
|
|
|
|
|
|
|
|
|
|
|
|
|
|
|
|
| Medical and survival benefits |
|
|
75,345 |
|
|
|
103.4 |
|
|
|
72,864 |
|
|
|
106.1 |
|
|
|
|
|
|
|
|
|
|
|
|
|
|
|
|
|
|
New policies
|
|
|
|
|
|
|
|
|
|
|
|
|
|
|
|
|
| |
|
(Millions of yen, %) |
|
| |
|
Six months ended September 30, 2009
(April 1 to September
30, 2009) |
|
|
Six months ended September 30, 2010
(April 1 to September
30, 2010) |
|
| |
|
|
|
|
Rate of
change |
|
|
|
|
|
Rate of
change |
|
| Individual insurance |
|
|
12,260 |
|
|
|
123.6 |
|
|
|
12,606 |
|
|
|
102.8 |
|
| Individual annuities |
|
|
39 |
|
|
|
93.4 |
|
|
|
43 |
|
|
|
109.7 |
|
|
|
|
|
|
|
|
|
|
|
|
|
|
|
|
|
|
| Total |
|
|
12,299 |
|
|
|
123.4 |
|
|
|
12,650 |
|
|
|
102.9 |
|
|
|
|
|
|
|
|
|
|
|
|
|
|
|
|
|
|
| Medical and survival benefits |
|
|
6,076 |
|
|
|
161.6 |
|
|
|
5,691 |
|
|
|
93.7 |
|
|
|
|
|
|
|
|
|
|
|
|
|
|
|
|
|
|
Notes)
| 1. |
Annualized premiums are calculated by using multipliers for various premium payment terms to the premium per payment. In single premium contracts, the amount is
calculated by dividing the premium by the duration of the policy. |
| 2. |
Annualized premiums for medical and survival benefits include (a) premium related to medical benefits such as hospitalization and surgery benefits,
(b) premium related to survival benefits such as specific illness and nursing benefits, and (c) premium related to premium waiver benefits, in which disability cause is excluded but causes such as specific illness and nursing care are
included. |
34
Sompo Japan Himawari Life Insurance Co., Ltd. (Non-consolidated)
Solvency Margin Ratio
|
|
|
|
|
|
|
|
|
| |
|
(Millions of yen) |
|
| |
|
As of September 30, 2010 |
|
|
As of March 31, 2010 |
|
| (A) Total Solvency Margin |
|
|
162,496 |
|
|
|
157,431 |
|
| Capital, etc. |
|
|
53,239 |
|
|
|
54,533 |
|
| Reserve for price fluctuation |
|
|
904 |
|
|
|
794 |
|
| Contingency reserve |
|
|
15,931 |
|
|
|
15,355 |
|
| General allowance for possible loan losses |
|
|
13 |
|
|
|
18 |
|
| Unrealized gains on securities (90% of gain or 100% of loss) |
|
|
5,242 |
|
|
|
1,245 |
|
| Net unrealized gains and losses on real estate (85% of gain or 100% of loss) |
|
|
— |
|
|
|
— |
|
| Policy reserves in excess of surrender values |
|
|
71,588 |
|
|
|
69,171 |
|
| Brought in capital, etc. |
|
|
— |
|
|
|
— |
|
| Subordinated debt, etc. |
|
|
— |
|
|
|
— |
|
| Deductions |
|
|
— |
|
|
|
— |
|
| Others |
|
|
15,576 |
|
|
|
16,312 |
|
| (B) Total Risks
|
|
|
13,395 |
|
|
|
12,915 |
|
| Underwriting risk (R1) |
|
|
6,743 |
|
|
|
6,382 |
|
| Underwriting risk for third-sector insurance products including accident, sickness and nursing-care
insurance (R8) |
|
|
3,712 |
|
|
|
3,516 |
|
| Guaranteed interest rate risk (R2) |
|
|
3,200 |
|
|
|
3,188 |
|
| Investment risk (R3) |
|
|
4,243 |
|
|
|
4,223 |
|
| Business management risk (R4) |
|
|
364 |
|
|
|
352 |
|
| Guaranteed minimum benefit risk (R7) |
|
|
332 |
|
|
|
322 |
|
| (C) Solvency Margin Ratio
[(A) / {(1/2) × (B)}] × 100 |
|
|
2,426.1 |
% |
|
|
2,437.9 |
% |
Notes)
| 1. |
The above figures are calculated based on Articles 86, 87, 161, 162 and 190 of the Ordinance for Enforcement of the Insurance Business Law and the provisions of
Notification No. 50 of the Ministry of Finance (1996). “Policy reserves in excess of surrender values” is calculated based on the provisions of Article 1 Paragraph 3-1 of Notification No. 50 of the Ministry of Finance.
|
| 2. |
Guaranteed minimum benefit risk is calculated by the standard method. |
35
NIPPONKOA Life Insurance Co., Ltd. (Non-consolidated)
Interim Balance Sheets
|
|
|
|
|
|
|
|
|
|
|
|
|
| |
|
(Millions of yen) |
|
| |
|
As of September 30, 2010 |
|
|
As of March 31, 2010 |
|
|
Increase
(Decrease) |
|
| |
|
Amount |
|
|
Amount |
|
|
|
|
| Assets: |
|
|
|
|
|
|
|
|
|
|
|
|
| Cash and deposits |
|
|
19,310 |
|
|
|
14,371 |
|
|
|
4,938 |
|
| Call loans |
|
|
697 |
|
|
|
478 |
|
|
|
219 |
|
| Receivables under securities borrowing transactions |
|
|
27,146 |
|
|
|
25,382 |
|
|
|
1,763 |
|
| Money trusts |
|
|
20,365 |
|
|
|
19,916 |
|
|
|
448 |
|
| Securities: |
|
|
396,442 |
|
|
|
378,612 |
|
|
|
17,829 |
|
| Government bonds |
|
|
260,952 |
|
|
|
243,074 |
|
|
|
17,877 |
|
| Municipal bonds |
|
|
52,308 |
|
|
|
52,132 |
|
|
|
175 |
|
| Corporate bonds |
|
|
76,133 |
|
|
|
75,571 |
|
|
|
561 |
|
| Domestic stocks |
|
|
6,084 |
|
|
|
6,892 |
|
|
|
(807 |
) |
| Foreign securities |
|
|
964 |
|
|
|
941 |
|
|
|
23 |
|
| Loans: |
|
|
14,419 |
|
|
|
13,763 |
|
|
|
655 |
|
| Policy loans |
|
|
14,419 |
|
|
|
13,763 |
|
|
|
655 |
|
| Tangible fixed assets |
|
|
187 |
|
|
|
178 |
|
|
|
9 |
|
| Intangible fixed assets |
|
|
970 |
|
|
|
240 |
|
|
|
730 |
|
| Agency accounts receivable |
|
|
21 |
|
|
|
24 |
|
|
|
(2 |
) |
| Reinsurance accounts receivable |
|
|
230 |
|
|
|
183 |
|
|
|
47 |
|
| Other assets |
|
|
8,549 |
|
|
|
8,911 |
|
|
|
(362 |
) |
| Deferred tax assets |
|
|
6,290 |
|
|
|
6,931 |
|
|
|
(641 |
) |
| Allowance for possible loan losses |
|
|
(7 |
) |
|
|
(7 |
) |
|
|
0 |
|
|
|
|
|
|
|
|
|
|
|
|
|
|
| Total assets |
|
|
494,625 |
|
|
|
468,988 |
|
|
|
25,636 |
|
|
|
|
|
|
|
|
|
|
|
|
|
|
| Liabilities: |
|
|
|
|
|
|
|
|
|
|
|
|
| Policy reserves: |
|
|
435,044 |
|
|
|
411,682 |
|
|
|
23,361 |
|
| Reserve for outstanding claims |
|
|
2,751 |
|
|
|
2,998 |
|
|
|
(247 |
) |
| Policy reserves |
|
|
430,861 |
|
|
|
407,193 |
|
|
|
23,668 |
|
| Reserve for dividends to policyholders |
|
|
1,431 |
|
|
|
1,491 |
|
|
|
(59 |
) |
| Agency accounts payable |
|
|
789 |
|
|
|
804 |
|
|
|
(15 |
) |
| Reinsurance accounts payable |
|
|
123 |
|
|
|
113 |
|
|
|
9 |
|
| Other liabilities |
|
|
30,172 |
|
|
|
30,000 |
|
|
|
172 |
|
| Reserve for retirement benefits |
|
|
343 |
|
|
|
300 |
|
|
|
42 |
|
| Reserve for bonus payments to directors |
|
|
— |
|
|
|
15 |
|
|
|
(15 |
) |
| Reserves under the special laws: |
|
|
584 |
|
|
|
542 |
|
|
|
42 |
|
| Reserve for price fluctuation |
|
|
584 |
|
|
|
542 |
|
|
|
42 |
|
|
|
|
|
|
|
|
|
|
|
|
|
|
| Total liabilities |
|
|
467,056 |
|
|
|
443,459 |
|
|
|
23,596 |
|
|
|
|
|
|
|
|
|
|
|
|
|
|
| Net assets: |
|
|
|
|
|
|
|
|
|
|
|
|
| Shareholders’ equity: |
|
|
|
|
|
|
|
|
|
|
|
|
| Common stock |
|
|
20,000 |
|
|
|
20,000 |
|
|
|
— |
|
| Retained earnings |
|
|
1,505 |
|
|
|
1,564 |
|
|
|
(59 |
) |
| Total shareholders’ equity |
|
|
21,505 |
|
|
|
21,564 |
|
|
|
(59 |
) |
| Valuation and translation adjustments: |
|
|
|
|
|
|
|
|
|
|
|
|
| Unrealized gains on securities available for sale, net of tax |
|
|
6,063 |
|
|
|
3,964 |
|
|
|
2,098 |
|
| Total valuation and translation adjustments |
|
|
6,063 |
|
|
|
3,964 |
|
|
|
2,098 |
|
|
|
|
|
|
|
|
|
|
|
|
|
|
| Total net assets |
|
|
27,568 |
|
|
|
25,528 |
|
|
|
2,039 |
|
|
|
|
|
|
|
|
|
|
|
|
|
|
| Total liabilities and net assets |
|
|
494,625 |
|
|
|
468,988 |
|
|
|
25,636 |
|
|
|
|
|
|
|
|
|
|
|
|
|
|
36
NIPPONKOA Life Insurance Co., Ltd. (Non-consolidated)
Interim Statements of Income
|
|
|
|
|
|
|
|
|
|
|
|
|
|
|
|
|
| |
|
(Millions of yen) |
|
| |
|
Six months
ended
September 30, 2009
(April 1 to
September 30, 2009) |
|
|
Six months ended
September 30, 2010
(April 1 to
September 30, 2010) |
|
|
Increase
(Decrease) |
|
|
Rate of
change |
|
| |
|
Amount |
|
|
Amount |
|
|
|
|
|
|
|
| Ordinary income: |
|
|
49,162 |
|
|
|
53,689 |
|
|
|
4,527 |
|
|
|
9.2 |
% |
| Insurance premiums and other: |
|
|
44,315 |
|
|
|
48,443 |
|
|
|
4,127 |
|
|
|
9.3 |
|
| Insurance premiums |
|
|
44,230 |
|
|
|
48,033 |
|
|
|
3,803 |
|
|
|
8.6 |
|
| Investment income: |
|
|
4,344 |
|
|
|
4,632 |
|
|
|
288 |
|
|
|
6.6 |
|
| Interest and dividend income |
|
|
3,890 |
|
|
|
4,402 |
|
|
|
511 |
|
|
|
13.2 |
|
| Investment gains on money trusts |
|
|
380 |
|
|
|
230 |
|
|
|
(149 |
) |
|
|
(39.4 |
) |
| Gains on sales of securities |
|
|
73 |
|
|
|
— |
|
|
|
(73 |
) |
|
|
(100.0 |
) |
| Other ordinary income: |
|
|
502 |
|
|
|
613 |
|
|
|
111 |
|
|
|
22.1 |
|
| Reversal of reserve for outstanding claims |
|
|
— |
|
|
|
247 |
|
|
|
247 |
|
|
|
— |
|
|
|
|
|
|
|
|
|
|
|
|
|
|
|
|
|
|
| Ordinary expenses: |
|
|
48,282 |
|
|
|
53,101 |
|
|
|
4,819 |
|
|
|
10.0 |
|
| Insurance claims and other: |
|
|
18,998 |
|
|
|
19,797 |
|
|
|
799 |
|
|
|
4.2 |
|
| Insurance claims |
|
|
4,317 |
|
|
|
5,398 |
|
|
|
1,080 |
|
|
|
25.0 |
|
| Annuity payments |
|
|
196 |
|
|
|
241 |
|
|
|
44 |
|
|
|
22.7 |
|
| Insurance benefits |
|
|
1,457 |
|
|
|
1,806 |
|
|
|
349 |
|
|
|
24.0 |
|
| Surrender benefits |
|
|
12,657 |
|
|
|
11,957 |
|
|
|
(700 |
) |
|
|
(5.5 |
) |
| Other refunds |
|
|
112 |
|
|
|
118 |
|
|
|
6 |
|
|
|
5.4 |
|
| Provision for policy reserves and other: |
|
|
20,168 |
|
|
|
23,668 |
|
|
|
3,499 |
|
|
|
17.4 |
|
| Provision for reserve for outstanding claims |
|
|
95 |
|
|
|
— |
|
|
|
(95 |
) |
|
|
(100.0 |
) |
| Provision for policy reserves |
|
|
20,072 |
|
|
|
23,668 |
|
|
|
3,595 |
|
|
|
17.9 |
|
| Provision for interest portion of reserve for dividends to policyholders |
|
|
0 |
|
|
|
0 |
|
|
|
0 |
|
|
|
26.2 |
|
| Investment expenses: |
|
|
38 |
|
|
|
21 |
|
|
|
(17 |
) |
|
|
(44.8 |
) |
| Interest paid |
|
|
35 |
|
|
|
18 |
|
|
|
(17 |
) |
|
|
(47.3 |
) |
| Operating, general and administrative expenses |
|
|
8,582 |
|
|
|
9,147 |
|
|
|
565 |
|
|
|
6.6 |
|
| Other ordinary expenses |
|
|
493 |
|
|
|
465 |
|
|
|
(28 |
) |
|
|
(5.7 |
) |
|
|
|
|
|
|
|
|
|
|
|
|
|
|
|
|
|
| Ordinary profit |
|
|
880 |
|
|
|
587 |
|
|
|
(292 |
) |
|
|
(33.2 |
) |
|
|
|
|
|
|
|
|
|
|
|
|
|
|
|
|
|
| Extraordinary gains: |
|
|
— |
|
|
|
0 |
|
|
|
0 |
|
|
|
— |
|
| Reversal of allowance for possible loan losses |
|
|
— |
|
|
|
0 |
|
|
|
0 |
|
|
|
— |
|
| Extraordinary losses: |
|
|
47 |
|
|
|
102 |
|
|
|
55 |
|
|
|
116.6 |
|
| Losses on disposal of fixed assets |
|
|
8 |
|
|
|
0 |
|
|
|
(7 |
) |
|
|
(92.8 |
) |
| Provision for reserves under the special laws: |
|
|
39 |
|
|
|
42 |
|
|
|
2 |
|
|
|
7.0 |
|
| Provision for reserve for price fluctuation |
|
|
39 |
|
|
|
42 |
|
|
|
2 |
|
|
|
7.0 |
|
| Other extraordinary losses |
|
|
— |
|
|
|
60 |
|
|
|
60 |
|
|
|
— |
|
|
|
|
|
|
|
|
|
|
|
|
|
|
|
|
|
|
| Provision for reserve for dividends to policyholders |
|
|
515 |
|
|
|
537 |
|
|
|
22 |
|
|
|
4.3 |
|
| Income (loss) before income taxes |
|
|
317 |
|
|
|
(51 |
) |
|
|
(369 |
) |
|
|
(116.4 |
) |
| Income taxes |
|
|
351 |
|
|
|
555 |
|
|
|
204 |
|
|
|
58.1 |
|
| Deferred income taxes |
|
|
(219 |
) |
|
|
(548 |
) |
|
|
(328 |
) |
|
|
— |
|
| Total income taxes |
|
|
131 |
|
|
|
7 |
|
|
|
(124 |
) |
|
|
(94.6 |
) |
| Net income (loss) |
|
|
185 |
|
|
|
(59 |
) |
|
|
(244 |
) |
|
|
(131.8 |
) |
|
|
|
|
|
|
|
|
|
|
|
|
|
|
|
|
|
37
NIPPONKOA Life Insurance Co., Ltd. (Non-consolidated)
Major Business Results
Total amount of policies in force and total amount of new policies
Total amount of policies in force
|
|
|
|
|
|
|
|
|
|
|
|
|
|
|
|
|
|
|
|
|
|
|
|
|
|
|
|
|
|
|
|
|
| |
|
(Number in thousands, Yen in hundred millions, %) |
|
| |
|
As of September 30, 2010 |
|
|
As of March 31, 2010 |
|
| |
|
Number |
|
|
Amount |
|
|
Number |
|
|
Amount |
|
| |
|
|
|
|
Rate of
change |
|
|
|
|
|
Rate of
change |
|
|
|
|
|
Rate of
change |
|
|
|
|
|
Rate of
change |
|
| Individual insurance |
|
|
585 |
|
|
|
105.4 |
|
|
|
41,423 |
|
|
|
103.4 |
|
|
|
555 |
|
|
|
111.1 |
|
|
|
40,044 |
|
|
|
105.1 |
|
| Individual annuities |
|
|
53 |
|
|
|
99.8 |
|
|
|
1,973 |
|
|
|
100.1 |
|
|
|
53 |
|
|
|
96.3 |
|
|
|
1,971 |
|
|
|
96.3 |
|
| Group insurance |
|
|
— |
|
|
|
— |
|
|
|
11,272 |
|
|
|
102.0 |
|
|
|
— |
|
|
|
— |
|
|
|
11,052 |
|
|
|
109.9 |
|
| Group annuities |
|
|
— |
|
|
|
— |
|
|
|
— |
|
|
|
— |
|
|
|
— |
|
|
|
— |
|
|
|
— |
|
|
|
— |
|
| Note) |
Amount of “Individual annuities” represents the sum of annuity fund at the beginning of annuity payment of contracts before the beginning of annuity payment
and policy reserves for the contracts after the beginning of annuity payment. |
Total amount of new policies
|
|
|
|
|
|
|
|
|
|
|
|
|
|
|
|
|
|
|
|
|
|
|
|
|
|
|
|
|
|
|
|
|
| |
|
(Number in thousands, Yen in hundred millions, %) |
|
| |
|
Six months ended September 30, 2009
(April 1 to September 30, 2009) |
|
|
Six months ended September 30, 2010
(April 1 to September 30,
2010) |
|
| |
|
Number |
|
|
Amount |
|
|
Number |
|
|
Amount |
|
| |
|
|
|
|
Rate of
change |
|
|
|
|
|
Rate of
change |
|
|
|
|
|
Rate of
change |
|
|
|
|
|
Rate of
change |
|
| Individual insurance |
|
|
46 |
|
|
|
120.9 |
|
|
|
3,149 |
|
|
|
108.0 |
|
|
|
51 |
|
|
|
110.4 |
|
|
|
3,810 |
|
|
|
121.0 |
|
| Individual annuities |
|
|
0 |
|
|
|
92.8 |
|
|
|
27 |
|
|
|
86.9 |
|
|
|
1 |
|
|
|
210.5 |
|
|
|
55 |
|
|
|
201.2 |
|
| Group insurance |
|
|
— |
|
|
|
— |
|
|
|
240 |
|
|
|
165.2 |
|
|
|
— |
|
|
|
— |
|
|
|
63 |
|
|
|
26.2 |
|
| Group annuities |
|
|
— |
|
|
|
— |
|
|
|
— |
|
|
|
— |
|
|
|
— |
|
|
|
— |
|
|
|
— |
|
|
|
— |
|
| Note) |
Amount of “Individual annuities” represents the amount of annuity fund at the beginning of annuity payment. |
Annualized premiums
Policies in force
|
|
|
|
|
|
|
|
|
|
|
|
|
|
|
|
|
| |
|
(Millions of yen, %) |
|
| |
|
As of September 30, 2010 |
|
|
As of March 31, 2010 |
|
| |
|
|
|
|
Rate of
change |
|
|
|
|
|
Rate of
change |
|
| Individual insurance |
|
|
59,761 |
|
|
|
103.5 |
|
|
|
57,758 |
|
|
|
105.3 |
|
| Individual annuities |
|
|
11,974 |
|
|
|
100.1 |
|
|
|
11,966 |
|
|
|
96.5 |
|
|
|
|
|
|
|
|
|
|
|
|
|
|
|
|
|
|
| Total |
|
|
71,736 |
|
|
|
102.9 |
|
|
|
69,725 |
|
|
|
103.6 |
|
|
|
|
|
|
|
|
|
|
|
|
|
|
|
|
|
|
| Medical and survival benefits |
|
|
14,215 |
|
|
|
104.4 |
|
|
|
13,610 |
|
|
|
111.6 |
|
|
|
|
|
|
|
|
|
|
|
|
|
|
|
|
|
|
New policies
|
|
|
|
|
|
|
|
|
|
|
|
|
|
|
|
|
| |
|
(Millions of yen, %) |
|
| |
|
Six months ended September 30, 2009
(April 1 to September 30,
2009) |
|
|
Six months ended September 30, 2010
(April 1 to September 30,
2010) |
|
| |
|
|
|
|
Rate of
change |
|
|
|
|
|
Rate of
change |
|
| Individual insurance |
|
|
4,300 |
|
|
|
103.0 |
|
|
|
4,952 |
|
|
|
115.2 |
|
| Individual annuities |
|
|
164 |
|
|
|
96.0 |
|
|
|
303 |
|
|
|
185.0 |
|
|
|
|
|
|
|
|
|
|
|
|
|
|
|
|
|
|
| Total |
|
|
4,464 |
|
|
|
102.7 |
|
|
|
5,255 |
|
|
|
117.7 |
|
|
|
|
|
|
|
|
|
|
|
|
|
|
|
|
|
|
| Medical and survival benefits |
|
|
1,214 |
|
|
|
110.0 |
|
|
|
1,171 |
|
|
|
96.4 |
|
|
|
|
|
|
|
|
|
|
|
|
|
|
|
|
|
|
Notes)
| 1. |
Annualized premiums are calculated by using multipliers for various premium payment terms to the premium per payment. In single premium contracts, the amount is
calculated by dividing the premium by the duration of the policy. |
| 2. |
Annualized premiums for medical and survival benefits include (a) premium related to medical benefits such as hospitalization and surgery benefits and
(b) premium related to survival benefits such as specific illness. |
38
NIPPONKOA Life Insurance Co., Ltd. (Non-consolidated)
Solvency Margin Ratio
|
|
|
|
|
|
|
|
|
| |
|
(Millions of yen) |
|
| |
|
As of September 30, 2010 |
|
|
As of March 31, 2010 |
|
| (A) Total Solvency Margin |
|
|
63,354 |
|
|
|
60,078 |
|
| Capital, etc. |
|
|
20,943 |
|
|
|
21,564 |
|
| Reserve for price fluctuation |
|
|
584 |
|
|
|
542 |
|
| Contingency reserve |
|
|
5,078 |
|
|
|
4,859 |
|
| General allowance for possible loan losses |
|
|
— |
|
|
|
— |
|
| Unrealized gains on securities (90% of gain or 100% of loss) |
|
|
8,552 |
|
|
|
5,592 |
|
| Net unrealized gains and losses on real estate (85% of gain or 100% of loss) |
|
|
— |
|
|
|
— |
|
| Policy reserves in excess of surrender values |
|
|
26,710 |
|
|
|
25,993 |
|
| Brought in capital, etc. |
|
|
— |
|
|
|
— |
|
| Subordinated debt, etc. |
|
|
— |
|
|
|
— |
|
| Deductions |
|
|
— |
|
|
|
— |
|
| Others |
|
|
1,485 |
|
|
|
1,527 |
|
| (B) Total Risks
|
|
|
4,560 |
|
|
|
4,368 |
|
| Underwriting risk (R1) |
|
|
3,020 |
|
|
|
2,930 |
|
| Underwriting risk for third-sector insurance products including accident and sickness insurance (R8)
|
|
|
1,042 |
|
|
|
970 |
|
| Guaranteed interest rate risk (R2) |
|
|
169 |
|
|
|
164 |
|
| Investment risk (R3) |
|
|
1,629 |
|
|
|
1,538 |
|
| Business management risk (R4) |
|
|
117 |
|
|
|
112 |
|
| Guaranteed minimum benefit risk (R7) |
|
|
— |
|
|
|
— |
|
| (C) Solvency Margin Ratio
[(A) / {(1/2) x (B)}] x 100 |
|
|
2,778.6 |
% |
|
|
2,750.4 |
% |
| Note) |
The above figures are calculated based on Articles 86, 87, 161, 162 and 190 of the Ordinance for Enforcement of the Insurance Business Law and the provisions of
Notification No. 50 of the Ministry of Finance (1996). “Policy reserves in excess of surrender values” is calculated based on the provisions of Article 1 Paragraph 3-1 of Notification No. 50 of the Ministry of Finance.
|
39
Sompo Japan DIY Life Insurance Co., Ltd. (Non-consolidated)
Interim Balance Sheets
|
|
|
|
|
|
|
|
|
|
|
|
|
| |
|
(Millions of yen) |
|
| |
|
As of September 30, 2010 |
|
|
As of March 31, 2010 |
|
|
Increase
(Decrease) |
|
| |
|
Amount |
|
|
Amount |
|
|
|
|
| Assets: |
|
|
|
|
|
|
|
|
|
|
|
|
| Cash and deposits |
|
|
216 |
|
|
|
182 |
|
|
|
33 |
|
| Securities: |
|
|
5,033 |
|
|
|
5,407 |
|
|
|
(373 |
) |
| Government bonds |
|
|
2,396 |
|
|
|
2,690 |
|
|
|
(293 |
) |
| Domestic stocks |
|
|
866 |
|
|
|
950 |
|
|
|
(84 |
) |
| Tangible fixed assets |
|
|
68 |
|
|
|
80 |
|
|
|
(12 |
) |
| Intangible fixed assets |
|
|
— |
|
|
|
0 |
|
|
|
(0 |
) |
| Agency accounts receivable |
|
|
0 |
|
|
|
0 |
|
|
|
0 |
|
| Reinsurance accounts receivable |
|
|
28 |
|
|
|
21 |
|
|
|
6 |
|
| Other assets |
|
|
862 |
|
|
|
456 |
|
|
|
406 |
|
| Allowance for possible loan losses |
|
|
— |
|
|
|
(0 |
) |
|
|
0 |
|
|
|
|
|
|
|
|
|
|
|
|
|
|
| Total assets |
|
|
6,209 |
|
|
|
6,149 |
|
|
|
59 |
|
|
|
|
|
|
|
|
|
|
|
|
|
|
| Liabilities: |
|
|
|
|
|
|
|
|
|
|
|
|
| Policy reserves: |
|
|
1,095 |
|
|
|
1,041 |
|
|
|
54 |
|
| Reserve for outstanding claims |
|
|
194 |
|
|
|
141 |
|
|
|
53 |
|
| Policy reserves |
|
|
900 |
|
|
|
899 |
|
|
|
0 |
|
| Agency accounts payable |
|
|
3 |
|
|
|
3 |
|
|
|
0 |
|
| Reinsurance accounts payable |
|
|
33 |
|
|
|
32 |
|
|
|
1 |
|
| Other liabilities |
|
|
350 |
|
|
|
342 |
|
|
|
8 |
|
| Reserve for retirement benefits |
|
|
22 |
|
|
|
20 |
|
|
|
2 |
|
| Reserves under the special laws: |
|
|
16 |
|
|
|
15 |
|
|
|
0 |
|
| Reserve for price fluctuation |
|
|
16 |
|
|
|
15 |
|
|
|
0 |
|
| Deferred tax liabilities |
|
|
195 |
|
|
|
225 |
|
|
|
(30 |
) |
|
|
|
|
|
|
|
|
|
|
|
|
|
| Total liabilities |
|
|
1,717 |
|
|
|
1,680 |
|
|
|
37 |
|
|
|
|
|
|
|
|
|
|
|
|
|
|
| Net assets: |
|
|
|
|
|
|
|
|
|
|
|
|
| Shareholders’ equity: |
|
|
|
|
|
|
|
|
|
|
|
|
| Common stock |
|
|
10,100 |
|
|
|
10,100 |
|
|
|
— |
|
| Capital surplus |
|
|
2,100 |
|
|
|
2,100 |
|
|
|
— |
|
| Retained earnings |
|
|
(8,052 |
) |
|
|
(8,128 |
) |
|
|
75 |
|
| Total shareholders’ equity |
|
|
4,147 |
|
|
|
4,071 |
|
|
|
75 |
|
| Valuation and translation adjustments: |
|
|
|
|
|
|
|
|
|
|
|
|
| Unrealized gains on securities available for sale, net of tax |
|
|
344 |
|
|
|
397 |
|
|
|
(53 |
) |
| Total valuation and translation adjustments |
|
|
344 |
|
|
|
397 |
|
|
|
(53 |
) |
|
|
|
|
|
|
|
|
|
|
|
|
|
| Total net assets |
|
|
4,491 |
|
|
|
4,468 |
|
|
|
22 |
|
|
|
|
|
|
|
|
|
|
|
|
|
|
| Total liabilities and net assets |
|
|
6,209 |
|
|
|
6,149 |
|
|
|
59 |
|
|
|
|
|
|
|
|
|
|
|
|
|
|
40
Sompo Japan DIY Life Insurance Co., Ltd. (Non-consolidated)
Interim Statements of Income
|
|
|
|
|
|
|
|
|
|
|
|
|
|
|
|
|
| |
|
(Millions of yen) |
|
| |
|
Six months ended
September 30, 2009
(April 1 to
September 30, 2009) |
|
|
Six months ended
September 30, 2010
(April 1 to
September 30, 2010) |
|
|
Increase
(Decrease) |
|
|
Rate of
change |
|
| |
|
|
|
| |
|
Amount |
|
|
Amount |
|
|
|
|
|
|
|
| Ordinary income: |
|
|
1,835 |
|
|
|
1,928 |
|
|
|
93 |
|
|
|
5.1 |
% |
| Insurance premiums and other: |
|
|
1,812 |
|
|
|
1,912 |
|
|
|
100 |
|
|
|
5.6 |
|
| Insurance premiums |
|
|
1,773 |
|
|
|
1,824 |
|
|
|
50 |
|
|
|
2.9 |
|
| Investment income: |
|
|
23 |
|
|
|
15 |
|
|
|
(7 |
) |
|
|
(33.0 |
) |
| Interest and dividend income |
|
|
23 |
|
|
|
15 |
|
|
|
(7 |
) |
|
|
(33.0 |
) |
| Other ordinary income |
|
|
0 |
|
|
|
0 |
|
|
|
(0 |
) |
|
|
(44.3 |
) |
|
|
|
|
|
|
|
|
|
|
|
|
|
|
|
|
|
| Ordinary expenses: |
|
|
2,130 |
|
|
|
1,850 |
|
|
|
(280 |
) |
|
|
(13.2 |
) |
| Insurance claims and other: |
|
|
590 |
|
|
|
488 |
|
|
|
(101 |
) |
|
|
(17.2 |
) |
| Insurance claims |
|
|
405 |
|
|
|
307 |
|
|
|
(98 |
) |
|
|
(24.3 |
) |
| Insurance benefits |
|
|
100 |
|
|
|
102 |
|
|
|
2 |
|
|
|
2.3 |
|
| Other refunds |
|
|
0 |
|
|
|
2 |
|
|
|
1 |
|
|
|
290.4 |
|
| Provision for policy reserves and other: |
|
|
110 |
|
|
|
54 |
|
|
|
(55 |
) |
|
|
(50.5 |
) |
| Provision for reserve for outstanding claims |
|
|
98 |
|
|
|
53 |
|
|
|
(44 |
) |
|
|
(45.2 |
) |
| Provision for policy reserves |
|
|
11 |
|
|
|
0 |
|
|
|
(11 |
) |
|
|
(94.7 |
) |
| Investment expenses: |
|
|
0 |
|
|
|
0 |
|
|
|
(0 |
) |
|
|
(27.3 |
) |
| Interest paid |
|
|
0 |
|
|
|
0 |
|
|
|
(0 |
) |
|
|
(27.3 |
) |
| Operating, general and administrative expenses |
|
|
1,394 |
|
|
|
1,279 |
|
|
|
(115 |
) |
|
|
(8.3 |
) |
| Other ordinary expenses |
|
|
34 |
|
|
|
27 |
|
|
|
(7 |
) |
|
|
(20.2 |
) |
|
|
|
|
|
|
|
|
|
|
|
|
|
|
|
|
|
| Ordinary profit (loss) |
|
|
(294 |
) |
|
|
78 |
|
|
|
373 |
|
|
|
— |
|
|
|
|
|
|
|
|
|
|
|
|
|
|
|
|
|
|
| Extraordinary losses: |
|
|
8 |
|
|
|
0 |
|
|
|
(8 |
) |
|
|
(92.4 |
) |
| Provision for reserves under the special laws: |
|
|
0 |
|
|
|
0 |
|
|
|
(0 |
) |
|
|
(10.6 |
) |
| Provision for reserve for price fluctuation |
|
|
0 |
|
|
|
0 |
|
|
|
(0 |
) |
|
|
(10.6 |
) |
| Other extraordinary losses |
|
|
8 |
|
|
|
— |
|
|
|
(8 |
) |
|
|
(100.0 |
) |
|
|
|
|
|
|
|
|
|
|
|
|
|
|
|
|
|
| Income (loss) before income taxes |
|
|
(303 |
) |
|
|
77 |
|
|
|
381 |
|
|
|
— |
|
| Income taxes |
|
|
1 |
|
|
|
1 |
|
|
|
— |
|
|
|
— |
|
| Total income taxes |
|
|
1 |
|
|
|
1 |
|
|
|
— |
|
|
|
— |
|
| Net income (loss) |
|
|
(305 |
) |
|
|
75 |
|
|
|
381 |
|
|
|
— |
|
|
|
|
|
|
|
|
|
|
|
|
|
|
|
|
|
|
41
Sompo Japan DIY Life Insurance Co., Ltd. (Non-consolidated)
Major Business Results
Total amount of policies in force and total amount of new policies
Total amount of policies in force
|
|
|
|
|
|
|
|
|
|
|
|
|
|
|
|
|
|
|
|
|
|
|
|
|
|
|
|
|
|
|
|
|
| |
|
(Number in thousands, Yen in hundred millions, %) |
|
| |
|
As of September 30, 2010 |
|
|
As of March 31, 2010 |
|
| |
|
Number |
|
|
Amount |
|
|
Number |
|
|
Amount |
|
| |
|
|
|
|
Rate of
change |
|
|
|
|
|
Rate of
change |
|
|
|
|
|
Rate of
change |
|
|
|
|
|
Rate of
change |
|
| Individual insurance |
|
|
46 |
|
|
|
99.2 |
|
|
|
7,924 |
|
|
|
98.6 |
|
|
|
46 |
|
|
|
101.1 |
|
|
|
8,039 |
|
|
|
99.7 |
|
| Individual annuities |
|
|
— |
|
|
|
— |
|
|
|
— |
|
|
|
— |
|
|
|
— |
|
|
|
— |
|
|
|
— |
|
|
|
— |
|
| Group insurance |
|
|
— |
|
|
|
— |
|
|
|
— |
|
|
|
— |
|
|
|
— |
|
|
|
— |
|
|
|
— |
|
|
|
— |
|
| Group annuities |
|
|
— |
|
|
|
— |
|
|
|
— |
|
|
|
— |
|
|
|
— |
|
|
|
— |
|
|
|
— |
|
|
|
— |
|
Total amount of new
policies
|
|
|
|
|
|
|
|
|
|
|
|
|
|
|
|
|
|
|
|
|
|
|
|
|
|
|
|
|
|
|
|
|
| |
|
(Number in thousands, Yen in hundred millions, %) |
|
| |
|
Six months ended September 30, 2009
(April 1 to September
30, 2009) |
|
|
Six months ended September 30, 2010
(April 1 to September 30,
2010) |
|
| |
|
Number |
|
|
Amount |
|
|
Number |
|
|
Amount |
|
| |
|
|
|
|
Rate of
change |
|
|
|
|
|
Rate of
change |
|
|
|
|
|
Rate of
change |
|
|
|
|
|
Rate of
change |
|
| Individual insurance |
|
|
2 |
|
|
|
106.8 |
|
|
|
417 |
|
|
|
102.7 |
|
|
|
1 |
|
|
|
71.8 |
|
|
|
288 |
|
|
|
69.2 |
|
| Individual annuities |
|
|
— |
|
|
|
— |
|
|
|
— |
|
|
|
— |
|
|
|
— |
|
|
|
— |
|
|
|
— |
|
|
|
— |
|
| Group insurance |
|
|
— |
|
|
|
— |
|
|
|
— |
|
|
|
— |
|
|
|
— |
|
|
|
— |
|
|
|
— |
|
|
|
— |
|
| Group annuities |
|
|
— |
|
|
|
— |
|
|
|
— |
|
|
|
— |
|
|
|
— |
|
|
|
— |
|
|
|
— |
|
|
|
— |
|
Annualized premiums
Policies in force
|
|
|
|
|
|
|
|
|
|
|
|
|
|
|
|
|
| |
|
(Millions of yen, %) |
|
| |
|
As of September 30, 2010 |
|
|
As of March 31, 2010 |
|
| |
|
|
|
|
Rate of
change |
|
|
|
|
|
Rate of
change |
|
| Individual insurance |
|
|
3,677 |
|
|
|
100.8 |
|
|
|
3,650 |
|
|
|
103.2 |
|
| Individual annuities |
|
|
— |
|
|
|
— |
|
|
|
— |
|
|
|
— |
|
| Total |
|
|
3,677 |
|
|
|
100.8 |
|
|
|
3,650 |
|
|
|
103.2 |
|
| Medical and survival benefits |
|
|
872 |
|
|
|
101.1 |
|
|
|
863 |
|
|
|
104.6 |
|
New policies
|
|
|
|
|
|
|
|
|
|
|
|
|
|
|
|
|
| |
|
(Millions of yen, %) |
|
| |
|
Six months ended September 30, 2009
(April 1 to September 30,
2009) |
|
|
Six months ended September 30, 2010
(April 1 to September 30,
2010) |
|
| |
|
|
|
|
Rate of
change |
|
|
|
|
|
Rate of
change |
|
| Individual insurance |
|
|
170 |
|
|
|
107.5 |
|
|
|
125 |
|
|
|
73.6 |
|
| Individual annuities |
|
|
— |
|
|
|
— |
|
|
|
— |
|
|
|
— |
|
| Total |
|
|
170 |
|
|
|
107.5 |
|
|
|
125 |
|
|
|
73.6 |
|
| Medical and survival benefits |
|
|
52 |
|
|
|
115.3 |
|
|
|
36 |
|
|
|
69.8 |
|
Notes)
| 1. |
Annualized premiums are calculated by using multipliers for various premium payment terms to the premium per payment. In single premium contracts, the amount is
calculated by dividing the premium by the duration of the policy. |
| 2. |
Annualized premiums for medical and survival benefits include (a) premium related to medical benefits such as hospitalization and surgery benefits,
(b) premium related to survival benefits such as specific illness and nursing benefits, and (c) premium related to premium waiver benefits, in which disability cause is excluded but causes such as specific illness and nursing care are
included. |
42
Sompo Japan DIY Life Insurance Co., Ltd. (Non-consolidated)
Solvency Margin Ratio
|
|
|
|
|
|
|
|
|
| |
|
(Millions of yen) |
|
| |
|
As of September 30, 2010 |
|
|
As of March 31, 2010 |
|
| (A) Total Solvency Margin |
|
|
5,194 |
|
|
|
5,199 |
|
| Capital, etc. |
|
|
4,147 |
|
|
|
4,071 |
|
| Reserve for price fluctuation |
|
|
16 |
|
|
|
15 |
|
| Contingency reserve |
|
|
545 |
|
|
|
551 |
|
| General allowance for possible loan losses |
|
|
— |
|
|
|
— |
|
| Unrealized gains on securities (90% of gain or 100% of loss) |
|
|
485 |
|
|
|
560 |
|
| Net unrealized gains and losses on real estate (85% of gain or 100% of loss) |
|
|
— |
|
|
|
— |
|
| Policy reserves in excess of surrender values |
|
|
— |
|
|
|
— |
|
| Brought in capital, etc. |
|
|
— |
|
|
|
— |
|
| Subordinated debt, etc. |
|
|
— |
|
|
|
— |
|
| Deductions |
|
|
— |
|
|
|
— |
|
| Others |
|
|
— |
|
|
|
— |
|
| (B) Total Risks
|
|
|
574 |
|
|
|
582 |
|
| Underwriting risk (R1) |
|
|
448 |
|
|
|
454 |
|
| Underwriting risk for third-sector insurance products including accident, sickness and nursing-care insurance (R8) |
|
|
95 |
|
|
|
95 |
|
| Guaranteed interest rate risk (R2) |
|
|
0 |
|
|
|
0 |
|
| Investment risk (R3) |
|
|
110 |
|
|
|
118 |
|
| Business management risk (R4) |
|
|
19 |
|
|
|
20 |
|
| Guaranteed minimum benefit risk (R7) |
|
|
— |
|
|
|
— |
|
| (C) Solvency Margin Ratio
[(A) / {(1/2) x (B)}] x 100 |
|
|
1,808.8 |
% |
|
|
1,785.9 |
% |
| Note) |
The above figures are calculated based on Articles 86, 87, 161, 162 and 190 of the Ordinance for Enforcement of the Insurance Business Law and the provisions of
Notification No. 50 of the Ministry of Finance (1996). “Policy reserves in excess of surrender values” is calculated based on the provisions of Article 1 Paragraph 3-1 of Notification No. 50 of the Ministry of Finance.
|
43
Supplementary Explanation
< Calculation of ratios >
|
|
|
|
|
| • Underwriting profit |
|
= |
|
Underwriting income – Underwriting expenses – Operating, general and administrative expenses related to underwriting + Other income and expenses* |
|
|
|
|
|
* |
|
Other income and expenses include, but not limited to, income tax expenses for compulsory automobile liability
insurance. |
|
|
|
|
|
|
|
|
| • Net loss ratio |
|
= |
|
(Net claims paid + Loss adjustment expenses) / Net premiums written × 100 |
|
|
|
|
|
|
|
|
| • Net expense ratio |
|
= |
|
(Net commissions and brokerage fees + Operating, general and administrative expenses related to underwriting) / Net premiums written ×
100 |
|
|
|
|
|
|
|
|
| • Underwriting result ratio |
|
= |
|
(Net premiums written – Net claims paid – Loss adjustment expenses – Operating expenses) / Net premiums written × 100 |
< Solvency margin ratio >
| |
• |
|
In addition to reserves to cover payments for claims, benefits and maturity refunds, etc., it is necessary for insurance companies to maintain
sufficient solvency in order to cover against risks which may exceed their normal estimates, i.e. the occurrence of major catastrophes, the fluctuation in mortality rate due to significant changes in key environmental factors and a big decline in
value of assets held by insurance companies, etc. |
| |
• |
|
Solvency margin ratio: (C), which is calculated in accordance with the Insurance Business Law, is the ratio of “solvency margin of insurance
companies by means of their capital, reserves, etc.” (total solvency margin: (A)) to “risks which will exceed their normal estimates” (total risks: (B)). |
| |
• |
|
“Risks which will exceed their normal estimates” are composed of risks described below. |
| |
<1> |
Underwriting risk, underwriting risk for third-sector insurance products including accident, sickness and nursing-care insurance: |
| |
|
Risks of occurrence of insurance claims in excess of normal estimates (excluding risks relating to major catastrophes) |
| |
<2> |
Guaranteed interest rate risk: |
| |
|
Risks of invested assets failing to yield assumed interest rates due to the aggravation of investment conditions than expected |
| |
|
Risks of retained securities and other assets fluctuating in prices in excess of normal estimates |
| |
<4> |
Business management risk: |
| |
|
Risks beyond normal estimates arising from business management (That does not fall under other categories.) |
| |
<5> |
Major catastrophe risk: |
| |
|
Risks of the occurrence of major catastrophic losses in excess of normal estimates (risks such as the Great Kanto Earthquake or Isewan typhoon)
|
| |
<6> |
Guaranteed minimum benefit risk: |
| |
|
Risks of special account assets fluctuating in prices in excess of normal estimates |
| |
• |
|
“Solvency margin of insurance companies by means of their capital, reserves, etc.” (total solvency margin) is the sum of total net assets
(excluding planned outflows), certain reserves (reserve for price fluctuation, contingency reserve and catastrophic loss reserve, etc.) and parts of net unrealized gains and losses on real estate, etc. |
| |
• |
|
Solvency margin ratio is one of the indicators for the regulatory authorities to monitor financial soundness of insurance companies. Solvency margin
ratio exceeding 200% would indicate adequate capability to meet payments of possible insurance claims. |
44
| 4. |
Supplementary Data about Financial Results for the six months ended September 30, 2010 at Press Conference |
Sompo Japan Insurance Inc. (Non-consolidated)
|
|
|
|
|
|
|
|
|
|
|
|
|
|
|
|
|
|
|
|
|
| |
|
(Yen in hundred millions) |
|
| |
|
Six months ended
September 30, 2009
(A) |
|
|
Year ended
March 31, 2010
(B) |
|
|
Six months ended
September 30, 2010
(C) |
|
|
Increase
(Decrease)
(C) - (B) |
|
|
Increase
(Decrease)
(C) - (A) |
|
| Net premiums written |
|
|
6,416 |
|
|
|
12,588 |
|
|
|
6,436 |
|
|
|
— |
|
|
|
20 |
|
| Rate of change |
|
|
(4.9 |
)% |
|
|
(2.4 |
)% |
|
|
0.3 |
% |
|
|
2.8 |
% |
|
|
5.2 |
% |
| ‚ Total assets |
|
|
50,086 |
|
|
|
50,292 |
|
|
|
48,572 |
|
|
|
(1,719 |
) |
|
|
(1,513 |
) |
| ƒ Net loss ratio |
|
|
74.7 |
% |
|
|
73.9 |
% |
|
|
69.3 |
% |
|
|
(4.6 |
)% |
|
|
(5.4 |
)% |
| „ Net expense ratio |
|
|
34.2 |
% |
|
|
34.1 |
% |
|
|
33.3 |
% |
|
|
(0.7 |
)% |
|
|
(0.8 |
)% |
| … Combined ratio |
|
|
108.8 |
% |
|
|
107.9 |
% |
|
|
102.6 |
% |
|
|
(5.3 |
)% |
|
|
(6.2 |
)% |
| Underwriting result ratio |
|
|
(8.8 |
)% |
|
|
(7.9 |
)% |
|
|
(2.6 |
)% |
|
|
5.3 |
% |
|
|
6.2 |
% |
| † Voluntary automobile insurance |
|
|
|
|
|
|
|
|
|
|
|
|
|
|
|
|
|
|
|
|
| • Net premiums written |
|
|
3,226 |
|
|
|
6,402 |
|
|
|
3,197 |
|
|
|
— |
|
|
|
(28 |
) |
| Rate of change |
|
|
(2.1 |
)% |
|
|
(2.1 |
)% |
|
|
(0.9 |
)% |
|
|
1.2 |
% |
|
|
1.2 |
% |
| • Underwriting result ratio |
|
|
(2.2 |
)% |
|
|
(4.8 |
)% |
|
|
(2.7 |
)% |
|
|
2.1 |
% |
|
|
(0.4 |
)% |
| • Net loss ratio |
|
|
67.6 |
% |
|
|
70.6 |
% |
|
|
69.4 |
% |
|
|
(1.2 |
)% |
|
|
1.8 |
% |
| • Net expense ratio |
|
|
34.7 |
% |
|
|
34.3 |
% |
|
|
33.3 |
% |
|
|
(0.9 |
)% |
|
|
(1.4 |
)% |
| ‡ Fire and allied insurance |
|
|
|
|
|
|
|
|
|
|
|
|
|
|
|
|
|
|
|
|
| • Net premiums written |
|
|
676 |
|
|
|
1,441 |
|
|
|
675 |
|
|
|
— |
|
|
|
(1 |
) |
| Rate of change |
|
|
(3.2 |
)% |
|
|
(0.6 |
)% |
|
|
(0.2 |
)% |
|
|
0.4 |
% |
|
|
3.0 |
% |
| • Underwriting result ratio |
|
|
12.4 |
% |
|
|
13.0 |
% |
|
|
12.2 |
% |
|
|
(0.8 |
)% |
|
|
(0.2 |
)% |
| • Net loss ratio |
|
|
44.5 |
% |
|
|
44.2 |
% |
|
|
43.3 |
% |
|
|
(0.9 |
)% |
|
|
(1.2 |
)% |
| • Net expense ratio |
|
|
43.1 |
% |
|
|
42.8 |
% |
|
|
44.5 |
% |
|
|
1.7 |
% |
|
|
1.4 |
% |
| ˆ Number of employees |
|
|
17,481 |
|
|
|
17,294 |
|
|
|
19,027 |
|
|
|
1,733 |
|
|
|
1,546 |
|
| ‰ Number of agencies |
|
|
47,336 |
|
|
|
46,294 |
|
|
|
45,533 |
|
|
|
(761 |
) |
|
|
(1,803 |
) |
<Reference> Consolidated figures of
NKSJ Holdings, Inc.
|
|
|
|
|
|
|
|
|
|
|
|
|
|
|
|
|
|
|
|
|
| |
|
(Yen in hundred millions) |
|
| |
|
Six months ended
September 30, 2009
(A) |
|
|
Year ended
March 31, 2010
(B) |
|
|
Six months ended
September 30, 2010
(C) |
|
|
Increase
(Decrease)
(C) - (B) |
|
|
Increase
(Decrease)
(C) - (A) |
|
| Ordinary income |
|
|
|
|
|
|
|
|
|
|
13,297 |
|
|
|
— |
|
|
|
— |
|
| ‚ Net premiums written |
|
|
|
|
|
|
|
|
|
|
9,878 |
|
|
|
— |
|
|
|
— |
|
| Rate of change |
|
|
|
|
|
|
|
|
|
|
— |
|
|
|
— |
|
|
|
— |
|
| ƒ Life insurance premiums written |
|
|
|
|
|
|
|
|
|
|
1,089 |
|
|
|
— |
|
|
|
— |
|
| Rate of change |
|
|
|
|
|
|
|
|
|
|
— |
|
|
|
— |
|
|
|
— |
|
| „ Ordinary profit |
|
|
|
|
|
|
|
|
|
|
388 |
|
|
|
— |
|
|
|
— |
|
| … Net income |
|
|
|
|
|
|
|
|
|
|
241 |
|
|
|
— |
|
|
|
— |
|
Notes)
| 1. |
Net loss ratio = (Net claims paid + Loss adjustment expenses) / Net premiums written × 100 |
| 2. |
Net expense ratio = (Net commissions and brokerage fees + Operating, general and administrative expenses related to underwriting) / Net premiums written × 100
|
| 3. |
Combined ratio = Net loss ratio + Net expense ratio |
| 4. |
Underwriting result ratio = 100 - Combined ratio |
| 5. |
Items with % within “Increase (Decrease)” represent change from the year ended March 31, 2010 and the six months ended September 30, 2009,
respectively. |
45
Sompo Japan Insurance Inc. (Non-consolidated)
Risk-monitored loans
|
|
|
|
|
|
|
|
|
|
|
|
|
| |
|
(Yen in hundred millions) |
|
| |
|
As of September 30, 2009 |
|
|
As of March 31, 2010 |
|
|
As of September 30, 2010 |
|
| Loans to borrowers in bankruptcy |
|
|
8 |
|
|
|
8 |
|
|
|
6 |
|
| Overdue loans |
|
|
22 |
|
|
|
20 |
|
|
|
16 |
|
| Loans overdue for three months or more |
|
|
— |
|
|
|
— |
|
|
|
— |
|
| Restructured loans |
|
|
7 |
|
|
|
11 |
|
|
|
4 |
|
|
|
|
|
|
|
|
|
|
|
|
|
|
| Total |
|
|
38 |
|
|
|
40 |
|
|
|
27 |
|
| Percent of total loans |
|
|
0.8 |
% |
|
|
0.9 |
% |
|
|
0.6 |
% |
|
|
|
|
|
|
|
|
|
|
|
|
|
| (Reference) Total loans |
|
|
4,823 |
|
|
|
4,761 |
|
|
|
4,681 |
|
Results of
self-assessment
|
|
|
|
|
|
|
|
|
|
|
|
|
| |
|
(Yen in hundred millions) |
|
| |
|
As of September 30, 2009 |
|
|
As of March 31, 2010 |
|
|
As of September 30, 2010 |
|
| No category |
|
|
47,938 |
|
|
|
48,472 |
|
|
|
46,457 |
|
| Category II |
|
|
587 |
|
|
|
616 |
|
|
|
486 |
|
| Category III |
|
|
99 |
|
|
|
97 |
|
|
|
93 |
|
| Category IV |
|
|
171 |
|
|
|
148 |
|
|
|
56 |
|
| Subtotal (Category II-IV) |
|
|
857 |
|
|
|
862 |
|
|
|
637 |
|
|
|
|
|
|
|
|
|
|
|
|
|
|
| Total |
|
|
48,796 |
|
|
|
49,334 |
|
|
|
47,094 |
|
|
|
|
|
|
|
|
|
|
|
|
|
|
The above figures represent amounts before
recognition of impairment losses. Impairment losses on securities are included in “Category IV”.
| ‚ |
Impairment losses on securities |
|
|
|
|
|
|
|
|
|
|
|
|
|
| |
|
(Yen in hundred millions) |
|
| |
|
Six months ended
September 30, 2009 |
|
|
Year ended
March 31, 2010 |
|
|
Six months ended
September 30, 2010 |
|
| Domestic bonds |
|
|
— |
|
|
|
— |
|
|
|
— |
|
| Domestic stocks |
|
|
39 |
|
|
|
25 |
|
|
|
27 |
|
| Foreign securities |
|
|
1 |
|
|
|
3 |
|
|
|
10 |
|
| Others |
|
|
0 |
|
|
|
0 |
|
|
|
— |
|
|
|
|
|
|
|
|
|
|
|
|
|
|
| Total |
|
|
41 |
|
|
|
28 |
|
|
|
37 |
|
|
|
|
|
|
|
|
|
|
|
|
|
|
Impairment rules applied
Impairment losses on securities which have readily determinable fair value are recognized if fair value declines by 30% or more of their cost (historical cost or amortized cost).
| ƒ |
Impairment losses on fixed assets |
|
|
|
|
|
|
|
|
|
|
|
|
|
| |
|
(Yen in hundred millions) |
|
| |
|
Six months ended
September 30, 2009 |
|
|
Year ended
March 31, 2010 |
|
|
Six months ended
September 30, 2010 |
|
| Land |
|
|
— |
|
|
|
3 |
|
|
|
2 |
|
| Buildings |
|
|
— |
|
|
|
0 |
|
|
|
0 |
|
| Others |
|
|
— |
|
|
|
— |
|
|
|
— |
|
|
|
|
|
|
|
|
|
|
|
|
|
|
| Total |
|
|
— |
|
|
|
3 |
|
|
|
2 |
|
|
|
|
|
|
|
|
|
|
|
|
|
|
| „ |
Unrealized gains and losses on securities |
|
|
|
|
|
|
|
|
|
|
|
|
|
| |
|
(Yen in hundred millions) |
|
| |
|
As of September 30, 2009 |
|
|
As of March 31, 2010 |
|
|
As of September 30, 2010 |
|
| Domestic bonds |
|
|
361 |
|
|
|
320 |
|
|
|
654 |
|
| Domestic stocks |
|
|
5,041 |
|
|
|
5,800 |
|
|
|
4,249 |
|
| Foreign securities |
|
|
(369 |
) |
|
|
(198 |
) |
|
|
(384 |
) |
| Others |
|
|
30 |
|
|
|
40 |
|
|
|
37 |
|
|
|
|
|
|
|
|
|
|
|
|
|
|
| Total |
|
|
5,064 |
|
|
|
5,963 |
|
|
|
4,556 |
|
|
|
|
|
|
|
|
|
|
|
|
|
|
Notes)
| 1. |
Unrealized gains and losses on monetary receivables bought are included in “Others”. |
| 2. |
Besides the above, unrealized gains and losses on trust assets in money trust other than trading purposes or held to maturity amount to 0.0 billion yen for the six
months ended September 30, 2009, 0.0 billion yen for the year ended March 31,2010, and (0.1) billion yen for the six months ended September 30, 2010. |
46
Sompo Japan Insurance Inc. (Non-consolidated)
| … |
Underwriting of third-sector insurance products |
|
|
|
|
|
|
|
|
|
|
|
|
|
|
|
|
|
| |
|
(Number in hundreds) |
|
| |
|
Six months ended September 30, 2010 |
|
|
Breakdown of number |
|
| |
|
Number |
|
|
Increase
(Decrease) |
|
|
Sompo Japan
Insurance Inc. |
|
|
Subsidiaries |
|
| Number of policies |
|
|
5,426 |
|
|
|
166 |
|
|
|
4,318 |
|
|
|
1,107 |
|
Notes)
| 1. |
This table represents total and respective number of policies of Sompo Japan Insurance Inc. and its subsidiaries from April 1 to September 30, 2010.
|
| 2. |
The above numbers represent the cumulative sales of policies of medical insurance and cancer insurance. |
| † |
Claims by natural disasters |
|
|
|
|
|
|
|
|
|
|
|
|
|
|
|
| |
|
|
|
(Yen in hundred millions) |
|
| |
|
|
|
Six months ended
September 30, 2009 |
|
|
Year ended
March 31, 2010 |
|
|
Six months ended
September 30, 2010 |
|
| Direct claims paid |
|
a |
|
|
32 |
|
|
|
130 |
|
|
|
14 |
|
| Net claims paid |
|
b |
|
|
25 |
|
|
|
116 |
|
|
|
14 |
|
| Unpaid claims |
|
c |
|
|
4 |
|
|
|
15 |
|
|
|
4 |
|
| Net incurred loss |
|
b + c |
|
|
30 |
|
|
|
132 |
|
|
|
18 |
|
Notes)
| 1. |
This table represents paid and unpaid claims related to natural disasters which occurred in the period. |
| 2. |
Amounts of unpaid claims are calculated by deducting reinsurance recoverable on unpaid loss from direct insurance reserve for outstanding losses and claims.
|
| ‡ |
Catastrophic loss reserve |
|
|
|
|
|
|
|
|
|
|
|
|
|
|
|
|
|
|
|
|
|
|
|
|
|
|
|
|
|
|
|
|
|
|
|
|
|
| |
|
(Yen in hundred millions, %) |
|
| |
|
Six months ended
September 30,
2009 |
|
|
Year ended
March 31,
2010 |
|
|
Six months ended
September 30,
2010 |
|
| Business line |
|
Balance |
|
|
Balance
ratio |
|
|
Provision |
|
|
Balance |
|
|
Balance
ratio |
|
|
Provision |
|
|
Balance |
|
|
Balance
ratio |
|
|
Provision |
|
| Fire and allied insurance |
|
|
1,389 |
|
|
|
105.1 |
|
|
|
93 |
|
|
|
1,485 |
|
|
|
105.4 |
|
|
|
189 |
|
|
|
1,580 |
|
|
|
119.9 |
|
|
|
95 |
|
| Marine insurance |
|
|
257 |
|
|
|
106.0 |
|
|
|
4 |
|
|
|
262 |
|
|
|
110.5 |
|
|
|
8 |
|
|
|
264 |
|
|
|
102.1 |
|
|
|
4 |
|
| Personal accident insurance |
|
|
896 |
|
|
|
66.4 |
|
|
|
21 |
|
|
|
845 |
|
|
|
67.5 |
|
|
|
39 |
|
|
|
857 |
|
|
|
63.3 |
|
|
|
21 |
|
| Voluntary automobile insurance |
|
|
331 |
|
|
|
5.1 |
|
|
|
196 |
|
|
|
386 |
|
|
|
6.0 |
|
|
|
386 |
|
|
|
265 |
|
|
|
4.1 |
|
|
|
194 |
|
| Others |
|
|
926 |
|
|
|
51.8 |
|
|
|
60 |
|
|
|
967 |
|
|
|
60.2 |
|
|
|
108 |
|
|
|
1,021 |
|
|
|
56.6 |
|
|
|
61 |
|
|
|
|
|
|
|
|
|
|
|
|
|
|
|
|
|
|
|
|
|
|
|
|
|
|
|
|
|
|
|
|
|
|
|
|
|
|
| Total |
|
|
3,801 |
|
|
|
34.1 |
|
|
|
376 |
|
|
|
3,946 |
|
|
|
36.2 |
|
|
|
732 |
|
|
|
3,989 |
|
|
|
35.8 |
|
|
|
377 |
|
|
|
|
|
|
|
|
|
|
|
|
|
|
|
|
|
|
|
|
|
|
|
|
|
|
|
|
|
|
|
|
|
|
|
|
|
|
Notes)
| 1. |
Balance ratio = Balance of catastrophic loss reserve / Net premiums written (excluding household earthquake and compulsory automobile liability insurance) × 100
|
As for the interim fiscal year, net premiums written are doubled for the calculation of balance ratio.
| 2. |
Provision represents gross amounts before excluding reversal. |
|
|
|
|
|
|
|
|
|
|
|
|
|
|
|
|
|
| |
|
(Yen in hundred millions) |
|
| |
|
Six months ended
September 30,
2009 |
|
|
Six months ended
September 30,
2010 |
|
| Business line |
|
Reinsurance
premiums
assumed |
|
|
Reinsurance
claims
assumed |
|
|
Reinsurance
premiums
assumed |
|
|
Reinsurance
claims
assumed |
|
| Fire and allied insurance |
|
|
97 |
|
|
|
40 |
|
|
|
114 |
|
|
|
29 |
|
| Marine insurance |
|
|
35 |
|
|
|
26 |
|
|
|
25 |
|
|
|
19 |
|
| Personal accident insurance |
|
|
4 |
|
|
|
3 |
|
|
|
6 |
|
|
|
3 |
|
| Voluntary automobile insurance |
|
|
22 |
|
|
|
8 |
|
|
|
12 |
|
|
|
10 |
|
| Compulsory automobile liability insurance |
|
|
539 |
|
|
|
777 |
|
|
|
565 |
|
|
|
780 |
|
| Others |
|
|
74 |
|
|
|
92 |
|
|
|
68 |
|
|
|
255 |
|
|
|
|
|
|
|
|
|
|
|
|
|
|
|
|
|
|
| Total |
|
|
774 |
|
|
|
949 |
|
|
|
792 |
|
|
|
1,098 |
|
|
|
|
|
|
|
|
|
|
|
|
|
|
|
|
|
|
|
|
|
|
|
|
|
|
|
|
|
|
|
|
|
|
|
| |
|
(Yen in hundred millions) |
|
| |
|
Six months ended
September 30,
2009 |
|
|
Six months ended
September 30,
2010 |
|
| Business line |
|
Reinsurance
premiums
ceded |
|
|
Reinsurance
claims
ceded |
|
|
Reinsurance
premiums
ceded |
|
|
Reinsurance
claims
ceded |
|
| Fire and allied insurance |
|
|
280 |
|
|
|
37 |
|
|
|
272 |
|
|
|
10 |
|
| Marine insurance |
|
|
59 |
|
|
|
33 |
|
|
|
57 |
|
|
|
74 |
|
| Personal accident insurance |
|
|
10 |
|
|
|
9 |
|
|
|
8 |
|
|
|
7 |
|
| Voluntary automobile insurance |
|
|
14 |
|
|
|
8 |
|
|
|
13 |
|
|
|
9 |
|
| Compulsory automobile liability insurance |
|
|
601 |
|
|
|
844 |
|
|
|
618 |
|
|
|
871 |
|
| Others |
|
|
122 |
|
|
|
67 |
|
|
|
162 |
|
|
|
24 |
|
|
|
|
|
|
|
|
|
|
|
|
|
|
|
|
|
|
| Total |
|
|
1,088 |
|
|
|
1,001 |
|
|
|
1,132 |
|
|
|
997 |
|
|
|
|
|
|
|
|
|
|
|
|
|
|
|
|
|
|
47
NIPPONKOA Insurance Co., Ltd. (Non-consolidated)
|
|
|
|
|
|
|
|
|
|
|
|
|
|
|
|
|
|
|
|
|
| |
|
(Yen in hundred millions) |
|
| |
|
Six months ended
September 30, 2009
(A) |
|
|
Year ended
March 31, 2010
(B) |
|
|
Six months ended
September 30, 2010
(C) |
|
|
Increase
(Decrease)
(C) - (B) |
|
|
Increase
(Decrease)
(C) - (A) |
|
| Net premiums written |
|
|
3,197 |
|
|
|
6,333 |
|
|
|
3,165 |
|
|
|
— |
|
|
|
(31 |
) |
| Rate of change |
|
|
(5.7 |
)% |
|
|
(3.1 |
)% |
|
|
(1.0 |
)% |
|
|
2.1 |
% |
|
|
4.7 |
% |
|
|
|
|
|
|
|
|
|
|
|
|
|
|
|
|
|
|
|
|
|
| ‚ Total assets |
|
|
26,348 |
|
|
|
25,924 |
|
|
|
25,081 |
|
|
|
(842 |
) |
|
|
(1,266 |
) |
|
|
|
|
|
|
|
|
|
|
|
|
|
|
|
|
|
|
|
|
|
| ƒ Net loss ratio |
|
|
66.2 |
% |
|
|
69.4 |
% |
|
|
67.1 |
% |
|
|
(2.3 |
)% |
|
|
0.9 |
% |
|
|
|
|
|
|
|
|
|
|
|
|
|
|
|
|
|
|
|
|
|
| „ Net expense ratio |
|
|
35.4 |
% |
|
|
35.8 |
% |
|
|
35.3 |
% |
|
|
(0.5 |
)% |
|
|
(0.1 |
)% |
|
|
|
|
|
|
|
|
|
|
|
|
|
|
|
|
|
|
|
|
|
| … Combined ratio |
|
|
101.6 |
% |
|
|
105.2 |
% |
|
|
102.4 |
% |
|
|
(2.8 |
)% |
|
|
0.8 |
% |
| Underwriting result ratio |
|
|
(1.6 |
)% |
|
|
(5.2 |
)% |
|
|
(2.4 |
)% |
|
|
2.8 |
% |
|
|
(0.8 |
)% |
|
|
|
|
|
|
|
|
|
|
|
|
|
|
|
|
|
|
|
|
|
| † Voluntary automobile insurance |
|
|
|
|
|
|
|
|
|
|
|
|
|
|
|
|
|
|
|
|
| • Net premiums written |
|
|
1,604 |
|
|
|
3,187 |
|
|
|
1,579 |
|
|
|
— |
|
|
|
(25 |
) |
| Rate of change |
|
|
(1.9 |
)% |
|
|
(2.0 |
)% |
|
|
(1.6 |
)% |
|
|
0.4 |
% |
|
|
0.3 |
% |
| • Underwriting result ratio |
|
|
1.8 |
% |
|
|
(2.4 |
)% |
|
|
(2.5 |
)% |
|
|
(0.1 |
)% |
|
|
(4.3 |
)% |
| • Net loss ratio |
|
|
66.4 |
% |
|
|
71.0 |
% |
|
|
70.5 |
% |
|
|
(0.5 |
)% |
|
|
4.1 |
% |
| • Net expense ratio |
|
|
31.8 |
% |
|
|
31.4 |
% |
|
|
32.0 |
% |
|
|
0.6 |
% |
|
|
0.2 |
% |
|
|
|
|
|
|
|
|
|
|
|
|
|
|
|
|
|
|
|
|
|
| ‡ Fire and allied insurance |
|
|
|
|
|
|
|
|
|
|
|
|
|
|
|
|
|
|
|
|
| • Net premiums written |
|
|
437 |
|
|
|
965 |
|
|
|
423 |
|
|
|
— |
|
|
|
(13 |
) |
| Rate of change |
|
|
(5.5 |
)% |
|
|
0.8 |
% |
|
|
(3.1 |
)% |
|
|
(3.9 |
)% |
|
|
2.4 |
% |
| • Underwriting result ratio |
|
|
5.9 |
% |
|
|
7.7 |
% |
|
|
7.8 |
% |
|
|
0.1 |
% |
|
|
1.9 |
% |
| • Net loss ratio |
|
|
50.5 |
% |
|
|
48.1 |
% |
|
|
48.6 |
% |
|
|
0.5 |
% |
|
|
(1.9 |
)% |
| • Net expense ratio |
|
|
43.6 |
% |
|
|
44.2 |
% |
|
|
43.6 |
% |
|
|
(0.6 |
)% |
|
|
— |
% |
|
|
|
|
|
|
|
|
|
|
|
|
|
|
|
|
|
|
|
|
|
| ˆ Number of employees |
|
|
8,292 |
|
|
|
8,257 |
|
|
|
9,962 |
|
|
|
1,705 |
|
|
|
1,670 |
|
|
|
|
|
|
|
|
|
|
|
|
|
|
|
|
|
|
|
|
|
|
| ‰ Number of agencies |
|
|
29,055 |
|
|
|
28,520 |
|
|
|
27,972 |
|
|
|
(548 |
) |
|
|
(1,083 |
) |
|
|
|
|
|
|
|
|
|
|
|
|
|
|
|
|
|
|
|
|
|
Notes)
| 1. |
Net loss ratio = (Net claims paid + Loss adjustment expenses) / Net premiums written × 100 |
| 2. |
Net expense ratio = (Net commissions and brokerage fees + Operating, general and administrative expenses related to underwriting) / Net premiums written × 100
|
| 3. |
Combined ratio = Net loss ratio + Net expense ratio |
| 4. |
Underwriting result ratio = 100 - Combined ratio |
| 5. |
Items with % within “Increase (Decrease)” represent change from the year ended March 31, 2010 and the six months ended September 30, 2009,
respectively. |
| 6. |
Number of employees does not include numbers of agent trainees nor in-house agents but includes numbers of employees who are loaned from other companies.
|
48
NIPPONKOA Insurance Co., Ltd. (Non-consolidated)
Risk-monitored loans
|
|
|
|
|
|
|
|
|
|
|
|
|
| |
|
(Yen in hundred millions) |
|
| |
|
As of September 30, 2009 |
|
|
As of March 31, 2010 |
|
|
As of September 30, 2010 |
|
| Loans to borrowers in bankruptcy |
|
|
0 |
|
|
|
0 |
|
|
|
0 |
|
| Overdue loans |
|
|
14 |
|
|
|
11 |
|
|
|
11 |
|
| Loans overdue for three months or more |
|
|
0 |
|
|
|
— |
|
|
|
— |
|
| Restructured loans |
|
|
4 |
|
|
|
5 |
|
|
|
3 |
|
|
|
|
|
|
|
|
|
|
|
|
|
|
| Total |
|
|
19 |
|
|
|
17 |
|
|
|
15 |
|
| Percent of total loans |
|
|
0.9 |
% |
|
|
0.8 |
% |
|
|
0.7 |
% |
|
|
|
|
|
|
|
|
|
|
|
|
|
|
|
|
|
| (Reference) Total loans |
|
|
2,324 |
|
|
|
2,274 |
|
|
|
2,126 |
|
|
|
|
|
|
|
|
|
|
|
|
|
|
Results of self-assessment
|
|
|
|
|
|
|
|
|
|
|
|
|
| |
|
(Yen in hundred millions) |
|
| |
|
As of September 30, 2009 |
|
|
As of March 31, 2010 |
|
|
As of September 30, 2010 |
|
| No category |
|
|
26,234 |
|
|
|
25,850 |
|
|
|
24,264 |
|
|
|
|
|
|
|
|
|
|
|
|
|
|
| Category II |
|
|
115 |
|
|
|
74 |
|
|
|
80 |
|
| Category III |
|
|
149 |
|
|
|
17 |
|
|
|
16 |
|
| Category IV |
|
|
7 |
|
|
|
155 |
|
|
|
15 |
|
| Subtotal (Category II-IV) |
|
|
272 |
|
|
|
247 |
|
|
|
112 |
|
|
|
|
|
|
|
|
|
|
|
|
|
|
| Total |
|
|
26,507 |
|
|
|
26,097 |
|
|
|
24,376 |
|
|
|
|
|
|
|
|
|
|
|
|
|
|
Note)
Total represents the amount before amortized or provisioned, however the amount of Category III and IV are fully amortized and/or provisioned.
| ‚ |
Impairment losses on securities |
|
|
|
|
|
|
|
|
|
|
|
|
|
| |
|
(Yen in hundred millions) |
|
| |
|
Six months ended
September 30, 2009 |
|
|
Year ended
March 31, 2010 |
|
|
Six months ended
September 30, 2010 |
|
| Domestic bonds |
|
|
— |
|
|
|
— |
|
|
|
— |
|
| Domestic stocks |
|
|
1 |
|
|
|
12 |
|
|
|
8 |
|
| Foreign securities |
|
|
1 |
|
|
|
0 |
|
|
|
2 |
|
| Others |
|
|
— |
|
|
|
8 |
|
|
|
0 |
|
|
|
|
|
|
|
|
|
|
|
|
|
|
| Total |
|
|
3 |
|
|
|
21 |
|
|
|
11 |
|
|
|
|
|
|
|
|
|
|
|
|
|
|
Impairment rules applied
NIPPONKOA recognized impairment on securities whose fair value is determinable as of the balance sheet date if the fair value declined by 30% or more from carrying value.
| ƒ |
Impairment losses on fixed assets |
|
|
|
|
|
|
|
|
|
|
|
|
|
| |
|
(Yen in hundred millions) |
|
| |
|
Six months ended
September 30, 2009 |
|
|
Year ended
March 31, 2010 |
|
|
Six months ended
September 30, 2010 |
|
| Land |
|
|
0 |
|
|
|
0 |
|
|
|
3 |
|
| Buildings |
|
|
0 |
|
|
|
2 |
|
|
|
0 |
|
| Others |
|
|
— |
|
|
|
— |
|
|
|
0 |
|
|
|
|
|
|
|
|
|
|
|
|
|
|
| Total |
|
|
0 |
|
|
|
2 |
|
|
|
4 |
|
|
|
|
|
|
|
|
|
|
|
|
|
|
| „ |
Unrealized gains and losses on securities |
|
|
|
|
|
|
|
|
|
|
|
|
|
| |
|
(Yen in hundred millions) |
|
| |
|
As of September 30, 2009 |
|
|
As of March 31, 2010 |
|
|
As of September 30, 2010 |
|
| Domestic bonds |
|
|
142 |
|
|
|
124 |
|
|
|
301 |
|
| Domestic stocks |
|
|
2,481 |
|
|
|
2,718 |
|
|
|
1,944 |
|
| Foreign securities |
|
|
(264 |
) |
|
|
(112 |
) |
|
|
(60 |
) |
| Others |
|
|
3 |
|
|
|
5 |
|
|
|
4 |
|
|
|
|
|
|
|
|
|
|
|
|
|
|
| Total |
|
|
2,362 |
|
|
|
2,735 |
|
|
|
2,190 |
|
|
|
|
|
|
|
|
|
|
|
|
|
|
Note)
The above numbers represent difference between costs and book values for securities available for sale, which have readily determinable fair
value.
49
NIPPONKOA Insurance Co., Ltd. (Non-consolidated)
| … |
Underwriting of third-sector insurance products |
|
|
|
|
|
|
|
|
|
|
|
|
|
|
|
|
|
| |
|
(Number in hundreds) |
|
| |
|
Six months ended September 30, 2010 |
|
|
Breakdown of number |
|
| |
|
Number |
|
|
Increase
(Decrease) |
|
|
NIPPONKOA
Insurance Co., Ltd. |
|
|
Subsidiaries |
|
| Number of policies |
|
|
564 |
|
|
|
(9 |
) |
|
|
319 |
|
|
|
244 |
|
Notes)
| 1. |
This table represents cumulative total and respective number of policies of NIPPONKOA Insurance Co., Ltd. and its subsidiaries from April 1, 2010 to
September 31, 2010. |
| 2. |
The above numbers includes policies of medical insurance and cancer insurance, but excludes policies of accident insurance and nursing-care insurance.
|
| † |
Claims by natural disasters |
|
|
|
|
|
|
|
|
|
|
|
|
|
| |
|
(Yen in hundred millions) |
|
| |
|
Six months ended
September 30, 2009 |
|
|
Year ended
March 31, 2010 |
|
|
Six months ended
September 30, 2010 |
|
| Direct claims paid |
|
|
23 |
|
|
|
114 |
|
|
|
15 |
|
| Net claims paid |
|
|
21 |
|
|
|
108 |
|
|
|
15 |
|
| Unpaid claims |
|
|
9 |
|
|
|
22 |
|
|
|
7 |
|
Notes)
| 1. |
This table represents paid and unpaid claims related to natural disasters which occurred in the period. |
| 2. |
“Unpaid claims” represents amounts deducting reinsurance recoverable on unpaid loss from direct insurance reserve for outstanding losses and claims.
|
| 3. |
Claims by natural disasters include claims caused by earthquakes. |
| ‡ |
Catastrophic loss reserve |
|
|
|
|
|
|
|
|
|
|
|
|
|
|
|
|
|
|
|
|
|
|
|
|
|
|
|
|
|
|
|
|
|
|
|
|
|
| |
|
(Yen in hundred millions, %) |
|
| |
|
Six months ended September 30, 2009 |
|
|
Year ended March 31, 2010 |
|
|
Six months ended September 30, 2010 |
|
| Business line |
|
Balance |
|
|
Balance
ratio |
|
|
Provision |
|
|
Balance |
|
|
Balance
ratio |
|
|
Provision |
|
|
Balance |
|
|
Balance
ratio |
|
|
Provision |
|
| Fire and allied insurance |
|
|
1,175 |
|
|
|
137.7 |
|
|
|
29 |
|
|
|
1,211 |
|
|
|
128.4 |
|
|
|
65 |
|
|
|
1,240 |
|
|
|
150.2 |
|
|
|
28 |
|
| Marine insurance |
|
|
189 |
|
|
|
142.5 |
|
|
|
3 |
|
|
|
190 |
|
|
|
141.1 |
|
|
|
6 |
|
|
|
190 |
|
|
|
137.0 |
|
|
|
3 |
|
| Personal accident insurance |
|
|
246 |
|
|
|
44.7 |
|
|
|
8 |
|
|
|
210 |
|
|
|
41.5 |
|
|
|
15 |
|
|
|
199 |
|
|
|
36.5 |
|
|
|
8 |
|
| Voluntary automobile insurance |
|
|
172 |
|
|
|
5.4 |
|
|
|
110 |
|
|
|
219 |
|
|
|
6.9 |
|
|
|
219 |
|
|
|
109 |
|
|
|
3.5 |
|
|
|
108 |
|
| Others |
|
|
502 |
|
|
|
56.8 |
|
|
|
21 |
|
|
|
515 |
|
|
|
64.6 |
|
|
|
38 |
|
|
|
532 |
|
|
|
60.9 |
|
|
|
21 |
|
|
|
|
|
|
|
|
|
|
|
|
|
|
|
|
|
|
|
|
|
|
|
|
|
|
|
|
|
|
|
|
|
|
|
|
|
|
| Total |
|
|
2,286 |
|
|
|
40.6 |
|
|
|
173 |
|
|
|
2,345 |
|
|
|
42.1 |
|
|
|
345 |
|
|
|
2,271 |
|
|
|
41.0 |
|
|
|
170 |
|
|
|
|
|
|
|
|
|
|
|
|
|
|
|
|
|
|
|
|
|
|
|
|
|
|
|
|
|
|
|
|
|
|
|
|
|
|
Notes)
| 1. |
Balance ratio = Balance of catastrophic loss reserve / Net premiums written (excluding household earthquake and compulsory automobile liability insurance) × 100
|
As for the interim fiscal year, net premiums written is doubled for the calculation of balance ratio.
| 2. |
Provision represents gross amounts. |
|
|
|
|
|
|
|
|
|
|
|
|
|
|
|
|
|
| |
|
(Yen in hundred millions) |
|
| |
|
Six months ended September 30, 2009 |
|
|
Six months ended September 30, 2010 |
|
| Business line |
|
Reinsurance
premiums
assumed |
|
|
Reinsurance
claims
assumed |
|
|
Reinsurance
premiums
assumed |
|
|
Reinsurance
claims
assumed |
|
| Fire and allied insurance |
|
|
24 |
|
|
|
8 |
|
|
|
21 |
|
|
|
6 |
|
| Marine insurance |
|
|
13 |
|
|
|
8 |
|
|
|
9 |
|
|
|
8 |
|
| Personal accident insurance |
|
|
10 |
|
|
|
7 |
|
|
|
13 |
|
|
|
7 |
|
| Voluntary automobile insurance |
|
|
12 |
|
|
|
9 |
|
|
|
13 |
|
|
|
8 |
|
| Compulsory automobile liability insurance |
|
|
249 |
|
|
|
356 |
|
|
|
258 |
|
|
|
359 |
|
| Others |
|
|
13 |
|
|
|
12 |
|
|
|
14 |
|
|
|
2 |
|
|
|
|
|
|
|
|
|
|
|
|
|
|
|
|
|
|
| Total |
|
|
324 |
|
|
|
401 |
|
|
|
331 |
|
|
|
393 |
|
|
|
|
|
|
|
|
|
|
|
|
|
|
|
|
|
|
|
|
|
|
|
|
|
|
|
|
|
|
|
|
|
|
|
| |
|
(Yen in hundred millions) |
|
| |
|
Six months ended September 30, 2009 |
|
|
Six months ended September 30, 2010 |
|
| Business line |
|
Reinsurance
premiums
ceded |
|
|
Reinsurance
claims
ceded |
|
|
Reinsurance
premiums
ceded |
|
|
Reinsurance
claims
ceded |
|
| Fire and allied insurance |
|
|
139 |
|
|
|
31 |
|
|
|
153 |
|
|
|
12 |
|
| Marine insurance |
|
|
15 |
|
|
|
9 |
|
|
|
13 |
|
|
|
13 |
|
| Personal accident insurance |
|
|
7 |
|
|
|
2 |
|
|
|
7 |
|
|
|
2 |
|
| Voluntary automobile insurance |
|
|
15 |
|
|
|
11 |
|
|
|
14 |
|
|
|
8 |
|
| Compulsory automobile liability insurance |
|
|
266 |
|
|
|
374 |
|
|
|
270 |
|
|
|
379 |
|
| Others |
|
|
37 |
|
|
|
15 |
|
|
|
41 |
|
|
|
7 |
|
|
|
|
|
|
|
|
|
|
|
|
|
|
|
|
|
|
| Total |
|
|
480 |
|
|
|
444 |
|
|
|
501 |
|
|
|
425 |
|
|
|
|
|
|
|
|
|
|
|
|
|
|
|
|
|
|
50
[Supplementary Information]
Sompo Japan Insurance Inc. and NIPPONKOA Insurance Co., Ltd. (Combined)
|
|
|
|
|
|
|
|
|
|
|
|
|
|
|
|
|
|
|
|
|
| |
|
(Yen in hundred millions) |
|
| |
|
Six months ended
September 30, 2009
(A) |
|
|
Year ended
March 31, 2010
(B) |
|
|
Six months
ended
September 30, 2010
(C) |
|
|
Increase
(Decrease)
(C) - (B) |
|
|
Increase
(Decrease)
(C) - (A) |
|
| Net premiums written |
|
|
9,614 |
|
|
|
18,922 |
|
|
|
9,602 |
|
|
|
— |
|
|
|
(11 |
) |
| Rate of change |
|
|
(5.2 |
)% |
|
|
(2.7 |
)% |
|
|
(0.1 |
)% |
|
|
2.5 |
% |
|
|
5.1 |
% |
|
|
|
|
|
|
|
|
|
|
|
|
|
|
|
|
|
|
|
|
|
| ‚ Total assets |
|
|
76,435 |
|
|
|
76,216 |
|
|
|
73,654 |
|
|
|
(2,562 |
) |
|
|
(2,780 |
) |
|
|
|
|
|
|
|
|
|
|
|
|
|
|
|
|
|
|
|
|
|
| ƒ Net loss ratio |
|
|
71.9 |
% |
|
|
72.4 |
% |
|
|
68.6 |
% |
|
|
(3.8 |
)% |
|
|
(3.3 |
)% |
|
|
|
|
|
|
|
|
|
|
|
|
|
|
|
|
|
|
|
|
|
| „ Net expense ratio |
|
|
34.6 |
% |
|
|
34.6 |
% |
|
|
34.0 |
% |
|
|
(0.6 |
)% |
|
|
(0.6 |
)% |
|
|
|
|
|
|
|
|
|
|
|
|
|
|
|
|
|
|
|
|
|
| … Combined ratio |
|
|
106.4 |
% |
|
|
107.0 |
% |
|
|
102.6 |
% |
|
|
(4.5 |
)% |
|
|
(3.9 |
)% |
| Underwriting result ratio |
|
|
(6.4 |
)% |
|
|
(7.0 |
)% |
|
|
(2.6 |
)% |
|
|
4.5 |
% |
|
|
3.9 |
% |
|
|
|
|
|
|
|
|
|
|
|
|
|
|
|
|
|
|
|
|
|
| † Voluntary automobile insurance |
|
|
|
|
|
|
|
|
|
|
|
|
|
|
|
|
|
|
|
|
| • Net premiums written |
|
|
4,830 |
|
|
|
9,590 |
|
|
|
4,777 |
|
|
|
— |
|
|
|
(53 |
) |
| Rate of change |
|
|
(2.0 |
)% |
|
|
(2.1 |
)% |
|
|
(1.1 |
)% |
|
|
0.9 |
% |
|
|
0.9 |
% |
| • Underwriting result ratio |
|
|
(0.9 |
)% |
|
|
(4.0 |
)% |
|
|
(2.6 |
)% |
|
|
1.4 |
% |
|
|
(1.7 |
)% |
| • Net loss ratio |
|
|
67.2 |
% |
|
|
70.7 |
% |
|
|
69.7 |
% |
|
|
(1.0 |
)% |
|
|
2.6 |
% |
| • Net expense ratio |
|
|
33.7 |
% |
|
|
33.3 |
% |
|
|
32.9 |
% |
|
|
(0.4 |
)% |
|
|
(0.8 |
)% |
|
|
|
|
|
|
|
|
|
|
|
|
|
|
|
|
|
|
|
|
|
| ‡ Fire and allied insurance |
|
|
|
|
|
|
|
|
|
|
|
|
|
|
|
|
|
|
|
|
| • Net premiums written |
|
|
1,114 |
|
|
|
2,407 |
|
|
|
1,099 |
|
|
|
— |
|
|
|
(15 |
) |
| Rate of change |
|
|
(4.1 |
)% |
|
|
(0.1 |
)% |
|
|
(1.4 |
)% |
|
|
(1.3 |
)% |
|
|
2.7 |
% |
| • Underwriting result ratio |
|
|
9.9 |
% |
|
|
10.9 |
% |
|
|
10.5 |
% |
|
|
(0.4 |
)% |
|
|
0.7 |
% |
| • Net loss ratio |
|
|
46.9 |
% |
|
|
45.8 |
% |
|
|
45.3 |
% |
|
|
(0.4 |
)% |
|
|
(1.5 |
)% |
| • Net expense ratio |
|
|
43.3 |
% |
|
|
43.4 |
% |
|
|
44.1 |
% |
|
|
0.8 |
% |
|
|
0.9 |
% |
|
|
|
|
|
|
|
|
|
|
|
|
|
|
|
|
|
|
|
|
|
| ˆ Number of employees |
|
|
25,773 |
|
|
|
25,551 |
|
|
|
28,989 |
|
|
|
3,438 |
|
|
|
3,216 |
|
|
|
|
|
|
|
|
|
|
|
|
|
|
|
|
|
|
|
|
|
|
| ‰ Number of agencies |
|
|
76,391 |
|
|
|
74,814 |
|
|
|
73,505 |
|
|
|
(1,309 |
) |
|
|
(2,886 |
) |
|
|
|
|
|
|
|
|
|
|
|
|
|
|
|
|
|
|
|
|
|
Notes)
| 1. |
Net loss ratio = (Net claims paid + Loss adjustment expenses) / Net premiums written × 100 |
| 2. |
Net expense ratio = (Net commissions and brokerage fees + Operating, general and administrative expenses related to underwriting) / Net premiums written × 100
|
| 3. |
Combined ratio = Net loss ratio + Net expense ratio |
| 4. |
Underwriting result ratio = 100 - Combined ratio |
| 5. |
Items with % within “Increase (Decrease)” represent change from the year ended March 31, 2010 and the six months ended September 30, 2009,
respectively. |
51
Note Regarding Forward-looking Statements
This document includes “forward-looking statements” that reflect the information in relation to the NKSJ Holdings, Inc.
(“NKSJ”). To the extent that statements in this document do not relate to historical or current facts, they constitute forward-looking statements. These forward-looking statements are based on the current assumptions and beliefs of NKSJ in
light of the information currently available to NKSJ, and involve known and unknown risks, uncertainties and other factors. Such risks, uncertainties and other factors may cause the actual results, performance, achievements or financial position of
NKSJ, as the case may be, to be materially different from any future results, performance, achievements or financial position expressed or implied by these forward-looking statements. NKSJ does not undertake or will not undertake any obligation to
publicly update any forward-looking statements after the date of this document. Investors are advised to consult any further disclosures by NKSJ in their subsequent domestic filings in Japan and filings with, or submissions to, the U.S. Securities
Exchange Commission pursuant to the U.S. Securities Exchange Act of 1934.
The risks, uncertainties and other factors referred
to above include, but are not limited to, those below. The risks, uncertainties and other factors are also referred to in our domestic Quarterly Securities Reports.
| (1) |
Effects of deterioration of economic and business conditions in Japan |
| (2) |
Risk of intensification of competition in the property and casualty insurance business |
| (3) |
Changes to laws, regulations, and systems |
| (4) |
Natural catastrophe risks related to insurance products |
| (5) |
Occurrence of losses exceeding projection |
| (7) |
Effects of declining stock price |
| (8) |
Effects of fluctuation in interest rate |
| (10) |
Effects of fluctuation in foreign exchange rate |
| (12) |
Life insurance business risks |
| (13) |
Overseas business risk |
| (14) |
Non-insurance business risk |
| (15) |
Credit rating downgrade |
| (16) |
Business interruption risk in case of natural disasters, etc. |
| (17) |
Information security risk |
| (19) |
System integration risk |
| (20) |
Risk of failure to adequately realize business integration synergies |
| (21) |
Risks related to merger of life insurance subsidiaries |
52
[English Summary]
Quarterly Securities Report for the Three Months Ended September 30, 2010
Part 1: Corporate Information
Section 1:
Information on the company
1. Trends in major business indexes
2. Business overview
3. Subsidiaries and affiliates
4. Employees
Section
2: Business Conditions
1. Insurance operation
2. Business risks
3. Significant contracts on management
4. Financial positions, results of operations, and cash flows
Section 3: Information on the facilities
Section 4: Information of the reporting company
1. Information on shares
(1) Total Number of Shares
(2) Stock Acquisition Rights
(3) Status of warrant bonds’ outstanding warrants with adjusted exercise prices
(4) Status of Rights Plan
(5) Changes in the Total Number of Shares Issued and the Amount of Common Stock
(6) Status of Major Shareholders
(7) Status of Voting Rights
2. Changes in stock prices
3. Directors
Section
5: Financial Condition
1. Interim Consolidated Financial Statements
2. Other
3. Interim Financial Statements (Non-consolidated)
4. Other
Part 2: Information on party(ies) providing guaranty to the Reporting Company
1
Part 1: Corporate Information
Section 1: Information on the company
| 1. |
Trends in major business indexes |
(Omitted.)
(Omitted.)
| 3. |
Subsidiaries and affiliates |
(Omitted.)
(Omitted.)
2
Section 2: Business Conditions
(Omitted.)
With respect to
the information given in this quarterly report about the Company’s business conditions and financial condition in the fiscal second quarter, no matters with the potential to materially influence investors’ decisions have arisen. Further,
no material changes have occurred from the information given under “Business risks” in the Company’s quarterly report for the fiscal first quarter.
The Company has no material events to report. Material events are those that raise material doubt about the assumption that the Company will continue as a going concern or materially affect the operation
of the Company.
| 3. |
Significant contracts on management |
(Omitted.)
| 4. |
Financial positions, results of operations, and cash flows |
(Omitted.)
Section 3: Information on the facilities
(Omitted.)
3
Section 4: Information of the reporting company
| |
(1) |
Total Number of Shares |
(Omitted.)
| |
(2) |
Stock Acquisition Rights |
(Omitted.)
| |
(3) |
Status of warrant bonds’ outstanding warrants with adjusted exercise prices |
(Omitted.)
| |
(4) |
Status of Rights Plan |
(Omitted.)
| |
(5) |
Changes in the Total Number of Shares Issued and the Amount of Common Stock |
(Omitted.)
4
| |
(6) |
Status of Major Shareholders |
|
|
|
|
|
|
|
|
|
|
|
| |
|
(As of September 30,
2010) |
|
| Shareholders’ name |
|
Location |
|
Number of
shares
held
(thousands) |
|
|
Percentage of
ownership
based on
issued shares
(%) |
|
| State Street Bank and Trust Company (standing proxy: The Hongkong and Shanghai Banking Corporation Limited Tokyo Branch) |
|
P.O. Box 351, Boston, Massachusetts 02101 U.S.A. (11-1 Nihonbashi 3-chome, Chuo-ku, Tokyo) |
|
|
85,003 |
|
|
|
5.12 |
|
| Japan Trustee Services Bank, Ltd. (Trust Account) |
|
8-11 Harumi 1-chome, Chuo-ku, Tokyo |
|
|
69,255 |
|
|
|
4.17 |
|
| Longleaf Partners Fund
(standing proxy: The Hongkong and Shanghai
Banking Corporation Limited Tokyo Branch) |
|
6410 Poplar Avenue Suite 900, Memphis, TN 38119 U.S.A. (11-1 Nihonbashi 3-chome, Chuo-ku, Tokyo) |
|
|
56,402 |
|
|
|
3.39 |
|
| The Master Trust Bank of Japan ,Ltd. (Trust Account) |
|
11-3 Hamamatsucho 2-chome, Minato-ku, Tokyo |
|
|
51,693 |
|
|
|
3.11 |
|
| The Dai-ichi Life Insurance Company, Limited |
|
13-1 Yurakucho 1-chome, Chiyoda-ku, Tokyo |
|
|
40,908 |
|
|
|
2.46 |
|
| NKSJ Holdings Employee Shareholding Plan |
|
Human Capital and General Affairs Division, NKSJ Holdings, Inc, 26-1 Nishi-Shinjuku 1-chome, Shinjuku-ku, Tokyo |
|
|
39,598 |
|
|
|
2.38 |
|
| Mizuho Corporate Bank, Ltd. |
|
3-3 Marunouchi 1-chome, Chiyoda-ku, Tokyo |
|
|
34,052 |
|
|
|
2.05 |
|
| Nippon Express Co., Ltd. |
|
9-3 Higashi-Shinbashi 1-chome, Minato-ku, Tokyo |
|
|
32,004 |
|
|
|
1.93 |
|
| SSBT OD05 Omnibus Account - Treaty Clients (standing proxy: The Hongkong and Shanghai Banking Corporation Limited Tokyo Branch) |
|
338 PITT Street SYDNEY NSW 2000 AUSTRALIA (11-1 Nihonbashi 3-chome, Chuo-ku, Tokyo) |
|
|
24,629 |
|
|
|
1.48 |
|
| Meiji Yasuda Life Insurance Company |
|
1-1 Marunouchi 2-chome,Chiyoda-ku, Tokyo |
|
|
22,503 |
|
|
|
1.35 |
|
|
|
|
|
|
|
|
|
|
|
|
| Total |
|
— |
|
|
456,050 |
|
|
|
27.45 |
|
|
|
|
|
|
|
|
|
|
|
|
Notes:
| |
1 |
Dai-ichi Life Insurance Company’s shareholdings include 17,971,000 shares contributed by Dai-ichi Life Insurance to a post-retirement benefit trust as a trust
asset (in the shareholder registry, said shares are registered in the name of Mizuho Trust & Banking Co., Ltd., as beneficial owner on behalf of Dai-ichi Life Insurance post-retirement benefit trust). |
| |
2 |
During the quarter ended September 30, 2010, the Company received notification that Southeastern Asset Management Inc. owned shares as specified below as of
April 1, 2010, per a large shareholding report filed on April 8, 2010, but the Company was unable to confirm the number of shares effectively owned by Southeastern Asset Management as of September 30, 2010. The Company
consequently listed its top 10 shareholders above based on the information recorded in its shareholder registry. |
|
|
|
|
|
|
|
|
|
|
|
| Shareholders’ name |
|
Location |
|
Number of
shares held
(thousands) |
|
|
Percentage of
ownership
based on
issued shares
(%) |
|
| Southeastern Asset Management Inc. |
|
6410 Poplar Avenue Suite 900, Memphis, TN 38119 U.S.A. |
|
|
208,200 |
|
|
|
12.53 |
|
| |
(7) |
Status of Voting Rights |
(Omitted.)
| 2. |
Changes in stock prices |
(Omitted.)
(Omitted.)
5
Section 5: Financial Condition
NKSJ Holdings, Inc. prepares the interim consolidated financial statements and the interim non-consolidated financial statements for the six months ended
September 30, 2010, since it conducts business defined in the provision of Article17-15 Paragraph 2 of the Cabinet Office Ordinance on Disclosure of Corporate Information, etc.
| 1 |
Basis of Preparation of the Interim Consolidated Financial Statements and the Interim Non-consolidated Financial Statements |
| |
(1) |
NKSJ Holdings, Inc. prepares the interim consolidated financial statements in accordance with the “Regulations concerning the Terminology, Forms and Preparation
Methods of the Interim Consolidated Financial Statements” (Ministry of Finance Ordinance No. 24, 1999) and the “Ordinance for Enforcement of the Insurance Business Law” (Ministry of Finance Ordinance No. 5, 1996) pursuant to
the provision of Articles 48 and 69 of the “Regulations concerning the Terminology, Forms and Preparation Methods of the Interim Consolidated Financial Statements”. |
| |
(2) |
NKSJ Holdings, Inc. prepares the interim non-consolidated financial statements in accordance with the “Regulations concerning the Terminology, Forms and
Preparation Methods of the Interim Financial Statements” (Ministry of Finance Ordinance No. 38, 1977). |
| |
(3) |
NKSJ Holdings, Inc. was established as of April 1, 2010, so the interim consolidated accounting period ended September 30, 2009 (April 1 to September 30,
2009), the consolidated fiscal year ended March 31, 2010 (April 1, 2009 to March 31, 2010), the second quarter consolidated accounting period ended September 30, 2009 (July 1 to September 30, 2009), the interim accounting period
ended September 30, 2009 (April 1 to September 30, 2009), and the fiscal year ended March 31, 2010 (April 1, 2009 to March 31, 2010) are not disclosed. |
In
accordance with the provision of Article 193-2 Paragraph 1 of the Financial Instruments and Exchange Act, the interim consolidated financial statements for the six months ended September 30, 2010 (April 1 to September 30, 2010)
and the interim non-consolidated financial statements for the six months ended September 30, 2010 (April 1 to September 30, 2010) have been audited by Ernst & Young ShinNihon LLC.
6
| 1. |
Interim Consolidated Financial Statements |
| (1) |
Interim Consolidated Balance Sheets |
|
|
|
|
|
|
|
|
|
| |
|
|
|
|
(Millions of yen) |
|
| |
|
|
|
|
As of September 30, 2010 |
|
| Assets: |
|
|
|
|
|
|
|
|
| Cash and deposits |
|
|
|
*3 |
|
|
270,872 |
|
| Call loans |
|
|
|
|
|
|
98,497 |
|
| Receivables under resale agreements |
|
|
|
|
|
|
82,982 |
|
| Receivables under securities borrowing transactions |
|
|
|
|
|
|
27,146 |
|
| Monetary receivables bought |
|
|
|
|
|
|
37,253 |
|
| Money trusts |
|
|
|
|
|
|
84,648 |
|
| Securities |
|
|
*3, |
*4 |
|
|
6,511,189 |
|
| Loans |
|
|
*2, |
*5 |
|
|
713,053 |
|
| Tangible fixed assets |
|
|
*1, |
*3 |
|
|
362,176 |
|
| Intangible fixed assets |
|
|
|
|
|
|
31,566 |
|
| Other assets |
|
|
|
|
|
|
571,200 |
|
| Deferred tax assets |
|
|
|
|
|
|
242,078 |
|
| Allowance for possible loan losses |
|
|
|
|
|
|
(5,839 |
) |
|
|
|
|
|
|
|
|
|
| Total assets |
|
|
|
|
|
|
9,026,824 |
|
|
|
|
|
|
|
|
|
|
| Liabilities: |
|
|
|
|
|
|
|
|
| Underwriting funds: |
|
|
|
|
|
|
7,352,175 |
|
| Reserve for outstanding losses and claims |
|
|
|
|
|
|
993,986 |
|
| Underwriting reserves |
|
|
|
|
|
|
6,358,188 |
|
| Bonds |
|
|
|
|
|
|
128,000 |
|
| Other liabilities |
|
|
|
*3 |
|
|
269,655 |
|
| Reserve for retirement benefits |
|
|
|
|
|
|
106,503 |
|
| Reserve for retirement benefits to directors |
|
|
|
|
|
|
113 |
|
| Reserve for bonus payments |
|
|
|
|
|
|
25,510 |
|
| Reserves under the special laws: |
|
|
|
|
|
|
21,336 |
|
| Reserve for price fluctuation |
|
|
|
|
|
|
21,336 |
|
| Deferred tax liabilities |
|
|
|
|
|
|
654 |
|
|
|
|
|
|
|
|
|
|
| Total liabilities |
|
|
|
|
|
|
7,903,947 |
|
|
|
|
|
|
|
|
|
|
| Net assets: |
|
|
|
|
|
|
|
|
| Shareholders’ equity: |
|
|
|
|
|
|
|
|
| Common stock |
|
|
|
|
|
|
100,045 |
|
| Capital surplus |
|
|
|
|
|
|
438,555 |
|
| Retained earnings |
|
|
|
|
|
|
335,209 |
|
| Treasury stock |
|
|
|
|
|
|
(527 |
) |
|
|
|
|
|
|
|
|
|
| Total shareholders’ equity |
|
|
|
|
|
|
873,282 |
|
|
|
|
|
|
|
|
|
|
| Valuation and translation adjustments: |
|
|
|
|
|
|
|
|
| Unrealized gains on securities available for sale, net of tax |
|
|
|
|
|
|
266,889 |
|
| Deferred gains on hedges |
|
|
|
|
|
|
5,330 |
|
| Foreign currency translation adjustments |
|
|
|
|
|
|
(27,962 |
) |
|
|
|
|
|
|
|
|
|
| Total valuation and translation adjustments |
|
|
|
|
|
|
244,258 |
|
|
|
|
|
|
|
|
|
|
| Stock acquisition rights |
|
|
|
|
|
|
2,362 |
|
| Non-controlling interests |
|
|
|
|
|
|
2,973 |
|
|
|
|
|
|
|
|
|
|
| Total net assets |
|
|
|
|
|
|
1,122,876 |
|
|
|
|
|
|
|
|
|
|
| Total liabilities and net assets |
|
|
|
|
|
|
9,026,824 |
|
|
|
|
|
|
|
|
|
|
7
| (2) |
Interim Consolidated Statements of Income |
|
|
|
|
|
|
|
|
|
| |
|
|
|
|
(Millions of yen) |
|
| |
|
|
|
|
Six months ended
September 30, 2010
(April 1 to
September 30, 2010) |
|
| Ordinary income: |
|
|
|
|
|
|
1,329,799 |
|
| Underwriting income: |
|
|
|
|
|
|
1,261,384 |
|
| Net premiums written |
|
|
|
|
|
|
987,832 |
|
| Deposits of premiums by policyholders |
|
|
|
|
|
|
79,398 |
|
| Interest and dividend income on deposits of premiums, etc. |
|
|
|
|
|
|
30,061 |
|
| Life insurance premiums written |
|
|
|
|
|
|
108,905 |
|
| Reversal of reserve for outstanding losses and claims |
|
|
|
|
|
|
35,643 |
|
| Reversal of underwriting reserves |
|
|
|
|
|
|
16,454 |
|
| Investment income: |
|
|
|
|
|
|
63,222 |
|
| Interest and dividend income |
|
|
|
|
|
|
78,453 |
|
| Investment gains on money trusts |
|
|
|
|
|
|
896 |
|
| Investment gains on trading securities |
|
|
|
|
|
|
67 |
|
| Gains on sales of securities |
|
|
|
|
|
|
5,839 |
|
| Transfer of interest and dividend income on deposits of premiums, etc. |
|
|
|
|
|
|
(30,061 |
) |
| Other ordinary income |
|
|
|
|
|
|
5,191 |
|
| Ordinary expenses: |
|
|
|
|
|
|
1,290,910 |
|
| Underwriting expenses: |
|
|
|
|
|
|
1,048,058 |
|
| Net claims paid |
|
|
|
|
|
|
607,279 |
|
| Loss adjustment expenses |
|
|
*1 |
|
|
|
65,449 |
|
| Net commissions and brokerage fees |
|
|
*1 |
|
|
|
176,065 |
|
| Maturity refunds to policyholders |
|
|
|
|
|
|
165,853 |
|
| Life insurance claims paid |
|
|
|
|
|
|
28,735 |
|
| Investment expenses: |
|
|
|
|
|
|
24,913 |
|
| Investment losses on money trusts |
|
|
|
|
|
|
581 |
|
| Losses on sales of securities |
|
|
|
|
|
|
2,201 |
|
| Impairment losses on securities |
|
|
|
|
|
|
6,827 |
|
| Operating, general and administrative expenses |
|
|
*1 |
|
|
|
212,008 |
|
| Other ordinary expenses: |
|
|
|
|
|
|
5,929 |
|
| Interest paid |
|
|
|
|
|
|
3,619 |
|
|
|
|
|
|
|
|
|
|
| Ordinary profit |
|
|
|
|
|
|
38,888 |
|
|
|
|
|
|
|
|
|
|
| Extraordinary gains: |
|
|
|
|
|
|
2,015 |
|
| Gains on disposal of fixed assets |
|
|
|
|
|
|
79 |
|
| Gains on negative goodwill |
|
|
|
|
|
|
149 |
|
| Other extraordinary gains |
|
|
*3 |
|
|
|
1,785 |
|
| Extraordinary losses: |
|
|
|
|
|
|
4,923 |
|
| Losses on disposal of fixed assets |
|
|
|
|
|
|
324 |
|
| Impairment losses |
|
|
*2 |
|
|
|
662 |
|
| Provision for reserves under the special laws: |
|
|
|
|
|
|
2,843 |
|
| Provision for reserve for price fluctuation |
|
|
|
|
|
|
2,843 |
|
| Other extraordinary losses |
|
|
*4 |
|
|
|
1,093 |
|
|
|
|
|
|
|
|
|
|
| Income before income taxes and non-controlling interests |
|
|
|
|
|
|
35,980 |
|
|
|
|
|
|
|
|
|
|
| Income taxes |
|
|
|
|
|
|
2,793 |
|
| Deferred income taxes |
|
|
|
|
|
|
9,250 |
|
|
|
|
|
|
|
|
|
|
| Total income taxes |
|
|
|
|
|
|
12,043 |
|
|
|
|
|
|
|
|
|
|
| Income before non-controlling interests |
|
|
|
|
|
|
23,936 |
|
|
|
|
|
|
|
|
|
|
| Non-controlling interests |
|
|
|
|
|
|
(180 |
) |
|
|
|
|
|
|
|
|
|
| Net income |
|
|
|
|
|
|
24,116 |
|
|
|
|
|
|
|
|
|
|
8
| (3) |
Interim Consolidated Statements of Changes in Net Assets |
|
|
|
|
|
| |
|
(Millions of yen) |
|
| |
|
Six months ended
September 30, 2010
(April 1 to
September 30, 2010) |
|
| Shareholders’ equity: |
|
|
|
|
| Common stock: |
|
|
|
|
| Balance at the beginning of the period |
|
|
70,000 |
|
| Changes during the period |
|
|
|
|
| Issuance of new stocks - exercise of stock acquisition rights |
|
|
45 |
|
| Increase due to share exchange |
|
|
30,000 |
|
|
|
|
|
|
| Total changes during the period |
|
|
30,045 |
|
|
|
|
|
|
| Balance at the end of the period |
|
|
100,045 |
|
|
|
|
|
|
| Capital surplus: |
|
|
|
|
| Balance at the beginning of the period |
|
|
24,229 |
|
| Changes during the period |
|
|
|
|
| Issuance of new stocks - exercise of stock acquisition rights |
|
|
45 |
|
| Disposal of treasury stock |
|
|
31 |
|
| Increase due to share exchange |
|
|
414,248 |
|
|
|
|
|
|
| Total changes during the period |
|
|
414,325 |
|
|
|
|
|
|
| Balance at the end of the period |
|
|
438,555 |
|
|
|
|
|
|
| Retained earnings: |
|
|
|
|
| Balance at the beginning of the period |
|
|
336,793 |
|
| Changes during the period |
|
|
|
|
| Dividends |
|
|
(25,700 |
) |
| Net income |
|
|
24,116 |
|
|
|
|
|
|
| Total changes during the period |
|
|
(1,584 |
) |
|
|
|
|
|
| Balance at the end of the period |
|
|
335,209 |
|
|
|
|
|
|
| Treasury stock: |
|
|
|
|
| Balance at the beginning of the period |
|
|
— |
|
| Changes during the period |
|
|
|
|
| Acquisition of treasury stock |
|
|
(708 |
) |
| Disposal of treasury stock |
|
|
180 |
|
|
|
|
|
|
| Total changes during the period |
|
|
(527 |
) |
|
|
|
|
|
| Balance at the end of the period |
|
|
(527 |
) |
|
|
|
|
|
| Total shareholders’ equity: |
|
|
|
|
| Balance at the beginning of the period |
|
|
431,023 |
|
| Changes during the period |
|
|
|
|
| Issuance of new stocks - exercise of stock acquisition rights |
|
|
91 |
|
| Dividends |
|
|
(25,700 |
) |
| Net income |
|
|
24,116 |
|
| Acquisition of treasury stock |
|
|
(708 |
) |
| Disposal of treasury stock |
|
|
212 |
|
| Increase due to share exchange |
|
|
444,248 |
|
|
|
|
|
|
| Total changes during the period |
|
|
442,259 |
|
|
|
|
|
|
| Balance at the end of the period |
|
|
873,282 |
|
|
|
|
|
|
9
|
|
|
|
|
| |
|
(Millions of yen) |
|
| |
|
Six months ended
September 30, 2010
(April 1 to
September 30, 2010) |
|
| Valuation and translation adjustments: |
|
|
|
|
| Unrealized gains on securities available for sale, net of tax: |
|
|
|
|
| Balance at the beginning of the period |
|
|
389,352 |
|
| Changes during the period |
|
|
|
|
| Net changes in items other than shareholders’ equity |
|
|
(122,463 |
) |
|
|
|
|
|
| Total changes during the period |
|
|
(122,463 |
) |
|
|
|
|
|
| Balance at the end of the period |
|
|
266,889 |
|
|
|
|
|
|
| Deferred gains on hedges |
|
|
|
|
| Balance at the beginning of the period |
|
|
— |
|
| Changes during the period |
|
|
|
|
| Net changes in items other than shareholders’ equity |
|
|
5,330 |
|
|
|
|
|
|
| Total changes during the period |
|
|
5,330 |
|
|
|
|
|
|
| Balance at the end of the period |
|
|
5,330 |
|
|
|
|
|
|
| Foreign currency translation adjustments: |
|
|
|
|
| Balance at the beginning of the period |
|
|
(21,674 |
) |
| Changes during the period |
|
|
|
|
| Net changes in items other than shareholders’ equity |
|
|
(6,287 |
) |
|
|
|
|
|
| Total changes during the period |
|
|
(6,287 |
) |
|
|
|
|
|
| Balance at the end of the period |
|
|
(27,962 |
) |
|
|
|
|
|
| Total valuation and translation adjustments: |
|
|
|
|
| Balance at the beginning of the period |
|
|
367,678 |
|
| Changes during the period |
|
|
|
|
| Net changes in items other than shareholders’ equity |
|
|
(123,420 |
) |
|
|
|
|
|
| Total changes during the period |
|
|
(123,420 |
) |
|
|
|
|
|
| Balance at the end of the period |
|
|
244,258 |
|
|
|
|
|
|
| Stock acquisition rights: |
|
|
|
|
| Balance at the beginning of the period |
|
|
1,302 |
|
| Changes during the period |
|
|
|
|
| Net changes in items other than shareholders’ equity |
|
|
1,059 |
|
|
|
|
|
|
| Total changes during the period |
|
|
1,059 |
|
|
|
|
|
|
| Balance at the end of the period |
|
|
2,362 |
|
|
|
|
|
|
| Non-controlling interests: |
|
|
|
|
| Balance at the beginning of the period |
|
|
2,839 |
|
| Changes during the period |
|
|
|
|
| Net changes in items other than shareholders’ equity |
|
|
133 |
|
|
|
|
|
|
| Total changes during the period |
|
|
133 |
|
|
|
|
|
|
| Balance at the end of the period |
|
|
2,973 |
|
|
|
|
|
|
10
|
|
|
|
|
| |
|
(Millions of yen) |
|
| |
|
Six months ended
September 30, 2010
(April 1 to
September 30, 2010) |
|
| Total net assets: |
|
|
|
|
| Balance at the beginning of the period |
|
|
802,843 |
|
| Changes during the period |
|
|
|
|
| Issuance of new stocks - exercise of stock acquisition rights |
|
|
91 |
|
| Dividends |
|
|
(25,700 |
) |
| Net income |
|
|
24,116 |
|
| Acquisition of treasury stock |
|
|
(708 |
) |
| Disposal of treasury stock |
|
|
212 |
|
| Increase due to share exchange |
|
|
444,248 |
|
| Net changes in items other than shareholders’ equity |
|
|
(122,226 |
) |
|
|
|
|
|
| Total changes during the period |
|
|
320,032 |
|
|
|
|
|
|
| Balance at the end of the period |
|
|
1,122,876 |
|
|
|
|
|
|
11
| (4) |
Interim Consolidated Statements of Cash Flows |
|
|
|
|
|
| |
|
(Millions of yen) |
|
| |
|
Six months ended
September 30, 2010
(April 1 to
September 30, 2010) |
|
| Cash flows from operating activities: |
|
|
|
|
| Income before income taxes and non-controlling interests |
|
|
35,980 |
|
| Depreciation |
|
|
9,610 |
|
| Impairment losses |
|
|
662 |
|
| Amortization of goodwill |
|
|
967 |
|
| Gains on negative goodwill |
|
|
(149 |
) |
| Increase (decrease) in reserve for outstanding losses and claims |
|
|
(36,658 |
) |
| Increase (decrease) in underwriting reserves |
|
|
(18,043 |
) |
| Increase (decrease) in allowance for possible loan losses |
|
|
(1,442 |
) |
| Increase (decrease) in reserve for retirement benefits |
|
|
2,946 |
|
| Increase (decrease) in reserve for retirement benefits to directors |
|
|
21 |
|
| Increase (decrease) in reserve for bonus payments |
|
|
3,034 |
|
| Increase (decrease) in reserve for bonus payments to directors |
|
|
(57 |
) |
| Increase (decrease) in reserve for price fluctuation |
|
|
2,843 |
|
| Interest and dividend income |
|
|
(78,453 |
) |
| Losses (gains) on investment in securities |
|
|
6,194 |
|
| Interest expenses |
|
|
3,619 |
|
| Foreign exchange losses (gains) |
|
|
5,045 |
|
| Losses (gains) related to tangible fixed assets |
|
|
245 |
|
| Losses (gains) related to loans |
|
|
0 |
|
| Investment losses (gains) on the equity method |
|
|
128 |
|
| Decrease (increase) in other assets |
|
|
85,657 |
|
| Increase (decrease) in other liabilities |
|
|
(26,621 |
) |
| Others |
|
|
10,027 |
|
|
|
|
|
|
| Subtotal |
|
|
5,558 |
|
|
|
|
|
|
| Interest and dividend received |
|
|
83,487 |
|
| Interest paid |
|
|
(3,582 |
) |
| Income taxes paid |
|
|
(7,822 |
) |
|
|
|
|
|
| Cash flows from operating activities |
|
|
77,640 |
|
|
|
|
|
|
12
|
|
|
|
|
|
|
|
|
| |
|
|
|
|
(Millions of yen) |
|
| |
|
|
|
|
Six months ended
September 30, 2010
(April 1
to
September 30, 2010) |
|
| Cash flows from investing activities: |
|
|
|
|
|
|
|
|
| Net decrease (increase) in deposits |
|
|
|
|
|
|
15,265 |
|
| Purchase of monetary receivables bought |
|
|
|
|
|
|
(1,187 |
) |
| Proceeds from sales and redemption of monetary receivables bought |
|
|
|
|
|
|
5,753 |
|
| Increase in money trusts |
|
|
|
|
|
|
(21 |
) |
| Decrease in money trusts |
|
|
|
|
|
|
347 |
|
| Purchase of securities |
|
|
|
|
|
|
(488,265 |
) |
| Proceeds from sales and redemption of securities |
|
|
|
|
|
|
402,055 |
|
| Loans made |
|
|
|
|
|
|
(98,409 |
) |
| Collection of loans |
|
|
|
|
|
|
117,746 |
|
| Net increase in receivables and payables under securities borrowing transactions |
|
|
|
|
|
|
214 |
|
| Others |
|
|
|
|
|
|
10,269 |
|
|
|
|
|
|
|
|
|
|
| Subtotal |
|
|
|
|
|
|
(36,231 |
) |
|
|
|
|
|
|
|
|
|
| Total of operating activities and investment transactions as above |
|
|
|
|
|
|
41,409 |
|
|
|
|
|
|
|
|
|
|
| Acquisition of tangible fixed assets |
|
|
|
|
|
|
(3,130 |
) |
| Proceeds from sales of tangible fixed assets |
|
|
|
|
|
|
338 |
|
| Acquisition of stocks of subsidiaries resulting in changes in the scope of consolidation |
|
|
|
|
|
|
(6,487 |
) |
| Others |
|
|
|
|
|
|
(1,951 |
) |
|
|
|
|
|
|
|
|
|
| Cash flows from investing activities |
|
|
|
|
|
|
(47,462 |
) |
|
|
|
|
|
|
|
|
|
| Cash flows from financing activities: |
|
|
|
|
|
|
|
|
| Proceeds from issuance of stocks |
|
|
|
|
|
|
0 |
|
| Proceeds from sales of treasury stock |
|
|
|
|
|
|
17 |
|
| Acquisition of treasury stock |
|
|
|
|
|
|
(708 |
) |
| Dividends paid |
|
|
|
|
|
|
(25,662 |
) |
| Dividends paid to non-controlling shareholders |
|
|
|
|
|
|
(5 |
) |
| Others |
|
|
|
|
|
|
(1,271 |
) |
|
|
|
|
|
|
|
|
|
| Cash flows from financing activities |
|
|
|
|
|
|
(27,630 |
) |
|
|
|
|
|
|
|
|
|
| Effect of exchange rate changes on cash and cash equivalents |
|
|
|
|
|
|
(1,567 |
) |
|
|
|
|
|
|
|
|
|
| Net Increase (decrease) in cash and cash equivalents |
|
|
|
|
|
|
980 |
|
|
|
|
|
|
|
|
|
|
| Cash and cash equivalents at the beginning of the period |
|
|
|
|
|
|
262,844 |
|
| Net increase in cash and cash equivalents due to share exchange |
|
|
|
|
|
|
141,141 |
|
| Net increase in cash and cash equivalents due to merger |
|
|
|
|
|
|
2,480 |
|
|
|
|
|
|
|
|
|
|
| Cash and cash equivalents at the end of the period |
|
|
*1 |
|
|
|
407,447 |
|
|
|
|
|
|
|
|
|
|
13
Significant Accounting Policies for the Preparation of the Interim Consolidated Financial Statements
|
|
|
| |
|
Six months ended September 30, 2010
(April 1 to September 30, 2010) |
| 1 Scope of consolidation |
|
(1) Number of consolidated subsidiaries: 23 companies
Sompo Japan Insurance Inc.
NIPPONKOA Insurance Co., Ltd.
Sonpo 24 Insurance Co., Ltd.
Saison Automobile and Fire Insurance Company,
Limited
Sompo Japan Himawari Life Insurance Co., Ltd.
NIPPONKOA Life Insurance Co., Ltd.
Sompo Japan DIY Life Insurance Co., Ltd.
Sompo Japan DC Securities Co., Ltd.
Healthcare Frontier Japan Inc.
Sompo Japan Asset Management Co., Ltd.
Sompo Japan Insurance Company of America
Sompo Japan Insurance Company of Europe Limited
NIPPONKOA Insurance Company (Europe) Limited
NIPPONKOA Management Services (Europe) Limited
Nippon Insurance Company of Europe Limited
Sompo Japan Asia Holdings Pte. Ltd.
Sompo Japan Insurance (Singapore) Pte. Ltd.
Tenet Insurance Company Limited
Sompo Japan Insurance (China) Co., Ltd.
NIPPONKOA Insurance Company (China) Limited
Sompo Japan Insurance (Hong Kong) Company
Limited
NIPPONKOA Insurance Company (Asia) Limited
Yasuda Seguros S.A. |
|
|
|
|
Tenet Insurance Company Limited is the company which was acquired 100%
of its shares by Sompo Japan Insurance Inc. as of May 31, 2010. |
|
|
|
|
(2) Names of principal non-consolidated subsidiaries
Names of principal non-consolidated subsidiaries
Ark Re Limited
Sompo Japan Reinsurance Company
Limited |
|
|
|
|
As the non-consolidated subsidiaries do not have a material impact on
reasonable judgment about the Group’s financial conditions and results of operations in terms of total assets, ordinary income, net income or loss and retained earnings, they are excluded from the scope of consolidation. |
|
|
| 2 Application of
the equity method |
|
(1) Number of affiliates accounted for under the equity method: 6
companies
Hitachi Capital Insurance Corporation
Yasuda Enterprise Development Co., Ltd.
Berjaya Sompo Insurance Berhad
Universal Sompo General Insurance Company
Limited
Maritima Seguros S.A.
Maritima Saude Seguros S.A. |
|
|
|
|
(2) The non-consolidated subsidiaries and affiliates (Ark Re Limited and Sompo Japan Reinsurance
Company Limited, etc.) are not accounted for under the equity method as each company has a minor impact on net income or loss and retained earnings and they do not have a material impact as a whole. |
|
|
|
|
(3) NKSJ Holdings, Inc. holds 26.6% of voting rights of Japan Earthquake Reinsurance Co., Ltd.
(“Japan Earthquake”) through domestic property and casualty insurance subsidiaries. As Japan Earthquake is engaged in public business and NKSJ Holdings, Inc. can not have a material impact on Japan Earthquake’s decision of finance,
promotion and business strategy, Japan Earthquake is excluded from affiliate. |
14
|
|
|
| |
|
Six months ended September 30, 2010
(April 1 to September 30,
2010) |
|
|
|
3 The interim balance sheet dates
of consolidated subsidiaries |
|
The interim balance sheet dates of the foreign consolidated subsidiaries are June 30. As the differences in the interim balance sheet dates do not exceed three months, the
interim financial statements as of June 30 are used for the preparation of the interim consolidated financial statements. Necessary adjustments are made for the significant transactions during the periods from the interim balance sheet dates of
the subsidiaries to the interim consolidated balance sheet date. |
|
|
| 4 Accounting policies |
|
(1) Valuation policies and methods for securities |
|
|
|
|
(a) Trading securities are carried at fair value.
Cost of sale is calculated under the moving-average
method. |
|
|
|
|
(b) Bonds held to maturity are carried at amortized cost based on the moving-average
method. |
|
|
|
|
(c) Policy reserve matching bonds are carried at amortized cost based
on the moving-average method in accordance with “Temporary Treatment of Accounting and Auditing Concerning Policy Reserve Matching Bonds in the Insurance Industry” (Japanese Institute of Certified Public Accountants Industry Audit Practice
Committee Report No.21). The outline of risk
management policy in relation to policy reserve matching bonds is as follows. Certain domestic consolidated life insurance subsidiaries set up “policy reserve for single-premium whole-life” as a sub-category, and follow the management policy to match the duration of the
policy reserve in the sub-category with the duration of policy reserve matching bonds corresponding to this sub-category within a certain range, to better manage the changes in the interest rate risk associated with the assets and
liabilities. |
|
|
|
|
(d) Stocks of non-consolidated subsidiaries and affiliates that are not accounted for under the equity
method are carried at cost based on the moving-average method. |
|
|
|
|
(e) Securities available for sale which have readily determinable
fair value are carried at fair value based on the market price as of the interim balance sheet date. Changes in unrealized gains or losses, net of applicable income taxes, are directly included in net assets, and cost of sale is calculated based on the moving-average method. |
|
|
|
|
(f) Securities available for sale which are considered extremely difficult to figure out fair
value are carried at cost based on the moving-average method. |
|
|
|
|
(g) Securities managed as trust assets in money trust for trading purposes are carried at fair
value. |
|
|
|
|
(h) Securities managed as trust assets in money trusts classified as other than trading purposes or
held to maturity are carried on the same basis as that of securities available for sale. |
|
|
|
|
(2) Valuation policies and methods for derivative financial
instruments
Derivative financial instruments are carried at fair
value. |
|
|
|
|
(3) Depreciation methods of significant assets |
|
|
(a) Tangible fixed assets (excluding lease assets)
Depreciation of tangible fixed assets (excluding lease assets)
held by NKSJ Holdings, Inc. and its domestic consolidated subsidiaries is computed using the declining-balance method, except for buildings (excluding fixtures attached to buildings) acquired on or after April 1, 1998 on which depreciation is
computed using the straight-line method. Depreciation
of tangible fixed assets (excluding lease assets) held by the foreign consolidated subsidiaries is mainly computed using the straight-line method. |
|
|
|
|
(b) Intangible fixed assets
Capitalized software for internal use held by the consolidated
subsidiaries is amortized using the straight-line method based on the estimated useful life. |
15
|
|
|
| |
|
Six months ended September 30, 2010
(April 1 to September 30,
2010) |
|
|
|
|
(4) Accounting policies for significant reserves |
|
|
|
|
(a) Allowance for possible loan losses
In order to provide for losses from defaults, the domestic
consolidated insurance subsidiaries establish allowance for possible loan losses in accordance with the internal standards for self-assessment of assets and the policy of write-off and provision.
For claims on debtors that have legally, formally or
substantially entered into bankruptcy, special liquidation or whose notes have been under suspension at clearing houses, allowances are provided based on the amount remaining after deduction of the estimated recoverable amounts from the disposal of
collateral and from guarantees. For claims on debtors
that are highly probable that they would bankrupt in the future, allowances are provided based on the amount remaining after deduction of the estimated recoverable amounts from the disposal of collateral and from guarantees, considering the
debtor’s overall solvency assessment. For claims
other than those described above, allowances are provided based on the amount of claims multiplied by the default rate, which is computed based on historical loan loss experience.
The departments responsible for respective assets assess relevant
claim in accordance with the in-house self-assessment criteria. The asset auditing department independently reviews the results and allowances are provided based on the said results.
The other consolidated subsidiaries determine the collectability
of the receivables respectively to provide allowances based on the said results to cover the estimated future losses. |
|
|
|
|
(b) Reserve for retirement benefits
In order to provide for employees’ retirement benefits, the
domestic consolidated subsidiaries record the amount, which was considered to occur as of the interim consolidated balance sheet date, based on the projected retirement benefit obligation and the estimated plan assets at the end of the fiscal
year. Prior service costs are amortized using the
straight-line method over certain years within the average remaining service years of employees at the time of occurrence.
Actuarial gains and losses are amortized using the straight-line method over certain years within the average remaining service years
of employees at the time of occurrence from the following fiscal year. |
|
|
|
|
(c) Reserve for retirement benefits to directors
In order to provide for retirement benefits to directors, the
domestic consolidated subsidiaries record the amount deemed accrued as of the interim consolidated balance sheet date based on internal regulations. |
|
|
|
|
(d) Reserve for bonus payments
In order to provide for employees’ bonus payments, the
estimated amounts to be paid as of the interim consolidated balance sheet date are recorded. |
|
|
|
|
(e) Reserve for price fluctuation
In order to provide for possible losses arising from price
fluctuation of stock etc, the domestic consolidated insurance subsidiaries set aside reserves under Article 115 of the Insurance Business Act. |
16
|
|
|
| |
|
Six months ended September 30, 2010
(April 1 to September 30,
2010) |
|
|
|
|
(5) Significant hedge accounting
Generally the domestic consolidated subsidiaries apply the
deferral hedge accounting method to interest rate swaps to hedge cash flow fluctuation risk of floating-rate loans and bonds and interest rate fluctuation risk related to long-term insurance contracts based on “The accounting and auditing
treatment on the application of the financial products accounting standard to the insurance industry” (Japanese Institute of Certified Public Accountants Industry Audit Practice Committee Report No.26, hereafter “Industry Audit Practice
Committee Report No.26”). The exceptional treatment is applied to certain interest rate swaps to the extent that such transactions meet certain conditions required for the application of the exceptional treatment.
The domestic consolidated subsidiaries apply fair value
hedge accounting to equity swaps for hedging the future stock price fluctuation risks.
The fair value hedge accounting method is applied to
forward foreign exchanges, currency options and currency swaps in order to reduce foreign exchange rate fluctuation risk on foreign currency denominated assets. The exceptional treatment is applied to the transactions to the extent that such
transactions meet certain conditions required for application of the exceptional treatment.
Hedge effectiveness is judged by periodically comparing the
accumulated fluctuations of the market value or cash flows of the hedged item to those of the related hedging instrument for the period from the commencement of the hedge to the date of judgment. However, when the material conditions are shared
among the hedging instrument and the hedged item and its effectiveness is considered high, when interest rate swaps meet requirements for applying the exceptional method or when certain transactions fulfill the required conditions to apply the
exceptional treatment, the judgment of the hedge effectiveness is omitted. The hedge effectiveness based on Industry Audit Practice Committee Report No.26 is judged by monitoring the interest rates which impact the
calculation of theoretical prices of both insurance liabilities as hedged item and interest rate swaps as hedging instrument which are grouped by different remaining periods. |
|
|
|
|
(6) Cash and cash equivalents in the interim consolidated statement of
cash flows
Cash and cash equivalents in the interim consolidated
statement of cash flows consist of cash on hand, demand deposits and short-term investments with original maturities or redemption of three months or less, which can be cashed easily and have few risks of fluctuation in value. |
|
|
|
|
(7) Accounting for consumption taxes
NKSJ Holdings, Inc. and its domestic consolidated
subsidiaries account for national and local consumption taxes using the tax-excluded method, except for the domestic consolidated insurance subsidiaries’ expenses such as loss adjustment expenses and operating, general and administrative
expenses for which the domestic consolidated insurance subsidiaries account using the tax-included method.
Non-deductible consumption taxes relating to assets are
included in other assets and amortized in equal installments over five years. |
17
Additional Information
|
| Six months ended September 30,
2010 (April 1 to September 30, 2010) |
(Subsidiaries merged and became a direct subsidiary of NKSJ Holdings, Inc.)
In accordance with
approval by board of directors of Sompo Japan Insurance Inc. (Sompo Japan) and NIPPONKOA Insurance Co., Ltd. (Nipponkoa), subsidiaries of NKSJ Holdings, Inc. (NKSJ), held on July 30, 2010, Sompo Japan Asset Management Co., Ltd. and ZEST Asset
Management Ltd., indirect subsidiaries of NKSJ, merged and the merged entity was renamed Sompo Japan Nipponkoa Asset Management Co., Ltd. (SJNKAM) as of October 1, 2010.
All shares of SJNKAM held by Sompo Japan and Nipponkoa were delivered in-kind to NKSJ, SJNKAM became a direct subsidiary of NKSJ as of October 1, 2010.
(Acquisition of shares)
NKSJ Holdings, Inc.
(NKSJ) acquired 99.07% of the common shares of Fiba Sigorta Anonim Sirketi (Fiba Sigorta), an insurance company, through its consolidated subsidiary as of November 2, 2010, in accordance with the agreement as of June 15, 2010.
Overview of Fiba Sigorta, purpose of the acquisition of shares, etc. are as follows.
| 1 |
Overview of Fiba Sigorta |
Company name: Fiba Sigorta Anonim Sirketi
Head office: Istanbul, Turkey
Description of business: Property and casualty
insurance business
Net premiums written (Fiscal year ended December 31, 2009): 242 million Turkish liras (13,813
million yen)
Total assets (As of December 31, 2009): 356 million Turkish liras (20,332 million yen)
| 2 |
Purpose of the acquisition of shares |
NKSJ will establish a strong platform to expand NKSJ’s property and casualty insurance business in the fast-growing Turkish market.
480 million Turkish liras (27,407 million yen)
Note) Yen amounts in the bracket ( ) are translated by the exchange rate (1 Turkish lira = 57.04 yen) as of September 30, 2010.
18
Notes to the Interim Consolidated Financial Statements
(Notes to the interim consolidated balance sheets)
|
|
|
|
|
|
|
| *1 |
|
|
Accumulated depreciation of tangible fixed assets amounts to 392,426 million yen. |
|
|
|
| *2 |
|
|
(1) |
|
|
Loans to borrowers in bankruptcy and overdue loans amount to 685 million yen and 2,836 million yen, respectively. |
|
|
|
|
|
|
|
|
|
Loans to borrowers in bankruptcy represent those loans (excluding the portion of the loans that were written off), on which accrued interest receivable is not recognized because
repayments of principal or interest were overdue for considerable periods and they are regarded uncollectible and which met the events defined in Article 96-1-3 (the maximum amount transferable to allowance for possible loan losses) and 4 of the
Corporate Income Tax Law Enforcement Regulation (Article 97 of 1965 Cabinet Order). Hereafter, those loans are referred to as “Non-accrual loans”. |
|
|
|
|
|
|
|
|
|
Overdue loans represent non-accrual loans other than (a) loans to borrowers in bankruptcy or (b) loans on which payments of interest are deferred in order to assist or
facilitate the restructuring of borrowers in financial difficulties. |
|
|
|
|
|
|
(2) |
|
|
Loans overdue for three months or more amount to 4 million yen. |
|
|
|
|
|
|
|
|
|
Loans overdue for three months or more represent, among loans which are not included in loans to borrowers in bankruptcy or overdue loans, loans on which the payment of principal or
interest has been delayed for three months or more from the date following the due date. |
|
|
|
|
|
|
(3) |
|
|
Restructured loans amount to 764 million yen. |
|
|
|
|
|
|
|
|
|
Restructured loans represent, among loans which are not included in any of the above categories, loans on which favorable terms for the benefit of borrowers such as interest
exemption or reduction, grace on interest payments, grace on principal repayments or forgiveness of debts have been granted in order to assist or facilitate the restructuring of borrowers in financial difficulties. |
|
|
|
|
|
|
(4) |
|
|
The total of loans to borrowers in bankruptcy, overdue loans, loans overdue for three months or more and restructured loans amount to 4,291 million yen. |
|
|
| *3 |
|
|
Securities of 78,639 million yen, deposits of 6,956 million yen and tangible fixed assets of 5,243 million yen are pledged
as
collateral. |
|
|
|
|
|
Other liabilities include the bank secured debt totaling 1,932 million yen. |
|
|
| *4 |
|
|
Securities include 88,853 million yen of lending securities under loan agreements. |
|
|
| *5 |
|
|
The amount of loan commitments outstanding is 11,354 million yen. |
|
|
| 6 |
|
|
While the securities amounting to 31,843 million yen received under securities borrowing transactions are available for
discretionary disposal through sale or
re-hypothecation, all of them are held by the company. |
19
(Notes to the interim consolidated statements of income)
|
| Six months ended September 30,
2010 (April 1 to September 30, 2010) |
| *1 |
Major components of operating expenses |
|
|
|
| Agency commissions, etc. |
|
176,325 million yen |
| Salaries |
|
98,477 million yen |
Operating
expenses represent the sum of loss adjustment expenses, operating, general and administrative expenses and net commissions and brokerage fees included in the interim consolidated statement of income.
| *2 |
The following assets recognize impairment losses for the six months ended September 30, 2010. |
|
|
|
|
|
|
|
|
|
|
|
|
|
|
|
|
|
|
|
|
|
| Purpose of use |
|
Category |
|
Location, etc. |
|
Impairment losses (millions of yen) |
|
| |
|
|
Land |
|
|
Buildings |
|
|
Others |
|
|
Total |
|
| Properties for rent |
|
Land and buildings |
|
6 properties including a building for rent in Tokyo |
|
|
514 |
|
|
|
102 |
|
|
|
— |
|
|
|
616 |
|
| Idle properties |
|
Land, building and others |
|
9 properties including a company housing in Hyogo |
|
|
39 |
|
|
|
5 |
|
|
|
1 |
|
|
|
45 |
|
|
|
|
|
|
|
|
|
|
|
|
|
|
|
|
|
|
|
|
|
|
| Total |
|
|
|
|
|
|
553 |
|
|
|
107 |
|
|
|
1 |
|
|
|
662 |
|
|
|
|
|
|
|
|
|
|
|
|
|
|
|
|
|
|
|
|
|
|
The domestic consolidated insurance subsidiaries categorize properties used for the insurance business as a
single asset group for the entire insurance business. Properties for rent, idle properties and potential disposal properties are categorized as a single asset group for each property. The other consolidated subsidiaries categorize properties used
for the business as a single asset group for each subsidiary.
When properties reduce profitability significantly for the six
months ended September 30, 2010, mainly due to a decline in the prices of land, the consolidated subsidiaries devalue the carrying amounts to the realizable value. These decreases in the carrying amounts are recorded as impairment losses in
extraordinary losses.
The realizable value is calculated using the value in use or the net selling price for properties for
rent and the net selling price for idle properties. The value in use is calculated by discounting the future cash flows at the discount rate of 5.2%. The net selling price is the appraisal value based on the Real Estate Appraisal Standard.
| *3 |
Other extraordinary gains are 1,785 million yen of gains on extinguishment of tie-in shares. |
| *4 |
The major component of other extraordinary losses is 904 million yen of the impact related to the adoption of accounting standards for asset retirement obligations.
|
20
(Notes to the interim consolidated statements of changes in net assets)
Six months ended September 30, 2010 (April 1 to September 30, 2010)
| 1 |
Type and number of shares outstanding and type and number of treasury stock |
|
|
|
|
|
|
|
|
|
|
|
|
|
|
|
|
|
| |
|
Number as of
March
31, 2010
(thousand shares) |
|
|
Increase
for the six
months ended
September 30, 2010
(thousand shares) |
|
|
Decrease
for the six
months ended
September 30, 2010
(thousand shares) |
|
|
Number as of
September
30, 2010
(thousand shares) |
|
| Shares outstanding |
|
|
|
|
|
|
|
|
|
|
|
|
|
|
|
|
| Common stock |
|
|
— |
|
|
|
1,661,409 |
|
|
|
— |
|
|
|
1,661,409 |
|
|
|
|
|
|
|
|
|
|
|
|
|
|
|
|
|
|
| Total |
|
|
— |
|
|
|
1,661,409 |
|
|
|
— |
|
|
|
1,661,409 |
|
|
|
|
|
|
|
|
|
|
|
|
|
|
|
|
|
|
| Treasury stock |
|
|
|
|
|
|
|
|
|
|
|
|
|
|
|
|
| Common stock |
|
|
— |
|
|
|
1,214 |
|
|
|
307 |
|
|
|
907 |
|
|
|
|
|
|
|
|
|
|
|
|
|
|
|
|
|
|
| Total |
|
|
— |
|
|
|
1,214 |
|
|
|
307 |
|
|
|
907 |
|
|
|
|
|
|
|
|
|
|
|
|
|
|
|
|
|
|
Notes)
| 1 |
Breakdown of increase in shares outstanding of common stock of 1,661,409 thousand shares is as follows. |
New stocks issued in the establishment of NKSJ Holdings, Inc. through share exchange of Sompo Japan Insurance Inc. and NIPPONKOA Insurance
Co., Ltd.: 1,661,263 thousand shares
Increase due to exercise of stock acquisition rights: 145 thousand shares
| 2 |
Breakdown of increase in treasury stock of common stock of 1,214 thousand shares is as follows. |
Increase due to acquisition of treasury stock in accordance with approval by board of directors: 1,000 thousand shares
Increase due to purchase of shares less than a full trading unit: 214 thousand shares
| 3 |
Breakdown of decrease in treasury stock of common stock of 307 thousand shares is as follows. |
Decrease due to disposal of treasury stock related to exercise of stock acquisition rights: 276 thousand shares
Decrease due to sales of shares less than a full trading unit: 30 thousand shares
| 2 |
Stock acquisition rights |
|
|
|
|
|
|
|
| Classification |
|
Breakdown of stock acquisition rights |
|
Balance as of September 30, 2010
(millions of yen) |
|
| NKSJ Holdings, Inc. |
|
Stock acquisition rights for stock option |
|
|
2,362 |
|
|
|
|
|
|
|
|
| Total |
|
|
|
|
2,362 |
|
|
|
|
|
|
|
|
NKSJ Holdings,
Inc. is a joint holding company established through share exchange on April 1, 2010, so the amounts of dividends paid are the amounts approved at each general meeting of stockholders of wholly-owned subsidiaries mentioned below.
Sompo Japan Insurance Inc.
|
|
|
|
|
|
|
|
|
|
|
|
|
|
|
|
|
| Resolution |
|
Type of
share |
|
Total amount
of dividend |
|
|
Dividend
per share |
|
|
Date of record |
|
Effective date |
|
Source of
dividend |
|
|
|
|
|
|
|
| General meeting of stockholders held on June 28, 2010 |
|
Common
stock |
|
|
19,681
million yen |
|
|
|
20 yen |
|
|
March 31, 2010 |
|
June 29, 2010 |
|
Retained
earnings |
NIPPONKOA Insurance
Co., Ltd.
|
|
|
|
|
|
|
|
|
|
|
|
|
|
|
|
|
| Resolution |
|
Type of
share |
|
Total amount
of dividend |
|
|
Dividend
per share |
|
|
Date of record |
|
Effective date |
|
Source of
dividend |
|
|
|
|
|
|
|
| General meeting of stockholders held on June 28, 2010 |
|
Common
stock |
|
|
6,019
million yen |
|
|
|
8 yen |
|
|
March 31, 2010 |
|
June 29, 2010 |
|
Retained
earnings |
| (2) |
Of dividends with record date within the six months ended September 30, 2010, dividends with the effective date after September 30, 2010
|
None.
21
(Notes to the interim consolidated statements of cash flows)
|
|
|
|
|
| Six months ended September 30,
2010 (April 1 to September 30, 2010) |
| *1 |
|
Reconciliation of cash and cash equivalents to the line items disclosed in the interim consolidated balance sheet as of September 30, 2010 |
|
|
|
|
|
Cash and deposits |
|
270,872 million yen |
|
|
Call loans |
|
98,497 million yen |
|
|
Receivables under resale agreements |
|
82,982 million yen |
|
|
Securities |
|
6,511,189 million yen |
|
|
Time deposit with an original maturity of more than 3 months |
|
(49,919) million yen |
|
|
Securities other than cash equivalents |
|
(6,506,174) million yen |
|
|
|
|
|
|
|
Cash and cash equivalents |
|
407,447 million yen |
|
|
| 2 |
|
Cash flows from investing activities include cash flows from investment activities conducted as a part of insurance
business. |
22
(Lease transactions)
|
| Six months ended September 30,
2010 (April 1 to September 30, 2010) |
| 1 |
Finance lease transactions |
Finance lease transactions that do not transfer ownership accounted for in a manner similar to accounting treatment for ordinary rental
transactions. (Lessee)
| |
(1) |
Acquisition cost, accumulated depreciation, accumulated impairment losses and net book value of leased assets |
|
|
|
|
|
|
|
|
|
|
|
|
|
|
|
|
|
| |
|
Acquisition cost
(millions
of yen) |
|
|
Accumulated
depreciation
(millions of yen)
|
|
|
Accumulated
impairment
losses
(millions of yen) |
|
|
Net book value
(millions
of yen) |
|
| Tangible fixed assets |
|
|
2,834 |
|
|
|
2,244 |
|
|
|
— |
|
|
|
589 |
|
Acquisition cost
includes interest payable thereon because the balance of future lease payment accounts for a small portion of the balance of tangible fixed assets.
| |
(2) |
Balance of future lease payments |
|
|
|
|
|
| Due within one year |
|
470 million yen |
|
|
| Due after one year |
|
118 million yen |
|
|
|
|
|
|
|
| Total |
|
589 million yen |
|
|
Balance of impairment losses on leased assets: — million yen
Future lease payment includes interest payable thereon because the balance of future lease payment accounts for a small portion of the
balance of tangible fixed assets.
| |
(3) |
Lease payment, reversal of impairment loss on leased assets, depreciation equivalent and impairment losses |
|
|
|
|
|
| Lease payment |
|
599 million yen |
|
|
| Reversal of impairment losses on lease assets |
|
— million yen |
|
|
| Depreciation equivalent |
|
599 million yen |
|
|
| Impairment losses |
|
— million yen |
|
|
| |
(4) |
Computation of depreciation equivalent |
Depreciation equivalent is computed using the straight-line method over the lease period, with no residual value.
| 2 |
Operating lease transactions |
Future lease payments related to non-cancelable operating leases
(Lessee)
|
|
|
|
|
| Due within one year |
|
705 million yen |
|
|
| Due after one year |
|
1,321 million yen |
|
|
|
|
|
|
|
| Total |
|
2,027 million yen |
|
|
(Lessor)
|
|
|
|
|
| Due within one year |
|
1,544 million yen |
|
|
| Due after one year |
|
7,758 million yen |
|
|
|
|
|
|
|
| Total |
|
9,302 million yen |
|
|
23
(Financial instruments)
As of September 30, 2010
Carrying amount on the interim consolidated balance sheet, fair
value, and unrealized gains (losses) as of September 30, 2010 are as follows.
Meanwhile the financial instruments which NKSJ Holdings,
Inc. considers extremely difficult to figure out the fair value are not included in the following table. (Please refer to “Note 2” for details.)
|
|
|
|
|
|
|
|
|
|
|
|
|
|
|
| |
|
|
|
(Millions of yen) |
|
| |
|
|
|
Carrying amount
on balance
sheet |
|
|
Fair value |
|
|
Unrealized
gains
(losses) |
|
| (1) |
|
Cash and deposits |
|
|
270,872 |
|
|
|
270,872 |
|
|
|
— |
|
| (2) |
|
Call loans |
|
|
98,497 |
|
|
|
98,497 |
|
|
|
— |
|
| (3) |
|
Receivables under resale agreements |
|
|
82,982 |
|
|
|
82,982 |
|
|
|
— |
|
| (4)
(5) |
|
Receivables under securities borrowing transactions
Monetary receivables bought |
|
|
27,146
37,253 |
|
|
|
27,146
37,253 |
|
|
|
— |
|
| (6) |
|
Money trusts |
|
|
84,213 |
|
|
|
84,213 |
|
|
|
— |
|
| (7) |
|
Securities |
|
|
|
|
|
|
|
|
|
|
|
|
|
|
Trading securities |
|
|
14,148 |
|
|
|
14,148 |
|
|
|
— |
|
|
|
Bonds held to maturity
Policy reserve matching bonds |
|
|
1,147,965
12,079 |
|
|
|
1,226,930
12,872 |
|
|
|
78,964
792 |
|
|
|
Securities available for sale |
|
|
5,147,417 |
|
|
|
5,147,417 |
|
|
|
— |
|
| (8) |
|
Loans |
|
|
713,053 |
|
|
|
|
|
|
|
|
|
|
|
Allowance for possible loan losses (*1) |
|
|
(1,506 |
) |
|
|
|
|
|
|
|
|
|
|
|
|
|
711,546 |
|
|
|
720,445 |
|
|
|
8,898 |
|
|
|
|
|
|
|
|
|
|
|
|
|
|
|
|
| Total assets |
|
|
7,634,122 |
|
|
|
7,722,778 |
|
|
|
88,655 |
|
|
|
|
|
|
|
|
|
|
|
|
|
|
|
|
| (1) |
|
Bonds |
|
|
128,000 |
|
|
|
130,956 |
|
|
|
2,956 |
|
|
|
|
|
|
|
|
|
|
|
|
|
|
|
|
| Total liabilities |
|
|
128,000 |
|
|
|
130,956 |
|
|
|
2,956 |
|
|
|
|
|
|
|
|
|
|
|
|
|
|
|
|
| Derivatives transactions (*2) |
|
|
|
|
|
|
|
|
|
|
|
|
| Not qualifying for hedge accounting |
|
|
1,470 |
* |
|
|
1,470 |
* |
|
|
— |
|
| Qualifying for hedge accounting |
|
|
11,719 |
|
|
|
11,718 |
|
|
|
(1 |
) |
|
|
|
|
|
|
|
|
|
|
|
|
|
|
|
| Total derivatives transactions |
|
|
10,249 |
|
|
|
10,248 |
|
|
|
(1 |
) |
|
|
|
|
|
|
|
|
|
|
|
|
|
|
|
| (*1) |
General allowance for possible loan losses and individual allowance for possible loan losses responding to loans are excluded. |
| (*2) |
This table shows derivatives transactions which are allocated on other assets and other liabilities collectively. |
Assets and liabilities arising out from derivatives transactions are shown on the net basis. The items which are net debt in total are
shown by an asterisk (*).
24
Notes)
| 1 |
Calculation methods for the fair value of financial instruments |
Assets
Since all
deposits are short term, the fair value approximates the book value, so the book value is presented as the fair value.
Since all call loans
are short term, the fair value approximates the book value, so the book value is presented as the fair value.
| |
(3) |
Receivables under resale agreements |
Since all are short term, the fair value approximates the book value, so the book value is presented as the fair value.
| |
(4) |
Receivables under securities borrowing transactions |
Since all are short term, the fair value approximates the book value, so the book value is presented as the fair value.
| |
(5) |
Monetary receivables bought |
The
fair value is based on the price quoted by counterparties.
The fair value of
the domestic bonds which are managed as trust assets is based on exchange price, the price released by Japan Securities Dealers Association, the price quoted by counterparties and the over-the-counter average price released by the
supplier. The fair value of the domestic stocks which are managed as trust assets is based on exchange price. And the fair value of foreign securities is based on exchange price, the price released by the industry association and the price quoted by
counterparties. As for derivatives transactions, the fair value of quoted derivatives is based on exchange price and the fair value of forward foreign exchange is based on forward exchange rate.
The fair value of
the domestic bonds is based on exchange price, the price released by Japan Securities Dealers Association and the price quoted by counterparties. The fair value of the domestic stocks is based on exchange price. And the fair value of
foreign securities is based on exchange price and the price quoted by counterparties.
The fair value is the
amount of future collection cash flow of each loan which is discounted by the risk free rate for the corresponding the period, adding credit risk premium and liquidity premium thereto, or the total amount of principal and interest which is
discounted by the expected interest rate of new loans by the types and categories of internal ratings. For the loans categorized as non-performing, probably irrecoverable, irrecoverable or some intensive control debtors, the fair value is the amount
of present value of estimated future cash flow, or since the potential loan losses are estimated based on the amount expected to be covered by collateral and guarantee, the fair value approximates the amount which the current estimated loan losses
are deducted from the carrying amount on the consolidated balance sheet, so such amount is presented as the fair value.
Liabilities
The fair value is
calculated as the amount of future cash flow discounted at the risk free rate for the corresponding period, adding credit risk premium and liquidity premium thereto.
Derivatives transactions
Please refer to the note in “Derivatives
transactions”.
As for derivatives transactions to which hedge accounting is applied, the fair value of forward foreign
exchange transactions is calculated using forward exchange rate. The fair value of interest rate swap transactions is based on the price quoted by counterparties or the fair value calculated by discounting future cash flow to the present value.
25
| 2 |
The financial instruments which NKSJ Holdings, Inc. considers extremely difficult to figure out the fair value are as follows. These financial instruments are not
included in “(6) Money trusts” and “(7) Securities”. |
|
|
|
|
|
| |
|
(Millions of yen) |
|
| |
|
Carrying amount
on balance
sheet |
|
| Money trusts |
|
|
435 |
|
| Domestic bonds |
|
|
1,000 |
|
| Domestic stocks |
|
|
121,509 |
|
| Foreign securities |
|
|
41,230 |
|
| Others |
|
|
25,838 |
|
|
|
|
|
|
| Total |
|
|
190,013 |
|
|
|
|
|
|
Since domestic stocks are the unlisted stocks and do not have the quoted market price, they are not included
in the scope of fair value disclosure.
Since foreign securities are the unlisted stocks or investments mainly include the
unlisted stocks and do not have the quoted market price, they are not included in the scope of fair value disclosure.
Since
others are investments mainly include the real estate or instruments mainly include the unlisted stocks and do not have the quoted market price, they are not included in the scope of fair value disclosure.
26
(Securities)
As of September 30, 2010
|
|
|
|
|
|
|
|
|
|
|
|
|
| |
|
(Millions of yen) |
|
| |
|
Carrying amount
on balance sheet |
|
|
Fair value |
|
|
Unrealized
gains (losses) |
|
| Securities whose fair value exceeds their carrying amount on balance sheet |
|
|
|
|
|
|
|
|
|
|
|
|
| Domestic bonds |
|
|
1,074,635 |
|
|
|
1,153,057 |
|
|
|
78,421 |
|
| Foreign securities |
|
|
46,701 |
|
|
|
47,441 |
|
|
|
740 |
|
|
|
|
|
|
|
|
|
|
|
|
|
|
| Subtotal |
|
|
1,121,337 |
|
|
|
1,200,499 |
|
|
|
79,161 |
|
|
|
|
|
|
|
|
|
|
|
|
|
|
| Securities whose fair value doesn’t exceed their carrying amount on balance sheet |
|
|
|
|
|
|
|
|
|
|
|
|
| Domestic bonds |
|
|
2,291 |
|
|
|
2,227 |
|
|
|
(64 |
) |
| Foreign securities |
|
|
24,336 |
|
|
|
24,203 |
|
|
|
(133 |
) |
|
|
|
|
|
|
|
|
|
|
|
|
|
| Subtotal |
|
|
26,628 |
|
|
|
26,430 |
|
|
|
(197 |
) |
|
|
|
|
|
|
|
|
|
|
|
|
|
| Total |
|
|
1,147,965 |
|
|
|
1,226,930 |
|
|
|
78,964 |
|
|
|
|
|
|
|
|
|
|
|
|
|
|
| 2 |
Policy reserve matching bonds |
|
|
|
|
|
|
|
|
|
|
|
|
|
| |
|
(Millions of yen) |
|
| |
|
Carrying amount
on balance sheet |
|
|
Fair value |
|
|
Unrealized
gains (losses) |
|
| Securities whose fair value exceeds their carrying amount on balance sheet |
|
|
|
|
|
|
|
|
|
|
|
|
| Domestic bonds |
|
|
12,079 |
|
|
|
12,872 |
|
|
|
792 |
|
|
|
|
|
|
|
|
|
|
|
|
|
|
| Securities whose fair value doesn’t exceed their carrying amount on balance sheet |
|
|
|
|
|
|
|
|
|
|
|
|
| Domestic bonds |
|
|
— |
|
|
|
— |
|
|
|
— |
|
|
|
|
|
|
|
|
|
|
|
|
|
|
| Total |
|
|
12,079 |
|
|
|
12,872 |
|
|
|
792 |
|
|
|
|
|
|
|
|
|
|
|
|
|
|
| 3 |
Securities available for sale |
|
|
|
|
|
|
|
|
|
|
|
|
|
| |
|
(Millions of yen) |
|
| |
|
Carrying amount
on balance sheet |
|
|
Cost |
|
|
Unrealized
gains (losses) |
|
| Securities whose carrying amount on balance sheet exceeds their cost |
|
|
|
|
|
|
|
|
|
|
|
|
| Domestic bonds |
|
|
2,486,904 |
|
|
|
2,390,706 |
|
|
|
96,197 |
|
| Domestic stocks |
|
|
913,245 |
|
|
|
463,232 |
|
|
|
450,012 |
|
| Foreign securities |
|
|
524,338 |
|
|
|
487,609 |
|
|
|
36,728 |
|
| Others |
|
|
69,030 |
|
|
|
64,353 |
|
|
|
4,677 |
|
|
|
|
|
|
|
|
|
|
|
|
|
|
| Subtotal |
|
|
3,993,518 |
|
|
|
3,405,901 |
|
|
|
587,617 |
|
|
|
|
|
|
|
|
|
|
|
|
|
|
| Securities whose carrying amount on balance sheet doesn’t exceed their cost |
|
|
|
|
|
|
|
|
|
|
|
|
| Domestic bonds |
|
|
55,228 |
|
|
|
55,943 |
|
|
|
(715 |
) |
| Domestic stocks |
|
|
576,687 |
|
|
|
675,493 |
|
|
|
(98,806 |
) |
| Foreign securities |
|
|
540,011 |
|
|
|
607,468 |
|
|
|
(67,457 |
) |
| Others |
|
|
34,100 |
|
|
|
35,298 |
|
|
|
(1,198 |
) |
|
|
|
|
|
|
|
|
|
|
|
|
|
| Subtotal |
|
|
1,206,027 |
|
|
|
1,374,204 |
|
|
|
(168,177 |
) |
|
|
|
|
|
|
|
|
|
|
|
|
|
| Total |
|
|
5,199,546 |
|
|
|
4,780,106 |
|
|
|
419,439 |
|
|
|
|
|
|
|
|
|
|
|
|
|
|
Notes)
| 1 |
Securities available for sale, which are considered extremely difficult to figure out their fair value are not included in the above table. |
| 2 |
Certificate of deposit, which are classified as cash and deposits and beneficial interests in the loan trusts, which are classified as monetary receivables bought in
the interim consolidated balance sheet, are included in “Others” above. |
| 3 |
Impairment losses on securities available for sale which have readily determinable fair value amount to 6,401 million yen (domestic stocks: 5,123 million yen,
foreign securities: 1,277 million yen). Impairment losses on securities available for sale which are considered extremely difficult to figure out their fair value amount to 413 million yen (domestic stocks: 317 million yen, foreign
securities: 47 million yen, others: 48 million yen). |
NKSJ Holdings, Inc. and its domestic consolidated
subsidiaries recognize impairment losses on securities available for sale which have readily determinable fair value if fair value declines by 30% or more of their cost as of the interim balance sheet date, as a rule.
27
(Money trusts)
As of September 30, 2010
| 1 |
Money trusts held to maturity |
None.
| 2 |
Money trusts classified as other than trading purposes or held to maturity |
|
|
|
|
|
|
|
|
|
|
|
|
|
| |
|
(Millions of yen) |
|
| |
|
Carrying amount
on balance sheet |
|
|
Cost |
|
|
Unrealized
gains (losses) |
|
| Money trusts |
|
|
26,616 |
|
|
|
26,359 |
|
|
|
257 |
|
| Note) |
Money trusts, which are considered extremely difficult to figure out their fair value are not included in the above table. |
28
(Derivatives transactions)
As of September 30, 2010
|
|
|
|
|
|
|
|
|
|
|
|
|
|
|
|
|
| |
|
(Millions of yen) |
|
| |
|
Notional
amount |
|
|
Due after
1 year of
notional
amount |
|
|
Fair value |
|
|
Unrealized
gains (losses) |
|
| Over-the-counter transactions: |
|
|
|
|
|
|
|
|
|
|
|
|
|
|
|
|
| Forward foreign exchanges: |
|
|
|
|
|
|
|
|
|
|
|
|
|
|
|
|
| Short |
|
|
|
|
|
|
|
|
|
|
|
|
|
|
|
|
| EUR |
|
|
66,892 |
|
|
|
— |
|
|
|
(3,062 |
) |
|
|
(3,062 |
) |
| USD |
|
|
29,161 |
|
|
|
— |
|
|
|
760 |
|
|
|
760 |
|
| Long |
|
|
|
|
|
|
|
|
|
|
|
|
|
|
|
|
| TRY |
|
|
19,956 |
|
|
|
— |
|
|
|
281 |
|
|
|
281 |
|
| USD |
|
|
19,389 |
|
|
|
— |
|
|
|
(53 |
) |
|
|
(53 |
) |
|
|
|
|
|
|
|
|
|
|
|
|
|
|
|
|
|
| Total |
|
|
— |
|
|
|
— |
|
|
|
(2,073 |
) |
|
|
(2,073 |
) |
|
|
|
|
|
|
|
|
|
|
|
|
|
|
|
|
|
Notes)
| 1 |
Information on currency derivatives transactions other than the above-mentioned transactions is omitted because of no transactions. |
| 2 |
Calculation methods for the fair value |
| |
The fair value is calculated using forward exchange rate. |
| |
As for forward foreign exchanges transactions between foreign currency and the other foreign currency, the fair value is calculated using forward exchange rate of the
other foreign currency and yen on the day of forward foreign exchanges transactions. |
| 3 |
Derivatives transactions to which hedge accounting is applied are excluded. |
| 2 |
Interest rate derivatives |
|
|
|
|
|
|
|
|
|
|
|
|
|
|
|
|
|
| |
|
(Millions of yen) |
|
| |
|
Notional
amount |
|
|
Due after
1 year of
notional
amount |
|
|
Fair value |
|
|
Unrealized
gains (losses) |
|
| Over-the-counter transactions: |
|
|
|
|
|
|
|
|
|
|
|
|
|
|
|
|
| Interest rate swaps: |
|
|
|
|
|
|
|
|
|
|
|
|
|
|
|
|
| Receive fix / Pay float |
|
|
15,000 |
|
|
|
— |
|
|
|
63 |
|
|
|
63 |
|
|
|
|
|
|
|
|
|
|
|
|
|
|
|
|
|
|
| Total |
|
|
— |
|
|
|
— |
|
|
|
63 |
|
|
|
63 |
|
|
|
|
|
|
|
|
|
|
|
|
|
|
|
|
|
|
Notes)
| 1 |
Information on interest rate derivatives transactions other than the above-mentioned transactions is omitted because of no transactions. |
| 2 |
Calculation methods for the fair value |
| |
The fair value is calculated by discounting future cash flow to the present value. |
| 3 |
Derivatives transactions to which hedge accounting is applied are excluded. |
29
|
|
|
|
|
|
|
|
|
|
|
|
|
|
|
|
|
| |
|
(Millions of yen) |
|
| |
|
Notional
amount |
|
|
Due after
1 year
of
notional
amount |
|
|
Fair value |
|
|
Unrealized
gains (losses) |
|
| Market transactions: |
|
|
|
|
|
|
|
|
|
|
|
|
|
|
|
|
| Equity index futures: |
|
|
|
|
|
|
|
|
|
|
|
|
|
|
|
|
| Short |
|
|
5,209 |
|
|
|
— |
|
|
|
14 |
|
|
|
14 |
|
| Equity index options: |
|
|
|
|
|
|
|
|
|
|
|
|
|
|
|
|
| Short |
|
|
|
|
|
|
|
|
|
|
|
|
|
|
|
|
| Call |
|
|
5,417 |
|
|
|
— |
|
|
|
|
|
|
|
|
|
|
|
|
205 |
* |
|
|
— |
* |
|
|
(6 |
) |
|
|
199 |
|
| Long |
|
|
|
|
|
|
|
|
|
|
|
|
|
|
|
|
| Put |
|
|
4,400 |
|
|
|
— |
|
|
|
|
|
|
|
|
|
|
|
|
205 |
* |
|
|
— |
* |
|
|
406 |
|
|
|
201 |
|
|
|
|
|
|
|
|
|
|
|
|
|
|
|
|
|
|
| Total |
|
|
— |
|
|
|
— |
|
|
|
414 |
|
|
|
414 |
|
|
|
|
|
|
|
|
|
|
|
|
|
|
|
|
|
|
Notes)
| 1 |
Information on equity derivatives transactions other than the above-mentioned transactions is omitted because of no transactions. |
| 2 |
Calculation methods for the fair value |
| |
|
The fair value is based on the closing price at major exchanges. |
| |
|
The fair value is based on the closing price at major exchanges. |
| 3 |
Amounts with an asterisk (*) represent the amount of the option premiums. |
|
|
|
|
|
|
|
|
|
|
|
|
|
|
|
|
|
| |
|
(Millions of yen) |
|
| |
|
Notional
amount |
|
|
Due after
1 year
of
notional
amount |
|
|
Fair value |
|
|
Unrealized
gains (losses) |
|
| Market transactions: |
|
|
|
|
|
|
|
|
|
|
|
|
|
|
|
|
| Bond futures: |
|
|
|
|
|
|
|
|
|
|
|
|
|
|
|
|
| Long |
|
|
1,500 |
|
|
|
— |
|
|
|
3 |
|
|
|
3 |
|
|
|
|
|
|
|
|
|
|
|
|
|
|
|
|
|
|
| Total |
|
|
— |
|
|
|
— |
|
|
|
3 |
|
|
|
3 |
|
|
|
|
|
|
|
|
|
|
|
|
|
|
|
|
|
|
Notes)
| 1 |
Information on bond derivatives transactions other than the above-mentioned transactions is omitted because of no transactions. |
| 2 |
Calculation methods for the fair value |
| |
The fair value is based on the closing price at major exchanges. |
None.
30
|
|
|
|
|
|
|
|
|
|
|
|
|
|
|
|
|
| |
|
(Millions of yen) |
|
| |
|
Notional
amount |
|
|
Due after
1 year of
notional
amount |
|
|
Fair value |
|
|
Unrealized
gains (losses) |
|
| Over-the-counter transactions: |
|
|
|
|
|
|
|
|
|
|
|
|
|
|
|
|
| Credit derivatives: |
|
|
|
|
|
|
|
|
|
|
|
|
|
|
|
|
| Short |
|
|
7,000 |
|
|
|
7,000 |
|
|
|
18 |
|
|
|
18 |
|
| Long |
|
|
3,000 |
|
|
|
1,000 |
|
|
|
3 |
|
|
|
3 |
|
| Weather derivatives: |
|
|
|
|
|
|
|
|
|
|
|
|
|
|
|
|
| Short |
|
|
480 |
|
|
|
— |
|
|
|
|
|
|
|
|
|
|
|
|
28 |
* |
|
|
— |
* |
|
|
(14 |
) |
|
|
13 |
|
| Earthquake derivatives: |
|
|
|
|
|
|
|
|
|
|
|
|
|
|
|
|
| Short |
|
|
5,000 |
|
|
|
1,050 |
|
|
|
|
|
|
|
|
|
|
|
|
141 |
* |
|
|
21 |
* |
|
|
(24 |
) |
|
|
116 |
|
| Long |
|
|
3,555 |
|
|
|
3,033 |
|
|
|
|
|
|
|
|
|
|
|
|
366 |
* |
|
|
290 |
* |
|
|
138 |
|
|
|
(227 |
) |
|
|
|
|
|
|
|
|
|
|
|
|
|
|
|
|
|
| Total |
|
|
— |
|
|
|
— |
|
|
|
121 |
|
|
|
(75 |
) |
|
|
|
|
|
|
|
|
|
|
|
|
|
|
|
|
|
Notes)
| 1 |
Calculation methods for the fair value |
| |
|
The fair value is based on the price quoted by counterparties. |
| |
|
The fair value is calculated based on the contract term and the element of the contract. |
| |
(3) |
Earthquake derivatives |
| |
|
The fair value is calculated based on the contract term and the element of the contract. |
| 2 |
Amounts with an asterisk (*) represent the amount of the option premiums. |
31
(Stock options)
Six months ended September 30, 2010 (April 1 to September 30, 2010)
| 1 |
Recorded amount and account on stock options for the six months ended September 30, 2010 |
Operating, general and administrative expenses: 631 million yen
| 2 |
Contents of stock options granted for the six months ended September 30, 2010 |
Terms of first to sixteenth issue of stock acquisition rights of NKSJ Holdings, Inc. (“NKSJ”) are those granted by NKSJ in lieu
of the stock options granted by Sompo Japan Insurance Inc. (“Sompo Japan”). Terms of seventeenth to twenty-second issue of stock acquisition rights of NKSJ are those granted by NKSJ in lieu of the stock options granted by NIPPONKOA
Insurance Co., Ltd. (“NIPPONKOA”).
[Stock options transferred from Sompo Japan to NKSJ]
Terms of First Issue of Stock Acquisition Rights of NKSJ
|
|
|
|
|
|
|
| Title and number of recipients |
|
Directors and executive officers of Sompo Japan |
|
|
|
1 |
|
|
Others (Note 1) |
|
|
|
7 |
|
|
|
| Number of stock options by types of shares (Shares) |
|
Common stock |
|
125,000 (Note 2) |
|
|
|
|
| Date of issue |
|
April 1, 2010 |
|
|
|
|
|
|
|
|
| Conditions to grant a right of stock options |
|
The right was granted on the date of issue |
|
|
|
|
|
|
|
|
| Length of services required |
|
– |
|
|
|
|
|
|
|
|
| Exercise period |
|
April 1, 2010 to June 27, 2012 |
|
|
|
|
|
|
|
|
| Exercise price (Yen) |
|
|
|
|
|
777 |
|
|
|
| Fair value per share as of the date of issue (Yen) |
|
|
|
– (Note 3) |
Notes)
| 1 |
“Others” in the table represents recipients at the time of issue by Sompo Japan but who have already been retired as of the date of issue by NKSJ.
|
| 2 |
Number of stock options is indicated by converting to number of shares. |
| 3 |
Amount is not indicated because the stock acquisition rights have been issued in accordance with Articles 280-20 and 280-21 of the former Japanese Commercial Code
revised in 2001 and have been transferred to NKSJ. |
32
Terms of Second Issue of Stock Acquisition Rights of NKSJ
|
|
|
|
|
|
|
| Title and number of recipients |
|
Directors and executive officers of Sompo Japan |
|
|
|
0 |
|
|
Others (Note 1) |
|
|
|
1 |
|
|
|
| Number of stock options by types of shares (Shares) |
|
Common stock |
|
10,000 (Note 2) |
|
|
|
|
| Date of issue |
|
April 1, 2010 |
|
|
|
|
|
|
|
|
| Conditions to grant a right of stock options |
|
The right was granted on the date of issue |
|
|
|
|
|
|
|
|
| Length of services required |
|
– |
|
|
|
|
|
|
|
|
| Exercise period |
|
April 1, 2010 to June 27, 2012 |
|
|
|
|
|
|
|
|
| Exercise price (Yen) |
|
|
|
|
|
712 |
|
|
|
| Fair value per share as of the date of issue (Yen) |
|
|
|
– (Note 3) |
Notes)
| 1 |
“Others” in the table represents recipients at the time of issue by Sompo Japan but who have already been retired as of the date of issue by NKSJ.
|
| 2 |
Number of stock options is indicated by converting to number of shares. |
| 3 |
Amount is not indicated because the stock acquisition rights have been issued in accordance with Articles 280-20 and 280-21 of the former Japanese Commercial Code
revised in 2001 and have been transferred to NKSJ. |
Terms of Third Issue of Stock Acquisition Rights of NKSJ
|
|
|
|
|
|
|
| Title and number of recipients |
|
Directors and executive officers of Sompo Japan |
|
|
|
1 |
|
|
Others (Note 1) |
|
|
|
1 |
|
|
|
| Number of stock options by types of shares (Shares) |
|
Common stock |
|
20,000 (Note 2) |
|
|
|
|
| Date of issue |
|
April 1, 2010 |
|
|
|
|
|
|
|
|
| Conditions to grant a right of stock options |
|
The right was granted on the date of issue |
|
|
|
|
|
|
|
|
| Length of services required |
|
– |
|
|
|
|
|
|
|
|
| Exercise period |
|
April 1, 2010 to June 27, 2012 |
|
|
|
|
|
|
|
|
| Exercise price (Yen) |
|
|
|
|
|
581 |
|
|
|
| Fair value per share as of the date of issue (Yen) |
|
|
|
– (Note 3) |
Notes)
| 1 |
“Others” in the table represents recipients at the time of issue by Sompo Japan but who have already been retired as of the date of issue by NKSJ.
|
| 2 |
Number of stock options is indicated by converting to number of shares. |
| 3 |
Amount is not indicated because the stock acquisition rights have been issued in accordance with Articles 280-20 and 280-21 of the former Japanese Commercial Code
revised in 2001 and have been transferred to NKSJ. |
33
Terms of Fourth Issue of Stock Acquisition Rights of NKSJ
|
|
|
|
|
|
|
| Title and number of recipients |
|
Directors and executive officers of Sompo Japan |
|
|
|
0 |
|
|
Others (Note 1) |
|
|
|
3 |
| Number of stock options by types of shares (Shares) |
|
Common stock |
|
30,000 (Note 2) |
|
|
|
|
| Date of issue |
|
April 1, 2010 |
|
|
|
|
|
|
|
|
| Conditions to grant a right of stock options |
|
The right was granted on the date of issue |
|
|
|
|
|
|
|
|
| Length of services required |
|
– |
|
|
|
|
|
|
|
|
| Exercise period |
|
April 1, 2010 to June 27, 2012 |
|
|
|
|
|
|
|
|
| Exercise price (Yen) |
|
|
|
|
|
574 |
|
|
|
| Fair value per share as of the date of issue (Yen) |
|
|
|
– (Note 3) |
Notes)
| 1 |
“Others” in the table represents recipients at the time of issue by Sompo Japan but who have already been retired as of the date of issue by NKSJ.
|
| 2 |
Number of stock options is indicated by converting to number of shares. |
| 3 |
Amount is not indicated because the stock acquisition rights have been issued in accordance with Articles 280-20 and 280-21 of the former Japanese Commercial Code
revised in 2001 and have been transferred to NKSJ. |
Terms of Fifth Issue of Stock Acquisition Rights of NKSJ
|
|
|
|
|
|
|
| Title and number of recipients |
|
Directors and executive officers of Sompo Japan |
|
3 |
|
|
Others (Note 1) |
|
12 |
| Number of stock options by types of shares (Shares) |
|
Common stock |
|
90,000 (Note 2) |
|
|
|
|
| Date of issue |
|
April 1, 2010 |
|
|
|
|
|
|
|
|
| Conditions to grant a right of stock options |
|
The right was granted on the date of issue |
|
|
|
|
|
|
|
|
| Length of services required |
|
– |
|
|
|
|
|
|
|
|
| Exercise period |
|
April 1, 2010 to June 27, 2013 |
|
|
|
|
|
|
|
|
| Exercise price (Yen) |
|
|
|
|
|
735 |
|
|
|
| Fair value per share as of the date of issue (Yen) |
|
|
|
– (Note 3) |
Notes)
| 1 |
“Others” in the table represents recipients at the time of issue by Sompo Japan but who have already been retired as of the date of issue by NKSJ.
|
| 2 |
Number of stock options is indicated by converting to number of shares. |
| 3 |
Amount is not indicated because the stock acquisition rights have been issued in accordance with Articles 280-20 and 280-21 of the former Japanese Commercial Code
revised in 2001 and have been transferred to NKSJ. |
34
Terms of Sixth Issue of Stock Acquisition Rights of NKSJ
|
|
|
|
|
|
|
| Title and number of recipients |
|
Directors and executive officers of Sompo Japan |
|
3 |
|
|
Others (Note 1) |
|
|
|
18 |
|
|
|
| Number of stock options by types of shares (Shares) |
|
Common stock |
|
130,000 (Note 2) |
|
|
|
|
| Date of issue |
|
April 1, 2010 |
|
|
|
|
|
|
|
|
| Conditions to grant a right of stock options |
|
The right was granted on the date of issue |
|
|
|
|
|
|
|
|
| Length of services required |
|
– |
|
|
|
|
|
|
|
|
| Exercise period |
|
April 1, 2010 to June 27, 2013 |
|
|
|
|
|
|
|
|
| Exercise price (Yen) |
|
|
|
|
|
901 |
|
|
|
| Fair value per share as of the date of issue (Yen) |
|
|
|
– (Note 3) |
Notes)
| 1 |
“Others” in the table represents recipients at the time of issue by Sompo Japan but who have already been retired as of the date of issue by NKSJ.
|
| 2 |
Number of stock options is indicated by converting to number of shares. |
| 3 |
Amount is not indicated because the stock acquisition rights have been issued in accordance with Articles 280-20 and 280-21 of the former Japanese Commercial Code
revised in 2001 and have been transferred to NKSJ. |
Terms of Seventh Issue of Stock Acquisition Rights of NKSJ
|
|
|
|
|
|
|
| Title and number of recipients |
|
Directors and executive officers of Sompo Japan |
|
5 |
| |
Others (Note 1) |
|
|
|
27 |
|
|
|
| Number of stock options by types of shares (Shares) |
|
Common stock |
|
255,000 (Note 2) |
|
|
|
|
| Date of issue |
|
April 1, 2010 |
|
|
|
|
|
|
|
|
| Conditions to grant a right of stock options |
|
The right was granted on the date of issue |
|
|
|
|
|
|
|
|
| Length of services required |
|
– |
|
|
|
|
|
|
|
|
| Exercise period |
|
April 1, 2010 to June 29, 2014 |
|
|
|
|
|
|
|
|
| Exercise price (Yen) |
|
|
|
|
|
1,167 |
|
|
|
| Fair value per share as of the date of issue (Yen) |
|
|
|
– (Note 3) |
Notes)
| 1 |
“Others” in the table represents recipients at the time of issue by Sompo Japan but who have already been retired as of the date of issue by NKSJ.
|
| 2 |
Number of stock options is indicated by converting to number of shares. |
| 3 |
Amount is not indicated because the stock acquisition rights have been issued in accordance with Articles 280-20 and 280-21 of the former Japanese Commercial Code
revised in 2001 and have been transferred to NKSJ. |
35
Terms of Eighth Issue of Stock Acquisition Rights of NKSJ
|
|
|
|
|
|
|
| Title and number of recipients |
|
Directors and executive officers of Sompo Japan |
|
6 |
| |
Others (Note 1) |
|
|
|
26 |
|
|
|
| Number of stock options by types of shares (Shares) |
|
Common stock |
|
262,000 (Note 2) |
|
|
|
|
| Date of issue |
|
April 1, 2010 |
|
|
|
|
|
|
|
|
| Conditions to grant a right of stock options |
|
The right was granted on the date of issue |
|
|
|
|
|
|
|
|
| Length of services required |
|
– |
|
|
|
|
|
|
|
|
| Exercise period |
|
April 1, 2010 to June 29, 2014 |
|
|
|
|
|
|
|
|
| Exercise price (Yen) |
|
|
|
|
|
1,082 |
|
|
|
| Fair value per share as of the date of issue (Yen) |
|
|
|
– (Note 3) |
Notes)
| 1 |
“Others” in the table represents recipients at the time of issue by Sompo Japan but who have already been retired as of the date of issue by NKSJ.
|
| 2 |
Number of stock options is indicated by converting to number of shares. |
| 3 |
Amount is not indicated because the stock acquisition rights have been issued in accordance with Articles 280-20 and 280-21 of the former Japanese Commercial Code
revised in 2001 and have been transferred to NKSJ. |
Terms of Ninth Issue of Stock Acquisition Rights of NKSJ
|
|
|
|
|
|
|
| Title and number of recipients |
|
Directors and executive officers of Sompo Japan |
|
|
|
11 |
|
|
Others (Note 1) |
|
|
|
34 |
|
|
|
| Number of stock options by types of shares (Shares) |
|
Common stock |
|
363,000 (Note 2) |
|
|
|
|
| Date of issue |
|
April 1, 2010 |
|
|
|
|
|
|
|
|
| Conditions to grant a right of stock options |
|
The right was granted on the date of issue |
|
|
|
|
|
|
|
|
| Length of services required |
|
– |
|
|
|
|
|
|
|
|
| Exercise period |
|
April 1, 2010 to June 28, 2015 |
|
|
|
|
|
|
|
|
| Exercise price (Yen) |
|
|
|
|
|
1,148 |
|
|
|
| Fair value per share as of the date of issue (Yen) |
|
|
|
– (Note 3) |
Notes)
| 1 |
“Others” in the table represents recipients at the time of issue by Sompo Japan but who have already been retired as of the date of issue by NKSJ.
|
| 2 |
Number of stock options is indicated by converting to number of shares. |
| 3 |
Amount is not indicated because the stock acquisition rights have been issued in accordance with Articles 280-20 and 280-21 of the former Japanese Commercial Code
revised in 2001 and have been transferred to NKSJ. |
36
Terms of Tenth Issue of Stock Acquisition Rights of NKSJ
|
|
|
|
|
|
|
| Title and number of recipients |
|
Directors and executive officers of Sompo Japan |
|
11 |
| |
Others (Note 1) |
|
|
|
35 |
|
|
|
| Number of stock options by types of shares (Shares) |
|
Common stock |
|
365,000 (Note 2) |
|
|
|
|
| Date of issue |
|
April 1, 2010 |
|
|
|
|
|
|
|
|
| Conditions to grant a right of stock options |
|
The right was granted on the date of issue |
|
|
|
|
|
|
|
|
| Length of services required |
|
– |
|
|
|
|
|
|
|
|
| Exercise period |
|
April 1, 2010 to June 28, 2015 |
|
|
|
|
|
|
|
|
| Exercise price (Yen) |
|
|
|
|
|
1,665 |
|
|
|
| Fair value per share as of the date of issue (Yen) |
|
|
|
– (Note 3) |
Notes)
| 1 |
“Others” in the table represents recipients at the time of issue by Sompo Japan but who have already been retired as of the date of issue by NKSJ.
|
| 2 |
Number of stock options is indicated by converting to number of shares. |
| 3 |
Amount is not indicated because the stock acquisition rights have been issued in accordance with Articles 280-20 and 280-21 of the former Japanese Commercial Code
revised in 2001 and have been transferred to NKSJ. |
Terms of Eleventh Issue of Stock Acquisition Rights of NKSJ
|
|
|
|
|
|
|
| Title and number of recipients |
|
Directors and executive officers of Sompo Japan |
|
11 |
|
|
Others (Note 1) |
|
|
|
31 |
|
|
|
| Number of stock options by types of shares (Shares) |
|
Common stock |
|
324,000 (Note 2) |
|
|
|
|
| Date of issue |
|
April 1, 2010 |
|
|
|
|
|
|
|
|
| Conditions to grant a right of stock options |
|
The right was granted on the date of issue |
|
|
|
|
|
|
|
|
| Length of services required |
|
– |
|
|
|
|
|
|
|
|
| Exercise period |
|
April 1, 2010 to June 28, 2016 |
|
|
|
|
|
|
|
|
| Exercise price (Yen) |
|
|
|
|
|
1,598 |
|
|
|
| Fair value per share as of the date of issue (Yen) |
|
|
|
470 (Note 3) |
Notes)
| 1 |
“Others” in the table represents recipients at the time of issue by Sompo Japan but who have already been retired as of the date of issue by NKSJ.
|
| 2 |
Number of stock options is indicated by converting to number of shares. |
| 3 |
Fair value per share at the time of issue by Sompo Japan is indicated in the table. |
37
Terms of Twelfth Issue of Stock Acquisition Rights of NKSJ
|
|
|
|
|
|
|
| Title and number of recipients |
|
Directors and executive officers of Sompo Japan |
|
|
|
11 |
|
|
Others (Note 1) |
|
|
|
30 |
|
|
|
| Number of stock options by types of shares (Shares) |
|
Common stock |
|
316,000 (Note 2) |
|
|
|
|
| Date of issue |
|
April 1, 2010 |
|
|
|
|
|
|
|
|
| Conditions to grant a right of stock options |
|
The right was granted on the date of issue |
|
|
|
|
|
|
|
|
| Length of services required |
|
– |
|
|
|
|
|
|
|
|
| Exercise period |
|
April 1, 2010 to June 28, 2016 |
|
|
|
|
|
|
|
|
| Exercise price (Yen) |
|
|
|
|
|
1,623 |
|
|
|
|
| Fair value per share as of the date of issue (Yen) |
|
|
|
|
|
515 (Note 3) |
Notes)
| 1 |
“Others” in the table represents recipients at the time of issue by Sompo Japan but who have already been retired as of the date of issue by NKSJ.
|
| 2 |
Number of stock options is indicated by converting to number of shares. |
| 3 |
Fair value per share at the time of issue by Sompo Japan is indicated in the table. |
Terms of Thirteenth Issue of Stock
Acquisition Rights of NKSJ
|
|
|
|
|
|
|
| Title and number of recipients |
|
Directors and executive officers of Sompo Japan |
|
17 |
|
|
Others (Note 1) |
|
|
|
24 |
|
|
|
| Number of stock options by types of shares (Shares) |
|
Common stock |
|
403,000 (Note 2) |
|
|
|
|
| Date of issue |
|
April 1, 2010 |
|
|
|
|
|
|
|
|
| Conditions to grant a right of stock options |
|
The right was granted on the date of issue |
|
|
|
|
|
|
|
|
| Length of services required |
|
– |
|
|
|
|
|
|
|
|
| Exercise period |
|
April 1, 2010 to June 27, 2017 |
|
|
|
|
|
|
|
|
| Exercise price (Yen) |
|
|
|
|
|
1,547 |
|
|
|
| Fair value per share as of the date of issue (Yen) |
|
|
|
379 (Note 3) |
Notes)
| 1 |
“Others” in the table represents recipients at the time of issue by Sompo Japan but who have already been retired as of the date of issue by NKSJ.
|
| 2 |
Number of stock options is indicated by converting to number of shares. |
| 3 |
Fair value per share at the time of issue by Sompo Japan is indicated in the table. |
38
Terms of Fourteenth Issue of Stock Acquisition Rights of NKSJ
|
|
|
|
|
|
|
| Title and number of recipients |
|
Directors and executive officers of Sompo Japan |
|
17 |
|
|
Others (Note 1) |
|
|
|
24 |
|
|
|
| Number of stock options by types of shares (Shares) |
|
Common stock |
|
382,000 (Note 2) |
|
|
|
|
| Date of issue |
|
April 1, 2010 |
|
|
|
|
|
|
|
|
| Conditions to grant a right of stock options |
|
The right was granted on the date of issue |
|
|
|
|
|
|
|
|
| Length of services required |
|
– |
|
|
|
|
|
|
|
|
| Exercise period |
|
April 1, 2010 to June 27, 2017 |
|
|
|
|
|
|
|
|
| Exercise price (Yen) |
|
|
|
|
|
990 |
|
|
|
| Fair value per share as of the date of issue (Yen) |
|
|
|
236 (Note 3) |
Notes)
| 1 |
“Others” in the table represents recipients at the time of issue by Sompo Japan but who have already been retired as of the date of issue by NKSJ.
|
| 2 |
Number of stock options is indicated by converting to number of shares. |
| 3 |
Fair value per share at the time of issue by Sompo Japan is indicated in the table. |
Terms of Fifteenth Issue of Stock
Acquisition Rights of NKSJ
|
|
|
|
|
|
|
| Title and number of recipients |
|
Directors and executive officers of Sompo Japan |
|
27 |
|
|
Others (Note 1) |
|
|
|
1 |
|
|
|
| Number of stock options by types of shares (Shares) |
|
Common stock |
|
297,300 (Note 2) |
|
|
|
|
| Date of issue |
|
April 1, 2010 |
|
|
|
|
|
|
|
|
| Conditions to grant a right of stock options |
|
The right was granted on the date of issue |
|
|
|
|
|
|
|
|
| Length of services required |
|
– |
|
|
|
|
|
|
|
|
| Exercise period |
|
April 1, 2010 to August 11, 2033 |
|
|
|
|
|
|
|
|
| Exercise price (Yen) |
|
|
|
|
|
1 |
|
|
|
| Fair value per share as of the date of issue (Yen) |
|
|
|
940 (Note 3) |
Notes)
| 1 |
“Others” in the table represents recipients at the time of issue by Sompo Japan but who have already been retired as of the date of issue by NKSJ.
|
| 2 |
Number of stock options is indicated by converting to number of shares. |
| 3 |
Fair value per share at the time of issue by Sompo Japan is indicated in the table. |
39
Terms of Sixteenth Issue of Stock Acquisition Rights of NKSJ
|
|
|
|
|
|
|
| Title and number of recipients |
|
Directors and executive officers of Sompo Japan |
|
41 |
|
|
Others (Note 1) |
|
|
|
1 |
| Number of stock options by types of shares (Shares) |
|
Common stock |
|
747,100 (Note 2) |
|
|
|
|
| Date of issue |
|
April 1, 2010 |
|
|
|
|
|
|
|
|
| Conditions to grant a right of stock options |
|
The right was granted on the date of issue |
|
|
|
|
|
|
|
|
| Length of services required |
|
– |
|
|
|
|
|
|
|
|
| Exercise period |
|
April 1, 2010 to August 10, 2034 |
|
|
|
|
|
|
|
|
| Exercise price (Yen) |
|
|
|
|
|
1 |
|
|
|
| Fair value per share as of the date of issue (Yen) |
|
|
|
623 (Note 3) |
Notes)
| 1 |
“Others” in the table represents recipients at the time of issue by Sompo Japan but who have already been retired as of the date of issue by NKSJ.
|
| 2 |
Number of stock options is indicated by converting to number of shares. |
| 3 |
Fair value per share at the time of issue by Sompo Japan is indicated in the table. |
[Stock options transferred from
NIPPONKOA to NKSJ]
Terms of Seventeenth Issue of Stock Acquisition Rights of NKSJ
|
|
|
|
|
|
|
| Title and number of recipients |
|
Directors and executive officers of NIPPONKOA |
|
5 |
|
|
Others (Note 1) |
|
|
|
7 |
|
|
|
| Number of stock options by types of shares (Shares) |
|
Common stock |
|
143,100 (Note 2) |
|
|
|
|
| Date of issue |
|
April 1, 2010 |
|
|
|
|
|
|
|
|
| Conditions to grant a right of stock options |
|
The right was granted on the date of issue |
|
|
|
|
|
|
|
|
| Length of services required |
|
– |
|
|
|
|
|
|
|
|
| Exercise period |
|
April 1, 2010 to June 29, 2024 |
|
|
|
|
|
|
|
|
| Exercise price (Yen) |
|
|
|
|
|
1 |
|
|
|
| Fair value per share as of the date of issue (Yen) |
|
|
|
596 |
Notes)
| 1 |
“Others” in the table represents recipients at the time of issue by NIPPONKOA but who have already been retired as of the date of issue by NKSJ.
|
| 2 |
Number of stock options is indicated by converting to number of shares. |
40
Terms of Eighteenth Issue of Stock Acquisition Rights of NKSJ
|
|
|
|
|
|
|
| Title and number of recipients |
|
Directors and executive officers of NIPPONKOA |
|
|
|
7 |
|
|
Others (Note 1) |
|
|
|
11 |
| Number of stock options by types of shares (Shares) |
|
Common stock |
|
201,600 (Note 2) |
|
|
|
|
| Date of issue |
|
April 1, 2010 |
|
|
|
|
|
|
|
|
| Conditions to grant a right of stock options |
|
The right was granted on the date of issue |
|
|
|
|
|
|
|
|
| Length of services required |
|
– |
|
|
|
|
|
|
|
|
| Exercise period |
|
April 1, 2010 to June 29, 2025 |
|
|
|
|
|
|
|
|
| Exercise price (Yen) |
|
|
|
|
|
1 |
|
|
|
| Fair value per share as of the date of issue (Yen) |
|
|
|
596 |
Notes)
| 1 |
“Others” in the table represents recipients at the time of issue by NIPPONKOA but who have already been retired as of the date of issue by NKSJ.
|
| 2 |
Number of stock options is indicated by converting to number of shares. |
Terms of Nineteenth Issue of Stock
Acquisition Rights of NKSJ
|
|
|
|
|
|
|
|
|
|
|
| Title and number of recipients |
|
Directors and executive officers of NIPPONKOA |
|
|
|
|
|
|
12 |
|
|
|
Others (Note 1) |
|
|
|
|
|
|
2 |
|
| Number of stock options by types of shares (Shares) |
|
Common stock |
|
|
110,700 (Note 2) |
|
|
|
|
|
| Date of issue |
|
April 1, 2010 |
|
|
|
|
|
|
|
|
|
|
|
|
| Conditions to grant a right of stock options |
|
The right was granted on the date of issue |
|
|
|
|
|
|
|
|
|
|
|
|
| Length of services required |
|
– |
|
|
|
|
|
|
|
|
|
|
|
|
| Exercise period |
|
April 1, 2010 to March 27, 2027 |
|
|
|
|
|
|
|
|
|
|
|
|
| Exercise price (Yen) |
|
|
|
|
|
|
|
|
1 |
|
|
|
|
| Fair value per share as of the date of issue (Yen) |
|
|
|
|
610 |
|
Notes)
| 1 |
“Others” in the table represents recipients at the time of issue by NIPPONKOA but who have already been retired as of the date of issue by NKSJ.
|
| 2 |
Number of stock options is indicated by converting to number of shares. |
41
Terms of Twentieth Issue of Stock Acquisition Rights of NKSJ
|
|
|
|
|
|
|
|
|
|
|
| Title and number of recipients |
|
Directors and executive officers of NIPPONKOA |
|
|
|
12 |
|
|
|
Others (Note 1) |
|
|
|
|
|
|
2 |
|
| Number of stock options by types of shares (Shares) |
|
Common stock |
|
|
121,500 (Note 2) |
|
|
|
|
|
| Date of issue |
|
April 1, 2010 |
|
|
|
|
|
|
|
|
|
|
|
|
| Conditions to grant a right of stock options |
|
The right was granted on the date of issue |
|
|
|
|
|
|
|
|
|
|
|
|
| Length of services required |
|
– |
|
|
|
|
|
|
|
|
|
|
|
|
| Exercise period |
|
April 1, 2010 to March 17, 2028 |
|
|
|
|
|
|
|
|
|
|
|
|
| Exercise price (Yen) |
|
|
|
|
|
|
|
|
1 |
|
|
|
|
| Fair value per share as of the date of issue (Yen) |
|
|
|
|
610 |
|
Notes)
| 1 |
“Others” in the table represents recipients at the time of issue by NIPPONKOA but who have already been retired as of the date of issue by NKSJ.
|
| 2 |
Number of stock options is indicated by converting to number of shares. |
Terms of Twenty-First Issue of Stock
Acquisition Rights of NKSJ
|
|
|
|
|
|
|
|
|
|
|
| Title and number of recipients |
|
Directors and executive officers of NIPPONKOA |
|
|
|
16 |
|
|
|
Others (Note 1) |
|
|
|
|
|
|
3 |
|
| Number of stock options by types of shares (Shares) |
|
Common stock |
|
|
247,500 (Note 2) |
|
|
|
|
|
| Date of issue |
|
April 1, 2010 |
|
|
|
|
|
|
|
|
|
|
|
|
| Conditions to grant a right of stock options |
|
The right was granted on the date of issue |
|
|
|
|
|
|
|
|
|
|
|
|
| Length of services required |
|
– |
|
|
|
|
|
|
|
|
|
|
|
|
| Exercise period |
|
April 1, 2010 to March 16, 2029 |
|
|
|
|
|
|
|
|
|
|
|
|
| Exercise price (Yen) |
|
|
|
|
|
|
|
|
1 |
|
|
|
|
| Fair value per share as of the date of issue (Yen) |
|
|
|
|
610 |
|
Notes)
| 1 |
“Others” in the table represents recipients at the time of issue by NIPPONKOA but who have already been retired as of the date of issue by NKSJ.
|
| 2 |
Number of stock options is indicated by converting to number of shares. |
42
Terms of Twenty-Second Issue of Stock Acquisition Rights of NKSJ
|
|
|
|
|
|
|
|
|
|
|
| Title and number of recipients |
|
Directors and executive officers of NIPPONKOA |
|
|
|
21 |
|
|
|
Others (Note 1) |
|
|
|
|
|
|
3 |
|
| Number of stock options by types of shares (Shares) |
|
Common stock |
|
|
353,700 (Note 2) |
|
|
|
|
|
| Date of issue |
|
April 1, 2010 |
|
|
|
|
|
|
|
|
|
|
|
|
| Conditions to grant a right of stock options |
|
The right was granted on the date of issue |
|
|
|
|
|
|
|
|
|
|
|
|
| Length of services required |
|
– |
|
|
|
|
|
|
|
|
|
|
|
|
| Exercise period |
|
April 1, 2010 to October 7, 2029 |
|
|
|
|
|
|
|
|
|
|
|
|
| Exercise price (Yen) |
|
|
|
|
|
|
|
|
1 |
|
|
|
|
| Fair value per share as of the date of issue (Yen) |
|
|
|
|
610 |
|
Notes)
| 1 |
“Others” in the table represents recipients at the time of issue by NIPPONKOA but who have already been retired as of the date of issue by NKSJ.
|
| 2 |
Number of stock options is indicated by converting to number of shares. |
[Stock options granted by NKSJ]
Terms of Twenty-Third Issue of Stock Acquisition Rights of NKSJ
|
|
|
|
|
|
|
|
|
|
|
| Title and number of recipients |
|
Directors and executive officers of NKSJ |
|
|
|
7 |
|
|
|
|
|
|
Directors and executive officers of Sompo Japan |
|
|
|
40 |
|
|
|
|
|
|
Directors and executive officers of NIPPONKOA |
|
|
|
26 |
|
|
|
(Note 1, 2) |
|
|
|
|
|
|
|
|
| Number of stock options by types of shares (Shares) |
|
Common stock |
|
|
1,397,800 (Note 3) |
|
|
|
|
|
| Date of issue |
|
August 16, 2010 |
|
|
|
|
|
|
|
|
|
|
|
|
| Conditions to grant a right of stock options |
|
The right was granted on the date of issue |
|
|
|
|
|
|
|
|
|
|
|
|
| Length of services required |
|
– |
|
|
|
|
|
|
|
|
|
|
|
|
| Exercise period |
|
August 17, 2010 to August 16, 2035 |
|
|
|
|
|
|
|
|
|
|
|
|
| Exercise price (Yen) |
|
|
|
|
|
|
|
|
1 |
|
|
|
| Fair value per share as of the date of issue (Yen) |
|
|
452 |
|
Notes)
| 1 |
“Directors” in the table excludes outside directors and non-full time directors. |
| 2 |
Since several directors and executive officers of NKSJ and Sompo Japan or NIPPONKOA hold positions concurrently at more than one of these companies, the actual number
of the persons whom the stock acquisition rights are granted is 69. |
| 3 |
Number of stock options is indicated by converting to number of shares. |
43
(Business combinations)
Six months ended September 30, 2010 (April 1 to September 30, 2010)
| (1) |
The name of acquiree and its type of business, reason for the business integration, date of integration, legal form of the integration, name of the controlling entity
after the integration, percentage of voting rights acquired and the primary reason for defining the acquirer |
| |
(a) |
The name of acquiree and its type of business |
NIPPONKOA Insurance Co., Ltd. :Property and casualty insurance business
| |
(b) |
Reason for the business integration |
In the face of the declining birthrate and aging society—the significant challenges Japan faces in the medium to long-term period—as well as of increased risks associated with depopulating
society, deteriorating global climate change, and in response to the diversified consumer demands amidst the individuals’ lifestyle changes, companies are urged to take proper actions and contribute to social safety and to customers’ sense
of security.
Based on this shared perspective, Sompo Japan Insurance Inc. (Sompo Japan) and NIPPONKOA Insurance Co., Ltd.
(Nipponkoa) decided to establish a—new solution service group which provides customers with security and service of the highest quality and contribute to social welfare, while sharing as a unitary group the strengths nurtured through 120 years
of their respective history.
April, 1,
2010
| |
(d) |
Legal form of the integration |
Share exchange
| |
(e) |
Name of the controlling entity after the integration |
NKSJ Holdings, Inc.
| |
(f) |
Percentage of voting rights acquired |
100%
| |
(g) |
The primary reason for defining the acquiror |
Sompo Japan was defined as the acquiror based on relative ownership percentage of voting rights in general.
| (2) |
The business term of the acquiree included in the interim consolidated financial statements |
From April 1, 2010 to September 30, 2010
| (3) |
Acquisition cost with details of the acquiree |
|
|
|
|
|
|
|
|
|
|
|
| Purchase price |
|
|
444,248 million yen |
|
|
|
|
|
|
|
| Amount of stock acquisition rights |
|
|
713 million yen |
|
|
|
|
|
|
|
|
|
|
|
|
|
|
|
|
|
|
| Total |
|
|
444,962 million yen |
|
|
|
|
|
|
|
44
| (4) |
Share exchange ratio, basis of calculation for the share exchange and the number of shares to be allotted |
One share
of common stock of NKSJ Holdings, Inc. (NKSJ) was allotted and delivered for each share of common stock of Sompo Japan, and 0.9 shares of common stock of NKSJ were allotted and delivered for each share of common stock of Nipponkoa.
| |
(b) |
Basis of calculation for the allotment in relation to the share exchange |
In order to ensure the fairness of the share exchange ratio to be used in the share exchange, Sompo Japan appointed Nomura Securities Co., Ltd., Mizuho Securities Co., Ltd. and Goldman Sachs Japan Co.,
Ltd., and Nipponkoa appointed Merrill Lynch Japan Securities Co., Ltd. and Mitsubishi UFJ Securities Co., Ltd. to calculate the share exchange ratio. Based on the calculation results and a comprehensive consideration of the financial conditions,
asset conditions and future outlook of the Parties, Sompo Japan and Nipponkoa engaged in careful deliberation concerning the share exchange ratio. The Parties concluded and agreed that the share exchange ratio mentioned above is appropriate.
| |
(c) |
Number of shares to be allotted |
|
|
|
| Sompo Japan |
|
984,055,299 shares |
| Nipponkoa |
|
677,207,979 shares |
| |
(a) |
Amount of negative goodwill |
149
million yen
| |
(b) |
Reason for recognizing negative goodwill |
The net amounts of assets acquired and liabilities assumed on the day of business integration exceeded the amount of investment based on evaluation of entity.
| (6) |
Amounts of assets acquired and liabilities assumed on the day of business integration |
|
|
|
| Total assets: |
|
3,064,910 million yen |
| Securities |
|
2,180,871 million yen |
| Total liabilities: |
|
2,619,450 million yen |
| Underwriting funds |
|
2,482,288 million yen |
45
| (1) |
The name of acquiree and its type of business, reason for the business integration, date of integration, legal form of the integration, name of the controlling entity
after the integration, percentage of voting rights acquired and the primary reason for defining the acquiror |
| |
(a) |
The name of acquiree and its type of business |
Tenet Insurance Company Limited (Tenet) :Property and casualty insurance business
| |
(b) |
Reason for the business integration |
Through the acquisition of Tenet, Sompo Japan Group plans to further strengthen its solid platform and expand its operations in Singapore and Southeast Asia.
May, 31,
2010
| |
(d) |
Legal form of the integration |
Acquisition of shares by cash
| |
(e) |
Name of the controlling entity after the integration |
Tenet Insurance Company Limited
| |
(f) |
Percentage of voting rights acquired |
100%
| |
(g) |
The primary reason for defining the acquiror |
Sompo Japan was defined as the acquiror because Sompo Japan acquired shares of Tenet by cash.
| (2) |
The business term of the acquiree included in the interim consolidated financial statements |
From June 1, 2010 to June 30, 2010
| (3) |
Acquisition cost with details of the acquiree |
|
|
|
|
|
|
|
| Purchase price |
|
|
97 million Singapore dollar |
|
|
|
| Direct cost for the acquisition |
|
|
2 million Singapore dollar |
|
|
|
|
|
|
|
|
|
|
| Total |
|
|
99 million Singapore dollar |
|
|
|
39 million Singapore dollar
| |
(b) |
Reason for recognizing goodwill |
The acquisition cost exceeded the net amounts of assets acquired and liabilities assumed on the day of business integration.
| |
(c) |
Method and term of amortization |
Straight-line amortization in 20 years
| (5) |
Amounts of assets acquired and liabilities assumed on the day of business integration |
|
|
|
|
|
| Total assets: |
|
122 million Singapore dollar |
|
|
| Deposits |
|
72 million Singapore dollar |
|
|
| Total liabilities: |
|
62 million Singapore dollar |
|
|
| Underwriting funds |
|
55 million Singapore dollar |
|
|
46
(Segment information)
[Segment information]
Six months ended September 30, 2010 (April 1 to September 30,
2010)
| 1 |
Summary of reportable segments |
The reportable segment of NKSJ Holdings, Inc. (NKSJ) is the component of our company, for which discrete financial information is
available, and whose operating results are regularly reviewed by the board of directors to make decisions about resources to be allocated to the segment and assess its performance.
The respective group companies of NKSJ determine their comprehensive strategies for their operations as independent management unit and
roll out their operations under the group-wide management policy of NKSJ.
Therefore, NKSJ is composed of the business segments
which include the respective group companies as a minimum component, and “Property and casualty insurance business” and “Life insurance business” are determined as the reportable segments. NKSJ and other operations which are not
covered by the reportable segments, are included in “Others”. The major companies which constitute each reportable segment and “Others” are listed below.
“Property and casualty insurance business” conducts underwriting of property and casualty insurance and related investment activities. “Life insurance business” conducts underwriting
of life insurance and related investment activities.
|
|
|
| |
|
Major companies |
|
|
| Reportable segments |
|
|
|
|
| Property and casualty insurance business |
|
Sompo Japan Insurance Inc.
NIPPONKOA Insurance Co., Ltd. Sonpo 24 Insurance Co., Ltd.
Saison Automobile and Fire Insurance Company, Limited
Sompo Japan Insurance Company of America
Sompo Japan Insurance Company of Europe Limited
Yasuda Seguros S.A. |
|
|
| Life insurance business |
|
Sompo Japan Himawari Life Insurance Co., Ltd.
NIPPONKOA Life Insurance Co., Ltd.
Sompo Japan DIY Life Insurance Co., Ltd. |
|
|
| Others |
|
NKSJ Holdings, Inc.
Sompo Japan DC Securities Co., Ltd.
Healthcare Frontier Japan Inc.
Sompo Japan Asset Management Co., Ltd.
Yasuda Enterprise Development Co., Ltd. |
| 2 |
Calculation methods for the amount of sales, net income or loss, assets and other items by each reportable segment |
The accounting methods of reportable business segments are the same methods as that mentioned in “Significant Accounting Policies for
the Preparation of the Interim Consolidated Financial Statements”. Net income or loss attributable to the reportable segments is the amounts based on net income in the interim consolidated statements of income.
Income arising from internal segment is based on the price of transactions among third parties.
47
| 3 |
Information related to the amount of sales, net income or loss, assets and other items by each reportable segment |
|
|
|
|
|
|
|
|
|
|
|
|
|
|
|
|
|
|
|
|
|
|
|
|
|
|
|
|
|
| |
|
(Millions of yen) |
|
| |
|
Reportable segments |
|
|
Others
(Note
2) |
|
|
Total |
|
|
Adjustment
(Note
3) |
|
|
Carrying
amount
on
the
interim
consolidated
financial
statements
(Note
4) |
|
| |
Property
and
casualty
insurance
business |
|
|
Life
insurance
business |
|
|
Total |
|
|
|
|
|
| Sales (Note 1) |
|
|
|
|
|
|
|
|
|
|
|
|
|
|
|
|
|
|
|
|
|
|
|
|
|
|
|
|
| Sales from transactions with external customers |
|
|
987,832 |
|
|
|
108,905 |
|
|
|
1,096,738 |
|
|
|
2,335 |
|
|
|
1,099,074 |
|
|
|
230,724 |
|
|
|
1,329,799 |
|
| Sales arising from internal segment |
|
|
— |
|
|
|
— |
|
|
|
— |
|
|
|
1,485 |
|
|
|
1,485 |
|
|
|
(1,485 |
) |
|
|
— |
|
|
|
|
|
|
|
|
|
|
|
|
|
|
|
|
|
|
|
|
|
|
|
|
|
|
|
|
|
|
| Total |
|
|
987,832 |
|
|
|
108,905 |
|
|
|
1,096,738 |
|
|
|
3,821 |
|
|
|
1,100,560 |
|
|
|
229,238 |
|
|
|
1,329,799 |
|
|
|
|
|
|
|
|
|
|
|
|
|
|
|
|
|
|
|
|
|
|
|
|
|
|
|
|
|
|
| Net income (loss) attributable to segment |
|
|
27,617 |
|
|
|
(2,379 |
) |
|
|
25,237 |
|
|
|
(1,121 |
) |
|
|
24,116 |
|
|
|
— |
|
|
|
24,116 |
|
|
|
|
|
|
|
|
|
|
|
|
|
|
|
|
|
|
|
|
|
|
|
|
|
|
|
|
|
|
| Assets attributable to segment |
|
|
7,346,334 |
|
|
|
1,671,397 |
|
|
|
9,017,732 |
|
|
|
9,091 |
|
|
|
9,026,824 |
|
|
|
— |
|
|
|
9,026,824 |
|
|
|
|
|
|
|
|
|
|
|
|
|
|
|
|
|
|
|
|
|
|
|
|
|
|
|
|
|
|
| Other items |
|
|
|
|
|
|
|
|
|
|
|
|
|
|
|
|
|
|
|
|
|
|
|
|
|
|
|
|
| Depreciation expenses |
|
|
8,853 |
|
|
|
629 |
|
|
|
9,482 |
|
|
|
127 |
|
|
|
9,610 |
|
|
|
— |
|
|
|
9,610 |
|
| Amortization of goodwill |
|
|
31 |
|
|
|
936 |
|
|
|
967 |
|
|
|
— |
|
|
|
967 |
|
|
|
— |
|
|
|
967 |
|
| Interest and dividend income |
|
|
65,232 |
|
|
|
13,535 |
|
|
|
78,767 |
|
|
|
1 |
|
|
|
78,768 |
|
|
|
(314 |
) |
|
|
78,453 |
|
| Interest paid |
|
|
3,571 |
|
|
|
46 |
|
|
|
3,617 |
|
|
|
5 |
|
|
|
3,623 |
|
|
|
(4 |
) |
|
|
3,619 |
|
| Investment gains (losses) on the equity method |
|
|
(129 |
) |
|
|
— |
|
|
|
(129 |
) |
|
|
0 |
|
|
|
(128 |
) |
|
|
— |
|
|
|
(128 |
) |
| Extraordinary gains: |
|
|
2,025 |
|
|
|
— |
|
|
|
2,025 |
|
|
|
— |
|
|
|
2,025 |
|
|
|
(10 |
) |
|
|
2,015 |
|
| Gains on negative goodwill |
|
|
149 |
|
|
|
— |
|
|
|
149 |
|
|
|
— |
|
|
|
149 |
|
|
|
— |
|
|
|
149 |
|
| Extraordinary losses: |
|
|
4,438 |
|
|
|
493 |
|
|
|
4,932 |
|
|
|
1 |
|
|
|
4,934 |
|
|
|
(10 |
) |
|
|
4,923 |
|
| Impairment losses |
|
|
662 |
|
|
|
— |
|
|
|
662 |
|
|
|
— |
|
|
|
662 |
|
|
|
— |
|
|
|
662 |
|
| Income tax expense |
|
|
12,524 |
|
|
|
(491 |
) |
|
|
12,032 |
|
|
|
10 |
|
|
|
12,043 |
|
|
|
— |
|
|
|
12,043 |
|
| Investment in affiliates accounted for under the equity method |
|
|
19,127 |
|
|
|
— |
|
|
|
19,127 |
|
|
|
1,159 |
|
|
|
20,286 |
|
|
|
— |
|
|
|
20,286 |
|
| Increase in tangible fixed assets and intangible fixed assets |
|
|
7,788 |
|
|
|
1,446 |
|
|
|
9,235 |
|
|
|
353 |
|
|
|
9,588 |
|
|
|
— |
|
|
|
9,588 |
|
|
|
|
|
|
| Notes) |
|
|
|
|
| 1 The definitions of sales are as follows. |
|
|
| Property and casualty insurance business: |
|
Net premiums written |
| Life insurance business: |
|
Life insurance premiums written |
| “Others” and carrying amount on the interim consolidated financial
statements: |
|
Ordinary income |
| 2 “Others” is business segments
which are not included in reportable segments. It includes other operations. |
| 3 Adjustments of sales are as
follows. |
| Elimination of transactions arising from internal segment: |
|
(1,485) million yen |
| Ordinary income related to property and casualty insurance business and life
insurance business excluding net premiums written and life insurance premiums written: |
|
230,724 million yen |
| 4 Net income or loss attributable to
segment is adjusted to net income in the interim consolidated statements of income. |
48
[Related information]
Six months ended September 30, 2010 (April 1 to September 30, 2010)
| 1 |
Information by products and services |
| |
(1) |
Property and casualty insurance business |
|
|
|
|
|
|
|
|
|
|
|
|
|
|
|
|
|
|
|
|
|
|
|
|
|
|
|
|
|
| |
|
(Millions of yen) |
|
| |
|
Fire and
allied
insurance |
|
|
Marine
insurance |
|
|
Personal
accident
insurance |
|
|
Voluntary
automobile
insurance |
|
|
Compulsory
automobile
liability
insurance |
|
|
Others |
|
|
Total |
|
| Sales from transactions with external customers |
|
|
114,169 |
|
|
|
23,893 |
|
|
|
96,874 |
|
|
|
490,656 |
|
|
|
124,069 |
|
|
|
138,170 |
|
|
|
987,832 |
|
Note) Sales represent amounts of net premiums written.
| |
(2) |
Life insurance business |
|
|
|
|
|
|
|
|
|
|
|
|
|
|
|
|
|
|
|
|
|
| |
|
(Millions of yen) |
|
| |
|
Individual
insurance |
|
|
Individual
annuities |
|
|
Group
insurance |
|
|
Group
annuities |
|
|
Total |
|
| Sales from transactions with external customers |
|
|
98,589 |
|
|
|
5,178 |
|
|
|
5,138 |
|
|
|
— |
|
|
|
108,905 |
|
Note) Sales represent amounts of life insurance premiums written.
| 2 |
Information by geographic area |
Geographic information is
omitted because sales from transactions with external customers attributed to Japan constitute more than 90 percent of sales in the interim consolidated statements of income.
| |
(2) |
Tangible fixed assets |
Geographic information is omitted because tangible fixed assets located in Japan constitute more than 90 percent of tangible fixed assets
in the interim consolidated balance sheets.
| 3 |
Information by major customers |
None.
49
[Information related to impairment losses on fixed assets by reportable segments]
Six months ended September 30, 2010 (April 1 to September 30, 2010)
|
|
|
|
|
|
|
|
|
|
|
|
|
|
|
|
|
|
|
|
|
|
|
|
|
| |
|
(Millions of yen) |
|
| |
|
Reportable segments |
|
|
Others |
|
|
Unallocated
amounts
and
eliminations |
|
|
Total |
|
| |
Property
and
casualty
insurance
business |
|
|
Life
insurance
business |
|
|
Total |
|
|
|
|
| Impairment losses |
|
|
662 |
|
|
|
— |
|
|
|
662 |
|
|
|
— |
|
|
|
— |
|
|
|
662 |
|
[Information related to amortization
of goodwill and balance of goodwill by reportable segments]
Six months ended September 30, 2010 (April 1 to September 30, 2010)
|
|
|
|
|
|
|
|
|
|
|
|
|
|
|
|
|
|
|
|
|
|
|
|
|
| |
|
(Millions of yen) |
|
| |
|
Reportable segments |
|
|
Others |
|
|
Unallocated
amounts
and
eliminations |
|
|
Total |
|
| |
Property
and
casualty
insurance
business |
|
|
Life
insurance
business |
|
|
Total |
|
|
|
|
| Amortization for the six months ended September 30, 2010 |
|
|
31 |
|
|
|
936 |
|
|
|
967 |
|
|
|
— |
|
|
|
— |
|
|
|
967 |
|
| Balance as of September 30, 2010 |
|
|
2,429 |
|
|
|
20,288 |
|
|
|
22,718 |
|
|
|
— |
|
|
|
— |
|
|
|
22,718 |
|
[Information related to gains on
negative goodwill by reportable segments]
Six months ended September 30, 2010 (April 1 to September 30, 2010)
|
|
|
|
|
|
|
|
|
|
|
|
|
|
|
|
|
|
|
|
|
|
|
|
|
| |
|
(Millions of yen) |
|
| |
|
Reportable segments |
|
|
Others |
|
|
Unallocated
amounts
and
eliminations |
|
|
Total |
|
| |
Property
and
casualty
insurance
business |
|
|
Life
insurance
business |
|
|
Total |
|
|
|
|
| Gains on negative goodwill |
|
|
149 |
|
|
|
— |
|
|
|
149 |
|
|
|
— |
|
|
|
— |
|
|
|
149 |
|
Outline of events resulting in
recognition of gains on negative goodwill
Property and casualty insurance business:
As mentioned in “Business Combinations”, Sompo Japan Insurance Inc., which was defined as the acquirer, acquired NIPPONKOA
Insurance Co., Ltd. through share exchange, and NKSJ Holdings, Inc. was established as a joint holding company as of April 1, 2010.
50
(Per share information)
|
|
|
|
|
| |
|
Six months ended September 30, 2010 |
|
| |
|
(April 1 to September 30, 2010) |
|
| Total net assets per share |
|
|
673.01 yen |
|
| Net income per share—Basic |
|
|
14.52 yen |
|
| Net income per share—Diluted |
|
|
14.50 yen |
|
Notes)
| 1 |
Calculation of basic net income per share and diluted net income per share is based on the following figures. |
|
|
|
| |
|
(Millions of yen) |
| |
|
Six months ended September 30, 2010
(April 1 to September 30, 2010) |
| Net income per share—Basic |
|
|
| Net income |
|
24,116 |
| Net income not attributable to common stockholders |
|
— |
| Net income attributable to common stocks |
|
24,116 |
| Average number of common stocks outstanding |
|
thousand shares 1,660,781 |
| Net income per share—Diluted |
|
|
| Adjustment of net income |
|
— |
| Increase of common stocks: |
|
thousand shares 2,306 |
| Stock acquisition rights |
|
thousand shares 2,306 |
| Outline of dilutive shares which are not included in the calculation of diluted net income per share because they do not have
dilutive effect |
|
Stock acquisition rights: 14 types
Number of dilutive shares: 3,020,000 shares |
| 2 |
Calculation of total net assets per share is based on the following figures. |
|
|
|
|
|
| |
|
(Millions of yen) |
|
| |
|
As of September 30, 2010 |
|
| Total net assets |
|
|
1,122,876 |
|
| Amount to be deducted from total net assets: |
|
|
(5,336 |
) |
| Stock acquisition rights |
|
|
(2,362 |
) |
| Non-controlling interests |
|
|
(2,973 |
) |
| Total net assets attributable to common stocks |
|
|
1,117,540 |
|
| Number of common stocks used for calculation of total net assets per share |
|
|
thousand shares
1,660,501 |
|
51
(Significant subsequent events)
None.
52
| (1) |
Quarterly Consolidated Statements of Income for the Second Quarter Consolidated Accounting Period |
The interim audit and the quarterly review of the quarterly consolidated statements of income for the second quarter consolidated
accounting period are not carried out, since NKSJ Holdings, Inc. conducts business defined in the provision of Article17-15 Paragraph 2 of the Cabinet Office Ordinance on Disclosure of Corporate Information, etc.
|
|
|
|
|
| |
|
(Millions of yen) |
|
| |
|
Three months ended
September 30, 2010
(July 1 to
September 30, 2010) |
|
| Ordinary income: |
|
|
666,352 |
|
| Underwriting income: |
|
|
641,911 |
|
| Net premiums written |
|
|
482,881 |
|
| Deposits of premiums by policyholders |
|
|
40,251 |
|
| Interest and dividend income on deposits of premiums, etc. |
|
|
14,886 |
|
| Life insurance premiums written |
|
|
60,820 |
|
| Reversal of reserve for outstanding losses and claims |
|
|
24,641 |
|
| Reversal of underwriting reserves |
|
|
16,454 |
|
| Investment income: |
|
|
21,750 |
|
| Interest and dividend income |
|
|
34,488 |
|
| Investment gains on money trusts |
|
|
527 |
|
| Investment gains on trading securities |
|
|
35 |
|
| Gains on sales of securities |
|
|
3,155 |
|
| Transfer of interest and dividend income on deposits of premiums, etc. |
|
|
(14,886 |
) |
| Other ordinary income |
|
|
2,690 |
|
| Ordinary expenses: |
|
|
650,829 |
|
| Underwriting expenses: |
|
|
529,409 |
|
| Net claims paid |
|
|
315,565 |
|
| Loss adjustment expenses |
|
|
32,421 |
|
| Net commissions and brokerage fees |
|
|
85,743 |
|
| Maturity refunds to policyholders |
|
|
96,352 |
|
| Life insurance claims paid |
|
|
14,568 |
|
| Provision for underwriting reserves |
|
|
(16,475 |
) |
| Investment expenses: |
|
|
12,418 |
|
| Investment losses on money trusts |
|
|
82 |
|
| Losses on sales of securities |
|
|
853 |
|
| Impairment losses on securities |
|
|
1,904 |
|
| Operating, general and administrative expenses |
|
|
106,464 |
|
| Other ordinary expenses: |
|
|
2,538 |
|
| Interest paid |
|
|
1,826 |
|
|
|
|
|
|
| Ordinary profit |
|
|
15,522 |
|
|
|
|
|
|
| Extraordinary gains: |
|
|
26 |
|
| Gains on disposal of fixed assets |
|
|
26 |
|
| Extraordinary losses: |
|
|
1,451 |
|
| Losses on disposal of fixed assets |
|
|
193 |
|
| Impairment losses |
|
|
625 |
|
| Provision for reserves under the special laws: |
|
|
479 |
|
| Provision for reserve for price fluctuation |
|
|
479 |
|
| Other extraordinary losses |
|
|
153 |
|
|
|
|
|
|
| Income before income taxes and non-controlling interests |
|
|
14,096 |
|
|
|
|
|
|
| Income taxes |
|
|
3,515 |
|
|
|
|
|
|
| Income before non-controlling interests |
|
|
10,581 |
|
|
|
|
|
|
| Non-controlling interests |
|
|
(112 |
) |
|
|
|
|
|
| Net income |
|
|
10,693 |
|
|
|
|
|
|
| Note) |
The above figures represent amounts deducting amounts of the quarterly consolidated statements of income for the first quarter consolidated accounting period from
amounts of the interim consolidated statements of income. |
53
(Segment information)
[Segment information]
| 1 |
Information related to the amount of sales and net income or loss by each reportable segment |
Three months ended September 30, 2010 (July 1 to September 30, 2010)
|
|
|
|
|
|
|
|
|
|
|
|
|
|
|
|
|
|
|
|
|
|
|
|
|
|
|
|
|
| |
|
(Millions of yen) |
|
| |
|
Reportable segments |
|
|
Others
(Note
2) |
|
|
Total |
|
|
Adjustment
(Note
3) |
|
|
Carrying
amount
on
the
quarterly
consolidated
statements
of
income
(Note 4) |
|
| |
Property
and
casualty
insurance
business |
|
|
Life
insurance
business |
|
|
Total |
|
|
|
|
|
| Sales (Note 1) |
|
|
|
|
|
|
|
|
|
|
|
|
|
|
|
|
|
|
|
|
|
|
|
|
|
|
|
|
| Sales from transactions with external customers |
|
|
482,881 |
|
|
|
60,820 |
|
|
|
543,701 |
|
|
|
1,174 |
|
|
|
544,875 |
|
|
|
121,477 |
|
|
|
666,352 |
|
| Sales arising from internal segment |
|
|
— |
|
|
|
— |
|
|
|
— |
|
|
|
716 |
|
|
|
716 |
|
|
|
(716 |
) |
|
|
— |
|
|
|
|
|
|
|
|
|
|
|
|
|
|
|
|
|
|
|
|
|
|
|
|
|
|
|
|
|
|
| Total |
|
|
482,881 |
|
|
|
60,820 |
|
|
|
543,701 |
|
|
|
1,890 |
|
|
|
545,592 |
|
|
|
120,760 |
|
|
|
666,352 |
|
|
|
|
|
|
|
|
|
|
|
|
|
|
|
|
|
|
|
|
|
|
|
|
|
|
|
|
|
|
| Net income (loss) attributable to segment |
|
|
12,574 |
|
|
|
(1,692 |
) |
|
|
10,882 |
|
|
|
(188 |
) |
|
|
10,693 |
|
|
|
— |
|
|
|
10,693 |
|
|
|
|
|
|
|
|
|
|
|
|
|
|
|
|
|
|
|
|
|
|
|
|
|
|
|
|
|
|
|
|
|
|
|
| Notes) |
|
|
|
|
| 1 The definitions of sales are as follows. |
|
|
| Property and casualty insurance business: |
|
Net premiums written |
| Life insurance business: |
|
Life insurance premiums written |
| “Others” and carrying amount on the quarterly consolidated statements of income: |
|
Ordinary income |
| 2 “Others” is business segments which are not included in
reportable segments. It includes other operations. |
| 3 Adjustments of sales are as follows. |
| Elimination of transactions arising from internal segment: |
|
(716) million yen |
| Ordinary income related to property and casualty insurance business and life insurance business excluding net
premiums written and life insurance premiums written: |
|
121,477 million yen |
| 4 Net income or loss attributable to segment is adjusted to net income in
the quarterly consolidated statements of income. |
54
(Per share information)
|
|
|
|
|
| |
|
Three months ended September 30, 2010
(July 1 to September 30,
2010) |
|
| Net income per share—Basic |
|
|
6.44 yen |
|
| Net income per share—Diluted |
|
|
6.43 yen |
|
Note) Calculation of basic net income
per share and diluted net income per share is based on the following figures.
|
|
|
|
|
| |
|
(Millions of yen) |
|
| |
|
Three months ended September 30, 2010
(July 1 to September 30,
2010) |
|
| (1) Net income per share—Basic |
|
|
|
|
| Net income |
|
|
10,693 |
|
| Net income not attributable to common stockholders |
|
|
— |
|
| Net income attributable to common stocks |
|
|
10,693 |
|
| Average number of common stocks outstanding |
|
|
thousand shares
1,660,470 |
|
| (2) Net income per share—Diluted |
|
|
|
|
| Adjustment of net income |
|
|
— |
|
| Increase of common stocks |
|
|
thousand shares
2,539 |
|
55
None.
56
| 3. |
Interim Financial Statements (Non-consolidated) |
| (1) |
Interim Balance Sheets (Non-consolidated) |
|
|
|
|
|
|
|
|
|
| |
|
|
|
|
(Millions of yen) |
|
| |
|
|
|
|
As of September 30, 2010 |
|
| Assets: |
|
|
|
|
|
|
|
|
| Current assets: |
|
|
|
|
|
|
|
|
| Cash and bank deposits |
|
|
|
|
|
|
2,269 |
|
| Accounts receivable |
|
|
|
|
|
|
240 |
|
|
|
|
|
|
|
|
|
|
| Total current assets |
|
|
|
|
|
|
2,509 |
|
|
|
|
|
|
|
|
|
|
| Fixed assets: |
|
|
|
|
|
|
|
|
| Tangible fixed assets |
|
|
*1 |
|
|
|
275 |
|
| Investments and other assets: |
|
|
|
|
|
|
|
|
| Investments in subsidiaries and affiliates |
|
|
|
|
|
|
878,799 |
|
| Others |
|
|
|
|
|
|
67 |
|
|
|
|
|
|
|
|
|
|
| Total investments and other assets |
|
|
|
|
|
|
878,866 |
|
|
|
|
|
|
|
|
|
|
| Total fixed assets |
|
|
|
|
|
|
879,142 |
|
|
|
|
|
|
|
|
|
|
| Total assets |
|
|
|
|
|
|
881,652 |
|
|
|
|
|
|
|
|
|
|
| Liabilities: |
|
|
|
|
|
|
|
|
| Current liabilities: |
|
|
|
|
|
|
|
|
| Short-term borrowings |
|
|
|
|
|
|
2,200 |
|
| Income taxes payable |
|
|
|
|
|
|
7 |
|
| Reserve for bonus payments |
|
|
|
|
|
|
104 |
|
| Others |
|
|
|
|
|
|
123 |
|
|
|
|
|
|
|
|
|
|
| Total current liabilities |
|
|
|
|
|
|
2,435 |
|
|
|
|
|
|
|
|
|
|
| Total liabilities |
|
|
|
|
|
|
2,435 |
|
|
|
|
|
|
|
|
|
|
| Net assets: |
|
|
|
|
|
|
|
|
| Shareholders’ equity: |
|
|
|
|
|
|
|
|
| Common stock |
|
|
|
|
|
|
100,045 |
|
| Capital surplus: |
|
|
|
|
|
|
|
|
| Capital reserves |
|
|
|
|
|
|
25,045 |
|
| Other capital surplus |
|
|
|
|
|
|
751,814 |
|
|
|
|
|
|
|
|
|
|
| Total capital surplus |
|
|
|
|
|
|
776,859 |
|
|
|
|
|
|
|
|
|
|
| Retained earnings: |
|
|
|
|
|
|
|
|
| Other retained earnings: |
|
|
|
|
|
|
|
|
| Retained earnings carried forward |
|
|
|
|
|
|
476 |
|
|
|
|
|
|
|
|
|
|
| Total retained earnings |
|
|
|
|
|
|
476 |
|
|
|
|
|
|
|
|
|
|
| Treasury stock |
|
|
|
|
|
|
(527 |
) |
|
|
|
|
|
|
|
|
|
| Total shareholders’ equity |
|
|
|
|
|
|
876,854 |
|
|
|
|
|
|
|
|
|
|
| Stock acquisition rights |
|
|
|
|
|
|
2,362 |
|
|
|
|
|
|
|
|
|
|
| Total net assets |
|
|
|
|
|
|
879,217 |
|
|
|
|
|
|
|
|
|
|
| Total liabilities and net assets |
|
|
|
|
|
|
881,652 |
|
|
|
|
|
|
|
|
|
|
57
| (2) |
Interim Statements of Income (Non-consolidated) |
|
|
|
|
|
|
|
|
|
| |
|
|
|
|
(Millions of yen) |
|
| |
|
|
|
|
Six months ended
September 30, 2010
(April 1
to
September 30, 2010) |
|
| Operating income: |
|
|
|
|
|
|
|
|
| Dividends received from subsidiaries and affiliates |
|
|
|
|
|
|
1,200 |
|
| Fees received from subsidiaries and affiliates |
|
|
|
|
|
|
1,223 |
|
|
|
|
|
|
|
|
|
|
| Total operating income |
|
|
|
|
|
|
2,423 |
|
|
|
|
|
|
|
|
|
|
| Operating expenses: |
|
|
|
|
|
|
|
|
| Operating, general and administrative expenses |
|
|
*1 |
|
|
|
1,235 |
|
|
|
|
|
|
|
|
|
|
| Total operating expenses |
|
|
|
|
|
|
1,235 |
|
|
|
|
|
|
|
|
|
|
| Operating profit |
|
|
|
|
|
|
1,187 |
|
|
|
|
|
|
|
|
|
|
| Non-operating income |
|
|
|
|
|
|
0 |
|
| Non-operating expenses: |
|
|
|
|
|
|
|
|
| Amortization of establishment costs |
|
|
|
|
|
|
704 |
|
| Others |
|
|
|
|
|
|
4 |
|
|
|
|
|
|
|
|
|
|
| Total non-operating expenses |
|
|
|
|
|
|
709 |
|
|
|
|
|
|
|
|
|
|
| Ordinary profit |
|
|
|
|
|
|
478 |
|
|
|
|
|
|
|
|
|
|
| Income before income taxes |
|
|
|
|
|
|
478 |
|
|
|
|
|
|
|
|
|
|
| Income taxes |
|
|
|
|
|
|
1 |
|
|
|
|
|
|
|
|
|
|
| Total income taxes |
|
|
|
|
|
|
1 |
|
|
|
|
|
|
|
|
|
|
| Net income |
|
|
|
|
|
|
476 |
|
|
|
|
|
|
|
|
|
|
58
| (3) |
Interim Statements of Changes in Net Assets (Non-consolidated) |
|
|
|
|
|
| |
|
(Millions of yen) |
|
| |
|
Six months ended
September 30, 2010
(April 1 to
September 30, 2010) |
|
| Shareholders’ equity: |
|
|
|
|
| Common stock: |
|
|
|
|
| Balance at the beginning of the period |
|
|
— |
|
| Changes during the period |
|
|
|
|
| Issuance of new stocks - exercise of stock acquisition rights |
|
|
45 |
|
| Increase due to share exchange |
|
|
100,000 |
|
|
|
|
|
|
| Total changes during the period |
|
|
100,045 |
|
|
|
|
|
|
| Balance at the end of the period |
|
|
100,045 |
|
|
|
|
|
|
| Capital surplus: |
|
|
|
|
| Capital reserves |
|
|
|
|
| Balance at the beginning of the period |
|
|
— |
|
| Changes during the period |
|
|
|
|
| Issuance of new stocks - exercise of stock acquisition rights |
|
|
45 |
|
| Increase due to share exchange |
|
|
25,000 |
|
|
|
|
|
|
| Total changes during the period |
|
|
25,045 |
|
|
|
|
|
|
| Balance at the end of the period |
|
|
25,045 |
|
|
|
|
|
|
| Other capital surplus: |
|
|
|
|
| Balance at the beginning of the period |
|
|
— |
|
| Changes during the period |
|
|
|
|
| Disposal of treasury stock |
|
|
31 |
|
| Increase due to share exchange |
|
|
751,782 |
|
|
|
|
|
|
| Total changes during the period |
|
|
751,814 |
|
|
|
|
|
|
| Balance at the end of the period |
|
|
751,814 |
|
|
|
|
|
|
| Retained earnings: |
|
|
|
|
| Other retained earnings: |
|
|
|
|
| Retained earnings carried forward: |
|
|
|
|
| Balance at the beginning of the period |
|
|
— |
|
| Changes during the period |
|
|
|
|
| Net income |
|
|
476 |
|
|
|
|
|
|
| Total changes during the period |
|
|
476 |
|
|
|
|
|
|
| Balance at the end of the period |
|
|
476 |
|
|
|
|
|
|
| Treasury stock: |
|
|
|
|
| Balance at the beginning of the period |
|
|
— |
|
| Changes during the period |
|
|
|
|
| Acquisition of treasury stock |
|
|
(708 |
) |
| Disposal of treasury stock |
|
|
180 |
|
|
|
|
|
|
| Total changes during the period |
|
|
(527 |
) |
|
|
|
|
|
| Balance at the end of the period |
|
|
(527 |
) |
|
|
|
|
|
| Total shareholders’ equity: |
|
|
|
|
| Balance at the beginning of the period |
|
|
— |
|
| Changes during the period |
|
|
|
|
| Issuance of new stocks - exercise of stock acquisition rights |
|
|
91 |
|
| Net income |
|
|
476 |
|
| Acquisition of treasury stock |
|
|
(708 |
) |
| Disposal of treasury stock |
|
|
212 |
|
| Increase due to share exchange |
|
|
876,782 |
|
|
|
|
|
|
| Total changes during the period |
|
|
876,854 |
|
|
|
|
|
|
| Balance at the end of the period |
|
|
876,854 |
|
|
|
|
|
|
59
|
|
|
|
|
| |
|
(Millions of yen) |
|
| |
|
Six months ended
September 30, 2010
(April 1 to
September 30, 2010) |
|
| Stock acquisition rights: |
|
|
|
|
| Balance at the beginning of the period |
|
|
— |
|
| Changes during the period |
|
|
|
|
| Net changes in items other than shareholders’ equity |
|
|
2,362 |
|
|
|
|
|
|
| Total changes during the period |
|
|
2,362 |
|
|
|
|
|
|
| Balance at the end of the period |
|
|
2,362 |
|
|
|
|
|
|
| Total net assets: |
|
|
|
|
| Balance at the beginning of the period |
|
|
— |
|
| Changes during the period |
|
|
|
|
| Issuance of new stocks - exercise of stock acquisition rights |
|
|
91 |
|
| Net income |
|
|
476 |
|
| Acquisition of treasury stock |
|
|
(708 |
) |
| Disposal of treasury stock |
|
|
212 |
|
| Increase due to share exchange |
|
|
876,782 |
|
| Net changes in items other than shareholders’ equity |
|
|
2,362 |
|
|
|
|
|
|
| Total changes during the period |
|
|
879,217 |
|
|
|
|
|
|
| Balance at the end of the period |
|
|
879,217 |
|
|
|
|
|
|
60
Significant Accounting Policies for the Preparation of the Interim Financial Statements
|
|
|
| |
|
Six months ended September 30, 2010
(April 1 to September 30, 2010) |
|
|
| 1 Valuation policies and methods for securities |
|
Stocks of subsidiaries and affiliates are carried at cost based on the moving-average method. |
|
|
| 2 Depreciation methods of fixed assets |
|
Depreciation of tangible fixed assets is computed using the declining-balance method, except for buildings (excluding fixtures attached
to buildings) on which depreciation is computed using the straight-line method. Useful lives of major tangible fixed assets are as follows. |
|
|
|
|
|
| Buildings: |
|
|
8 to 38 years |
|
| Fixtures and equipment: |
|
|
4 to 15 years |
|
|
|
|
| 3 Accounting methods of deferred assets |
|
Establishment costs are expensed in the period incurred. |
|
|
| 4 Accounting policies for reserves |
|
In order to provide for employees’ bonus payments, reserve for bonus payments is recorded, based on the estimated amounts to be paid as of the interim balance sheet
date. |
|
|
| 5 Accounting for consumption taxes |
|
National and local consumption taxes are accounted for using the tax-excluded method. |
Additional Information
|
| Six months ended September 30,
2010 (April 1 to September 30, 2010) |
|
| (Subsidiaries merged and became a direct subsidiary of NKSJ Holdings, Inc.)
Information is omitted since it is same as “Additional Information
(Subsidiaries merged and became a direct subsidiary of NKSJ Holdings, Inc.)” in the interim consolidated financial statements. |
61
Notes to the Interim Financial Statements
(Note to the interim balance sheets)
|
| As of September 30,
2010 |
|
| *1 Accumulated depreciation of tangible fixed assets amounts to 22 million
yen. |
(Note to the interim statements of income)
|
| Six months ended September 30,
2010 (April 1 to September 30, 2010) |
| *1 Depreciation expenses |
| Tangible fixed assets 22 million yen |
(Note to the interim statements of changes in net assets)
Six months ended September 30, 2010 (April 1 to September 30, 2010)
Type and number of
treasury stock
|
|
|
|
|
|
|
|
|
|
|
|
|
|
|
|
|
| |
|
Number as of
March
31, 2010
(thousand shares) |
|
|
Increase
for the six
months ended
September 30, 2010
(thousand shares) |
|
|
Decrease
for the six
months ended
September 30, 2010
(thousand shares) |
|
|
Number as
of
September 30, 2010
(thousand shares) |
|
| Common stock |
|
|
— |
|
|
|
1,214 |
|
|
|
307 |
|
|
|
907 |
|
|
|
|
|
|
|
|
|
|
|
|
|
|
|
|
|
|
| Total |
|
|
— |
|
|
|
1,214 |
|
|
|
307 |
|
|
|
907 |
|
|
|
|
|
|
|
|
|
|
|
|
|
|
|
|
|
|
Notes)
| 1 |
Breakdown of increase in treasury stock of common stock of 1,214 thousand shares is as follows. |
Increase due to acquisition of treasury stock in accordance with approval by board of directors: 1,000 thousand shares
Increase due to purchase of shares less than a full trading unit: 214 thousand shares
| 2 |
Breakdown of decrease in treasury stock of common stock of 307 thousand shares is as follows. |
Decrease due to disposal of treasury stock related to exercise of stock acquisition rights: 276 thousand shares
Decrease due to sales of shares less than a full trading unit: 30 thousand shares
62
(Securities)
As of September 30, 2010
Since stocks of subsidiaries and affiliates (Carrying amount on the
interim balance sheet is 878,799 million yen of stocks of subsidiaries.) do not have the quoted market price and NKSJ Holdings, Inc. considers extremely difficult to figure out the fair value, they are not included in the scope of fair value
disclosure.
(Business combinations)
Six months ended September 30, 2010 (April 1 to September 30, 2010)
Notes for business
integration are omitted since they are shown in “Notes to the Interim Consolidated Financial Statements (Business combinations) 1 Business integration” in the interim consolidated financial statements.
63
(Per share information)
|
|
|
|
|
| |
|
Six months ended September 30, 2010
(April 1 to September
30, 2010) |
|
| Total net assets per share |
|
|
528.06 yen |
|
| Net income per share—Basic |
|
|
0.28 yen |
|
| Net income per share—Diluted |
|
|
0.28 yen |
|
Notes)
| 1 |
Calculation of basic net income per share and diluted net income per share is based on the following figures. |
|
|
|
| |
|
(Millions of yen) |
| |
|
Six months ended September 30, 2010
(April 1 to September 30, 2010) |
| Net income per share—Basic |
|
|
| Net income |
|
476 |
| Net income not attributable to common stockholders |
|
— |
| Net income attributable to common stocks |
|
476 |
| Average number of common stocks outstanding |
|
thousand shares 1,660,781 |
| Net income per share—Diluted |
|
|
| Adjustment of net income |
|
— |
| Increase of common stocks: |
|
thousand shares 2,306 |
| Stock acquisition rights |
|
thousand shares 2,306 |
| Outline of dilutive shares which are not included in the calculation of diluted net income per share because they do not have
dilutive effect |
|
Stock acquisition rights: 14 types
Number of dilutive shares: 3,020,000
shares |
| 2 |
Calculation of total net assets per share is based on the following figures. |
|
|
|
|
|
| |
|
(Millions of yen) |
|
| |
|
As of September 30, 2010 |
|
| Total net assets |
|
|
879,217 |
|
| Amount to be deducted from total net assets: |
|
|
(2,362 |
) |
| Stock acquisition rights |
|
|
(2,362 |
) |
| Total net assets attributable to common stocks |
|
|
876,854 |
|
| Number of common stocks used for calculation of total net assets per share |
|
|
thousand shares
1,660,501 |
|
64
(Significant subsequent events)
None.
65
None.
66
Part 2: Information on party(ies) providing guaranty to the Reporting Company
(Omitted.)
67
Note Regarding Forward-looking Statements
This document includes “forward-looking statements” that reflect the information in relation to the NKSJ Holdings, Inc.
(“NKSJ”). To the extent that statements in this document do not relate to historical or current facts, they constitute forward-looking statements. These forward-looking statements are based on the current assumptions and beliefs of NKSJ in
light of the information currently available to NKSJ, and involve known and unknown risks, uncertainties and other factors. Such risks, uncertainties and other factors may cause the actual results, performance, achievements or financial position of
NKSJ, as the case may be, to be materially different from any future results, performance, achievements or financial position expressed or implied by these forward-looking statements. NKSJ does not undertake or will not undertake any obligation to
publicly update any forward-looking statements after the date of this document. Investors are advised to consult any further disclosures by NKSJ in their subsequent domestic filings in Japan and filings with, or submissions to, the U.S. Securities
Exchange Commission pursuant to the U.S. Securities Exchange Act of 1934.
The risks, uncertainties and other factors referred
to above include, but are not limited to, those below. The risks, uncertainties and other factors are also referred to in our domestic Quarterly Securities Reports.
| (1) |
Effects of deterioration of economic and business conditions in Japan |
| (2) |
Risk of intensification of competition in the property and casualty insurance business |
| (3) |
Changes to laws, regulations, and systems |
| (4) |
Natural catastrophe risks related to insurance products |
| (5) |
Occurrence of losses exceeding projection |
| (7) |
Effects of declining stock price |
| (8) |
Effects of fluctuation in interest rate |
| (10) |
Effects of fluctuation in foreign exchange rate |
| (12) |
Life insurance business risks |
| (13) |
Overseas business risk |
| (14) |
Non-insurance business risk |
| (15) |
Credit rating downgrade |
| (16) |
Business interruption risk in case of natural disasters, etc. |
| (17) |
Information security risk |
| (19) |
System integration risk |
| (20) |
Risk of failure to adequately realize business integration synergies |
| (21) |
Risks related to merger of life insurance subsidiaries |
68