Please wait
FORM 6-K
U.S. SECURITIES AND EXCHANGE COMMISSION
Washington, D.C. 20549
Report of Foreign Private Issuer
Pursuant to Rule 13a-16 or 15d-16 of
the Securities Exchange Act of 1934
Commission File Number:
333-163336
For the month of February 2011.
NKSJ Holdings, Inc.
(Translation of registrant’s name into English)
26-1,
Nishi-Shinjuku 1-chome
Shinjuku-ku, Tokyo 160-8338
Japan
(Address of principal executive offices)
Indicate by
check mark whether the registrant files or will file annual reports under cover Form 20-F or Form 40-F.
Form
20-F X Form 40-F
Indicate by check mark if the registrant is submitting the Form 6-K in paper as permitted by Regulation S-T Rule
101(b)(1):
Indicate by
check mark if the registrant is submitting the Form 6-K in paper as permitted by Regulation S-T Rule 101(b)(7):
Indicate by check mark whether by furnishing the information contained in this Form, the registrant is also thereby furnishing the
information to the Commission pursuant to Rule 12g3-2(b) under the Securities Exchange Act of 1934.
Yes
No X
If “Yes” is marked, indicate below
the file number assigned to the registrant in connection with Rule 12g3-2(b): 82-
Information furnished on this form:
Table of Contents
Summary of Consolidated Financial Results for the nine months ended December 31, 2010
Summary of Consolidated Financial Results for the nine months ended December 31, 2010
(Supplementary Information)
Quarterly Securities Report for the Three Months Ended December 31, 2010
SIGNATURES
Pursuant to the requirements of the Securities Exchange Act of 1934, the registrant has duly caused this report to be signed on its behalf by the undersigned, thereunto duly authorized.
|
|
|
|
|
|
|
|
|
| |
|
|
|
NKSJ Holdings, Inc. |
|
|
| Date: February 22, 2011 |
|
|
|
|
|
|
|
|
|
|
|
|
By: |
|
/S/ HIROHISA
KURUMIDA |
|
|
|
|
|
|
|
|
Hirohisa Kurumida |
|
|
|
|
|
|
|
|
Manager of Corporate Legal Department |
|
|
[English Translation]
Summary of Consolidated Financial Results for the nine months ended December 31, 2010
UNOFFICIAL TRANSLATION
This document is an unofficial English translation of the Japanese original.
February 14, 2011
NKSJ Holdings, Inc.
Summary of Consolidated Financial Results for the
nine months ended December 31, 2010
[under Japanese GAAP]
|
|
|
| Company Name: |
|
NKSJ Holdings, Inc. |
| Listed on: |
|
Tokyo and Osaka Stock Exchange |
| Stock Code Number: |
|
8630 |
| URL: |
|
http://www.nksj- hd.com/ |
| Representative Director: |
|
Masatoshi Sato, President & CEO |
| Contact: |
|
Kazuhisa Tamura, Manager, Accounting Department |
|
|
|
|
|
|
|
|
|
|
|
|
|
| Scheduled date to file Quarterly Securities Report: |
|
February 14, 2011 |
|
|
|
|
|
|
|
|
|
|
| Scheduled date to start payment of dividends: |
|
——— |
|
|
|
|
|
|
|
|
|
|
| Supplementary information for quarterly financial statements: |
|
Yes |
|
|
|
|
|
|
|
|
|
|
| Schedule for quarterly investor meeting: |
|
None |
|
|
|
|
|
|
|
|
|
|
Note) Any amounts less than one million yen are rounded down, unless otherwise noted.
| 1. |
Consolidated Financial Results for the nine months ended December 31, 2010 (April 1 to December 31, 2010) |
| (1) |
Consolidated Results of Operations |
Note) The percentages are changes from corresponding period of previous fiscal year.
|
|
|
|
|
|
|
|
|
|
|
|
|
|
|
|
|
|
|
|
|
|
|
|
|
| |
|
Ordinary income |
|
|
Ordinary profit |
|
|
Net income |
|
| |
|
millions of yen |
|
|
% |
|
|
millions of yen |
|
|
% |
|
|
millions of yen |
|
|
% |
|
| Nine months ended December 31, 2010 |
|
|
2,002,076 |
|
|
|
— |
|
|
|
45,973 |
|
|
|
— |
|
|
|
24,846 |
|
|
|
— |
|
| Nine months ended December 31, 2009 |
|
|
— |
|
|
|
— |
|
|
|
— |
|
|
|
— |
|
|
|
— |
|
|
|
— |
|
|
|
|
|
|
|
|
|
|
| |
|
Net income
per share |
|
|
Diluted net income
per share |
|
| |
|
yen |
|
|
yen |
|
| Nine months ended December 31, 2010 |
|
|
14.96 |
|
|
|
14.93 |
|
| Nine months ended December 31, 2009 |
|
|
— |
|
|
|
— |
|
| (2) |
Consolidated Financial Conditions |
|
|
|
|
|
|
|
|
|
|
|
|
|
|
|
|
|
| |
|
Total assets |
|
|
Total net assets |
|
|
Equity ratio |
|
|
Total net assets
per share |
|
| |
|
millions of yen |
|
|
millions of yen |
|
|
% |
|
|
yen |
|
| As of December 31, 2010 |
|
|
9,022,852 |
|
|
|
1,168,156 |
|
|
|
12.9 |
|
|
|
700.32 |
|
| As of March 31, 2010 |
|
|
— |
|
|
|
— |
|
|
|
— |
|
|
|
— |
|
|
|
|
|
|
| Reference) Equity capital: |
|
As of December 31, 2010 |
|
1,162,837 million yen |
|
|
As of March 31, 2010 |
|
— million yen |
|
|
|
|
|
|
|
|
|
|
|
|
|
|
|
|
|
|
|
|
|
| |
|
Dividends per share |
|
| |
|
First
quarter-end |
|
|
Second
quarter-end |
|
|
Third
quarter-end |
|
|
Fiscal
year-end |
|
|
Annual |
|
| |
|
yen |
|
|
yen |
|
|
yen |
|
|
yen |
|
|
yen |
|
| Fiscal year ended March 31, 2010 |
|
|
— |
|
|
|
— |
|
|
|
— |
|
|
|
— |
|
|
|
— |
|
| Fiscal year ending March 31, 2011 |
|
|
— |
|
|
|
— |
|
|
|
— |
|
|
|
|
|
|
|
|
|
| Fiscal year ending March 31, 2011 (Forecast) |
|
|
|
|
|
|
|
|
|
|
|
|
|
|
20.00 |
|
|
|
20.00 |
|
Note) Revision to the
forecasts for dividends during the third quarter: None
| 3. |
Consolidated Forecasts for the fiscal year ending March 31, 2011 (April 1, 2010 to March 31, 2011) |
Note) The percentages are changes from corresponding period of previous fiscal year.
|
|
|
|
|
|
|
|
|
|
|
|
|
|
|
|
|
|
|
|
|
|
|
|
|
|
|
|
|
| |
|
Ordinary income |
|
|
Ordinary profit |
|
|
Net income |
|
|
Net income
per share |
|
| |
|
millions of yen |
|
|
% |
|
|
millions of yen |
|
|
% |
|
|
millions of yen |
|
|
% |
|
|
yen |
|
| Fiscal year ending March 31, 2011 (April 1, 2010 to March 31, 2011) |
|
|
2,625,000 |
|
|
|
— |
|
|
|
48,000 |
|
|
|
— |
|
|
|
25,000 |
|
|
|
— |
|
|
|
15.05 |
|
| Note) |
Revision to the forecasts for the fiscal year during the third quarter: None |
Note)
Please refer to “Other Information” on page 2 for details.
| (1) |
Changes in significant subsidiaries during the third quarter: None |
Note) The above shows changes in specified subsidiaries resulting in the change in the scope of
consolidation during the third quarter.
| (2) |
Adoption of simplified accounting methods or special accounting methods: Yes |
Note) The above shows adoption of simplified accounting methods or accounting methods used specifically for
the preparation of the quarterly consolidated financial statements.
| (3) |
Changes in accounting policies, procedures and methods of presentation |
|
|
|
| Changes due to revisions to accounting standards: |
|
None |
|
|
| ‚ Changes due to other reasons: |
|
None |
| |
Note) |
The above shows changes which are shown in “Changes in significant accounting policies for the preparation of the quarterly consolidated financial
statements”. |
| (4) |
Number of shares outstanding (Common stock) : |
|
|
|
|
|
|
|
|
|
Total shares outstanding including treasury stock: |
|
|
|
|
|
|
|
|
|
As of December 31, 2010 |
|
|
1,661,409,178 shares |
|
|
|
|
|
|
As of March 31, 2010 |
|
|
— shares |
|
|
|
|
|
|
‚ Treasury stock: |
|
|
|
|
|
|
|
|
|
As of December 31, 2010 |
|
|
975,828 shares |
|
|
|
|
|
|
As of March 31, 2010 |
|
|
— shares |
|
|
|
|
|
|
ƒ Average number of shares outstanding: |
|
|
|
|
|
|
|
|
|
For the nine months ended December 31,
2010 |
|
|
1,660,680,200 shares |
|
|
|
|
|
|
For the nine months ended December 31,
2009 |
|
|
— shares |
|
(Disclosure regarding the execution
of the quarterly review process)
This summary is outside the scope of the quarterly review procedure which is required by
“Financial Instruments and Exchange Act”, but the review procedure of the quarterly financial statements was completed.
(Notes for
using forecasted information etc.)
The forecasts included in this document are based on the currently available information
and certain assumptions that we believe reasonable. Accordingly, the actual results may differ materially from those projected herein depending on various factors.
For notes for using forecasted information, please refer to “Note Regarding Forward-looking Statements” on page 11.
NKSJ Holdings, Inc. was established on April 1, 2010 as a holding company of Sompo Japan Insurance Inc. and NIPPONKOA Insurance Co., Ltd. This consolidated fiscal year is the first period, so there
are no results for the fiscal year ended March 31, 2010 and the nine months ended December 31, 2009.
Contents
1
| 1. |
Qualitative Information related to the Consolidated Financial Results for the nine months ended December 31, 2010 |
| (1) |
Qualitative information related to the consolidated results of operations |
The consolidated results of operations for the nine months ended December 31, 2010 are as follows.
1,903.0 billion yen of underwriting income, 91.9 billion yen of investment income and 7.0 billion yen of other ordinary income resulted in 2,002.0 billion yen of ordinary income.
In contrast, 1,602.7 billion yen of underwriting expenses, 30.4 billion yen of investment expenses, 314.2 billion yen of operating,
general and administrative expenses and 8.7 billion yen of other ordinary expenses resulted in 1,956.1 billion yen of ordinary expenses.
As a result, ordinary profit amounted to 45.9 billion yen and net income amounted to 24.8 billion yen.
| (2) |
Qualitative information related to the consolidated financial conditions |
As of December 31, 2010, the total assets amounted to 9,022.8 billion yen and the total net assets amounted to 1,168.1 billion yen.
| (3) |
Qualitative information related to the consolidated forecasts |
There is no change on the consolidated forecasts for the fiscal year ending March 31, 2011 (full fiscal year) as disclosed on November 19, 2010.
| (1) |
Summary of changes in significant subsidiaries |
None.
| (2) |
Summary of adoption of simplified accounting methods or special accounting methods |
Income taxes are calculated by applying a reasonably estimated effective tax rate to income before income taxes. The estimated effective
tax rate is determined by estimating the effective tax rate after applying deferred tax accounting for the fiscal year, including the third quarter of this fiscal year. When it is remarkably unreasonable to adopt this accounting method, income taxes
are calculated by the statutory effective tax rate.
| (3) |
Summary of changes in accounting policies, procedures and methods of presentation |
NKSJ Holdings, Inc. is a sole parent company of Sompo Japan Insurance Inc. and NIPPONKOA Insurance Co., Ltd. established through share exchange on April 1, 2010. This consolidated fiscal year is the
first period, so there is no change in accounting policies, procedures and methods of presentation.
2
| 3. |
Quarterly Consolidated Financial Statements |
| (1) |
Quarterly Consolidated Balance Sheets |
|
|
|
|
|
| |
|
(Millions of yen) |
|
| |
|
As of December 31, 2010 |
|
| Assets: |
|
|
|
|
| Cash and deposits |
|
|
234,188 |
|
| Call loans |
|
|
64,225 |
|
| Receivables under resale agreements |
|
|
64,984 |
|
| Receivables under securities borrowing transactions |
|
|
25,502 |
|
| Monetary receivables bought |
|
|
34,720 |
|
| Money trusts |
|
|
81,392 |
|
| Securities |
|
|
6,580,373 |
|
| Loans |
|
|
706,428 |
|
| Tangible fixed assets |
|
|
361,289 |
|
| Intangible fixed assets |
|
|
52,711 |
|
| Other assets |
|
|
591,847 |
|
| Deferred tax assets |
|
|
231,373 |
|
| Allowance for possible loan losses |
|
|
(6,185 |
) |
|
|
|
|
|
| Total assets |
|
|
9,022,852 |
|
|
|
|
|
|
| Liabilities: |
|
|
|
|
| Underwriting funds: |
|
|
7,316,385 |
|
| Reserve for outstanding losses and claims |
|
|
974,282 |
|
| Underwriting reserves |
|
|
6,342,103 |
|
| Bonds |
|
|
128,000 |
|
| Other liabilities |
|
|
269,447 |
|
| Reserve for retirement benefits |
|
|
108,981 |
|
| Reserve for retirement benefits to directors |
|
|
129 |
|
| Reserve for bonus payments |
|
|
7,446 |
|
| Reserves under the special laws: |
|
|
23,325 |
|
| Reserve for price fluctuation |
|
|
23,325 |
|
| Deferred tax liabilities |
|
|
978 |
|
|
|
|
|
|
| Total liabilities |
|
|
7,854,696 |
|
|
|
|
|
|
| Net assets: |
|
|
|
|
| Shareholders’ equity: |
|
|
|
|
| Common stock |
|
|
100,045 |
|
| Capital surplus |
|
|
438,555 |
|
| Retained earnings |
|
|
336,104 |
|
| Treasury stock |
|
|
(567 |
) |
|
|
|
|
|
| Total shareholders’ equity |
|
|
874,137 |
|
|
|
|
|
|
| Valuation and translation adjustments: |
|
|
|
|
| Unrealized gains on securities available for sale, net of tax |
|
|
315,576 |
|
| Deferred gains on hedges |
|
|
4,274 |
|
| Foreign currency translation adjustments |
|
|
(31,150 |
) |
|
|
|
|
|
| Total valuation and translation adjustments |
|
|
288,699 |
|
|
|
|
|
|
| Stock acquisition rights |
|
|
2,362 |
|
| Non-controlling interests |
|
|
2,955 |
|
|
|
|
|
|
| Total net assets |
|
|
1,168,156 |
|
|
|
|
|
|
| Total liabilities and net assets |
|
|
9,022,852 |
|
|
|
|
|
|
3
| (2) |
Quarterly Consolidated Statements of Income |
|
|
|
|
|
| |
|
(Millions of yen) |
|
| |
|
Nine months
ended
December 31, 2010
(April 1 to December 31, 2010) |
|
| |
| Ordinary income: |
|
|
2,002,076 |
|
| Underwriting income: |
|
|
1,903,022 |
|
| Net premiums written |
|
|
1,465,475 |
|
| Deposits of premiums by policyholders |
|
|
118,276 |
|
| Interest and dividend income on deposits of premiums, etc. |
|
|
44,860 |
|
| Life insurance premiums written |
|
|
171,436 |
|
| Reversal of reserve for outstanding losses and claims |
|
|
59,675 |
|
| Reversal of underwriting reserves |
|
|
39,068 |
|
| Investment income: |
|
|
91,957 |
|
| Interest and dividend income |
|
|
116,534 |
|
| Investment gains on money trusts |
|
|
847 |
|
| Gains on sales of securities |
|
|
9,396 |
|
| Transfer of interest and dividend income on deposits of premiums, etc. |
|
|
(44,860 |
) |
| Other ordinary income |
|
|
7,097 |
|
| Ordinary expenses: |
|
|
1,956,103 |
|
| Underwriting expenses: |
|
|
1,602,747 |
|
| Net claims paid |
|
|
925,954 |
|
| Loss adjustment expenses |
|
|
97,439 |
|
| Net commissions and brokerage fees |
|
|
265,020 |
|
| Maturity refunds to policyholders |
|
|
264,815 |
|
| Life insurance claims paid |
|
|
43,872 |
|
| Investment expenses: |
|
|
30,422 |
|
| Investment losses on money trusts |
|
|
914 |
|
| Investment losses on trading securities |
|
|
17 |
|
| Losses on sales of securities |
|
|
3,607 |
|
| Impairment losses on securities |
|
|
9,854 |
|
| Operating, general and administrative expenses |
|
|
314,200 |
|
| Other ordinary expenses: |
|
|
8,734 |
|
| Interest paid |
|
|
5,403 |
|
|
|
|
|
|
| Ordinary profit |
|
|
45,973 |
|
|
|
|
|
|
| Extraordinary gains: |
|
|
2,251 |
|
| Gains on disposal of fixed assets |
|
|
316 |
|
| Gains on negative goodwill |
|
|
149 |
|
| Other extraordinary gains |
|
|
1,785 |
|
| Extraordinary losses: |
|
|
7,210 |
|
| Losses on disposal of fixed assets |
|
|
493 |
|
| Impairment losses |
|
|
662 |
|
| Provision for reserves under the special laws: |
|
|
4,832 |
|
| Provision for reserve for price fluctuation |
|
|
4,832 |
|
| Other extraordinary losses |
|
|
1,222 |
|
|
|
|
|
|
| Income before income taxes and non-controlling interests |
|
|
41,014 |
|
|
|
|
|
|
| Income taxes and deferred income taxes |
|
|
16,418 |
|
|
|
|
|
|
| Income before non-controlling interests |
|
|
24,596 |
|
|
|
|
|
|
| Non-controlling interests |
|
|
(250 |
) |
|
|
|
|
|
| Net income |
|
|
24,846 |
|
|
|
|
|
|
4
| (3) |
Notes on Going-Concern Assumption |
None.
| (4) |
Notes for Material Changes in Shareholders’ Equity |
None.
5
As of December 31, 2010
| 1. |
Bonds held to maturity (which have readily determinable fair value) |
|
|
|
|
|
|
|
|
|
|
|
|
|
| |
|
(Millions of yen) |
|
| |
|
Carrying amount
on balance sheet |
|
|
Fair value |
|
|
Unrealized
gains
(losses) |
|
| Domestic bonds |
|
|
1,109,413 |
|
|
|
1,164,456 |
|
|
|
55,043 |
|
| Foreign securities |
|
|
62,422 |
|
|
|
63,158 |
|
|
|
735 |
|
|
|
|
|
|
|
|
|
|
|
|
|
|
| Total |
|
|
1,171,836 |
|
|
|
1,227,614 |
|
|
|
55,778 |
|
|
|
|
|
|
|
|
|
|
|
|
|
|
| 2. |
Policy reserve matching bonds (which have readily determinable fair value) |
|
|
|
|
|
|
|
|
|
|
|
|
|
| |
|
(Millions of yen) |
|
| |
|
Carrying amount
on balance sheet |
|
|
Fair value |
|
|
Unrealized
gains
(losses) |
|
| Domestic bonds |
|
|
14,775 |
|
|
|
15,248 |
|
|
|
473 |
|
|
|
|
|
|
|
|
|
|
|
|
|
|
| Total |
|
|
14,775 |
|
|
|
15,248 |
|
|
|
473 |
|
|
|
|
|
|
|
|
|
|
|
|
|
|
| 3. |
Securities available for sale (which have readily determinable fair value) |
|
|
|
|
|
|
|
|
|
|
|
|
|
| |
|
(Millions of yen) |
|
| |
|
Cost |
|
|
Carrying amount
on balance sheet |
|
|
Unrealized
gains
(losses) |
|
| Domestic bonds |
|
|
2,431,283 |
|
|
|
2,500,594 |
|
|
|
69,310 |
|
| Domestic stocks |
|
|
1,135,321 |
|
|
|
1,609,106 |
|
|
|
473,784 |
|
| Foreign securities |
|
|
1,092,602 |
|
|
|
1,034,476 |
|
|
|
(58,126 |
) |
| Others |
|
|
89,625 |
|
|
|
92,171 |
|
|
|
2,545 |
|
|
|
|
|
|
|
|
|
|
|
|
|
|
| Total |
|
|
4,748,834 |
|
|
|
5,236,348 |
|
|
|
487,513 |
|
|
|
|
|
|
|
|
|
|
|
|
|
|
Notes)
| 1. |
Certificate of deposit, which are classified as cash and deposits and beneficial interests in the loan trusts, which are classified as monetary receivables bought in
the quarterly consolidated balance sheet, are included in “Others” above. |
| 2. |
Impairment losses on securities available for sale which have readily determinable fair value amount to 8,918 million yen. NKSJ Holdings, Inc. and its domestic
consolidated subsidiaries recognize impairment losses on securities available for sale which have readily determinable fair value if fair value declines by 30% or more of their cost as of the quarterly balance sheet date, as a rule.
|
6
| (6) |
Derivatives Transactions |
As of
December 31, 2010
|
|
|
|
|
|
|
|
|
|
|
|
|
|
|
| |
|
|
|
(Millions of yen) |
|
| Type |
|
Transaction |
|
Notional
amount |
|
|
Fair value |
|
|
Unrealized
gains
(losses) |
|
| Currency derivatives |
|
Forward foreign exchanges: |
|
|
|
|
|
|
|
|
|
|
|
|
|
|
Short |
|
|
59,286 |
|
|
|
1,891 |
|
|
|
1,891 |
|
|
|
Long |
|
|
16,466 |
|
|
|
(314 |
) |
|
|
(314 |
) |
|
|
Currency options: |
|
|
|
|
|
|
|
|
|
|
|
|
|
|
Short |
|
|
35,823 |
|
|
|
|
|
|
|
|
|
|
|
|
|
|
87 |
* |
|
|
(30 |
) |
|
|
57 |
|
|
|
Long |
|
|
33,174 |
|
|
|
|
|
|
|
|
|
|
|
|
|
|
87 |
* |
|
|
143 |
|
|
|
55 |
|
|
|
|
|
|
|
|
|
|
|
|
|
|
|
|
| Equity derivatives |
|
Equity index futures: |
|
|
|
|
|
|
|
|
|
|
|
|
|
|
Short |
|
|
5,611 |
|
|
|
(55 |
) |
|
|
(55 |
) |
|
|
Equity index options: |
|
|
|
|
|
|
|
|
|
|
|
|
|
|
Short |
|
|
5,417 |
|
|
|
|
|
|
|
|
|
|
|
|
|
|
205 |
* |
|
|
(1 |
) |
|
|
203 |
|
|
|
Long |
|
|
4,400 |
|
|
|
|
|
|
|
|
|
|
|
|
|
|
205 |
* |
|
|
108 |
|
|
|
(96 |
) |
|
|
|
|
|
|
|
|
|
|
|
|
|
|
|
| Bond derivatives |
|
Bond futures: |
|
|
|
|
|
|
|
|
|
|
|
|
|
|
Long |
|
|
1,426 |
|
|
|
(13 |
) |
|
|
(13 |
) |
|
|
|
|
|
|
|
|
|
|
|
|
|
|
|
| Others |
|
Credit derivatives: |
|
|
|
|
|
|
|
|
|
|
|
|
|
|
Short |
|
|
9,000 |
|
|
|
66 |
|
|
|
66 |
|
|
|
Long |
|
|
2,000 |
|
|
|
0 |
|
|
|
0 |
|
|
|
Weather derivatives: |
|
|
|
|
|
|
|
|
|
|
|
|
|
|
Short |
|
|
472 |
|
|
|
|
|
|
|
|
|
|
|
|
|
|
19 |
* |
|
|
(10 |
) |
|
|
8 |
|
|
|
Earthquake derivatives: |
|
|
|
|
|
|
|
|
|
|
|
|
|
|
Short |
|
|
3,960 |
|
|
|
|
|
|
|
|
|
|
|
|
|
|
119 |
* |
|
|
(10 |
) |
|
|
109 |
|
|
|
Long |
|
|
3,555 |
|
|
|
|
|
|
|
|
|
|
|
|
|
|
366 |
* |
|
|
125 |
|
|
|
(241 |
) |
|
|
|
|
|
|
|
|
|
|
|
|
|
|
|
| Total |
|
|
— |
|
|
|
1,899 |
|
|
|
1,672 |
|
|
|
|
|
|
|
|
|
|
|
|
|
|
|
|
Notes)
| 1. |
Derivatives transactions to which hedge accounting is applied are excluded. |
| 2. |
Amounts with an asterisk (*) represent the amount of the option premiums. |
7
| 4. |
Supplementary Information |
| (1) |
Summary of Results of Operations |
|
|
|
|
|
| |
|
(Millions of yen) |
|
| |
|
Nine months ended
December 31,
2010
(April 1 to December 31, 2010) |
|
| Ordinary income and expenses: |
|
|
|
|
| Underwriting income: |
|
|
1,903,022 |
|
| Net premiums written |
|
|
1,465,475 |
|
| Deposits of premiums by policyholders |
|
|
118,276 |
|
| Life insurance premiums written |
|
|
171,436 |
|
| Underwriting expenses: |
|
|
1,602,747 |
|
| Net claims paid |
|
|
925,954 |
|
| Loss adjustment expenses |
|
|
97,439 |
|
| Net commissions and brokerage fees |
|
|
265,020 |
|
| Maturity refunds to policyholders |
|
|
264,815 |
|
| Life insurance claims paid |
|
|
43,872 |
|
|
|
|
|
|
| Investment income: |
|
|
91,957 |
|
| Interest and dividend income |
|
|
116,534 |
|
| Gains on sales of securities |
|
|
9,396 |
|
| Investment expenses: |
|
|
30,422 |
|
| Losses on sales of securities |
|
|
3,607 |
|
| Impairment losses on securities |
|
|
9,854 |
|
|
|
|
|
|
| Operating, general and administrative expenses |
|
|
314,200 |
|
|
|
|
|
|
| Other ordinary income and expenses |
|
|
(1,636 |
) |
|
|
|
|
|
| Ordinary profit |
|
|
45,973 |
|
|
|
|
|
|
| Extraordinary gains and losses: |
|
|
|
|
| Extraordinary gains |
|
|
2,251 |
|
| Extraordinary losses |
|
|
7,210 |
|
|
|
|
|
|
| Net extraordinary losses |
|
|
(4,958 |
) |
|
|
|
|
|
| Income before income taxes and non-controlling interests |
|
|
41,014 |
|
| Income taxes and deferred income taxes |
|
|
16,418 |
|
| Income before non-controlling interests |
|
|
24,596 |
|
| Non-controlling interests |
|
|
(250 |
) |
|
|
|
|
|
| Net income |
|
|
24,846 |
|
|
|
|
|
|
8
| (2) |
Premiums Written and Claims Paid by Lines of Business (Consolidated) |
Direct premiums written (including deposits of premiums by policyholders)
|
|
|
|
|
|
|
|
|
|
|
|
|
| |
|
(Millions of yen) |
|
| |
|
Nine months ended December 31, 2010
(April 1 to December 31, 2010) |
|
| Business line |
|
Amount |
|
|
% of total
amount |
|
|
Rate of
change |
|
| |
|
|
|
|
% |
|
|
% |
|
| Fire and allied insurance |
|
|
271,837 |
|
|
|
16.2 |
|
|
|
— |
|
| Marine insurance |
|
|
42,804 |
|
|
|
2.5 |
|
|
|
— |
|
| Personal accident insurance |
|
|
220,869 |
|
|
|
13.2 |
|
|
|
— |
|
| Voluntary automobile insurance |
|
|
738,727 |
|
|
|
44.0 |
|
|
|
— |
|
| Compulsory automobile liability insurance |
|
|
190,641 |
|
|
|
11.4 |
|
|
|
— |
|
| Others |
|
|
214,201 |
|
|
|
12.8 |
|
|
|
— |
|
|
|
|
|
|
|
|
|
|
|
|
|
|
| Total |
|
|
1,679,082 |
|
|
|
100.0 |
|
|
|
— |
|
| Deposits of premiums by policyholders |
|
|
118,276 |
|
|
|
7.0 |
|
|
|
— |
|
|
|
|
|
|
|
|
|
|
|
|
|
|
| Net premiums
written |
|
|
|
|
|
|
|
|
|
|
|
|
| |
|
(Millions of yen) |
|
| |
|
Nine months ended December 31, 2010
(April 1 to December 31, 2010) |
|
| Business line |
|
Amount |
|
|
% of total
amount |
|
|
Rate of
change |
|
| |
|
|
|
|
% |
|
|
% |
|
| Fire and allied insurance |
|
|
179,648 |
|
|
|
12.3 |
|
|
|
— |
|
| Marine insurance |
|
|
35,520 |
|
|
|
2.4 |
|
|
|
— |
|
| Personal accident insurance |
|
|
139,003 |
|
|
|
9.5 |
|
|
|
— |
|
| Voluntary automobile insurance |
|
|
737,863 |
|
|
|
50.3 |
|
|
|
— |
|
| Compulsory automobile liability insurance |
|
|
182,733 |
|
|
|
12.5 |
|
|
|
— |
|
| Others |
|
|
190,705 |
|
|
|
13.0 |
|
|
|
— |
|
|
|
|
|
|
|
|
|
|
|
|
|
|
| Total |
|
|
1,465,475 |
|
|
|
100.0 |
|
|
|
— |
|
|
|
|
|
|
|
|
|
|
|
|
|
|
| Net claims
paid |
|
|
|
|
|
|
|
|
|
|
|
|
| |
|
(Millions of yen) |
|
| |
|
Nine months ended December 31,
2010
(April 1 to December 31, 2010) |
|
| Business line |
|
Amount |
|
|
% of total
amount |
|
|
Rate of
change |
|
| |
|
|
|
|
% |
|
|
% |
|
| Fire and allied insurance |
|
|
71,574 |
|
|
|
7.7 |
|
|
|
— |
|
| Marine insurance |
|
|
17,584 |
|
|
|
1.9 |
|
|
|
— |
|
| Personal accident insurance |
|
|
75,729 |
|
|
|
8.2 |
|
|
|
— |
|
| Voluntary automobile insurance |
|
|
461,528 |
|
|
|
49.8 |
|
|
|
— |
|
| Compulsory automobile liability insurance |
|
|
172,767 |
|
|
|
18.7 |
|
|
|
— |
|
| Others |
|
|
126,768 |
|
|
|
13.7 |
|
|
|
— |
|
|
|
|
|
|
|
|
|
|
|
|
|
|
| Total |
|
|
925,954 |
|
|
|
100.0 |
|
|
|
— |
|
|
|
|
|
|
|
|
|
|
|
|
|
|
Note to
the above three tables:
The above figures represent amounts before offsetting internal transactions among consolidated
segments.
9
| (3) |
Life Insurance Business (Consolidated) |
Life
insurance premiums
|
|
|
|
|
|
|
|
|
| |
|
(Millions of yen) |
|
| |
|
Nine months ended December 31, 2010
(April 1 to December 31,
2010) |
|
| |
|
Amount |
|
|
Rate of change |
|
| |
|
|
|
|
% |
|
| Life insurance premiums |
|
|
171,436 |
|
|
|
— |
|
Note) The above figures represent amounts before offsetting internal transactions among consolidated segments.
Total amount of policies in force
|
|
|
|
|
|
|
|
|
| |
|
(Millions of yen) |
|
| |
|
As of
December 31, 2010 |
|
| |
|
Amount |
|
|
Rate of change |
|
| |
|
|
|
|
% |
|
| Individual insurance |
|
|
16,308,118 |
|
|
|
— |
|
| Individual annuities |
|
|
278,566 |
|
|
|
— |
|
| Group insurance |
|
|
3,038,924 |
|
|
|
— |
|
| Group annuities |
|
|
— |
|
|
|
— |
|
Notes)
| 1. |
The above figures represent amounts before offsetting internal transactions among consolidated segments. |
| 2. |
Amount of “Individual annuities” represents the sum of annuity fund at the beginning of annuity payment of contracts before the beginning of annuity payment
and policy reserves for the contracts after the beginning of annuity payment. |
Total amount of new policies
|
|
|
|
|
|
|
|
|
|
|
|
|
| |
|
(Millions of yen) |
|
| |
|
Nine months ended December 31,
2010
(April 1 to December 31, 2010) |
|
| |
|
Net increase by
new policies
and conversion |
|
|
New policies |
|
|
Net increase
by conversion |
|
| Individual insurance |
|
|
2,328,639 |
|
|
|
2,328,639 |
|
|
|
— |
|
| Individual annuities |
|
|
10,839 |
|
|
|
10,839 |
|
|
|
— |
|
| Group insurance |
|
|
30,068 |
|
|
|
30,068 |
|
|
|
— |
|
| Group annuities |
|
|
— |
|
|
|
— |
|
|
|
— |
|
Notes)
| 1. |
The above figures represent amounts before offsetting internal transactions among consolidated segments. |
| 2. |
Amount of “Net increase by new policies and conversion” for “Individual annuities” represents the amount of annuity fund at the beginning of annuity
payment. |
Annualized premiums of new policies (individual insurance and individual annuities)
|
|
|
|
|
|
|
|
|
| |
|
(Millions of yen) |
|
| |
|
Nine months ended December 31, 2010
(April 1 to December 31,
2010) |
|
| |
|
Amount |
|
|
Rate of change |
|
| |
|
|
|
|
% |
|
| Annualized premiums of new policies |
|
|
28,068 |
|
|
|
— |
|
Note) The above figures represent amounts before offsetting internal transactions among consolidated segments.
10
Note Regarding Forward-looking Statements
This document includes “forward-looking statements” that reflect the information in relation to the NKSJ Holdings, Inc.
(“NKSJ”). To the extent that statements in this document do not relate to historical or current facts, they constitute forward-looking statements. These forward-looking statements are based on the current assumptions and beliefs of NKSJ in
light of the information currently available to NKSJ, and involve known and unknown risks, uncertainties and other factors. Such risks, uncertainties and other factors may cause the actual results, performance, achievements or financial position of
NKSJ, as the case may be, to be materially different from any future results, performance, achievements or financial position expressed or implied by these forward-looking statements. NKSJ does not undertake or will not undertake any obligation to
publicly update any forward-looking statements after the date of this document. Investors are advised to consult any further disclosures by NKSJ in their subsequent domestic filings in Japan and filings with, or submissions to, the U.S. Securities
Exchange Commission pursuant to the U.S. Securities Exchange Act of 1934.
The risks, uncertainties and other factors referred
to above include, but are not limited to, those below. The risks, uncertainties and other factors are also referred to in our domestic Quarterly Securities Reports.
| (1) |
Effects of deterioration of economic and business conditions in Japan |
| (2) |
Risk of intensification of competition in the property and casualty insurance business |
| (3) |
Changes to laws, regulations, and systems |
| (4) |
Natural catastrophe risks related to insurance products |
| (5) |
Occurrence of losses exceeding projection |
| (7) |
Effects of declining stock price |
| (8) |
Effects of fluctuation in interest rate |
| (10) |
Effects of fluctuation in foreign exchange rate |
| (12) |
Life insurance business risks |
| (13) |
Overseas business risk |
| (14) |
Non-insurance business risk |
| (15) |
Credit rating downgrade |
| (16) |
Business interruption risk in case of natural disasters, etc. |
| (17) |
Information security risk |
| (19) |
System integration risk |
| (20) |
Risk of failure to adequately realize business integration synergies |
| (21) |
Risks related to merger of life insurance subsidiaries |
11
[English Translation]
Summary of Consolidated Financial Results for the nine months ended December 31, 2010
(Supplementary Information)
UNOFFICIAL TRANSLATION
This document is an unofficial English translation of the Japanese original.
Summary of Consolidated Financial Results
for the nine months ended December 31, 2010
Supplementary
Information
February 14, 2011
NKSJ Holdings, Inc.
(Stock code number : 8630)
Summary of Consolidated Financial Results for the nine months ended
December 31, 2010
Supplementary Information Contents
|
|
|
|
|
| Overview of Business Results of Principal Consolidated Subsidiaries |
|
|
|
|
|
|
| Sompo Japan Insurance Inc. (Non-consolidated) |
|
|
2 |
|
| Quarterly Balance Sheets |
|
|
2 |
|
| Quarterly Statements of Income |
|
|
3 |
|
| Premiums Written and Claims Paid by Lines of Business |
|
|
4 |
|
| Solvency Margin Ratio |
|
|
5 |
|
| Exposure to Structured Finance (As of December 31, 2010) |
|
|
6 |
|
|
|
| NIPPONKOA Insurance Co., Ltd. (Non-consolidated) |
|
|
9 |
|
| Quarterly Balance Sheets |
|
|
9 |
|
| Quarterly Statements of Income |
|
|
10 |
|
| Premiums Written and Claims Paid by Lines of Business |
|
|
11 |
|
| Solvency Margin Ratio |
|
|
12 |
|
| Investments in the securitized paper and subprime loans (As of December 31,
2010) |
|
|
13 |
|
|
|
| SONPO 24 Insurance Co., Ltd. (Non-Consolidated) |
|
|
14 |
|
| Quarterly Balance Sheets |
|
|
14 |
|
| Quarterly Statements of Income |
|
|
15 |
|
| Premiums Written and Claims Paid by Lines of Business |
|
|
16 |
|
| Solvency Margin Ratio |
|
|
17 |
|
|
|
| Saison Automobile and Fire Insurance Company, Limited (Non-consolidated) |
|
|
18 |
|
| Quarterly Balance Sheets |
|
|
18 |
|
| Quarterly Statements of Income |
|
|
19 |
|
| Premiums Written and Claims Paid by Lines of Business |
|
|
20 |
|
| Solvency Margin Ratio |
|
|
21 |
|
|
|
| Sompo Japan Himawari Life Insurance Co., Ltd. (Non-consolidated) |
|
|
22 |
|
| Quarterly Balance Sheets |
|
|
22 |
|
| Quarterly Statements of Income |
|
|
23 |
|
| Major Business Results |
|
|
|
|
| (Total amount of policies in force, Total amount of new policies, Annualized
premiums) |
|
|
24 |
|
| Solvency Margin Ratio |
|
|
25 |
|
|
|
| NIPPONKOA Life Insurance Co., Ltd. (Non-consolidated) |
|
|
26 |
|
| Quarterly Balance Sheets |
|
|
26 |
|
| Quarterly Statements of Income |
|
|
27 |
|
| Major Business Results |
|
|
|
|
| (Total amount of policies in force, Total amount of new policies, Annualized
premiums) |
|
|
28 |
|
| Solvency Margin Ratio |
|
|
29 |
|
|
|
| Sompo Japan DIY Life Insurance Co., Ltd. (Non-consolidated) |
|
|
30 |
|
| Quarterly Balance Sheets |
|
|
30 |
|
| Quarterly Statements of Income |
|
|
31 |
|
| Major Business Results |
|
|
|
|
| (Total amount of policies in force, Total amount of new policies, Annualized
premiums) |
|
|
32 |
|
| Solvency Margin Ratio |
|
|
33 |
|
|
|
| Supplementary Explanation |
|
|
34 |
|
| Calculation of ratios |
|
|
34 |
|
| Solvency margin ratio |
|
|
34 |
|
|
|
| Note Regarding Forward-looking Statements |
|
|
35 |
|
1
| Overview |
of Business Results of Principal Consolidated Subsidiaries |
Sompo Japan Insurance Inc. (Non-consolidated)
Quarterly Balance Sheets
|
|
|
|
|
|
|
|
|
|
|
|
|
| |
|
(Millions of yen) |
|
| |
|
As of December 31, 2010 |
|
|
As of March 31, 2010 |
|
|
Increase
(Decrease) |
|
| |
|
Amount |
|
|
Amount |
|
|
|
|
| Assets: |
|
|
|
|
|
|
|
|
|
|
|
|
| Cash and deposits |
|
|
48,404 |
|
|
|
118,455 |
|
|
|
(70,051 |
) |
| Call loans |
|
|
53,500 |
|
|
|
46,800 |
|
|
|
6,700 |
|
| Receivables under resale agreements |
|
|
64,984 |
|
|
|
61,489 |
|
|
|
3,494 |
|
| Monetary receivables bought |
|
|
31,559 |
|
|
|
34,585 |
|
|
|
(3,026 |
) |
| Money trusts |
|
|
3,502 |
|
|
|
6,773 |
|
|
|
(3,271 |
) |
| Securities |
|
|
3,454,480 |
|
|
|
3,525,735 |
|
|
|
(71,254 |
) |
| Loans |
|
|
467,274 |
|
|
|
476,173 |
|
|
|
(8,899 |
) |
| Tangible fixed assets |
|
|
209,905 |
|
|
|
212,244 |
|
|
|
(2,338 |
) |
| Intangible fixed assets |
|
|
96 |
|
|
|
758 |
|
|
|
(662 |
) |
| Other assets |
|
|
359,722 |
|
|
|
437,671 |
|
|
|
(77,948 |
) |
| Deferred tax assets |
|
|
150,889 |
|
|
|
121,347 |
|
|
|
29,541 |
|
| Allowance for possible loan losses |
|
|
(3,642 |
) |
|
|
(5,068 |
) |
|
|
1,426 |
|
| Allowance for possible investment losses |
|
|
(7,907 |
) |
|
|
(7,734 |
) |
|
|
(172 |
) |
|
|
|
|
|
|
|
|
|
|
|
|
|
| Total assets |
|
|
4,832,768 |
|
|
|
5,029,232 |
|
|
|
(196,463 |
) |
|
|
|
|
|
|
|
|
|
|
|
|
|
| Liabilities: |
|
|
|
|
|
|
|
|
|
|
|
|
| Underwriting funds: |
|
|
3,674,736 |
|
|
|
3,797,586 |
|
|
|
(122,849 |
) |
| Reserve for outstanding losses and claims |
|
|
630,548 |
|
|
|
687,801 |
|
|
|
(57,252 |
) |
| Underwriting reserves |
|
|
3,044,187 |
|
|
|
3,109,784 |
|
|
|
(65,597 |
) |
| Bonds |
|
|
128,000 |
|
|
|
128,000 |
|
|
|
— |
|
| Other liabilities |
|
|
162,839 |
|
|
|
181,855 |
|
|
|
(19,015 |
) |
| Reserve for retirement benefits |
|
|
81,003 |
|
|
|
76,741 |
|
|
|
4,261 |
|
| Reserve for bonus payments |
|
|
5,088 |
|
|
|
13,405 |
|
|
|
(8,317 |
) |
| Reserves under the special laws: |
|
|
13,821 |
|
|
|
11,462 |
|
|
|
2,358 |
|
| Reserve for price fluctuation |
|
|
13,821 |
|
|
|
11,462 |
|
|
|
2,358 |
|
|
|
|
|
|
|
|
|
|
|
|
|
|
| Total liabilities |
|
|
4,065,489 |
|
|
|
4,209,051 |
|
|
|
(143,562 |
) |
|
|
|
|
|
|
|
|
|
|
|
|
|
| Net assets: |
|
|
|
|
|
|
|
|
|
|
|
|
| Shareholders’ equity: |
|
|
|
|
|
|
|
|
|
|
|
|
| Common stock |
|
|
70,000 |
|
|
|
70,000 |
|
|
|
— |
|
| Capital surplus |
|
|
24,229 |
|
|
|
24,229 |
|
|
|
— |
|
| Retained earnings |
|
|
341,269 |
|
|
|
338,304 |
|
|
|
2,965 |
|
| Total shareholders’ equity |
|
|
435,499 |
|
|
|
432,534 |
|
|
|
2,965 |
|
| Valuation and translation adjustments: |
|
|
|
|
|
|
|
|
|
|
|
|
| Unrealized gains on securities available for sale, net of tax |
|
|
331,779 |
|
|
|
386,343 |
|
|
|
(54,563 |
) |
| Total valuation and translation adjustments |
|
|
331,779 |
|
|
|
386,343 |
|
|
|
(54,563 |
) |
| Stock acquisition rights |
|
|
— |
|
|
|
1,302 |
|
|
|
(1,302 |
) |
|
|
|
|
|
|
|
|
|
|
|
|
|
| Total net assets |
|
|
767,279 |
|
|
|
820,181 |
|
|
|
(52,901 |
) |
|
|
|
|
|
|
|
|
|
|
|
|
|
| Total liabilities and net assets |
|
|
4,832,768 |
|
|
|
5,029,232 |
|
|
|
(196,463 |
) |
|
|
|
|
|
|
|
|
|
|
|
|
|
2
Sompo Japan Insurance Inc. (Non-consolidated)
Quarterly Statements of Income
|
|
|
|
|
|
|
|
|
|
|
|
|
|
|
|
|
|
|
|
|
| |
|
|
|
|
(Millions of yen) |
|
| |
|
|
|
|
Nine months ended
December 31, 2009
(April 1
to
December 31, 2009) |
|
|
Nine months ended
December 31, 2010
(April 1
to
December 31, 2010) |
|
|
Increase
(Decrease) |
|
|
Rate of
change |
|
| |
|
|
|
|
Amount |
|
|
Amount |
|
|
|
|
|
|
|
| Ordinary income: |
|
|
|
|
|
|
1,246,139 |
|
|
|
1,250,890 |
|
|
|
4,751 |
|
|
|
0.4 |
% |
| Underwriting income: |
|
|
|
|
|
|
1,191,885 |
|
|
|
1,199,925 |
|
|
|
8,040 |
|
|
|
0.7 |
|
| Net premiums written |
|
|
|
|
|
|
951,167 |
|
|
|
953,354 |
|
|
|
2,186 |
|
|
|
0.2 |
|
| Deposits of premiums by policyholders |
|
|
|
|
|
|
86,824 |
|
|
|
90,610 |
|
|
|
3,786 |
|
|
|
4.4 |
|
| Interest and dividend income on deposits of premiums, etc. |
|
|
|
|
|
|
31,668 |
|
|
|
29,333 |
|
|
|
(2,334 |
) |
|
|
(7.4 |
) |
| Reversal of reserve for outstanding losses and claims |
|
|
|
|
|
|
68,586 |
|
|
|
57,252 |
|
|
|
(11,334 |
) |
|
|
(16.5 |
) |
| Reversal of underwriting reserves |
|
|
|
|
|
|
52,198 |
|
|
|
65,597 |
|
|
|
13,398 |
|
|
|
25.7 |
|
| Investment income: |
|
|
|
|
|
|
49,818 |
|
|
|
46,836 |
|
|
|
(2,981 |
) |
|
|
(6.0 |
) |
| Interest and dividend income |
|
|
|
|
|
|
66,092 |
|
|
|
62,758 |
|
|
|
(3,333 |
) |
|
|
(5.0 |
) |
| Investment gains on money trusts |
|
|
|
|
|
|
0 |
|
|
|
0 |
|
|
|
0 |
|
|
|
810.4 |
|
| Investment gains on trading securities |
|
|
|
|
|
|
25 |
|
|
|
— |
|
|
|
(25 |
) |
|
|
(100.0 |
) |
| Gains on sales of securities |
|
|
|
|
|
|
12,538 |
|
|
|
4,737 |
|
|
|
(7,801 |
) |
|
|
(62.2 |
) |
| Transfer of interest and dividend income on deposits of premiums, etc. |
|
|
|
|
|
|
(31,668 |
) |
|
|
(29,333 |
) |
|
|
2,334 |
|
|
|
— |
|
| Other ordinary income |
|
|
|
|
|
|
4,435 |
|
|
|
4,128 |
|
|
|
(306 |
) |
|
|
(6.9 |
) |
|
|
|
|
|
|
|
|
|
|
|
|
|
|
|
|
|
|
|
|
|
| Ordinary expenses: |
|
|
|
|
|
|
1,218,150 |
|
|
|
1,211,186 |
|
|
|
(6,964 |
) |
|
|
(0.6 |
) |
| Underwriting expenses: |
|
|
|
|
|
|
1,011,802 |
|
|
|
1,016,719 |
|
|
|
4,917 |
|
|
|
0.5 |
|
| Net claims paid |
|
|
|
|
|
|
647,426 |
|
|
|
609,055 |
|
|
|
(38,370 |
) |
|
|
(5.9 |
) |
| Loss adjustment expenses |
|
|
|
|
|
|
57,887 |
|
|
|
69,667 |
|
|
|
11,779 |
|
|
|
20.3 |
|
| Net commissions and brokerage fees |
|
|
|
|
|
|
160,338 |
|
|
|
161,168 |
|
|
|
830 |
|
|
|
0.5 |
|
| Maturity refunds to policyholders |
|
|
|
|
|
|
138,682 |
|
|
|
172,814 |
|
|
|
34,131 |
|
|
|
24.6 |
|
| Investment expenses: |
|
|
|
|
|
|
25,018 |
|
|
|
21,935 |
|
|
|
(3,083 |
) |
|
|
(12.3 |
) |
| Investment losses on money trusts |
|
|
|
|
|
|
1,127 |
|
|
|
395 |
|
|
|
(731 |
) |
|
|
(64.9 |
) |
| Investment losses on trading securities |
|
|
|
|
|
|
— |
|
|
|
23 |
|
|
|
23 |
|
|
|
— |
|
| Losses on sales of securities |
|
|
|
|
|
|
5,528 |
|
|
|
2,042 |
|
|
|
(3,485 |
) |
|
|
(63.0 |
) |
| Impairment losses on securities |
|
|
|
|
|
|
6,642 |
|
|
|
6,137 |
|
|
|
(505 |
) |
|
|
(7.6 |
) |
| Operating, general and administrative expenses |
|
|
|
|
|
|
173,990 |
|
|
|
166,407 |
|
|
|
(7,583 |
) |
|
|
(4.4 |
) |
| Other ordinary expenses: |
|
|
|
|
|
|
7,338 |
|
|
|
6,123 |
|
|
|
(1,214 |
) |
|
|
(16.5 |
) |
| Interest paid |
|
|
|
|
|
|
4,246 |
|
|
|
5,299 |
|
|
|
1,053 |
|
|
|
24.8 |
|
|
|
|
|
|
|
|
|
|
|
|
|
|
|
|
|
|
|
|
|
|
| Ordinary profit |
|
|
|
|
|
|
27,989 |
|
|
|
39,704 |
|
|
|
11,715 |
|
|
|
41.9 |
|
|
|
|
|
|
|
|
|
|
|
|
|
|
|
|
|
|
|
|
|
|
| Extraordinary gains: |
|
|
|
|
|
|
15,857 |
|
|
|
3,219 |
|
|
|
(12,637 |
) |
|
|
(79.7 |
) |
| Gains on disposal of fixed assets |
|
|
|
|
|
|
843 |
|
|
|
131 |
|
|
|
(712 |
) |
|
|
(84.5 |
) |
| Other extraordinary gains |
|
|
|
|
|
|
15,013 |
|
|
|
3,088 |
|
|
|
(11,925 |
) |
|
|
(79.4 |
) |
| Extraordinary losses: |
|
|
|
|
|
|
4,909 |
|
|
|
3,679 |
|
|
|
(1,230 |
) |
|
|
(25.1 |
) |
| Losses on disposal of fixed assets |
|
|
|
|
|
|
615 |
|
|
|
293 |
|
|
|
(321 |
) |
|
|
(52.2 |
) |
| Impairment losses |
|
|
|
|
|
|
— |
|
|
|
259 |
|
|
|
259 |
|
|
|
— |
|
| Provision for reserves under the special laws: |
|
|
|
|
|
|
4,294 |
|
|
|
2,358 |
|
|
|
(1,935 |
) |
|
|
(45.1 |
) |
| Provision for reserve for price fluctuation |
|
|
|
|
|
|
4,294 |
|
|
|
2,358 |
|
|
|
(1,935 |
) |
|
|
(45.1 |
) |
| Other extraordinary losses |
|
|
|
|
|
|
— |
|
|
|
767 |
|
|
|
767 |
|
|
|
— |
|
|
|
|
|
|
|
|
|
|
|
|
|
|
|
|
|
|
|
|
|
|
| Income before income taxes |
|
|
|
|
|
|
38,936 |
|
|
|
39,245 |
|
|
|
308 |
|
|
|
0.8 |
|
| Income taxes and deferred income taxes |
|
|
|
|
|
|
14,784 |
|
|
|
14,340 |
|
|
|
(444 |
) |
|
|
(3.0 |
) |
| Net income |
|
|
|
|
|
|
24,152 |
|
|
|
24,904 |
|
|
|
752 |
|
|
|
3.1 |
|
|
|
|
|
|
|
|
|
|
|
|
|
|
|
|
|
|
|
|
|
|
|
|
|
|
|
|
| Underwriting result: |
|
|
|
|
|
|
|
|
|
|
|
|
|
|
|
|
|
|
|
|
| Net premiums written |
|
|
(+ |
) |
|
|
951,167 |
|
|
|
953,354 |
|
|
|
2,186 |
|
|
|
0.2 |
|
| Net claims paid |
|
|
(– |
) |
|
|
647,426 |
|
|
|
609,055 |
|
|
|
(38,370 |
) |
|
|
(5.9 |
) |
| Loss adjustment expenses |
|
|
(– |
) |
|
|
57,887 |
|
|
|
69,667 |
|
|
|
11,779 |
|
|
|
20.3 |
|
| Operating expenses: |
|
|
(– |
) |
|
|
325,436 |
|
|
|
319,514 |
|
|
|
(5,921 |
) |
|
|
(1.8 |
) |
| Net commissions and brokerage fees |
|
|
|
|
|
|
160,338 |
|
|
|
161,168 |
|
|
|
830 |
|
|
|
0.5 |
|
| Operating, general and administrative expenses related to underwriting |
|
|
|
|
|
|
165,097 |
|
|
|
158,346 |
|
|
|
(6,751 |
) |
|
|
(4.1 |
) |
| Underwriting result |
|
|
|
|
|
|
(79,582 |
) |
|
|
(44,883 |
) |
|
|
34,699 |
|
|
|
— |
|
|
|
|
|
|
|
|
|
|
|
|
|
|
|
|
|
|
|
|
|
|
| Underwriting profit |
|
|
|
|
|
|
13,125 |
|
|
|
22,416 |
|
|
|
9,291 |
|
|
|
70.8 |
|
|
|
|
|
|
|
|
|
|
|
|
|
|
|
|
|
|
|
|
|
|
| Ratios: |
|
|
|
|
|
|
|
|
|
|
|
|
|
|
|
|
|
|
|
|
| Net loss ratio |
|
|
( |
%) |
|
|
74.2 |
|
|
|
71.2 |
|
|
|
(3.0 |
) |
|
|
|
|
| Net expense ratio |
|
|
( |
%) |
|
|
34.2 |
|
|
|
33.5 |
|
|
|
(0.7 |
) |
|
|
|
|
| Underwriting result ratio |
|
|
( |
%) |
|
|
(8.4 |
) |
|
|
(4.7 |
) |
|
|
3.7 |
|
|
|
|
|
3
Sompo Japan Insurance Inc. (Non-consolidated)
Premiums Written and Claims Paid by Lines of Business
Direct premiums
written (excluding deposits of premiums by policyholders)
|
|
|
|
|
|
|
|
|
|
|
|
|
|
|
|
|
|
|
|
|
|
|
|
|
| |
|
(Millions of yen) |
|
| |
|
Nine months ended December 31, 2009
(April 1 to December 31,
2009) |
|
|
Nine months ended December 31, 2010
(April 1 to December 31,
2010) |
|
| Business line |
|
Amount |
|
|
% of total
amount |
|
|
Rate of
change |
|
|
Amount |
|
|
% of total
amount |
|
|
Rate of
change |
|
| Fire and allied insurance |
|
|
137,276 |
|
|
|
13.7 |
% |
|
|
(0.8 |
)% |
|
|
132,385 |
|
|
|
13.2 |
% |
|
|
(3.6 |
)% |
| Marine insurance |
|
|
21,570 |
|
|
|
2.2 |
|
|
|
(24.3 |
) |
|
|
23,467 |
|
|
|
2.3 |
|
|
|
8.8 |
|
| Personal accident insurance |
|
|
97,573 |
|
|
|
9.7 |
|
|
|
(1.1 |
) |
|
|
98,026 |
|
|
|
9.7 |
|
|
|
0.5 |
|
| Voluntary automobile insurance |
|
|
482,910 |
|
|
|
48.2 |
|
|
|
(2.6 |
) |
|
|
480,627 |
|
|
|
47.8 |
|
|
|
(0.5 |
) |
| Compulsory automobile liability insurance |
|
|
132,319 |
|
|
|
13.2 |
|
|
|
(10.6 |
) |
|
|
132,447 |
|
|
|
13.2 |
|
|
|
0.1 |
|
| Others |
|
|
130,852 |
|
|
|
13.1 |
|
|
|
0.4 |
|
|
|
138,984 |
|
|
|
13.8 |
|
|
|
6.2 |
|
|
|
|
|
|
|
|
|
|
|
|
|
|
|
|
|
|
|
|
|
|
|
|
|
|
| Total |
|
|
1,002,501 |
|
|
|
100.0 |
|
|
|
(3.6 |
) |
|
|
1,005,938 |
|
|
|
100.0 |
|
|
|
0.3 |
|
| Deposits of premiums by policyholders |
|
|
86,824 |
|
|
|
— |
|
|
|
(22.3 |
) |
|
|
90,610 |
|
|
|
— |
|
|
|
4.4 |
|
|
|
|
|
|
|
|
|
|
|
|
|
|
|
|
|
|
|
|
|
|
|
|
|
|
| Net premiums
written |
|
|
|
|
|
|
|
|
|
|
|
|
|
|
|
|
|
|
|
|
|
|
|
|
| |
|
(Millions of yen) |
|
| |
|
Nine months ended December 31, 2009
(April 1 to December 31,
2009) |
|
|
Nine months ended December 31, 2010
(April 1 to December 31,
2010) |
|
| Business line |
|
Amount |
|
|
% of total
amount |
|
|
Rate of
change |
|
|
Amount |
|
|
% of total
amount |
|
|
Rate of
change |
|
| Fire and allied insurance |
|
|
107,253 |
|
|
|
11.3 |
% |
|
|
(1.5 |
)% |
|
|
106,453 |
|
|
|
11.2 |
% |
|
|
(0.7 |
)% |
| Marine insurance |
|
|
17,924 |
|
|
|
1.9 |
|
|
|
(25.4 |
) |
|
|
19,081 |
|
|
|
2.0 |
|
|
|
6.5 |
|
| Personal accident insurance |
|
|
96,435 |
|
|
|
10.1 |
|
|
|
(1.1 |
) |
|
|
97,453 |
|
|
|
10.2 |
|
|
|
1.1 |
|
| Voluntary automobile insurance |
|
|
483,336 |
|
|
|
50.8 |
|
|
|
(2.2 |
) |
|
|
481,165 |
|
|
|
50.5 |
|
|
|
(0.4 |
) |
| Compulsory automobile liability insurance |
|
|
123,076 |
|
|
|
12.9 |
|
|
|
(12.2 |
) |
|
|
125,868 |
|
|
|
13.2 |
|
|
|
2.3 |
|
| Others |
|
|
123,141 |
|
|
|
12.9 |
|
|
|
0.8 |
|
|
|
123,331 |
|
|
|
12.9 |
|
|
|
0.2 |
|
|
|
|
|
|
|
|
|
|
|
|
|
|
|
|
|
|
|
|
|
|
|
|
|
|
| Total |
|
|
951,167 |
|
|
|
100.0 |
|
|
|
(3.6 |
) |
|
|
953,354 |
|
|
|
100.0 |
|
|
|
0.2 |
|
|
|
|
|
|
|
|
|
|
|
|
|
|
|
|
|
|
|
|
|
|
|
|
|
|
| Net claims
paid |
|
|
|
|
|
|
|
|
|
|
|
|
|
|
|
|
|
|
|
|
|
|
|
|
| |
|
(Millions of yen) |
|
| |
|
Nine months ended December 31, 2009
(April 1 to December 31,
2009) |
|
|
Nine months ended December 31, 2010
(April 1 to December 31,
2010) |
|
| Business line |
|
Amount |
|
|
Rate of
change |
|
|
Net loss
ratio |
|
|
Amount |
|
|
Rate of
change |
|
|
Net loss
ratio |
|
| Fire and allied insurance |
|
|
46,329 |
|
|
|
11.3 |
% |
|
|
44.7 |
% |
|
|
41,589 |
|
|
|
(10.2 |
)% |
|
|
40.8 |
% |
| Marine insurance |
|
|
10,031 |
|
|
|
(7.0 |
) |
|
|
60.6 |
|
|
|
10,886 |
|
|
|
8.5 |
|
|
|
60.8 |
|
| Personal accident insurance |
|
|
50,541 |
|
|
|
0.4 |
|
|
|
57.6 |
|
|
|
51,564 |
|
|
|
2.0 |
|
|
|
58.4 |
|
| Voluntary automobile insurance |
|
|
296,905 |
|
|
|
(2.0 |
) |
|
|
68.7 |
|
|
|
293,286 |
|
|
|
(1.2 |
) |
|
|
70.6 |
|
| Compulsory automobile liability insurance |
|
|
117,742 |
|
|
|
(3.5 |
) |
|
|
104.0 |
|
|
|
117,996 |
|
|
|
0.2 |
|
|
|
101.2 |
|
| Others |
|
|
125,875 |
|
|
|
95.0 |
|
|
|
106.3 |
|
|
|
93,731 |
|
|
|
(25.5 |
) |
|
|
80.6 |
|
|
|
|
|
|
|
|
|
|
|
|
|
|
|
|
|
|
|
|
|
|
|
|
|
|
| Total |
|
|
647,426 |
|
|
|
9.3 |
|
|
|
74.2 |
|
|
|
609,055 |
|
|
|
(5.9 |
) |
|
|
71.2 |
|
|
|
|
|
|
|
|
|
|
|
|
|
|
|
|
|
|
|
|
|
|
|
|
|
|
4
Sompo Japan Insurance Inc. (Non-consolidated)
Solvency Margin Ratio
|
|
|
|
|
|
|
|
|
| |
|
(Millions of yen) |
|
| |
|
As of December 31, 2010 |
|
|
As of March 31, 2010 |
|
| (A) Total Solvency Margin |
|
|
1,571,422 |
|
|
|
1,671,429 |
|
| Capital and funds, etc. |
|
|
435,499 |
|
|
|
414,156 |
|
| Reserve for price fluctuation |
|
|
13,821 |
|
|
|
11,462 |
|
| Contingency reserve |
|
|
611 |
|
|
|
611 |
|
| Catastrophic loss reserve |
|
|
481,312 |
|
|
|
466,702 |
|
| General allowance for possible loan losses |
|
|
276 |
|
|
|
992 |
|
| Unrealized gains on securities (before tax effect deductions) |
|
|
464,201 |
|
|
|
536,605 |
|
| Net unrealized gains and losses on real estate |
|
|
30,208 |
|
|
|
52,252 |
|
| Excess amount of reserve for maturity refunds |
|
|
— |
|
|
|
— |
|
| Subordinated debt, etc. |
|
|
128,000 |
|
|
|
128,000 |
|
| Deductions |
|
|
157,460 |
|
|
|
101,616 |
|
| Others |
|
|
174,952 |
|
|
|
162,261 |
|
| (B) Total Risks
|
|
|
407,089 |
|
|
|
417,827 |
|
| Underwriting risk (R1) |
|
|
83,979 |
|
|
|
83,975 |
|
| Underwriting risk for third-sector insurance products including accident, sickness and nursing-care insurance (R2)
|
|
|
— |
|
|
|
— |
|
| Guaranteed interest rate risk (R3) |
|
|
5,332 |
|
|
|
5,368 |
|
| Investment risk (R4) |
|
|
175,548 |
|
|
|
185,633 |
|
| Business management risk (R5) |
|
|
9,265 |
|
|
|
9,493 |
|
| Major catastrophe risk (R6) |
|
|
198,398 |
|
|
|
199,686 |
|
| (C) Solvency Margin Ratio |
|
|
|
|
|
|
|
|
| [ (A) / {(B) × 1/2} ] × 100 |
|
|
772.0 |
% |
|
|
800.0 |
% |
| Note) |
The above figures are calculated based on Articles 86 and 87 of the Ordinance for Enforcement of the Insurance Business Law and the provisions of Notification
No. 50 of the Ministry of Finance (1996). The figures as of December 31, 2010 are partly calculated on the simplified method, for example, some bases for the major catastrophe risk calculation are deemed same as the figures as of
September 30, 2010. |
5
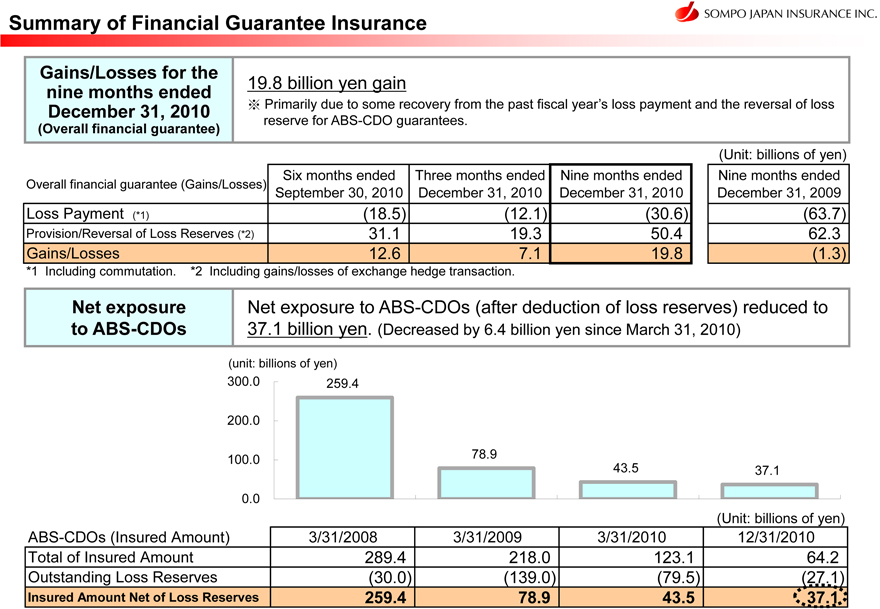
Exposure to Structured Finance
As of December 31, 2010
February 14, 2011
Summary of Financial
Guarantee Insurance
Gains/Losses for the nine months ended December 31, 2010
(Overall financial guarantee)
19.8 billion yen gain
Primarily due to some
recovery from the past fiscal year’s loss payment and the reversal of loss reserve for ABS-CDO guarantees.
(Unit: billions of yen)
Overall financial guarantee (Gains/Losses)
Six
months ended September 30, 2010
Three months ended December 31, 2010
Nine months ended December 31, 2010
Nine months ended December 31, 2009
Loss
Payment (*1) (18.5) (12.1) (30.6) (63.7)
Provision/Reversal of Loss Reserves (*2) 31.1 19.3 50.4 62.3
Gains/Losses 12.6 7.1 19.8(1.3)
*1 Including commutation.
*2 Including
gains/losses of exchange hedge transaction.
Net exposure to ABS-CDOs
Net exposure to ABS-CDOs (after deduction of loss reserves) reduced to 37.1 billion yen. (Decreased by 6.4 billion yen
since March 31, 2010)
(unit: billions of yen)
300.0
259.4
200.0
100.0
78.9
43.5
37.1
0.0
(Unit: billions of yen)
ABS-CDOs (Insured Amount) 3/31/2008 3/31/2009 3/31/2010 12/31/2010
Total of Insured Amount 289.4 218.0 123.1 64.2
Outstanding Loss Reserves (30.0) (139.0) (79.5) (27.1)
Insured Amount Net of Loss Reserves 259.4 78.9 43.5 37.1
6
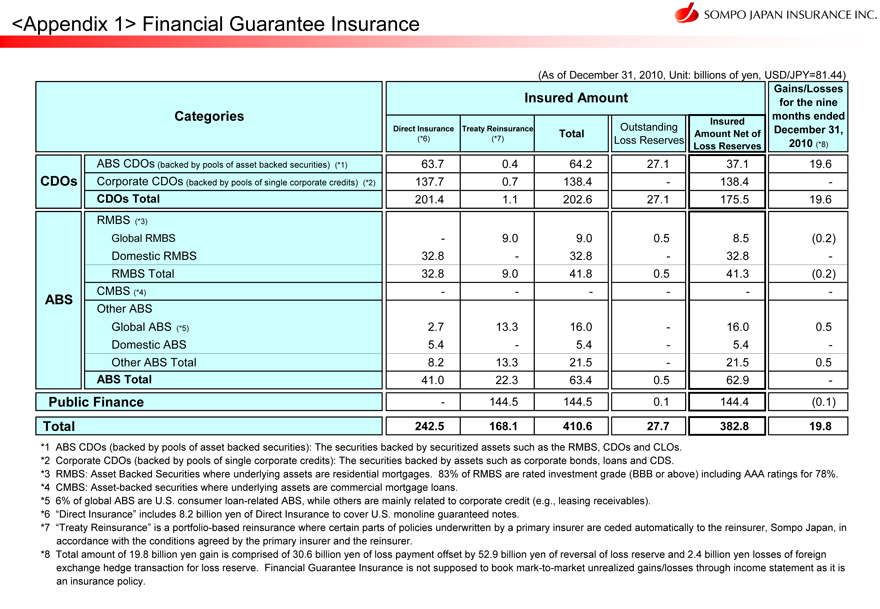
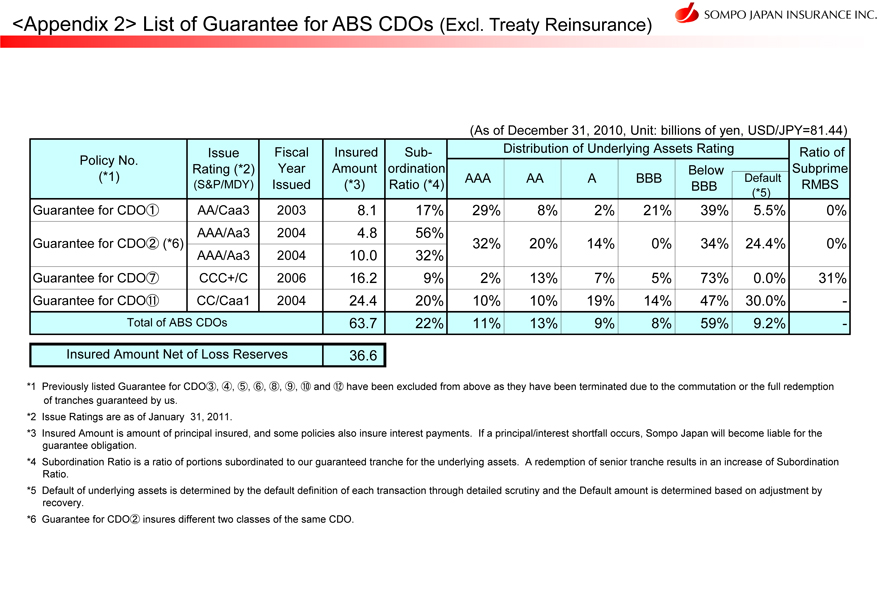
<Appendix 1> Financial Guarantee Insurance
(As of December 31, 2010, Unit: billions of yen, USD/JPY=81.44)
Gains/Losses for the nine months ended December 31, 2010 (*8)
Categories
Insured Amount
Direct Insurance (*6)
Treaty Reinsurance (*7)
Total
Outstanding Loss Reserves
Insured Amount Net of Loss Reserves
ABS CDOs (backed by pools of asset backed securities) (*1) 63.7 0.4 64.2 27.1 37.1 19.6
CDOs Corporate CDOs (backed by pools of single corporate credits) (*2) 137.7 0.7 138.4 - 138.4 -
CDOs Total 201.4 1.1 202.6 27.1 175.5 19.6
RMBS
(*3)
Global RMBS - 9.0 9.0 0.5 8.5(0.2)
Domestic RMBS 32.8 - 32.8 - 32.8 -
RMBS Total 32.8 9.0 41.8 0.5 41.3(0.2)
ABS
CMBS (*4) - - - - - -
Other ABS
Global ABS (*5) 2.7 13.3 16.0 - 16.0
0.5
Domestic ABS 5.4 - 5.4 - 5.4 -
Other ABS Total 8.2 13.3 21.5 - 21.5 0.5
ABS
Total 41.0 22.3 63.4 0.5 62.9 -
Public Finance - 144.5 144.5 0.1 144.4 (0.1)
Total 242.5 168.1 410.6 27.7 382.8 19.8
*1 ABS CDOs (backed by pools of asset backed securities): The securities backed by securitized assets such as the RMBS, CDOs and CLOs.
*2 Corporate CDOs (backed by pools of single corporate credits): The securities backed by assets such as corporate bonds,
loans and CDS.
*3 RMBS: Asset Backed Securities where underlying assets are residential mortgages. 83% of RMBS
are rated investment grade (BBB or above) including AAA ratings for 78%.
*4 CMBS: Asset-backed securities
where underlying assets are commercial mortgage loans.
*5 6% of global ABS are U.S. consumer loan-related ABS,
while others are mainly related to corporate credit (e.g., leasing receivables).
*6 “Direct
Insurance” includes 8.2 billion yen of Direct Insurance to cover U.S. monoline guaranteed notes.
*7
“Treaty Reinsurance” is a portfolio-based reinsurance where certain parts of policies underwritten by a primary insurer are ceded automatically to the reinsurer, Sompo Japan, in
accordance with the conditions agreed by the primary insurer and the reinsurer.
*8 Total amount of 19.8 billion yen gain is comprised of 30.6 billion yen of loss payment offset by 52.9 billion yen of
reversal of loss reserve and 2.4 billion yen losses of foreign exchange hedge transaction for loss reserve. Financial Guarantee Insurance is not supposed to book mark-to-market unrealized gains/losses through income statement as it is an insurance
policy.
<Appendix 2> List of Guarantee for ABS CDOs (Excl. Treaty Reinsurance)
(As of December 31, 2010, Unit: billions of yen, USD/JPY=81.44)
Policy No. (*1)
Issue Rating (*2) (S&P/MDY)
Fiscal Year
Issued
Insured Amount (*3)
Sub- ordination Ratio (*4)
Distribution of
Underlying Assets Rating
Ratio of Subprime RMBS
Below BBB
AAA
AA
A
BBB
Default (*5)
Guarantee for CDO 1 AA/Caa3 2003 8.1 17% 29% 8% 2% 21% 39% 5.5% 0%
Guarantee for CDO 2 (*6)
AAA/Aa3 2004 4.8 56%
AAA/Aa3 2004 10.0 32%
32% 20% 14% 0% 34% 24.4% 0%
Guarantee for CDO 7 CCC+/C 2006 16.2 9% 2% 13% 7% 5% 73% 0.0% 31%
Guarantee for CDO 11 CC/Caa1 2004 24.4 20% 10% 10% 19% 14% 47% 30.0% -
Total of ABS CDOs 63.7 22% 11% 13% 9% 8% 59% 9.2% -
Insured Amount Net of Loss Reserves 36.6
*1 Previously listed Guarantee for CDO 3,4,5,6,8,9,10 and 12 have been excluded from above as they have been terminated due to the commutation or the full redemption of tranches guaranteed
by us.
*2 Issue Ratings are as of January 31, 2011.
*3 Insured Amount is amount of principal insured, and some policies also insure interest payments. If a principal/interest
shortfall occurs, Sompo Japan will become liable for the guarantee obligation.
*4 Subordination Ratio is a
ratio of portions subordinated to our guaranteed tranche for the underlying assets. A redemption of senior tranche results in an increase of Subordination Ratio.
*5 Default of underlying assets is determined by the default definition of each transaction through detailed scrutiny and the Default amount is determined based on adjustment by recovery.
*6 Guarantee for CDO2 insures different two classes of the same CDO.
7
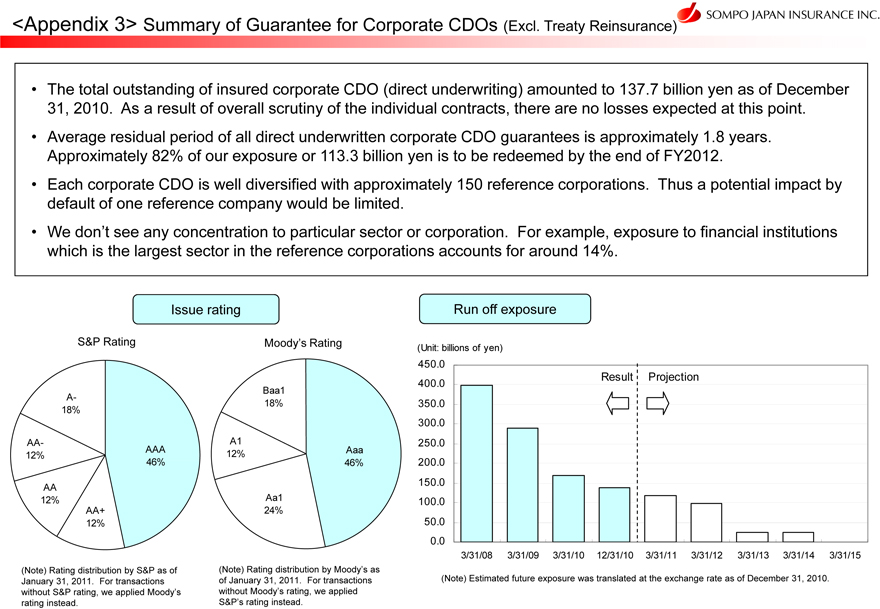
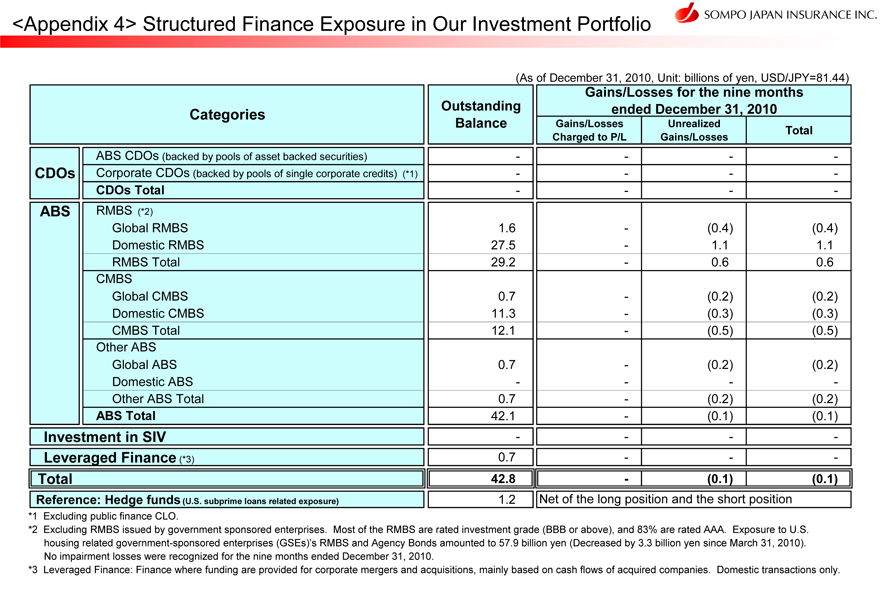
<Appendix 3> Summary of Guarantee for Corporate CDOs (Excl. Treaty Reinsurance)
• The total outstanding of insured corporate CDO (direct underwriting) amounted to 137.7 billion yen as
of December 31, 2010. As a result of overall scrutiny of the individual contracts, there are no losses expected at this point.
• Average residual period of all direct underwritten corporate CDO guarantees is approximately 1.8 years. Approximately 82% of our exposure or 113.3 billion yen is to be redeemed by
the end of FY2012.
• Each corporate CDO is well diversified with approximately 150 reference
corporations. Thus a potential impact by default of one reference company would be limited.
• We
don’t see any concentration to particular sector or corporation. For example, exposure to financial institutions which is the largest sector in the reference corporations accounts for around 14%.
Issue rating
S&P Rating Moody’s Rating
Baa1 18% A-
18%
AA- 12% A1 12%
AAA 46% Aaa 46%
AA 12% A1 12%
AA+ 12% Aa124%
(Note) Rating distribution by S&P as of January 31, 2011. For transactions without S&P rating, we applied Moody’s rating instead.
(Note) Rating distribution by Moody’s as of January 31, 2011. For transactions without Moody’s rating, we
applied S&P’s rating instead.
Run off exposure
(Unit: billions of yen)
450.0 400.0 350.0 300.0 250.0 200.0 150.0 100.0 50.0 0.0
Result Projection
3/31/08 3/31/09 3/31/10
12/31/10 3/31/11 3/31/12 3/31/13 3/31/14 3/31/15
(Note) Estimated future exposure was translated at the
exchange rate as of December 31, 2010.
<Appendix 4> Structured Finance Exposure in Our Investment
Portfolio
(As of December 31, 2010, Unit: billions of yen, USD/JPY=81.44)
Categories Outstanding Balance Gains/Losses for the nine months ended December 31, 2010
Gains/Losses Charged to P/L Unrealized Gains/Losses Total
ABS CDOs (backed by pools of asset backed securities) - - - -
CDOs Corporate CDOs (backed by pools of single corporate credits) (*1) - - - -
CDOs Total - - - -
ABS RMBS (*2)
Global RMBS 1.6 - (0.4) (0.4)
Domestic RMBS 27.5 - 1.1 1.1
RMBS Total 29.2 - 0.6 0.6
CMBS
Global CMBS 0.7 - (0.2) (0.2)
Domestic CMBS 11.3 - (0.3) (0.3)
CMBS Total 12.1
- - (0.5) (0.5)
Other ABS
Global ABS 0.7 - (0.2) (0.2)
Domestic ABS - - - -
Other ABS Total 0.7 - (0.2) (0.2)
ABS Total 42.1 - (0.1) (0.1)
Investment in SIV -
- - - -
Leveraged Finance (*3) 0.7 - - -
Total 42.8 - (0.1) (0.1)
Reference: Hedge funds (U.S. subprime loans related exposure) 1.2 Net of the long position and the short position
*1 Excluding public finance CLO.
*2 Excluding
RMBS issued by government sponsored enterprises. Most of the RMBS are rated investment grade (BBB or above), and 83% are rated AAA. Exposure to U.S. housing related government-sponsored enterprises (GSEs)’s RMBS and Agency Bonds amounted to
57.9 billion yen (Decreased by 3.3 billion yen since March 31, 2010).
No impairment losses were
recognized for the nine months ended December 31, 2010.
*3 Leveraged Finance: Finance where funding are
provided for corporate mergers and acquisitions, mainly based on cash flows of acquired companies. Domestic transactions only.
8
NIPPONKOA Insurance Co., Ltd. (Non-consolidated)
Quarterly Balance Sheets
|
|
|
|
|
|
|
|
|
|
|
|
|
| |
|
(Millions of yen) |
|
| |
|
As of December 31, 2010 |
|
|
As of March 31, 2010 |
|
|
Increase
(Decrease) |
|
| |
|
Amount |
|
|
Amount |
|
|
|
|
| Assets: |
|
|
|
|
|
|
|
|
|
|
|
|
| Cash and deposits |
|
|
95,111 |
|
|
|
80,793 |
|
|
|
14,317 |
|
| Call loans |
|
|
10,000 |
|
|
|
50,000 |
|
|
|
(40,000 |
) |
| Monetary receivables bought |
|
|
3,161 |
|
|
|
6,129 |
|
|
|
(2,967 |
) |
| Money trusts |
|
|
56,333 |
|
|
|
56,752 |
|
|
|
(418 |
) |
| Securities |
|
|
1,757,100 |
|
|
|
1,822,848 |
|
|
|
(65,748 |
) |
| Loans |
|
|
204,638 |
|
|
|
227,417 |
|
|
|
(22,779 |
) |
| Tangible fixed assets |
|
|
127,722 |
|
|
|
130,437 |
|
|
|
(2,715 |
) |
| Intangible fixed assets |
|
|
528 |
|
|
|
534 |
|
|
|
(6 |
) |
| Other assets |
|
|
164,966 |
|
|
|
159,263 |
|
|
|
5,702 |
|
| Deferred tax assets |
|
|
74,055 |
|
|
|
60,392 |
|
|
|
13,662 |
|
| Allowance for possible loan losses |
|
|
(2,122 |
) |
|
|
(2,106 |
) |
|
|
(16 |
) |
|
|
|
|
|
|
|
|
|
|
|
|
|
| Total assets |
|
|
2,491,494 |
|
|
|
2,592,464 |
|
|
|
(100,969 |
) |
|
|
|
|
|
|
|
|
|
|
|
|
|
| Liabilities: |
|
|
|
|
|
|
|
|
|
|
|
|
| Underwriting funds: |
|
|
1,990,867 |
|
|
|
2,059,290 |
|
|
|
(68,423 |
) |
| Reserve for outstanding losses and claims |
|
|
265,060 |
|
|
|
267,872 |
|
|
|
(2,812 |
) |
| Underwriting reserves |
|
|
1,725,807 |
|
|
|
1,791,418 |
|
|
|
(65,610 |
) |
| Other liabilities |
|
|
56,364 |
|
|
|
65,184 |
|
|
|
(8,820 |
) |
| Reserve for retirement benefits |
|
|
24,220 |
|
|
|
22,583 |
|
|
|
1,636 |
|
| Reserve for bonus payments |
|
|
1,619 |
|
|
|
6,078 |
|
|
|
(4,458 |
) |
| Reserve for bonus payments to directors |
|
|
— |
|
|
|
41 |
|
|
|
(41 |
) |
| Reserves under the special laws: |
|
|
7,931 |
|
|
|
5,643 |
|
|
|
2,288 |
|
| Reserve for price fluctuation |
|
|
7,931 |
|
|
|
5,643 |
|
|
|
2,288 |
|
|
|
|
|
|
|
|
|
|
|
|
|
|
| Total liabilities |
|
|
2,081,002 |
|
|
|
2,158,821 |
|
|
|
(77,819 |
) |
|
|
|
|
|
|
|
|
|
|
|
|
|
| Net assets: |
|
|
|
|
|
|
|
|
|
|
|
|
| Shareholders’ equity: |
|
|
|
|
|
|
|
|
|
|
|
|
| Common stock |
|
|
91,249 |
|
|
|
91,249 |
|
|
|
— |
|
| Capital surplus |
|
|
46,702 |
|
|
|
46,702 |
|
|
|
— |
|
| Retained earnings |
|
|
119,735 |
|
|
|
117,202 |
|
|
|
2,533 |
|
| Total shareholders’ equity |
|
|
257,686 |
|
|
|
255,153 |
|
|
|
2,533 |
|
| Valuation and translation adjustments: |
|
|
|
|
|
|
|
|
|
|
|
|
| Unrealized gains on securities available for sale, net of tax |
|
|
148,531 |
|
|
|
175,808 |
|
|
|
(27,276 |
) |
| Deferred gains on hedges |
|
|
4,274 |
|
|
|
2,115 |
|
|
|
2,158 |
|
| Total valuation and translation adjustments |
|
|
152,806 |
|
|
|
177,924 |
|
|
|
(25,118 |
) |
| Stock acquisition rights |
|
|
— |
|
|
|
565 |
|
|
|
(565 |
) |
|
|
|
|
|
|
|
|
|
|
|
|
|
| Total net assets |
|
|
410,492 |
|
|
|
433,642 |
|
|
|
(23,150 |
) |
|
|
|
|
|
|
|
|
|
|
|
|
|
| Total liabilities and net assets |
|
|
2,491,494 |
|
|
|
2,592,464 |
|
|
|
(100,969 |
) |
|
|
|
|
|
|
|
|
|
|
|
|
|
9
NIPPONKOA Insurance Co., Ltd. (Non-consolidated)
Quarterly Statements of Income
|
|
|
|
|
|
|
|
|
|
|
|
|
|
|
|
|
|
|
|
|
| |
|
|
|
|
(Millions of yen) |
|
| |
|
|
|
|
Nine months ended
December 31, 2009
(April 1
to
December 31, 2009) |
|
|
Nine months ended
December 31, 2010
(April 1
to
December 31, 2010) |
|
|
Increase
(Decrease) |
|
|
Rate of
change |
|
| |
|
|
|
|
Amount |
|
|
Amount |
|
|
|
|
|
|
|
| Ordinary income: |
|
|
|
|
|
|
640,987 |
|
|
|
614,517 |
|
|
|
(26,470 |
) |
|
|
(4.1 |
)% |
| Underwriting income: |
|
|
|
|
|
|
608,294 |
|
|
|
582,868 |
|
|
|
(25,425 |
) |
|
|
(4.2 |
) |
| Net premiums written |
|
|
|
|
|
|
480,629 |
|
|
|
471,742 |
|
|
|
(8,887 |
) |
|
|
(1.8 |
) |
| Deposits of premiums by policyholders |
|
|
|
|
|
|
29,725 |
|
|
|
27,187 |
|
|
|
(2,537 |
) |
|
|
(8.5 |
) |
| Interest and dividend income on deposits of premiums, etc. |
|
|
|
|
|
|
17,284 |
|
|
|
15,480 |
|
|
|
(1,804 |
) |
|
|
(10.4 |
) |
| Reversal of reserve for outstanding losses and claims |
|
|
|
|
|
|
2,986 |
|
|
|
2,812 |
|
|
|
(174 |
) |
|
|
(5.8 |
) |
| Reversal of underwriting reserves |
|
|
|
|
|
|
77,408 |
|
|
|
65,610 |
|
|
|
(11,797 |
) |
|
|
(15.2 |
) |
| Investment income: |
|
|
|
|
|
|
31,660 |
|
|
|
30,534 |
|
|
|
(1,126 |
) |
|
|
(3.6 |
) |
| Interest and dividend income |
|
|
|
|
|
|
35,617 |
|
|
|
33,706 |
|
|
|
(1,911 |
) |
|
|
(5.4 |
) |
| Investment gains on money trusts |
|
|
|
|
|
|
1,746 |
|
|
|
453 |
|
|
|
(1,292 |
) |
|
|
(74.0 |
) |
| Gains on sales of securities |
|
|
|
|
|
|
8,205 |
|
|
|
10,260 |
|
|
|
2,055 |
|
|
|
25.0 |
|
| Transfer of interest and dividend income on deposits of premiums, etc. |
|
|
|
|
|
|
(17,284 |
) |
|
|
(15,480 |
) |
|
|
1,804 |
|
|
|
— |
|
| Other ordinary income |
|
|
|
|
|
|
1,033 |
|
|
|
1,114 |
|
|
|
80 |
|
|
|
7.8 |
|
|
|
|
|
|
|
|
|
|
|
|
|
|
|
|
|
|
|
|
|
|
| Ordinary expenses: |
|
|
|
|
|
|
618,764 |
|
|
|
597,882 |
|
|
|
(20,881 |
) |
|
|
(3.4 |
) |
| Underwriting expenses: |
|
|
|
|
|
|
514,789 |
|
|
|
494,286 |
|
|
|
(20,503 |
) |
|
|
(4.0 |
) |
| Net claims paid |
|
|
|
|
|
|
300,424 |
|
|
|
296,235 |
|
|
|
(4,188 |
) |
|
|
(1.4 |
) |
| Loss adjustment expenses |
|
|
|
|
|
|
26,440 |
|
|
|
26,193 |
|
|
|
(246 |
) |
|
|
(0.9 |
) |
| Net commissions and brokerage fees |
|
|
|
|
|
|
81,706 |
|
|
|
79,295 |
|
|
|
(2,410 |
) |
|
|
(2.9 |
) |
| Maturity refunds to policyholders |
|
|
|
|
|
|
105,924 |
|
|
|
91,154 |
|
|
|
(14,769 |
) |
|
|
(13.9 |
) |
| Investment expenses: |
|
|
|
|
|
|
9,864 |
|
|
|
10,411 |
|
|
|
546 |
|
|
|
5.5 |
|
| Investment losses on money trusts |
|
|
|
|
|
|
196 |
|
|
|
513 |
|
|
|
317 |
|
|
|
161.8 |
|
| Losses on sales of securities |
|
|
|
|
|
|
2,831 |
|
|
|
4,888 |
|
|
|
2,057 |
|
|
|
72.7 |
|
| Impairment losses on securities |
|
|
|
|
|
|
2,846 |
|
|
|
2,334 |
|
|
|
(511 |
) |
|
|
(18.0 |
) |
| Operating, general and administrative expenses |
|
|
|
|
|
|
93,518 |
|
|
|
92,306 |
|
|
|
(1,211 |
) |
|
|
(1.3 |
) |
| Other ordinary expenses: |
|
|
|
|
|
|
591 |
|
|
|
878 |
|
|
|
287 |
|
|
|
48.6 |
|
| Interest paid |
|
|
|
|
|
|
38 |
|
|
|
26 |
|
|
|
(11 |
) |
|
|
(30.4 |
) |
|
|
|
|
|
|
|
|
|
|
|
|
|
|
|
|
|
|
|
|
|
| Ordinary profit |
|
|
|
|
|
|
22,223 |
|
|
|
16,634 |
|
|
|
(5,588 |
) |
|
|
(25.1 |
) |
|
|
|
|
|
|
|
|
|
|
|
|
|
|
|
|
|
|
|
|
|
| Extraordinary gains: |
|
|
|
|
|
|
398 |
|
|
|
746 |
|
|
|
347 |
|
|
|
87.2 |
|
| Gains on disposal of fixed assets |
|
|
|
|
|
|
398 |
|
|
|
181 |
|
|
|
(217 |
) |
|
|
(54.5 |
) |
| Other extraordinary gains |
|
|
|
|
|
|
— |
|
|
|
565 |
|
|
|
565 |
|
|
|
— |
|
| Extraordinary losses: |
|
|
|
|
|
|
4,721 |
|
|
|
3,031 |
|
|
|
(1,690 |
) |
|
|
(35.8 |
) |
| Losses on disposal of fixed assets |
|
|
|
|
|
|
323 |
|
|
|
178 |
|
|
|
(144 |
) |
|
|
(44.8 |
) |
| Impairment losses |
|
|
|
|
|
|
68 |
|
|
|
402 |
|
|
|
334 |
|
|
|
489.5 |
|
| Provision for reserves under the special laws: |
|
|
|
|
|
|
1,922 |
|
|
|
2,288 |
|
|
|
365 |
|
|
|
19.0 |
|
| Provision for reserve for price fluctuation |
|
|
|
|
|
|
1,922 |
|
|
|
2,288 |
|
|
|
365 |
|
|
|
19.0 |
|
| Other extraordinary losses |
|
|
|
|
|
|
2,407 |
|
|
|
162 |
|
|
|
(2,245 |
) |
|
|
(93.3 |
) |
|
|
|
|
|
|
|
|
|
|
|
|
|
|
|
|
|
|
|
|
|
| Income before income taxes |
|
|
|
|
|
|
17,900 |
|
|
|
14,349 |
|
|
|
(3,551 |
) |
|
|
(19.8 |
) |
| Income taxes and deferred income taxes |
|
|
|
|
|
|
4,666 |
|
|
|
4,522 |
|
|
|
(144 |
) |
|
|
(3.1 |
) |
| Net income |
|
|
|
|
|
|
13,234 |
|
|
|
9,827 |
|
|
|
(3,406 |
) |
|
|
(25.7 |
) |
|
|
|
|
|
|
|
|
|
|
|
|
|
|
|
|
|
|
|
|
|
|
|
|
|
|
|
| Underwriting result: |
|
|
|
|
|
|
|
|
|
|
|
|
|
|
|
|
|
|
|
|
| Net premiums written |
|
|
(+) |
|
|
|
480,629 |
|
|
|
471,742 |
|
|
|
(8,887 |
) |
|
|
(1.8 |
) |
| Net claims paid |
|
|
(–) |
|
|
|
300,424 |
|
|
|
296,235 |
|
|
|
(4,188 |
) |
|
|
(1.4 |
) |
| Loss adjustment expenses |
|
|
(–) |
|
|
|
26,440 |
|
|
|
26,193 |
|
|
|
(246 |
) |
|
|
(0.9 |
) |
| Operating expenses: |
|
|
(–) |
|
|
|
170,584 |
|
|
|
167,080 |
|
|
|
(3,504 |
) |
|
|
(2.1 |
) |
| Net commissions and brokerage fees |
|
|
|
|
|
|
81,706 |
|
|
|
79,295 |
|
|
|
(2,410 |
) |
|
|
(2.9 |
) |
| Operating, general and administrative expenses related to underwriting |
|
|
|
|
|
|
88,878 |
|
|
|
87,784 |
|
|
|
(1,094 |
) |
|
|
(1.2 |
) |
| Underwriting result |
|
|
|
|
|
|
(16,819 |
) |
|
|
(17,766 |
) |
|
|
(946 |
) |
|
|
— |
|
|
|
|
|
|
|
|
|
|
|
|
|
|
|
|
|
|
|
|
|
|
| Underwriting profit |
|
|
|
|
|
|
3,123 |
|
|
|
(111 |
) |
|
|
(3,234 |
) |
|
|
(103.6 |
) |
|
|
|
|
|
|
|
|
|
|
|
|
|
|
|
|
|
|
|
|
|
| Ratios: |
|
|
|
|
|
|
|
|
|
|
|
|
|
|
|
|
|
|
|
|
| Net loss ratio |
|
|
(%) |
|
|
|
68.0 |
|
|
|
68.3 |
|
|
|
0.3 |
|
|
|
|
|
| Net expense ratio |
|
|
(%) |
|
|
|
35.5 |
|
|
|
35.4 |
|
|
|
(0.1 |
) |
|
|
|
|
| Underwriting result ratio |
|
|
(%) |
|
|
|
(3.5 |
) |
|
|
(3.8 |
) |
|
|
(0.3 |
) |
|
|
|
|
10
NIPPONKOA Insurance Co., Ltd. (Non-consolidated)
Premiums Written and Claims Paid by Lines of Business
Direct premiums
written (excluding deposits of premiums by policyholders)
|
|
|
|
|
|
|
|
|
|
|
|
|
|
|
|
|
|
|
|
|
|
|
|
|
| |
|
(Millions of yen) |
|
| |
|
Nine months ended December 31, 2009
(April 1 to December 31,
2009) |
|
|
Nine months ended December 31, 2010
(April 1 to December 31,
2010) |
|
| Business line |
|
Amount |
|
|
% of total
amount |
|
|
Rate of
change |
|
|
Amount |
|
|
% of total
amount |
|
|
Rate of
change |
|
| Fire and allied insurance |
|
|
92,746 |
|
|
|
18.3 |
% |
|
|
2.2 |
% |
|
|
87,976 |
|
|
|
17.6 |
% |
|
|
(5.1 |
)% |
| Marine insurance |
|
|
10,394 |
|
|
|
2.0 |
|
|
|
(26.2 |
) |
|
|
11,118 |
|
|
|
2.2 |
|
|
|
7.0 |
|
| Personal accident insurance |
|
|
38,965 |
|
|
|
7.7 |
|
|
|
(5.3 |
) |
|
|
38,202 |
|
|
|
7.7 |
|
|
|
(2.0 |
) |
| Voluntary automobile insurance |
|
|
241,312 |
|
|
|
47.5 |
|
|
|
(1.8 |
) |
|
|
237,367 |
|
|
|
47.7 |
|
|
|
(1.6 |
) |
| Compulsory automobile liability insurance |
|
|
57,851 |
|
|
|
11.4 |
|
|
|
(10.0 |
) |
|
|
57,982 |
|
|
|
11.6 |
|
|
|
0.2 |
|
| Others |
|
|
66,301 |
|
|
|
13.1 |
|
|
|
(2.9 |
) |
|
|
66,061 |
|
|
|
13.2 |
|
|
|
(0.4 |
) |
|
|
|
|
|
|
|
|
|
|
|
|
|
|
|
|
|
|
|
|
|
|
|
|
|
| Total |
|
|
507,572 |
|
|
|
100.0 |
|
|
|
(3.2 |
) |
|
|
498,709 |
|
|
|
100.0 |
|
|
|
(1.7 |
) |
| Deposits of premiums by policyholders |
|
|
29,725 |
|
|
|
— |
|
|
|
(31.2 |
) |
|
|
27,187 |
|
|
|
— |
|
|
|
(8.5 |
) |
|
|
|
|
|
|
|
|
|
|
|
|
|
|
|
|
|
|
|
|
|
|
|
|
|
|
|
|
|
|
|
|
| Net premiums
written |
|
|
|
|
|
|
|
|
|
|
|
|
|
|
|
|
|
|
|
|
|
|
|
|
| |
|
(Millions of yen) |
|
| |
|
Nine months ended December 31, 2009
(April 1 to December 31,
2009) |
|
|
Nine months ended December 31, 2010
(April 1 to December 31,
2010) |
|
| Business line |
|
Amount |
|
|
% of total
amount |
|
|
Rate of
change |
|
|
Amount |
|
|
% of
total
amount |
|
|
Rate of
change |
|
| Fire and allied insurance |
|
|
72,065 |
|
|
|
15.0 |
% |
|
|
2.1 |
% |
|
|
66,796 |
|
|
|
14.2 |
% |
|
|
(7.3 |
)% |
| Marine insurance |
|
|
9,975 |
|
|
|
2.1 |
|
|
|
(24.6 |
) |
|
|
10,469 |
|
|
|
2.2 |
|
|
|
5.0 |
|
| Personal accident insurance |
|
|
39,490 |
|
|
|
8.2 |
|
|
|
(4.7 |
) |
|
|
38,953 |
|
|
|
8.3 |
|
|
|
(1.4 |
) |
| Voluntary automobile insurance |
|
|
240,997 |
|
|
|
50.1 |
|
|
|
(1.8 |
) |
|
|
237,248 |
|
|
|
50.2 |
|
|
|
(1.6 |
) |
| Compulsory automobile liability insurance |
|
|
55,530 |
|
|
|
11.6 |
|
|
|
(12.0 |
) |
|
|
56,388 |
|
|
|
12.0 |
|
|
|
1.5 |
|
| Others |
|
|
62,569 |
|
|
|
13.0 |
|
|
|
(2.5 |
) |
|
|
61,886 |
|
|
|
13.1 |
|
|
|
(1.1 |
) |
|
|
|
|
|
|
|
|
|
|
|
|
|
|
|
|
|
|
|
|
|
|
|
|
|
| Total |
|
|
480,629 |
|
|
|
100.0 |
|
|
|
(3.5 |
) |
|
|
471,742 |
|
|
|
100.0 |
|
|
|
(1.8 |
) |
|
|
|
|
|
|
|
|
|
|
|
|
|
|
|
|
|
|
|
|
|
|
|
|
|
| Net claims
paid |
|
|
|
|
|
|
|
|
|
|
|
|
|
|
|
|
|
|
|
|
|
|
|
|
| |
|
(Millions of yen) |
|
| |
|
Nine months ended December 31, 2009
(April 1 to December 31,
2009) |
|
|
Nine months ended December 31, 2010
(April 1 to December 31,
2010) |
|
| Business line |
|
Amount |
|
|
Rate of
change |
|
|
Net loss
ratio |
|
|
Amount |
|
|
Rate of
change |
|
|
Net loss
ratio |
|
| Fire and allied insurance |
|
|
32,511 |
|
|
|
9.5 |
% |
|
|
48.9 |
% |
|
|
28,445 |
|
|
|
(12.5 |
)% |
|
|
46.3 |
% |
| Marine insurance |
|
|
6,172 |
|
|
|
26.3 |
|
|
|
64.2 |
|
|
|
4,281 |
|
|
|
(30.6 |
) |
|
|
42.8 |
|
| Personal accident insurance |
|
|
23,184 |
|
|
|
(5.2 |
) |
|
|
64.2 |
|
|
|
22,744 |
|
|
|
(1.9 |
) |
|
|
63.6 |
|
| Voluntary automobile insurance |
|
|
151,652 |
|
|
|
1.8 |
|
|
|
69.0 |
|
|
|
156,192 |
|
|
|
3.0 |
|
|
|
72.2 |
|
| Compulsory automobile liability insurance |
|
|
53,956 |
|
|
|
(3.6 |
) |
|
|
102.7 |
|
|
|
54,302 |
|
|
|
0.6 |
|
|
|
101.8 |
|
| Others |
|
|
32,947 |
|
|
|
(7.4 |
) |
|
|
58.4 |
|
|
|
30,269 |
|
|
|
(8.1 |
) |
|
|
54.2 |
|
|
|
|
|
|
|
|
|
|
|
|
|
|
|
|
|
|
|
|
|
|
|
|
|
|
| Total |
|
|
300,424 |
|
|
|
0.3 |
|
|
|
68.0 |
|
|
|
296,235 |
|
|
|
(1.4 |
) |
|
|
68.3 |
|
|
|
|
|
|
|
|
|
|
|
|
|
|
|
|
|
|
|
|
|
|
|
|
|
|
11
NIPPONKOA Insurance Co., Ltd. (Non-consolidated)
Solvency Margin Ratio
|
|
|
|
|
|
|
|
|
| |
|
(Millions of yen) |
|
| |
|
As of December 31, 2010 |
|
|
As of March 31, 2010 |
|
| (A) Total Solvency Margin |
|
|
817,729 |
|
|
|
840,210 |
|
| Capital and funds, etc. |
|
|
257,686 |
|
|
|
249,698 |
|
| Reserve for price fluctuation |
|
|
7,931 |
|
|
|
5,643 |
|
| Contingency reserve |
|
|
12 |
|
|
|
12 |
|
| Catastrophic loss reserve |
|
|
287,027 |
|
|
|
285,675 |
|
| General allowance for possible loan losses |
|
|
151 |
|
|
|
40 |
|
| Unrealized gains on securities (before tax effect deductions) |
|
|
204,188 |
|
|
|
242,132 |
|
| Net unrealized gains and losses on real estate |
|
|
23,153 |
|
|
|
24,275 |
|
| Excess amount of reserve for maturity refunds |
|
|
— |
|
|
|
— |
|
| Subordinated debt, etc. |
|
|
— |
|
|
|
— |
|
| Deductions |
|
|
13,269 |
|
|
|
13,269 |
|
| Others |
|
|
50,848 |
|
|
|
46,002 |
|
| (B) Total Risks
|
|
|
230,656 |
|
|
|
226,293 |
|
| Underwriting risk (R1) |
|
|
39,278 |
|
|
|
39,271 |
|
| Underwriting risk for third-sector insurance products including accident, sickness and nursing-care insurance (R2)
|
|
|
1 |
|
|
|
1 |
|
| Guaranteed interest rate risk (R3) |
|
|
3,039 |
|
|
|
3,088 |
|
| Investment risk (R4) |
|
|
80,213 |
|
|
|
85,444 |
|
| Business management risk (R5) |
|
|
5,120 |
|
|
|
7,492 |
|
| Major catastrophe risk (R6) |
|
|
133,481 |
|
|
|
121,948 |
|
| (C) Solvency Margin Ratio |
|
|
|
|
|
|
|
|
| [ (A) / {(B) × 1/2} ] × 100 |
|
|
709.0 |
% |
|
|
742.5 |
% |
| Note) |
The above figures are calculated based on Articles 86 and 87 of the Ordinance for Enforcement of the Insurance Business Law and the provisions of Notification
No. 50 of the Ministry of Finance (1996). The figures as of December 31, 2010 are partly calculated on the simplified method, for example, some bases for the major catastrophe risk calculation are deemed same as the figures as of
September 30, 2010. |
12
NIPPONKOA Insurance Co., Ltd. (Non-consolidated)
Investments in the securitized paper and subprime loans (As of December 31, 2010)
Investments by NIPPONKOA in the securitized paper, as of December 31, 2010, are as follows.
| 1. |
SPEs ( Special Purpose Entities) |
None.
| 2. |
CDOs (Collateralized Debt Obligations) |
|
|
|
|
|
|
|
|
|
|
|
|
|
|
|
|
|
|
|
|
|
|
|
|
|
| |
|
(Billions of yen) |
|
| |
|
As of December 31, 2010 |
|
|
(Reference) As of March 31, 2010 |
|
| |
|
Fair value |
|
|
Unrealized
gains or losses |
|
|
Impairment
losses |
|
|
Fair value |
|
|
Unrealized
gains or losses |
|
|
Impairment
losses |
|
| CDOs |
|
|
7.6 |
|
|
|
0.1 |
|
|
|
— |
|
|
|
7.8 |
|
|
|
0.1 |
|
|
|
— |
|
| Rated |
|
|
7.2 |
|
|
|
— |
|
|
|
— |
|
|
|
7.2 |
|
|
|
— |
|
|
|
— |
|
| Non-rated |
|
|
0.4 |
|
|
|
0.1 |
|
|
|
— |
|
|
|
0.6 |
|
|
|
0.1 |
|
|
|
— |
|
(Notes)
| (1) |
NIPPONKOA recognized impairment on securities whose fair value is determinable as of the balance sheet date if the fair value declined by 30% or more from carrying
value. Also 30% rule is applied to the securities in the table below. |
| (2) |
Out of the rated CDOs, 14% is rated AAA, 73% is rated A and 13% is rated BB. |
| (3) |
All of the underlying collateral pools for CDOs are assets supported by the corporate credits. |
| (4) |
95% of the CDOs is domestic and 5% is overseas. |
| (5) |
The ratios for categorizations of the rated CDOs and categorizations of the CDOs by region are calculated using the fair value. |
| (6) |
Other than the figures in the table above, related to CDOs, NIPPONKOA recorded 0.9 billion yen of gains on derivative financial instruments. |
| 3. |
Other subprime/Alt-A exposure |
None.
| 4. |
CMBS (Commercial Mortgage-Backed Security) |
|
|
|
|
|
|
|
|
|
|
|
|
|
|
|
|
|
|
|
|
|
|
|
|
|
| |
|
(Billions of yen) |
|
| |
|
As of December 31, 2010 |
|
|
(Reference) As of March 31, 2010 |
|
| |
|
Fair value |
|
|
Unrealized
gains or losses |
|
|
Impairment
losses |
|
|
Fair value |
|
|
Unrealized
gains or losses |
|
|
Impairment
losses |
|
| CMBS |
|
|
5.2 |
|
|
|
(0.2 |
) |
|
|
— |
|
|
|
8.8 |
|
|
|
(0.3 |
) |
|
|
(0.1 |
) |
| Domestic |
|
|
5.2 |
|
|
|
(0.2 |
) |
|
|
— |
|
|
|
8.8 |
|
|
|
(0.3 |
) |
|
|
(0.1 |
) |
| Overseas |
|
|
— |
|
|
|
— |
|
|
|
— |
|
|
|
— |
|
|
|
— |
|
|
|
— |
|
| (Note) |
Amount in impairment losses includes the loss on evaluation of securities and other investment expenses. |
None.
| 6. |
CDS (Credit Default Swap) |
NIPPONKOA does not hold CDS that reference the securitized paper including CDOs. NIPPONKOA holds CDS that reference a single credit of a
firm (7.0 billion yen of short commitment notional value, 0.0 billion yen of fair value, 0.0 billion yen of valuation gain).
[Definitions of
securitized assets]
| |
• |
|
SPEs: Special Purpose Entities. A general term of special purpose entities including SIV (Structured Investment Vehicle) that are specialized in
investment of securitized papers. |
| |
• |
|
CDOs: Collateralized Debt Obligations. A securitized note, which was supported by asset pool of number of underlying debt securities and loans.
|
| |
• |
|
Alt-A: A type of the U.S. mortgage loan. Alt-A (Mezzanine) is placed in the middle of prime loan, a loan for borrowers with higher credit score, and
subprime loan, a loan for borrowers with lower credit score. |
| |
• |
|
CMBS: Commercial Mortgage-Backed Security. An instrument that securitized the mortgage loans for commercial real estate. |
| |
• |
|
CDS: Credit Default Swap. A swap contract involving trading of credits, which reference the creditworthiness of a corporate or securitized paper,
called a reference credit (entity). |
13
SONPO 24 Insurance Co., Ltd. (Non-consolidated)
Quarterly Balance Sheets
|
|
|
|
|
|
|
|
|
|
|
|
|
| |
|
(Millions of yen) |
|
| |
|
As of December 31, 2010 |
|
|
As of March 31, 2010 |
|
|
Increase
(Decrease) |
|
| |
|
Amount |
|
|
Amount |
|
|
|
|
| Assets: |
|
|
|
|
|
|
|
|
|
|
|
|
| Cash and deposits |
|
|
1,872 |
|
|
|
1,851 |
|
|
|
20 |
|
| Securities |
|
|
15,987 |
|
|
|
15,618 |
|
|
|
369 |
|
| Tangible fixed assets |
|
|
153 |
|
|
|
182 |
|
|
|
(28 |
) |
| Other assets |
|
|
683 |
|
|
|
810 |
|
|
|
(127 |
) |
|
|
|
|
|
|
|
|
|
|
|
|
|
| Total assets |
|
|
18,696 |
|
|
|
18,463 |
|
|
|
233 |
|
|
|
|
|
|
|
|
|
|
|
|
|
|
| Liabilities: |
|
|
|
|
|
|
|
|
|
|
|
|
| Underwriting funds: |
|
|
9,001 |
|
|
|
8,538 |
|
|
|
463 |
|
| Reserve for outstanding losses and claims |
|
|
2,493 |
|
|
|
2,333 |
|
|
|
159 |
|
| Underwriting reserves |
|
|
6,508 |
|
|
|
6,204 |
|
|
|
303 |
|
| Other liabilities |
|
|
1,233 |
|
|
|
1,443 |
|
|
|
(210 |
) |
| Reserve for retirement benefits |
|
|
97 |
|
|
|
79 |
|
|
|
18 |
|
| Reserve for bonus payments |
|
|
20 |
|
|
|
92 |
|
|
|
(72 |
) |
| Reserves under the special laws: |
|
|
22 |
|
|
|
20 |
|
|
|
2 |
|
| Reserve for price fluctuation |
|
|
22 |
|
|
|
20 |
|
|
|
2 |
|
| Deferred tax liabilities |
|
|
— |
|
|
|
18 |
|
|
|
(18 |
) |
|
|
|
|
|
|
|
|
|
|
|
|
|
| Total liabilities |
|
|
10,376 |
|
|
|
10,193 |
|
|
|
182 |
|
|
|
|
|
|
|
|
|
|
|
|
|
|
| Net assets: |
|
|
|
|
|
|
|
|
|
|
|
|
| Shareholders’ equity: |
|
|
|
|
|
|
|
|
|
|
|
|
| Common stock |
|
|
19,000 |
|
|
|
19,000 |
|
|
|
— |
|
| Capital surplus |
|
|
19,000 |
|
|
|
19,000 |
|
|
|
— |
|
| Retained earnings |
|
|
(29,634 |
) |
|
|
(29,763 |
) |
|
|
129 |
|
| Total shareholders’ equity |
|
|
8,365 |
|
|
|
8,236 |
|
|
|
129 |
|
| Valuation and translation adjustments: |
|
|
|
|
|
|
|
|
|
|
|
|
| Unrealized gains (losses) on securities available for sale, net of tax |
|
|
(45 |
) |
|
|
32 |
|
|
|
(78 |
) |
| Total valuation and translation adjustments |
|
|
(45 |
) |
|
|
32 |
|
|
|
(78 |
) |
|
|
|
|
|
|
|
|
|
|
|
|
|
| Total net assets |
|
|
8,320 |
|
|
|
8,269 |
|
|
|
50 |
|
|
|
|
|
|
|
|
|
|
|
|
|
|
| Total liabilities and net assets |
|
|
18,696 |
|
|
|
18,463 |
|
|
|
233 |
|
|
|
|
|
|
|
|
|
|
|
|
|
|
14
SONPO 24 Insurance Co., Ltd. (Non-consolidated)
Quarterly Statements of Income
|
|
|
|
|
|
|
|
|
|
|
|
|
|
|
|
|
|
|
|
|
| |
|
|
|
|
(Millions of yen) |
|
| |
|
|
|
|
Nine months ended
December 31, 2009
(April 1 to
December
31, 2009) |
|
|
Nine months ended
December 31, 2010
(April
1 to
December 31, 2010) |
|
|
Increase
(Decrease) |
|
|
Rate of
change |
|
| |
|
|
|
|
Amount |
|
|
Amount |
|
|
|
|
|
|
|
| Ordinary income: |
|
|
|
|
|
|
7,506 |
|
|
|
8,370 |
|
|
|
864 |
|
|
|
11.5 |
% |
| Underwriting income: |
|
|
|
|
|
|
7,436 |
|
|
|
8,040 |
|
|
|
603 |
|
|
|
8.1 |
|
| Net premiums written |
|
|
|
|
|
|
7,428 |
|
|
|
8,033 |
|
|
|
605 |
|
|
|
8.1 |
|
| Interest and dividend income on deposits of premiums, etc. |
|
|
|
|
|
|
8 |
|
|
|
6 |
|
|
|
(1 |
) |
|
|
(16.5 |
) |
| Investment income: |
|
|
|
|
|
|
69 |
|
|
|
330 |
|
|
|
260 |
|
|
|
373.9 |
|
| Interest and dividend income |
|
|
|
|
|
|
77 |
|
|
|
63 |
|
|
|
(14 |
) |
|
|
(18.7 |
) |
| Gains on sales of securities |
|
|
|
|
|
|
— |
|
|
|
273 |
|
|
|
273 |
|
|
|
— |
|
| Transfer of interest and dividend income on deposits of premiums, etc. |
|
|
|
|
|
|
(8 |
) |
|
|
(6 |
) |
|
|
1 |
|
|
|
— |
|
| Other ordinary income |
|
|
|
|
|
|
0 |
|
|
|
0 |
|
|
|
(0 |
) |
|
|
(2.0 |
) |
|
|
|
|
|
|
|
|
|
|
|
|
|
|
|
|
|
|
|
|
|
| Ordinary expenses: |
|
|
|
|
|
|
7,612 |
|
|
|
8,235 |
|
|
|
622 |
|
|
|
8.2 |
|
| Underwriting expenses: |
|
|
|
|
|
|
5,518 |
|
|
|
6,313 |
|
|
|
794 |
|
|
|
14.4 |
|
| Net claims paid |
|
|
|
|
|
|
4,019 |
|
|
|
4,854 |
|
|
|
834 |
|
|
|
20.8 |
|
| Loss adjustment expenses |
|
|
|
|
|
|
461 |
|
|
|
477 |
|
|
|
15 |
|
|
|
3.4 |
|
| Net commissions and brokerage fees |
|
|
|
|
|
|
483 |
|
|
|
518 |
|
|
|
35 |
|
|
|
7.3 |
|
| Provision for reserve for outstanding losses and claims |
|
|
|
|
|
|
32 |
|
|
|
159 |
|
|
|
127 |
|
|
|
393.9 |
|
| Provision for underwriting reserves |
|
|
|
|
|
|
521 |
|
|
|
303 |
|
|
|
(218 |
) |
|
|
(41.8 |
) |
| Operating, general and administrative expenses |
|
|
|
|
|
|
2,094 |
|
|
|
1,921 |
|
|
|
(172 |
) |
|
|
(8.2 |
) |
| Other ordinary expenses |
|
|
|
|
|
|
0 |
|
|
|
0 |
|
|
|
(0 |
) |
|
|
(73.3 |
) |
|
|
|
|
|
|
|
|
|
|
|
|
|
|
|
|
|
|
|
|
|
| Ordinary profit (loss) |
|
|
|
|
|
|
(106 |
) |
|
|
135 |
|
|
|
241 |
|
|
|
— |
|
|
|
|
|
|
|
|
|
|
|
|
|
|
|
|
|
|
|
|
|
|
| Extraordinary losses: |
|
|
|
|
|
|
5 |
|
|
|
3 |
|
|
|
(2 |
) |
|
|
(37.8 |
) |
| Losses on disposal of fixed assets |
|
|
|
|
|
|
0 |
|
|
|
1 |
|
|
|
0 |
|
|
|
102.7 |
|
| Provision for reserves under the special laws: |
|
|
|
|
|
|
2 |
|
|
|
2 |
|
|
|
0 |
|
|
|
2.9 |
|
| Provision for reserve for price fluctuation |
|
|
|
|
|
|
2 |
|
|
|
2 |
|
|
|
0 |
|
|
|
2.9 |
|
| Other extraordinary losses |
|
|
|
|
|
|
2 |
|
|
|
— |
|
|
|
(2 |
) |
|
|
(100.0 |
) |
|
|
|
|
|
|
|
|
|
|
|
|
|
|
|
|
|
|
|
|
|
| Income (loss) before income taxes |
|
|
|
|
|
|
(111 |
) |
|
|
132 |
|
|
|
243 |
|
|
|
— |
|
| Income taxes and deferred income taxes |
|
|
|
|
|
|
2 |
|
|
|
2 |
|
|
|
— |
|
|
|
— |
|
| Net income (loss) |
|
|
|
|
|
|
(114 |
) |
|
|
129 |
|
|
|
243 |
|
|
|
— |
|
|
|
|
|
|
|
|
|
|
|
|
|
|
|
|
|
|
|
|
|
|
|
|
|
|
|
|
| Underwriting result: |
|
|
|
|
|
|
|
|
|
|
|
|
|
|
|
|
|
|
|
|
| Net premiums written |
|
|
(+ |
) |
|
|
7,428 |
|
|
|
8,033 |
|
|
|
605 |
|
|
|
8.1 |
|
| Net claims paid |
|
|
(– |
) |
|
|
4,019 |
|
|
|
4,854 |
|
|
|
834 |
|
|
|
20.8 |
|
| Loss adjustment expenses |
|
|
(– |
) |
|
|
461 |
|
|
|
477 |
|
|
|
15 |
|
|
|
3.4 |
|
| Operating expenses: |
|
|
(– |
) |
|
|
2,577 |
|
|
|
2,438 |
|
|
|
(139 |
) |
|
|
(5.4 |
) |
| Net commissions and brokerage fees |
|
|
|
|
|
|
483 |
|
|
|
518 |
|
|
|
35 |
|
|
|
7.3 |
|
| Operating, general and administrative expenses related to underwriting |
|
|
|
|
|
|
2,094 |
|
|
|
1,919 |
|
|
|
(174 |
) |
|
|
(8.3 |
) |
| Underwriting result |
|
|
|
|
|
|
370 |
|
|
|
264 |
|
|
|
(106 |
) |
|
|
(28.6 |
) |
|
|
|
|
|
|
|
|
|
|
|
|
|
|
|
|
|
|
|
|
|
| Underwriting profit |
|
|
|
|
|
|
(175 |
) |
|
|
(192 |
) |
|
|
(16 |
) |
|
|
— |
|
|
|
|
|
|
|
|
|
|
|
|
|
|
|
|
|
|
|
|
|
|
| Ratios: |
|
|
|
|
|
|
|
|
|
|
|
|
|
|
|
|
|
|
|
|
| Net loss ratio |
|
|
(% |
) |
|
|
60.3 |
|
|
|
66.4 |
|
|
|
6.1 |
|
|
|
|
|
| Net expense ratio |
|
|
(% |
) |
|
|
34.7 |
|
|
|
30.3 |
|
|
|
(4.4 |
) |
|
|
|
|
| Underwriting result ratio |
|
|
(% |
) |
|
|
5.0 |
|
|
|
3.3 |
|
|
|
(1.7 |
) |
|
|
|
|
15
SONPO 24 Insurance Co., Ltd. (Non-consolidated)
Premiums Written and Claims Paid by Lines of Business
Direct premiums
written (excluding deposits of premiums by policyholders)
|
|
|
|
|
|
|
|
|
|
|
|
|
|
|
|
|
|
|
|
|
|
|
|
|
| |
|
(Millions of yen) |
|
| |
|
Nine months ended December 31, 2009
(April 1 to December 31, 2009) |
|
|
Nine months ended December 31, 2010
(April 1 to December 31, 2010) |
|
| Business line |
|
Amount |
|
|
% of total
amount |
|
|
Rate of
change |
|
|
Amount |
|
|
% of total
amount |
|
|
Rate of
change |
|
| Fire and allied insurance |
|
|
— |
|
|
|
— |
% |
|
|
— |
% |
|
|
— |
|
|
|
— |
% |
|
|
— |
% |
| Marine insurance |
|
|
— |
|
|
|
— |
|
|
|
— |
|
|
|
— |
|
|
|
— |
|
|
|
— |
|
| Personal accident insurance |
|
|
— |
|
|
|
— |
|
|
|
— |
|
|
|
— |
|
|
|
— |
|
|
|
— |
|
| Voluntary automobile insurance |
|
|
7,367 |
|
|
|
100.0 |
|
|
|
15.0 |
|
|
|
7,973 |
|
|
|
100.0 |
|
|
|
8.2 |
|
| Compulsory automobile liability insurance |
|
|
— |
|
|
|
— |
|
|
|
— |
|
|
|
— |
|
|
|
— |
|
|
|
— |
|
| Others |
|
|
— |
|
|
|
— |
|
|
|
— |
|
|
|
— |
|
|
|
— |
|
|
|
— |
|
|
|
|
|
|
|
|
|
|
|
|
|
|
|
|
|
|
|
|
|
|
|
|
|
|
| Total |
|
|
7,367 |
|
|
|
100.0 |
|
|
|
15.0 |
|
|
|
7,973 |
|
|
|
100.0 |
|
|
|
8.2 |
|
| Deposits of premiums by policyholders |
|
|
— |
|
|
|
— |
|
|
|
— |
|
|
|
— |
|
|
|
— |
|
|
|
— |
|
|
|
|
|
|
|
|
|
|
|
|
|
|
|
|
|
|
|
|
|
|
|
|
|
|
Net premiums written
|
|
|
|
|
|
|
|
|
|
|
|
|
|
|
|
|
|
|
|
|
|
|
|
|
| |
|
(Millions of yen) |
|
| |
|
Nine months ended December 31, 2009
(April 1 to December 31, 2009) |
|
|
Nine months ended December 31, 2010
(April 1 to December 31, 2010) |
|
| Business line |
|
Amount |
|
|
% of total
amount |
|
|
Rate of
change |
|
|
Amount |
|
|
% of total
amount |
|
|
Rate of
change |
|
| Fire and allied insurance |
|
|
— |
|
|
|
— |
% |
|
|
— |
% |
|
|
— |
|
|
|
— |
% |
|
|
— |
% |
| Marine insurance |
|
|
— |
|
|
|
— |
|
|
|
— |
|
|
|
— |
|
|
|
— |
|
|
|
— |
|
| Personal accident insurance |
|
|
— |
|
|
|
— |
|
|
|
— |
|
|
|
— |
|
|
|
— |
|
|
|
— |
|
| Voluntary automobile insurance |
|
|
7,305 |
|
|
|
98.3 |
|
|
|
15.1 |
|
|
|
7,907 |
|
|
|
98.4 |
|
|
|
8.2 |
|
| Compulsory automobile liability insurance |
|
|
123 |
|
|
|
1.7 |
|
|
|
(1.5 |
) |
|
|
126 |
|
|
|
1.6 |
|
|
|
2.7 |
|
| Others |
|
|
— |
|
|
|
— |
|
|
|
— |
|
|
|
— |
|
|
|
— |
|
|
|
— |
|
|
|
|
|
|
|
|
|
|
|
|
|
|
|
|
|
|
|
|
|
|
|
|
|
|
| Total |
|
|
7,428 |
|
|
|
100.0 |
|
|
|
14.8 |
|
|
|
8,033 |
|
|
|
100.0 |
|
|
|
8.1 |
|
|
|
|
|
|
|
|
|
|
|
|
|
|
|
|
|
|
|
|
|
|
|
|
|
|
Net claims paid
|
|
|
|
|
|
|
|
|
|
|
|
|
|
|
|
|
|
|
|
|
|
|
|
|
| |
|
(Millions of yen) |
|
| |
|
Nine months ended December 31, 2009
(April 1 to December 31, 2009) |
|
|
Nine months ended December 31, 2010
(April 1 to December 31, 2010) |
|
| Business line |
|
Amount |
|
|
Rate of
change |
|
|
Net loss
ratio |
|
|
Amount |
|
|
Rate of
change |
|
|
Net loss
ratio |
|
| Fire and allied insurance |
|
|
— |
|
|
|
— |
% |
|
|
— |
% |
|
|
— |
|
|
|
— |
% |
|
|
— |
% |
| Marine insurance |
|
|
— |
|
|
|
— |
|
|
|
— |
|
|
|
— |
|
|
|
— |
|
|
|
— |
|
| Personal accident insurance |
|
|
— |
|
|
|
— |
|
|
|
— |
|
|
|
— |
|
|
|
— |
|
|
|
— |
|
| Voluntary automobile insurance |
|
|
3,882 |
|
|
|
7.4 |
|
|
|
59.5 |
|
|
|
4,699 |
|
|
|
21.0 |
|
|
|
65.5 |
|
| Compulsory automobile liability insurance |
|
|
137 |
|
|
|
7.4 |
|
|
|
111.2 |
|
|
|
155 |
|
|
|
13.1 |
|
|
|
122.5 |
|
| Others |
|
|
— |
|
|
|
— |
|
|
|
— |
|
|
|
— |
|
|
|
— |
|
|
|
— |
|
|
|
|
|
|
|
|
|
|
|
|
|
|
|
|
|
|
|
|
|
|
|
|
|
|
| Total |
|
|
4,019 |
|
|
|
7.4 |
|
|
|
60.3 |
|
|
|
4,854 |
|
|
|
20.8 |
|
|
|
66.4 |
|
|
|
|
|
|
|
|
|
|
|
|
|
|
|
|
|
|
|
|
|
|
|
|
|
|
16
SONPO 24 Insurance Co., Ltd. (Non-consolidated)
Solvency Margin Ratio
|
|
|
|
|
|
|
|
|
| |
|
(Millions of yen) |
|
| |
|
As of December 31, 2010 |
|
|
As of March 31, 2010 |
|
| (A) Total Solvency Margin |
|
|
8,596 |
|
|
|
8,616 |
|
| Capital and funds, etc. |
|
|
8,365 |
|
|
|
8,236 |
|
| Reserve for price fluctuation |
|
|
22 |
|
|
|
20 |
|
| Contingency reserve |
|
|
— |
|
|
|
— |
|
| Catastrophic loss reserve |
|
|
253 |
|
|
|
312 |
|
| General allowance for possible loan losses |
|
|
— |
|
|
|
— |
|
| Unrealized gains (losses) on securities (before tax effect deductions) |
|
|
(45 |
) |
|
|
46 |
|
| Net unrealized gains and losses on real estate |
|
|
— |
|
|
|
— |
|
| Excess amount of reserve for maturity refunds |
|
|
— |
|
|
|
— |
|
| Subordinated debt, etc. |
|
|
— |
|
|
|
— |
|
| Deductions |
|
|
— |
|
|
|
— |
|
| Others |
|
|
— |
|
|
|
— |
|
| (B) Total Risks |
|
|
945 |
|
|
|
895 |
|
|
|
|
|
|
|
|
|
|
|
| Underwriting risk (R1) |
|
|
792 |
|
|
|
734 |
|
| Underwriting risk for third-sector insurance products including accident, sickness and nursing-care
insurance (R2) |
|
|
— |
|
|
|
— |
|
| Guaranteed interest rate risk (R3) |
|
|
— |
|
|
|
— |
|
| Investment risk (R4) |
|
|
156 |
|
|
|
193 |
|
| Business management risk (R5) |
|
|
31 |
|
|
|
30 |
|
| Major catastrophe risk (R6) |
|
|
105 |
|
|
|
104 |
|
| (C) Solvency Margin Ratio |
|
|
|
|
|
|
|
|
| [ (A) / {(B) × 1/2} ] × 100 |
|
|
1,818.3 |
% |
|
|
1,924.8 |
% |
| Note) |
The above figures are calculated based on Articles 86 and 87 of the Ordinance for Enforcement of the Insurance Business Law and the provisions of Notification
No. 50 of the Ministry of Finance (1996). The figures as of December 31, 2010 are partly calculated on the simplified method, for example, some bases for the investment risk calculation are deemed same as the figures as of
September 30, 2010. |
17
Saison Automobile and Fire Insurance Company, Limited (Non-consolidated)
Quarterly Balance Sheets
|
|
|
|
|
|
|
|
|
|
|
|
|
| |
|
(Millions of yen) |
|
| |
|
As of December 31, 2010 |
|
|
As of March 31, 2010 |
|
|
Increase
(Decrease) |
|
| |
|
Amount |
|
|
Amount |
|
|
|
|
| Assets: |
|
|
|
|
|
|
|
|
|
|
|
|
| Cash and deposits |
|
|
4,505 |
|
|
|
10,796 |
|
|
|
(6,290 |
) |
| Money trusts |
|
|
1,311 |
|
|
|
1,316 |
|
|
|
(4 |
) |
| Securities |
|
|
23,673 |
|
|
|
19,223 |
|
|
|
4,450 |
|
| Loans |
|
|
15 |
|
|
|
20 |
|
|
|
(4 |
) |
| Tangible fixed assets |
|
|
446 |
|
|
|
171 |
|
|
|
274 |
|
| Intangible fixed assets |
|
|
1,739 |
|
|
|
897 |
|
|
|
842 |
|
| Other assets |
|
|
2,058 |
|
|
|
1,917 |
|
|
|
141 |
|
| Allowance for possible loan losses |
|
|
(0 |
) |
|
|
(0 |
) |
|
|
— |
|
|
|
|
|
|
|
|
|
|
|
|
|
|
| Total assets |
|
|
33,751 |
|
|
|
34,342 |
|
|
|
(591 |
) |
|
|
|
|
|
|
|
|
|
|
|
|
|
| Liabilities: |
|
|
|
|
|
|
|
|
|
|
|
|
| Underwriting funds: |
|
|
20,076 |
|
|
|
19,359 |
|
|
|
716 |
|
| Reserve for outstanding losses and claims |
|
|
4,870 |
|
|
|
4,946 |
|
|
|
(76 |
) |
| Underwriting reserves |
|
|
15,206 |
|
|
|
14,413 |
|
|
|
793 |
|
| Other liabilities |
|
|
1,648 |
|
|
|
1,431 |
|
|
|
216 |
|
| Reserve for retirement benefits |
|
|
247 |
|
|
|
364 |
|
|
|
(116 |
) |
| Reserve for retirement benefits to directors |
|
|
40 |
|
|
|
34 |
|
|
|
5 |
|
| Reserve for bonus payments |
|
|
108 |
|
|
|
206 |
|
|
|
(97 |
) |
| Reserves under the special laws: |
|
|
6 |
|
|
|
14 |
|
|
|
(8 |
) |
| Reserve for price fluctuation |
|
|
6 |
|
|
|
14 |
|
|
|
(8 |
) |
| Deferred tax liabilities |
|
|
113 |
|
|
|
100 |
|
|
|
13 |
|
|
|
|
|
|
|
|
|
|
|
|
|
|
| Total liabilities |
|
|
22,241 |
|
|
|
21,510 |
|
|
|
730 |
|
|
|
|
|
|
|
|
|
|
|
|
|
|
| Net assets: |
|
|
|
|
|
|
|
|
|
|
|
|
| Shareholders’ equity: |
|
|
|
|
|
|
|
|
|
|
|
|
| Common stock |
|
|
8,610 |
|
|
|
8,610 |
|
|
|
— |
|
| Capital surplus |
|
|
6,848 |
|
|
|
6,848 |
|
|
|
— |
|
| Retained earnings |
|
|
(4,247 |
) |
|
|
(2,925 |
) |
|
|
(1,322 |
) |
| Total shareholders’ equity |
|
|
11,210 |
|
|
|
12,532 |
|
|
|
(1,322 |
) |
| Valuation and translation adjustments: |
|
|
|
|
|
|
|
|
|
|
|
|
| Unrealized gains on securities available for sale, net of tax |
|
|
299 |
|
|
|
299 |
|
|
|
0 |
|
| Total valuation and translation adjustments |
|
|
299 |
|
|
|
299 |
|
|
|
0 |
|
|
|
|
|
|
|
|
|
|
|
|
|
|
| Total net assets |
|
|
11,509 |
|
|
|
12,831 |
|
|
|
(1,322 |
) |
|
|
|
|
|
|
|
|
|
|
|
|
|
| Total liabilities and net assets |
|
|
33,751 |
|
|
|
34,342 |
|
|
|
(591 |
) |
|
|
|
|
|
|
|
|
|
|
|
|
|
18
Saison Automobile and Fire Insurance Company, Limited (Non-consolidated)
Quarterly Statements of Income
|
|
|
|
|
|
|
|
|
|
|
|
|
|
|
|
|
|
|
| |
|
|
|
(Millions of yen) |
|
| |
|
|
|
Nine months ended
December 31, 2009
(April 1
to
December 31, 2009) |
|
|
Nine months ended
December 31, 2010
(April 1
to
December 31, 2010) |
|
|
Increase
(Decrease) |
|
|
Rate of
change |
|
| |
|
|
|
Amount |
|
|
Amount |
|
|
|
|
|
|
|
| Ordinary income: |
|
|
|
|
12,083 |
|
|
|
12,076 |
|
|
|
(6 |
) |
|
|
(0.1 |
)% |
| Underwriting income: |
|
|
|
|
11,631 |
|
|
|
11,620 |
|
|
|
(10 |
) |
|
|
(0.1 |
) |
| Net premiums written |
|
|
|
|
10,402 |
|
|
|
11,026 |
|
|
|
624 |
|
|
|
6.0 |
|
| Deposits of premiums by policyholders |
|
|
|
|
571 |
|
|
|
478 |
|
|
|
(93 |
) |
|
|
(16.3 |
) |
| Interest and dividend income on deposits of premiums, etc. |
|
|
|
|
46 |
|
|
|
40 |
|
|
|
(6 |
) |
|
|
(14.2 |
) |
| Reversal of reserve for outstanding losses and claims |
|
|
|
|
611 |
|
|
|
76 |
|
|
|
(534 |
) |
|
|
(87.5 |
) |
| Investment income: |
|
|
|
|
292 |
|
|
|
299 |
|
|
|
6 |
|
|
|
2.2 |
|
| Interest and dividend income |
|
|
|
|
236 |
|
|
|
230 |
|
|
|
(6 |
) |
|
|
(2.7 |
) |
| Investment gains on money trusts |
|
|
|
|
46 |
|
|
|
— |
|
|
|
(46 |
) |
|
|
(100.0 |
) |
| Investment gains on trading securities |
|
|
|
|
2 |
|
|
|
1 |
|
|
|
(1 |
) |
|
|
(38.8 |
) |
| Gains on sales of securities |
|
|
|
|
53 |
|
|
|
106 |
|
|
|
52 |
|
|
|
98.1 |
|
| Transfer of interest and dividend income on deposits of premiums, etc. |
|
|
|
|
(46 |
) |
|
|
(40 |
) |
|
|
6 |
|
|
|
— |
|
| Other ordinary income |
|
|
|
|
159 |
|
|
|
156 |
|
|
|
(2 |
) |
|
|
(1.5 |
) |
|
|
|
|
|
|
|
|
|
|
|
|
|
|
|
|
|
|
|
| Ordinary expenses: |
|
|
|
|
12,146 |
|
|
|
13,389 |
|
|
|
1,242 |
|
|
|
10.2 |
|
| Underwriting expenses: |
|
|
|
|
8,713 |
|
|
|
9,396 |
|
|
|
682 |
|
|
|
7.8 |
|
| Net claims paid |
|
|
|
|
5,683 |
|
|
|
5,681 |
|
|
|
(2 |
) |
|
|
(0.0 |
) |
| Loss adjustment expenses |
|
|
|
|
639 |
|
|
|
734 |
|
|
|
94 |
|
|
|
14.8 |
|
| Net commissions and brokerage fees |
|
|
|
|
1,326 |
|
|
|
1,335 |
|
|
|
9 |
|
|
|
0.7 |
|
| Maturity refunds to policyholders |
|
|
|
|
744 |
|
|
|
846 |
|
|
|
102 |
|
|
|
13.7 |
|
| Provision for underwriting reserves |
|
|
|
|
314 |
|
|
|
793 |
|
|
|
478 |
|
|
|
152.3 |
|
| Investment expenses: |
|
|
|
|
105 |
|
|
|
151 |
|
|
|
46 |
|
|
|
44.4 |
|
| Investment losses on money trusts |
|
|
|
|
— |
|
|
|
4 |
|
|
|
4 |
|
|
|
— |
|
| Losses on sales of securities |
|
|
|
|
76 |
|
|
|
54 |
|
|
|
(22 |
) |
|
|
(29.5 |
) |
| Operating, general and administrative expenses |
|
|
|
|
3,259 |
|
|
|
3,832 |
|
|
|
573 |
|
|
|
17.6 |
|
| Other ordinary expenses: |
|
|
|
|
68 |
|
|
|
8 |
|
|
|
(59 |
) |
|
|
(87.3 |
) |
| Interest paid |
|
|
|
|
3 |
|
|
|
6 |
|
|
|
2 |
|
|
|
76.6 |
|
|
|
|
|
|
|
|
|
|
|
|
|
|
|
|
|
|
|
|
| Ordinary loss |
|
|
|
|
(63 |
) |
|
|
(1,312 |
) |
|
|
(1,249 |
) |
|
|
— |
|
|
|
|
|
|
|
|
|
|
|
|
|
|
|
|
|
|
|
|
| Extraordinary gains: |
|
|
|
|
— |
|
|
|
8 |
|
|
|
8 |
|
|
|
— |
|
| Reversal of reserves under the special laws: |
|
|
|
|
— |
|
|
|
8 |
|
|
|
8 |
|
|
|
— |
|
| Reversal of reserve for price fluctuation |
|
|
|
|
— |
|
|
|
8 |
|
|
|
8 |
|
|
|
— |
|
| Extraordinary losses: |
|
|
|
|
0 |
|
|
|
2 |
|
|
|
1 |
|
|
|
180.6 |
|
| Losses on disposal of fixed assets |
|
|
|
|
0 |
|
|
|
2 |
|
|
|
1 |
|
|
|
691.4 |
|
| Impairment losses |
|
|
|
|
0 |
|
|
|
— |
|
|
|
(0 |
) |
|
|
(100.0 |
) |
| Provision for reserves under the special laws: |
|
|
|
|
0 |
|
|
|
— |
|
|
|
(0 |
) |
|
|
(100.0 |
) |
| Provision for reserve for price fluctuation |
|
|
|
|
0 |
|
|
|
— |
|
|
|
(0 |
) |
|
|
(100.0 |
) |
|
|
|
|
|
|
|
|
|
|
|
|
|
|
|
|
|
|
|
| Loss before income taxes |
|
|
|
|
(64 |
) |
|
|
(1,306 |
) |
|
|
(1,242 |
) |
|
|
— |
|
| Income taxes and deferred income taxes |
|
|
|
|
16 |
|
|
|
16 |
|
|
|
— |
|
|
|
— |
|
| Net loss |
|
|
|
|
(80 |
) |
|
|
(1,322 |
) |
|
|
(1,242 |
) |
|
|
— |
|
|
|
|
|
|
|
|
|
|
|
|
|
|
|
|
|
|
|
|
| Underwriting result: |
|
|
|
|
|
|
|
|
|
|
|
|
|
|
|
|
|
|
| Net premiums written |
|
(+) |
|
|
10,402 |
|
|
|
11,026 |
|
|
|
624 |
|
|
|
6.0 |
|
| Net claims paid |
|
(–) |
|
|
5,683 |
|
|
|
5,681 |
|
|
|
(2 |
) |
|
|
(0.0 |
) |
| Loss adjustment expenses |
|
(–) |
|
|
639 |
|
|
|
734 |
|
|
|
94 |
|
|
|
14.8 |
|
| Operating expenses: |
|
(–) |
|
|
4,366 |
|
|
|
4,956 |
|
|
|
589 |
|
|
|
13.5 |
|
| Net commissions and brokerage fees |
|
|
|
|
1,326 |
|
|
|
1,335 |
|
|
|
9 |
|
|
|
0.7 |
|
| Operating, general and administrative expenses related to underwriting |
|
|
|
|
3,040 |
|
|
|
3,620 |
|
|
|
580 |
|
|
|
19.1 |
|
| Underwriting result |
|
|
|
|
(287 |
) |
|
|
(345 |
) |
|
|
(57 |
) |
|
|
— |
|
|
|
|
|
|
|
|
|
|
|
|
|
|
|
|
|
|
|
|
| Underwriting profit |
|
|
|
|
(77 |
) |
|
|
(1,355 |
) |
|
|
(1,278 |
) |
|
|
— |
|
|
|
|
|
|
|
|
|
|
|
|
|
|
|
|
|
|
|
|
| Ratios: |
|
|
|
|
|
|
|
|
|
|
|
|
|
|
|
|
|
|
| Net loss ratio (%) |
|
|
|
|
60.8 |
|
|
|
58.2 |
|
|
|
(2.6 |
) |
|
|
|
|
| Net expense ratio (%) |
|
|
|
|
42.0 |
|
|
|
44.9 |
|
|
|
2.9 |
|
|
|
|
|
| Underwriting result ratio (%) |
|
|
|
|
(2.8 |
) |
|
|
(3.1 |
) |
|
|
(0.3 |
) |
|
|
|
|
19
Saison Automobile and Fire Insurance Company, Limited (Non-consolidated)
Premiums Written and Claims Paid by Lines of Business
Direct premiums written (excluding deposits of premiums by policyholders)
|
|
|
|
|
|
|
|
|
|
|
|
|
|
|
|
|
|
|
|
|
|
|
|
|
| |
|
(Millions of yen) |
|
| |
|
Nine months ended December 31, 2009
(April 1 to December 31, 2009) |
|
|
Nine months ended December 31, 2010
(April 1 to December 31, 2010) |
|
| Business line |
|
Amount |
|
|
% of total
amount |
|
|
Rate of
change |
|
|
Amount |
|
|
% of total
amount |
|
|
Rate of
change |
|
| Fire and allied insurance |
|
|
1,754 |
|
|
|
14.8 |
% |
|
|
81.6 |
% |
|
|
2,598 |
|
|
|
20.3 |
% |
|
|
48.2 |
% |
| Marine insurance |
|
|
1 |
|
|
|
0.0 |
|
|
|
14.0 |
|
|
|
0 |
|
|
|
0.0 |
|
|
|
(48.3 |
) |
| Personal accident insurance |
|
|
2,882 |
|
|
|
24.3 |
|
|
|
24.8 |
|
|
|
3,275 |
|
|
|
25.5 |
|
|
|
13.6 |
|
| Voluntary automobile insurance |
|
|
6,372 |
|
|
|
53.7 |
|
|
|
(4.7 |
) |
|
|
6,100 |
|
|
|
47.6 |
|
|
|
(4.3 |
) |
| Compulsory automobile liability insurance |
|
|
235 |
|
|
|
2.0 |
|
|
|
(14.2 |
) |
|
|
211 |
|
|
|
1.7 |
|
|
|
(10.0 |
) |
| Others |
|
|
609 |
|
|
|
5.1 |
|
|
|
(5.7 |
) |
|
|
637 |
|
|
|
5.0 |
|
|
|
4.6 |
|
|
|
|
|
|
|
|
|
|
|
|
|
|
|
|
|
|
|
|
|
|
|
|
|
|
| Total |
|
|
11,855 |
|
|
|
100.0 |
|
|
|
8.9 |
|
|
|
12,825 |
|
|
|
100.0 |
|
|
|
8.2 |
|
| Deposits of premiums by policyholders |
|
|
571 |
|
|
|
— |
|
|
|
(2.7 |
) |
|
|
478 |
|
|
|
— |
|
|
|
(16.3 |
) |
|
|
|
|
|
|
|
|
|
|
|
|
|
|
|
|
|
|
|
|
|
|
|
|
|
Net premiums written
|
|
|
|
|
|
|
|
|
|
|
|
|
|
|
|
|
|
|
|
|
|
|
|
|
| |
|
(Millions of yen) |
|
| |
|
Nine months ended December 31, 2009
(April 1 to December 31, 2009) |
|
|
Nine months ended December 31, 2010
(April 1 to December 31, 2010) |
|
| Business line |
|
Amount |
|
|
% of total
amount |
|
|
Rate of
change |
|
|
Amount |
|
|
% of total
amount |
|
|
Rate of
change |
|
| Fire and allied insurance |
|
|
1,252 |
|
|
|
12.0 |
% |
|
|
86.2 |
% |
|
|
1,931 |
|
|
|
17.5 |
% |
|
|
54.2 |
% |
| Marine insurance |
|
|
22 |
|
|
|
0.2 |
|
|
|
(39.2 |
) |
|
|
16 |
|
|
|
0.2 |
|
|
|
(25.3 |
) |
| Personal accident insurance |
|
|
1,906 |
|
|
|
18.3 |
|
|
|
10.8 |
|
|
|
2,064 |
|
|
|
18.7 |
|
|
|
8.2 |
|
| Voluntary automobile insurance |
|
|
6,324 |
|
|
|
60.8 |
|
|
|
(4.7 |
) |
|
|
6,054 |
|
|
|
54.9 |
|
|
|
(4.3 |
) |
| Compulsory automobile liability insurance |
|
|
311 |
|
|
|
3.0 |
|
|
|
(7.7 |
) |
|
|
349 |
|
|
|
3.2 |
|
|
|
12.1 |
|
| Others |
|
|
583 |
|
|
|
5.6 |
|
|
|
(6.3 |
) |
|
|
610 |
|
|
|
5.5 |
|
|
|
4.6 |
|
|
|
|
|
|
|
|
|
|
|
|
|
|
|
|
|
|
|
|
|
|
|
|
|
|
| Total |
|
|
10,402 |
|
|
|
100.0 |
|
|
|
3.7 |
|
|
|
11,026 |
|
|
|
100.0 |
|
|
|
6.0 |
|
|
|
|
|
|
|
|
|
|
|
|
|
|
|
|
|
|
|
|
|
|
|
|
|
|
Net claims paid
|
|
|
|
|
|
|
|
|
|
|
|
|
|
|
|
|
|
|
|
|
|
|
|
|
| |
|
(Millions of yen) |
|
| |
|
Nine months ended December 31, 2009
(April 1 to December 31, 2009) |
|
|
Nine months ended December 31, 2010
(April 1 to December 31, 2010) |
|
| Business line |
|
Amount |
|
|
Rate of
change |
|
|
Net loss
ratio |
|
|
Amount |
|
|
Rate of
change |
|
|
Net loss
ratio |
|
| Fire and allied insurance |
|
|
133 |
|
|
|
(33.5 |
)% |
|
|
11.9 |
% |
|
|
190 |
|
|
|
42.3 |
% |
|
|
11.0 |
% |
| Marine insurance |
|
|
14 |
|
|
|
(29.9 |
) |
|
|
65.7 |
|
|
|
13 |
|
|
|
(7.8 |
) |
|
|
80.0 |
|
| Personal accident insurance |
|
|
1,059 |
|
|
|
8.9 |
|
|
|
61.5 |
|
|
|
1,204 |
|
|
|
13.8 |
|
|
|
65.8 |
|
| Voluntary automobile insurance |
|
|
4,064 |
|
|
|
5.0 |
|
|
|
71.7 |
|
|
|
3,859 |
|
|
|
(5.1 |
) |
|
|
72.3 |
|
| Compulsory automobile liability insurance |
|
|
297 |
|
|
|
(3.6 |
) |
|
|
102.9 |
|
|
|
313 |
|
|
|
5.3 |
|
|
|
95.7 |
|
| Others |
|
|
114 |
|
|
|
(17.9 |
) |
|
|
22.3 |
|
|
|
100 |
|
|
|
(12.3 |
) |
|
|
20.2 |
|
|
|
|
|
|
|
|
|
|
|
|
|
|
|
|
|
|
|
|
|
|
|
|
|
|
| Total |
|
|
5,683 |
|
|
|
3.1 |
|
|
|
60.8 |
|
|
|
5,681 |
|
|
|
(0.0 |
) |
|
|
58.2 |
|
|
|
|
|
|
|
|
|
|
|
|
|
|
|
|
|
|
|
|
|
|
|
|
|
|
20
Saison Automobile and Fire Insurance Company, Limited (Non-consolidated)
Solvency Margin Ratio
|
|
|
|
|
|
|
|
|
| |
|
(Millions of yen) |
|
| |
|
As of December 31, 2010 |
|
|
As of March 31, 2010 |
|
| (A) Total Solvency Margin |
|
|
13,034 |
|
|
|
15,333 |
|
| Capital and funds, etc. |
|
|
9,493 |
|
|
|
11,658 |
|
| Reserve for price fluctuation |
|
|
6 |
|
|
|
14 |
|
| Contingency reserve |
|
|
8 |
|
|
|
8 |
|
| Catastrophic loss reserve |
|
|
3,152 |
|
|
|
3,291 |
|
| General allowance for possible loan losses |
|
|
0 |
|
|
|
0 |
|
| Unrealized gains on securities (before tax effect deductions) |
|
|
371 |
|
|
|
359 |
|
| Net unrealized gains and losses on real estate |
|
|
— |
|
|
|
— |
|
| Excess amount of reserve for maturity refunds |
|
|
— |
|
|
|
— |
|
| Subordinated debt, etc. |
|
|
— |
|
|
|
— |
|
| Deductions |
|
|
— |
|
|
|
— |
|
| Others |
|
|
2 |
|
|
|
2 |
|
| (B) Total Risks |
|
|
1,657 |
|
|
|
1,653 |
|
|
|
|
|
|
|
|
|
|
|
| Underwriting risk (R1) |
|
|
839 |
|
|
|
838 |
|
| Underwriting risk for third-sector insurance products including accident, sickness and nursing-care insurance (R2) |
|
|
— |
|
|
|
— |
|
| Guaranteed interest rate risk (R3) |
|
|
6 |
|
|
|
6 |
|
| Investment risk (R4) |
|
|
510 |
|
|
|
530 |
|
| Business management risk (R5) |
|
|
59 |
|
|
|
59 |
|
| Major catastrophe risk (R6) |
|
|
612 |
|
|
|
598 |
|
| (C) Solvency Margin Ratio |
|
|
1,572.6 |
% |
|
|
1,854.7 |
% |
| [ (A) / {(B) × 1/2} ] × 100 |
|
|
|
|
|
|
|
|
| Note) |
The above figures are calculated based on Articles 86 and 87 of the Ordinance for Enforcement of the Insurance Business Law and the provisions of Notification
No. 50 of the Ministry of Finance (1996). The figures as of December 31, 2010 are partly calculated on the simplified method, for example, some bases for the major catastrophe risk calculation are deemed same as the figures as of
September 30, 2010. |
21
Sompo Japan Himawari Life Insurance Co., Ltd. (Non-consolidated)
Quarterly Balance Sheets
|
|
|
|
|
|
|
|
|
|
|
|
|
| |
|
(Millions of yen) |
|
| |
|
As of December 31, 2010 |
|
|
As of March 31, 2010 |
|
|
Increase
(Decrease) |
|
| |
|
Amount |
|
|
Amount |
|
|
|
|
| Assets: |
|
|
|
|
|
|
|
|
|
|
|
|
| Cash and deposits |
|
|
21,129 |
|
|
|
32,988 |
|
|
|
(11,858 |
) |
| Securities: |
|
|
1,083,772 |
|
|
|
1,030,306 |
|
|
|
53,466 |
|
| Government bonds |
|
|
638,741 |
|
|
|
560,887 |
|
|
|
77,853 |
|
| Municipal bonds |
|
|
69,338 |
|
|
|
70,489 |
|
|
|
(1,150 |
) |
| Corporate bonds |
|
|
311,611 |
|
|
|
310,212 |
|
|
|
1,398 |
|
| Domestic stocks |
|
|
5,070 |
|
|
|
5,140 |
|
|
|
(70 |
) |
| Foreign securities |
|
|
59,011 |
|
|
|
83,576 |
|
|
|
(24,564 |
) |
| Loans: |
|
|
17,482 |
|
|
|
17,162 |
|
|
|
319 |
|
| Policy loans |
|
|
17,482 |
|
|
|
17,162 |
|
|
|
319 |
|
| Tangible fixed assets |
|
|
1,165 |
|
|
|
1,197 |
|
|
|
(32 |
) |
| Intangible fixed assets |
|
|
4,367 |
|
|
|
4,625 |
|
|
|
(258 |
) |
| Agency accounts receivable |
|
|
147 |
|
|
|
174 |
|
|
|
(26 |
) |
| Reinsurance accounts receivable |
|
|
736 |
|
|
|
1,206 |
|
|
|
(470 |
) |
| Other assets |
|
|
23,657 |
|
|
|
21,401 |
|
|
|
2,255 |
|
| Deferred tax assets |
|
|
13,117 |
|
|
|
13,164 |
|
|
|
(47 |
) |
| Allowance for possible loan losses |
|
|
(36 |
) |
|
|
(94 |
) |
|
|
58 |
|
|
|
|
|
|
|
|
|
|
|
|
|
|
| Total assets |
|
|
1,165,539 |
|
|
|
1,122,133 |
|
|
|
43,405 |
|
|
|
|
|
|
|
|
|
|
|
|
|
|
| Liabilities: |
|
|
|
|
|
|
|
|
|
|
|
|
| Policy reserves: |
|
|
1,102,184 |
|
|
|
1,054,852 |
|
|
|
47,331 |
|
| Reserve for outstanding claims |
|
|
20,316 |
|
|
|
20,155 |
|
|
|
160 |
|
| Policy reserves |
|
|
1,079,744 |
|
|
|
1,032,371 |
|
|
|
47,373 |
|
| Reserve for dividends to policyholders |
|
|
2,123 |
|
|
|
2,325 |
|
|
|
(202 |
) |
| Agency accounts payable |
|
|
1,391 |
|
|
|
1,591 |
|
|
|
(199 |
) |
| Reinsurance accounts payable |
|
|
995 |
|
|
|
1,205 |
|
|
|
(210 |
) |
| Other liabilities |
|
|
4,237 |
|
|
|
7,564 |
|
|
|
(3,326 |
) |
| Reserve for retirement benefits |
|
|
876 |
|
|
|
663 |
|
|
|
213 |
|
| Reserve for retirement benefits to directors |
|
|
76 |
|
|
|
45 |
|
|
|
31 |
|
| Reserves under the special laws: |
|
|
919 |
|
|
|
794 |
|
|
|
125 |
|
| Reserve for price fluctuation |
|
|
919 |
|
|
|
794 |
|
|
|
125 |
|
|
|
|
|
|
|
|
|
|
|
|
|
|
| Total liabilities |
|
|
1,110,682 |
|
|
|
1,066,716 |
|
|
|
43,965 |
|
|
|
|
|
|
|
|
|
|
|
|
|
|
| Net assets: |
|
|
|
|
|
|
|
|
|
|
|
|
| Shareholders’ equity: |
|
|
|
|
|
|
|
|
|
|
|
|
| Common stock |
|
|
17,250 |
|
|
|
17,250 |
|
|
|
— |
|
| Capital surplus |
|
|
10,000 |
|
|
|
10,000 |
|
|
|
— |
|
| Retained earnings |
|
|
25,500 |
|
|
|
27,283 |
|
|
|
(1,783 |
) |
| Total shareholders’ equity |
|
|
52,750 |
|
|
|
54,533 |
|
|
|
(1,783 |
) |
| Valuation and translation adjustments: |
|
|
|
|
|
|
|
|
|
|
|
|
| Unrealized gains on securities available for sale, net of tax |
|
|
2,106 |
|
|
|
882 |
|
|
|
1,223 |
|
| Total valuation and translation adjustments |
|
|
2,106 |
|
|
|
882 |
|
|
|
1,223 |
|
|
|
|
|
|
|
|
|
|
|
|
|
|
| Total net assets |
|
|
54,856 |
|
|
|
55,416 |
|
|
|
(559 |
) |
|
|
|
|
|
|
|
|
|
|
|
|
|
| Total liabilities and net assets |
|
|
1,165,539 |
|
|
|
1,122,133 |
|
|
|
43,405 |
|
|
|
|
|
|
|
|
|
|
|
|
|
|
22
Sompo Japan Himawari Life Insurance Co., Ltd. (Non-consolidated)
Quarterly Statements of Income
|
|
|
|
|
|
|
|
|
|
|
|
|
|
|
|
|
| |
|
(Millions of yen) |
|
| |
|
Nine months ended
December 31, 2009
(April 1
to
December 31, 2009) |
|
|
Nine months ended
December 31, 2010
(April 1
to
December 31, 2010) |
|
|
Increase
(Decrease) |
|
|
Rate of
change |
|
| |
|
Amount |
|
|
Amount |
|
|
|
|
|
|
|
| Ordinary income: |
|
|
185,354 |
|
|
|
196,123 |
|
|
|
10,768 |
|
|
|
5.8 |
% |
| Insurance premiums and other: |
|
|
169,081 |
|
|
|
181,278 |
|
|
|
12,197 |
|
|
|
7.2 |
|
| Insurance premiums |
|
|
167,055 |
|
|
|
179,259 |
|
|
|
12,203 |
|
|
|
7.3 |
|
| Investment income: |
|
|
16,194 |
|
|
|
14,709 |
|
|
|
(1,484 |
) |
|
|
(9.2 |
) |
| Interest and dividend income |
|
|
13,540 |
|
|
|
14,235 |
|
|
|
695 |
|
|
|
5.1 |
|
| Gains on sales of securities |
|
|
1,080 |
|
|
|
474 |
|
|
|
(606 |
) |
|
|
(56.1 |
) |
| Investment gains on special account |
|
|
1,573 |
|
|
|
— |
|
|
|
(1,573 |
) |
|
|
(100.0 |
) |
| Other ordinary income |
|
|
79 |
|
|
|
135 |
|
|
|
55 |
|
|
|
70.4 |
|
|
|
|
|
|
|
|
|
|
|
|
|
|
|
|
|
|
| Ordinary expenses: |
|
|
183,789 |
|
|
|
196,816 |
|
|
|
13,026 |
|
|
|
7.1 |
|
| Insurance claims and other: |
|
|
112,763 |
|
|
|
102,917 |
|
|
|
(9,845 |
) |
|
|
(8.7 |
) |
| Insurance claims |
|
|
16,363 |
|
|
|
16,083 |
|
|
|
(280 |
) |
|
|
(1.7 |
) |
| Annuity payments |
|
|
609 |
|
|
|
742 |
|
|
|
132 |
|
|
|
21.7 |
|
| Insurance benefits |
|
|
16,499 |
|
|
|
18,007 |
|
|
|
1,508 |
|
|
|
9.1 |
|
| Surrender benefits |
|
|
74,900 |
|
|
|
64,051 |
|
|
|
(10,849 |
) |
|
|
(14.5 |
) |
| Other refunds |
|
|
886 |
|
|
|
709 |
|
|
|
(177 |
) |
|
|
(20.0 |
) |
| Provision for policy reserves and other: |
|
|
27,294 |
|
|
|
47,534 |
|
|
|
20,240 |
|
|
|
74.2 |
|
| Provision for reserve for outstanding claims |
|
|
1,856 |
|
|
|
160 |
|
|
|
(1,695 |
) |
|
|
(91.3 |
) |
| Provision for policy reserves |
|
|
25,438 |
|
|
|
47,373 |
|
|
|
21,935 |
|
|
|
86.2 |
|
| Provision for interest portion of reserve for dividends to policyholders |
|
|
0 |
|
|
|
0 |
|
|
|
0 |
|
|
|
72.7 |
|
| Investment expenses: |
|
|
1,118 |
|
|
|
773 |
|
|
|
(345 |
) |
|
|
(30.9 |
) |
| Interest paid |
|
|
26 |
|
|
|
43 |
|
|
|
17 |
|
|
|
65.0 |
|
| Losses on sales of securities |
|
|
— |
|
|
|
175 |
|
|
|
175 |
|
|
|
— |
|
| Impairment losses on securities |
|
|
718 |
|
|
|
— |
|
|
|
(718 |
) |
|
|
(100.0 |
) |
| Losses on derivatives |
|
|
318 |
|
|
|
24 |
|
|
|
(293 |
) |
|
|
(92.2 |
) |
| Investment losses on special account |
|
|
— |
|
|
|
493 |
|
|
|
493 |
|
|
|
— |
|
| Operating, general and administrative expenses |
|
|
41,441 |
|
|
|
43,649 |
|
|
|
2,208 |
|
|
|
5.3 |
|
| Other ordinary expenses |
|
|
1,171 |
|
|
|
1,940 |
|
|
|
769 |
|
|
|
65.7 |
|
|
|
|
|
|
|
|
|
|
|
|
|
|
|
|
|
|
| Ordinary profit (loss) |
|
|
1,565 |
|
|
|
(692 |
) |
|
|
(2,257 |
) |
|
|
(144.3 |
) |
|
|
|
|
|
|
|
|
|
|
|
|
|
|
|
|
|
| Extraordinary gains: |
|
|
0 |
|
|
|
4 |
|
|
|
4 |
|
|
|
3,869.5 |
|
| Other extraordinary gains |
|
|
0 |
|
|
|
4 |
|
|
|
4 |
|
|
|
3,869.5 |
|
| Extraordinary losses: |
|
|
94 |
|
|
|
480 |
|
|
|
386 |
|
|
|
409.8 |
|
| Losses on disposal of fixed assets |
|
|
7 |
|
|
|
15 |
|
|
|
7 |
|
|
|
111.6 |
|
| Provision for reserves under the special laws: |
|
|
87 |
|
|
|
125 |
|
|
|
38 |
|
|
|
44.0 |
|
| Provision for reserve for price fluctuation |
|
|
87 |
|
|
|
125 |
|
|
|
38 |
|
|
|
44.0 |
|
| Other extraordinary losses |
|
|
— |
|
|
|
339 |
|
|
|
339 |
|
|
|
— |
|
|
|
|
|
|
|
|
|
|
|
|
|
|
|
|
|
|
| Provision for reserve for dividends to policyholders |
|
|
1,107 |
|
|
|
1,194 |
|
|
|
86 |
|
|
|
7.8 |
|
| Income (loss) before income taxes |
|
|
363 |
|
|
|
(2,362 |
) |
|
|
(2,725 |
) |
|
|
(750.5 |
) |
| Income taxes and deferred income taxes |
|
|
325 |
|
|
|
(579 |
) |
|
|
(904 |
) |
|
|
(278.2 |
) |
| Net income (loss) |
|
|
38 |
|
|
|
(1,783 |
) |
|
|
(1,821 |
) |
|
|
(4,784.8 |
) |
|
|
|
|
|
|
|
|
|
|
|
|
|
|
|
|
|
23
Sompo Japan Himawari Life Insurance Co., Ltd. (Non-consolidated)
Major Business Results
Total amount of policies in force
|
|
|
|
|
|
|
|
|
|
|
|
|
|
|
|
|
|
|
|
|
|
|
|
|
|
|
|
|
|
|
|
|
| |
|
(Number in thousands, Yen in hundred millions, %) |
|
| |
|
As of December 31, 2010 |
|
|
As of March 31, 2010 |
|
| |
|
Number |
|
|
Amount |
|
|
Number |
|
|
Amount |
|
| |
|
|
|
|
Rate of
change |
|
|
|
|
|
Rate of
change |
|
|
|
|
|
Rate of
change |
|
|
|
|
|
Rate of
change |
|
| Individual insurance |
|
|
1,871 |
|
|
|
108.1 |
|
|
|
112,761 |
|
|
|
108.4 |
|
|
|
1,732 |
|
|
|
109.9 |
|
|
|
104,049 |
|
|
|
110.1 |
|
| Individual annuities |
|
|
15 |
|
|
|
99.5 |
|
|
|
798 |
|
|
|
99.5 |
|
|
|
15 |
|
|
|
98.2 |
|
|
|
801 |
|
|
|
98.5 |
|
| Group insurance |
|
|
— |
|
|
|
— |
|
|
|
18,671 |
|
|
|
101.6 |
|
|
|
— |
|
|
|
— |
|
|
|
18,379 |
|
|
|
92.0 |
|
| Group annuities |
|
|
— |
|
|
|
— |
|
|
|
— |
|
|
|
— |
|
|
|
— |
|
|
|
— |
|
|
|
— |
|
|
|
— |
|
| Note) |
Amount of “Individual annuities” represents the sum of annuity fund at the beginning of annuity payment of contracts before the beginning of annuity payment
and policy reserves for the contracts after the beginning of annuity payment. |
Total amount of new policies
|
|
|
|
|
|
|
|
|
|
|
|
|
|
|
|
|
|
|
|
|
|
|
|
|
|
|
|
|
|
|
|
|
| |
|
(Number in thousands, Yen in hundred millions, %) |
|
| |
|
Nine months ended December 31, 2009
(April 1 to December 31,
2009) |
|
|
Nine months ended December 31, 2010
(April 1 to December 31,
2010) |
|
| |
|
Number |
|
|
Amount |
|
|
Number |
|
|
Amount |
|
| |
|
|
|
|
Rate of
change |
|
|
|
|
|
Rate of
change |
|
|
|
|
|
Rate of
change |
|
|
|
|
|
Rate of
change |
|
| Individual insurance |
|
|
228 |
|
|
|
133.5 |
|
|
|
15,636 |
|
|
|
132.8 |
|
|
|
247 |
|
|
|
108.5 |
|
|
|
16,869 |
|
|
|
107.9 |
|
| Individual annuities |
|
|
0 |
|
|
|
105.6 |
|
|
|
15 |
|
|
|
96.7 |
|
|
|
0 |
|
|
|
114.9 |
|
|
|
16 |
|
|
|
105.9 |
|
| Group insurance |
|
|
— |
|
|
|
— |
|
|
|
425 |
|
|
|
651.7 |
|
|
|
— |
|
|
|
— |
|
|
|
171 |
|
|
|
40.2 |
|
| Group annuities |
|
|
— |
|
|
|
— |
|
|
|
— |
|
|
|
— |
|
|
|
— |
|
|
|
— |
|
|
|
— |
|
|
|
— |
|
| Note) |
Amount of “Individual annuities” represents the amount of annuity fund at the beginning of annuity payment. |
Annualized premiums
Policies in force
|
|
|
|
|
|
|
|
|
|
|
|
|
|
|
|
|
| |
|
(Millions of yen, %) |
|
| |
|
As of December 31, 2010 |
|
|
As of March 31, 2010 |
|
| |
|
|
|
|
Rate of
change |
|
|
|
|
|
Rate of
change |
|
| Individual insurance |
|
|
195,707 |
|
|
|
101.5 |
|
|
|
192,742 |
|
|
|
98.1 |
|
| Individual annuities |
|
|
3,534 |
|
|
|
102.8 |
|
|
|
3,439 |
|
|
|
98.9 |
|
|
|
|
|
|
|
|
|
|
|
|
|
|
|
|
|
|
| Total |
|
|
199,241 |
|
|
|
101.6 |
|
|
|
196,181 |
|
|
|
98.2 |
|
|
|
|
|
|
|
|
|
|
|
|
|
|
|
|
|
|
| Medical and survival benefits |
|
|
77,121 |
|
|
|
105.8 |
|
|
|
72,864 |
|
|
|
106.1 |
|
|
|
|
|
|
|
|
|
|
|
|
|
|
|
|
|
|
New policies
|
|
|
|
|
|
|
|
|
|
|
|
|
|
|
|
|
| |
|
(Millions of yen, %) |
|
| |
|
Nine months ended December 31, 2009
(April 1 to December 31,
2009) |
|
|
Nine months ended December 31, 2010
(April 1 to December 31,
2010) |
|
| |
|
|
|
|
Rate of
change |
|
|
|
|
|
Rate of
change |
|
| Individual insurance |
|
|
17,662 |
|
|
|
111.8 |
|
|
|
19,411 |
|
|
|
109.9 |
|
| Individual annuities |
|
|
61 |
|
|
|
90.1 |
|
|
|
65 |
|
|
|
107.3 |
|
|
|
|
|
|
|
|
|
|
|
|
|
|
|
|
|
|
| Total |
|
|
17,723 |
|
|
|
111.7 |
|
|
|
19,477 |
|
|
|
109.9 |
|
|
|
|
|
|
|
|
|
|
|
|
|
|
|
|
|
|
| Medical and survival benefits |
|
|
8,637 |
|
|
|
125.1 |
|
|
|
9,057 |
|
|
|
104.9 |
|
|
|
|
|
|
|
|
|
|
|
|
|
|
|
|
|
|
Notes)
| 1. |
Annualized premiums are calculated by using multipliers for various premium payment terms to the premium per payment. In single premium contracts, the amount is
calculated by dividing the premium by the duration of the policy. |
| 2. |
Annualized premiums for medical and survival benefits include (a) premium related to medical benefits such as hospitalization and surgery benefits,
(b) premium related to survival benefits such as specific illness and nursing benefits, and (c) premium related to premium waiver benefits, in which disability cause is excluded but causes such as specific illness and nursing care are
included. |
24
Sompo Japan Himawari Life Insurance Co., Ltd. (Non-consolidated)
Solvency Margin Ratio
|
|
|
|
|
|
|
|
|
| |
|
(Millions of yen) |
|
| |
|
As of December 31, 2010 |
|
|
As of March 31, 2010 |
|
| (A) Total Solvency Margin |
|
|
161,571 |
|
|
|
157,431 |
|
| Capital, etc. |
|
|
52,754 |
|
|
|
54,533 |
|
| Reserve for price fluctuation |
|
|
919 |
|
|
|
794 |
|
| Contingency reserve |
|
|
16,261 |
|
|
|
15,355 |
|
| General allowance for possible loan losses |
|
|
14 |
|
|
|
18 |
|
| Unrealized gains on securities (90% of gain or 100% of loss) |
|
|
2,971 |
|
|
|
1,245 |
|
| Net unrealized gains and losses on real estate (85% of gain or 100% of loss) |
|
|
— |
|
|
|
— |
|
| Policy reserves in excess of surrender values |
|
|
73,347 |
|
|
|
69,171 |
|
| Brought in capital, etc. |
|
|
— |
|
|
|
— |
|
| Subordinated debt, etc. |
|
|
— |
|
|
|
— |
|
| Deductions |
|
|
— |
|
|
|
— |
|
| Others |
|
|
15,302 |
|
|
|
16,312 |
|
| (B) Total Risks
|
|
|
13,563 |
|
|
|
12,915 |
|
| Underwriting risk (R1) |
|
|
6,927 |
|
|
|
6,382 |
|
| Underwriting risk for third-sector insurance products including accident, sickness and nursing-care insurance (R8) |
|
|
3,842 |
|
|
|
3,516 |
|
| Guaranteed interest rate risk (R2) |
|
|
3,212 |
|
|
|
3,188 |
|
| Investment risk (R3) |
|
|
4,076 |
|
|
|
4,223 |
|
| Business management risk (R4) |
|
|
367 |
|
|
|
352 |
|
| Guaranteed minimum benefit risk (R7) |
|
|
336 |
|
|
|
322 |
|
| (C) Solvency Margin Ratio |
|
|
|
|
|
|
|
|
|

|
|
|
2,382.3 |
% |
|
|
2,437.9 |
% |
Notes)
| 1. |
The above figures are calculated based on Articles 86, 87, 161, 162 and 190 of the Ordinance for Enforcement of the Insurance Business Law and the provisions of
Notification No. 50 of the Ministry of Finance (1996). “Policy reserves in excess of surrender values” is calculated based on the provisions of Article 1 Paragraph 3-1 of Notification No. 50 of the Ministry of Finance.
|
| 2. |
Guaranteed minimum benefit risk is calculated by the standard method. |
25
NIPPONKOA Life Insurance Co., Ltd. (Non-consolidated)
Quarterly Balance Sheets
|
|
|
|
|
|
|
|
|
|
|
|
|
| |
|
(Millions of yen) |
|
| |
|
As of December 31, 2010 |
|
|
As of March 31, 2010 |
|
|
Increase
(Decrease) |
|
| |
|
Amount |
|
|
Amount |
|
|
|
|
| Assets: |
|
|
|
|
|
|
|
|
|
|
|
|
| Cash and deposits |
|
|
10,309 |
|
|
|
14,371 |
|
|
|
(4,062 |
) |
| Call loans |
|
|
725 |
|
|
|
478 |
|
|
|
247 |
|
| Receivables under securities borrowing transactions |
|
|
25,502 |
|
|
|
25,382 |
|
|
|
120 |
|
| Money trusts |
|
|
20,213 |
|
|
|
19,916 |
|
|
|
297 |
|
| Securities: |
|
|
415,813 |
|
|
|
378,612 |
|
|
|
37,200 |
|
| Government bonds |
|
|
276,650 |
|
|
|
243,074 |
|
|
|
33,576 |
|
| Municipal bonds |
|
|
55,028 |
|
|
|
52,132 |
|
|
|
2,895 |
|
| Corporate bonds |
|
|
76,674 |
|
|
|
75,571 |
|
|
|
1,102 |
|
| Domestic stocks |
|
|
6,483 |
|
|
|
6,892 |
|
|
|
(408 |
) |
| Foreign securities |
|
|
976 |
|
|
|
941 |
|
|
|
35 |
|
| Loans: |
|
|
14,836 |
|
|
|
13,763 |
|
|
|
1,073 |
|
| Policy loans |
|
|
14,836 |
|
|
|
13,763 |
|
|
|
1,073 |
|
| Tangible fixed assets |
|
|
198 |
|
|
|
178 |
|
|
|
20 |
|
| Intangible fixed assets |
|
|
1,303 |
|
|
|
240 |
|
|
|
1,062 |
|
| Agency accounts receivable |
|
|
17 |
|
|
|
24 |
|
|
|
(7 |
) |
| Reinsurance accounts receivable |
|
|
178 |
|
|
|
183 |
|
|
|
(4 |
) |
| Other assets |
|
|
11,451 |
|
|
|
8,911 |
|
|
|
2,539 |
|
| Deferred tax assets |
|
|
6,725 |
|
|
|
6,931 |
|
|
|
(206 |
) |
| Allowance for possible loan losses |
|
|
(7 |
) |
|
|
(7 |
) |
|
|
0 |
|
|
|
|
|
|
|
|
|
|
|
|
|
|
| Total assets |
|
|
507,268 |
|
|
|
468,988 |
|
|
|
38,280 |
|
|
|
|
|
|
|
|
|
|
|
|
|
|
| Liabilities: |
|
|
|
|
|
|
|
|
|
|
|
|
| Policy reserves: |
|
|
450,504 |
|
|
|
411,682 |
|
|
|
38,821 |
|
| Reserve for outstanding claims |
|
|
2,441 |
|
|
|
2,998 |
|
|
|
(557 |
) |
| Policy reserves |
|
|
446,591 |
|
|
|
407,193 |
|
|
|
39,398 |
|
| Reserve for dividends to policyholders |
|
|
1,471 |
|
|
|
1,491 |
|
|
|
(19 |
) |
| Agency accounts payable |
|
|
749 |
|
|
|
804 |
|
|
|
(54 |
) |
| Reinsurance accounts payable |
|
|
163 |
|
|
|
113 |
|
|
|
50 |
|
| Other liabilities |
|
|
27,955 |
|
|
|
30,000 |
|
|
|
(2,045 |
) |
| Reserve for retirement benefits |
|
|
360 |
|
|
|
300 |
|
|
|
59 |
|
| Reserve for bonus payments to directors |
|
|
— |
|
|
|
15 |
|
|
|
(15 |
) |
| Reserves under the special laws: |
|
|
608 |
|
|
|
542 |
|
|
|
66 |
|
| Reserve for price fluctuation |
|
|
608 |
|
|
|
542 |
|
|
|
66 |
|
|
|
|
|
|
|
|
|
|
|
|
|
|
| Total liabilities |
|
|
480,341 |
|
|
|
443,459 |
|
|
|
36,881 |
|
|
|
|
|
|
|
|
|
|
|
|
|
|
| Net assets: |
|
|
|
|
|
|
|
|
|
|
|
|
| Shareholders’ equity: |
|
|
|
|
|
|
|
|
|
|
|
|
| Common stock |
|
|
20,000 |
|
|
|
20,000 |
|
|
|
— |
|
| Retained earnings |
|
|
1,608 |
|
|
|
1,564 |
|
|
|
44 |
|
| Total shareholders’ equity |
|
|
21,608 |
|
|
|
21,564 |
|
|
|
44 |
|
| Valuation and translation adjustments: |
|
|
|
|
|
|
|
|
|
|
|
|
| Unrealized gains on securities available for sale, net of tax |
|
|
5,318 |
|
|
|
3,964 |
|
|
|
1,353 |
|
| Total valuation and translation adjustments |
|
|
5,318 |
|
|
|
3,964 |
|
|
|
1,353 |
|
|
|
|
|
|
|
|
|
|
|
|
|
|
| Total net assets |
|
|
26,926 |
|
|
|
25,528 |
|
|
|
1,398 |
|
|
|
|
|
|
|
|
|
|
|
|
|
|
| Total liabilities and net assets |
|
|
507,268 |
|
|
|
468,988 |
|
|
|
38,280 |
|
|
|
|
|
|
|
|
|
|
|
|
|
|
26
NIPPONKOA Life Insurance Co., Ltd. (Non-consolidated)
Quarterly Statements of Income
|
|
|
|
|
|
|
|
|
|
|
|
|
|
|
|
|
| |
|
(Millions of yen) |
|
| |
|
Nine months ended
December 31, 2009
(April 1 to
December 31, 2009) |
|
|
Nine months ended
December 31, 2010
(April 1 to
December 31, 2010) |
|
|
Increase
(Decrease) |
|
|
Rate of
change |
|
| |
|
Amount |
|
|
Amount |
|
|
|
|
|
|
|
| Ordinary income: |
|
|
74,587 |
|
|
|
84,353 |
|
|
|
9,765 |
|
|
|
13.1 |
% |
| Insurance premiums and other: |
|
|
67,058 |
|
|
|
76,360 |
|
|
|
9,301 |
|
|
|
13.9 |
|
| Insurance premiums |
|
|
66,925 |
|
|
|
75,764 |
|
|
|
8,838 |
|
|
|
13.2 |
|
| Investment income: |
|
|
6,555 |
|
|
|
6,970 |
|
|
|
415 |
|
|
|
6.3 |
|
| Interest and dividend income |
|
|
5,993 |
|
|
|
6,681 |
|
|
|
687 |
|
|
|
11.5 |
|
| Investment gains on money trusts |
|
|
484 |
|
|
|
289 |
|
|
|
(194 |
) |
|
|
(40.2 |
) |
| Gains on sales of securities |
|
|
73 |
|
|
|
— |
|
|
|
(73 |
) |
|
|
(100.0 |
) |
| Other ordinary income: |
|
|
973 |
|
|
|
1,022 |
|
|
|
49 |
|
|
|
5.0 |
|
| Reversal of reserve for outstanding claims |
|
|
205 |
|
|
|
557 |
|
|
|
351 |
|
|
|
170.9 |
|
|
|
|
|
|
|
|
|
|
|
|
|
|
|
|
|
|
| Ordinary expenses: |
|
|
72,830 |
|
|
|
83,152 |
|
|
|
10,322 |
|
|
|
14.2 |
|
| Insurance claims and other: |
|
|
27,987 |
|
|
|
29,257 |
|
|
|
1,269 |
|
|
|
4.5 |
|
| Insurance claims |
|
|
6,400 |
|
|
|
7,869 |
|
|
|
1,469 |
|
|
|
23.0 |
|
| Annuity payments |
|
|
390 |
|
|
|
439 |
|
|
|
48 |
|
|
|
12.4 |
|
| Insurance benefits |
|
|
2,293 |
|
|
|
2,700 |
|
|
|
406 |
|
|
|
17.7 |
|
| Surrender benefits |
|
|
18,317 |
|
|
|
17,631 |
|
|
|
(685 |
) |
|
|
(3.7 |
) |
| Other refunds |
|
|
158 |
|
|
|
139 |
|
|
|
(19 |
) |
|
|
(12.0 |
) |
| Provision for policy reserves and other: |
|
|
31,202 |
|
|
|
39,399 |
|
|
|
8,196 |
|
|
|
26.3 |
|
| Provision for policy reserves |
|
|
31,202 |
|
|
|
39,398 |
|
|
|
8,196 |
|
|
|
26.3 |
|
| Provision for interest portion of reserve for dividends to policyholders |
|
|
0 |
|
|
|
1 |
|
|
|
0 |
|
|
|
24.9 |
|
| Investment expenses: |
|
|
53 |
|
|
|
29 |
|
|
|
(24 |
) |
|
|
(45.2 |
) |
| Interest paid |
|
|
49 |
|
|
|
26 |
|
|
|
(23 |
) |
|
|
(47.6 |
) |
| Operating, general and administrative expenses |
|
|
12,847 |
|
|
|
13,776 |
|
|
|
929 |
|
|
|
7.2 |
|
| Other ordinary expenses |
|
|
738 |
|
|
|
689 |
|
|
|
(48 |
) |
|
|
(6.6 |
) |
|
|
|
|
|
|
|
|
|
|
|
|
|
|
|
|
|
| Ordinary profit |
|
|
1,757 |
|
|
|
1,200 |
|
|
|
(556 |
) |
|
|
(31.7 |
) |
|
|
|
|
|
|
|
|
|
|
|
|
|
|
|
|
|
| Extraordinary gains: |
|
|
— |
|
|
|
0 |
|
|
|
0 |
|
|
|
— |
|
| Reversal of allowance for possible loan losses |
|
|
— |
|
|
|
0 |
|
|
|
0 |
|
|
|
— |
|
| Extraordinary losses: |
|
|
68 |
|
|
|
181 |
|
|
|
112 |
|
|
|
164.9 |
|
| Losses on disposal of fixed assets |
|
|
8 |
|
|
|
0 |
|
|
|
(7 |
) |
|
|
(88.8 |
) |
| Provision for reserves under the special laws: |
|
|
60 |
|
|
|
66 |
|
|
|
5 |
|
|
|
9.5 |
|
| Provision for reserve for price fluctuation |
|
|
60 |
|
|
|
66 |
|
|
|
5 |
|
|
|
9.5 |
|
| Other extraordinary losses |
|
|
— |
|
|
|
114 |
|
|
|
114 |
|
|
|
— |
|
|
|
|
|
|
|
|
|
|
|
|
|
|
|
|
|
|
| Provision for reserve for dividends to policyholders |
|
|
832 |
|
|
|
899 |
|
|
|
67 |
|
|
|
8.1 |
|
| Income before income taxes |
|
|
855 |
|
|
|
119 |
|
|
|
(736 |
) |
|
|
(86.0 |
) |
| Income taxes and deferred income taxes |
|
|
322 |
|
|
|
75 |
|
|
|
(246 |
) |
|
|
(76.6 |
) |
| Net income |
|
|
533 |
|
|
|
44 |
|
|
|
(489 |
) |
|
|
(91.7 |
) |
|
|
|
|
|
|
|
|
|
|
|
|
|
|
|
|
|
27
NIPPONKOA Life Insurance Co., Ltd. (Non-consolidated)
Major Business Results
Total amount of policies in force
|
|
|
|
|
|
|
|
|
|
|
|
|
|
|
|
|
|
|
|
|
|
|
|
|
|
|
|
|
|
|
|
|
| |
|
(Number in thousands, Yen in hundred millions, %) |
|
| |
|
As of December 31, 2010 |
|
|
As of March 31, 2010 |
|
| |
|
Number |
|
|
Amount |
|
|
Number |
|
|
Amount |
|
| |
|
|
|
|
Rate of
change |
|
|
|
|
|
Rate of
change |
|
|
|
|
|
Rate of
change |
|
|
|
|
|
Rate of
change |
|
| Individual insurance |
|
|
604 |
|
|
|
108.9 |
|
|
|
42,412 |
|
|
|
105.9 |
|
|
|
555 |
|
|
|
111.1 |
|
|
|
40,044 |
|
|
|
105.1 |
|
| Individual annuities |
|
|
54 |
|
|
|
100.3 |
|
|
|
1,987 |
|
|
|
100.8 |
|
|
|
53 |
|
|
|
96.3 |
|
|
|
1,971 |
|
|
|
96.3 |
|
| Group insurance |
|
|
— |
|
|
|
— |
|
|
|
11,280 |
|
|
|
102.1 |
|
|
|
— |
|
|
|
— |
|
|
|
11,052 |
|
|
|
109.9 |
|
| Group annuities |
|
|
— |
|
|
|
— |
|
|
|
— |
|
|
|
— |
|
|
|
— |
|
|
|
— |
|
|
|
— |
|
|
|
— |
|
| Note) |
Amount of “Individual annuities” represents the sum of annuity fund at the beginning of annuity payment of contracts before the beginning of annuity payment
and policy reserves for the contracts after the beginning of annuity payment. |
Total amount of new policies
|
|
|
|
|
|
|
|
|
|
|
|
|
|
|
|
|
|
|
|
|
|
|
|
|
|
|
|
|
|
|
|
|
| |
|
(Number in thousands, Yen in hundred millions, %) |
|
| |
|
Nine months ended December 31, 2009
(April 1 to December 31,
2009) |
|
|
Nine months ended December 31, 2010
(April 1 to December 31,
2010) |
|
| |
|
Number |
|
|
Amount |
|
|
Number |
|
|
Amount |
|
| |
|
|
|
|
Rate of
change |
|
|
|
|
|
Rate of
change |
|
|
|
|
|
Rate of
change |
|
|
|
|
|
Rate of
change |
|
| Individual insurance |
|
|
70 |
|
|
|
115.7 |
|
|
|
4,740 |
|
|
|
107.8 |
|
|
|
80 |
|
|
|
114.9 |
|
|
|
5,965 |
|
|
|
125.8 |
|
| Individual annuities |
|
|
0 |
|
|
|
84.6 |
|
|
|
38 |
|
|
|
76.8 |
|
|
|
2 |
|
|
|
246.4 |
|
|
|
92 |
|
|
|
242.1 |
|
| Group insurance |
|
|
— |
|
|
|
— |
|
|
|
284 |
|
|
|
146.5 |
|
|
|
— |
|
|
|
— |
|
|
|
83 |
|
|
|
29.5 |
|
| Group annuities |
|
|
— |
|
|
|
— |
|
|
|
— |
|
|
|
— |
|
|
|
— |
|
|
|
— |
|
|
|
— |
|
|
|
— |
|
| Note) |
Amount of “Individual annuities” represents the amount of annuity fund at the beginning of annuity payment. |
Annualized premiums
Policies in force
|
|
|
|
|
|
|
|
|
|
|
|
|
|
|
|
|
| |
|
(Millions of yen, %) |
|
| |
|
As of December 31, 2010 |
|
|
As of March 31, 2010 |
|
| |
|
|
|
|
Rate of
change |
|
|
|
|
|
Rate of
change |
|
| Individual insurance |
|
|
61,359 |
|
|
|
106.2 |
|
|
|
57,758 |
|
|
|
105.3 |
|
| Individual annuities |
|
|
12,071 |
|
|
|
100.9 |
|
|
|
11,966 |
|
|
|
96.5 |
|
|
|
|
|
|
|
|
|
|
|
|
|
|
|
|
|
|
| Total |
|
|
73,430 |
|
|
|
105.3 |
|
|
|
69,725 |
|
|
|
103.6 |
|
|
|
|
|
|
|
|
|
|
|
|
|
|
|
|
|
|
| Medical and survival benefits |
|
|
14,526 |
|
|
|
106.7 |
|
|
|
13,610 |
|
|
|
111.6 |
|
|
|
|
|
|
|
|
|
|
|
|
|
|
|
|
|
|
New policies
|
|
|
|
|
|
|
|
|
|
|
|
|
|
|
|
|
| |
|
(Millions of yen, %) |
|
| |
|
Nine months ended December 31, 2009
(April 1 to December 31,
2009) |
|
|
Nine months ended December 31, 2010
(April 1 to December 31, 2010) |
|
| |
|
|
|
|
Rate of
change |
|
|
|
|
|
Rate of
change |
|
| Individual insurance |
|
|
6,580 |
|
|
|
104.3 |
|
|
|
7,871 |
|
|
|
119.6 |
|
| Individual annuities |
|
|
227 |
|
|
|
82.8 |
|
|
|
526 |
|
|
|
231.9 |
|
|
|
|
|
|
|
|
|
|
|
|
|
|
|
|
|
|
| Total |
|
|
6,807 |
|
|
|
103.4 |
|
|
|
8,398 |
|
|
|
123.4 |
|
|
|
|
|
|
|
|
|
|
|
|
|
|
|
|
|
|
| Medical and survival benefits |
|
|
1,836 |
|
|
|
101.7 |
|
|
|
1,766 |
|
|
|
96.2 |
|
|
|
|
|
|
|
|
|
|
|
|
|
|
|
|
|
|
Notes)
| 1. |
Annualized premiums are calculated by using multipliers for various premium payment terms to the premium per payment. In single premium contracts, the amount is
calculated by dividing the premium by the duration of the policy. |
| 2. |
Annualized premiums for medical and survival benefits include (a) premium related to medical benefits such as hospitalization and surgery benefits and
(b) premium related to survival benefits such as specific illness. |
28
NIPPONKOA Life Insurance Co., Ltd. (Non-consolidated)
Solvency Margin Ratio
|
|
|
|
|
|
|
|
|
| |
|
(Millions of yen) |
|
| |
|
As of December 31, 2010 |
|
|
As of March 31, 2010 |
|
| (A) Total Solvency Margin |
|
|
62,847 |
|
|
|
60,078 |
|
| Capital, etc. |
|
|
20,766 |
|
|
|
21,564 |
|
| Reserve for price fluctuation |
|
|
608 |
|
|
|
542 |
|
| Contingency reserve |
|
|
5,202 |
|
|
|
4,859 |
|
| General allowance for possible loan losses |
|
|
— |
|
|
|
— |
|
| Unrealized gains on securities (90% of gain or 100% of loss) |
|
|
7,501 |
|
|
|
5,592 |
|
| Net unrealized gains and losses on real estate (85% of gain or 100% of loss) |
|
|
— |
|
|
|
— |
|
| Policy reserves in excess of surrender values |
|
|
27,228 |
|
|
|
25,993 |
|
| Brought in capital, etc. |
|
|
— |
|
|
|
— |
|
| Subordinated debt, etc. |
|
|
— |
|
|
|
— |
|
| Deductions |
|
|
— |
|
|
|
— |
|
| Others |
|
|
1,541 |
|
|
|
1,527 |
|
| (B) Total Risks |
|
|
|
|
|
|
|
|
|
|
|
|
4,659 |
|
|
|
4,368 |
|
| Underwriting risk (R1) |
|
|
3,074 |
|
|
|
2,930 |
|
| Underwriting risk for third-sector insurance products including accident and sickness insurance (R8)
|
|
|
1,077 |
|
|
|
970 |
|
| Guaranteed interest rate risk (R2) |
|
|
171 |
|
|
|
164 |
|
| Investment risk (R3) |
|
|
1,663 |
|
|
|
1,538 |
|
| Business management risk (R4) |
|
|
119 |
|
|
|
112 |
|
| Guaranteed minimum benefit risk (R7) |
|
|
— |
|
|
|
— |
|
| (C) Solvency Margin Ratio |
|
|
|
|
|
|
|
|
|
|
|
|
2,697.9 |
% |
|
|
2,750.4 |
% |
| Note) |
The above figures are calculated based on Articles 86, 87, 161, 162 and 190 of the Ordinance for Enforcement of the Insurance Business Law and the provisions of
Notification No. 50 of the Ministry of Finance (1996). “Policy reserves in excess of surrender values” is calculated based on the provisions of Article 1 Paragraph 3-1 of Notification No. 50 of the Ministry of Finance.
|
29
Sompo Japan DIY Life Insurance Co., Ltd. (Non-consolidated)
Quarterly Balance Sheets
|
|
|
|
|
|
|
|
|
|
|
|
|
| |
|
(Millions of yen) |
|
| |
|
As of December 31, 2010 |
|
|
As of March 31, 2010 |
|
|
Increase
(Decrease) |
|
| |
|
Amount |
|
|
Amount |
|
|
|
|
| Assets: |
|
|
|
|
|
|
|
|
|
|
|
|
| Cash and deposits |
|
|
154 |
|
|
|
182 |
|
|
|
(28 |
) |
| Securities: |
|
|
4,722 |
|
|
|
5,407 |
|
|
|
(685 |
) |
| Government bonds |
|
|
2,388 |
|
|
|
2,690 |
|
|
|
(301 |
) |
| Domestic stocks |
|
|
852 |
|
|
|
950 |
|
|
|
(98 |
) |
| Tangible fixed assets |
|
|
59 |
|
|
|
80 |
|
|
|
(20 |
) |
| Intangible fixed assets |
|
|
— |
|
|
|
0 |
|
|
|
(0 |
) |
| Agency accounts receivable |
|
|
0 |
|
|
|
0 |
|
|
|
0 |
|
| Reinsurance accounts receivable |
|
|
2 |
|
|
|
21 |
|
|
|
(18 |
) |
| Other assets |
|
|
1,154 |
|
|
|
456 |
|
|
|
698 |
|
| Allowance for possible loan losses |
|
|
— |
|
|
|
(0 |
) |
|
|
0 |
|
|
|
|
|
|
|
|
|
|
|
|
|
|
| Total assets |
|
|
6,093 |
|
|
|
6,149 |
|
|
|
(55 |
) |
|
|
|
|
|
|
|
|
|
|
|
|
|
| Liabilities: |
|
|
|
|
|
|
|
|
|
|
|
|
| Policy reserves: |
|
|
1,089 |
|
|
|
1,041 |
|
|
|
48 |
|
| Reserve for outstanding claims |
|
|
199 |
|
|
|
141 |
|
|
|
58 |
|
| Policy reserves |
|
|
889 |
|
|
|
899 |
|
|
|
(10 |
) |
| Agency accounts payable |
|
|
3 |
|
|
|
3 |
|
|
|
0 |
|
| Reinsurance accounts payable |
|
|
28 |
|
|
|
32 |
|
|
|
(3 |
) |
| Other liabilities |
|
|
253 |
|
|
|
342 |
|
|
|
(88 |
) |
| Reserve for retirement benefits |
|
|
23 |
|
|
|
20 |
|
|
|
3 |
|
| Reserves under the special laws: |
|
|
16 |
|
|
|
15 |
|
|
|
0 |
|
| Reserve for price fluctuation |
|
|
16 |
|
|
|
15 |
|
|
|
0 |
|
| Deferred tax liabilities |
|
|
189 |
|
|
|
225 |
|
|
|
(35 |
) |
|
|
|
|
|
|
|
|
|
|
|
|
|
| Total liabilities |
|
|
1,604 |
|
|
|
1,680 |
|
|
|
(75 |
) |
|
|
|
|
|
|
|
|
|
|
|
|
|
| Net assets: |
|
|
|
|
|
|
|
|
|
|
|
|
| Shareholders’ equity: |
|
|
|
|
|
|
|
|
|
|
|
|
| Common stock |
|
|
10,100 |
|
|
|
10,100 |
|
|
|
— |
|
| Capital surplus |
|
|
2,100 |
|
|
|
2,100 |
|
|
|
— |
|
| Retained earnings |
|
|
(8,044 |
) |
|
|
(8,128 |
) |
|
|
83 |
|
| Total shareholders’ equity |
|
|
4,155 |
|
|
|
4,071 |
|
|
|
83 |
|
| Valuation and translation adjustments: |
|
|
|
|
|
|
|
|
|
|
|
|
| Unrealized gains on securities available for sale, net of tax |
|
|
334 |
|
|
|
397 |
|
|
|
(63 |
) |
| Total valuation and translation adjustments |
|
|
334 |
|
|
|
397 |
|
|
|
(63 |
) |
|
|
|
|
|
|
|
|
|
|
|
|
|
| Total net assets |
|
|
4,489 |
|
|
|
4,468 |
|
|
|
20 |
|
|
|
|
|
|
|
|
|
|
|
|
|
|
| Total liabilities and net assets |
|
|
6,093 |
|
|
|
6,149 |
|
|
|
(55 |
) |
|
|
|
|
|
|
|
|
|
|
|
|
|
30
Sompo Japan DIY Life Insurance Co., Ltd. (Non-consolidated)
Quarterly Statements of Income
|
|
|
|
|
|
|
|
|
|
|
|
|
|
|
|
|
| |
|
(Millions of yen) |
|
| |
|
Nine months ended
December 31, 2009
(April 1 to
December 31, 2009) |
|
|
Nine months ended
December 31, 2010
(April 1 to
December 31, 2010) |
|
|
Increase
(Decrease) |
|
|
Rate of
change |
|
| |
|
|
|
| |
|
Amount |
|
|
Amount |
|
|
|
|
|
|
|
| Ordinary income: |
|
|
2,761 |
|
|
|
2,866 |
|
|
|
104 |
|
|
|
3.8 |
% |
| Insurance premiums and other: |
|
|
2,721 |
|
|
|
2,824 |
|
|
|
103 |
|
|
|
3.8 |
|
| Insurance premiums |
|
|
2,665 |
|
|
|
2,733 |
|
|
|
68 |
|
|
|
2.6 |
|
| Investment income: |
|
|
40 |
|
|
|
31 |
|
|
|
(9 |
) |
|
|
(22.8 |
) |
| Interest and dividend income |
|
|
40 |
|
|
|
31 |
|
|
|
(9 |
) |
|
|
(22.8 |
) |
| Other ordinary income: |
|
|
0 |
|
|
|
10 |
|
|
|
10 |
|
|
|
7,003.9 |
|
| Reversal of policy reserves |
|
|
— |
|
|
|
10 |
|
|
|
10 |
|
|
|
— |
|
|
|
|
|
|
|
|
|
|
|
|
|
|
|
|
|
|
| Ordinary expenses: |
|
|
3,222 |
|
|
|
2,779 |
|
|
|
(443 |
) |
|
|
(13.8 |
) |
| Insurance claims and other: |
|
|
1,009 |
|
|
|
784 |
|
|
|
(224 |
) |
|
|
(22.3 |
) |
| Insurance claims |
|
|
746 |
|
|
|
512 |
|
|
|
(234 |
) |
|
|
(31.4 |
) |
| Insurance benefits |
|
|
150 |
|
|
|
164 |
|
|
|
14 |
|
|
|
9.7 |
|
| Other refunds |
|
|
0 |
|
|
|
3 |
|
|
|
2 |
|
|
|
238.7 |
|
| Provision for policy reserves and other: |
|
|
67 |
|
|
|
58 |
|
|
|
(9 |
) |
|
|
(14.0 |
) |
| Provision for reserve for outstanding claims |
|
|
61 |
|
|
|
58 |
|
|
|
(3 |
) |
|
|
(5.1 |
) |
| Provision for policy reserves |
|
|
6 |
|
|
|
— |
|
|
|
(6 |
) |
|
|
(100.0 |
) |
| Investment expenses: |
|
|
0 |
|
|
|
0 |
|
|
|
(0 |
) |
|
|
(29.2 |
) |
| Interest paid |
|
|
0 |
|
|
|
0 |
|
|
|
(0 |
) |
|
|
(29.2 |
) |
| Operating, general and administrative expenses |
|
|
2,094 |
|
|
|
1,889 |
|
|
|
(204 |
) |
|
|
(9.8 |
) |
| Other ordinary expenses |
|
|
50 |
|
|
|
46 |
|
|
|
(4 |
) |
|
|
(8.8 |
) |
|
|
|
|
|
|
|
|
|
|
|
|
|
|
|
|
|
| Ordinary profit (loss) |
|
|
(461 |
) |
|
|
87 |
|
|
|
548 |
|
|
|
— |
|
|
|
|
|
|
|
|
|
|
|
|
|
|
|
|
|
|
| Extraordinary losses: |
|
|
9 |
|
|
|
0 |
|
|
|
(8 |
) |
|
|
(89.5 |
) |
| Provision for reserves under the special laws: |
|
|
1 |
|
|
|
0 |
|
|
|
(0 |
) |
|
|
(11.6 |
) |
| Provision for reserve for price fluctuation |
|
|
1 |
|
|
|
0 |
|
|
|
(0 |
) |
|
|
(11.6 |
) |
| Other extraordinary losses |
|
|
8 |
|
|
|
- |
|
|
|
(8 |
) |
|
|
(100.0 |
) |
|
|
|
|
|
|
|
|
|
|
|
|
|
|
|
|
|
| Income (loss) before income taxes |
|
|
(470 |
) |
|
|
86 |
|
|
|
556 |
|
|
|
— |
|
| Income taxes and deferred income taxes |
|
|
2 |
|
|
|
2 |
|
|
|
— |
|
|
|
— |
|
| Net income (loss) |
|
|
(473 |
) |
|
|
83 |
|
|
|
556 |
|
|
|
— |
|
|
|
|
|
|
|
|
|
|
|
|
|
|
|
|
|
|
31
Sompo Japan DIY Life Insurance Co., Ltd. (Non-consolidated)
Major Business Results
Total amount of policies in force
|
|
|
|
|
|
|
|
|
|
|
|
|
|
|
|
|
|
|
|
|
|
|
|
|
|
|
|
|
|
|
|
|
| |
|
(Number in thousands, Yen in hundred millions, %) |
|
| |
|
As of December 31, 2010 |
|
|
As of March 31, 2010 |
|
| |
|
Number |
|
|
Amount |
|
|
Number |
|
|
Amount |
|
| |
|
|
|
|
Rate of
change |
|
|
|
|
|
Rate of
change |
|
|
|
|
|
Rate of
change |
|
|
|
|
|
Rate of
change |
|
| Individual insurance |
|
|
46 |
|
|
|
99.3 |
|
|
|
7,906 |
|
|
|
98.3 |
|
|
|
46 |
|
|
|
101.1 |
|
|
|
8,039 |
|
|
|
99.7 |
|
| Individual annuities |
|
|
— |
|
|
|
— |
|
|
|
— |
|
|
|
— |
|
|
|
— |
|
|
|
— |
|
|
|
— |
|
|
|
— |
|
| Group insurance |
|
|
— |
|
|
|
— |
|
|
|
— |
|
|
|
— |
|
|
|
— |
|
|
|
— |
|
|
|
— |
|
|
|
— |
|
| Group annuities |
|
|
— |
|
|
|
— |
|
|
|
— |
|
|
|
— |
|
|
|
— |
|
|
|
— |
|
|
|
— |
|
|
|
— |
|
Total amount of new policies
|
|
|
|
|
|
|
|
|
|
|
|
|
|
|
|
|
|
|
|
|
|
|
|
|
|
|
|
|
|
|
|
|
| |
|
(Number in thousands, Yen in hundred millions, %) |
|
| |
|
Nine months ended December 31, 2009
(April 1 to December 31,
2009) |
|
|
Nine months ended December 31, 2010
(April 1 to December 31,
2010) |
|
| |
|
Number |
|
|
Amount |
|
|
Number |
|
|
Amount |
|
| |
|
|
|
|
Rate of
change |
|
|
|
|
|
Rate of
change |
|
|
|
|
|
Rate of
change |
|
|
|
|
|
Rate of
change |
|
| Individual insurance |
|
|
3 |
|
|
|
96.5 |
|
|
|
592 |
|
|
|
91.4 |
|
|
|
2 |
|
|
|
78.2 |
|
|
|
451 |
|
|
|
76.1 |
|
| Individual annuities |
|
|
— |
|
|
|
— |
|
|
|
— |
|
|
|
— |
|
|
|
— |
|
|
|
— |
|
|
|
— |
|
|
|
— |
|
| Group insurance |
|
|
— |
|
|
|
— |
|
|
|
— |
|
|
|
— |
|
|
|
— |
|
|
|
— |
|
|
|
— |
|
|
|
— |
|
| Group annuities |
|
|
— |
|
|
|
— |
|
|
|
— |
|
|
|
— |
|
|
|
— |
|
|
|
— |
|
|
|
— |
|
|
|
— |
|
Annualized premiums
Policies in force
|
|
|
|
|
|
|
|
|
|
|
|
|
|
|
|
|
| |
|
(Millions of yen, %) |
|
| |
|
As of December 31, 2010 |
|
|
As of March 31, 2010 |
|
| |
|
|
|
|
Rate of
change |
|
|
|
|
|
Rate of
change |
|
| Individual insurance |
|
|
3,700 |
|
|
|
101.4 |
|
|
|
3,650 |
|
|
|
103.2 |
|
| Individual annuities |
|
|
— |
|
|
|
— |
|
|
|
— |
|
|
|
— |
|
| Total |
|
|
3,700 |
|
|
|
101.4 |
|
|
|
3,650 |
|
|
|
103.2 |
|
| Medical and survival benefits |
|
|
877 |
|
|
|
101.6 |
|
|
|
863 |
|
|
|
104.6 |
|
New policies
|
|
|
|
|
|
|
|
|
|
|
|
|
|
|
|
|
| |
|
(Millions of yen, %) |
|
| |
|
Nine months ended December 31, 2009
(April 1 to December 31,
2009) |
|
|
Nine months ended December 31, 2010
(April 1 to December 31,
2010) |
|
| |
|
|
|
|
Rate of
change |
|
|
|
|
|
Rate of
change |
|
| Individual insurance |
|
|
244 |
|
|
|
94.9 |
|
|
|
193 |
|
|
|
79.3 |
|
| Individual annuities |
|
|
— |
|
|
|
— |
|
|
|
— |
|
|
|
— |
|
| Total |
|
|
244 |
|
|
|
94.9 |
|
|
|
193 |
|
|
|
79.3 |
|
| Medical and survival benefits |
|
|
74 |
|
|
|
98.7 |
|
|
|
55 |
|
|
|
74.8 |
|
Notes)
| 1. |
Annualized premiums are calculated by using multipliers for various premium payment terms to the premium per payment. In single premium contracts, the amount is
calculated by dividing the premium by the duration of the policy. |
| 2. |
Annualized premiums for medical and survival benefits include (a) premium related to medical benefits such as hospitalization and surgery benefits,
(b) premium related to survival benefits such as specific illness and nursing benefits, and (c) premium related to premium waiver benefits, in which disability cause is excluded but causes such as specific illness and nursing care are
included. |
32
Sompo Japan DIY Life Insurance Co., Ltd. (Non-consolidated)
Solvency Margin Ratio
|
|
|
|
|
|
|
|
|
| |
|
(Millions of yen) |
|
| |
|
As of December 31, 2010 |
|
|
As of March 31, 2010 |
|
| (A) Total Solvency Margin |
|
|
5,187 |
|
|
|
5,199 |
|
| Capital, etc. |
|
|
4,155 |
|
|
|
4,071 |
|
| Reserve for price fluctuation |
|
|
16 |
|
|
|
15 |
|
| Contingency reserve |
|
|
544 |
|
|
|
551 |
|
| General allowance for possible loan losses |
|
|
— |
|
|
|
— |
|
| Unrealized gains on securities (90% of gain or 100% of loss) |
|
|
471 |
|
|
|
560 |
|
| Net unrealized gains and losses on real estate (85% of gain or 100% of loss) |
|
|
— |
|
|
|
— |
|
| Policy reserves in excess of surrender values |
|
|
— |
|
|
|
— |
|
| Brought in capital, etc. |
|
|
— |
|
|
|
— |
|
| Subordinated debt, etc. |
|
|
— |
|
|
|
— |
|
| Deductions |
|
|
— |
|
|
|
— |
|
| Others |
|
|
— |
|
|
|
— |
|
| (B) Total Risks |
|
|
|
|
|
|
|
|
|
|
|
|
571 |
|
|
|
582 |
|
| Underwriting risk (R1) |
|
|
447 |
|
|
|
454 |
|
| Underwriting risk for third-sector insurance products including accident, sickness and nursing-care insurance (R8) |
|
|
95 |
|
|
|
95 |
|
| Guaranteed interest rate risk (R2) |
|
|
0 |
|
|
|
0 |
|
| Investment risk (R3) |
|
|
103 |
|
|
|
118 |
|
| Business management risk (R4) |
|
|
19 |
|
|
|
20 |
|
| Guaranteed minimum benefit risk (R7) |
|
|
— |
|
|
|
— |
|
| (C) Solvency Margin Ratio |
|
|
|
|
|
|
|
|
|
|
|
|
1,814.6 |
% |
|
|
1,785.9 |
% |
| Note) |
The above figures are calculated based on Articles 86, 87, 161, 162 and 190 of the Ordinance for Enforcement of the Insurance Business Law and the provisions of
Notification No. 50 of the Ministry of Finance (1996). “Policy reserves in excess of surrender values” is calculated based on the provisions of Article 1 Paragraph 3-1 of Notification No. 50 of the Ministry of Finance.
|
33
Supplementary Explanation
< Calculation of ratios >
|
|
|
|
|
| • Underwriting profit |
|
= |
|
Underwriting income – Underwriting expenses – Operating, general and administrative expenses related to underwriting + Other income and expenses* |
|
|
|
|
|
* |
|
Other income and expenses include, but not limited to, income tax expenses for compulsory automobile liability
insurance. |
|
|
|
|
|
|
|
|
| • Net loss ratio |
|
= |
|
(Net claims paid + Loss adjustment expenses) / Net premiums written × 100 |
|
|
|
|
|
|
|
|
| • Net expense ratio |
|
= |
|
(Net commissions and brokerage fees + Operating, general and administrative expenses related to underwriting) / Net premiums written × 100 |
|
|
|
|
|
|
|
|
| • Underwriting result ratio |
|
= |
|
(Net premiums written – Net claims paid – Loss adjustment expenses – Operating expenses) / Net premiums written × 100 |
< Solvency margin ratio >
| |
• |
|
In addition to reserves to cover payments for claims, benefits and maturity refunds, etc., it is necessary for insurance companies to maintain
sufficient solvency in order to cover against risks which may exceed their normal estimates, i.e. the occurrence of major catastrophes, the fluctuation in mortality rate due to significant changes in key environmental factors and a big decline in
value of assets held by insurance companies, etc. |
| |
• |
|
Solvency margin ratio: (C), which is calculated in accordance with the Insurance Business Law, is the ratio of “solvency margin of insurance
companies by means of their capital, reserves, etc.” (total solvency margin: (A)) to “risks which will exceed their normal estimates” (total risks: (B)). |
| |
• |
|
“Risks which will exceed their normal estimates” are composed of risks described below. |
| |
<1> |
Underwriting risk, underwriting risk for third-sector insurance products including accident, sickness and nursing-care insurance: |
| |
|
Risks of occurrence of insurance claims in excess of normal estimates (excluding risks relating to major catastrophes) |
| |
<2> |
Guaranteed interest rate risk: |
| |
|
Risks of invested assets failing to yield assumed interest rates due to the aggravation of investment conditions than expected |
| |
|
Risks of retained securities and other assets fluctuating in prices in excess of normal estimates |
| |
<4> |
Business management risk: |
| |
|
Risks beyond normal estimates arising from business management (That does not fall under other categories.) |
| |
<5> |
Major catastrophe risk: |
| |
|
Risks of the occurrence of major catastrophic losses in excess of normal estimates (risks such as the Great Kanto Earthquake or Isewan typhoon)
|
| |
<6> |
Guaranteed minimum benefit risk: |
| |
|
Risks of special account assets fluctuating in prices in excess of normal estimates |
| |
• |
|
“Solvency margin of insurance companies by means of their capital, reserves, etc.” (total solvency margin) is the sum of total net assets
(excluding planned outflows), certain reserves (reserve for price fluctuation, contingency reserve and catastrophic loss reserve, etc.) and parts of net unrealized gains and losses on real estate, etc. |
| |
• |
|
Solvency margin ratio is one of the indicators for the regulatory authorities to monitor financial soundness of insurance companies. Solvency margin
ratio exceeding 200% would indicate adequate capability to meet payments of possible insurance claims. |
34
Note Regarding Forward-looking Statements
This document includes “forward-looking statements” that reflect the information in relation to the NKSJ Holdings, Inc.
(“NKSJ”). To the extent that statements in this document do not relate to historical or current facts, they constitute forward-looking statements. These forward-looking statements are based on the current assumptions and beliefs of NKSJ in
light of the information currently available to NKSJ, and involve known and unknown risks, uncertainties and other factors. Such risks, uncertainties and other factors may cause the actual results, performance, achievements or financial position of
NKSJ, as the case may be, to be materially different from any future results, performance, achievements or financial position expressed or implied by these forward-looking statements. NKSJ does not undertake or will not undertake any obligation to
publicly update any forward-looking statements after the date of this document. Investors are advised to consult any further disclosures by NKSJ in their subsequent domestic filings in Japan and filings with, or submissions to, the U.S. Securities
Exchange Commission pursuant to the U.S. Securities Exchange Act of 1934.
The risks, uncertainties and other factors referred
to above include, but are not limited to, those below. The risks, uncertainties and other factors are also referred to in our domestic Quarterly Securities Reports.
| (1) |
Effects of deterioration of economic and business conditions in Japan |
| (2) |
Risk of intensification of competition in the property and casualty insurance business |
| (3) |
Changes to laws, regulations, and systems |
| (4) |
Natural catastrophe risks related to insurance products |
| (5) |
Occurrence of losses exceeding projection |
| (7) |
Effects of declining stock price |
| (8) |
Effects of fluctuation in interest rate |
| (10) |
Effects of fluctuation in foreign exchange rate |
| (12) |
Life insurance business risks |
| (13) |
Overseas business risk |
| (14) |
Non-insurance business risk |
| (15) |
Credit rating downgrade |
| (16) |
Business interruption risk in case of natural disasters, etc. |
| (17) |
Information security risk |
| (19) |
System integration risk |
| (20) |
Risk of failure to adequately realize business integration synergies |
| (21) |
Risks related to merger of life insurance subsidiaries |
35
[English Summary]
Quarterly Securities Report for the Three Months Ended December 31, 2010
Part 1: Corporate Information
Section 1: Information on the Company
1. Trends in major business indexes
2.
Business overview
3. Subsidiaries and affiliates
4. Employees
Section 2: Business Conditions
1. Insurance operation
2.
Business risks
3. Significant contracts on management
4. Financial positions, results of operations, and cash flows
Section 3: Information on the Facilities
Section 4: Information of the Reporting Company
1. Information on shares
(1) Total Number of Shares
(2) Stock Acquisition Rights
(3) Status of warrant bonds’ outstanding warrants with adjusted exercise prices
(4) Status of Rights Plan
(5) Changes in the Total Number of Shares Issued and the Amount of Common Stock
(6) Status of Major Shareholders
(7) Status of Voting Rights
2. Changes in stock prices
3. Directors
Section 5: Financial Condition
1. Quarterly Consolidated Financial Statements
2. Other
Part 2: Information on party(ies)
providing guaranty to the Reporting Company
1
Part 1: Corporate Information
Section 1: Information on the Company
| 1. |
Trends in major business indexes |
(Omitted.)
(Omitted.)
| 3. |
Subsidiaries and affiliates |
(Omitted.)
(Omitted.)
2
Section 2: Business Conditions
(Omitted.)
With respect to
the information given in this quarterly report about the Company’s business conditions and financial condition in the fiscal third quarter, no matters with the potential to materially influence investors’ decisions have arisen. Further, no
material changes have occurred from the information given under “Business risks” in the Company’s quarterly report for the fiscal first quarter.
The Company has no material events to report. Material events are those that raise material doubt about the assumption that the Company will continue as a going concern or materially affect the operation
of the Company.
| 3. |
Significant contracts on management |
(Omitted.)
| 4. |
Financial positions, results of operations, and cash flows |
(Omitted.)
Section 3: Information on the Facilities
(Omitted.)
3
Section 4: Information of the Reporting Company
| |
(1) |
Total Number of Shares |
(Omitted.)
| |
(2) |
Stock Acquisition Rights |
(Omitted.)
| |
(3) |
Status of warrant bonds’ outstanding warrants with adjusted exercise prices |
(Omitted.)
| |
(4) |
Status of Rights Plan |
(Omitted.)
| |
(5) |
Changes in the Total Number of Shares Issued and the Amount of Common Stock |
(Omitted.)
| |
(6) |
Status of Major Shareholders |
The following Major Shareholders transferred as of the end of the fiscal third quarter.
Persons who became top 10 shareholders
|
|
|
|
|
|
|
|
|
|
|
| |
|
(As of December 31, 2010) |
|
| Shareholders’ name |
|
Location |
|
Number of
shares
held
(thousands) |
|
|
Percentage of
ownership
based on
issued shares
(%) |
|
| JP Morgan Chase Bank 380055
(standing proxy: Mizuho Corporate Bank, Ltd.) |
|
270 PARK AVENUE. NEW YORK.
NY 10017. UNITED STATES OF AMERICA
(16-13 Tsukishima 4-chome, Chuo-ku, Tokyo) |
|
|
21,366 |
|
|
|
1.29 |
|
4
‚ Persons who ceased to be
top 10 shareholders
|
|
|
|
|
|
|
|
|
|
|
| |
|
(As of December 31, 2010) |
|
| Shareholders’ name |
|
Location |
|
Number of
shares
held
(thousands) |
|
|
Percentage of
ownership
based on
issued shares
(%) |
|
| Meiji Yasuda Life Insurance Company |
|
1-1 Marunouchi 2-chome, Chiyoda-ku, Tokyo |
|
|
19,824 |
|
|
|
1.19 |
|
Notes:
| |
• |
|
The Company received notification that Southeastern Asset Management Inc. owned shares as specified below as of November 30, 2010, per a
large shareholding report filed on December 7, 2010, but the Company was unable to confirm the number of shares effectively owned by Southeastern Asset Management as of December 31, 2010. Therefore, the transfer stated above is based on
the information recorded in its shareholder registry. |
|
|
|
|
|
|
|
|
|
|
|
| Shareholders’ name |
|
Location |
|
Number of
shares held
(thousands) |
|
|
Percentage of
ownership
based on
issued shares
(%) |
|
| Southeastern Asset Management Inc. |
|
6410 Poplar Avenue Suite 900, Memphis, TN 38119 U.S.A. |
|
|
191,008 |
|
|
|
11.50 |
|
| |
(7) |
Status of Voting Rights |
(Omitted.)
| 2. |
Changes in stock prices |
(Omitted.)
(Omitted.)
5
Section 5: Financial Condition
| 1 |
Basis of Preparation of the Quarterly Consolidated Financial Statements |
| |
(1) |
NKSJ Holdings, Inc. prepares its quarterly consolidated financial statements in accordance with the “Regulations concerning the Terminology, Forms and Preparation
Methods of the Quarterly Consolidated Financial Statements” (Cabinet Ordinance No. 64, 2007) and the “Ordinance for Enforcement of the Insurance Business Law” (Ministry of Finance Ordinance No. 5, 1996) pursuant to the
provision of Articles 61 and 82 of the “Regulations concerning the Terminology, Forms and Preparation Methods of the Quarterly Consolidated Financial Statements”. |
| |
(2) |
NKSJ Holdings, Inc. was established as of April 1, 2010, so the three months ended December 31, 2009 (October 1 to December 31, 2009), the nine months
ended December 31, 2009 (April 1 to December 31, 2009) and the fiscal year ended March 31, 2010 (April 1, 2009 to March 31, 2010) are not disclosed. |
Among the items which shall be disclosed when significant changes are recognized, compared with March 31, 2010 under Regulations
concerning the Terminology, Forms and Preparation Methods of the Quarterly Consolidated Financial Statements, those items except for minor items are disclosed, as there is no amount of the corresponding period.
| 2 |
Results of Operations for the Quarterly Consolidated Accounting Period |
Results of operations for the third quarter consolidated accounting period are shown in “2. Other”, since NKSJ Holdings, Inc. conducts business defined in the provision of Article17-15 Paragraph
2 of the Cabinet Office Ordinance on Disclosure of Corporate Information, etc.
In
accordance with the provision of Article 193-2 Paragraph 1 of the Financial Instruments and Exchange Act, the quarterly consolidated financial statements for the three months ended December 31, 2010 (October 1 to December 31,
2010) and the nine months ended December 31, 2010 (April 1 to December 31, 2010) have been reviewed by Ernst & Young ShinNihon LLC.
6
| 1. |
Quarterly Consolidated Financial Statements |
| (1) |
Quarterly Consolidated Balance Sheets |
|
|
|
|
|
|
|
|
|
| |
|
|
|
|
(Millions of yen) |
|
| |
|
|
|
|
As of December 31, 2010 |
|
| Assets: |
|
|
|
|
|
|
|
|
| Cash and deposits |
|
|
|
|
|
|
234,188 |
|
| Call loans |
|
|
|
|
|
|
64,225 |
|
| Receivables under resale agreements |
|
|
|
|
|
|
64,984 |
|
| Receivables under securities borrowing transactions |
|
|
|
|
|
|
25,502 |
|
| Monetary receivables bought |
|
|
|
|
|
|
34,720 |
|
| Money trusts |
|
|
|
|
|
|
81,392 |
|
| Securities |
|
|
|
|
|
|
6,580,373 |
|
| Loans |
|
|
|
|
|
|
706,428 |
|
| Tangible fixed assets |
|
|
|
*1 |
|
|
361,289 |
|
| Intangible fixed assets |
|
|
|
|
|
|
52,711 |
|
| Other assets |
|
|
|
|
|
|
591,847 |
|
| Deferred tax assets |
|
|
|
|
|
|
231,373 |
|
| Allowance for possible loan losses |
|
|
|
|
|
|
(6,185 |
) |
|
|
|
|
|
|
|
|
|
| Total assets |
|
|
|
|
|
|
9,022,852 |
|
|
|
|
|
|
|
|
|
|
| Liabilities: |
|
|
|
|
|
|
|
|
| Underwriting funds: |
|
|
|
|
|
|
7,316,385 |
|
| Reserve for outstanding losses and claims |
|
|
|
|
|
|
974,282 |
|
| Underwriting reserves |
|
|
|
|
|
|
6,342,103 |
|
| Bonds |
|
|
|
|
|
|
128,000 |
|
| Other liabilities |
|
|
|
|
|
|
269,447 |
|
| Reserve for retirement benefits |
|
|
|
|
|
|
108,981 |
|
| Reserve for retirement benefits to directors |
|
|
|
|
|
|
129 |
|
| Reserve for bonus payments |
|
|
|
|
|
|
7,446 |
|
| Reserves under the special laws: |
|
|
|
|
|
|
23,325 |
|
| Reserve for price fluctuation |
|
|
|
|
|
|
23,325 |
|
| Deferred tax liabilities |
|
|
|
|
|
|
978 |
|
|
|
|
|
|
|
|
|
|
| Total liabilities |
|
|
|
|
|
|
7,854,696 |
|
|
|
|
|
|
|
|
|
|
| Net assets: |
|
|
|
|
|
|
|
|
| Shareholders’ equity: |
|
|
|
|
|
|
|
|
| Common stock |
|
|
|
|
|
|
100,045 |
|
| Capital surplus |
|
|
|
|
|
|
438,555 |
|
| Retained earnings |
|
|
|
|
|
|
336,104 |
|
| Treasury stock |
|
|
|
|
|
|
(567 |
) |
|
|
|
|
|
|
|
|
|
| Total shareholders’ equity |
|
|
|
|
|
|
874,137 |
|
|
|
|
|
|
|
|
|
|
| Valuation and translation adjustments: |
|
|
|
|
|
|
|
|
| Unrealized gains on securities available for sale, net of tax |
|
|
|
|
|
|
315,576 |
|
| Deferred gains on hedges |
|
|
|
|
|
|
4,274 |
|
| Foreign currency translation adjustments |
|
|
|
|
|
|
(31,150 |
) |
|
|
|
|
|
|
|
|
|
| Total valuation and translation adjustments |
|
|
|
|
|
|
288,699 |
|
|
|
|
|
|
|
|
|
|
| Stock acquisition rights |
|
|
|
|
|
|
2,362 |
|
| Non-controlling interests |
|
|
|
|
|
|
2,955 |
|
|
|
|
|
|
|
|
|
|
| Total net assets |
|
|
|
|
|
|
1,168,156 |
|
|
|
|
|
|
|
|
|
|
| Total liabilities and net assets |
|
|
|
|
|
|
9,022,852 |
|
|
|
|
|
|
|
|
|
|
7
| (2) |
Quarterly Consolidated Statements of Income |
|
|
|
|
|
|
|
|
|
| |
|
|
|
|
(Millions of yen) |
|
| |
|
|
|
|
Nine months ended
December 31, 2010
(April 1 to
December 31, 2010) |
|
| Ordinary income: |
|
|
|
|
|
|
2,002,076 |
|
| Underwriting income: |
|
|
|
|
|
|
1,903,022 |
|
| Net premiums written |
|
|
|
|
|
|
1,465,475 |
|
| Deposits of premiums by policyholders |
|
|
|
|
|
|
118,276 |
|
| Interest and dividend income on deposits of premiums, etc. |
|
|
|
|
|
|
44,860 |
|
| Life insurance premiums written |
|
|
|
|
|
|
171,436 |
|
| Reversal of reserve for outstanding losses and claims |
|
|
|
|
|
|
59,675 |
|
| Reversal of underwriting reserves |
|
|
|
|
|
|
39,068 |
|
| Investment income: |
|
|
|
|
|
|
91,957 |
|
| Interest and dividend income |
|
|
|
|
|
|
116,534 |
|
| Investment gains on money trusts |
|
|
|
|
|
|
847 |
|
| Gains on sales of securities |
|
|
|
|
|
|
9,396 |
|
| Transfer of interest and dividend income on deposits of premiums, etc. |
|
|
|
|
|
|
(44,860 |
) |
| Other ordinary income |
|
|
|
|
|
|
7,097 |
|
| Ordinary expenses: |
|
|
|
|
|
|
1,956,103 |
|
| Underwriting expenses: |
|
|
|
|
|
|
1,602,747 |
|
| Net claims paid |
|
|
|
|
|
|
925,954 |
|
| Loss adjustment expenses |
|
|
*1 |
|
|
|
97,439 |
|
| Net commissions and brokerage fees |
|
|
*1 |
|
|
|
265,020 |
|
| Maturity refunds to policyholders |
|
|
|
|
|
|
264,815 |
|
| Life insurance claims paid |
|
|
|
|
|
|
43,872 |
|
| Investment expenses: |
|
|
|
|
|
|
30,422 |
|
| Investment losses on money trusts |
|
|
|
|
|
|
914 |
|
| Investment losses on trading securities |
|
|
|
|
|
|
17 |
|
| Losses on sales of securities |
|
|
|
|
|
|
3,607 |
|
| Impairment losses on securities |
|
|
|
|
|
|
9,854 |
|
| Operating, general and administrative expenses |
|
|
*1 |
|
|
|
314,200 |
|
| Other ordinary expenses: |
|
|
|
|
|
|
8,734 |
|
| Interest paid |
|
|
|
|
|
|
5,403 |
|
|
|
|
|
|
|
|
|
|
| Ordinary profit |
|
|
|
|
|
|
45,973 |
|
|
|
|
|
|
|
|
|
|
| Extraordinary gains: |
|
|
|
|
|
|
2,251 |
|
| Gains on disposal of fixed assets |
|
|
|
|
|
|
316 |
|
| Gains on negative goodwill |
|
|
|
|
|
|
149 |
|
| Other extraordinary gains |
|
|
*2 |
|
|
|
1,785 |
|
| Extraordinary losses: |
|
|
|
|
|
|
7,210 |
|
| Losses on disposal of fixed assets |
|
|
|
|
|
|
493 |
|
| Impairment losses |
|
|
|
|
|
|
662 |
|
| Provision for reserves under the special laws: |
|
|
|
|
|
|
4,832 |
|
| Provision for reserve for price fluctuation |
|
|
|
|
|
|
4,832 |
|
| Other extraordinary losses |
|
|
*3 |
|
|
|
1,222 |
|
|
|
|
|
|
|
|
|
|
| Income before income taxes and non-controlling interests |
|
|
|
|
|
|
41,014 |
|
|
|
|
|
|
|
|
|
|
| Income taxes and deferred income taxes |
|
|
|
|
|
|
16,418 |
|
|
|
|
|
|
|
|
|
|
| Income before non-controlling interests |
|
|
|
|
|
|
24,596 |
|
|
|
|
|
|
|
|
|
|
| Non-controlling interests |
|
|
|
|
|
|
(250 |
) |
|
|
|
|
|
|
|
|
|
| Net income |
|
|
|
|
|
|
24,846 |
|
|
|
|
|
|
|
|
|
|
8
| (3) |
Quarterly Consolidated Statements of Cash Flows |
|
|
|
|
|
| |
|
(Millions of yen) |
|
| |
|
Nine months
ended
December 31, 2010
(April 1 to
December 31, 2010) |
|
| Cash flows from operating activities: |
|
|
|
|
| Income before income taxes and non-controlling interests |
|
|
41,014 |
|
| Depreciation |
|
|
14,722 |
|
| Impairment losses |
|
|
662 |
|
| Amortization of goodwill |
|
|
1,466 |
|
| Gains on negative goodwill |
|
|
(149 |
) |
| Increase (decrease) in reserve for outstanding losses and claims |
|
|
(60,131 |
) |
| Increase (decrease) in underwriting reserves |
|
|
(41,240 |
) |
| Increase (decrease) in allowance for possible loan losses |
|
|
(1,399 |
) |
| Increase (decrease) in reserve for retirement benefits |
|
|
5,402 |
|
| Increase (decrease) in reserve for retirement benefits to directors |
|
|
37 |
|
| Increase (decrease) in reserve for bonus payments |
|
|
(15,060 |
) |
| Increase (decrease) in reserve for bonus payments to directors |
|
|
(57 |
) |
| Increase (decrease) in reserve for price fluctuation |
|
|
4,832 |
|
| Interest and dividend income |
|
|
(116,534 |
) |
| Losses (gains) on investment in securities |
|
|
7,214 |
|
| Interest expenses |
|
|
5,403 |
|
| Foreign exchange losses (gains) |
|
|
6,363 |
|
| Losses (gains) related to tangible fixed assets |
|
|
177 |
|
| Investment losses (gains) on the equity method |
|
|
(13 |
) |
| Decrease (increase) in other assets |
|
|
73,652 |
|
| Increase (decrease) in other liabilities |
|
|
(40,953 |
) |
| Others |
|
|
11,053 |
|
|
|
|
|
|
| Subtotal |
|
|
(103,536 |
) |
|
|
|
|
|
| Interest and dividend received |
|
|
121,566 |
|
| Interest paid |
|
|
(7,123 |
) |
| Income taxes paid |
|
|
(14,388 |
) |
|
|
|
|
|
| Cash flows from operating activities |
|
|
(3,482 |
) |
|
|
|
|
|
9
|
|
|
|
|
|
|
|
|
| |
|
|
|
|
(Millions of yen) |
|
| |
|
|
|
|
Nine months ended
December 31, 2010
(April 1
to
December 31, 2010) |
|
| Cash flows from investing activities: |
|
|
|
|
|
|
|
|
| Net decrease (increase) in deposits |
|
|
|
|
|
|
23,741 |
|
| Purchase of monetary receivables bought |
|
|
|
|
|
|
(1,187 |
) |
| Proceeds from sales and redemption of monetary receivables bought |
|
|
|
|
|
|
8,242 |
|
| Increase in money trusts |
|
|
|
|
|
|
(21 |
) |
| Decrease in money trusts |
|
|
|
|
|
|
3,347 |
|
| Purchase of securities |
|
|
|
|
|
|
(675,269 |
) |
| Proceeds from sales and redemption of securities |
|
|
|
|
|
|
578,722 |
|
| Loans made |
|
|
|
|
|
|
(141,696 |
) |
| Collection of loans |
|
|
|
|
|
|
164,727 |
|
| Net increase in receivables and payables under securities borrowing transactions |
|
|
|
|
|
|
5,279 |
|
| Others |
|
|
|
|
|
|
14,174 |
|
|
|
|
|
|
|
|
|
|
| Subtotal |
|
|
|
|
|
|
(19,938 |
) |
|
|
|
|
|
|
|
|
|
| Total of operating activities and investment transactions as above |
|
|
|
|
|
|
(23,421 |
) |
|
|
|
|
|
|
|
|
|
| Acquisition of tangible fixed assets |
|
|
|
|
|
|
(6,429 |
) |
| Proceeds from sales of tangible fixed assets |
|
|
|
|
|
|
895 |
|
| Acquisition of stocks of subsidiaries resulting in changes in the scope of consolidation |
|
|
|
|
|
|
(28,409 |
) |
| Others |
|
|
|
|
|
|
(2,629 |
) |
|
|
|
|
|
|
|
|
|
| Cash flows from investing activities |
|
|
|
|
|
|
(56,512 |
) |
|
|
|
|
|
|
|
|
|
| Cash flows from financing activities: |
|
|
|
|
|
|
|
|
| Proceeds from issuance of stocks |
|
|
|
|
|
|
0 |
|
| Proceeds from sales of treasury stock |
|
|
|
|
|
|
18 |
|
| Acquisition of treasury stock |
|
|
|
|
|
|
(749 |
) |
| Dividends paid |
|
|
|
|
|
|
(25,671 |
) |
| Dividends paid to non-controlling shareholders |
|
|
|
|
|
|
(5 |
) |
| Others |
|
|
|
|
|
|
1,101 |
|
|
|
|
|
|
|
|
|
|
| Cash flows from financing activities |
|
|
|
|
|
|
(25,306 |
) |
|
|
|
|
|
|
|
|
|
| Effect of exchange rate changes on cash and cash equivalents |
|
|
|
|
|
|
(1,858 |
) |
|
|
|
|
|
|
|
|
|
| Net increase (decrease) in cash and cash equivalents |
|
|
|
|
|
|
(87,160 |
) |
|
|
|
|
|
|
|
|
|
| Cash and cash equivalents at the beginning of the period |
|
|
|
|
|
|
262,844 |
|
| Net increase in cash and cash equivalents due to share exchange |
|
|
|
|
|
|
141,141 |
|
| Net increase in cash and cash equivalents due to merger |
|
|
|
|
|
|
3,022 |
|
|
|
|
|
|
|
|
|
|
| Cash and cash equivalents at the end of the period |
|
|
*1 |
|
|
|
319,848 |
|
|
|
|
|
|
|
|
|
|
10
[Changes in significant accounting policies for the preparation of the quarterly consolidated financial
statements]
|
|
|
| |
|
Nine months ended December 31, 2010
(April 1 to December 31, 2010) |
| Changes in the scope of consolidation |
|
There is no mention as NKSJ Holdings, Inc. was established as of April 1, 2010. Fiba Sigorta Anonim Sirketi is
included in the consolidation from the third quarter of this fiscal year as it became a subsidiary through the acquisition of shares as of November 2, 2010.
As a result, the number of consolidated subsidiaries for the nine months ended December 31, 2010 is 24
companies. |
[Adoption of accounting methods used specifically for the preparation of the quarterly consolidated financial
statements]
|
|
|
| |
|
Nine months ended December 31, 2010
(April 1 to December 31, 2010) |
|
|
| Calculation of income taxes |
|
Income taxes are calculated by applying a reasonably estimated effective tax rate to income before income taxes. The estimated effective tax rate
is determined by estimating the effective tax rate after applying deferred tax accounting for the fiscal year, including the third quarter of this fiscal year. When it is remarkably unreasonable to adopt this accounting method, income taxes are
calculated by the statutory effective tax rate. |
11
[Notes to the quarterly consolidated financial statements]
(Notes to the quarterly consolidated balance sheets)
|
|
|
|
|
| As of December 31,
2010 |
| *1 |
|
Accumulated depreciation of tangible fixed assets amounts to 395,361 million yen. |
(Notes to the quarterly consolidated statements of income)
|
|
|
|
|
|
|
| Nine months ended December 31,
2010 (April 1 to December 31, 2010) |
|
| *1 |
|
Major components of operating expenses |
|
|
|
Agency commissions, etc. |
|
|
266,301 million yen |
|
|
|
Salaries |
|
|
177,637 million yen |
|
|
|
Operating expenses represent the sum of loss adjustment expenses, operating, general and administrative expenses and net commissions and brokerage fees included in the
quarterly consolidated statement of income. |
|
|
|
| *2 |
|
Other extraordinary gains are 1,785 million yen of gains on extinguishment of tie-in shares. |
|
|
|
| *3 |
|
The major component of other extraordinary losses is 904 million yen of the impact related to the adoption of accounting standards for asset retirement
obligations. |
|
(Notes to the quarterly consolidated
statements of cash flows)
|
|
|
|
|
|
|
| Nine months ended December 31,
2010 (April 1 to December 31, 2010) |
|
| *1 |
|
Reconciliation of cash and cash equivalents to the line items disclosed in the quarterly consolidated balance sheet as of December 31, 2010 |
|
|
|
|
|
|
Cash and deposits |
|
|
234,188 million yen |
|
|
|
Call loans |
|
|
64,225 million yen |
|
|
|
Receivables under resale agreements |
|
|
64,984 million yen |
|
|
|
Securities |
|
|
6,580,373 million yen |
|
|
|
Time deposit with an original maturity of more than 3 months |
|
|
(48,601) million yen |
|
|
|
Securities other than cash equivalents |
|
|
(6,575,321) million yen |
|
|
|
|
|
|
|
|
|
|
Cash and cash equivalents |
|
|
319,848 million yen |
|
|
|
| 2 |
|
Cash flows from investing activities include cash flows from investment activities conducted as a part of insurance business. |
|
12
(Shareholders’ Equity)
As of December 31, 2010 and the nine months ended December 31, 2010 (April 1 to December 31, 2010)
| 1 |
Type and number of shares outstanding: |
Common stock: 1,661,409 thousand shares
| 2 |
Type and number of treasury stock: |
Common stock: 975 thousand shares
| 3 |
Stock acquisition rights as of December 31, 2010: |
Stock acquisition rights for stock option: 2,362 million yen (NKSJ Holdings, Inc. 2,362 million yen)
NKSJ Holdings,
Inc. is a joint holding company established through share exchange on April 1, 2010, so the amounts of dividends paid are the amounts approved at each general meeting of stockholders of wholly-owned subsidiaries mentioned below.
Sompo Japan Insurance Inc.
|
|
|
|
|
|
|
|
|
|
|
|
|
|
|
|
|
| Resolution |
|
Type of
share |
|
Total amount
of dividend |
|
|
Dividend
per share |
|
|
Date of record |
|
Effective date |
|
Source of
dividend |
|
|
|
|
|
|
|
| General meeting of stockholders held on June 28, 2010 |
|
Common
stock |
|
|
19,681
million yen |
|
|
|
20 yen |
|
|
March 31, 2010 |
|
June 29, 2010 |
|
Retained earnings |
NIPPONKOA Insurance Co.,
Ltd.
|
|
|
|
|
|
|
|
|
|
|
|
|
|
|
|
|
| Resolution |
|
Type of
share |
|
Total amount
of dividend |
|
|
Dividend
per share |
|
|
Date of record |
|
Effective date |
|
Source of
dividend |
|
|
|
|
|
|
|
| General meeting of stockholders held on June 28, 2010 |
|
Common
stock |
|
|
6,019
million yen |
|
|
|
8 yen |
|
|
March 31, 2010 |
|
June 29, 2010 |
|
Retained earnings |
| (2) |
Of dividends with record date within the nine months ended December 31, 2010, dividends with the effective date after December 31, 2010
|
None.
13
(Segment information)
[Segment information]
| 1 |
Summary of reportable segments |
The reportable segment of NKSJ Holdings, Inc. (NKSJ) is the component of our company, for which discrete financial information is
available, and whose operating results are regularly reviewed by the board of directors to make decisions about resources to be allocated to the segment and assess its performance.
The respective group companies of NKSJ determine their comprehensive strategies for their operations as independent management unit and
roll out their operations under the group-wide management policy of NKSJ.
Therefore, NKSJ is composed of the business segments
which include the respective group companies as a minimum component, and “Property and casualty insurance business” and “Life insurance business” are determined as the reportable segments. NKSJ and other operations which are not
covered by the reportable segments, are included in “Others”. The major companies which constitute each reportable segment and “Others” are listed below.
“Property and casualty insurance business” conducts underwriting of property and casualty insurance and related investment activities. “Life insurance business” conducts underwriting
of life insurance and related investment activities.
|
|
|
| |
|
Major companies |
|
|
| Reportable segments |
|
|
|
|
| Property and casualty insurance business |
|
Sompo Japan Insurance Inc.
NIPPONKOA Insurance Co., Ltd. Sonpo 24 Insurance Co., Ltd.
Saison Automobile and Fire Insurance Company, Limited
Sompo Japan Insurance Company of America
Sompo Japan Insurance Company of Europe Limited
Yasuda Seguros S.A. |
|
|
| Life insurance business |
|
Sompo Japan Himawari Life Insurance Co., Ltd.
NIPPONKOA Life Insurance Co., Ltd.
Sompo Japan DIY Life Insurance Co., Ltd. |
|
|
| Others |
|
NKSJ Holdings, Inc.
Sompo Japan DC Securities Co., Ltd.
Healthcare Frontier Japan Inc.
Sompo Japan Nipponkoa Asset Management Co., Ltd.
Yasuda Enterprise Development Co., Ltd. |
14
| 2 |
Information related to the amount of sales and net income or loss by each reportable segment |
Nine months ended December 31, 2010 (April 1 to December 31, 2010)
|
|
|
|
|
|
|
|
|
|
|
|
|
|
|
|
|
|
|
|
|
|
|
|
|
|
|
|
|
| |
|
(Millions of yen) |
|
| |
|
Reportable segments |
|
|
Others
(Note
2) |
|
|
Total |
|
|
Adjustment
(Note
3) |
|
|
Carrying
amount
on
the quarterly
consolidated
statements of
income
(Note 4) |
|
| |
|
Property
and
casualty
insurance
business |
|
|
Life
insurance
business |
|
|
Total |
|
|
|
|
|
| Sales (Note 1) |
|
|
|
|
|
|
|
|
|
|
|
|
|
|
|
|
|
|
|
|
|
|
|
|
|
|
|
|
| Sales from transactions with external customers |
|
|
1,465,475 |
|
|
|
171,436 |
|
|
|
1,636,912 |
|
|
|
3,677 |
|
|
|
1,640,589 |
|
|
|
361,487 |
|
|
|
2,002,076 |
|
| Sales arising from internal segment |
|
|
— |
|
|
|
— |
|
|
|
— |
|
|
|
2,289 |
|
|
|
2,289 |
|
|
|
(2,289 |
) |
|
|
— |
|
|
|
|
|
|
|
|
|
|
|
|
|
|
|
|
|
|
|
|
|
|
|
|
|
|
|
|
|
|
| Total |
|
|
1,465,475 |
|
|
|
171,436 |
|
|
|
1,636,912 |
|
|
|
5,966 |
|
|
|
1,642,879 |
|
|
|
359,197 |
|
|
|
2,002,076 |
|
|
|
|
|
|
|
|
|
|
|
|
|
|
|
|
|
|
|
|
|
|
|
|
|
|
|
|
|
|
| Net income (loss) attributable to segment |
|
|
29,261 |
|
|
|
(3,330 |
) |
|
|
25,931 |
|
|
|
(1,084 |
) |
|
|
24,846 |
|
|
|
— |
|
|
|
24,846 |
|
|
|
|
|
|
| Notes) |
|
|
|
|
|
|
|
| 1 The definitions of sales are as follows. |
|
|
|
|
| Property and casualty insurance business:
Life insurance business: |
|
Net premiums written Life insurance premiums written |
| “Others” and carrying amount on the quarterly consolidated statements of income: |
|
Ordinary income |
| 2 “Others” is business segments which are not included in reportable segments.
It includes other operations. |
|
|
|
|
| 3 Adjustments of sales are as follows. |
|
|
|
|
| Elimination of transactions arising from internal segment: |
|
|
|
(2,289) million yen |
| Ordinary income related to property and casualty insurance business and life insurance business excluding net premiums written
and life insurance premiums written: |
|
|
|
361,487 million yen |
| 4 Net income or loss attributable to segment is adjusted to net income in the quarterly
consolidated statements of income. |
|
|
|
|
| 3 |
Information related to goodwill by each reportable segment |
(Significant changes in the amount of goodwill)
In “Property and casualty
insurance business”, as mentioned in “Business combinations”, Sompo Japan Insurance Inc. and other 5 consolidated subsidiaries of NKSJ acquired shares of Fiba Sigorta Anonim Sirketi as of November 2, 2010. The increase in the
amount of goodwill related to the acquisition is 21,233 million yen for the three months ended December 31, 2010.
15
(Financial instruments)
As of December 31, 2010
The financial instruments which NKSJ Holdings, Inc. considers
extremely difficult to figure out the fair value are not included in the following table.
|
|
|
|
|
|
|
|
|
|
|
|
|
| |
|
(Millions of yen) |
|
| |
|
Carrying amount
on balance
sheet |
|
|
Fair value |
|
|
Unrealized
gains
(losses) |
|
| Cash and deposits |
|
|
234,188 |
|
|
|
234,188 |
|
|
|
— |
|
| Call loans |
|
|
64,225 |
|
|
|
64,225 |
|
|
|
— |
|
| Receivables under resale agreements |
|
|
64,984 |
|
|
|
64,984 |
|
|
|
— |
|
| Receivables under securities borrowing transactions |
|
|
25,502 |
|
|
|
25,502 |
|
|
|
— |
|
| Monetary receivables bought |
|
|
34,720 |
|
|
|
34,720 |
|
|
|
— |
|
| Money trusts |
|
|
80,958 |
|
|
|
80,958 |
|
|
|
— |
|
| Securities |
|
|
6,390,088 |
|
|
|
6,446,340 |
|
|
|
56,251 |
|
| Loans |
|
|
706,428 |
|
|
|
|
|
|
|
|
|
| Allowance for possible loan losses (*1) |
|
|
(1,561 |
) |
|
|
|
|
|
|
|
|
|
|
|
|
|
|
|
|
|
|
|
|
|
|
|
|
704,866 |
|
|
|
712,881 |
|
|
|
8,014 |
|
|
|
|
|
|
|
|
|
|
|
|
|
|
| Total assets |
|
|
7,599,534 |
|
|
|
7,663,800 |
|
|
|
64,266 |
|
|
|
|
|
|
|
|
|
|
|
|
|
|
| Bonds |
|
|
128,000 |
|
|
|
131,008 |
|
|
|
3,008 |
|
|
|
|
|
|
|
|
|
|
|
|
|
|
| Total liabilities |
|
|
128,000 |
|
|
|
131,008 |
|
|
|
3,008 |
|
|
|
|
|
|
|
|
|
|
|
|
|
|
| Derivative transactions (*2) |
|
|
|
|
|
|
|
|
|
|
|
|
| Not qualifying for hedge accounting |
|
|
1,899 |
|
|
|
1,899 |
|
|
|
— |
|
| Qualifying for hedge accounting |
|
|
14,536 |
|
|
|
14,535 |
|
|
|
(0 |
) |
|
|
|
|
|
|
|
|
|
|
|
|
|
| Total derivative transactions |
|
|
16,436 |
|
|
|
16,435 |
|
|
|
(0 |
) |
|
|
|
|
|
|
|
|
|
|
|
|
|
| (*1) |
General allowance for possible loan losses and individual allowance for possible loan losses responding to loans are excluded. |
| (*2) |
This table shows derivative transactions which are allocated on other assets and other liabilities collectively. |
Assets and liabilities arising out from derivative transactions are shown on the net basis. The items which are net debt in total are
shown by an asterisk (*).
Notes)
| 1 |
Calculation methods for the fair value of cash and deposits |
Since all deposits are short term, the fair value approximates the book value, so the book value is presented as the fair value.
| 2 |
Calculation methods for the fair value of call loans |
Since all call loans are short term, the fair value approximates the book value, so the book value is presented as the fair value.
| 3 |
Calculation methods for the fair value of receivables under resale agreements |
Since all are short term, the fair value approximates the book value, so the book value is presented as the fair value.
| 4 |
Calculation methods for the fair value of receivables under securities borrowing transactions |
Since all are short term, the fair value approximates the book value, so the book value is presented as the fair value.
| 5 |
Calculation methods for the fair value of monetary receivables bought |
The fair value is based on the price quoted by counterparties.
16
| 6 |
Calculation methods for the fair value of money trusts |
The fair value of the domestic bonds which are managed as trust asset is based on exchange price, the price released by Japan Securities Dealers Association, the price quoted by
counterparties and the over-the-counter average price released by the supplier. The fair value of the domestic stocks which are managed as trust asset is based on exchange price. And the fair value of foreign securities is based on exchange price,
the price released by the industry association and the price quoted by counterparties. As for derivative transactions, the fair value of quoted derivatives is based on exchange price and the fair value of forward foreign exchanges is based on
forward exchange rate.
| 7 |
Calculation methods for the fair value of securities |
The fair value of the domestic bonds is based on exchange price, the price released by Japan Securities Dealers Association and the price quoted by counterparties. The fair value of the
domestic stocks is based on exchange price. And the fair value of foreign securities is based on exchange price and the price quoted by counterparties.
| 8 |
Calculation methods for the fair value of loans |
The fair value is the amount of future collection cash flow of each loan which is discounted by the risk free rate for the corresponding the period, adding credit risk premium and liquidity premium
thereto, or the total amount of principal and interest which is discounted by the expected interest rate of new loans by the types and categories of internal ratings. For the loans categorized as non-performing, probably irrecoverable, irrecoverable
or some intensive control debtors, the fair value is the amount of present value of estimated future cash flow, or since the potential loan losses are estimated based on the amount expected to be covered by collateral and guarantee, the fair value
approximates the amount which the current estimated loan losses are deducted from the carrying amount on the quarterly consolidated balance sheet, so such amount is presented as the fair value.
| 9 |
Calculation methods for the fair value of bonds |
The fair value is calculated as the amount of future cash flow discounted at the risk free rate for the corresponding period, adding credit risk premium and liquidity premium thereto.
| 10 |
Calculation methods for the fair value of derivative transactions |
The fair value of forward foreign exchange transactions is calculated using forward exchange rate. As for forward foreign exchange transactions between foreign currency and the other foreign currency, the
fair value is calculated using forward exchange rate of the other foreign currency and yen on the day of forward foreign exchange transactions.
The fair value of currency option transactions is based on the price quoted by counterparties.
The transactions such as forward foreign exchanges that applied exceptional accounting are accounted for together in securities of hedge objectives. Therefore, the fair value is included in the fair value
of the securities.
The fair value of interest rate swap transactions is based on the price quoted by counterparties or the
fair value calculated by discounting future cash flow to the present value.
The fair value of equity index future transactions
is based on the closing price at major exchanges.
The fair value of equity index option transactions is based on the closing
price at major exchanges.
The fair value of bond future transactions is based on the closing price at major exchanges.
The fair value of credit derivative transactions is based on the price quoted by counterparties.
The fair value of weather derivative transactions is calculated based on the contract term and the element of the contract.
The fair value of earthquake derivative transactions is calculated based on the contract term and the element of the contract.
17
(Securities)
As of December 31, 2010
| 1 |
Bonds held to maturity (which have readily determinable fair value) |
|
|
|
|
|
|
|
|
|
|
|
|
|
| |
|
(Millions of yen) |
|
| |
|
Carrying amount
on balance sheet |
|
|
Fair value |
|
|
Unrealized
gains (losses) |
|
| Domestic bonds |
|
|
1,109,413 |
|
|
|
1,164,456 |
|
|
|
55,043 |
|
| Foreign securities |
|
|
62,422 |
|
|
|
63,158 |
|
|
|
735 |
|
|
|
|
|
|
|
|
|
|
|
|
|
|
| Total |
|
|
1,171,836 |
|
|
|
1,227,614 |
|
|
|
55,778 |
|
|
|
|
|
|
|
|
|
|
|
|
|
|
| 2 |
Policy reserve matching bonds (which have readily determinable fair value) |
|
|
|
|
|
|
|
|
|
|
|
|
|
| |
|
(Millions of yen) |
|
| |
|
Carrying amount
on balance sheet |
|
|
Fair value |
|
|
Unrealized
gains (losses) |
|
| Domestic bonds |
|
|
14,775 |
|
|
|
15,248 |
|
|
|
473 |
|
|
|
|
|
|
|
|
|
|
|
|
|
|
| Total |
|
|
14,775 |
|
|
|
15,248 |
|
|
|
473 |
|
|
|
|
|
|
|
|
|
|
|
|
|
|
| 3 |
Securities available for sale (which have readily determinable fair value) |
|
|
|
|
|
|
|
|
|
|
|
|
|
| |
|
(Millions of yen) |
|
| |
|
Cost |
|
|
Carrying amount
on balance sheet |
|
|
Unrealized
gains (losses) |
|
| Domestic bonds |
|
|
2,431,283 |
|
|
|
2,500,594 |
|
|
|
69,310 |
|
| Domestic stocks |
|
|
1,135,321 |
|
|
|
1,609,106 |
|
|
|
473,784 |
|
| Foreign securities |
|
|
1,092,602 |
|
|
|
1,034,476 |
|
|
|
(58,126 |
) |
| Others |
|
|
89,625 |
|
|
|
92,171 |
|
|
|
2,545 |
|
|
|
|
|
|
|
|
|
|
|
|
|
|
| Total |
|
|
4,748,834 |
|
|
|
5,236,348 |
|
|
|
487,513 |
|
|
|
|
|
|
|
|
|
|
|
|
|
|
Notes)
| 1 |
Certificate of deposit, which are classified as cash and deposits and beneficial interests in the loan trusts, which are classified as monetary receivables bought in
the quarterly consolidated balance sheet, are included in “Others” above. |
| 2 |
Impairment losses on securities available for sale which have readily determinable fair value amount to 8,918 million yen. NKSJ Holdings, Inc. and its domestic
consolidated subsidiaries recognize impairment losses on securities available for sale which have readily determinable fair value if fair value declines by 30% or more of their cost as of the quarterly balance sheet date, as a rule.
|
18
(Derivatives transactions)
As of December 31, 2010
|
|
|
|
|
|
|
|
|
|
|
|
|
|
|
| |
|
|
|
(Millions of yen) |
|
| Type |
|
Transaction |
|
Notional
amount |
|
|
Fair value |
|
|
Unrealized
gains (losses) |
|
| Currency derivatives |
|
Forward foreign exchanges: |
|
|
|
|
|
|
|
|
|
|
|
|
|
|
Short |
|
|
59,286 |
|
|
|
1,891 |
|
|
|
1,891 |
|
|
|
Long |
|
|
16,466 |
|
|
|
(314 |
) |
|
|
(314 |
) |
|
|
Currency options: |
|
|
|
|
|
|
|
|
|
|
|
|
|
|
Short |
|
|
35,823 |
|
|
|
|
|
|
|
|
|
|
|
|
|
|
87 |
* |
|
|
(30 |
) |
|
|
57 |
|
|
|
Long |
|
|
33,174 |
|
|
|
|
|
|
|
|
|
|
|
|
|
|
87 |
* |
|
|
143 |
|
|
|
55 |
|
|
|
|
|
|
|
|
|
|
|
|
|
|
|
|
| Equity derivatives |
|
Equity index futures: |
|
|
|
|
|
|
|
|
|
|
|
|
|
|
Short |
|
|
5,611 |
|
|
|
(55 |
) |
|
|
(55 |
) |
|
|
Equity index options: |
|
|
|
|
|
|
|
|
|
|
|
|
|
|
Short |
|
|
5,417 |
|
|
|
|
|
|
|
|
|
|
|
|
|
|
205 |
* |
|
|
(1 |
) |
|
|
203 |
|
|
|
Long |
|
|
4,400 |
|
|
|
|
|
|
|
|
|
|
|
|
|
|
205 |
* |
|
|
108 |
|
|
|
(96 |
) |
|
|
|
|
|
|
|
|
|
|
|
|
|
|
|
| Bond derivatives |
|
Bond futures: |
|
|
|
|
|
|
|
|
|
|
|
|
|
|
Long |
|
|
1,426 |
|
|
|
(13 |
) |
|
|
(13 |
) |
|
|
|
|
|
|
|
|
|
|
|
|
|
|
|
| Others |
|
Credit derivatives: |
|
|
|
|
|
|
|
|
|
|
|
|
|
|
Short |
|
|
9,000 |
|
|
|
66 |
|
|
|
66 |
|
|
|
Long |
|
|
2,000 |
|
|
|
0 |
|
|
|
0 |
|
|
|
Weather derivatives: |
|
|
|
|
|
|
|
|
|
|
|
|
|
|
Short |
|
|
472 |
|
|
|
|
|
|
|
|
|
|
|
|
|
|
19 |
* |
|
|
(10 |
) |
|
|
8 |
|
|
|
Earthquake derivatives: |
|
|
|
|
|
|
|
|
|
|
|
|
|
|
Short |
|
|
3,960 |
|
|
|
|
|
|
|
|
|
|
|
|
|
|
119 |
* |
|
|
(10 |
) |
|
|
109 |
|
|
|
Long |
|
|
3,555 |
|
|
|
|
|
|
|
|
|
|
|
|
|
|
366 |
* |
|
|
125 |
|
|
|
(241 |
) |
|
|
|
|
|
|
|
|
|
|
|
|
|
|
|
| Total |
|
|
— |
|
|
|
1,899 |
|
|
|
1,672 |
|
|
|
|
|
|
|
|
|
|
|
|
|
|
|
|
Notes)
| 1 |
Derivatives transactions to which hedge accounting is applied are excluded. |
| 2 |
Amounts with an asterisk (*) represent the amount of the option premiums. |
19
(Business combinations)
Three months ended December 31, 2010 (October 1 to December 31, 2010)
| (1) |
The name of acquiree and its type of business, reason for business integration, date of business integration, legal form of business integration, name of the entity
after business integration, percentage of voting rights acquired and the primary reason for defining the acquiror |
| |
(a) |
The name of acquiree and its type of business |
Fiba Sigorta Anonim Sirketi (Fiba Sigorta) :Property and casualty insurance business
| |
(b) |
Reason for business integration |
Through the acquisition of Fiba Sigorta, NKSJ Holdings, Inc. (NKSJ) plans to establish a strong platform to expand NKSJ’s property
and casualty insurance business in the fast-growing Turkish market.
| |
(c) |
Date of business integration |
November 2, 2010
| |
(d) |
Legal form of business integration |
Acquisition of shares by cash
| |
(e) |
Name of the entity after business integration |
Fiba Sigorta Anonim Sirketi
| |
(f) |
Percentage of voting rights acquired |
90.0%
| |
(g) |
The primary reason for defining the acquiror |
NKSJ was defined as the acquiror because Sompo Japan Insurance Inc. and other 5 consolidated subsidiaries of NKSJ acquired shares of Fiba Sigorta by cash.
| (2) |
The business term of the acquiree included in the quarterly consolidated statements of income for the nine months ended December 31, 2010 |
None. The date of business integration was the date after September 30, 2010 which is the balance sheet date of the third quarter of
Fiba Sigorta.
| (3) |
Acquisition cost with details of the acquiree |
|
|
|
|
|
|
|
|
|
|
|
| Purchase price |
|
|
484 million Turkish liras |
|
|
|
|
|
|
|
| Direct cost for the acquisition |
|
|
22 million Turkish liras |
|
|
|
|
|
|
|
|
|
|
|
|
|
|
|
|
|
|
| Total |
|
|
507 million Turkish liras |
|
|
|
|
|
|
|
20
| (4) |
Amount of goodwill, reason for recognizing goodwill and method and term of amortization |
377 million Turkish liras
| |
(b) |
Reason for recognizing goodwill |
The acquisition cost exceeded the net amounts of assets acquired and liabilities assumed on the date of business integration.
| |
(c) |
Method and term of amortization |
Straight-line amortization in 20 years
| (5) |
Amounts of assets acquired and liabilities assumed on the date of business integration |
|
|
|
|
|
|
|
| Total assets: |
|
381 million Turkish liras |
| Cash and deposits |
|
256 million Turkish liras |
| Total liabilities: |
|
251 million Turkish liras |
| Underwriting funds |
|
218 million Turkish liras |
| 2 |
Transactions under common control |
| (1) |
The name of constituent companies and its type of business, date of business integration, legal form of business integration, name of the entity after business
integration and purpose of transactions |
| |
(a) |
The name of constituent companies and its type of business |
|
|
|
| Sompo Japan Asset Management Co., Ltd. (SJAM) |
|
: Investment advisory business and mutual fund business |
| ZEST Asset Management Ltd. (ZEST) |
|
: Investment advisory business |
| |
(b) |
Date of business integration |
October 1, 2010
| |
(c) |
Legal form of business integration |
Absorption by SJAM (consolidated company of NKSJ) of a surviving company and ZEST (non-consolidated company of NKSJ) of a merging company
| |
(d) |
Name of the entity after business integration |
Sompo Japan Nipponkoa Asset Management Co., Ltd. (consolidated company of NKSJ)
| |
(e) |
Purpose of transactions |
NKSJ
plans the concentration and the enhancement of the investment operation of NKSJ Group.
| (2) |
Summary of accounting treatment |
The transactions are accounted for as transactions under common control in accordance with the Accounting Standards Board of Japan
Statement No. 21 “Accounting Standard for Business Combinations in Japan” (December 26, 2008) and the Accounting Standards Board of Japan Guidance No. 10 “Guidance on Accounting Standard for Business Combinations and
Accounting Standard for Business Divestitures” (December 26, 2008).
21
(Per share information)
| 1 |
Total net assets per share |
|
|
|
|
|
| |
|
As of December 31, 2010 |
|
| Total net assets per share |
|
|
700.32 yen |
|
Note)
| Calculation |
of total net assets per share is based on the following figures. |
|
|
|
|
|
| |
|
(Millions of yen) |
|
| |
|
As of December 31, 2010 |
|
| Total net assets |
|
|
1,168,156 |
|
| Amount to be deducted from total net assets: |
|
|
(5,318 |
) |
| Stock acquisition rights |
|
|
(2,362 |
) |
| Non-controlling interests |
|
|
(2,955 |
) |
| Total net assets attributable to common stocks |
|
|
1,162,837 |
|
| Number of common stocks used for calculation of total net assets per share |
|
|
thousand shares |
|
|
|
|
1,660,433 |
|
|
|
|
|
|
| |
|
Nine months ended December 31, 2010
(April 1 to December 31, 2010) |
|
| Net income per share—Basic |
|
|
14.96 yen |
|
| Net income per share—Diluted |
|
|
14.93 yen |
|
| Calculation |
of basic net income per share and diluted net income per share is based on the following figures. |
|
|
|
|
|
| |
|
(Millions of yen) |
|
| |
|
Nine months ended December 31, 2010
(April 1 to December 31, 2010) |
|
| (1) Net income per share—Basic |
|
|
|
|
| Net income |
|
|
24,846 |
|
| Net income not attributable to common stockholders |
|
|
— |
|
| Net income attributable to common stocks |
|
|
24,846 |
|
| Average number of common stocks outstanding |
|
|
thousand shares
1,660,680 |
|
| (2) Net income per share—Diluted |
|
|
|
|
| Adjustment of net income |
|
|
— |
|
| Increase of common stocks |
|
|
thousand shares |
|
|
|
|
2,603 |
|
22
(Significant subsequent events)
None.
23
| (1) |
Quarterly Consolidated Statements of Income for the Third Quarter Consolidated Accounting Period |
The quarterly consolidated statements of income for the third quarter consolidated accounting period are not reviewed, since NKSJ
Holdings, Inc. conducts business defined in the provision of Article17-15 Paragraph 2 of the Cabinet Office Ordinance on Disclosure of Corporate Information, etc.
|
|
|
|
|
| |
|
(Millions of yen) |
|
| |
|
Three months ended
December 31, 2010
(October 1
to
December 31, 2010) |
|
| Ordinary income: |
|
|
672,277 |
|
| Underwriting income: |
|
|
641,637 |
|
| Net premiums written |
|
|
477,642 |
|
| Deposits of premiums by policyholders |
|
|
38,878 |
|
| Interest and dividend income on deposits of premiums, etc. |
|
|
14,799 |
|
| Life insurance premiums written |
|
|
62,530 |
|
| Reversal of reserve for outstanding losses and claims |
|
|
24,032 |
|
| Reversal of underwriting reserves |
|
|
22,613 |
|
| Investment income: |
|
|
28,734 |
|
| Interest and dividend income |
|
|
38,080 |
|
| Investment gains on money trusts |
|
|
(48 |
) |
| Investment gains on trading securities |
|
|
(67 |
) |
| Realized gains on sales of securities |
|
|
3,556 |
|
| Transfer of interest and dividend income on deposits of premiums, etc. |
|
|
(14,799 |
) |
| Other ordinary income |
|
|
1,905 |
|
| Ordinary expenses: |
|
|
665,193 |
|
| Underwriting expenses: |
|
|
554,688 |
|
| Net claims paid |
|
|
318,674 |
|
| Loss adjustment expenses |
|
|
31,989 |
|
| Net commissions and brokerage fees |
|
|
88,955 |
|
| Maturity refunds to policyholders |
|
|
98,962 |
|
| Life insurance claims paid |
|
|
15,136 |
|
| Investment expenses: |
|
|
5,508 |
|
| Investment losses on money trusts |
|
|
333 |
|
| Investment losses on trading securities |
|
|
17 |
|
| Realized losses on sales of securities |
|
|
1,405 |
|
| Impairment losses on securities |
|
|
3,026 |
|
| Operating, general and administrative expenses |
|
|
102,191 |
|
| Other ordinary expenses: |
|
|
2,804 |
|
| Interest paid |
|
|
1,783 |
|
|
|
|
|
|
| Ordinary profit |
|
|
7,084 |
|
|
|
|
|
|
| Extraordinary gains: |
|
|
236 |
|
| Gains on disposal of fixed assets |
|
|
236 |
|
| Extraordinary losses: |
|
|
2,286 |
|
| Losses on disposal of fixed assets |
|
|
168 |
|
| Provision for reserves under the special laws: |
|
|
1,989 |
|
| Provision for reserve for price fluctuation |
|
|
1,989 |
|
| Other extraordinary losses |
|
|
129 |
|
|
|
|
|
|
| Income before income taxes and non-controlling interests |
|
|
5,034 |
|
|
|
|
|
|
| Income taxes and deferred income taxes |
|
|
4,374 |
|
|
|
|
|
|
| Income before non-controlling interests |
|
|
659 |
|
|
|
|
|
|
| Non-controlling interests |
|
|
(70 |
) |
|
|
|
|
|
| Net income |
|
|
729 |
|
|
|
|
|
|
| Note) |
The above table represents the amounts deducting the amounts for the six months ended September 30, 2010 from the amounts for the nine months ended
December 31, 2010. |
24
(Segment information)
[Segment information]
| 1 |
Information related to the amount of sales and net income or loss by each reportable segment |
Three months ended December 31, 2010 (October 1 to December 31, 2010)
|
|
|
|
|
|
|
|
|
|
|
|
|
|
|
|
|
|
|
|
|
|
|
|
|
|
|
|
|
| |
|
(Millions of yen) |
|
| |
|
Reportable segments |
|
|
Others
(Note
2) |
|
|
Total |
|
|
Adjustment
(Note
3) |
|
|
Carrying
amount
on
the quarterly
consolidated
statements of
income
(Note 4) |
|
| |
Property
and
casualty
insurance
business |
|
|
Life
insurance
business |
|
|
Total |
|
|
|
|
|
| Sales (Note 1) |
|
|
|
|
|
|
|
|
|
|
|
|
|
|
|
|
|
|
|
|
|
|
|
|
|
|
|
|
| Sales from transactions with external customers |
|
|
477,642 |
|
|
|
62,530 |
|
|
|
540,173 |
|
|
|
1,341 |
|
|
|
541,514 |
|
|
|
130,763 |
|
|
|
672,277 |
|
| Sales arising from internal segment |
|
|
— |
|
|
|
— |
|
|
|
— |
|
|
|
803 |
|
|
|
803 |
|
|
|
(803 |
) |
|
|
— |
|
|
|
|
|
|
|
|
|
|
|
|
|
|
|
|
|
|
|
|
|
|
|
|
|
|
|
|
|
|
| Total |
|
|
477,642 |
|
|
|
62,530 |
|
|
|
540,173 |
|
|
|
2,145 |
|
|
|
542,318 |
|
|
|
129,959 |
|
|
|
672,277 |
|
|
|
|
|
|
|
|
|
|
|
|
|
|
|
|
|
|
|
|
|
|
|
|
|
|
|
|
|
|
| Net income (loss) attributable to segment |
|
|
1,644 |
|
|
|
(950 |
) |
|
|
693 |
|
|
|
36 |
|
|
|
729 |
|
|
|
— |
|
|
|
729 |
|
|
|
|
|
|
| Notes) |
|
|
|
|
|
|
|
| 1 The definitions of sales are as follows. |
|
|
|
|
| Property and casualty insurance business: |
|
Net premiums written |
| Life insurance business: |
|
Life insurance premiums written |
| “Others” and carrying amount on the quarterly consolidated statements of income: |
|
Ordinary income |
| 2 “Others” is business segments which are not included in reportable segments.
It includes other operations. |
|
|
|
|
| 3 Adjustments of sales are as follows. |
|
|
|
|
| Elimination of transactions arising from internal segment: |
|
|
|
(803) million yen |
| Ordinary income related to property and casualty insurance business and life insurance business excluding net premiums written
and life insurance premiums written: |
|
|
|
130,763 million yen |
| 4 Net income or loss attributable to segment is adjusted to net income in the quarterly
consolidated statements of income. |
|
|
|
|
25
(Per share information)
|
|
|
|
|
| |
|
Three months ended December 31, 2010
(October 1 to December 31, 2010) |
|
| Net income per share—Basic |
|
|
0.43 yen |
|
| Net income per share—Diluted |
|
|
0.43 yen |
|
Note) Calculation of basic net income per share and diluted net income per share is based on the following figures.
|
|
|
|
|
| |
|
(Millions of yen) |
|
| |
|
Three months ended December 31, 2010
(October 1 to December 31, 2010) |
|
| (1) Net income per share—Basic |
|
|
|
|
| Net income |
|
|
729 |
|
| Net income not attributable to common stockholders |
|
|
— |
|
| Net income attributable to common stocks |
|
|
729 |
|
| Average number of common stocks outstanding |
|
|
thousand shares
1,660,478 |
|
| (2) Net income per share—Diluted |
|
|
|
|
| Adjustment of net income |
|
|
— |
|
| Increase of common stocks |
|
|
thousand shares |
|
| |
|
|
3,192 |
|
26
27
Part 2: Information on party(ies) providing guaranty to the Reporting Company
(Omitted.)
28
Note Regarding Forward-looking Statements
This document includes “forward-looking statements” that reflect the information in relation to the NKSJ Holdings, Inc.
(“NKSJ”). To the extent that statements in this document do not relate to historical or current facts, they constitute forward-looking statements. These forward-looking statements are based on the current assumptions and beliefs of NKSJ in
light of the information currently available to NKSJ, and involve known and unknown risks, uncertainties and other factors. Such risks, uncertainties and other factors may cause the actual results, performance, achievements or financial position of
NKSJ, as the case may be, to be materially different from any future results, performance, achievements or financial position expressed or implied by these forward-looking statements. NKSJ does not undertake or will not undertake any obligation to
publicly update any forward-looking statements after the date of this document. Investors are advised to consult any further disclosures by NKSJ in their subsequent domestic filings in Japan and filings with, or submissions to, the U.S. Securities
Exchange Commission pursuant to the U.S. Securities Exchange Act of 1934.
The risks, uncertainties and other factors referred
to above include, but are not limited to, those below. The risks, uncertainties and other factors are also referred to in our domestic Quarterly Securities Reports.
| (1) |
Effects of deterioration of economic and business conditions in Japan |
| (2) |
Risk of intensification of competition in the property and casualty insurance business |
| (3) |
Changes to laws, regulations, and systems |
| (4) |
Natural catastrophe risks related to insurance products |
| (5) |
Occurrence of losses exceeding projection |
| (7) |
Effects of declining stock price |
| (8) |
Effects of fluctuation in interest rate |
| (10) |
Effects of fluctuation in foreign exchange rate |
| (12) |
Life insurance business risks |
| (13) |
Overseas business risk |
| (14) |
Non-insurance business risk |
| (15) |
Credit rating downgrade |
| (16) |
Business interruption risk in case of natural disasters, etc. |
| (17) |
Information security risk |
| (19) |
System integration risk |
| (20) |
Risk of failure to adequately realize business integration synergies |
| (21) |
Risks related to merger of life insurance subsidiaries |
29