
Backblaze ©2026 | 1 August 3, 2026 Q2 2026 Results Gleb Budman CEO and Co-Founder Backblaze Marc Suidan CFO
Backblaze ©2026 | 2 Cautionary Note Regarding Forward-Looking Statements This presentation contains forward-looking statements, which involve risks and uncertainties. These forward-looking statements are generally identified by the use of forward-looking terminology, including the terms “anticipate,” “believe,” “continue,” “could,” “estimate,” “expect,” “intend,” “likely,” “may,” “plan,” “possible,” “potential,” “predict,” “project,” “should,” “target,” “will,” “would” and, in each case, their negative or other various or comparable terminology. All statements other than statements of historical facts contained in this presentation, including statements regarding our strategy, future operations, future financial position, future revenue, projected costs, planned investments and initiatives, prospects, plans, objectives of management and general economic trends and trends in the industry and markets are forward-looking statements. These statements involve known and unknown risks, uncertainties and other important factors that may cause our actual results to differ materially from any future results expressed or implied by the forward-looking statements, including that our AI customer revenue is early-stage and widespread adoption is uncertain; we may not achieve the growth rates implied by current trends; estimates of addressable market size and market opportunity are based on internal assumptions and third-party data that may prove inaccurate or may not reflect actual market conditions; our sales and marketing and cost-saving initiatives may not achieve their intended results; new features and price changes may not have the anticipated impact; supply availability, volatility and pricing may adversely affect our business; our recently announced strategic agreement with CoreWeave involves a new delivery model and is subject to risks related to customer concentration, ramp timing, consumption levels, and our ability to scale operations, any of which could cause actual revenue to differ from contracted amounts. Additional risks are set forth under “Risk Factors” in our most recent Annual Report on Form 10-K and Quarterly Reports on Form 10-Q. These forward-looking statements reflect our views with respect to future events as of the date of this presentation and are based on assumptions and subject to risks and uncertainties. Given these uncertainties, you should not place undue reliance on these forward-looking statements. We undertake no obligation to update any forward-looking statements, whether as a result of new information, future events or otherwise after the date of this presentation, except as required by applicable law. Non-GAAP Financial Measures To supplement the financial measures prepared in accordance with generally accepted accounting principles (GAAP), we use non-GAAP Adjusted Gross Profit and Margin, non-GAAP Net Income (Loss), non-GAAP Net Income (Loss) per share, Adjusted EBITDA and Margin, and Adjusted Free Cash Flow and Margin. These non-GAAP financial measures exclude certain items and are not prepared in accordance with GAAP; therefore, the information is not necessarily comparable to other companies and should be considered as a supplement to, not a substitute for, or superior to, the corresponding measures calculated in accordance with GAAP. We present these non-GAAP measures because management believes they are a useful measure of the Company’s performance and provide an additional basis for assessing our operating results. Please see the Appendix attached to this presentation for a reconciliation of non-GAAP Adjusted Gross Margin, non-GAAP Net Income, Adjusted EBITDA Margin and Adjusted Free Cash Flow to the most directly comparable GAAP financial measures. Important Information About This Presentation
Backblaze ©2026 | 3 Our Mission To make customers unstoppable by solving their toughest data storage challenges.
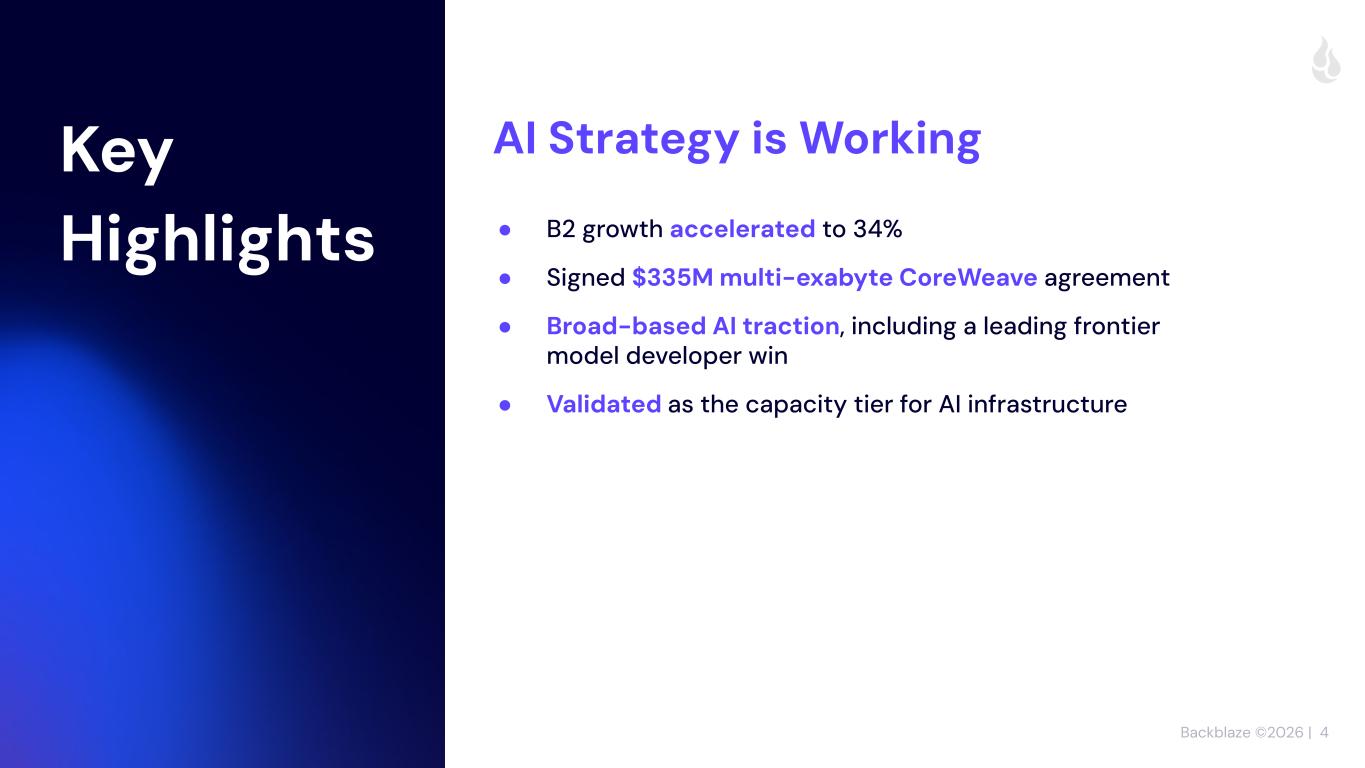
Backblaze ©2026 | 4 Key Highlights ● B2 growth accelerated to 34% ● Signed $335M multi-exabyte CoreWeave agreement ● Broad-based AI traction, including a leading frontier model developer win ● Validated as the capacity tier for AI infrastructure AI Strategy is Working
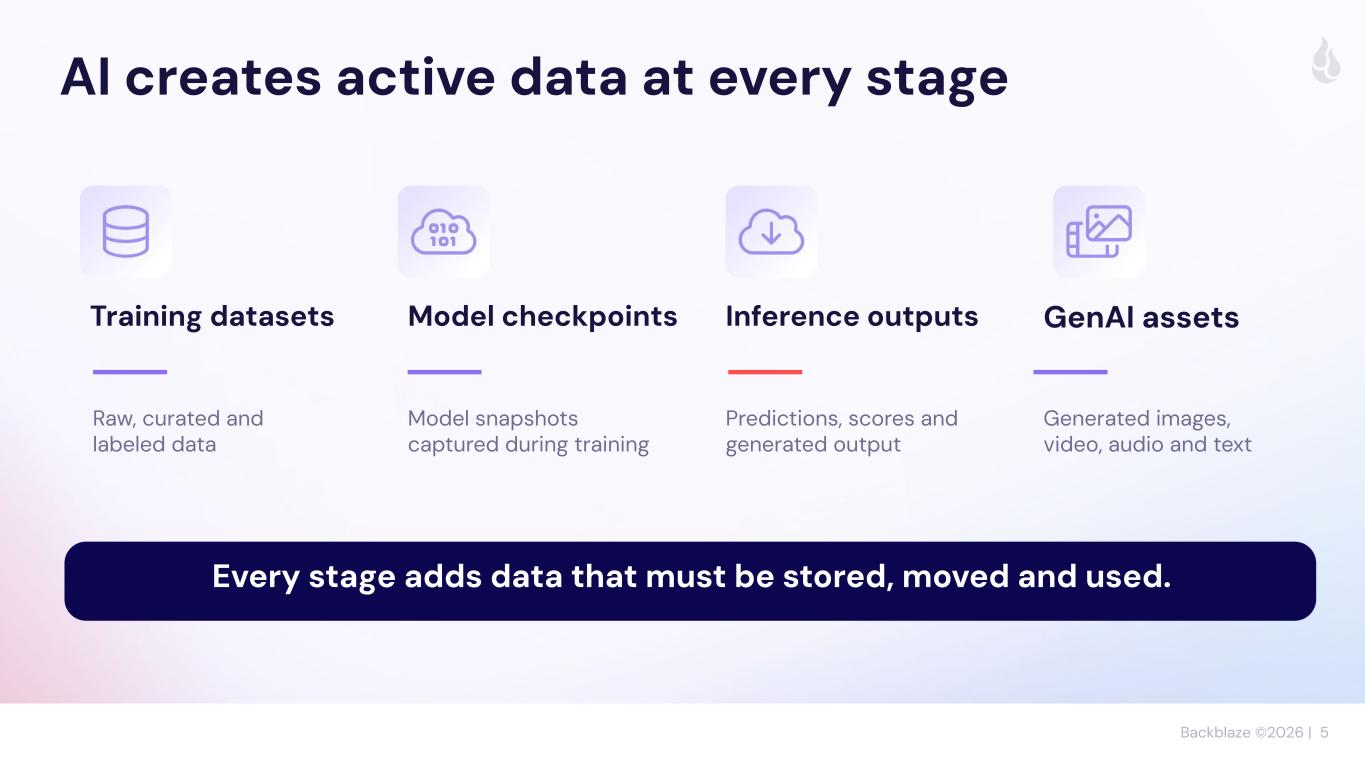
Backblaze ©2026 | 5 AI creates active data at every stage Training datasets Model checkpoints Model snapshots captured during training Inference outputs Predictions, scores and generated output GenAI assets Generated images, video, audio and text Every stage adds data that must be stored, moved and used. Raw, curated and labeled data
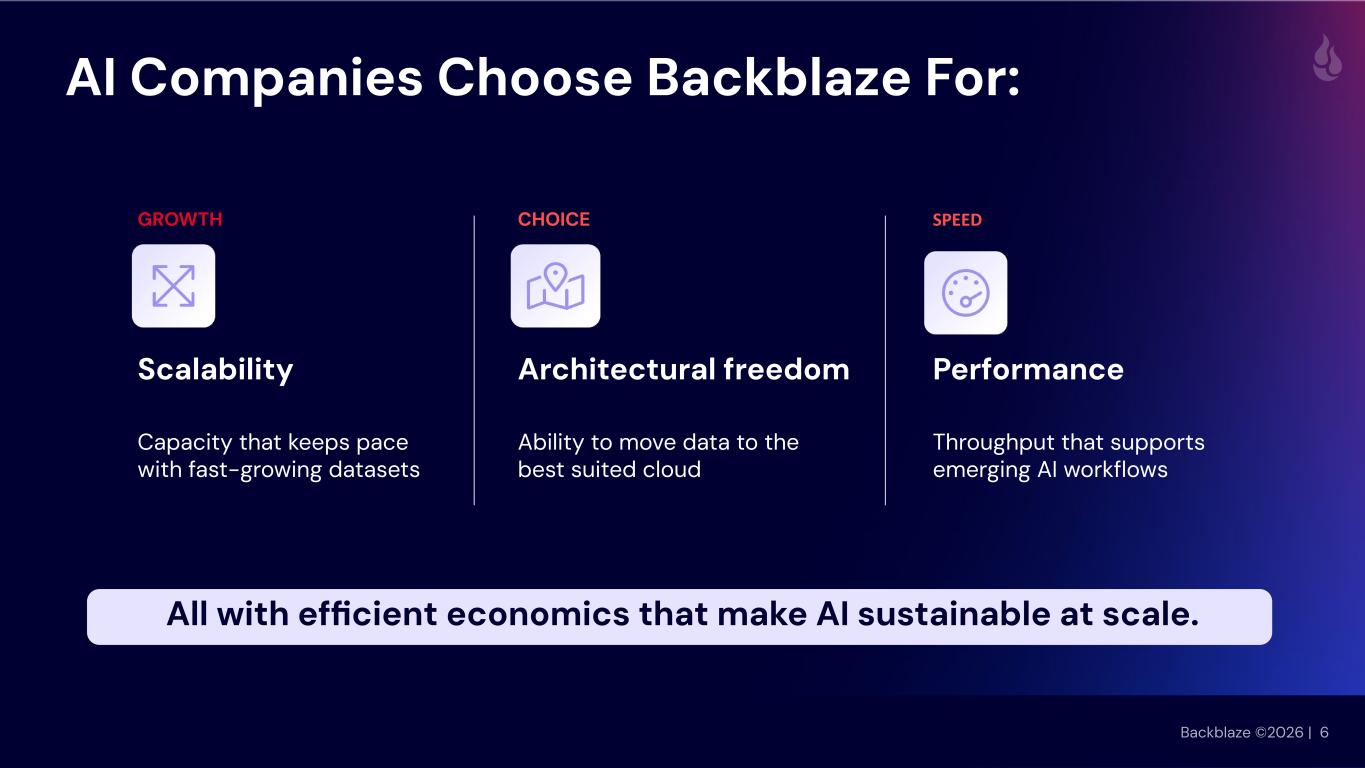
Backblaze ©2026 | 6 AI Companies Choose Backblaze For: GROWTH Scalability Capacity that keeps pace with fast-growing datasets CHOICE Architectural freedom Ability to move data to the best suited cloud SPEED Performance Throughput that supports emerging AI workflows All with efficient economics that make AI sustainable at scale.
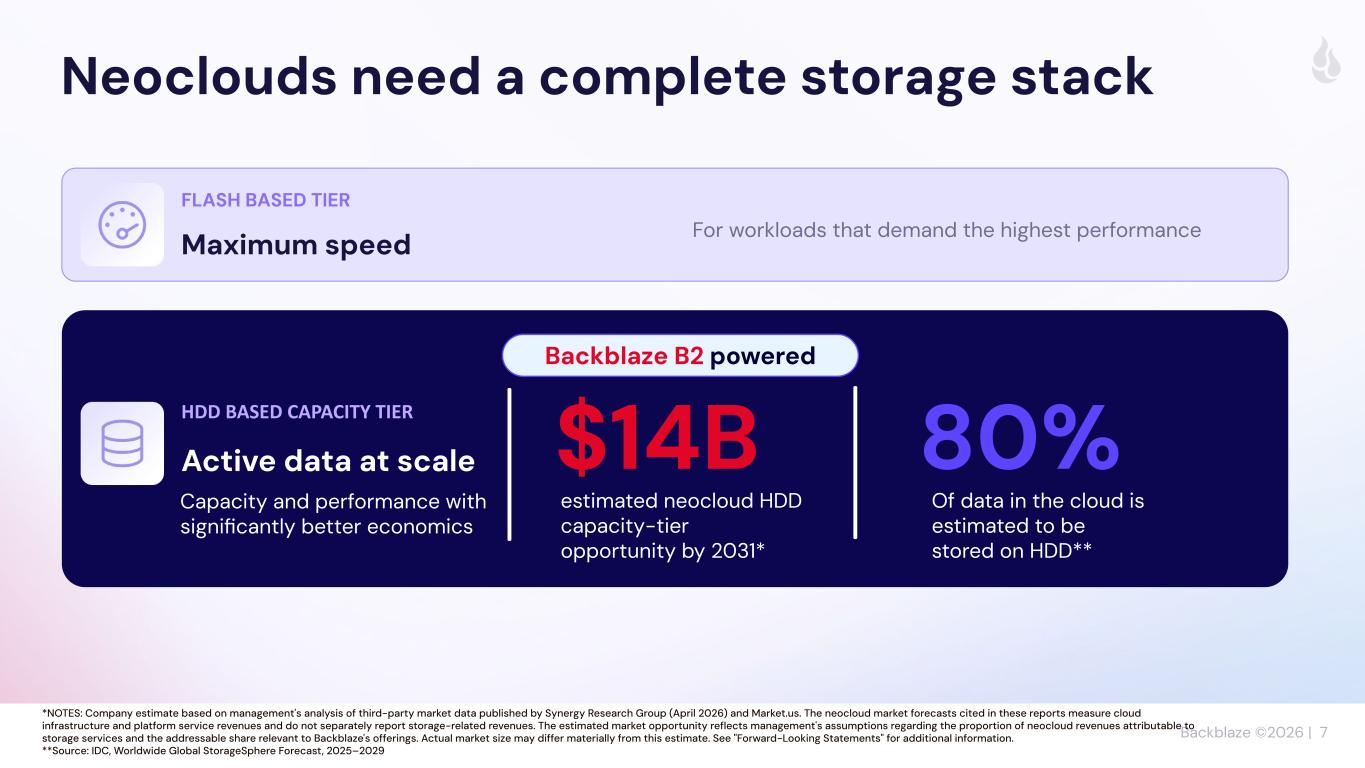
Backblaze ©2026 | 7 Neoclouds need a complete storage stack FLASH BASED TIER Maximum speed For workloads that demand the highest performance HDD BASED CAPACITY TIER Active data at scale $14B estimated neocloud HDD capacity-tier opportunity by 2031* Capacity and performance with significantly better economics Backblaze B2 powered *NOTES: Company estimate based on management's analysis of third-party market data published by Synergy Research Group (April 2026) and Market.us. The neocloud market forecasts cited in these reports measure cloud infrastructure and platform service revenues and do not separately report storage-related revenues. The estimated market opportunity reflects management's assumptions regarding the proportion of neocloud revenues attributable to storage services and the addressable share relevant to Backblaze's offerings. Actual market size may differ materially from this estimate. See "Forward-Looking Statements" for additional information. **Source: IDC, Worldwide Global StorageSphere Forecast, 2025–2029 80% Of data in the cloud is estimated to be stored on HDD**
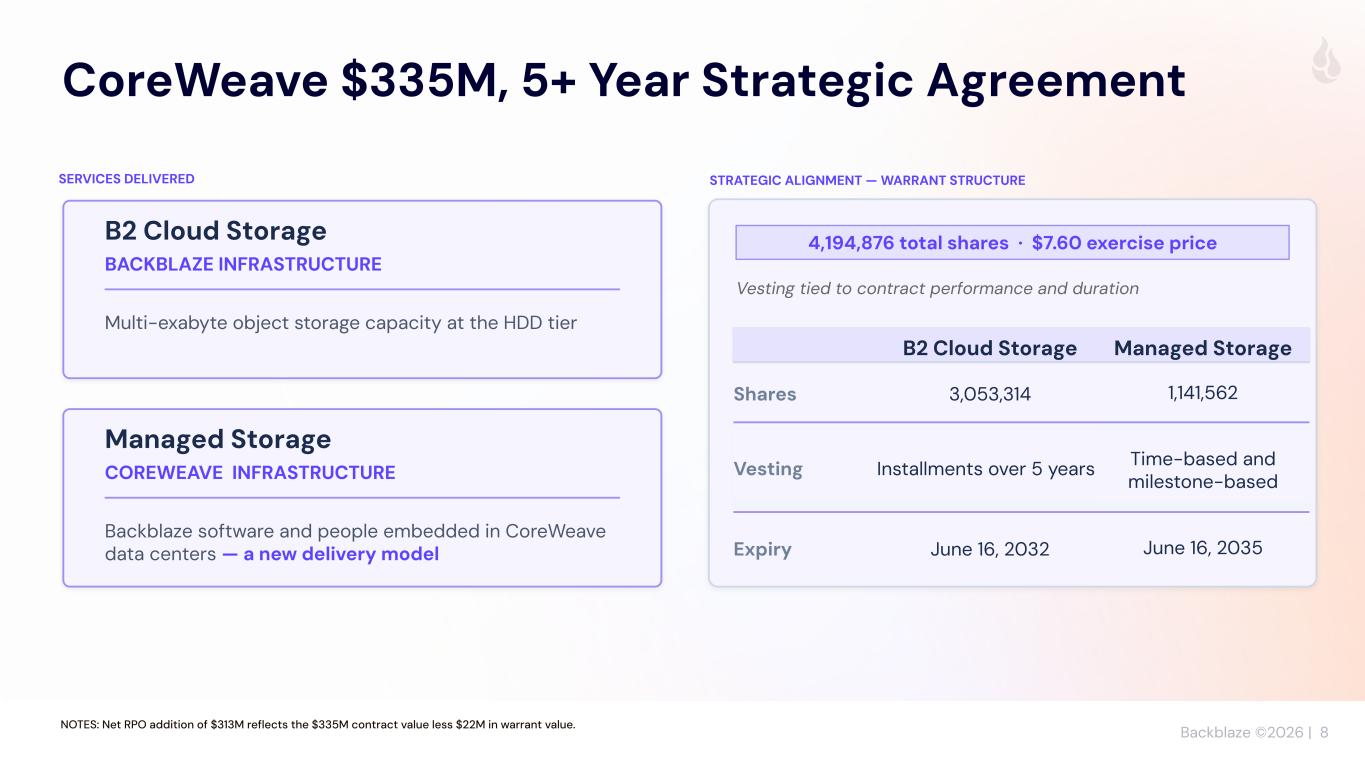
Backblaze ©2026 | 8 CoreWeave $335M, 5+ Year Strategic Agreement B2 Cloud Storage BACKBLAZE INFRASTRUCTURE Multi-exabyte object storage capacity at the HDD tier STRATEGIC ALIGNMENT — WARRANT STRUCTURE 4,194,876 total shares · $7.60 exercise price Vesting tied to contract performance and duration B2 Cloud Storage Managed Storage Shares 3,053,314 1,141,562 Vesting Installments over 5 years Time-based and milestone-based Expiry June 16, 2032 June 16, 2035 NOTES: Net RPO addition of $313M reflects the $335M contract value less $22M in warrant value. Managed Storage COREWEAVE INFRASTRUCTURE Backblaze software and people embedded in CoreWeave data centers — a new delivery model SERVICES DELIVERED
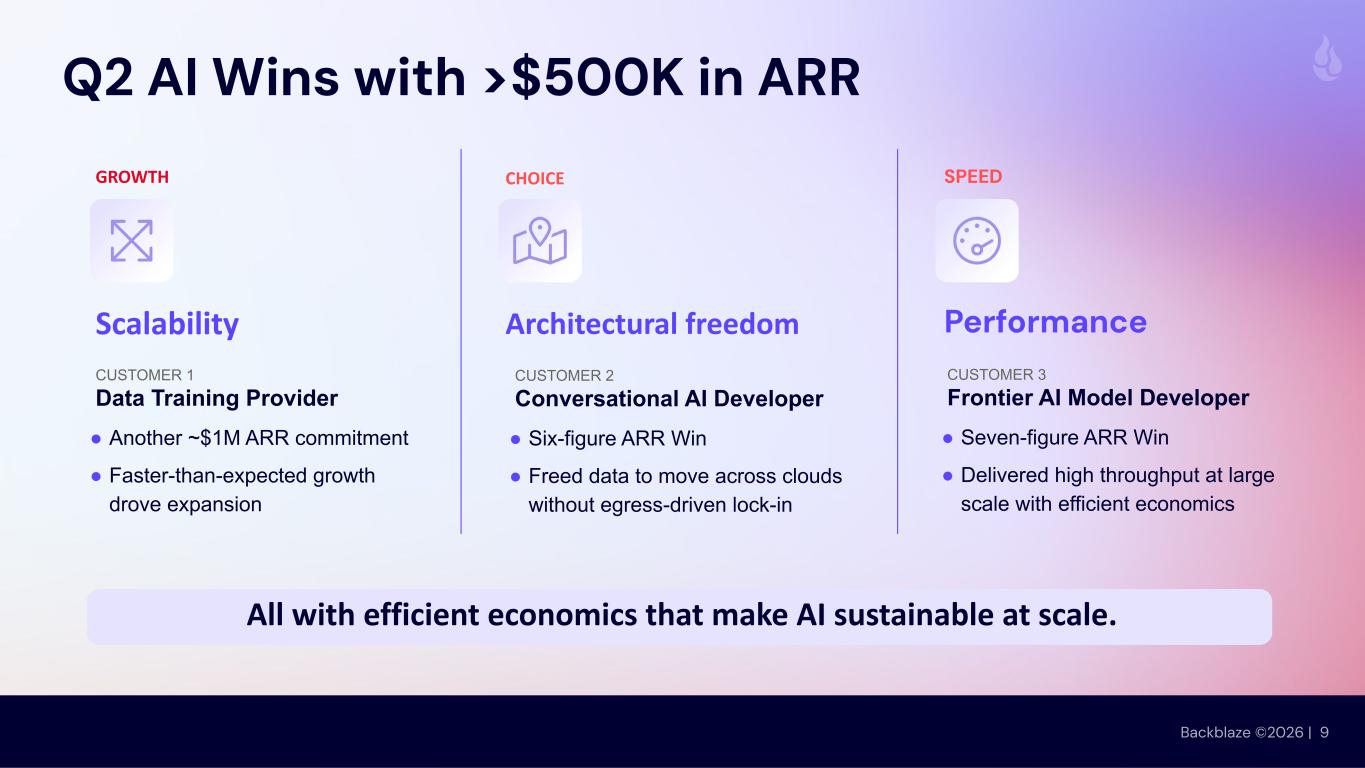
Backblaze ©2026 | 9 Q2 AI Wins with >$500K in ARR GROWTH Scalability CUSTOMER 1 Data Training Provider ● Another ~$1M ARR commitment ● Faster-than-expected growth drove expansion CHOICE Architectural freedom SPEED Performance All with efficient economics that make AI sustainable at scale. CUSTOMER 2 Conversational AI Developer ● Six-figure ARR Win ● Freed data to move across clouds without egress-driven lock-in CUSTOMER 3 Frontier AI Model Developer ● Seven-figure ARR Win ● Delivered high throughput at large scale with efficient economics
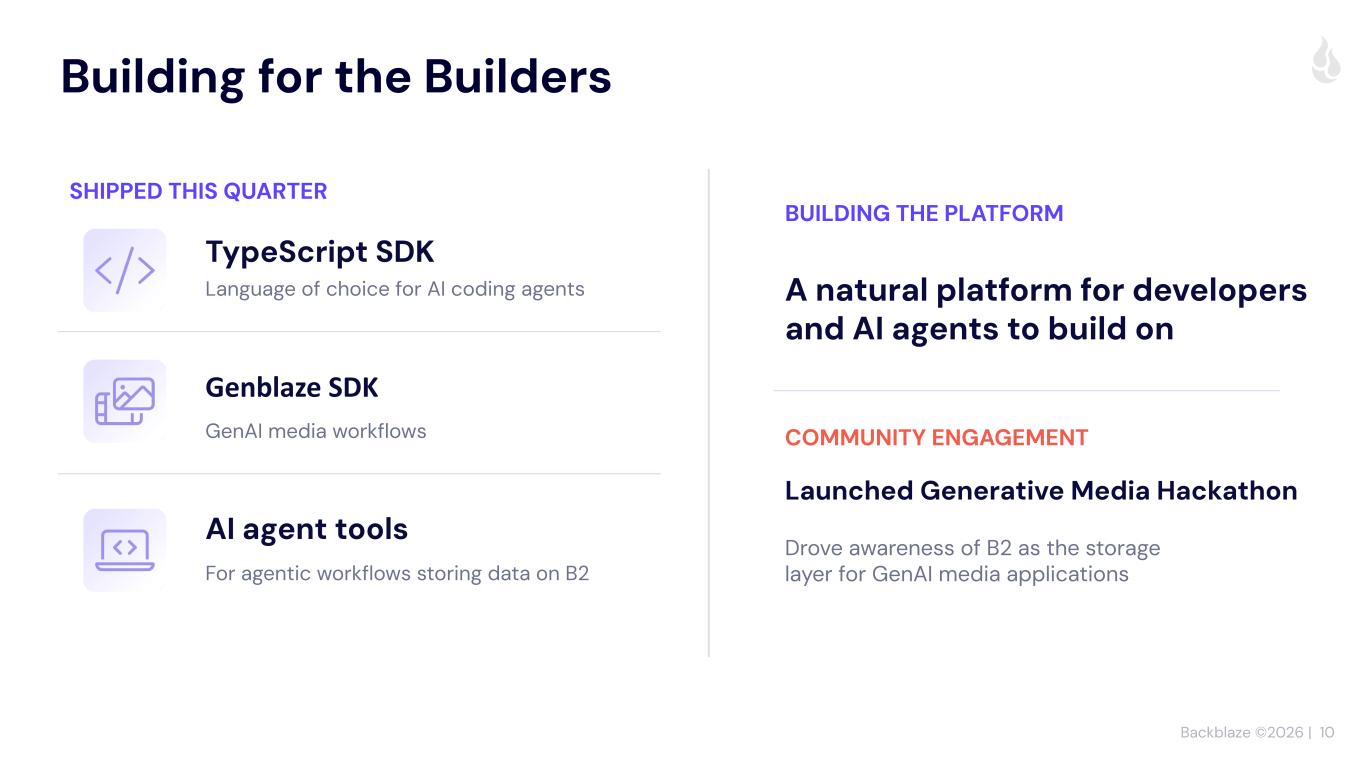
Backblaze ©2026 | 10 SHIPPED THIS QUARTER TypeScript SDK Language of choice for AI coding agents Genblaze SDK GenAI media workflows AI agent tools For agentic workflows storing data on B2 BUILDING THE PLATFORM A natural platform for developers and AI agents to build on COMMUNITY ENGAGEMENT Launched Generative Media Hackathon Drove awareness of B2 as the storage layer for GenAI media applications Building for the Builders
Backblaze ©2026 | 11 Capacity for growth. As AI scales, data grows. Economics for discipline As AI companies mature, storage efficiency matters. Positioned for durable growth BACKBLAZE DELIVERS BOTH

Backblaze ©2026 | 12 Financial Overview Marc Suidan CFO
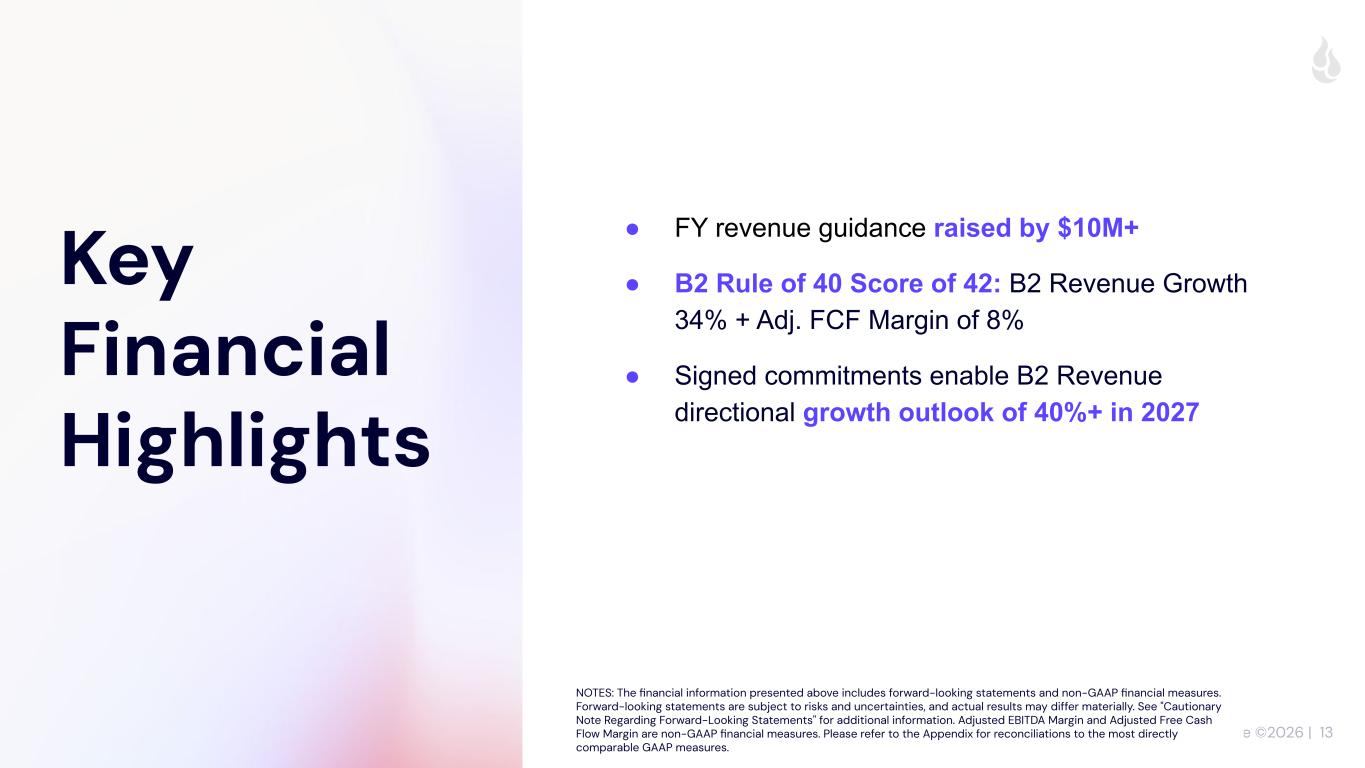
Backblaze ©2026 | 13 Key Financial Highlights ● FY revenue guidance raised by $10M+ ● B2 Rule of 40 Score of 42: B2 Revenue Growth 34% + Adj. FCF Margin of 8% ● Signed commitments enable B2 Revenue directional growth outlook of 40%+ in 2027 NOTES: The financial information presented above includes forward-looking statements and non-GAAP financial measures. Forward-looking statements are subject to risks and uncertainties, and actual results may differ materially. See "Cautionary Note Regarding Forward-Looking Statements" for additional information. Adjusted EBITDA Margin and Adjusted Free Cash Flow Margin are non-GAAP financial measures. Please refer to the Appendix for reconciliations to the most directly comparable GAAP measures.
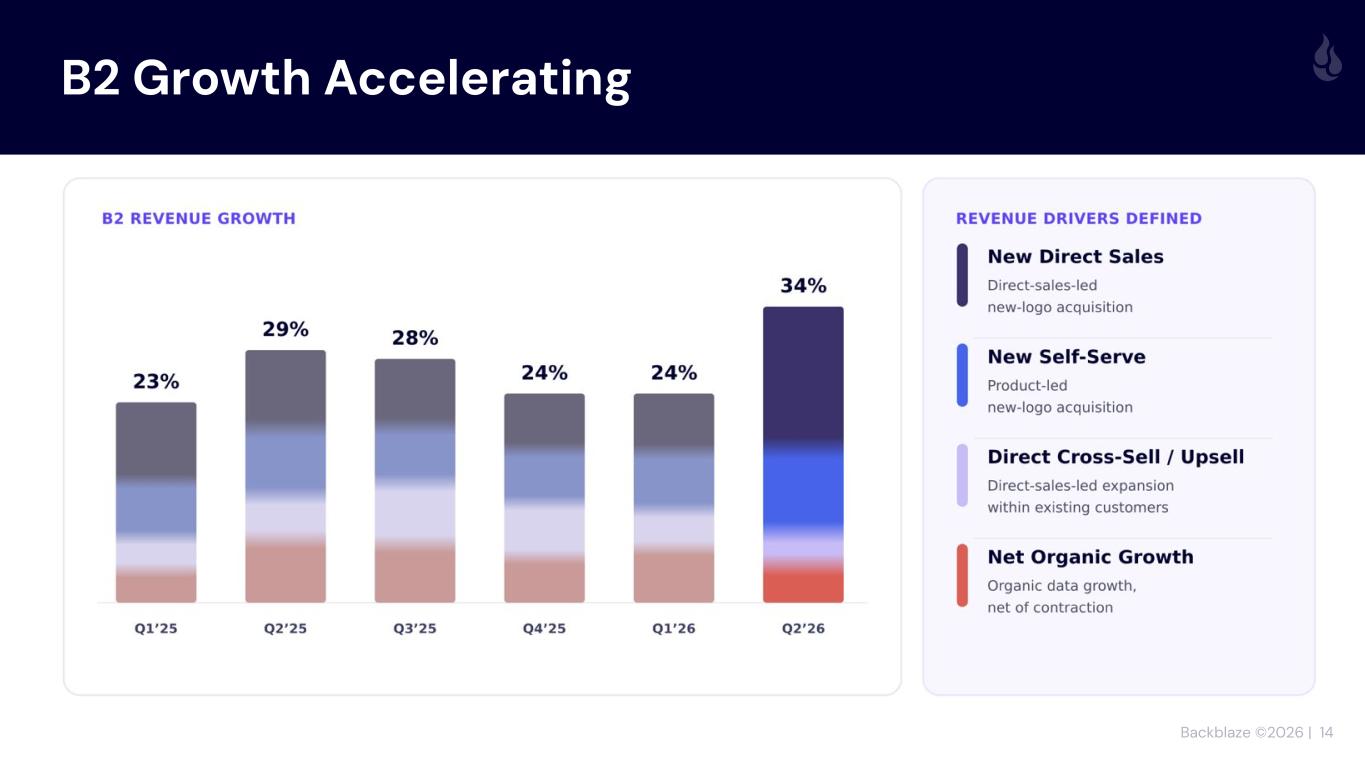
Backblaze ©2026 | 14 B2 Growth Accelerating
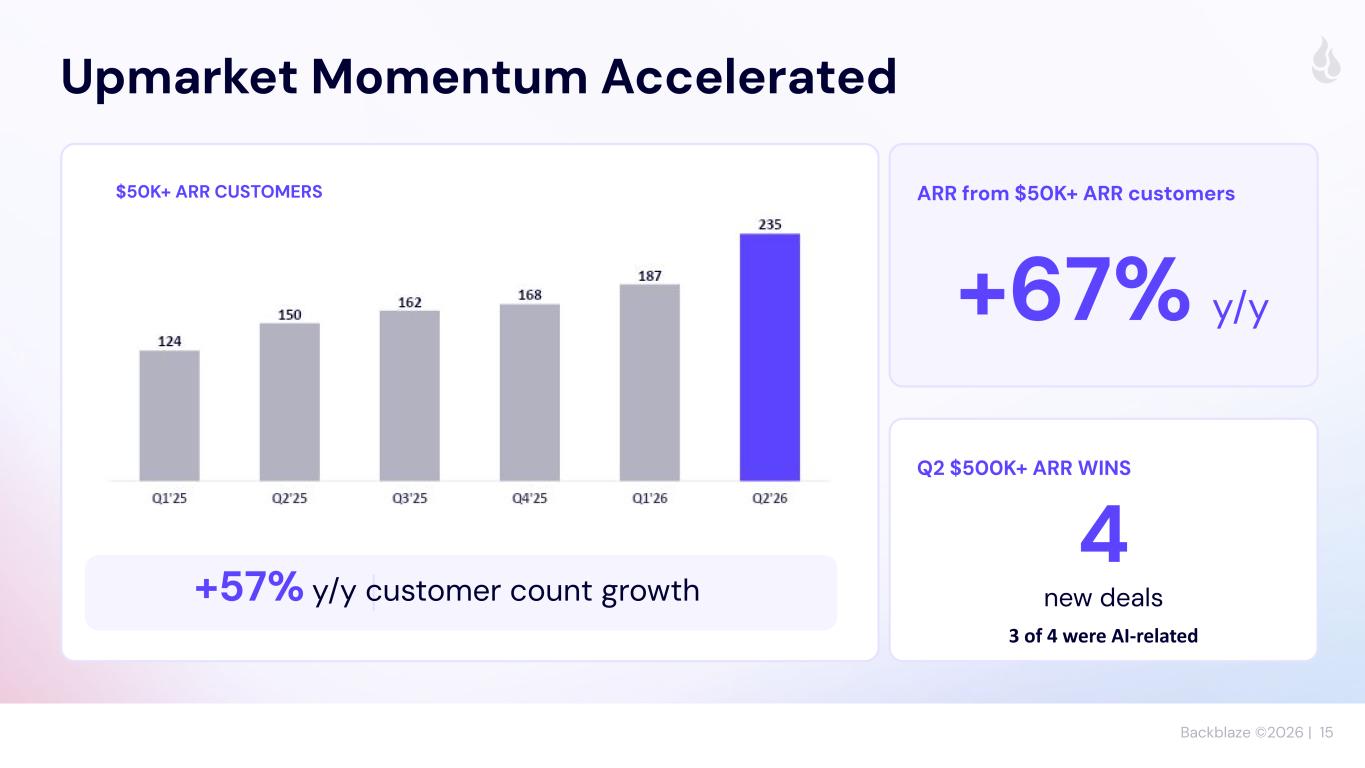
Backblaze ©2026 | 15 Upmarket Momentum Accelerated $50K+ ARR CUSTOMERS +67% y/y ARR from $50K+ ARR customers +57% y/y customer count growth Q2 $500K+ ARR WINS 4 new deals 3 of 4 were AI-related
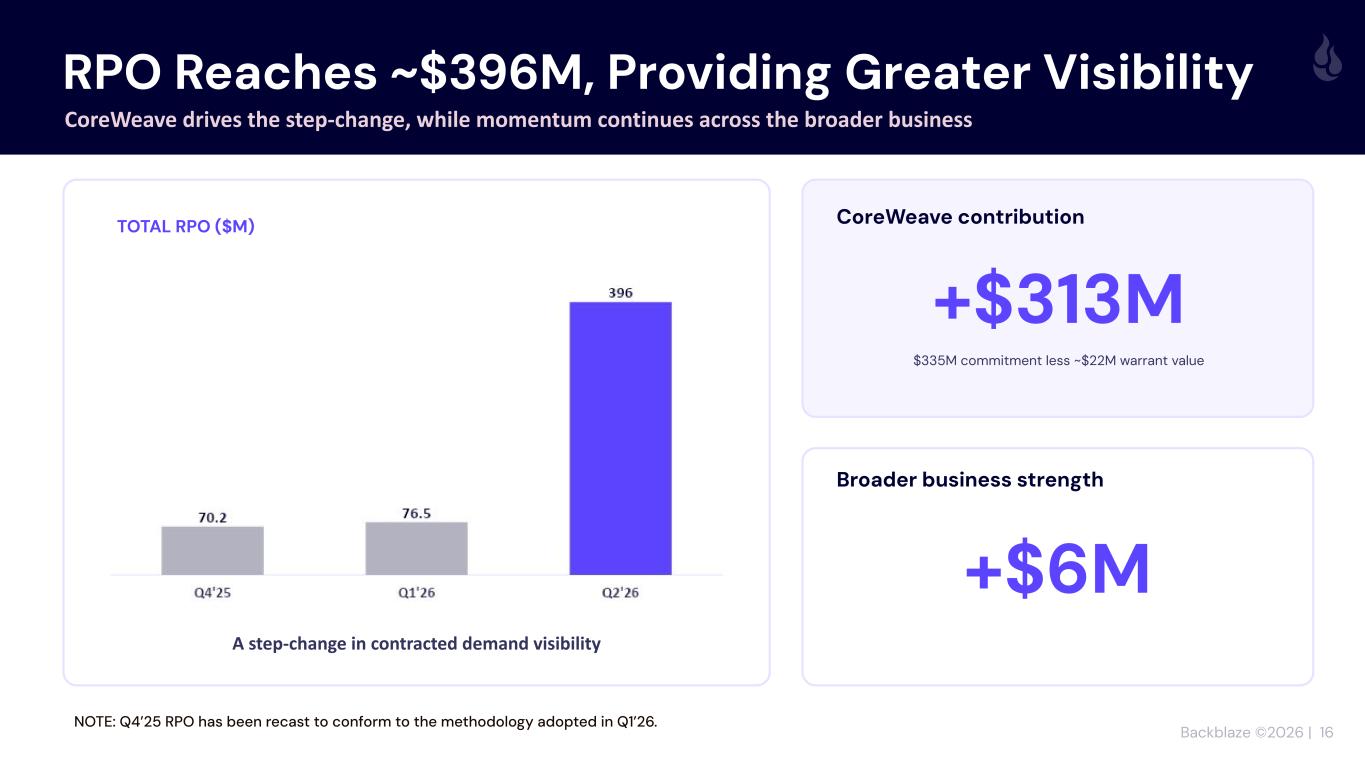
Backblaze ©2026 | 16 RPO Reaches ~$396M, Providing Greater Visibility CoreWeave drives the step-change, while momentum continues across the broader business TOTAL RPO ($M) A step-change in contracted demand visibility +$313M CoreWeave contribution $335M commitment less ~$22M warrant value Broader business strength +$6M NOTE: Q4’25 RPO has been recast to conform to the methodology adopted in Q1’26.
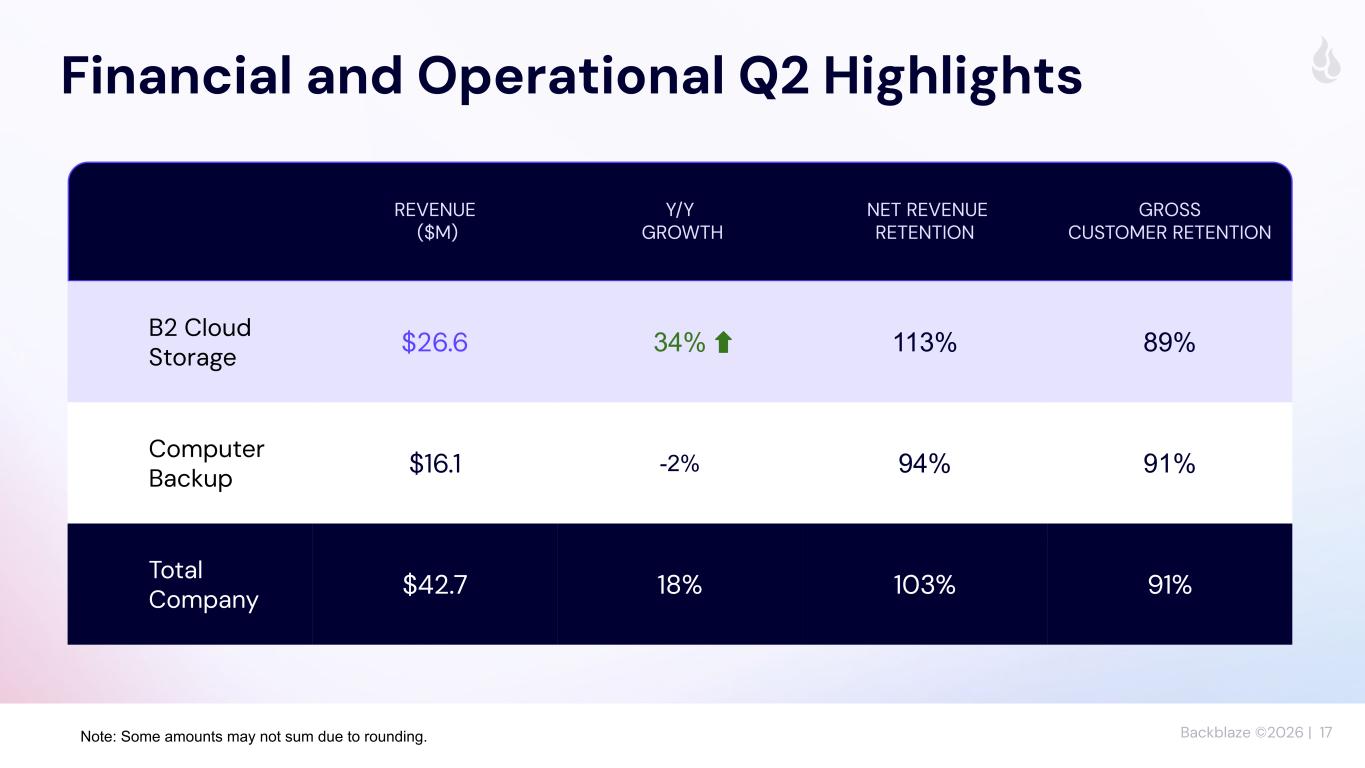
Backblaze ©2026 | 17 Financial and Operational Q2 Highlights REVENUE ($M) Y/Y GROWTH NET REVENUE RETENTION GROSS CUSTOMER RETENTION B2 Cloud Storage $26.6 34% 113% 89% Computer Backup $16.1 -2% 94% 91% Total Company $42.7 18% 103% 91% Note: Some amounts may not sum due to rounding.
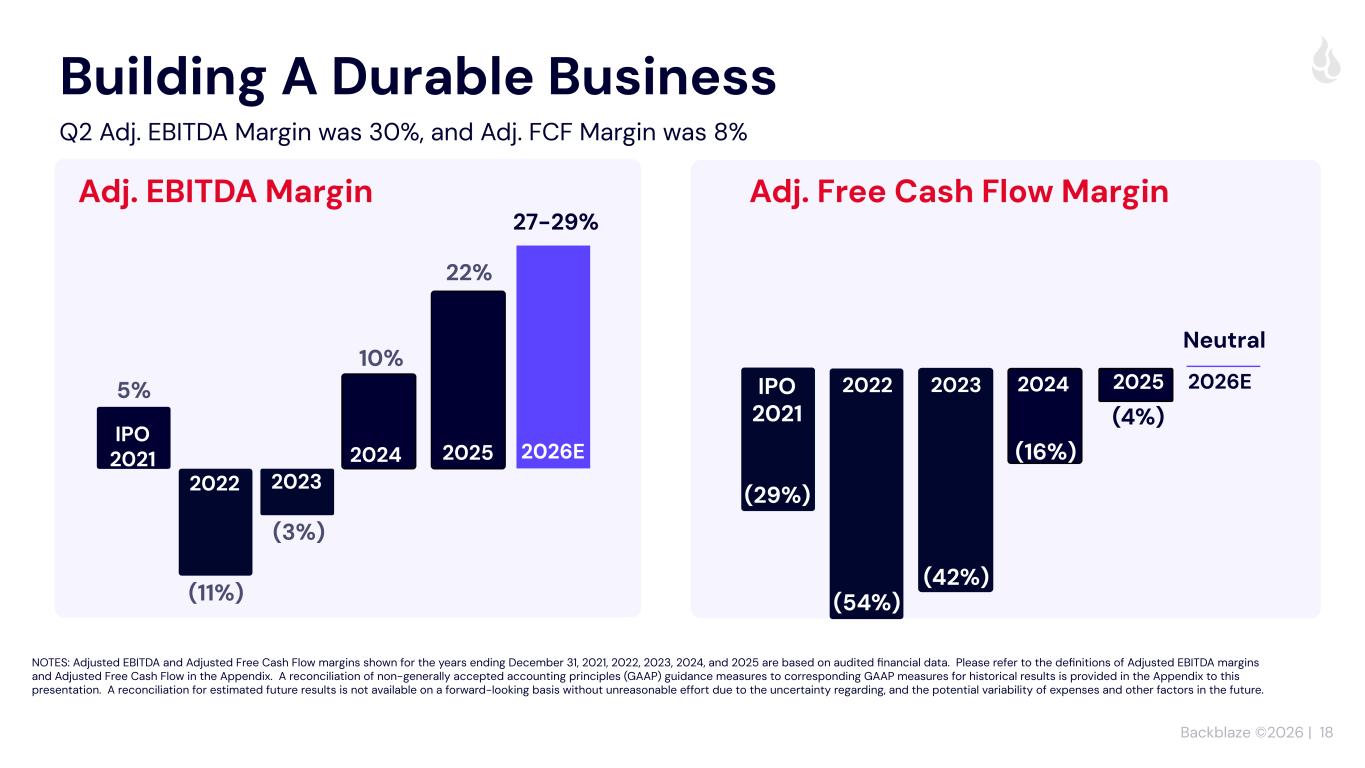
Backblaze ©2026 | 18 22% Building A Durable Business Q2 Adj. EBITDA Margin was 30%, and Adj. FCF Margin was 8% (3%) (11%) Adj. EBITDA Margin NOTES: Adjusted EBITDA and Adjusted Free Cash Flow margins shown for the years ending December 31, 2021, 2022, 2023, 2024, and 2025 are based on audited financial data. Please refer to the definitions of Adjusted EBITDA margins and Adjusted Free Cash Flow in the Appendix. A reconciliation of non-generally accepted accounting principles (GAAP) guidance measures to corresponding GAAP measures for historical results is provided in the Appendix to this presentation. A reconciliation for estimated future results is not available on a forward-looking basis without unreasonable effort due to the uncertainty regarding, and the potential variability of expenses and other factors in the future. 5% IPO 2021 2022 2023 Adj. Free Cash Flow Margin 2024 IPO 2021 2022 2023 2024 (54%) (42%) (29%) 2026E 27-29% 2026E 10% (16%)2025 2025 (4%) Neutral
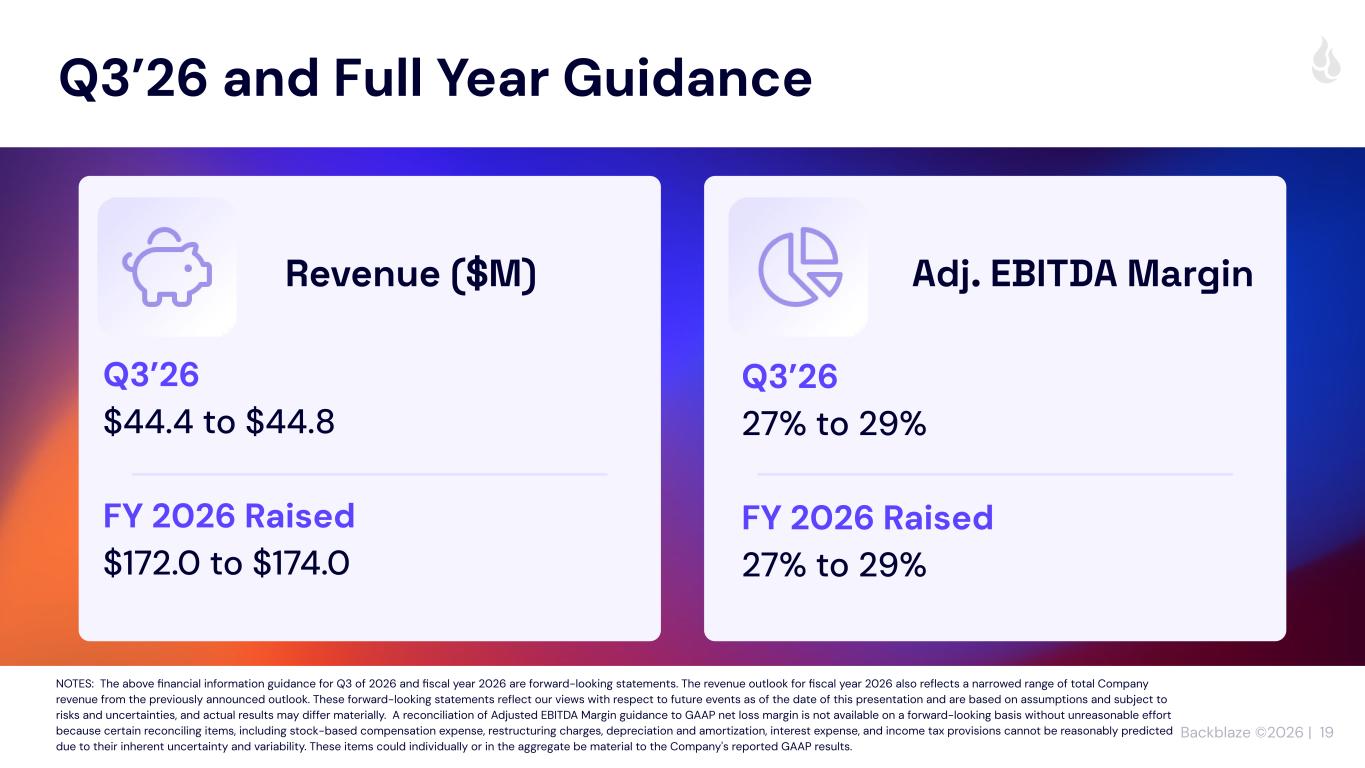
Backblaze ©2026 | 19 Q3’26 and Full Year Guidance Q3’26 $44.4 to $44.8 FY 2026 Raised $172.0 to $174.0 Q3’26 27% to 29% FY 2026 Raised 27% to 29% NOTES: The above financial information guidance for Q3 of 2026 and fiscal year 2026 are forward-looking statements. The revenue outlook for fiscal year 2026 also reflects a narrowed range of total Company revenue from the previously announced outlook. These forward-looking statements reflect our views with respect to future events as of the date of this presentation and are based on assumptions and subject to risks and uncertainties, and actual results may differ materially. A reconciliation of Adjusted EBITDA Margin guidance to GAAP net loss margin is not available on a forward-looking basis without unreasonable effort because certain reconciling items, including stock-based compensation expense, restructuring charges, depreciation and amortization, interest expense, and income tax provisions cannot be reasonably predicted due to their inherent uncertainty and variability. These items could individually or in the aggregate be material to the Company's reported GAAP results. Revenue ($M) Adj. EBITDA Margin
Backblaze ©2026 | 20 Q&A
Backblaze ©2026 | 21 Thank You!

Backblaze ©2026 | 22 Appendix
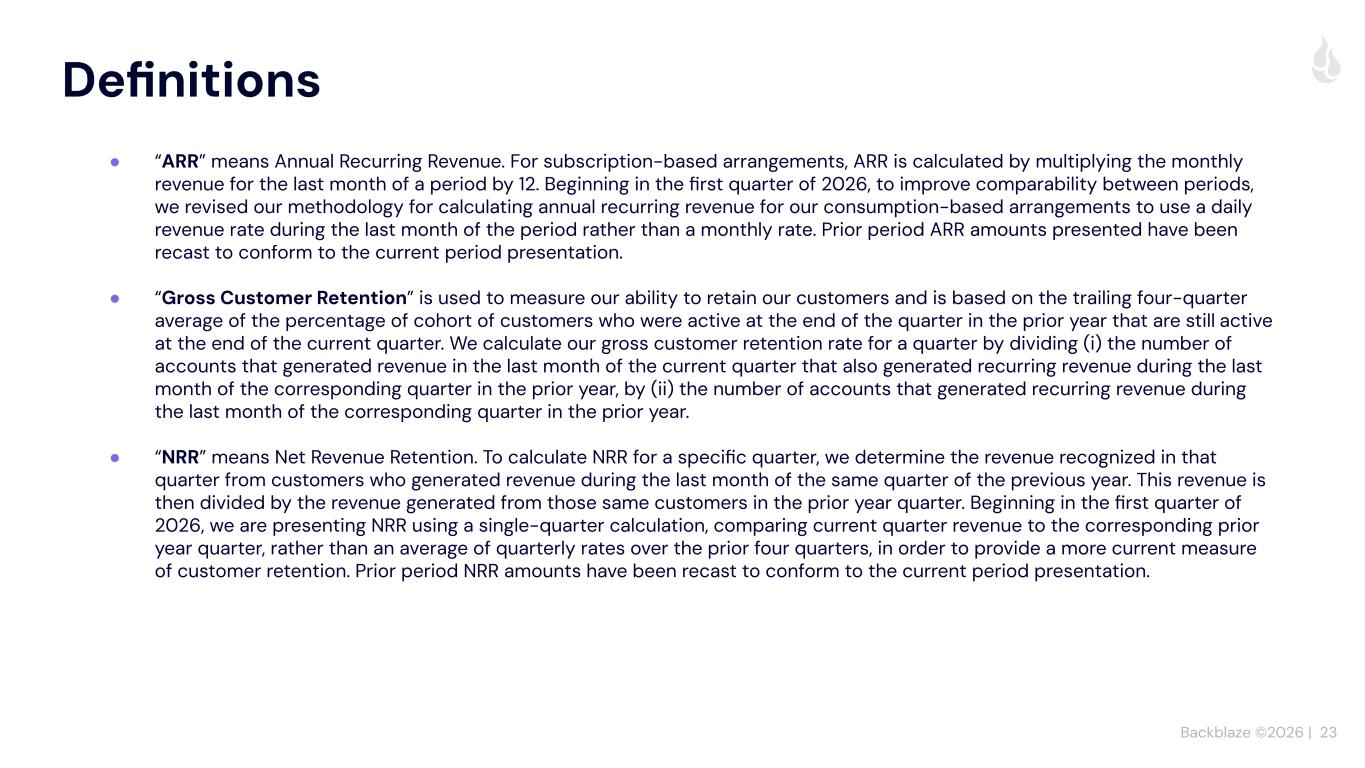
Backblaze ©2026 | 23 ● “ARR” means Annual Recurring Revenue. For subscription-based arrangements, ARR is calculated by multiplying the monthly revenue for the last month of a period by 12. Beginning in the first quarter of 2026, to improve comparability between periods, we revised our methodology for calculating annual recurring revenue for our consumption-based arrangements to use a daily revenue rate during the last month of the period rather than a monthly rate. Prior period ARR amounts presented have been recast to conform to the current period presentation. ● “Gross Customer Retention” is used to measure our ability to retain our customers and is based on the trailing four-quarter average of the percentage of cohort of customers who were active at the end of the quarter in the prior year that are still active at the end of the current quarter. We calculate our gross customer retention rate for a quarter by dividing (i) the number of accounts that generated revenue in the last month of the current quarter that also generated recurring revenue during the last month of the corresponding quarter in the prior year, by (ii) the number of accounts that generated recurring revenue during the last month of the corresponding quarter in the prior year. ● “NRR” means Net Revenue Retention. To calculate NRR for a specific quarter, we determine the revenue recognized in that quarter from customers who generated revenue during the last month of the same quarter of the previous year. This revenue is then divided by the revenue generated from those same customers in the prior year quarter. Beginning in the first quarter of 2026, we are presenting NRR using a single-quarter calculation, comparing current quarter revenue to the corresponding prior year quarter, rather than an average of quarterly rates over the prior four quarters, in order to provide a more current measure of customer retention. Prior period NRR amounts have been recast to conform to the current period presentation. Definitions
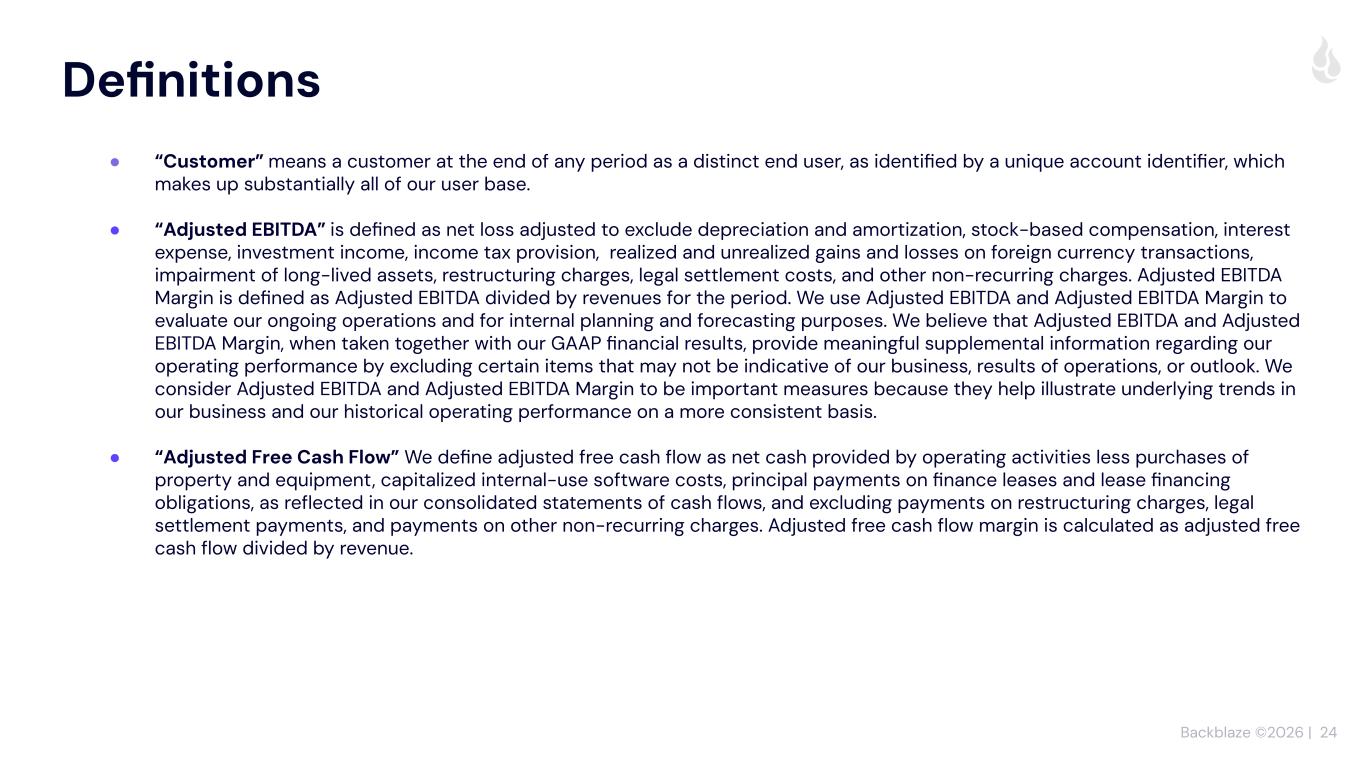
Backblaze ©2026 | 24 ● “Customer” means a customer at the end of any period as a distinct end user, as identified by a unique account identifier, which makes up substantially all of our user base. ● “Adjusted EBITDA” is defined as net loss adjusted to exclude depreciation and amortization, stock-based compensation, interest expense, investment income, income tax provision, realized and unrealized gains and losses on foreign currency transactions, impairment of long-lived assets, restructuring charges, legal settlement costs, and other non-recurring charges. Adjusted EBITDA Margin is defined as Adjusted EBITDA divided by revenues for the period. We use Adjusted EBITDA and Adjusted EBITDA Margin to evaluate our ongoing operations and for internal planning and forecasting purposes. We believe that Adjusted EBITDA and Adjusted EBITDA Margin, when taken together with our GAAP financial results, provide meaningful supplemental information regarding our operating performance by excluding certain items that may not be indicative of our business, results of operations, or outlook. We consider Adjusted EBITDA and Adjusted EBITDA Margin to be important measures because they help illustrate underlying trends in our business and our historical operating performance on a more consistent basis. ● “Adjusted Free Cash Flow” We define adjusted free cash flow as net cash provided by operating activities less purchases of property and equipment, capitalized internal-use software costs, principal payments on finance leases and lease financing obligations, as reflected in our consolidated statements of cash flows, and excluding payments on restructuring charges, legal settlement payments, and payments on other non-recurring charges. Adjusted free cash flow margin is calculated as adjusted free cash flow divided by revenue. Definitions
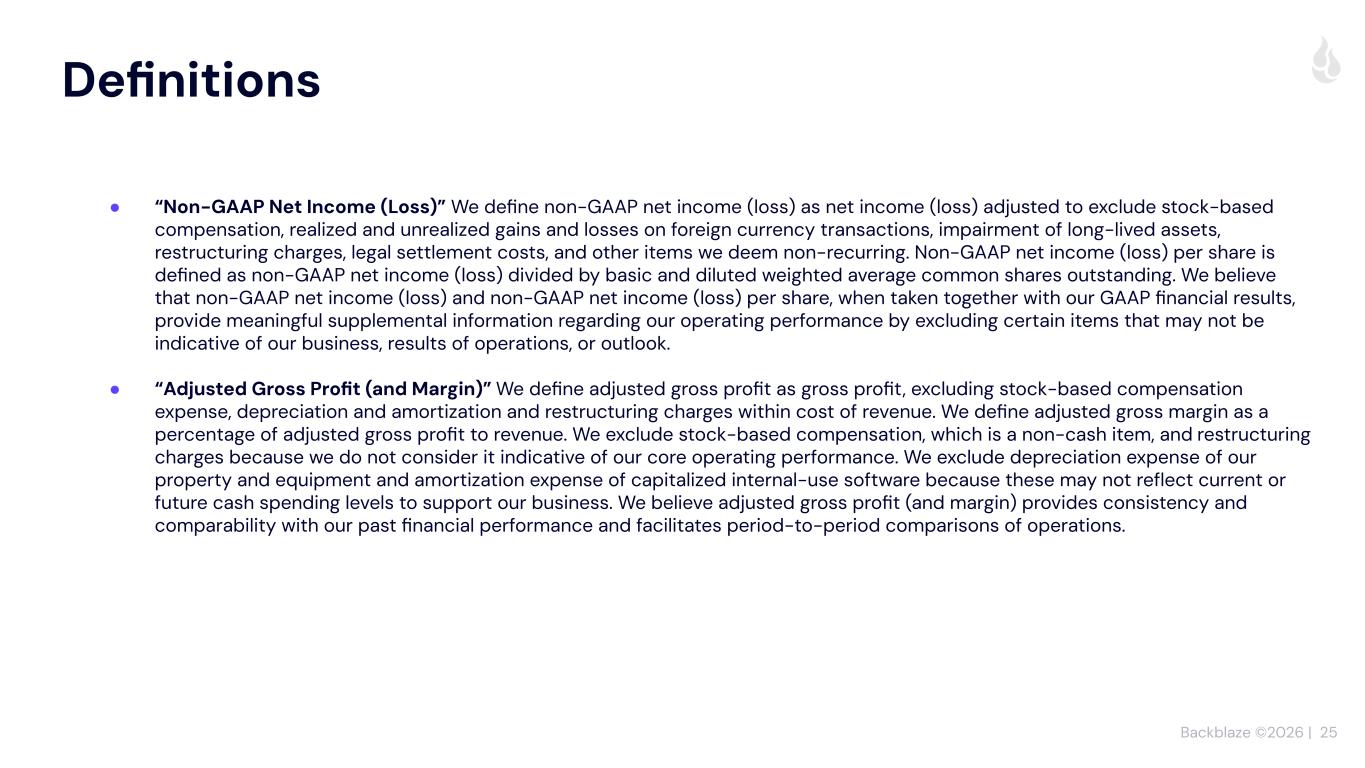
Backblaze ©2026 | 25 ● “Non-GAAP Net Income (Loss)” We define non-GAAP net income (loss) as net income (loss) adjusted to exclude stock-based compensation, realized and unrealized gains and losses on foreign currency transactions, impairment of long-lived assets, restructuring charges, legal settlement costs, and other items we deem non-recurring. Non-GAAP net income (loss) per share is defined as non-GAAP net income (loss) divided by basic and diluted weighted average common shares outstanding. We believe that non-GAAP net income (loss) and non-GAAP net income (loss) per share, when taken together with our GAAP financial results, provide meaningful supplemental information regarding our operating performance by excluding certain items that may not be indicative of our business, results of operations, or outlook. ● “Adjusted Gross Profit (and Margin)” We define adjusted gross profit as gross profit, excluding stock-based compensation expense, depreciation and amortization and restructuring charges within cost of revenue. We define adjusted gross margin as a percentage of adjusted gross profit to revenue. We exclude stock-based compensation, which is a non-cash item, and restructuring charges because we do not consider it indicative of our core operating performance. We exclude depreciation expense of our property and equipment and amortization expense of capitalized internal-use software because these may not reflect current or future cash spending levels to support our business. We believe adjusted gross profit (and margin) provides consistency and comparability with our past financial performance and facilitates period-to-period comparisons of operations. Definitions
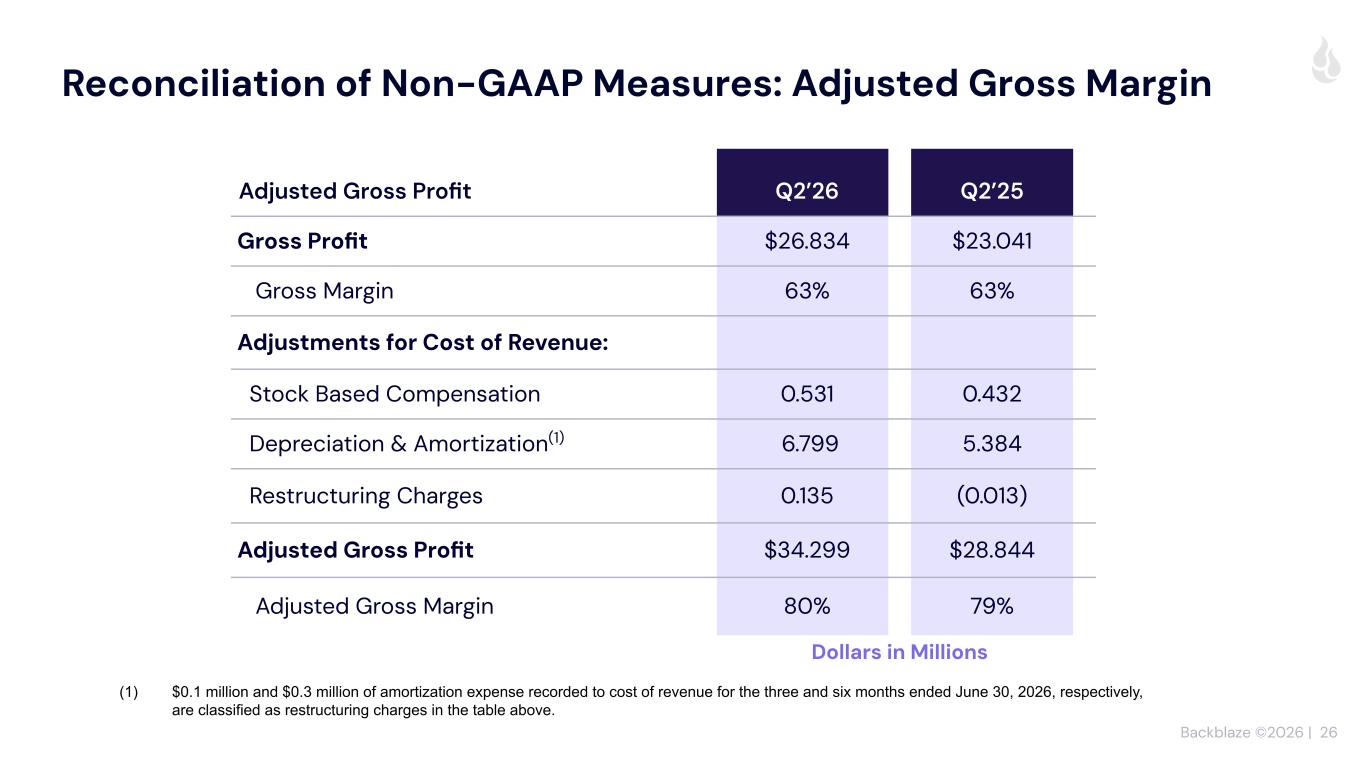
Backblaze ©2026 | 26 Reconciliation of Non-GAAP Measures: Adjusted Gross Margin Adjusted Gross Profit Q2’26 Q2’25 Gross Profit $26.834 $23.041 Gross Margin 63% 63% Adjustments for Cost of Revenue: Stock Based Compensation 0.531 0.432 Depreciation & Amortization(1) 6.799 5.384 Restructuring Charges 0.135 (0.013) Adjusted Gross Profit $34.299 $28.844 Adjusted Gross Margin 80% 79% Dollars in Millions (1) $0.1 million and $0.3 million of amortization expense recorded to cost of revenue for the three and six months ended June 30, 2026, respectively, are classified as restructuring charges in the table above.
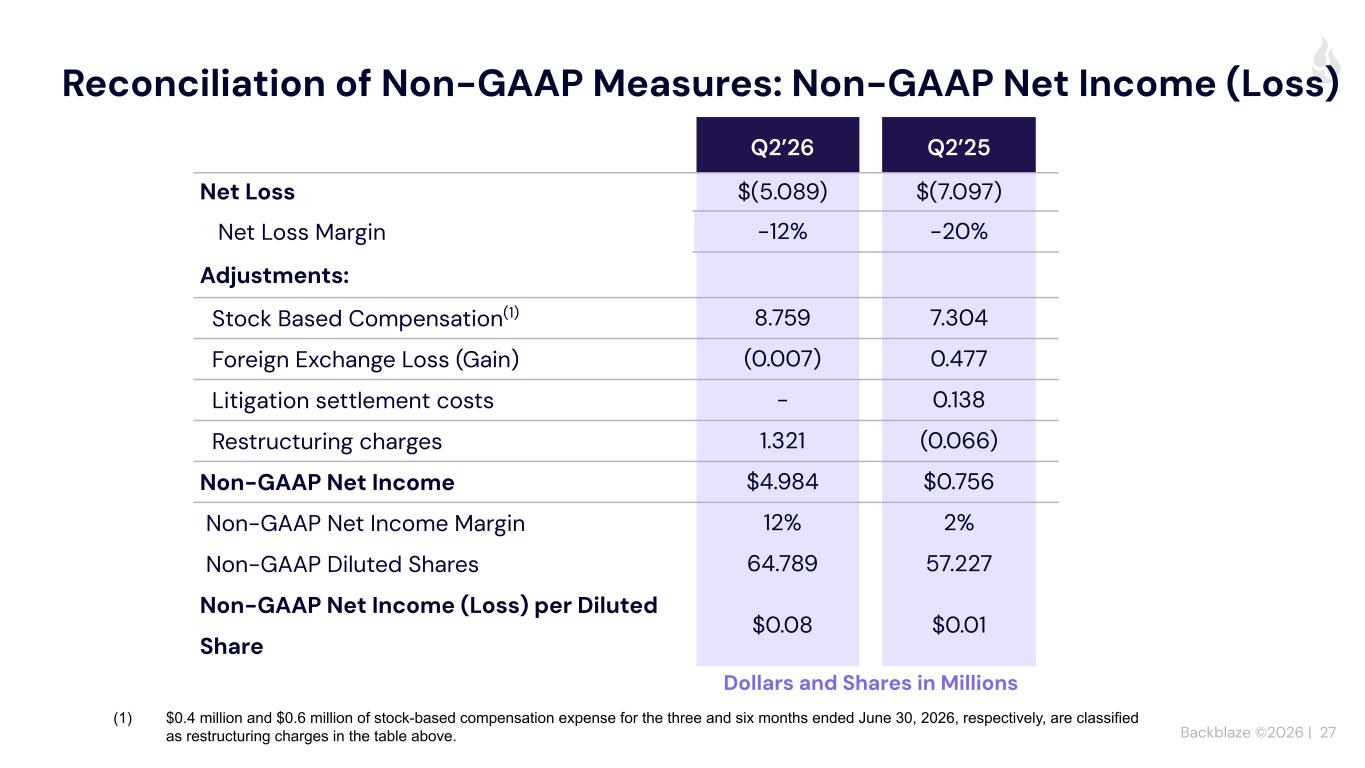
Backblaze ©2026 | 27 Reconciliation of Non-GAAP Measures: Non-GAAP Net Income (Loss) Q2’26 Q2’25 Net Loss $(5.089) $(7.097) Net Loss Margin -12% -20% Adjustments: Stock Based Compensation(1) 8.759 7.304 Foreign Exchange Loss (Gain) (0.007) 0.477 Litigation settlement costs - 0.138 Restructuring charges 1.321 (0.066) Non-GAAP Net Income $4.984 $0.756 Non-GAAP Net Income Margin 12% 2% Non-GAAP Diluted Shares 64.789 57.227 Non-GAAP Net Income (Loss) per Diluted Share $0.08 $0.01 Dollars and Shares in Millions (1) $0.4 million and $0.6 million of stock-based compensation expense for the three and six months ended June 30, 2026, respectively, are classified as restructuring charges in the table above.
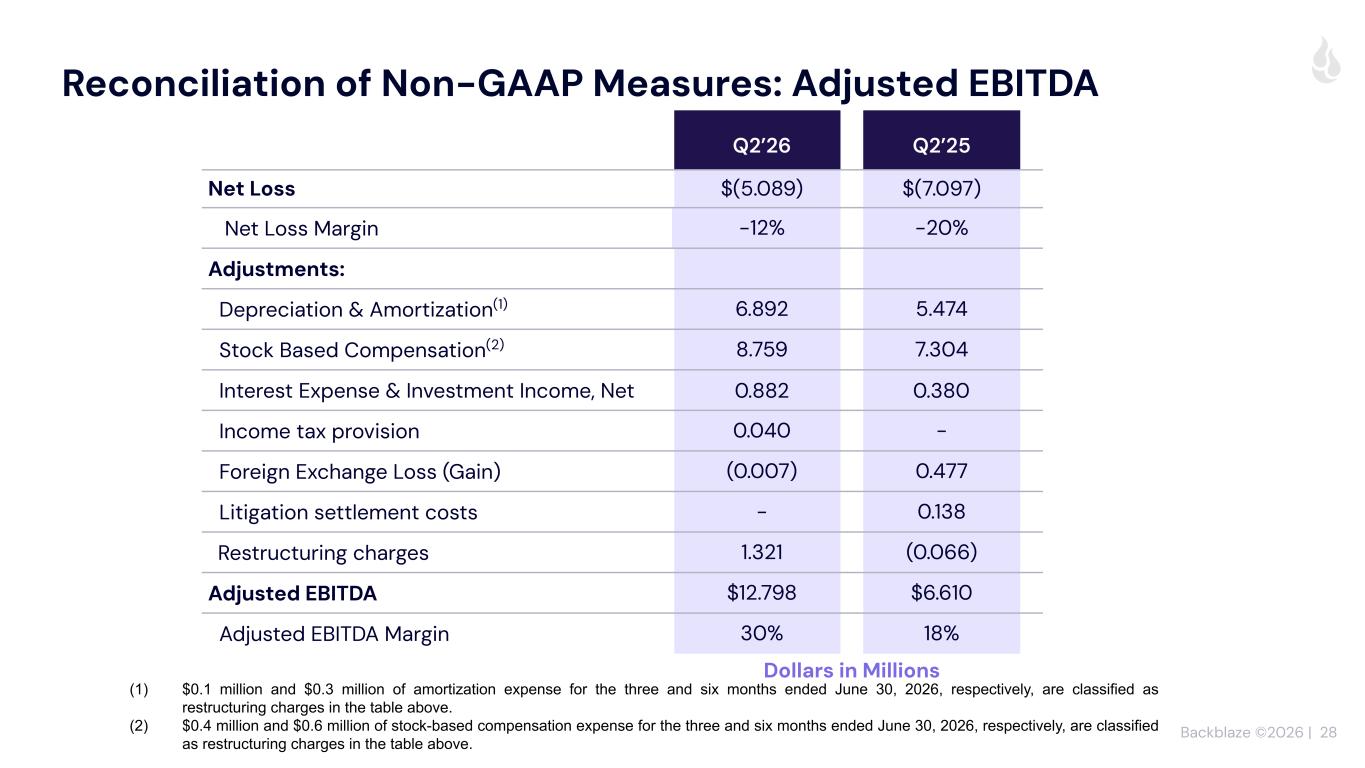
Backblaze ©2026 | 28 Reconciliation of Non-GAAP Measures: Adjusted EBITDA Q2’26 Q2’25 Net Loss $(5.089) $(7.097) Net Loss Margin -12% -20% Adjustments: Depreciation & Amortization(1) 6.892 5.474 Stock Based Compensation(2) 8.759 7.304 Interest Expense & Investment Income, Net 0.882 0.380 Income tax provision 0.040 - Foreign Exchange Loss (Gain) (0.007) 0.477 Litigation settlement costs - 0.138 Restructuring charges 1.321 (0.066) Adjusted EBITDA $12.798 $6.610 Adjusted EBITDA Margin 30% 18% Dollars in Millions (1) $0.1 million and $0.3 million of amortization expense for the three and six months ended June 30, 2026, respectively, are classified as restructuring charges in the table above. (2) $0.4 million and $0.6 million of stock-based compensation expense for the three and six months ended June 30, 2026, respectively, are classified as restructuring charges in the table above.
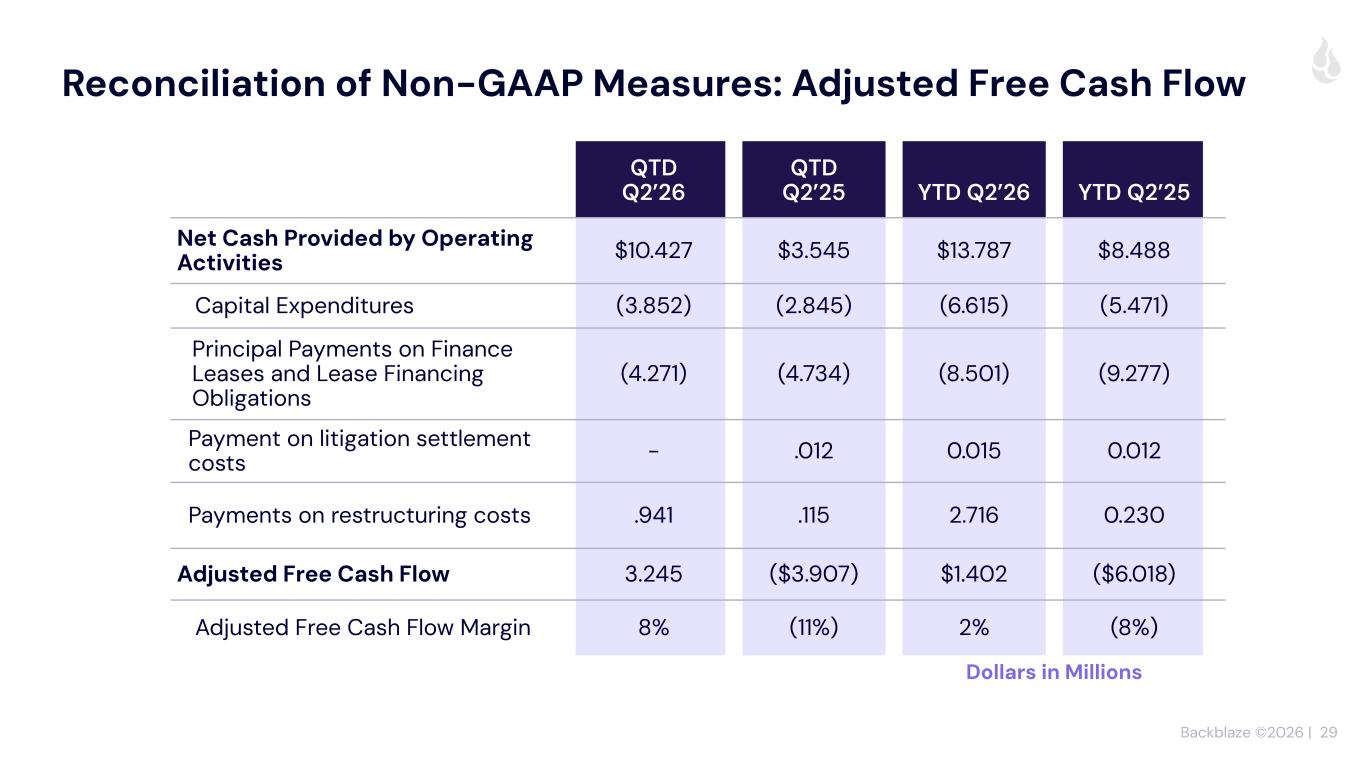
Backblaze ©2026 | 29 Reconciliation of Non-GAAP Measures: Adjusted Free Cash Flow QTD Q2’26 QTD Q2’25 YTD Q2’26 YTD Q2’25 Net Cash Provided by Operating Activities $10.427 $3.545 $13.787 $8.488 Capital Expenditures (3.852) (2.845) (6.615) (5.471) Principal Payments on Finance Leases and Lease Financing Obligations (4.271) (4.734) (8.501) (9.277) Payment on litigation settlement costs - .012 0.015 0.012 Payments on restructuring costs .941 .115 2.716 0.230 Adjusted Free Cash Flow 3.245 ($3.907) $1.402 ($6.018) Adjusted Free Cash Flow Margin 8% (11%) 2% (8%) Dollars in Millions