
.2 4Q25 EARNINGS REPORT PennyMac Mortgage Investment Trust January 2026
FORWARD LOOKING STATEMENTS This presentation contains forward-looking statements within the meaning of Section 21E of the Securities Exchange Act of 1934, as amended, regarding management’s beliefs, estimates, projections and assumptions with respect to, among other things, the Company’s financial results, future operations, business plans and investment strategies, as well as industry and market conditions, all of which are subject to change. Words like “believe,” “expect,” “anticipate,” “promise,” “plan,” and other expressions or words of similar meanings, as well as future or conditional verbs such as “will,” “would,” “should,” “could,” or “may” are generally intended to identify forward-looking statements. Actual results and operations for any future period may vary materially from those projected herein and from past results discussed herein. These forward-looking statements include, but are not limited to, statements regarding future changes in interest rates, housing, and prepayment rates; future loan originations and production; future loan delinquencies, defaults and forbearances; future investment and hedge expenses; future investment strategies, future earnings and return on equity as well as other business and financial expectations. Factors which could cause actual results to differ materially from historical results or those anticipated include, but are not limited to: changes in interest rates; changes in macroeconomic, consumer and real estate market conditions; changes in housing prices, housing sales and real estate values; t changes in homeownership costs and affordability; compliance with changing federal, state and local laws and regulations that govern its business; the general economy or the real estate finance and real estate markets; events or circumstances which undermine confidence in the financial and housing markets or otherwise have a broad impact on financial and housing markets; the degree and nature of the Company’s competition; the availability of, and level of competition for, attractive risk adjusted investment opportunities in mortgage loans and mortgage related assets that satisfy the Company’s investment objectives; the concentration of credit risks to which the Company is exposed; the Company’s dependence on and potential conflicts with its manager, servicer and their affiliates; the Company’s ability to mitigate cybersecurity risks, cybersecurity incidents and technology disruptions; the development of artificial intelligence; the availability, terms and deployment of short term and long term capital; the adequacy of the Company’s cash reserves and working capital; the Company’s ability to maintain the desired relationship between its financing and the interest rates and maturities of its assets; the timing and amount of cash flows, if any, from the Company’ s investments; the Company’s engagement in private loan securitizations; the Company’s substantial amount of indebtedness; the performance, financial condition and liquidity of borrowers; the Company’s exposure to risks of loss from severe weather events, man-made or other natural conditions, including climate change and pandemics; the ability of the Company’s servicer, which also provides the Company with fulfillment services, to approve and monitor correspondent sellers and underwrite loans to investor standards; incomplete or inaccurate information or documentation provided by customers or counterparties, or adverse changes in the financial condition of the Company’s customers and counterparties; the Company’s indemnification and repurchase obligations in connection with mortgage loans it purchases and later sells or securitizes; the quality and enforceability of the collateral documentation evidencing the Company’ s ownership and rights in the assets in which it invests; increased rates of delinquency, defaults and forbearances and/or decreased recovery rates on the Company’s investments; the performance of mortgage loans underlying mortgage backed securities or other investments in which the Company retains credit risk; the Company’s ability to foreclose on its investments in a timely manner or at all; increased prepayments of the mortgages and other loans underlying the Company’s mortgage backed securities or relating to the Company’s mortgage servicing rights and other investments; risks associated with the discontinuation of LIBOR; the degree to which the Company’s hedging strategies may or may not protect it from interest rate volatility; the accuracy or changes in the estimates the Company makes about uncertainties, contingencies and asset and liability valuations; the Company’s ability to maintain appropriate internal control over financial reporting; the Company’s ability to detect misconduct and fraud; developments in the secondary markets for the Company’s mortgage loan products; legislative and regulatory changes that impact the mortgage loan industry or housing market regulatory or other changes that impact government agencies or government sponsored entities, or such changes that increase the cost of doing business with such agencies or entities; federal and state mortgage regulations and enforcement; changes in government support of homeownership and affordability programs; changes in the Company’s investment objectives or investment or operational strategies; limitations imposed on the Company’s business and its ability to satisfy complex rules for it to qualify as a REIT for U.S. federal income tax purposes and qualify for an exclusion from the Investment Company Act of 1940 and the ability of certain of the Company’s subsidiaries to qualify as REITs or as taxable REIT subsidiaries for U.S. federal income tax purposes; changes in governmental regulations, accounting treatment, tax rates and similar matters; the Company’s ability to make distributions to its shareholders in the future; the Company’s failure to deal appropriately with issues that may give rise to reputational risk; and the Company’s organizational structure and certain requirements in its charter documents. You should not place undue reliance on any forward-looking statement and should consider all of the uncertainties and risks described above, as well as those more fully discussed in reports and other documents filed by the Company with the Securities and Exchange Commission from time to time. The Company undertakes no obligation to publicly update or revise any forward-looking statements or any other information contained herein, and the statements made in this presentation are current as of the date of this presentation only. This presentation contains financial information calculated other than in accordance with U.S. generally accepted accounting principles (“GAAP”), such as income excluding market driven value changes and leverage ratios that provide a meaningful perspective on the Company’s business results since the Company utilizes this information to evaluate and manage the business. Non-GAAP disclosures have limitations as an analytical tool and should not be viewed as a substitute for financial information determined in accordance with GAAP. 2
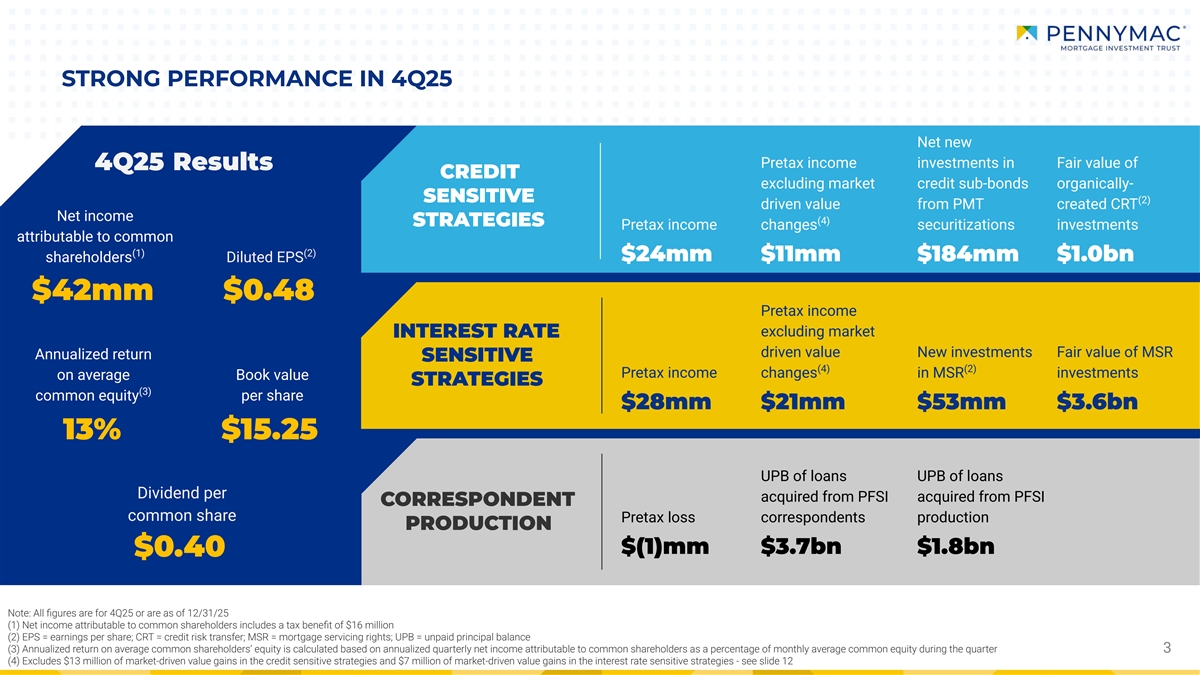
S STRONG P TRONG PERF ERFORMANCE IN 4 ORMANCE IN 4Q Q25 25 Net new Net new Pr Pretax income etax income inv investments in estments in F Fair v air value of alue of 4 4Q Q25 25 Results Results CREDIT CREDIT ex excluding mark cluding market et cr credit sub-bonds edit sub-bonds or organically- ganically- SENSITI SENSITIV VE E (2) (2) driv driven v en value alue fr from PM om PMT T cr created CR eated CRT T Net income (4) (4) S STRA TRATEGIES TEGIES Pr Pretax income etax income changes changes securitizations securitizations inv investments estments attributable to common Net income (1) (2) $24mm $24mm $ $11mm 11mm $ $184mm 184mm $ $1. 1.0bn 0bn shareholders Diluted EPS attributable to common (1) (2) shareholders Diluted EPS $42mm $0.48 Pr Pretax income etax income $42mm $0.48 ex excluding mark cluding market et INTERES INTEREST RA T RATE TE driv driven v en value alue New inv New investments estments F Fair v air value of MSR alue of MSR Annualized return SENSITI SENSITIV VE E (4) (4) (2) (2) Pr Pretax income etax income changes changes in MSR in MSR inv investments estments on average Book value S STRA TRATEGIES TEGIES Return on average Book value (3) common equity per share (3) common equity per share $28mm $28mm $21mm $21mm $5 $53mm 3mm $3. $3.6bn 6bn 13% $15.25 13% $15.25 UPB of loans acquir UPB of loans ed UPB of loans UPB of loans Dividend per Dividend per fr acquir om PFSI ed from PFSI acquir acquired fr ed from PFSI om PFSI C CORRESPONDENT ORRESPONDENT common shar common share e Pr Pretax loss etax loss corr correspondents espondents pr production oduction P PRODUC RODUCTION TION $( $(1)mm 1)mm $3. $3.7bn 7bn $ $1. 1.8bn 8bn $0 $0. .40 40 Note: All figures are for 4Q25 or are as of 12/31/25 (1) Net income attributable to common shareholders includes a tax benefit of $16 million (2) EPS = earnings per share; CRT = credit risk transfer; MSR = mortgage servicing rights; UPB = unpaid principal balance (3) Annualized return on average common shareholders’ equity is calculated based on annualized quarterly net income attributable to common shareholders as a percentage of monthly average common equity during the quarter 3 3 3 (4) Excludes $13 million of market-driven value gains in the credit sensitive strategies and $7 million of market-driven value gains in the interest rate sensitive strategies - see slide 12
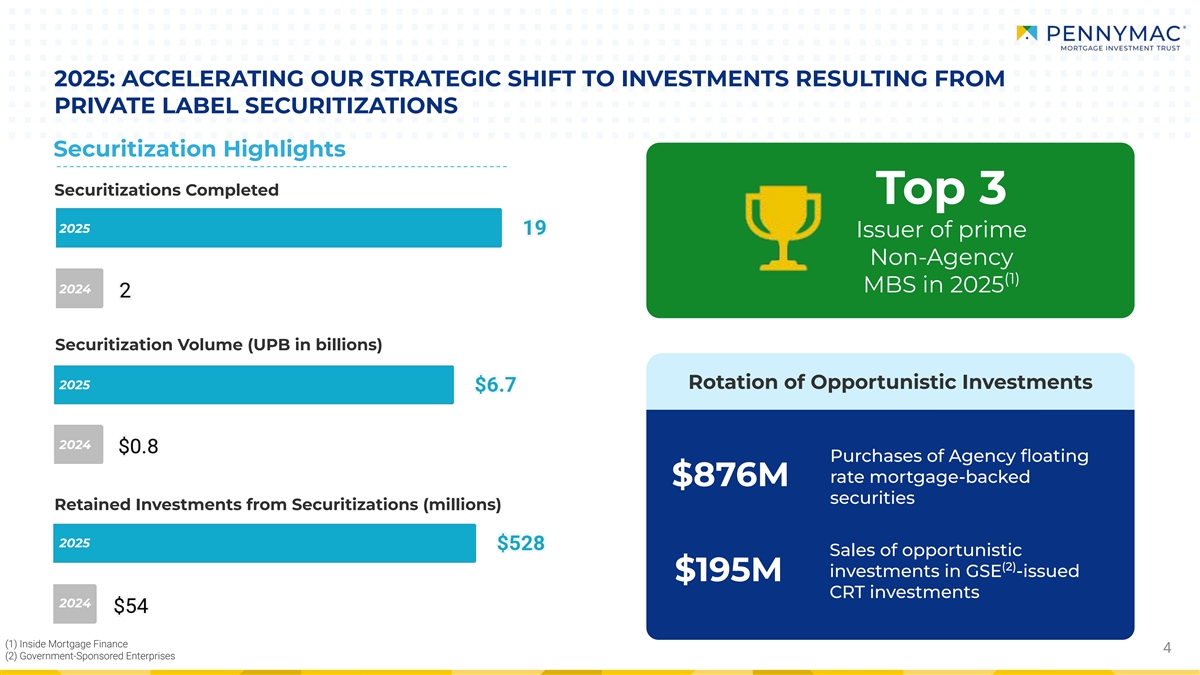
2025: ACCELERATING OUR STRATEGIC SHIFT TO INVESTMENTS RESULTING FROM PRIVATE LABEL SECURITIZATIONS Securitization Highlights Securitizations Completed Top 3 2025 Issuer of prime Non-Agency (1) MBS in 2025 2024 Securitization Volume (UPB in billions) Rotation of Opportunistic Investments 2025 2024 Purchases of Agency floating rate mortgage-backed $876M securities Retained Investments from Securitizations (millions) 2025 Sales of opportunistic (2) investments in GSE -issued $195M CRT investments 2024 2024 (1) Inside Mortgage Finance 4 (2) Government-Sponsored Enterprises

4Q25 STRATEGIC UPDATE
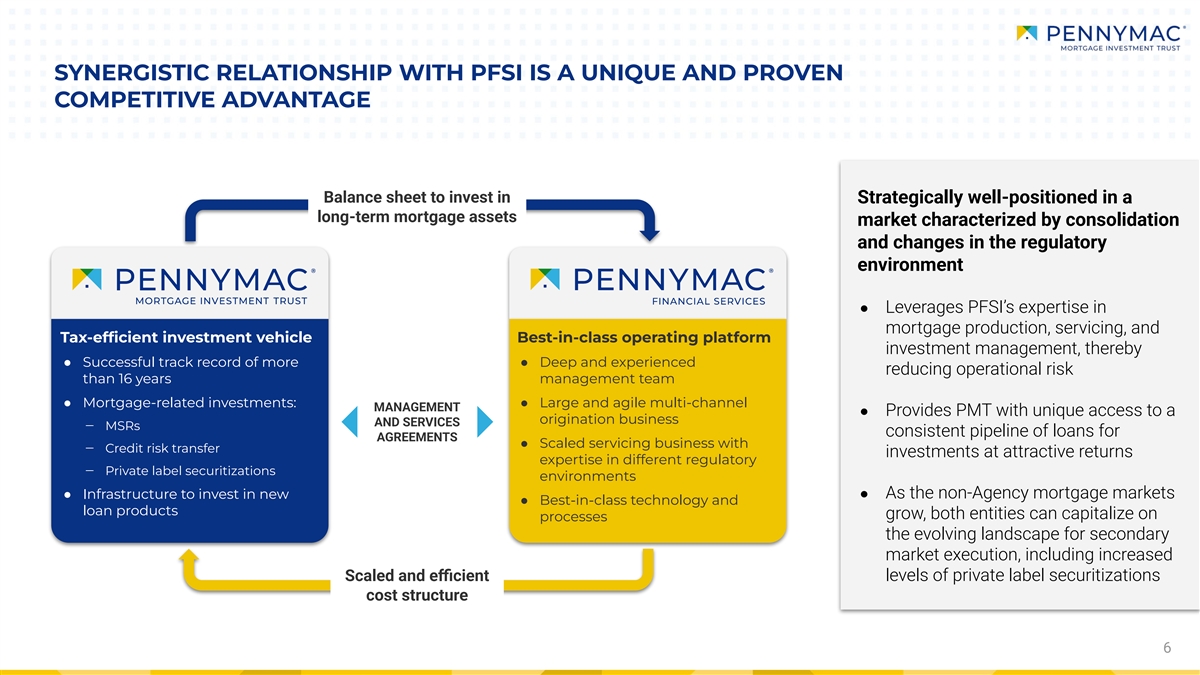
SYNERGISTIC RELATIONSHIP WITH PFSI IS A UNIQUE AND PROVEN COMPETITIVE ADVANTAGE Balance sheet to invest in Strategically well-positioned in a long-term mortgage assets market characterized by consolidation and changes in the regulatory environment ● Leverages PFSI’s expertise in mortgage production, servicing, and Tax-efficient investment vehicle Best-in-class operating platform investment management, thereby ● Successful track record of more ● Deep and experienced reducing operational risk than 16 years management team ● Mortgage-related investments:● Large and agile multi-channel MANAGEMENT ● Provides PMT with unique access to a origination business AND SERVICES ‒ MSRs consistent pipeline of loans for AGREEMENTS ● Scaled servicing business with ‒ Credit risk transfer investments at attractive returns expertise in different regulatory ‒ Private label securitizations environments ● Infrastructure to invest in new ● As the non-Agency mortgage markets ● Best-in-class technology and loan products grow, both entities can capitalize on processes the evolving landscape for secondary market execution, including increased Scaled and efficient levels of private label securitizations cost structure 6
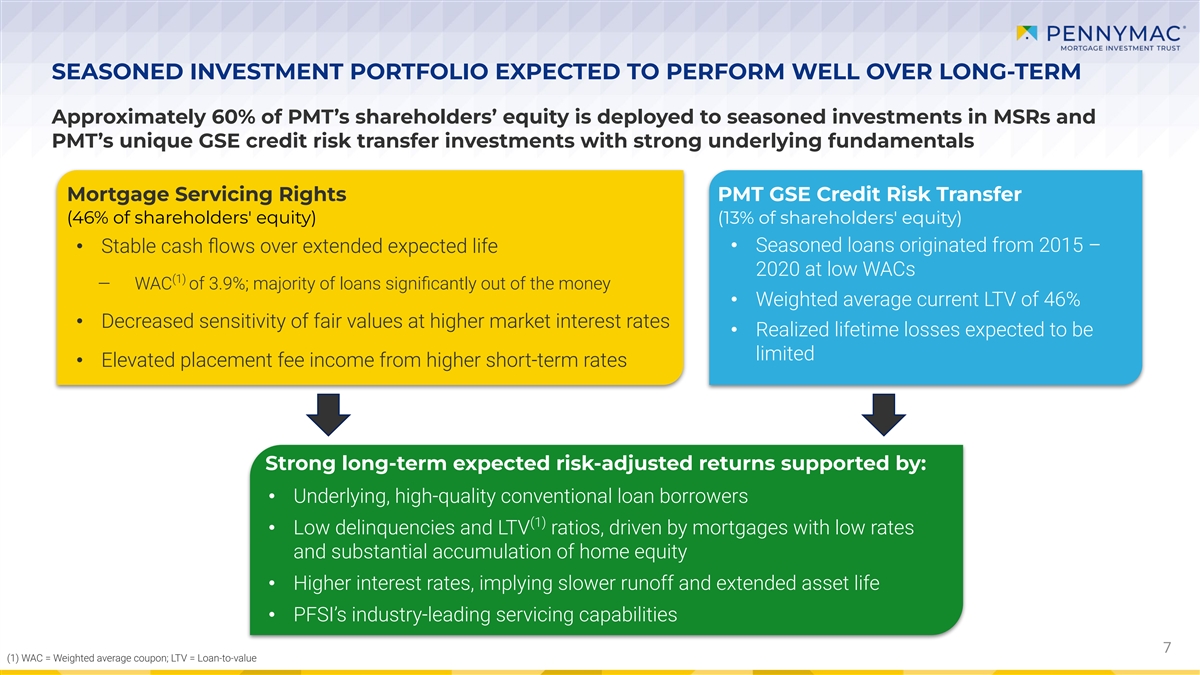
SEASONED INVESTMENT PORTFOLIO EXPECTED TO PERFORM WELL OVER LONG-TERM Approximately 60% of PMT’s shareholders’ equity is deployed to seasoned investments in MSRs and PMT’s unique GSE credit risk transfer investments with strong underlying fundamentals Mortgage Servicing Rights PMT GSE Credit Risk Transfer (46% of shareholders' equity) (13% of shareholders' equity) • Stable cash flows over extended expected life• Seasoned loans originated from 2015 – 2020 at low WACs (1) ‒ WAC of 3.9%; majority of loans significantly out of the money • Weighted average current LTV of 46% • Decreased sensitivity of fair values at higher market interest rates • Realized lifetime losses expected to be limited • Elevated placement fee income from higher short-term rates Strong long-term expected risk-adjusted returns supported by: • Underlying, high-quality conventional loan borrowers (1) • Low delinquencies and LTV ratios, driven by mortgages with low rates and substantial accumulation of home equity • Higher interest rates, implying slower runoff and extended asset life • PFSI’s industry-leading servicing capabilities 7 (1) WAC = Weighted average coupon; LTV = Loan-to-value
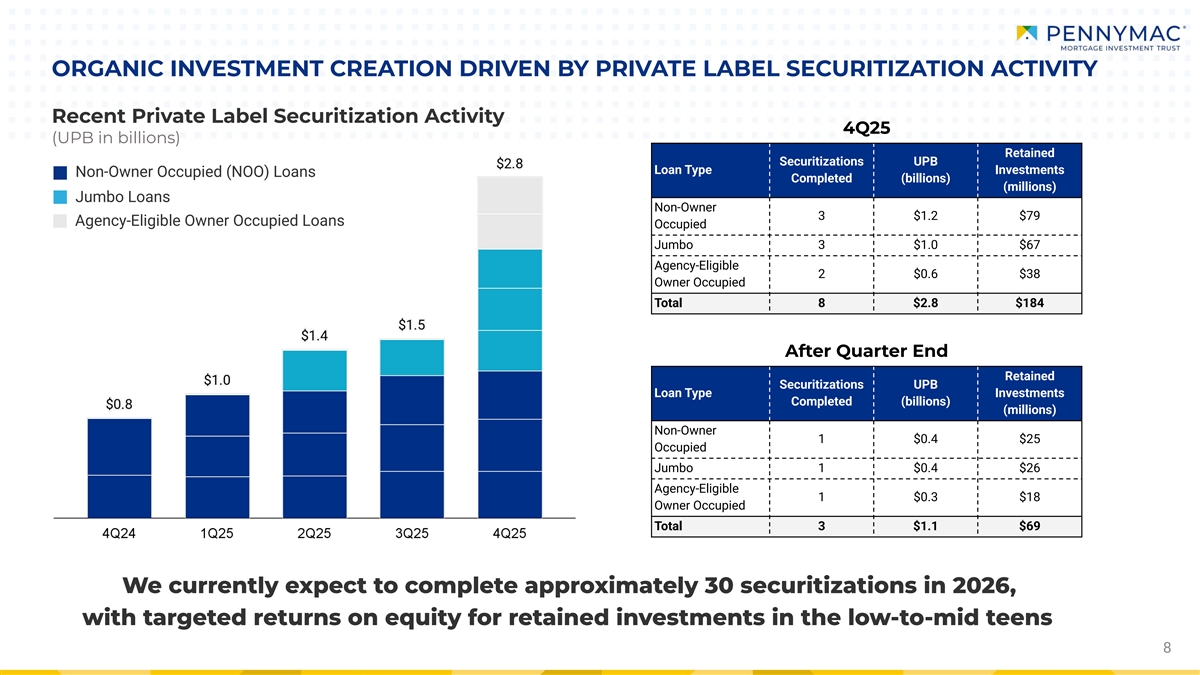
ORGANIC INVESTMENT CREATION DRIVEN BY PRIVATE LABEL SECURITIZATION ACTIVITY Recent Private Label Securitization Activity 4Q25 (UPB in billions) Retained Securitizations UPB Loan Type Investments Non-Owner Occupied (NOO) Loans Completed (billions) (millions) Jumbo Loans Non-Owner 3 $1.2 $79 Agency-Eligible Owner Occupied Loans Occupied Jumbo 3 $1.0 $67 Agency-Eligible 2 $0.6 $38 Owner Occupied Total 8 $2.8 $184 After Quarter End Retained Securitizations UPB Loan Type Investments Completed (billions) (millions) Non-Owner 1 $0.4 $25 Occupied Jumbo 1 $0.4 $26 Agency-Eligible 1 $0.3 $18 Owner Occupied Total 3 $1.1 $69 We currently expect to complete approximately 30 securitizations in 2026, with targeted returns on equity for retained investments in the low-to-mid teens 8
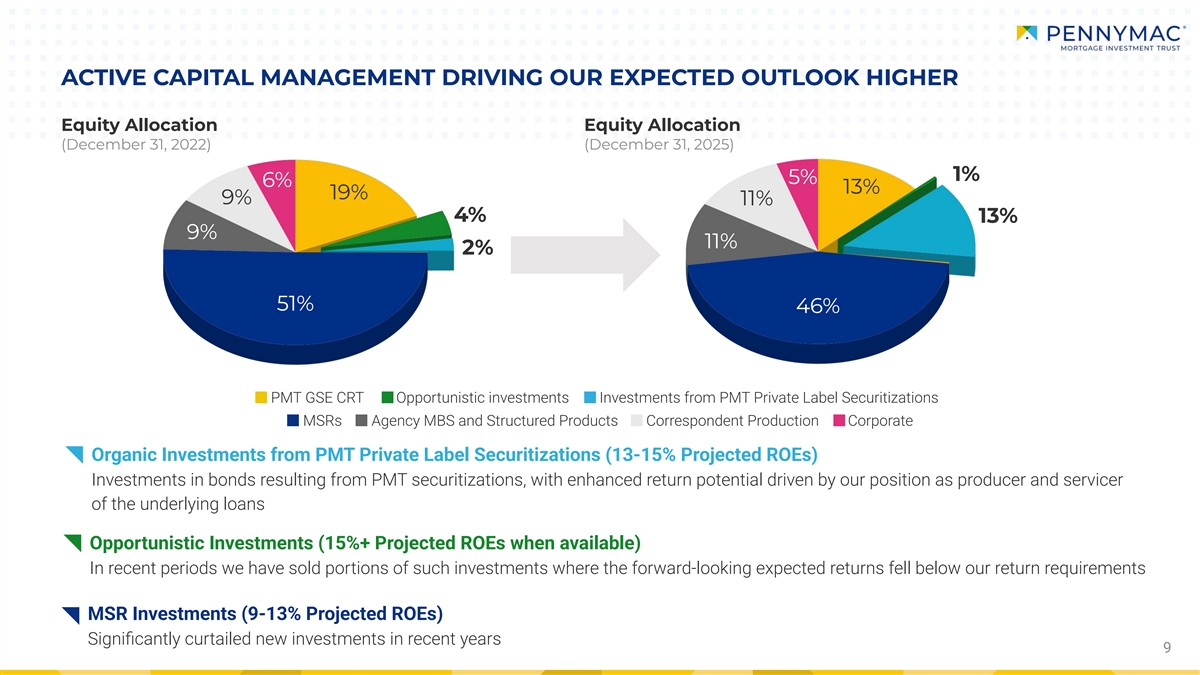
ACTIVE CAPITAL MANAGEMENT DRIVING OUR EXPECTED OUTLOOK HIGHER Equity Allocation Equity Allocation (December 31, 2022) (December 31, 2025) 1% 5% 6% 13% 19% 9% 11% 4% 13% 9% 11% 2% 51% 46% PMT GSE CRT Opportunistic investments Investments from PMT Private Label Securitizations MSRs Agency MBS and Structured Products Correspondent Production Corporate Organic Investments from PMT Private Label Securitizations (13-15% Projected ROEs) Investments in bonds resulting from PMT securitizations, with enhanced return potential driven by our position as producer and servicer of the underlying loans Opportunistic Investments (15%+ Projected ROEs when available) In recent periods we have sold portions of such investments where the forward-looking expected returns fell below our return requirements MSR Investments (9-13% Projected ROEs) Significantly curtailed new investments in recent years 9
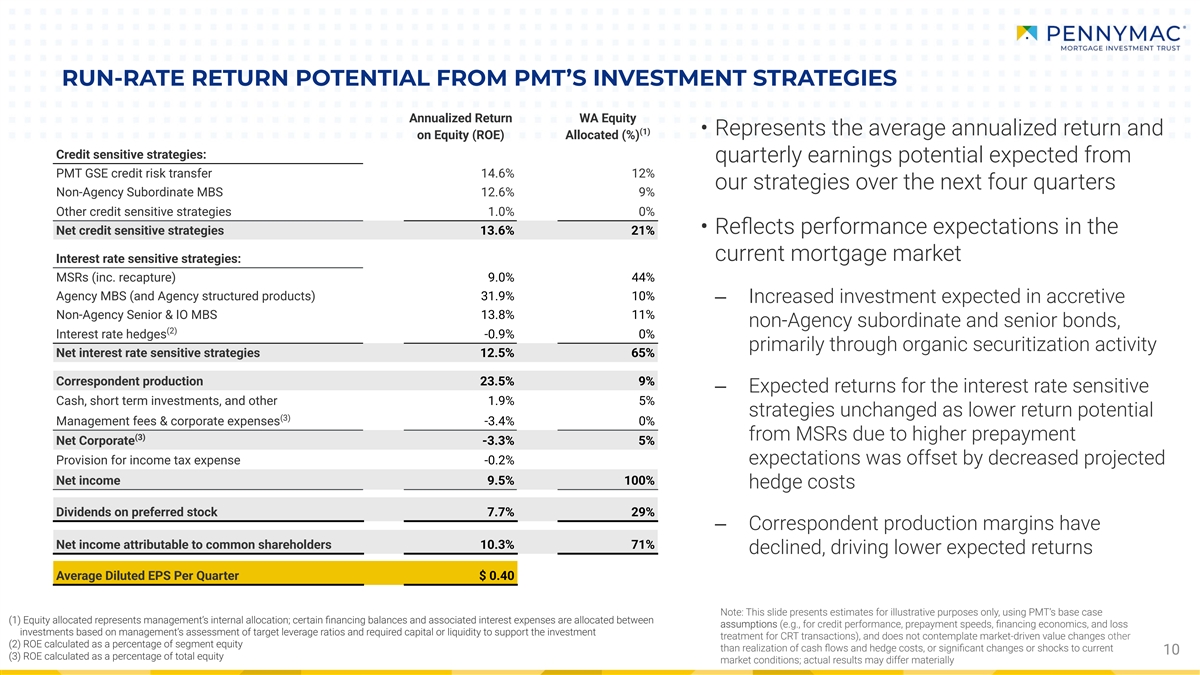
RUN-RATE RETURN POTENTIAL FROM PMT’S INVESTMENT STRATEGIES Annualized Return WA Equity (1) • Represents the average annualized return and on Equity (ROE) Allocated (%) Credit sensitive strategies: quarterly earnings potential expected from PMT GSE credit risk transfer 14.6% 12% our strategies over the next four quarters Non-Agency Subordinate MBS 12.6% 9% Other credit sensitive strategies 1.0% 0% • Reflects performance expectations in the Net credit sensitive strategies 13.6% 21% current mortgage market Interest rate sensitive strategies: MSRs (inc. recapture) 9.0% 44% Agency MBS (and Agency structured products) 31.9% 10% ‒ Increased investment expected in accretive Non-Agency Senior & IO MBS 13.8% 11% non-Agency subordinate and senior bonds, (2) Interest rate hedges -0.9% 0% primarily through organic securitization activity Net interest rate sensitive strategies 12.5% 65% Correspondent production 23.5% 9% ‒ Expected returns for the interest rate sensitive Cash, short term investments, and other 1.9% 5% strategies unchanged as lower return potential (3) Management fees & corporate expenses -3.4% 0% (3) from MSRs due to higher prepayment Net Corporate -3.3% 5% Provision for income tax expense -0.2% expectations was offset by decreased projected Net income 9.5% 100% hedge costs Dividends on preferred stock 7.7% 29% ‒ Correspondent production margins have Net income attributable to common shareholders 10.3% 71% declined, driving lower expected returns Average Diluted EPS Per Quarter $ 0.40 Note: This slide presents estimates for illustrative purposes only, using PMT’s base case (1) Equity allocated represents management’s internal allocation; certain financing balances and associated interest expenses are allocated between assumptions (e.g., for credit performance, prepayment speeds, financing economics, and loss investments based on management’s assessment of target leverage ratios and required capital or liquidity to support the investment treatment for CRT transactions), and does not contemplate market-driven value changes other (2) ROE calculated as a percentage of segment equity than realization of cash flows and hedge costs, or significant changes or shocks to current 10 (3) ROE calculated as a percentage of total equity market conditions; actual results may differ materially

KEY OPERATING METRICS & OTHER FINANCIAL SCHEDULES
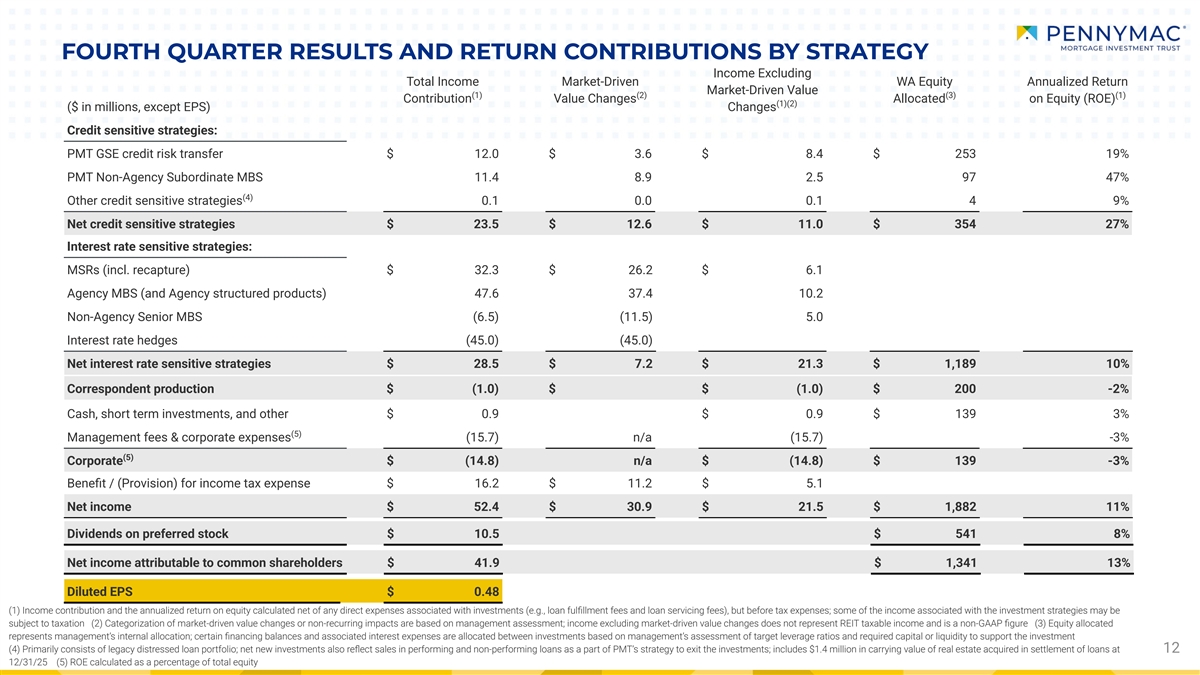
FOURTH QUARTER RESULTS AND RETURN CONTRIBUTIONS BY STRATEGY Income Excluding Total Income Market-Driven WA Equity Annualized Return Market-Driven Value (1) (2) (3) (1) Contribution Value Changes Allocated on Equity (ROE) (1)(2) ($ in millions, except EPS) Changes Credit sensitive strategies: PMT GSE credit risk transfer $ 12.0 $ 3.6 $ 8.4 $ 253 19% PMT Non-Agency Subordinate MBS 11.4 8.9 2.5 97 47% (4) Other credit sensitive strategies 0.1 0.0 0.1 4 9% Net credit sensitive strategies $ 23.5 $ 12.6 $ 11.0 $ 354 27% Interest rate sensitive strategies: MSRs (incl. recapture) $ 32.3 $ 26.2 $ 6.1 Agency MBS (and Agency structured products) 47.6 37.4 10.2 Non-Agency Senior MBS (6.5) (11.5) 5.0 Interest rate hedges (45.0) (45.0) Net interest rate sensitive strategies $ 28.5 $ 7.2 $ 21.3 $ 1,189 10% Correspondent production $ (1.0) $ $ (1.0) $ 200 -2% Cash, short term investments, and other $ 0.9 $ 0.9 $ 139 3% (5) Management fees & corporate expenses (15.7) n/a (15.7) -3% (5) Corporate $ (14.8) n/a $ (14.8) $ 139 -3% Benefit / (Provision) for income tax expense $ 16.2 $ 11.2 $ 5.1 Net income $ 52.4 $ 30.9 $ 21.5 $ 1,882 11% Dividends on preferred stock $ 10.5 $ 541 8% Net income attributable to common shareholders $ 41.9 $ 1,341 13% Diluted EPS $ 0.48 (1) Income contribution and the annualized return on equity calculated net of any direct expenses associated with investments (e.g., loan fulfillment fees and loan servicing fees), but before tax expenses; some of the income associated with the investment strategies may be subject to taxation (2) Categorization of market-driven value changes or non-recurring impacts are based on management assessment; income excluding market-driven value changes does not represent REIT taxable income and is a non-GAAP figure (3) Equity allocated represents management’s internal allocation; certain financing balances and associated interest expenses are allocated between investments based on management’s assessment of target leverage ratios and required capital or liquidity to support the investment (4) Primarily consists of legacy distressed loan portfolio; net new investments also reflect sales in performing and non-performing loans as a part of PMT’s strategy to exit the investments; includes $1.4 million in carrying value of real estate acquired in settlement of loans at 12 12/31/25 (5) ROE calculated as a percentage of total equity
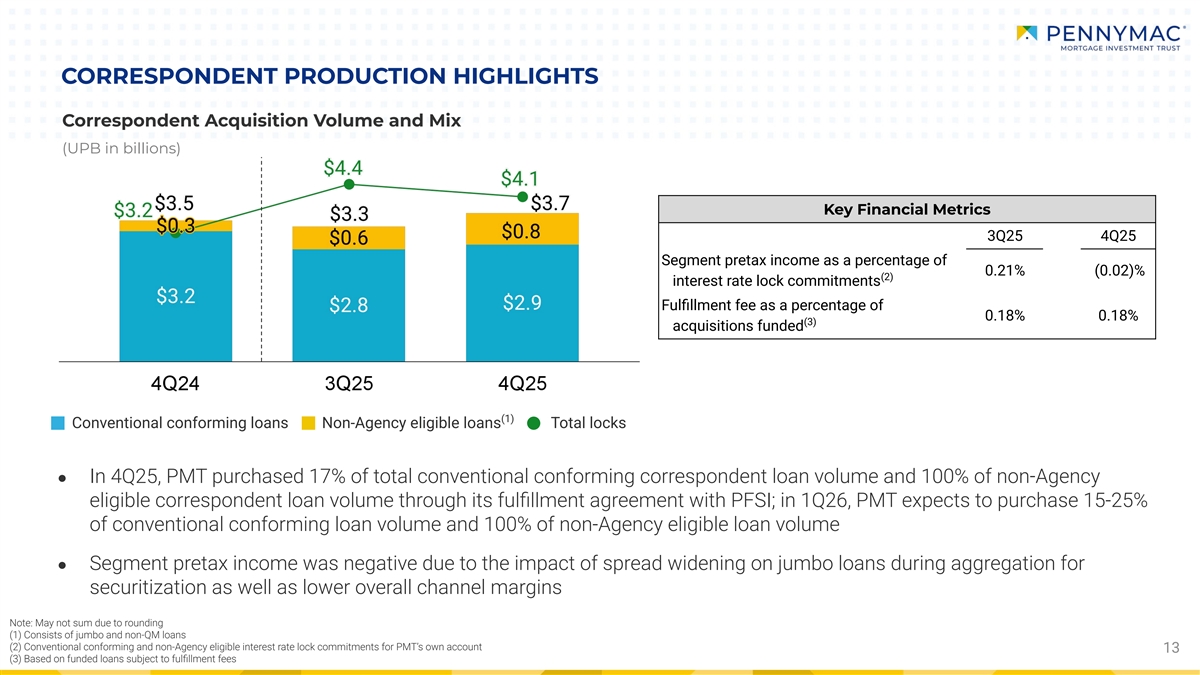
CORRESPONDENT PRODUCTION HIGHLIGHTS Correspondent Acquisition Volume and Mix (UPB in billions) Key Financial Metrics 3Q25 4Q25 Segment pretax income as a percentage of 0.21% (0.02)% (2) interest rate lock commitments Fulfillment fee as a percentage of 0.18% 0.18% (3) acquisitions funded (1) Conventional conforming loans Non-Agency eligible loans Total locks ● In 4Q25, PMT purchased 17% of total conventional conforming correspondent loan volume and 100% of non-Agency eligible correspondent loan volume through its fulfillment agreement with PFSI; in 1Q26, PMT expects to purchase 15-25% of conventional conforming loan volume and 100% of non-Agency eligible loan volume ● Segment pretax income was negative due to the impact of spread widening on jumbo loans during aggregation for securitization as well as lower overall channel margins Note: May not sum due to rounding (1) Consists of jumbo and non-QM loans (2) Conventional conforming and non-Agency eligible interest rate lock commitments for PMT’s own account 13 (3) Based on funded loans subject to fulfillment fees
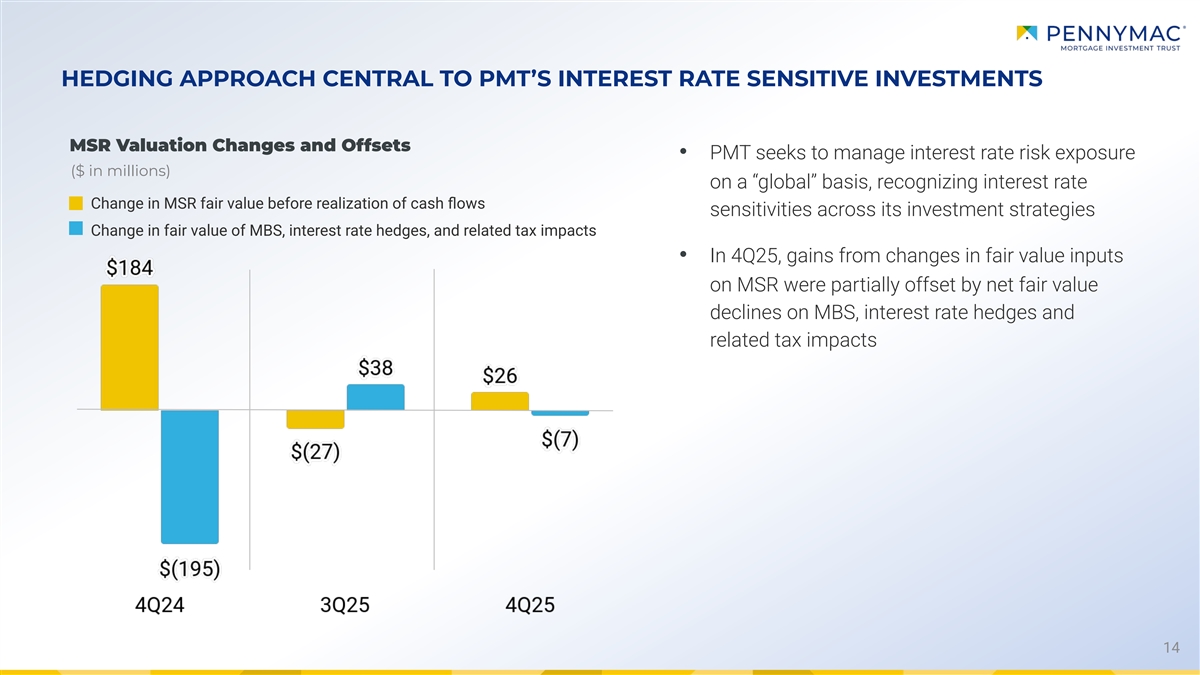
HEDGING APPROACH CENTRAL TO PMT’S INTEREST RATE SENSITIVE INVESTMENTS MSR Valuation Changes and Offsets • PMT seeks to manage interest rate risk exposure ($ in millions) on a “global” basis, recognizing interest rate Change in MSR fair value before realization of cash flows sensitivities across its investment strategies Change in fair value of MBS, interest rate hedges, and related tax impacts • In 4Q25, gains from changes in fair value inputs on MSR were partially offset by net fair value declines on MBS, interest rate hedges and related tax impacts 14
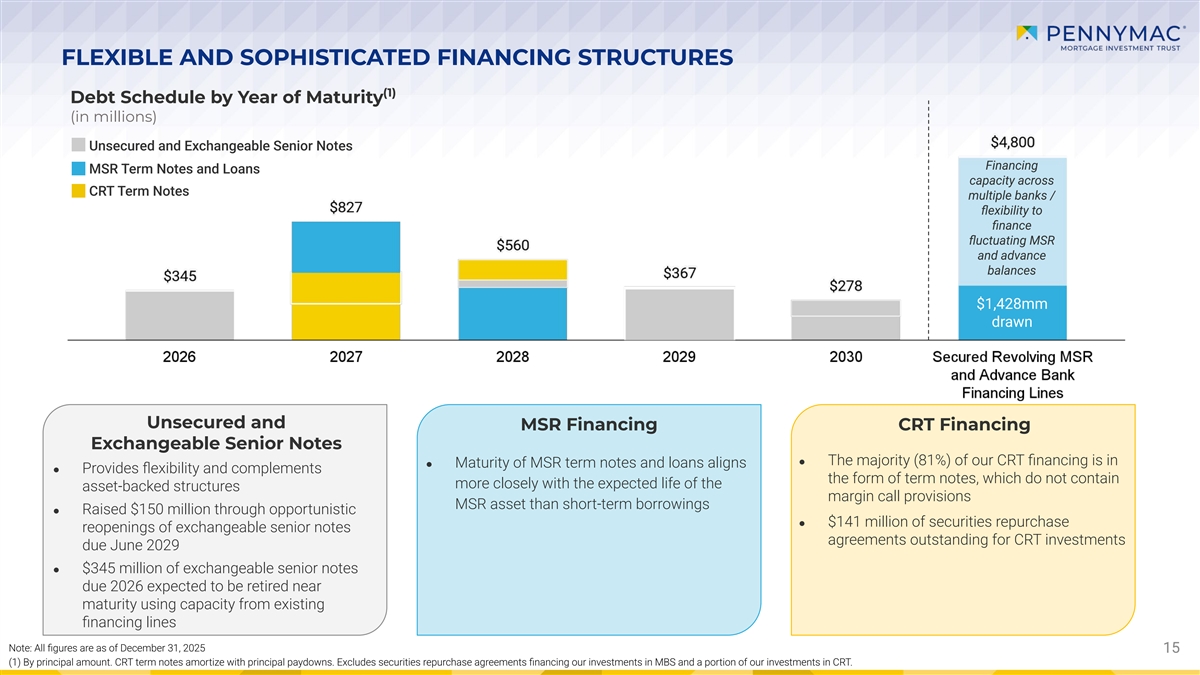
FLEXIBLE AND SOPHISTICATED FINANCING STRUCTURES (1) Debt Schedule by Year of Maturity (in millions) Unsecured and Exchangeable Senior Notes Financing MSR Term Notes and Loans capacity across CRT Term Notes multiple banks / flexibility to finance fluctuating MSR and advance balances $1,428mm drawn Unsecured and MSR Financing CRT Financing Exchangeable Senior Notes ● The majority (81%) of our CRT financing is in ● Maturity of MSR term notes and loans aligns ● Provides flexibility and complements the form of term notes, which do not contain more closely with the expected life of the asset-backed structures margin call provisions MSR asset than short-term borrowings ● Raised $150 million through opportunistic ● $141 million of securities repurchase reopenings of exchangeable senior notes agreements outstanding for CRT investments due June 2029 ● $345 million of exchangeable senior notes due 2026 expected to be retired near maturity using capacity from existing financing lines Note: All figures are as of December 31, 2025 15 15 (1) By principal amount. CRT term notes amortize with principal paydowns. Excludes securities repurchase agreements financing our investments in MBS and a portion of our investments in CRT.
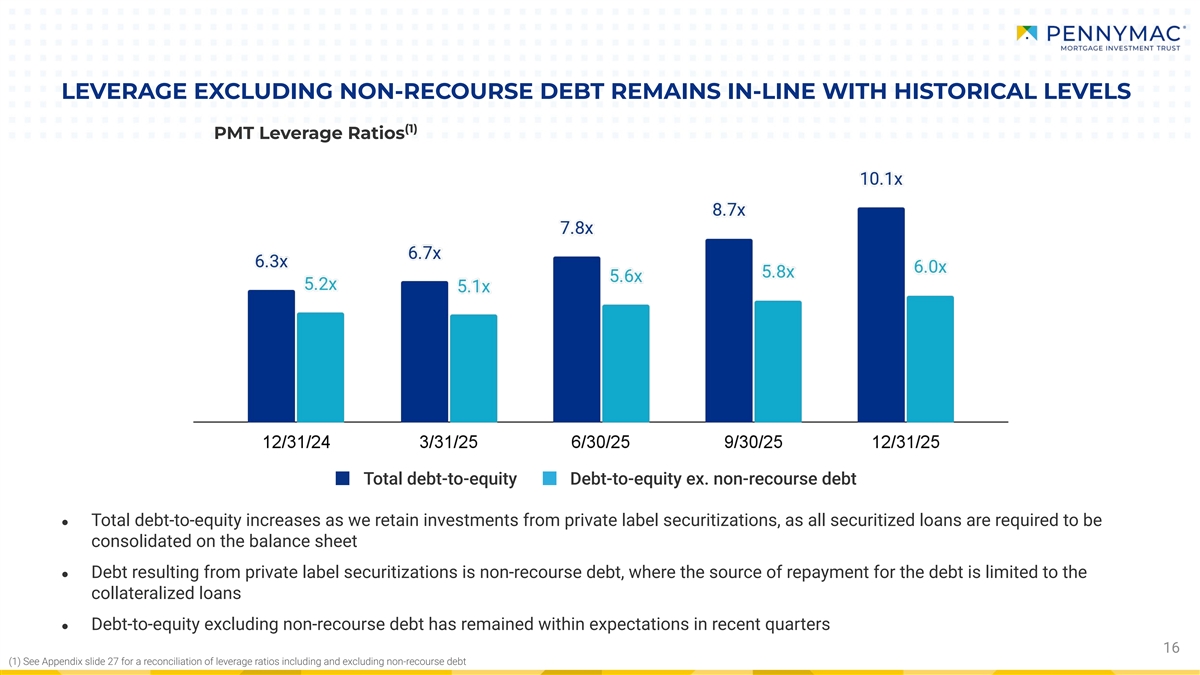
(1) See Appendix slide 27 for a reconciliation of leverage ratios including and excluding non-recourse debt LEVERAGE EXCLUDING NON-RECOURSE DEBT REMAINS IN-LINE WITH HISTORICAL LEVELS (1) PMT Leverage Ratios Total debt-to-equity Debt-to-equity ex. non-recourse debt ● Total debt-to-equity increases as we retain investments from private label securitizations, as all securitized loans are required to be consolidated on the balance sheet ● Debt resulting from private label securitizations is non-recourse debt, where the source of repayment for the debt is limited to the collateralized loans ● Debt-to-equity excluding non-recourse debt has remained within expectations in recent quarters 16

APPENDIX
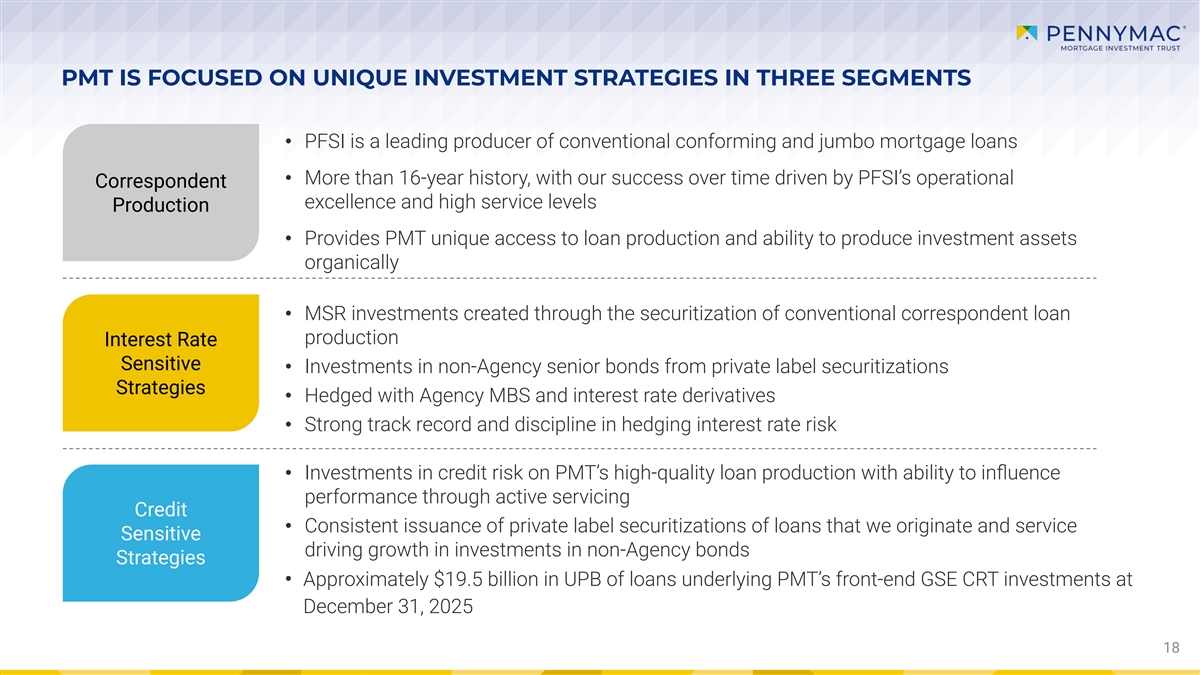
PMT IS FOCUSED ON UNIQUE INVESTMENT STRATEGIES IN THREE SEGMENTS • PFSI is a leading producer of conventional conforming and jumbo mortgage loans • More than 16-year history, with our success over time driven by PFSI’s operational Correspondent excellence and high service levels Production • Provides PMT unique access to loan production and ability to produce investment assets organically • MSR investments created through the securitization of conventional correspondent loan production Interest Rate Sensitive • Investments in non-Agency senior bonds from private label securitizations Strategies • Hedged with Agency MBS and interest rate derivatives • Strong track record and discipline in hedging interest rate risk • Investments in credit risk on PMT’s high-quality loan production with ability to influence performance through active servicing Credit • Consistent issuance of private label securitizations of loans that we originate and service Sensitive driving growth in investments in non-Agency bonds Strategies • Appr oximately $19.5 billion in UPB of loans underlying PMT’s front-end GSE CRT investments at December 31, 2025 18
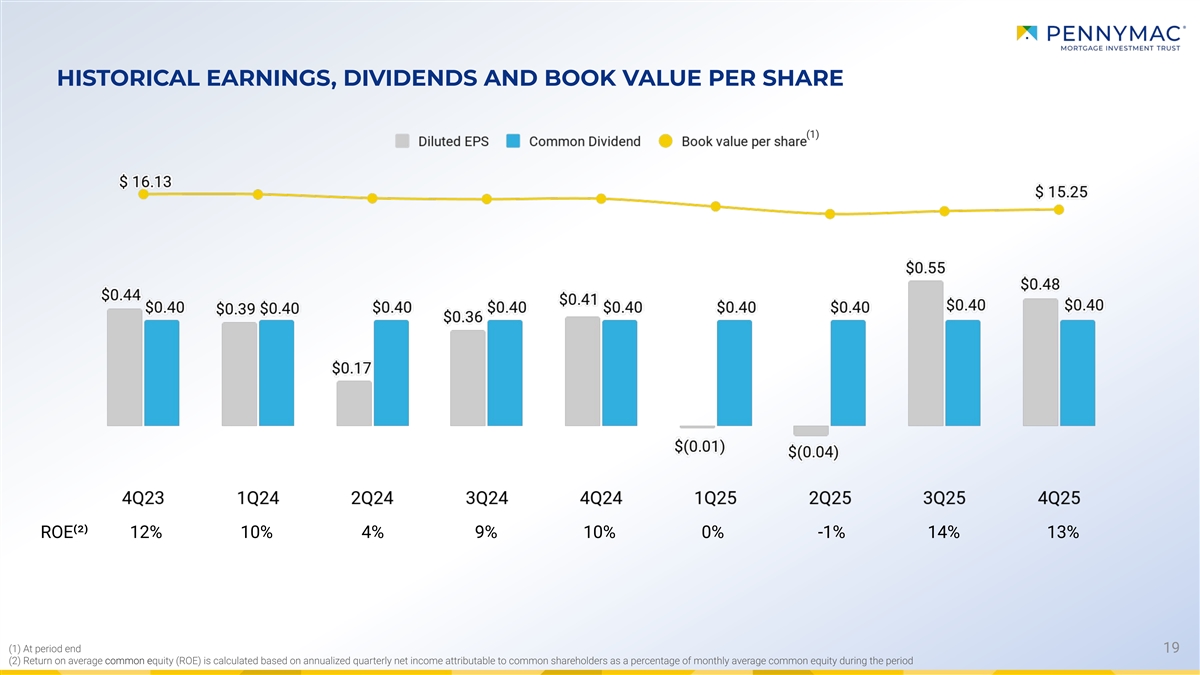
(1) At period end (2) Return on average common equity (ROE) is calculated based on annualized quarterly net income attributable to common shareholders as a percentage of monthly average common equity during the period HISTORICAL EARNINGS, DIVIDENDS AND BOOK VALUE PER SHARE (1) ROE⁽²⁾ 12% 10% 4% 9% 10% 0% -1% 14% 13% 19
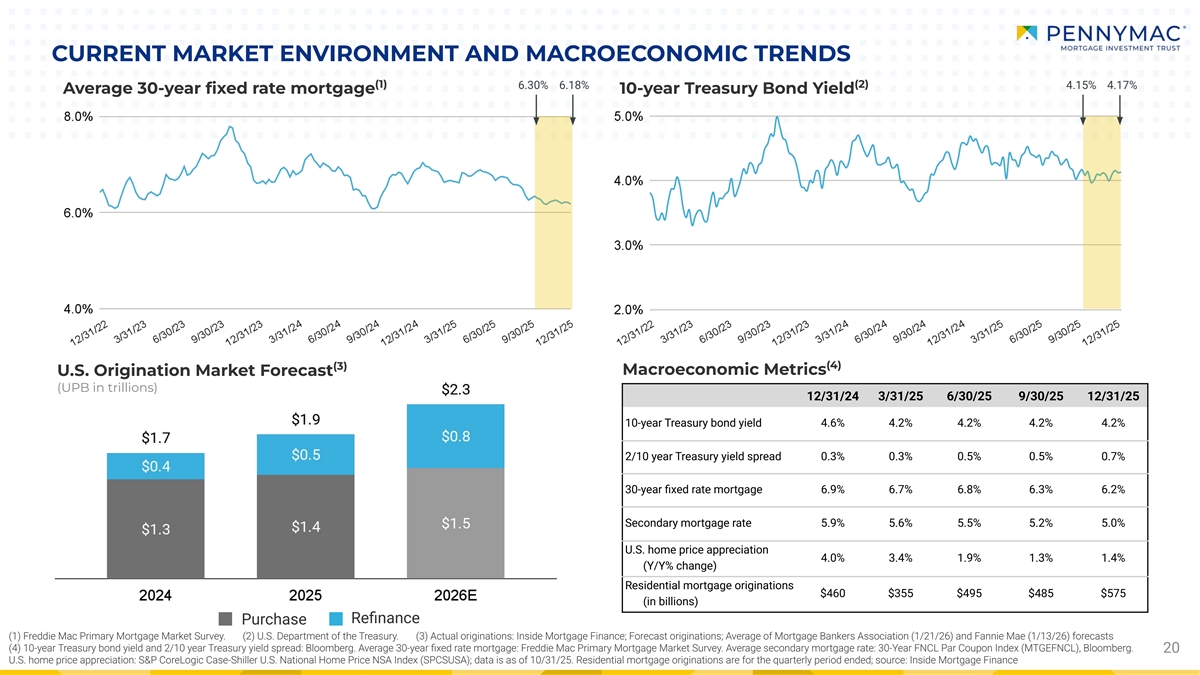
CURRENT MARKET ENVIRONMENT AND MACROECONOMIC TRENDS (1) (2) 6.30% 6.18% 4.15% 4.17% Average 30-year fixed rate mortgage 10-year Treasury Bond Yield (4) (3) Macroeconomic Metrics U.S. Origination Market Forecast (UPB in trillions) 12/31/24 3/31/25 6/30/25 9/30/25 12/31/25 10-year Treasury bond yield 4.6% 4.2% 4.2% 4.2% 4.2% 2/10 year Treasury yield spread 0.3% 0.3% 0.5% 0.5% 0.7% 30-year fixed rate mortgage 6.9% 6.7% 6.8% 6.3% 6.2% Secondary mortgage rate 5.9% 5.6% 5.5% 5.2% 5.0% U.S. home price appreciation 4.0% 3.4% 1.9% 1.3% 1.4% (Y/Y% change) Residential mortgage originations $460 $355 $495 $485 $575 (in billions) Refinance Purchase (1) Freddie Mac Primary Mortgage Market Survey. (2) U.S. Department of the Treasury. (3) Actual originations: Inside Mortgage Finance; Forecast originations; Average of Mortgage Bankers Association (1/21/26) and Fannie Mae (1/13/26) forecasts (4) 10-year Treasury bond yield and 2/10 year Treasury yield spread: Bloomberg. Average 30-year fixed rate mortgage: Freddie Mac Primary Mortgage Market Survey. Average secondary mortgage rate: 30-Year FNCL Par Coupon Index (MTGEFNCL), Bloomberg. 20 U.S. home price appreciation: S&P CoreLogic Case-Shiller U.S. National Home Price NSA Index (SPCSUSA); data is as of 10/31/25. Residential mortgage originations are for the quarterly period ended; source: Inside Mortgage Finance
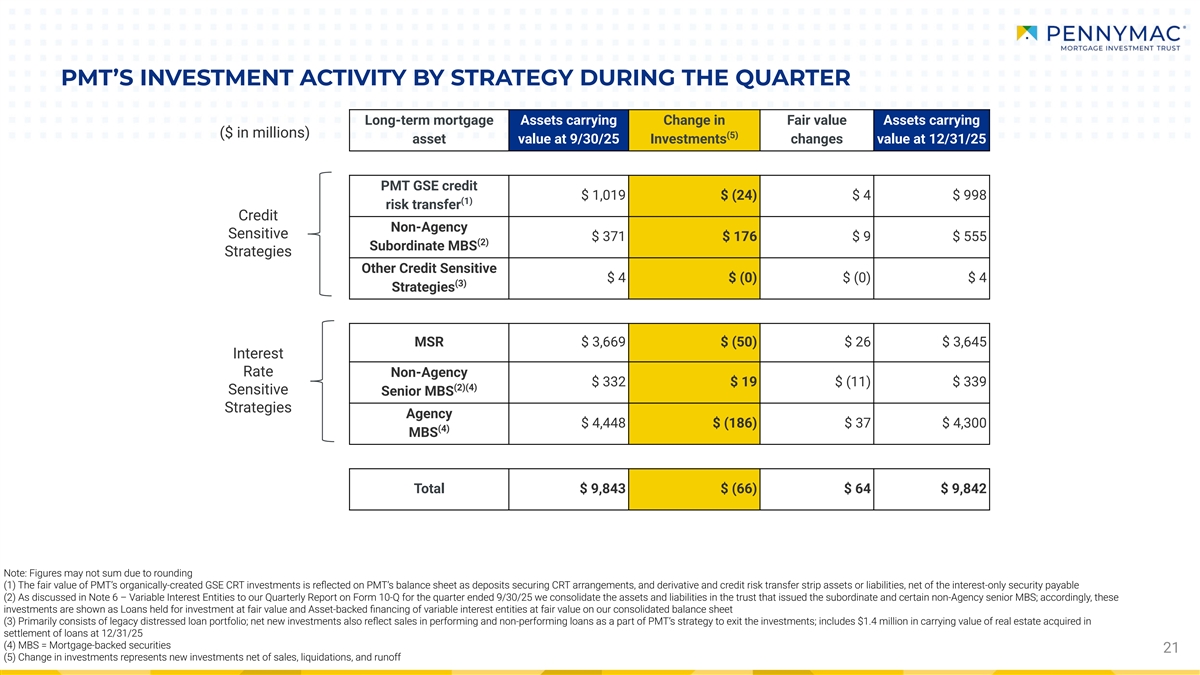
PMT’S INVESTMENT ACTIVITY BY STRATEGY DURING THE QUARTER Long-term mortgage Assets carrying Change in Fair value Assets carrying ($ in millions) (5) asset value at 9/30/25 Investments changes value at 12/31/25 PMT GSE credit $ 1,019 $ (24) $ 4 $ 998 (1) risk transfer Credit Non-Agency Sensitive $ 371 $ 176 $ 9 $ 555 (2) Subordinate MBS Strategies Other Credit Sensitive $ 4 $ (0) $ (0) $ 4 (3) Strategies MSR $ 3,669 $ (50) $ 26 $ 3,645 Interest Rate Non-Agency $ 332 $ 19 $ (11) $ 339 (2)(4) Sensitive Senior MBS Strategies Agency $ 4,448 $ (186) $ 37 $ 4,300 (4) MBS Total $ 9,843 $ (66) $ 64 $ 9,842 Note: Figures may not sum due to rounding (1) The fair value of PMT’s organically-created GSE CRT investments is reflected on PMT’s balance sheet as deposits securing CRT arrangements, and derivative and credit risk transfer strip assets or liabilities, net of the interest-only security payable (2) As discussed in Note 6 – Variable Interest Entities to our Quarterly Report on Form 10-Q for the quarter ended 9/30/25 we consolidate the assets and liabilities in the trust that issued the subordinate and certain non-Agency senior MBS; accordingly, these investments are shown as Loans held for investment at fair value and Asset-backed financing of variable interest entities at fair value on our consolidated balance sheet (3) Primarily consists of legacy distressed loan portfolio; net new investments also reflect sales in performing and non-performing loans as a part of PMT’s strategy to exit the investments; includes $1.4 million in carrying value of real estate acquired in settlement of loans at 12/31/25 (4) MBS = Mortgage-backed securities 21 (5) Change in investments represents new investments net of sales, liquidations, and runoff
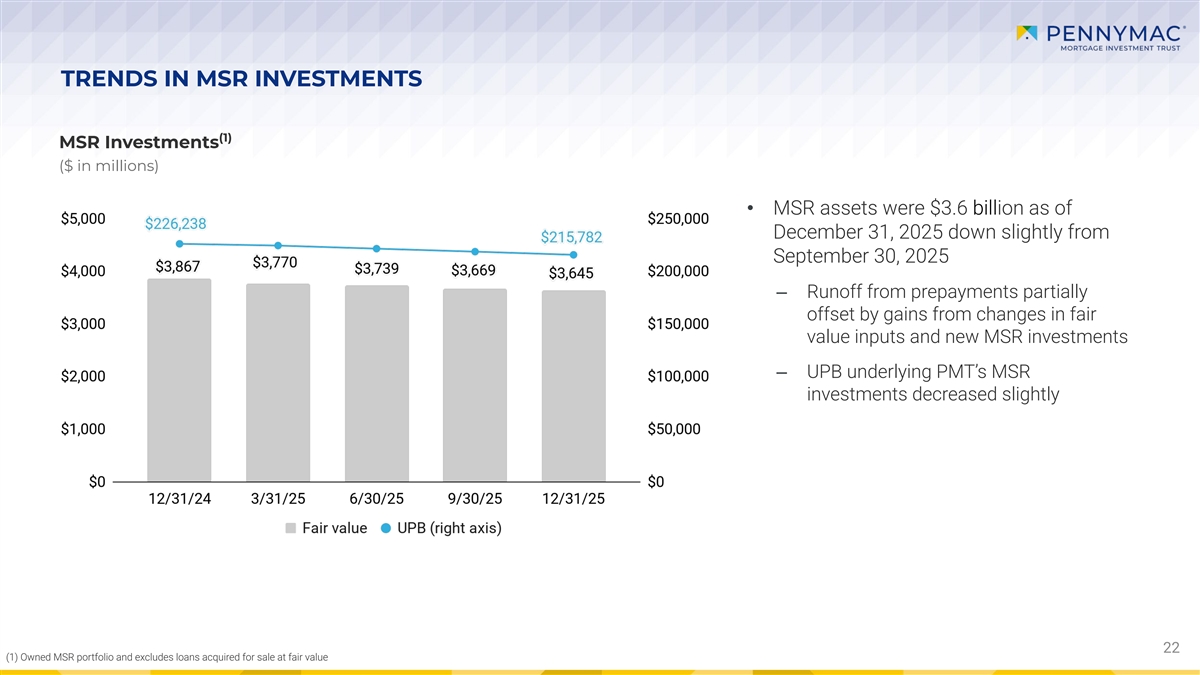
TRENDS IN MSR INVESTMENTS (1) MSR Investments ($ in millions) • MSR assets were $3.6 billion as of December 31, 2025 down slightly from September 30, 2025 ‒ Runoff from prepayments partially offset by gains from changes in fair value inputs and new MSR investments ‒ UPB underlying PMT’s MSR investments decreased slightly 22 (1) Owned MSR portfolio and excludes loans acquired for sale at fair value
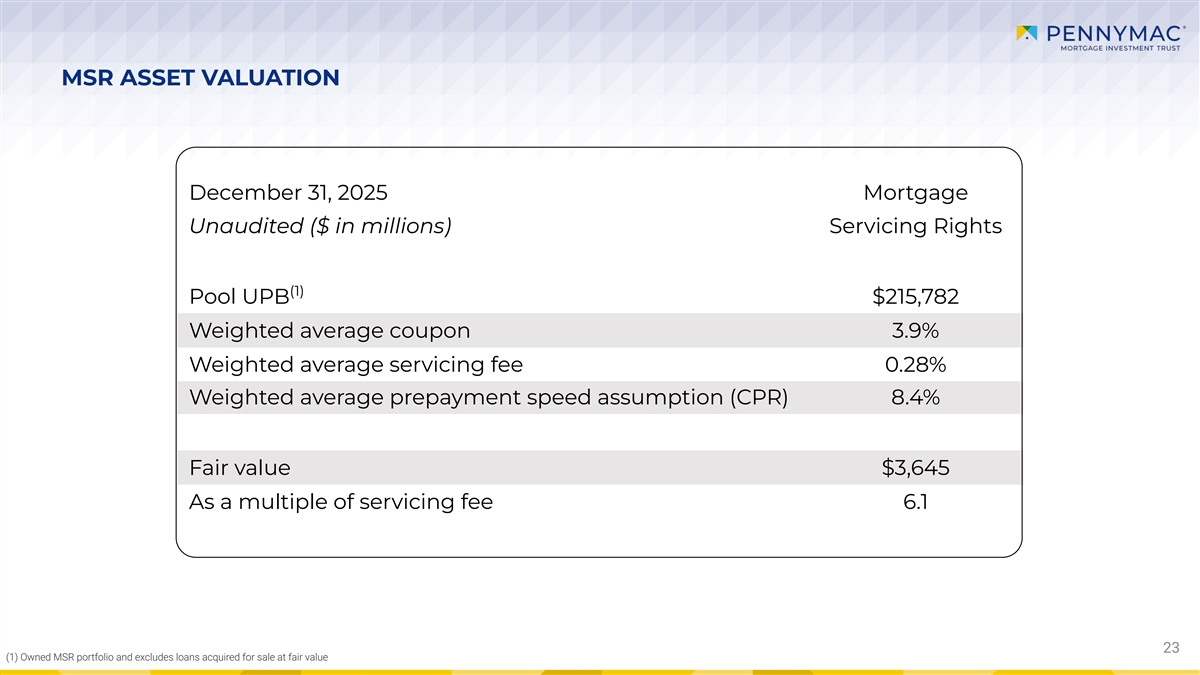
MSR ASSET VALUATION December 31, 2025 Mortgage Unaudited ($ in millions) Servicing Rights (1) Pool UPB $215,782 Weighted average coupon 3.9% Weighted average servicing fee 0.28% Weighted average prepayment speed assumption (CPR) 8.4% Fair value $3,645 As a multiple of servicing fee 6.1 23 (1) Owned MSR portfolio and excludes loans acquired for sale at fair value
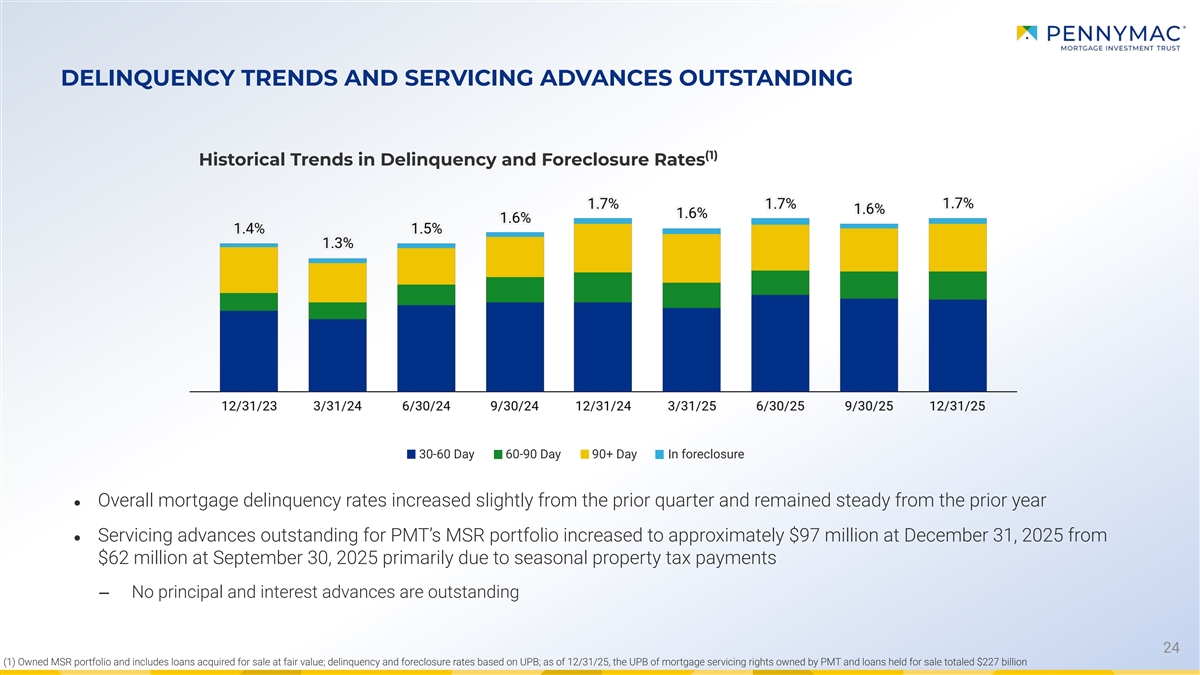
DELINQUENCY TRENDS AND SERVICING ADVANCES OUTSTANDING (1) Historical Trends in Delinquency and Foreclosure Rates 30-60 Day 60-90 Day 90+ Day In foreclosure ● Overall mortgage delinquency rates increased slightly from the prior quarter and remained steady from the prior year ● Servicing advances outstanding for PMT’s MSR portfolio increased to approximately $97 million at December 31, 2025 from $62 million at September 30, 2025 primarily due to seasonal property tax payments ‒ No principal and interest advances are outstanding 24 (1) Owned MSR portfolio and includes loans acquired for sale at fair value; delinquency and foreclosure rates based on UPB; as of 12/31/25, the UPB of mortgage servicing rights owned by PMT and loans held for sale totaled $227 billion
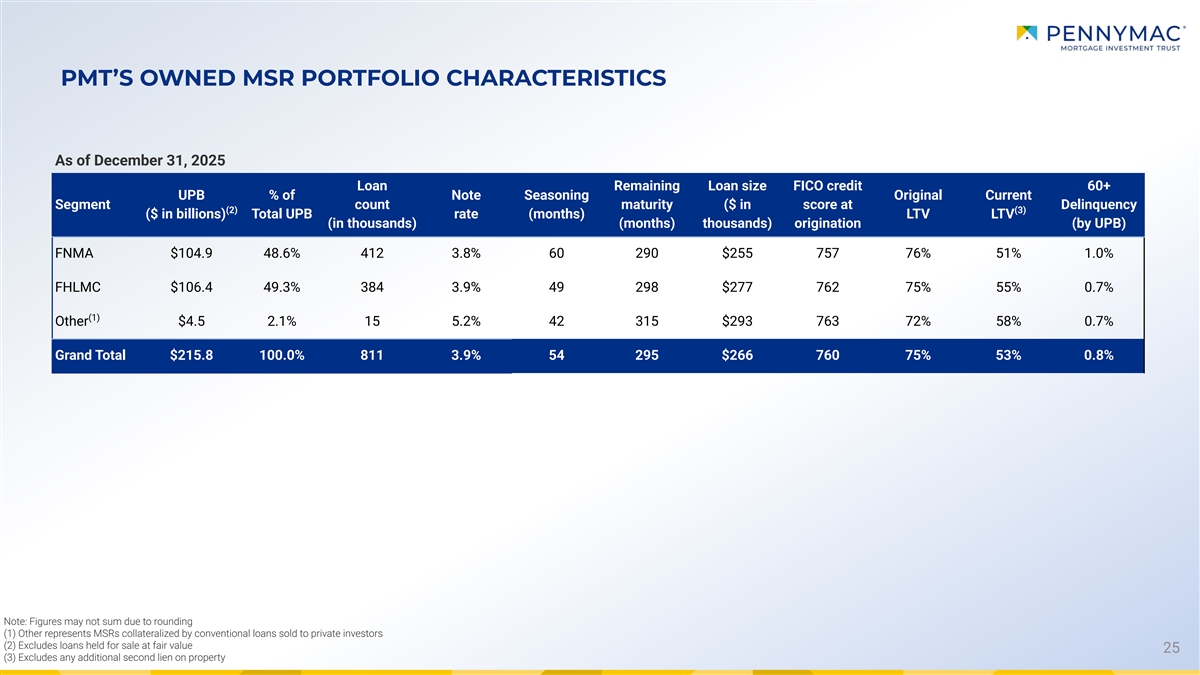
PMT’S OWNED MSR PORTFOLIO CHARACTERISTICS As of December 31, 2025 Loan Remaining Loan size FICO credit 60+ UPB % of Note Seasoning Original Current Segment count maturity ($ in score at Delinquency (2) (3) ($ in billions) Total UPB rate (months) LTV LTV (in thousands) (months) thousands) origination (by UPB) FNMA $104.9 48.6% 412 3.8% 60 290 $255 757 76% 51% 1.0% FHLMC $106.4 49.3% 384 3.9% 49 298 $277 762 75% 55% 0.7% (1) Other $4.5 2.1% 15 5.2% 42 315 $293 763 72% 58% 0.7% Grand Total $215.8 100.0% 811 3.9% 54 295 $266 760 75% 53% 0.8% Note: Figures may not sum due to rounding (1) Other represents MSRs collateralized by conventional loans sold to private investors (2) Excludes loans held for sale at fair value 25 (3) Excludes any additional second lien on property
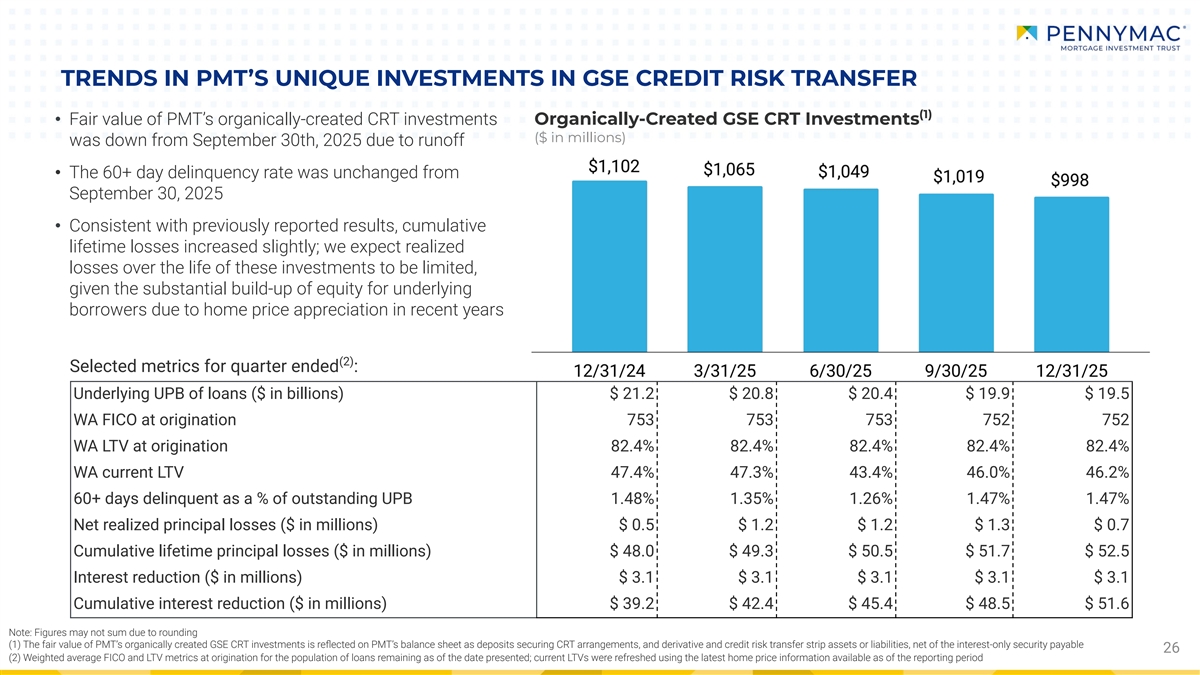
TRENDS IN PMT’S UNIQUE INVESTMENTS IN GSE CREDIT RISK TRANSFER (1) • Fair value of PMT’s organically-created CRT investments Organically-Created GSE CRT Investments ($ in millions) was down from September 30th, 2025 due to runoff • The 60+ day delinquency rate was unchanged from September 30, 2025 • Consistent with previously reported results, cumulative lifetime losses increased slightly; we expect realized losses over the life of these investments to be limited, given the substantial build-up of equity for underlying borrowers due to home price appreciation in recent years (2) Selected metrics for quarter ended : Underlying UPB of loans ($ in billions) $ 21.2 $ 20.8 $ 20.4 $ 19.9 $ 19.5 WA FICO at origination 753 753 753 752 752 WA LTV at origination 82.4% 82.4% 82.4% 82.4% 82.4% WA current LTV 47.4% 47.3% 43.4% 46.0% 46.2% 60+ days delinquent as a % of outstanding UPB 1.48% 1.35% 1.26% 1.47% 1.47% Net realized principal losses ($ in millions) $ 0.5 $ 1.2 $ 1.2 $ 1.3 $ 0.7 Cumulative lifetime principal losses ($ in millions) $ 48.0 $ 49.3 $ 50.5 $ 51.7 $ 52.5 Interest reduction ($ in millions) $ 3.1 $ 3.1 $ 3.1 $ 3.1 $ 3.1 Cumulative interest reduction ($ in millions) $ 39.2 $ 42.4 $ 45.4 $ 48.5 $ 51.6 Note: Figures may not sum due to rounding (1) The fair value of PMT’s organically created GSE CRT investments is reflected on PMT’s balance sheet as deposits securing CRT arrangements, and derivative and credit risk transfer strip assets or liabilities, net of the interest-only security payable 26 (2) Weighted average FICO and LTV metrics at origination for the population of loans remaining as of the date presented; current LTVs were refreshed using the latest home price information available as of the reporting period
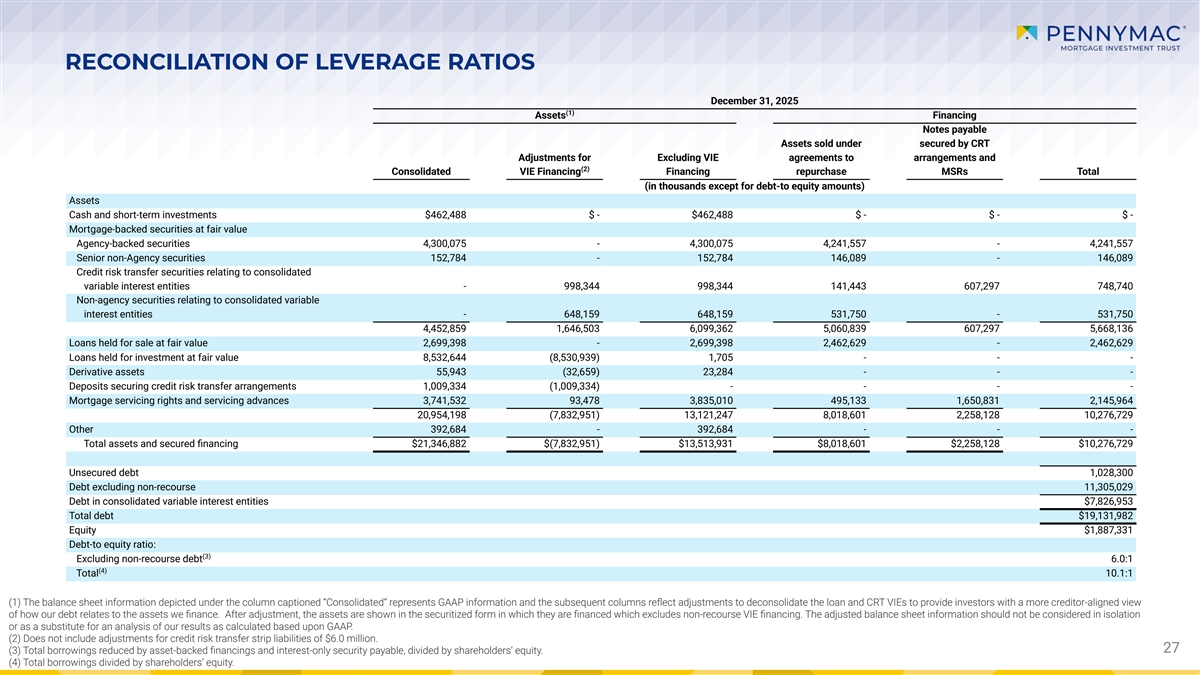
RECONCILIATION OF LEVERAGE RATIOS December 31, 2025 (1) Assets Financing Notes payable Assets sold under secured by CRT Adjustments for Excluding VIE agreements to arrangements and (2) Consolidated VIE Financing Financing repurchase MSRs Total (in thousands except for debt-to equity amounts) Assets Cash and short-term investments $462,488 $ - $462,488 $ - $ - $ - Mortgage-backed securities at fair value Agency-backed securities 4,300,075 - 4,300,075 4,241,557 - 4,241,557 Senior non-Agency securities 152,784 - 152,784 146,089 - 146,089 Credit risk transfer securities relating to consolidated variable interest entities - 998,344 998,344 141,443 607,297 748,740 Non-agency securities relating to consolidated variable interest entities - 648,159 648,159 531,750 - 531,750 4,452,859 1,646,503 6,099,362 5,060,839 607,297 5,668,136 Loans held for sale at fair value 2,699,398 - 2,699,398 2,462,629 - 2,462,629 Loans held for investment at fair value 8,532,644 (8,530,939) 1,705 - - - Derivative assets 55,943 (32,659) 23,284 - - - Deposits securing credit risk transfer arrangements 1,009,334 (1,009,334) - - - - Mortgage servicing rights and servicing advances 3,741,532 93,478 3,835,010 495,133 1,650,831 2,145,964 20,954,198 (7,832,951) 13,121,247 8,018,601 2,258,128 10,276,729 Other 392,684 - 392,684 - - - Total assets and secured financing $21,346,882 $(7,832,951) $13,513,931 $8,018,601 $2,258,128 $10,276,729 Unsecured debt 1,028,300 Debt excluding non-recourse 11,305,029 Debt in consolidated variable interest entities $7,826,953 Total debt $19,131,982 Equity $1,887,331 Debt-to equity ratio: (3) Excluding non-recourse debt 6.0:1 (4) Total 10.1:1 (1) The balance sheet information depicted under the column captioned “Consolidated” represents GAAP information and the subsequent columns reflect adjustments to deconsolidate the loan and CRT VIEs to provide investors with a more creditor-aligned view of how our debt relates to the assets we finance. After adjustment, the assets are shown in the securitized form in which they are financed which excludes non-recourse VIE financing. The adjusted balance sheet information should not be considered in isolation or as a substitute for an analysis of our results as calculated based upon GAAP. (2) Does not include adjustments for credit risk transfer strip liabilities of $6.0 million. 27 27 (3) Total borrowings reduced by asset-backed financings and interest-only security payable, divided by shareholders’ equity. (4) Total borrowings divided by shareholders’ equity.
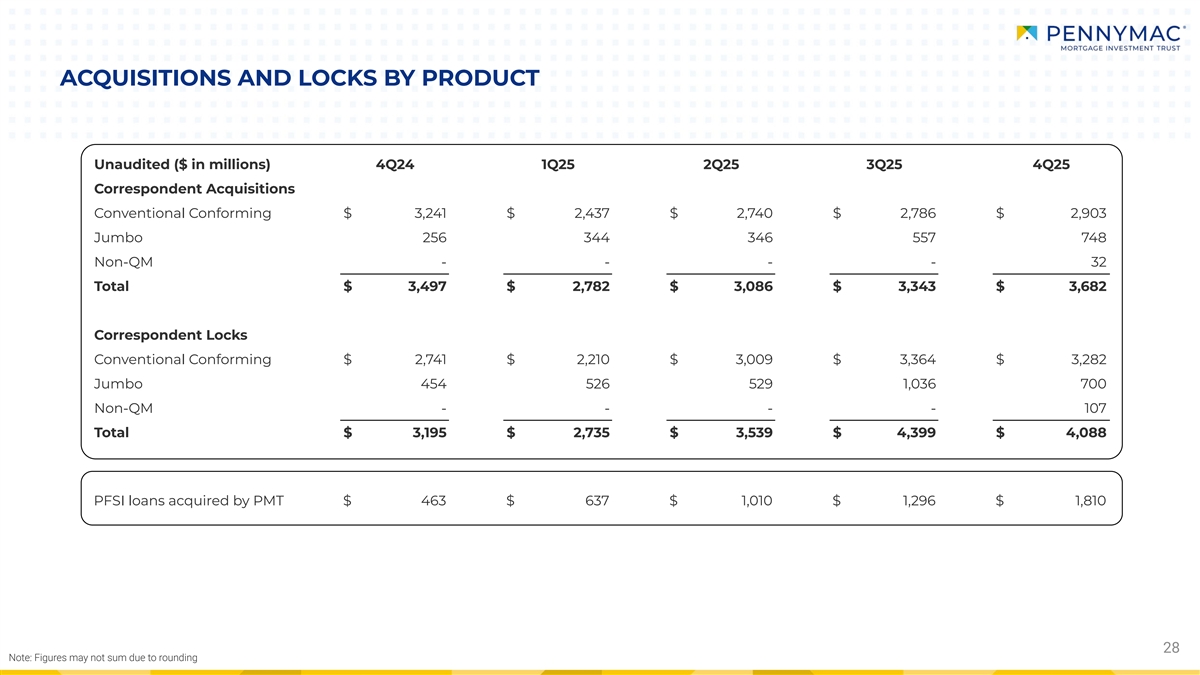
ACQUISITIONS AND LOCKS BY PRODUCT Unaudited ($ in millions) 4Q24 1Q25 2Q25 3Q25 4Q25 Correspondent Acquisitions Conventional Conforming $ 3,241 $ 2,437 $ 2,740 $ 2,786 $ 2,903 Jumbo 256 344 346 557 748 Non-QM - - - - 32 Total $ 3,497 $ 2,782 $ 3,086 $ 3,343 $ 3,682 Correspondent Locks Conventional Conforming $ 2,741 $ 2,210 $ 3,009 $ 3,364 $ 3,282 Jumbo 454 526 529 1,036 700 Non-QM - - - - 107 Total $ 3,195 $ 2,735 $ 3,539 $ 4,399 $ 4,088 PFSI loans acquired by PMT $ 463 $ 637 $ 1,010 $ 1,296 $ 1,810 28 Note: Figures may not sum due to rounding

29