.2

TABLE OF CONTENTS
|
Company Information & Forward-Looking Statements |
|
|
Earnings Press Release |
|
|
Financial & Operating Highlights |
|
|
Balance Sheets |
|
|
Statements of Operations, Funds from Operations (“FFO”) & Core FFO (“CFFO”) |
|
|
Trailing Five Quarters |
|
|
Three and Nine Months Ended September 30, 2025 and 2024 |
|
|
Adjusted EBITDA Reconciliations and Coverage Ratio |
|
|
Trailing Five Quarters |
|
|
Three and Nine Months Ended September 30, 2025 and 2024 |
|
|
Same-Store Portfolio Net Operating Income (“NOI”) and NOI Bridge |
|
|
Trailing Five Quarters |
|
|
Three and Nine Months Ended September 30, 2025 and 2024 |
|
|
Same-Store Portfolio NOI by Market |
|
|
Three Months Ended September 30, 2025 and 2024 |
|
| Nine Months Ended September 30, 2025 and 2024 | 17 |
|
Property Portfolio NOI Exposure by Market |
|
|
Value Add Summary |
|
|
Investment & Development Activity |
|
|
Debt Summary |
|
|
Debt & Credit Metrics |
|
|
Definitions |
COMPANY INFORMATION
Independence Realty Trust, Inc. (NYSE: IRT), an S&P 400 MidCap Company, is a real estate investment trust (“REIT”) that owns and operates multifamily communities, across non-gateway U.S. markets. IRT’s investment strategy is focused on gaining scale near major employment centers within key amenity rich submarkets that offer good school districts and high-quality retail. IRT’s main objective is to provide attractive risk-adjusted returns to shareholders through diligent portfolio management, strong operational performance, and a consistent return on capital through distributions and capital appreciation. More information may be found on the Company’s website, www.irtliving.com.
|
Corporate Headquarters |
1835 Market Street, Suite 2601 |
|
|
Philadelphia, PA 19103 |
||
|
267.270.4800 |
||
|
Trading Symbol on NYSE |
IRT |
|
| Credit Ratings |
Fitch Ratings |
BBB l Stable |
| Standard & Poors' Ratings Services | BBB l Stable | |
|
Investor Relations |
Stephanie Krewson-Kelly |
|
|
267.270.4815 |
||
|
SKrewson@IRTLiving.com |
This release contains certain forward-looking statements within the meaning of Section 27A of the Securities Act of 1933, as amended, and Section 21E of the Securities Exchange Act of 1934, as amended. Such forward-looking statements include, but are not limited to, our earnings guidance, and the assumptions underlying such guidance, our planned use of remaining proceeds from our sales of common stock on a forward basis, our expectations with respect to the three properties which are classified as held for sale, the assumptions underlying the determination of the fair value of our impairment charge for our property held for sale as of September 30, 2025, and our expectations with respect to our new joint venture and our expectations with respect to future acquisitions and dispositions. All statements in this release that address financial and operating performance, events or developments that we expect or anticipate will occur or be achieved in the future are forward-looking statements.
Our forward-looking statements are not guarantees of future performance and involve estimates, projections, forecasts and assumptions, including as to matters that are not within our control, and are subject to risks and uncertainties including, without limitation, risks and uncertainties related to changes in market demand for rental apartment homes and pricing pressures, including from competitors, that could lead to declines in occupancy and rent levels, uncertainty and volatility in capital and credit markets, including changes that reduce availability, and increase costs, of capital, unexpected changes in our intention or ability to repay certain debt prior to maturity, increased costs on account of inflation, increased competition in the labor market, our planned use of the remaining proceeds from our sales of common stock on a forward basis, inability to sell certain assets, including those assets designated as held for sale, within the time frames or at the pricing levels expected, failure to achieve expected benefits from the redeployment of proceeds from asset sales, inability or failure to achieve anticipated benefits from future acquisitions and dispositions, delays in completing, and cost overruns incurred in connection with, our value add initiatives and failure to achieve rent increases and occupancy levels on account of the value add initiatives, unexpected impairments or impairments in excess of our estimates, increased regulations generally and specifically on the rental housing market, including legislation that may regulate rents and fees or delay or limit our ability to evict non-paying residents, risks endemic to real estate and the real estate industry generally, the impact of potential outbreaks of infectious diseases and measures intended to prevent the spread or address the effects thereof, economic conditions, including inflation and recessionary conditions and their related impacts on the real estate industry, U.S. and global trade policies and tensions, including changes in, or the imposition of, tariffs and/or trade barriers and the economic impacts, volatility and uncertainty resulting therefrom, the impacts from the U.S. government shutdown, the effects of natural and other disasters, unknown or unexpected liabilities, including the cost of legal proceedings, costs and disruptions as the result of a cybersecurity incident or other technology disruption, including but not limited to a third party's unauthorized access to our data or the data of our residents, unexpected capital needs, inability to obtain appropriate insurance coverages at reasonable rates, or at all, or losses from catastrophes in excess of our insurance coverages, and share price fluctuations. Please refer to the documents filed by us with the SEC, including specifically the “Risk Factors” sections of our Annual Report on Form 10-K for the year ended December 31, 2024 and our Quarterly Report on Form 10-Q for the quarter ended March 31, 2025, and our other filings with the SEC, which identify additional factors that could cause actual results to differ from those contained in forward-looking statements.
These forward-looking statements are based upon the beliefs and expectations of our management at the time of this release and our actual results may differ materially from the expectations, intentions, beliefs, plans or predictions of the future expressed or implied by such forward-looking statements. We undertake no obligation to update these forward-looking statements to reflect events or circumstances after the date hereof or to reflect the occurrence of unanticipated events, except as may be required by law.
Independence Realty Trust Announces Third Quarter 2025 Financial Results
PHILADELPHIA – (BUSINESS WIRE) – October 29, 2025 — Independence Realty Trust, Inc. (“IRT”) (NYSE: IRT), a multifamily apartment REIT, announces its third quarter 2025 financial results.
Q3 2025 EPS of $0.03
Q3 CFFO Per Share of $0.29
In Line with Expectations
2.7% Same-Store NOI Growth in Q3
1.4% Increase in Rental Revenue and 0.7% Decrease in Property Operating Expenses
95.6% Same-Store Occupancy at End of Q3
60.4% Resident Retention Rate in Q3
Completed 788 Renovations in Value Add Program
Achieved Average ROI of 14.8% During Q3
Accretive Investment Activity
Acquired Two Communities in Orlando During Q3 for an Aggregate Purchase Price of $155 million
Capital Recycling Out of Three Communities to Fund Higher Growth Investments is Progressing
Balance Sheet Remains Strong
Conservative Leverage and Ample Liquidity to Fund Growth
Reaffirmed Full Year 2025 Guidance Midpoints
Management Commentary
“Third quarter same-store NOI growth of 2.7% and CFFO per share of $0.29 were in line with our expectations. We remain committed to prioritizing stable occupancy, which will position us to capture improving rental rate growth as supply pressures continue to recede,” said Scott Schaeffer, Chairman and CEO. “I am also pleased to report bad debt during the third quarter improved to less than 1% of same-store revenues driven by improved processes and our investments in technology. We will continue to invest in technologies to drive further operational efficiencies that enhance the resident experience while benefiting shareholders.”
Third Quarter Summary
|
• |
Net income available to common shares of $6.9 million for the quarter ended September 30, 2025 compared to $12.4 million for the quarter ended September 30, 2024. Earnings per diluted share (“EPS”) of $0.03 for the quarter ended September 30, 2025 compared to $0.05 for the quarter ended September 30, 2024. |
|
• |
Same-store portfolio NOI growth of 2.7% for the quarter ended September 30, 2025 compared to the quarter ended September 30, 2024. |
|
• |
Core Funds from Operations (“CFFO”) of $70.0 million for the quarter ended September 30, 2025 compared to $66.8 million for the quarter ended September 30, 2024. CFFO per share was $0.29 for the third quarter of 2025 and for the third quarter of 2024. |
|
• |
Adjusted EBITDA of $92.6 million for the quarter ended September 30, 2025 compared to $87.5 million for the quarter ended September 30, 2024. |
|
• |
Value add program completed renovations of 788 units during the quarter ended September 30, 2025, achieving a weighted average return on investment during the quarter of 14.8%. |
Included later in this press release are definitions of NOI, CFFO, Adjusted EBITDA and other Non-GAAP financial measures and reconciliations of such measures to their most comparable financial measures as calculated and presented in accordance with GAAP, as well as discussion of our same-store methodology.
Same-Store Portfolio(1) Operating Results
|
Three Months Ended |
Nine Months Ended |
|||
|
September 30, 2025 Compared to |
September 30, 2025 Compared to |
|||
|
Three Months Ended |
Nine Months Ended |
|||
|
September 30, 2024 |
September 30, 2024 |
|||
|
Rental and other property revenue |
1.4% increase |
1.6% increase |
||
|
Property operating expenses |
0.7% decrease |
0.1% decrease |
||
|
NOI |
2.7% increase |
2.7% increase |
||
|
Portfolio average occupancy |
10 bps decrease to 95.3% |
40 bps increase to 95.4% |
||
|
Portfolio average rental rate |
0.6% increase to $1,581 |
0.9% increase to $1,577 |
||
|
NOI Margin |
90 bps increase to 63.4% |
60 bps increase to 63.0% |
|
Q2 2025 |
Q3 2025 |
|||||||
|
Same-Store Portfolio(1) |
||||||||
|
Average Occupancy |
95.3 | % | 95.3 | % | ||||
|
Lease Over Lease Effective Rental Rate Growth:(2) |
||||||||
|
New Leases |
(3.1 | )% | (3.5 | )% | ||||
|
Renewal Leases |
3.9 | % | 2.6 | % | ||||
|
Blended |
0.7 | % | 0.1 | % | ||||
|
Resident Retention Rate |
58.4 | % | 60.4 | % | ||||
|
Same-Store Portfolio excluding Ongoing Value Add |
||||||||
|
Average Occupancy |
95.5 | % | 95.8 | % | ||||
|
Lease Over Lease Effective Rental Rate Growth:(2) |
||||||||
|
New Leases |
(3.8 | )% | (4.3 | )% | ||||
|
Renewal Leases |
3.9 | % | 2.5 | % | ||||
|
Blended |
0.4 | % | (0.3 | )% | ||||
|
Resident Retention Rate |
58.7 | % | 60.7 | % | ||||
|
Value Add (34 properties with Ongoing Value Add) |
||||||||
|
Average Occupancy |
95.0 | % | 94.4 | % | ||||
|
Lease Over Lease Effective Rental Rate Growth:(2) |
||||||||
|
New Leases |
(2.1 | )% | (2.2 | )% | ||||
|
Renewal Leases |
3.9 | % | 2.7 | % | ||||
|
Blended |
1.1 | % | 0.7 | % | ||||
|
Resident Retention Rate |
58.0 | % | 59.7 | % | ||||
|
(1) |
Same-store portfolio includes 105 properties, which represent 30,502 units. |
|
(2) |
Lease-over-lease effective rent growth represents the change in effective monthly rent, as adjusted for concessions, for each unit that had a prior lease and current lease that are for a term of 9-14 months. Q2 2025 new, renewal, and blended lease over lease rent growth for all leases was (3.4)%, 4.2%, and 0.7%, respectively. Q3 2025 new, renewal, and blended lease over lease rent growth for all leases was (3.9)%, 2.8% and 0.1%, respectively. |
Value Add Program
We completed renovations of 788 units during the three months ended September 30, 2025, achieving a weighted average return on investment of 14.8%, with an average cost per unit renovated of $20,269, and an average monthly rent increase per unit of $249 over unrenovated comparable units. We completed renovations of 1,517 units during the nine months ended September 30, 2025, achieving a weighted average return on investment of 15.4%, with an average cost per unit renovated of $19,612, and an average monthly rent increase per unit of $252 over unrenovated comparable units. See the Value Add Summary page of our supplemental information for additional information on our projects’ life to date as of September 30, 2025.
Investment Activity
Acquisitions
| • |
On July 31, 2025, we acquired 3030 at Apopka, a 240-unit community in Orlando, Florida, for $60.25 million.
|
|
| • |
On August 14, 2025, we acquired M2 at Millenia 700, a 403-unit community, also in Orlando, Florida for $94.75 million.
|
|
| • |
The aggregate purchase price of these two acquisitions totaled $155.0 million, and the acquisitions increased our exposure in Orlando, Florida from 617 units to 1,260 units.
|
|
| • | We used $101.0 million of proceeds from sales of our common stock under our forward sale agreements to acquire these communities on a leverage-neutral and CFFO accretive basis. |
Properties Held for Sale
As of September 30, 2025, we had three properties classified as held for sale.
|
• |
Jamestown at St. Matthews: During the three months ended June 30, 2025, we classified this property in Louisville, Kentucky, as held for sale. This property is under contract for sale and the sale is expected to close by year end at a gain of approximately $18.0 million.
|
|
| • |
Stonebridge Crossing: During the three months ended June 30, 2025, we classified this property in Memphis, Tennessee as held for sale. We are actively marketing this property for sale and expect it to close in early 2026.
|
|
| • |
Bella Terra at City Center: During the three months ended June 30, 2025, we classified this property in Denver, Colorado as held for sale. We recognized a loss on impairment of $12.8 million in the third quarter of 2025. We expect the sale of this property to occur in 2026.
|
Joint Ventures
| • |
Metropolis at Innsbrook, Richmond, Virginia: On July 21, 2025, the joint venture sold this 402-unit apartment community. We received $31.1 million in proceeds from the sale, comprised of a return of our initial investment of $24.5 million and equity proceeds of $6.6 million. We recognized a gain on sale of $10.4 million in the third quarter of 2025.
|
|
|
• |
The Approach, Indianapolis, Indiana: On October 8, 2025, we entered into a joint venture for the development of a to-be-built multifamily project comprised of 318 units just outside Indianapolis, Indiana. We have committed to invest an aggregate of $20.0 million in this joint venture, and, as of October 8, 2025, had funded $1.7 million on account of this commitment.
|
|
| • |
Views of Music City II, Nashville, Tennessee: On October 9, 2025, our joint venture partner redeemed our investment in this property, comprised of a return of our initial capital of $5.9 million and a preferred return of $3.3 million. We recognized the preferred return of $3.3 million in Income (loss) from unconsolidated real estate entities in October 2025. Under the terms of our joint venture agreement, we are entitled to the right of first refusal on the sale of the property. |
Capital Expenditures
Across our total portfolio for the three months ended September 30, 2025, recurring capital expenditures were $8.6 million, or $246 per unit, value add expenditures were $14.7 million, non-recurring expenditures were $16.9 million and development expenditures were $1.0 million, respectively. For the nine months ended September 30, 2025, recurring capital expenditures were $24.6 million, or $707 per unit, value add expenditures were $31.9 million, non-recurring expenditures were $39.2 million and development expenditures were $9.9 million, respectively.
Capital Markets
In connection with our previously announced public offering of 11,500,000 shares of common stock, in September 2024, we entered into forward sale agreements with Citigroup. On September 29, 2025, we physically settled 5,300,000 of those shares pursuant to the forward sale agreements at a weighted average price of $19.06 per share, resulting in proceeds to us of $101.0 million which we used to fund acquisitions. The scheduled maturity date of our forward sale agreements is December 31, 2025. As of September 30, 2025, there were 300,000 shares of common stock remaining under our forward sale agreements with Citigroup and 2,681,000 shares remaining to be settled pursuant to the forward sale transactions entered into under our At-the-Market offering program, for a combined total of 2,981,600 shares of our common stock. Assuming the 2,981,600 shares were settled at the September 30, 2025 forward sales price, we would receive additional proceeds of approximately $61.7 million.
Balance Sheet and Liquidity
At September 30, 2025, our net debt to Adjusted EBITDA was 6.0x. As of the same date and including the effect of hedges, our weighted average effective interest rate on our consolidated debt was 4.3% with a weighted average maturity of 3.2 years, and 99.7% of our debt was either subject to fixed interest rates or was hedged. Also as of September 30, 2025, we had approximately $628.1 million in liquidity through a combination of unrestricted cash and cash equivalents, unsettled proceeds related to forward sale agreements (assuming the forward sale agreements are physically settled at the forward price determined at the closing of such forward sale agreements), and capacity under our unsecured revolver.
Dividend Distribution
On September 8, 2025, our Board of Directors declared a quarterly dividend of $0.17 per share of common stock. The third quarter dividend was paid on October 24, 2025 to stockholders of record at the close of business on September 30, 2025.
2025 EPS, FFO and CFFO Guidance
|
Previous Guidance |
Current Guidance |
Change at Midpoint |
||||||||||||||||||
|
2025 Full Year EPS and CFFO Guidance(1) |
Low |
High |
Low |
High |
||||||||||||||||
|
Earnings per share (3) |
$ | 0.475 | $ | 0.535 | $ | 0.27 | $ | 0.28 | $ | (0.23 | ) | |||||||||
|
Adjustments: |
||||||||||||||||||||
|
Depreciation and amortization |
1.02 | 1.02 | 1.00 | 1.00 | (0.02 | ) | ||||||||||||||
|
Gains on sale included with income from unconsolidated real estate entities (2) |
(0.04 | ) | (0.04 | ) | (0.04 | ) | (0.04 | ) |
— |
|||||||||||
|
Gain on sale of real estate assets (3) |
(0.25 | ) | (0.30 | ) | (0.03 | ) | (0.03 | ) | 0.25 | |||||||||||
|
FFO per share |
1.195 | 1.215 | 1.20 | 1.21 | — | |||||||||||||||
|
Loan (premium accretion) discount amortization, net |
(0.03 | ) | (0.03 | ) | (0.03 | ) | (0.03 | ) | — | |||||||||||
|
CFFO per share |
$ | 1.165 | $ | 1.185 | $ | 1.17 | $ | 1.18 | $ | — | ||||||||||
| Weighted average shares and units (in millions) | 241.6 | 240.2 | (1.4 | ) | ||||||||||||||||
|
(1)
|
This guidance, including the underlying assumptions presented in the table on the following page, constitutes forward-looking information. Actual full year 2025 EPS, FFO, and CFFO could vary significantly from the projections presented. See “Forward-Looking Statements”. Our guidance is based on the key guidance assumptions detailed below. |
|
(2)
|
Represents income from unconsolidated real estate entities we recognized in the third quarter of 2025 with respect to the Metropolis joint venture sale discussed above.
|
|
(3)
|
Change in EPS at the midpoint is due to fewer gains on sale from lower disposition volume. Gain on sale of real estate assets includes gains on sale (loss on impairment) recognized with respect to the one property in Birmingham, Alabama sold in the first quarter of 2025 and two of the properties classified as held for sale as of September 30, 2025.
|
2025 Guidance Assumptions(1)
Our key guidance assumptions for 2025 are enumerated below. See the definitions at the end of this release for further information regarding our same-store definitions.
|
Same-Store Portfolio: |
Previous 2025 Outlook: |
Current 2025 Outlook: |
Change at Midpoint |
|||
|
Number of properties/units |
105 properties / 30,502 units |
105 properties / 30,502 units |
— | |||
|
Property revenue growth |
1.5% - 1.9% |
1.6% - 1.8% |
— | |||
|
Controllable operating expense growth |
1.7% - 2.1% |
1.8% - 2.0% |
— | |||
|
Real estate tax and insurance expense growth |
(0.8%) - 0.0% |
(0.6%) - (0.2%) |
— | |||
|
Total operating expense growth |
0.7% - 1.3% |
0.9% - 1.1% |
— | |||
|
NOI growth |
1.7% - 2.5% |
1.9% - 2.3% |
— | |||
|
Corporate Expenses ($ in millions) |
||||||
|
General and administrative & property management expenses |
$54 - $56 |
$54 - $55 |
$(0.5) |
|||
|
Interest expense(2) |
$88 - $90 |
$86 - $88 |
$(2.0) | |||
|
Transaction/Investment Volume(3) ($ in millions) |
||||||
|
Acquisition volume |
$580 - $650 |
$215 |
$(400) | |||
|
Disposition volume |
$385 - $435 |
$161 |
$(249) | |||
|
Capital Expenditures ($ in millions) |
||||||
|
Recurring |
$27 - $29 |
$29 - $30 |
$1.5 | |||
|
Value add renovation program |
$38 - $42 |
$38 - $40 |
$(1.0) | |||
|
Non-recurring and revenue enhancing |
$43 - $47 |
$46 - $48 |
$2.0 | |||
|
Development |
$5 - $6 |
$5 - $6 |
— |
|
(1) |
This guidance, including the underlying assumptions, constitutes forward-looking information. Actual results could vary significantly from the projections presented. We undertake no duty to update the assumptions used in our guidance except as required by law. See “Forward-Looking Statements.” |
|
(2) |
Interest expense includes amortization of deferred financing costs but excludes loan premium accretion, net. As a result of purchase accounting we recorded loan premiums, net, that are accreted into and reduce GAAP interest expense over the remaining term of the associated debt. However, loan premium accretion is excluded from CFFO. |
|
(3) |
Acquisition volume reflects one property in Indianapolis, Indiana that was acquired for $59.5 million in the first quarter of 2025 and two properties in Orlando, Florida that were acquired for an aggregate purchase price of $155.0 million in the third quarter of 2025. Disposition volume reflects the sale of one property sold for $111.0 million in the first quarter of 2025 and approximately $50.0 million related to the expected disposition of one of the three properties classified as held for sale as of September 30, 2025. We continue to evaluate our portfolio for capital recycling opportunities so actual acquisition and disposition volume could vary significantly from our projections. |
See the schedules at the end of this earnings release for selected financial information for IRT.
Non-GAAP Financial Measures and Definitions
We disclose the following non-GAAP financial measures in this earnings release: FFO, CFFO, NOI and Adjusted EBITDA. Included at the end of this release are definitions of these non-GAAP financial measures and a reconciliation of our reported net income to our FFO and CFFO, a reconciliation of our same-store NOI to our reported net income, a reconciliation of our Adjusted EBITDA to net income, and management’s rationales for the usefulness of each of these and other non-GAAP financial measures used in this release.
Conference Call
All interested parties can listen to the live conference call webcast at 9:00 AM ET on Thursday, October 30, 2025 from the investor relations section of the IRT website at www.irtliving.com or by dialing 1.888.440.3307, access code 1963990. For those who are not available to listen to the live call, the replay will be available shortly following the live call from the investor relations section of IRT’s website until the next earnings release. A replay of the conference call can also be accessed telephonically until Thursday, November 6, 2025 by dialing 1.800.770.2030, access code 1963990.
Supplemental Information
We produce supplemental information that includes details regarding the performance of the portfolio, financial information, non-GAAP financial measures, same-store portfolio information and other useful information for investors. The supplemental information is available via our website, www.irtliving.com, through the "Investor Relations" section.
About Independence Realty Trust, Inc.
Independence Realty Trust, Inc. (NYSE: IRT), an S&P 400 MidCap Company, is a real estate investment trust (“REIT”) that owns and operates multifamily communities, across non-gateway U.S. markets. IRT’s investment strategy is focused on gaining scale near major employment centers within key amenity rich submarkets that offer good school districts and high-quality retail. IRT’s main objective is to provide attractive risk-adjusted returns to shareholders through diligent portfolio management, strong operational performance, and a consistent return on capital through distributions and capital appreciation. More information may be found on the Company’s website, www.irtliving.com.
Forward-Looking Statements
This release contains certain forward-looking statements within the meaning of Section 27A of the Securities Act of 1933, as amended, and Section 21E of the Securities Exchange Act of 1934, as amended. Such forward-looking statements include, but are not limited to, our earnings guidance, and the assumptions underlying such guidance, our planned use of remaining proceeds from our sales of common stock on a forward basis, our expectations with respect to the three properties which are classified as held for sale, our expectations with respect to our new joint venture and our expectations with respect to future acquisitions and dispositions. All statements in this release that address financial and operating performance, events or developments that we expect or anticipate will occur or be achieved in the future are forward-looking statements.
Our forward-looking statements are not guarantees of future performance and involve estimates, projections, forecasts and assumptions, including as to matters that are not within our control, and are subject to risks and uncertainties including, without limitation, risks and uncertainties related to changes in market demand for rental apartment homes and pricing pressures, including from competitors, that could lead to declines in occupancy and rent levels, uncertainty and volatility in capital and credit markets, including changes that reduce availability, and increase costs, of capital, unexpected changes in our intention or ability to repay certain debt prior to maturity, increased costs on account of inflation, increased competition in the labor market, our planned use of the remaining proceeds from our sales of common stock on a forward basis, inability to sell certain assets, including those assets designated as held for sale, within the time frames or at the pricing levels expected, failure to achieve expected benefits from the redeployment of proceeds from asset sales, inability or failure to achieve anticipated benefits from future acquisitions and dispositions, delays in completing, and cost overruns incurred in connection with, our value add initiatives and failure to achieve rent increases and occupancy levels on account of the value add initiatives, unexpected impairments or impairments in excess of our estimates, increased regulations generally and specifically on the rental housing market, including legislation that may regulate rents and fees or delay or limit our ability to evict non-paying residents, risks endemic to real estate and the real estate industry generally, the impact of potential outbreaks of infectious diseases and measures intended to prevent the spread or address the effects thereof, economic conditions, including inflation and recessionary conditions and their related impacts on the real estate industry, U.S. and global trade policies and tensions, including changes in, or the imposition of, tariffs and/or trade barriers and the economic impacts, volatility and uncertainty resulting therefrom, the impacts from the U.S. government shutdown, the effects of natural and other disasters, unknown or unexpected liabilities, including the cost of legal proceedings, costs and disruptions as the result of a cybersecurity incident or other technology disruption, including but not limited to a third party's unauthorized access to our data or the data of our residents, unexpected capital needs, inability to obtain appropriate insurance coverages at reasonable rates, or at all, or losses from catastrophes in excess of our insurance coverages, and share price fluctuations. Please refer to the documents filed by us with the SEC, including specifically the “Risk Factors” sections of our Annual Report on Form 10-K for the year ended December 31, 2024 and our Quarterly Report on Form 10-Q for the quarter ended March 31,2025, and our other filings with the SEC, which identify additional factors that could cause actual results to differ from those contained in forward-looking statements.
These forward-looking statements are based upon the beliefs and expectations of our management at the time of this release and our actual results may differ materially from the expectations, intentions, beliefs, plans or predictions of the future expressed or implied by such forward-looking statements. We undertake no obligation to update these forward-looking statements to reflect events or circumstances after the date hereof or to reflect the occurrence of unanticipated events, except as may be required by law.
FINANCIAL & OPERATING HIGHLIGHTS
Dollars in thousands, except per share data
|
For the Three Months Ended |
||||||||||||||||||||
|
September 30, 2025 |
June 30, 2025 |
March 31, 2025 |
December 31, 2024 |
September 30, 2024 |
||||||||||||||||
|
Selected Financial Information: |
||||||||||||||||||||
|
Operating Statistics: |
||||||||||||||||||||
|
Net income (loss) available to common shares |
$ | 6,893 | $ | 8,046 | $ | 8,354 | $ | (1,001 | ) | $ | 12,365 | |||||||||
|
Earnings per share -- diluted |
$ | 0.03 | $ | 0.03 | $ | 0.04 | $ | 0.00 | $ | 0.05 | ||||||||||
|
Rental and other property revenue |
$ | 166,888 | $ | 161,891 | $ | 160,905 | $ | 160,617 | $ | 159,860 | ||||||||||
|
Property operating expenses |
$ | 61,699 | $ | 60,935 | $ | 59,263 | $ | 54,195 | $ | 60,538 | ||||||||||
|
NOI |
$ | 105,189 | $ | 100,956 | $ | 101,642 | $ | 106,422 | $ | 99,322 | ||||||||||
|
NOI margin |
63.0 | % | 62.4 | % | 63.2 | % | 66.3 | % | 62.1 | % | ||||||||||
|
Adjusted EBITDA |
$ | 92,643 | $ | 87,556 | $ | 85,748 | $ | 94,533 | $ | 87,453 | ||||||||||
|
FFO per share |
$ | 0.30 | $ | 0.28 | $ | 0.28 | $ | 0.33 | $ | 0.30 | ||||||||||
|
CFFO per share |
$ | 0.29 | $ | 0.28 | $ | 0.27 | $ | 0.32 | $ | 0.29 | ||||||||||
|
Dividends per share |
$ | 0.17 | $ | 0.17 | $ | 0.16 | $ | 0.16 | $ | 0.16 | ||||||||||
|
CFFO payout ratio |
58.6 | % | 60.7 | % | 59.3 | % | 50.0 | % | 55.2 | % | ||||||||||
|
Portfolio Data: |
||||||||||||||||||||
|
Total gross assets |
$ | 7,058,026 | $ | 6,874,320 | $ | 6,844,114 | $ | 6,882,296 | $ | 6,733,864 | ||||||||||
|
Total number of operating properties (a) |
115 | 113 | 113 | 113 | 110 | |||||||||||||||
|
Total units (a) |
33,818 | 33,175 | 33,175 | 33,615 | 32,670 | |||||||||||||||
|
Portfolio period end occupancy (a) |
95.1 | % | 95.2 | % | 94.9 | % | 95.4 | % | 95.5 | % | ||||||||||
|
Portfolio average occupancy (a) |
94.9 | % | 95.2 | % | 95.3 | % | 95.4 | % | 95.4 | % | ||||||||||
|
Portfolio average effective monthly rent, per unit (a) |
$ | 1,593 | $ | 1,582 | $ | 1,583 | $ | 1,572 | $ | 1,571 | ||||||||||
|
Same-store portfolio period end occupancy (b) |
95.6 | % | 95.4 | % | 95.1 | % | 95.5 | % | 95.6 | % | ||||||||||
|
Same-store portfolio average occupancy (b) |
95.3 | % | 95.3 | % | 95.5 | % | 95.5 | % | 95.4 | % | ||||||||||
|
Same-store portfolio average effective monthly rent, per unit (b) |
$ | 1,581 | $ | 1,575 | $ | 1,573 | $ | 1,571 | $ | 1,571 | ||||||||||
|
Capitalization: |
||||||||||||||||||||
|
Total debt (c) |
$ | 2,296,202 | $ | 2,249,801 | $ | 2,253,957 | $ | 2,333,683 | $ | 2,286,694 | ||||||||||
|
Common share price, period end |
$ | 16.39 | $ | 17.69 | $ | 21.23 | $ | 19.84 | $ | 20.50 | ||||||||||
|
Market equity capitalization |
$ | 4,016,286 | $ | 4,241,203 | $ | 5,088,933 | $ | 4,697,713 | $ | 4,736,212 | ||||||||||
|
Total market capitalization |
$ | 6,312,488 | $ | 6,491,004 | $ | 7,342,890 | $ | 7,031,396 | $ | 7,022,906 | ||||||||||
|
Total debt/total gross assets |
32.5 | % | 32.7 | % | 32.9 | % | 33.9 | % | 34.0 | % | ||||||||||
|
Net debt to adjusted EBITDA (d) |
6.0x |
6.3x |
6.3x |
5.9x |
6.3x |
|||||||||||||||
|
Interest coverage |
4.5x |
4.7x |
4.4x |
4.8x |
4.8x |
|||||||||||||||
|
Common shares and OP Units: |
||||||||||||||||||||
|
Shares outstanding |
239,103,283 | 233,809,823 | 233,763,180 | 230,838,249 | 225,093,090 | |||||||||||||||
|
OP units outstanding |
5,941,643 | 5,941,643 | 5,941,643 | 5,941,643 | 5,941,643 | |||||||||||||||
|
Common shares and OP units outstanding |
245,044,926 | 239,751,466 | 239,704,823 | 236,779,892 | 231,034,733 | |||||||||||||||
|
Weighted average common shares and OP units |
239,576,189 | 239,438,276 | 236,665,226 | 230,893,621 | 230,762,299 | |||||||||||||||
|
(a) |
Excludes our development projects Destination at Arista and Flatirons Flats, as applicable. See the definitions at the end of this release. Destination at Arista no longer met the definition of a development project in the fourth quarter of 2024. |
|
(b) |
Same-store portfolio consists of 105 properties, which represent 30,502 units. |
|
(c) |
Includes indebtedness associated with real estate held for sale, as applicable. |
|
(d) |
Reflects net debt to Adjusted EBITDA, which is annualized for each period presented, including adjustments for the timing of acquisitions and dispositions impacting quarterly EBITDA. For the five quarters ended September 30, 2025, net debt to Adjusted EBITDA excluding adjustments for timing of acquisitions and dispositions was 6.1x, 6.3x, 6.4x, 6.0x, and 6.4x, respectively. |
Dollars in thousands, except per share data
|
As of |
||||||||||||||||||||
|
September 30, 2025 |
June 30, 2025 |
March 31, 2025 |
December 31, 2024 |
September 30, 2024 |
||||||||||||||||
|
Assets: |
||||||||||||||||||||
|
Real estate held for investment, at cost |
$ | 6,571,161 | $ | 6,356,830 | $ | 6,442,303 | $ | 6,363,936 | $ | 6,341,504 | ||||||||||
|
Less: accumulated depreciation |
(861,370 | ) | (810,042 | ) | (789,619 | ) | (740,957 | ) | (715,702 | ) | ||||||||||
|
Real estate held for investment, net |
5,709,791 | 5,546,788 | 5,652,684 | 5,622,979 | 5,625,802 | |||||||||||||||
|
Real estate held for sale |
107,182 | 119,875 | — | 110,112 | — | |||||||||||||||
|
Real estate under development |
65,628 | 91,849 | 117,802 | 116,861 | 115,221 | |||||||||||||||
|
Cash and cash equivalents |
23,290 | 19,491 | 29,055 | 21,228 | 17,611 | |||||||||||||||
|
Restricted cash |
27,639 | 23,035 | 19,279 | 22,224 | 30,632 | |||||||||||||||
|
Investment in unconsolidated real estate entities |
93,965 | 106,920 | 101,640 | 91,975 | 95,393 | |||||||||||||||
|
Other assets |
47,771 | 38,389 | 39,330 | 39,596 | 43,566 | |||||||||||||||
|
Derivative assets |
11,873 | 14,635 | 20,084 | 29,300 | 18,821 | |||||||||||||||
|
Intangible assets, net |
5,453 | 1,644 | 3,620 | 3,644 | 1,158 | |||||||||||||||
|
Total assets |
$ | 6,092,592 | $ | 5,962,626 | $ | 5,983,494 | $ | 6,057,919 | $ | 5,948,204 | ||||||||||
|
Liabilities and Equity: |
||||||||||||||||||||
|
Indebtedness, net |
$ | 2,296,202 | $ | 2,249,801 | $ | 2,253,957 | $ | 2,274,651 | $ | 2,286,694 | ||||||||||
|
Indebtedness associated with real estate held for sale, net |
— | — | — | 59,032 | — | |||||||||||||||
|
Accounts payable and accrued expenses |
119,513 | 105,576 | 86,399 | 94,670 | 119,286 | |||||||||||||||
|
Accrued interest payable |
10,265 | 7,815 | 10,136 | 8,630 | 6,858 | |||||||||||||||
|
Dividends payable |
41,592 | 40,691 | 37,865 | 37,827 | 36,906 | |||||||||||||||
|
Derivative liabilities |
737 | 233 | 29 | — | 1,779 | |||||||||||||||
|
Other liabilities |
9,023 | 7,550 | 7,929 | 8,035 | 7,966 | |||||||||||||||
|
Total liabilities |
2,477,332 | 2,411,666 | 2,396,315 | 2,482,845 | 2,459,489 | |||||||||||||||
|
Equity: |
||||||||||||||||||||
|
Shareholders' Equity: |
||||||||||||||||||||
|
Preferred shares, $0.01 par value per share |
— | — | — | — | — | |||||||||||||||
|
Common shares, $0.01 par value per share |
2,391 | 2,338 | 2,337 | 2,308 | 2,250 | |||||||||||||||
|
Additional paid in capital |
4,022,309 | 3,920,436 | 3,918,718 | 3,868,006 | 3,755,311 | |||||||||||||||
|
Accumulated other comprehensive income |
9,095 | 12,038 | 17,308 | 26,065 | 13,835 | |||||||||||||||
|
Accumulated deficit |
(548,319 | ) | (514,623 | ) | (482,973 | ) | (454,104 | ) | (416,223 | ) | ||||||||||
|
Total shareholders' equity |
3,485,476 | 3,420,189 | 3,455,390 | 3,442,275 | 3,355,173 | |||||||||||||||
|
Noncontrolling Interests |
129,784 | 130,771 | 131,789 | 132,799 | 133,542 | |||||||||||||||
|
Total equity |
3,615,260 | 3,550,960 | 3,587,179 | 3,575,074 | 3,488,715 | |||||||||||||||
|
Total liabilities and equity |
$ | 6,092,592 | $ | 5,962,626 | $ | 5,983,494 | $ | 6,057,919 | $ | 5,948,204 | ||||||||||
STATEMENTS OF OPERATIONS, FFO & CFFO
TRAILING FIVE QUARTERS
(Dollars in thousands, except per share data)
|
For the Three Months Ended |
||||||||||||||||||||
|
September 30, 2025 |
June 30, 2025 |
March 31, 2025 |
December 31, 2024 |
September 30, 2024 |
||||||||||||||||
|
Revenue: |
||||||||||||||||||||
|
Rental and other property revenue |
$ | 166,888 | $ | 161,891 | $ | 160,905 | $ | 160,617 | $ | 159,860 | ||||||||||
|
Other revenue |
250 | 297 | 338 | 346 | 275 | |||||||||||||||
|
Total revenue |
167,138 | 162,188 | 161,243 | 160,963 | 160,135 | |||||||||||||||
|
Expenses: |
||||||||||||||||||||
|
Property operating expenses |
61,699 | 60,935 | 59,263 | 54,195 | 60,538 | |||||||||||||||
|
Property management expenses |
7,891 | 7,715 | 7,826 | 7,379 | 7,379 | |||||||||||||||
|
General and administrative expenses (a) |
4,905 | 5,982 | 8,406 | 4,856 | 4,765 | |||||||||||||||
|
Depreciation and amortization expense |
61,735 | 59,794 | 58,725 | 57,742 | 55,261 | |||||||||||||||
|
Casualty losses (gains), net |
419 | 255 | (115 | ) | (80 | ) | 1,249 | |||||||||||||
|
Total expenses |
136,649 | 134,681 | 134,105 | 124,092 | 129,192 | |||||||||||||||
|
Interest expense |
(20,455 | ) | (18,773 | ) | (19,348 | ) | (19,770 | ) | (18,308 | ) | ||||||||||
|
(Loss on impairment) gain on sale of real estate assets, net |
(12,841 | ) | — | 1,496 | (20,928 | ) | 688 | |||||||||||||
|
Loss on extinguishment of debt |
— | — | (67 | ) | (2 | ) | — | |||||||||||||
|
Other loss |
(12 | ) | — | (103 | ) | — | — | |||||||||||||
|
Income (loss) from investments in unconsolidated real estate entities |
9,814 | (562 | ) | (590 | ) | 2,729 | (703 | ) | ||||||||||||
|
Net income (loss) |
$ | 6,995 | $ | 8,172 | $ | 8,526 | $ | (1,100 | ) | $ | 12,620 | |||||||||
|
(Income) loss allocated to noncontrolling interests |
(102 | ) | (126 | ) | (172 | ) | 99 | (255 | ) | |||||||||||
|
Net income (loss) available to common shares |
$ | 6,893 | $ | 8,046 | $ | 8,354 | $ | (1,001 | ) | $ | 12,365 | |||||||||
|
Earnings per share - basic |
$ | 0.03 | $ | 0.03 | $ | 0.04 | $ | 0.00 | $ | 0.05 | ||||||||||
|
Weighted-average shares outstanding - Basic |
233,634,546 | 233,496,633 | 230,723,583 | 224,951,978 | 224,820,656 | |||||||||||||||
|
Earnings per share - diluted |
$ | 0.03 | $ | 0.03 | $ | 0.04 | $ | 0.00 | $ | 0.05 | ||||||||||
|
Weighted-average shares outstanding - Diluted |
234,283,170 | 234,131,752 | 231,828,484 | 224,951,978 | 226,058,400 | |||||||||||||||
|
Funds From Operations (FFO): |
||||||||||||||||||||
|
Net income (loss) |
$ | 6,995 | $ | 8,172 | $ | 8,526 | $ | (1,100 | ) | $ | 12,620 | |||||||||
|
Add-Back (Deduct): |
||||||||||||||||||||
|
Real estate depreciation and amortization |
61,282 | 59,372 | 58,308 | 57,332 | 54,880 | |||||||||||||||
|
Our share of real estate depreciation and amortization from investments in unconsolidated real estate entities |
375 | 457 | 457 | (212 | ) | 598 | ||||||||||||||
|
Loss on impairment of real estate assets, net, excluding prepayment gains |
12,841 | — | 73 | 20,928 | 160 | |||||||||||||||
|
Gain on sale of real estate associated with unconsolidated real estate entities |
(10,389 | ) | — | — | — | — | ||||||||||||||
|
FFO |
$ | 71,104 | $ | 68,001 | $ | 67,364 | $ | 76,948 | $ | 68,258 | ||||||||||
|
FFO per share |
$ | 0.30 | $ | 0.28 | $ | 0.28 | $ | 0.33 | $ | 0.30 | ||||||||||
|
CORE Funds From Operations (CFFO): |
||||||||||||||||||||
|
FFO |
$ | 71,104 | $ | 68,001 | $ | 67,364 | $ | 76,948 | $ | 68,258 | ||||||||||
|
Add-Back (Deduct): |
||||||||||||||||||||
|
Other depreciation and amortization |
453 | 422 | 417 | 410 | 382 | |||||||||||||||
|
Casualty losses (gains), net |
419 | 255 | (115 | ) | (80 | ) | 1,249 | |||||||||||||
|
Loan (premium accretion) discount amortization, net |
(2,001 | ) | (1,985 | ) | (2,029 | ) | (2,249 | ) | (2,239 | ) | ||||||||||
|
Prepayment (gains) penalties on asset dispositions |
— | — | (1,569 | ) | — | (848 | ) | |||||||||||||
|
Loss on extinguishment of debt |
— | — | 67 | 2 | — | |||||||||||||||
|
Other loss |
12 | — | 103 | — | — | |||||||||||||||
|
CFFO |
$ | 69,987 | $ | 66,693 | $ | 64,238 | $ | 75,031 | $ | 66,802 | ||||||||||
|
CFFO per share |
$ | 0.29 | $ | 0.28 | $ | 0.27 | $ | 0.32 | $ | 0.29 | ||||||||||
|
Weighted-average shares and units outstanding |
239,576,189 | 239,438,276 | 236,665,226 | 230,893,621 | 230,762,299 | |||||||||||||||
| (a) | Included in the three months ended March 31, 2025 is $2.8 million of stock compensation expense recorded with respect to stock awards granted to retirement eligible employees. |
STATEMENTS OF OPERATIONS, FFO & CFFO
Dollars in thousands, except per share data
|
For the Three Months Ended |
For the Nine Months Ended |
|||||||||||||||
|
September 30, |
September 30, |
|||||||||||||||
|
2025 |
2024 |
2025 |
2024 |
|||||||||||||
|
Revenue: |
||||||||||||||||
|
Rental and other property revenue |
$ | 166,888 | $ | 159,860 | $ | 489,684 | $ | 478,296 | ||||||||
|
Other revenue |
250 | 275 | 885 | 776 | ||||||||||||
|
Total revenue |
167,138 | 160,135 | 490,569 | 479,072 | ||||||||||||
|
Expenses: |
||||||||||||||||
|
Property operating expenses |
61,699 | 60,538 | 181,897 | 181,393 | ||||||||||||
|
Property management expenses |
7,891 | 7,379 | 23,433 | 22,544 | ||||||||||||
|
General and administrative expenses |
4,905 | 4,765 | 19,293 | 19,389 | ||||||||||||
|
Depreciation and amortization expense |
61,735 | 55,261 | 180,256 | 163,112 | ||||||||||||
|
Casualty losses |
419 | 1,249 | 559 | 4,015 | ||||||||||||
|
Total expenses |
136,649 | 129,192 | 405,438 | 390,453 | ||||||||||||
|
Interest expense |
(20,455 | ) | (18,308 | ) | (58,575 | ) | (56,371 | ) | ||||||||
|
(Loss on impairment) gain on sale of real estate assets, net |
(12,841 | ) | 688 | (11,344 | ) | 11,066 | ||||||||||
|
(Loss) gain on extinguishment of debt |
— | — | (67 | ) | 203 | |||||||||||
|
Other loss |
(12 | ) | — | (115 | ) | (1 | ) | |||||||||
|
Income (loss) from investments in unconsolidated real estate entities |
9,814 | (703 | ) | 8,663 | (2,382 | ) | ||||||||||
|
Net income |
6,995 | 12,620 | 23,693 | 41,134 | ||||||||||||
|
Income allocated to noncontrolling interests |
(102 | ) | (255 | ) | (401 | ) | (840 | ) | ||||||||
|
Net income available to common shares |
$ | 6,893 | $ | 12,365 | $ | 23,292 | $ | 40,294 | ||||||||
|
Earnings per share - basic |
$ | 0.03 | $ | 0.05 | $ | 0.10 | $ | 0.18 | ||||||||
|
Weighted-average shares outstanding - Basic |
233,634,546 | 224,820,656 | 232,628,917 | 224,747,327 | ||||||||||||
|
Earnings per share - diluted |
$ | 0.03 | $ | 0.05 | $ | 0.10 | $ | 0.18 | ||||||||
|
Weighted-average shares outstanding - Diluted |
234,283,170 | 226,058,400 | 233,403,810 | 225,530,265 | ||||||||||||
|
Funds From Operations (FFO): |
||||||||||||||||
|
Net income |
$ | 6,995 | $ | 12,620 | $ | 23,693 | $ | 41,134 | ||||||||
|
Add-Back (Deduct): |
||||||||||||||||
|
Real estate depreciation and amortization |
61,282 | 54,880 | 178,964 | 162,028 | ||||||||||||
|
Our share of real estate depreciation and amortization from investments in unconsolidated real estate entities |
375 | 598 | 1,289 | 1,793 | ||||||||||||
|
Loss on impairment (gain on sale) of real estate assets, net, excluding prepayment gains |
12,841 | 160 | 12,914 | (9,113 | ) | |||||||||||
|
Gain on sale of real estate associated with unconsolidated real estate entities |
(10,389 | ) | — | (10,389 | ) | — | ||||||||||
|
FFO |
$ | 71,104 | $ | 68,258 | $ | 206,471 | $ | 195,842 | ||||||||
|
FFO per share |
$ | 0.30 | $ | 0.30 | $ | 0.87 | $ | 0.85 | ||||||||
|
CORE Funds From Operations (CFFO): |
||||||||||||||||
|
FFO |
$ | 71,104 | $ | 68,258 | $ | 206,471 | $ | 195,842 | ||||||||
|
Add-Back (Deduct): |
||||||||||||||||
|
Other depreciation and amortization |
453 | 382 | 1,292 | 1,083 | ||||||||||||
|
Casualty losses |
419 | 1,249 | 559 | 4,015 | ||||||||||||
|
Loan (premium accretion) discount amortization, net |
(2,001 | ) | (2,239 | ) | (6,015 | ) | (6,918 | ) | ||||||||
|
Prepayment (gains) penalties on asset dispositions |
— | (848 | ) | (1,570 | ) | (1,953 | ) | |||||||||
|
Loss (gain) on extinguishment of debt |
— | — | 67 | (203 | ) | |||||||||||
|
Other loss |
12 | — | 115 | 1 | ||||||||||||
|
CFFO |
$ | 69,987 | $ | 66,802 | $ | 200,919 | $ | 191,867 | ||||||||
|
CFFO per share |
$ | 0.29 | $ | 0.29 | $ | 0.84 | $ | 0.83 | ||||||||
|
Weighted-average shares and units outstanding |
239,576,189 | 230,762,299 | 238,570,560 | 230,689,617 | ||||||||||||
ADJUSTED EBITDA RECONCILIATION AND COVERAGE RATIO
Dollars in thousands
|
Three Months Ended |
||||||||||||||||||||
|
September 30, 2025 |
June 30, 2025 |
March 31, 2025 |
December 31, 2024 |
September 30, 2024 |
||||||||||||||||
|
Net income (loss) |
$ | 6,995 | $ | 8,172 | $ | 8,526 | $ | (1,100 | ) | $ | 12,620 | |||||||||
|
Add-Back (Deduct): |
||||||||||||||||||||
|
Interest expense |
20,455 | 18,773 | 19,348 | 19,770 | 18,308 | |||||||||||||||
|
Depreciation and amortization |
61,735 | 59,794 | 58,725 | 57,742 | 55,261 | |||||||||||||||
|
Casualty losses (gains), net |
419 | 255 | (115 | ) | (80 | ) | 1,249 | |||||||||||||
|
Loss on impairment (gain on sale) of real estate assets, net |
12,841 | — | (1,496 | ) | 20,928 | (688 | ) | |||||||||||||
|
Loss on extinguishment of debt |
— | — | 67 | 2 | — | |||||||||||||||
|
(Income) loss from investments in unconsolidated real estate entities |
(9,814 | ) | 562 | 590 | (2,729 | ) | 703 | |||||||||||||
|
Other loss |
12 | — | 103 | — | — | |||||||||||||||
|
Adjusted EBITDA |
$ | 92,643 | $ | 87,556 | $ | 85,748 | $ | 94,533 | $ | 87,453 | ||||||||||
|
INTEREST COST: |
||||||||||||||||||||
|
Interest expense |
$ | 20,455 | $ | 18,773 | $ | 19,348 | $ | 19,770 | $ | 18,308 | ||||||||||
|
INTEREST COVERAGE: |
4.5x |
4.7x |
4.4x |
4.8x |
4.8x |
|||||||||||||||
|
For the Three Months Ended September 30, |
For the Nine Months Ended September 30, |
|||||||||||||||
|
2025 |
2024 |
2025 |
2024 |
|||||||||||||
|
Net income |
$ | 6,995 | $ | 12,620 | $ | 23,693 | $ | 41,134 | ||||||||
|
Add-Back (Deduct): |
||||||||||||||||
|
Interest expense |
20,455 | 18,308 | 58,575 | 56,371 | ||||||||||||
|
Depreciation and amortization |
61,735 | 55,261 | 180,256 | 163,112 | ||||||||||||
|
Casualty losses |
419 | 1,249 | 559 | 4,015 | ||||||||||||
|
Loss on impairment (gain on sale) of real estate assets, net |
12,841 | (688 | ) | 11,344 | (11,066 | ) | ||||||||||
|
Loss (gain) on extinguishment of debt |
— | — | 67 | (203 | ) | |||||||||||
|
(Income) loss from investments in unconsolidated real estate entities |
(9,814 | ) | 703 | (8,663 | ) | 2,382 | ||||||||||
|
Other loss |
12 | — | 115 | 1 | ||||||||||||
|
Adjusted EBITDA |
$ | 92,643 | $ | 87,453 | $ | 265,946 | $ | 255,746 | ||||||||
|
INTEREST COST: |
||||||||||||||||
|
Interest expense |
$ | 20,455 | $ | 18,308 | $ | 58,575 | $ | 56,371 | ||||||||
|
INTEREST COVERAGE: |
4.5x |
4.8x |
4.5x |
4.5x |
||||||||||||
SAME-STORE PORTFOLIO NET OPERATING INCOME & NOI BRIDGE (a) (b)
TRAILING FIVE QUARTERS
Dollars in thousands, except per unit data
|
For the Three Months Ended |
||||||||||||||||||||
|
September 30, 2025 |
June 30, 2025 |
March 31, 2025 |
December 31, 2024 |
September 30, 2024 |
||||||||||||||||
|
Revenue: |
||||||||||||||||||||
|
Rental and other property revenue |
$ | 150,573 | $ | 148,113 | $ | 146,856 | $ | 147,071 | $ | 148,430 | ||||||||||
|
Property Operating Expenses: |
||||||||||||||||||||
|
Real estate taxes |
16,280 | 17,655 | 18,338 | 16,240 | 16,129 | |||||||||||||||
|
Property insurance |
3,107 | 3,381 | 3,716 | 3,719 | 3,713 | |||||||||||||||
|
Personnel expenses |
12,954 | 11,891 | 11,495 | 11,575 | 12,739 | |||||||||||||||
|
Utilities |
7,635 | 7,063 | 7,458 | 7,394 | 7,607 | |||||||||||||||
|
Repairs and maintenance |
5,393 | 5,659 | 4,186 | 2,240 | 6,023 | |||||||||||||||
|
Contract services |
5,788 | 5,825 | 5,500 | 5,140 | 5,616 | |||||||||||||||
|
Advertising expenses |
2,455 | 2,552 | 1,835 | 1,627 | 2,226 | |||||||||||||||
|
Other expenses |
1,571 | 1,620 | 1,564 | 1,492 | 1,537 | |||||||||||||||
|
Total property operating expenses |
55,183 | 55,646 | 54,092 | 49,427 | 55,590 | |||||||||||||||
|
Same-store portfolio NOI |
$ | 95,390 | $ | 92,467 | $ | 92,764 | $ | 97,644 | $ | 92,840 | ||||||||||
|
Same-store portfolio NOI margin |
63.4 | % | 62.4 | % | 63.2 | % | 66.4 | % | 62.5 | % | ||||||||||
|
Average occupancy |
95.3 | % | 95.3 | % | 95.5 | % | 95.5 | % | 95.4 | % | ||||||||||
|
Average effective monthly rent, per unit |
$ | 1,581 | $ | 1,575 | $ | 1,573 | $ | 1,571 | $ | 1,571 | ||||||||||
|
For the Three Months Ended |
||||||||||||||||||||
|
September 30, 2025 |
June 30, 2025 |
March 31, 2025 |
December 31, 2024 |
September 30, 2024 |
||||||||||||||||
|
Rental and other property revenue |
||||||||||||||||||||
|
Same-store portfolio |
$ | 150,573 | $ | 148,113 | $ | 146,856 | $ | 147,071 | $ | 148,430 | ||||||||||
|
Non same-store portfolio |
16,315 | 13,778 | 14,049 | 13,546 | 11,430 | |||||||||||||||
|
Total rental and other property revenue |
166,888 | 161,891 | 160,905 | 160,617 | 159,860 | |||||||||||||||
|
Property operating expenses |
||||||||||||||||||||
|
Same-store portfolio |
55,183 | 55,646 | 54,092 | 49,427 | 55,590 | |||||||||||||||
|
Non same-store portfolio |
6,516 | 5,289 | 5,171 | 4,768 | 4,948 | |||||||||||||||
|
Total property operating expenses |
61,699 | 60,935 | 59,263 | 54,195 | 60,538 | |||||||||||||||
|
NOI |
||||||||||||||||||||
|
Same-store portfolio |
95,390 | 92,467 | 92,764 | 97,644 | 92,840 | |||||||||||||||
|
Non same-store portfolio |
9,799 | 8,489 | 8,878 | 8,778 | 6,482 | |||||||||||||||
|
Total property NOI |
$ | 105,189 | $ | 100,956 | $ | 101,642 | $ | 106,422 | $ | 99,322 | ||||||||||
|
(a) |
Same-store portfolio consists of 105 properties, which represent 30,502 units. |
|
(b) |
See the definitions at the end of this release for a reconciliation from GAAP net income (loss) to NOI. |
SAME-STORE PORTFOLIO NET OPERATING INCOME (a)
THREE AND nine MONTHS ENDED September 30, 2025 AND 2024
Dollars in thousands, except per unit data
|
For the Three Months Ended |
For the Nine Months Ended |
|||||||||||||||||||||||
|
September 30, |
September 30, |
|||||||||||||||||||||||
|
2025 |
2024 |
% change |
2025 |
2024 |
% change |
|||||||||||||||||||
|
Revenue: |
||||||||||||||||||||||||
|
Rental and other property revenue |
$ | 150,573 | $ | 148,430 | 1.4 | % | $ | 445,542 | $ | 438,359 | 1.6 | % | ||||||||||||
|
Property Operating Expenses: |
||||||||||||||||||||||||
|
Real estate taxes |
16,280 | 16,129 | 0.9 | % | 52,274 | 52,294 | 0.0 | % | ||||||||||||||||
|
Property insurance |
3,107 | 3,713 | (16.3 | )% | 10,203 | 11,455 | (10.9 | )% | ||||||||||||||||
|
Personnel expenses |
12,954 | 12,739 | 1.7 | % | 36,341 | 36,493 | (0.4 | )% | ||||||||||||||||
|
Utilities |
7,635 | 7,607 | 0.4 | % | 22,155 | 21,529 | 2.9 | % | ||||||||||||||||
|
Repairs and maintenance |
5,393 | 6,023 | (10.5 | )% | 15,238 | 16,632 | (8.4 | )% | ||||||||||||||||
|
Contract services |
5,788 | 5,616 | 3.1 | % | 17,113 | 16,136 | 6.1 | % | ||||||||||||||||
|
Advertising expenses |
2,455 | 2,226 | 10.3 | % | 6,842 | 5,753 | 18.9 | % | ||||||||||||||||
|
Other expenses |
1,571 | 1,537 | 2.2 | % | 4,755 | 4,717 | 0.8 | % | ||||||||||||||||
|
Total property operating expenses |
55,183 | 55,590 | (0.7 | )% | 164,921 | 165,009 | (0.1 | )% | ||||||||||||||||
|
Same-store portfolio NOI |
$ | 95,390 | $ | 92,840 | 2.7 | % | $ | 280,621 | $ | 273,350 | 2.7 | % | ||||||||||||
|
Same-store portfolio NOI margin |
63.4 | % | 62.5 | % | 0.9 | % | 63.0 | % | 62.4 | % | 0.6 | % | ||||||||||||
|
Average occupancy |
95.3 | % | 95.4 | % | (0.1 | )% | 95.4 | % | 95.0 | % | 0.4 | % | ||||||||||||
|
Average effective monthly rent, per unit |
$ | 1,581 | $ | 1,571 | 0.6 | % | $ | 1,577 | $ | 1,563 | 0.9 | % | ||||||||||||
|
(a) |
Same-store portfolio consists of 105 properties, which represent 30,502 units. |
SAME-STORE PORTFOLIO NET OPERATING INCOME BY MARKET
THREE MONTHS ENDED September 30, 2025
Dollars in thousands, except rent per unit
|
Rental and Other Property Revenue |
Property Operating Expenses |
Net Operating Income |
Average Occupancy |
Average Effective Monthly Rent per Unit |
||||||||||||||||||||||||||||||||||||||||||||||||||||||||||||||
|
Market |
Number of Properties |
Units |
2025 |
2024 |
% Change |
2025 |
2024 |
% Change |
2025 |
2024 |
% Change |
2025 |
2024 |
% Change |
2025 |
2024 |
% Change |
|||||||||||||||||||||||||||||||||||||||||||||||||
|
Atlanta, GA |
13 | 5,180 | $ | 25,006 | $ | 24,635 | 1.5 | % | $ | 9,868 | $ | 10,405 | (5.2 | )% | $ | 15,135 | $ | 14,229 | 6.4 | % | 93.5 | % | 94.2 | % | (0.7 | )% | $ | 1,593 | $ | 1,599 | (0.4 | )% | ||||||||||||||||||||||||||||||||||
|
Dallas, TX |
14 | 4,007 | 22,635 | 22,422 | 0.9 | % | 8,535 | 8,120 | 5.1 | % | 14,101 | 14,302 | (1.4 | )% | 96.0 | % | 95.6 | % | 0.4 | % | 1,809 | 1,816 | (0.4 | )% | ||||||||||||||||||||||||||||||||||||||||||
|
Columbus, OH |
10 | 2,510 | 12,014 | 11,528 | 4.2 | % | 4,605 | 4,490 | 2.6 | % | 7,409 | 7,039 | 5.3 | % | 95.5 | % | 95.0 | % | 0.5 | % | 1,539 | 1,493 | 3.1 | % | ||||||||||||||||||||||||||||||||||||||||||
|
Nashville, TN |
5 | 1,508 | 7,712 | 7,640 | 0.9 | % | 1,978 | 2,560 | (22.7 | )% | 5,734 | 5,079 | 12.9 | % | 95.4 | % | 95.5 | % | (0.1 | )% | 1,626 | 1,637 | (0.7 | )% | ||||||||||||||||||||||||||||||||||||||||||
|
Oklahoma City, OK |
8 | 2,147 | 8,665 | 8,427 | 2.8 | % | 2,978 | 2,936 | 1.4 | % | 5,687 | 5,491 | 3.6 | % | 96.4 | % | 95.6 | % | 0.8 | % | 1,254 | 1,225 | 2.4 | % | ||||||||||||||||||||||||||||||||||||||||||
|
Indianapolis, IN |
7 | 1,979 | 9,006 | 8,910 | 1.1 | % | 3,444 | 3,110 | 10.7 | % | 5,562 | 5,800 | (4.1 | )% | 95.8 | % | 96.6 | % | (0.8 | )% | 1,458 | 1,420 | 2.7 | % | ||||||||||||||||||||||||||||||||||||||||||
|
Tampa-St. Petersburg, FL |
5 | 1,503 | 8,830 | 8,449 | 4.5 | % | 3,275 | 2,967 | 10.4 | % | 5,555 | 5,482 | 1.3 | % | 96.0 | % | 93.6 | % | 2.4 | % | 1,869 | 1,839 | 1.6 | % | ||||||||||||||||||||||||||||||||||||||||||
|
Raleigh - Durham, NC |
6 | 1,690 | 8,209 | 8,147 | 0.8 | % | 3,013 | 3,073 | (2.0 | )% | 5,196 | 5,074 | 2.4 | % | 95.5 | % | 95.6 | % | (0.1 | )% | 1,544 | 1,559 | (1.0 | )% | ||||||||||||||||||||||||||||||||||||||||||
|
Denver, CO |
5 | 1,093 | 6,164 | 6,261 | (1.5 | )% | 2,038 | 2,070 | (1.5 | )% | 4,126 | 4,191 | (1.6 | )% | 95.3 | % | 96.4 | % | (1.1 | )% | 1,786 | 1,796 | (0.6 | )% | ||||||||||||||||||||||||||||||||||||||||||
|
Houston, TX |
5 | 1,308 | 6,073 | 5,987 | 1.4 | % | 2,386 | 2,660 | (10.3 | )% | 3,687 | 3,328 | 10.8 | % | 95.6 | % | 96.8 | % | (1.2 | )% | 1,466 | 1,439 | 1.9 | % | ||||||||||||||||||||||||||||||||||||||||||
|
Lexington, KY |
3 | 886 | 4,266 | 4,047 | 5.4 | % | 1,249 | 1,223 | 2.1 | % | 3,017 | 2,824 | 6.8 | % | 96.9 | % | 96.8 | % | 0.1 | % | 1,484 | 1,397 | 6.2 | % | ||||||||||||||||||||||||||||||||||||||||||
|
Huntsville, AL |
4 | 1,051 | 4,712 | 4,951 | (4.8 | )% | 1,747 | 1,744 | 0.2 | % | 2,965 | 3,207 | (7.5 | )% | 95.3 | % | 96.0 | % | (0.7 | )% | 1,418 | 1,481 | (4.3 | )% | ||||||||||||||||||||||||||||||||||||||||||
|
Memphis, TN |
3 | 883 | 4,184 | 4,267 | (1.9 | )% | 1,332 | 1,491 | (10.7 | )% | 2,852 | 2,776 | 2.7 | % | 95.3 | % | 94.7 | % | 0.6 | % | 1,559 | 1,599 | (2.5 | )% | ||||||||||||||||||||||||||||||||||||||||||
|
Charlotte, NC |
3 | 714 | 3,671 | 3,787 | (3.1 | )% | 1,230 | 1,201 | 2.4 | % | 2,440 | 2,586 | (5.6 | )% | 95.7 | % | 95.9 | % | (0.2 | )% | 1,681 | 1,732 | (2.9 | )% | ||||||||||||||||||||||||||||||||||||||||||
|
Louisville, KY |
3 | 794 | 3,502 | 3,412 | 2.6 | % | 1,380 | 1,355 | 1.8 | % | 2,122 | 2,057 | 3.2 | % | 96.2 | % | 96.3 | % | (0.1 | )% | 1,332 | 1,282 | 3.9 | % | ||||||||||||||||||||||||||||||||||||||||||
|
Cincinnati, OH |
2 | 542 | 3,043 | 2,899 | 5.0 | % | 1,115 | 1,100 | 1.4 | % | 1,929 | 1,798 | 7.3 | % | 96.6 | % | 97.2 | % | (0.6 | )% | 1,693 | 1,621 | 4.4 | % | ||||||||||||||||||||||||||||||||||||||||||
|
Charleston, SC |
2 | 518 | 2,841 | 2,762 | 2.9 | % | 1,141 | 1,196 | (4.6 | )% | 1,701 | 1,566 | 8.6 | % | 94.0 | % | 96.2 | % | (2.2 | )% | 1,788 | 1,722 | 3.8 | % | ||||||||||||||||||||||||||||||||||||||||||
|
Myrtle Beach, SC - Wilmington, NC |
3 | 628 | 2,657 | 2,720 | (2.3 | )% | 972 | 939 | 3.5 | % | 1,686 | 1,782 | (5.4 | )% | 95.5 | % | 95.6 | % | (0.1 | )% | 1,388 | 1,410 | (1.6 | )% | ||||||||||||||||||||||||||||||||||||||||||
|
Greenville, SC |
1 | 702 | 2,765 | 2,663 | 3.8 | % | 1,083 | 1,056 | 2.6 | % | 1,682 | 1,607 | 4.7 | % | 92.3 | % | 95.2 | % | (2.9 | )% | 1,321 | 1,303 | 1.4 | % | ||||||||||||||||||||||||||||||||||||||||||
|
Orlando, FL |
1 | 297 | 1,719 | 1,690 | 1.7 | % | 671 | 686 | (2.2 | )% | 1,048 | 1,004 | 4.4 | % | 96.7 | % | 96.0 | % | 0.7 | % | 1,811 | 1,785 | 1.5 | % | ||||||||||||||||||||||||||||||||||||||||||
|
Austin, TX |
1 | 256 | 1,454 | 1,406 | 3.4 | % | 564 | 596 | (5.4 | )% | 890 | 810 | 9.9 | % | 95.2 | % | 94.2 | % | 1.0 | % | 1,797 | 1,801 | (0.2 | )% | ||||||||||||||||||||||||||||||||||||||||||
|
San Antonio, TX |
1 | 306 | 1,445 | 1,420 | 1.8 | % | 579 | 612 | (5.4 | )% | 866 | 808 | 7.2 | % | 96.7 | % | 97.4 | % | (0.7 | )% | 1,462 | 1,456 | 0.4 | % | ||||||||||||||||||||||||||||||||||||||||||
|
Total / Weighted Average |
105 | 30,502 | $ | 150,573 | $ | 148,430 | 1.4 | % | $ | 55,183 | $ | 55,590 | (0.7 | )% | $ | 95,390 | $ | 92,840 | 2.7 | % | 95.3 | % | 95.4 | % | (0.1 | )% | $ | 1,581 | $ | 1,571 | 0.6 | % | ||||||||||||||||||||||||||||||||||
SAME-STORE PORTFOLIO NET OPERATING INCOME BY MARKET
nine MONTHS ENDED September 30, 2025
Dollars in thousands, except rent per unit
|
Rental and Other Property Revenue |
Property Operating Expenses |
Net Operating Income |
Average Occupancy |
Average Effective Monthly Rent per Unit |
||||||||||||||||||||||||||||||||||||||||||||||||||||||||||||||
|
Market |
Number of Properties |
Units |
2025 |
2024 |
% Change |
2025 |
2024 |
% Change |
2025 |
2024 |
% Change |
2025 |
2024 |
% Change |
2025 |
2024 |
% Change |
|||||||||||||||||||||||||||||||||||||||||||||||||
|
Atlanta, GA |
13 | 5,180 | $ | 73,228 | $ | 72,710 | 0.7 | % | $ | 28,875 | $ | 29,215 | (1.2 | )% | $ | 44,351 | $ | 43,496 | 2.0 | % | 93.5 | % | 93.5 | % | 0.0 | % | $ | 1,592 | $ | 1,610 | (1.1 | )% | ||||||||||||||||||||||||||||||||||
|
Dallas, TX |
14 | 4,007 | 67,163 | 66,628 | 0.8 | % | 25,557 | 25,714 | (0.6 | )% | 41,606 | 40,914 | 1.7 | % | 96.0 | % | 95.2 | % | 0.8 | % | 1,812 | 1,816 | (0.2 | )% | ||||||||||||||||||||||||||||||||||||||||||
|
Columbus, OH |
10 | 2,510 | 35,594 | 33,553 | 6.1 | % | 13,881 | 12,988 | 6.9 | % | 21,714 | 20,566 | 5.6 | % | 95.7 | % | 94.9 | % | 0.8 | % | 1,529 | 1,458 | 4.9 | % | ||||||||||||||||||||||||||||||||||||||||||
|
Oklahoma City, OK |
8 | 2,147 | 25,485 | 24,514 | 4.0 | % | 8,639 | 8,432 | 2.5 | % | 16,846 | 16,082 | 4.8 | % | 96.1 | % | 95.2 | % | 0.9 | % | 1,248 | 1,206 | 3.5 | % | ||||||||||||||||||||||||||||||||||||||||||
|
Indianapolis, IN |
7 | 1,979 | 26,737 | 26,268 | 1.8 | % | 10,164 | 9,858 | 3.1 | % | 16,573 | 16,410 | 1.0 | % | 95.7 | % | 96.1 | % | (0.4 | )% | 1,455 | 1,398 | 4.1 | % | ||||||||||||||||||||||||||||||||||||||||||
|
Tampa-St. Petersburg, FL |
5 | 1,503 | 26,066 | 24,930 | 4.6 | % | 9,522 | 9,134 | 4.2 | % | 16,543 | 15,795 | 4.7 | % | 96.0 | % | 92.8 | % | 3.2 | % | 1,859 | 1,836 | 1.3 | % | ||||||||||||||||||||||||||||||||||||||||||
|
Nashville, TN |
5 | 1,508 | 22,793 | 22,711 | 0.4 | % | 7,237 | 7,737 | (6.5 | )% | 15,556 | 14,974 | 3.9 | % | 95.7 | % | 95.1 | % | 0.6 | % | 1,620 | 1,635 | (0.9 | )% | ||||||||||||||||||||||||||||||||||||||||||
|
Raleigh - Durham, NC |
6 | 1,690 | 24,352 | 24,100 | 1.0 | % | 9,115 | 9,032 | 0.9 | % | 15,238 | 15,068 | 1.1 | % | 95.1 | % | 94.9 | % | 0.2 | % | 1,548 | 1,551 | (0.2 | )% | ||||||||||||||||||||||||||||||||||||||||||
|
Denver, CO |
5 | 1,093 | 18,365 | 18,456 | (0.5 | )% | 5,739 | 5,790 | (0.9 | )% | 12,626 | 12,666 | (0.3 | )% | 95.0 | % | 96.4 | % | (1.4 | )% | 1,802 | 1,768 | 1.9 | % | ||||||||||||||||||||||||||||||||||||||||||
|
Houston, TX |
5 | 1,308 | 17,897 | 17,673 | 1.3 | % | 7,381 | 7,979 | (7.5 | )% | 10,517 | 9,694 | 8.5 | % | 96.3 | % | 95.7 | % | 0.6 | % | 1,443 | 1,433 | 0.7 | % | ||||||||||||||||||||||||||||||||||||||||||
|
Huntsville, AL |
4 | 1,051 | 14,238 | 14,655 | (2.8 | )% | 5,219 | 5,174 | 0.9 | % | 9,019 | 9,482 | (4.9 | )% | 95.5 | % | 95.4 | % | 0.1 | % | 1,432 | 1,486 | (3.6 | )% | ||||||||||||||||||||||||||||||||||||||||||
|
Lexington, KY |
3 | 886 | 12,472 | 11,791 | 5.8 | % | 3,653 | 3,659 | (0.2 | )% | 8,819 | 8,132 | 8.4 | % | 96.7 | % | 97.0 | % | (0.3 | )% | 1,451 | 1,360 | 6.7 | % | ||||||||||||||||||||||||||||||||||||||||||
|
Memphis, TN |
3 | 883 | 12,687 | 12,697 | (0.1 | )% | 4,161 | 4,452 | (6.5 | )% | 8,526 | 8,245 | 3.4 | % | 95.1 | % | 94.6 | % | 0.5 | % | 1,581 | 1,590 | (0.6 | )% | ||||||||||||||||||||||||||||||||||||||||||
|
Charlotte, NC |
3 | 714 | 11,116 | 11,369 | (2.2 | )% | 3,642 | 3,597 | 1.3 | % | 7,473 | 7,772 | (3.8 | )% | 95.8 | % | 95.4 | % | 0.4 | % | 1,701 | 1,741 | (2.3 | )% | ||||||||||||||||||||||||||||||||||||||||||
|
Louisville, KY |
3 | 794 | 10,339 | 9,977 | 3.6 | % | 4,055 | 3,978 | 1.9 | % | 6,284 | 5,999 | 4.8 | % | 96.4 | % | 95.8 | % | 0.6 | % | 1,308 | 1,266 | 3.3 | % | ||||||||||||||||||||||||||||||||||||||||||
|
Cincinnati, OH |
2 | 542 | 8,879 | 8,499 | 4.5 | % | 3,284 | 3,204 | 2.5 | % | 5,595 | 5,294 | 5.7 | % | 96.7 | % | 96.2 | % | 0.5 | % | 1,663 | 1,603 | 3.7 | % | ||||||||||||||||||||||||||||||||||||||||||
|
Myrtle Beach, SC - Wilmington, NC |
3 | 628 | 7,998 | 8,151 | (1.9 | )% | 2,803 | 2,721 | 3.0 | % | 5,195 | 5,430 | (4.3 | )% | 95.2 | % | 95.2 | % | 0.0 | % | 1,387 | 1,411 | (1.7 | )% | ||||||||||||||||||||||||||||||||||||||||||
|
Charleston, SC |
2 | 518 | 8,402 | 8,204 | 2.4 | % | 3,342 | 3,478 | (3.9 | )% | 5,061 | 4,725 | 7.1 | % | 94.8 | % | 96.2 | % | (1.4 | )% | 1,771 | 1,704 | 3.9 | % | ||||||||||||||||||||||||||||||||||||||||||
|
Greenville, SC |
1 | 702 | 8,061 | 7,948 | 1.4 | % | 3,153 | 3,104 | 1.6 | % | 4,908 | 4,844 | 1.3 | % | 93.0 | % | 94.3 | % | (1.3 | )% | 1,290 | 1,306 | (1.2 | )% | ||||||||||||||||||||||||||||||||||||||||||
|
Orlando, FL |
1 | 297 | 5,103 | 4,993 | 2.2 | % | 2,007 | 2,146 | (6.5 | )% | 3,096 | 2,847 | 8.7 | % | 96.5 | % | 94.6 | % | 1.9 | % | 1,805 | 1,794 | 0.6 | % | ||||||||||||||||||||||||||||||||||||||||||
|
Austin, TX |
1 | 256 | 4,283 | 4,239 | 1.0 | % | 1,736 | 1,788 | (2.9 | )% | 2,547 | 2,451 | 3.9 | % | 95.5 | % | 94.6 | % | 0.9 | % | 1,796 | 1,804 | (0.4 | )% | ||||||||||||||||||||||||||||||||||||||||||
|
San Antonio, TX |
1 | 306 | 4,284 | 4,293 | (0.2 | )% | 1,756 | 1,829 | (4.0 | )% | 2,528 | 2,464 | 2.6 | % | 97.3 | % | 96.9 | % | 0.4 | % | 1,447 | 1,469 | (1.5 | )% | ||||||||||||||||||||||||||||||||||||||||||
|
Total/Weighted Average |
105 | 30,502 | $ | 445,542 | $ | 438,359 | 1.6 | % | $ | 164,921 | $ | 165,009 | (0.1 | )% | $ | 280,621 | $ | 273,350 | 2.7 | % | 95.4 | % | 95.0 | % | 0.4 | % | $ | 1,577 | $ | 1,563 | 0.9 | % | ||||||||||||||||||||||||||||||||||
CONSOLIDATED PROPERTY PORTFOLIO (a)
NET OPERATING INCOME EXPOSURE BY MARKET
Dollars in thousands, except rent per unit
|
For the Three Months Ended |
||||||||||||||||||||||||||||
|
September 30, 2025 |
||||||||||||||||||||||||||||
|
Market |
Number of Properties |
Units |
Gross Real Estate Assets |
Period of Occupancy |
Average Effective Monthly Rent per Unit |
NOI |
% of NOI |
|||||||||||||||||||||
|
Atlanta, GA |
13 | 5,180 | $ | 1,127,199 | 95.0 | % | $ | 1,582 | $ | 15,136 | 14.4 | % | ||||||||||||||||
|
Dallas, TX |
14 | 4,007 | 894,828 | 96.0 | % | 1,811 | 14,101 | 13.4 | % | |||||||||||||||||||
|
Columbus, OH |
10 | 2,510 | 385,920 | 96.0 | % | 1,538 | 7,409 | 7.2 | % | |||||||||||||||||||
|
Tampa-St. Petersburg, FL |
6 | 1,791 | 398,604 | 95.7 | % | 1,924 | 6,823 | 6.5 | % | |||||||||||||||||||
|
Indianapolis, IN |
8 | 2,259 | 360,891 | 95.0 | % | 1,477 | 6,387 | 6.1 | % | |||||||||||||||||||
|
Denver, CO (a)(b)(c) |
7 | 1,722 | 489,720 | 93.5 | % | 1,811 | 6,303 | 6.0 | % | |||||||||||||||||||
|
Nashville, TN |
5 | 1,508 | 379,015 | 96.0 | % | 1,617 | 5,734 | 5.5 | % | |||||||||||||||||||
|
Oklahoma City, OK |
8 | 2,147 | 345,498 | 96.7 | % | 1,260 | 5,687 | 5.4 | % | |||||||||||||||||||
|
Raleigh - Durham, NC |
6 | 1,690 | 258,498 | 94.2 | % | 1,544 | 5,196 | 4.9 | % | |||||||||||||||||||
|
Memphis, TN (c) |
4 | 1,383 | 160,635 | 90.7 | % | 1,478 | 3,860 | 3.7 | % | |||||||||||||||||||
|
Houston, TX |
5 | 1,308 | 217,545 | 96.9 | % | 1,446 | 3,687 | 3.5 | % | |||||||||||||||||||
|
Orlando, FL |
4 | 1,260 | 282,928 | 89.0 | % | 1,899 | 3,551 | 3.4 | % | |||||||||||||||||||
|
Charlotte, NC |
4 | 1,014 | 263,359 | 95.4 | % | 1,672 | 3,498 | 3.3 | % | |||||||||||||||||||
|
Lexington, KY |
3 | 886 | 167,612 | 97.7 | % | 1,485 | 3,017 | 2.9 | % | |||||||||||||||||||
|
Louisville, KY (c) |
4 | 1,150 | 143,874 | 95.3 | % | 1,367 | 2,981 | 2.8 | % | |||||||||||||||||||
|
Huntsville, AL |
4 | 1,051 | 242,661 | 95.4 | % | 1,416 | 2,942 | 2.8 | % | |||||||||||||||||||
|
Cincinnati, OH |
2 | 542 | 127,053 | 97.4 | % | 1,676 | 1,929 | 1.8 | % | |||||||||||||||||||
|
Charleston, SC |
2 | 518 | 83,676 | 95.3 | % | 1,776 | 1,701 | 1.6 | % | |||||||||||||||||||
|
Myrtle Beach, SC - Wilmington, NC |
3 | 628 | 69,636 | 96.2 | % | 1,387 | 1,686 | 1.6 | % | |||||||||||||||||||
|
Greenville, SC |
1 | 702 | 127,593 | 95.1 | % | 1,282 | 1,682 | 1.6 | % | |||||||||||||||||||
|
Austin, TX |
1 | 256 | 61,425 | 94.1 | % | 1,806 | 890 | 0.8 | % | |||||||||||||||||||
|
San Antonio, TX |
1 | 306 | 57,685 | 97.7 | % | 1,440 | 866 | 0.8 | % | |||||||||||||||||||
|
Total / Weighted Average |
115 | 33,818 | $ | 6,645,855 | 95.1 | % | $ | 1,593 | $ | 105,066 | 100.0 | % | ||||||||||||||||
|
(a) |
Excludes our development project Flatiron Flats. See the definitions at the end of this release. |
|
(b) |
Includes properties in our Fort Collins, CO and Colorado Springs, CO markets. |
| (c) | Includes one property that was held for sale as of September 30, 2025. |
PROJECT LIFE TO DATE AS OF September 30, 2025
| Total | Total Units To Be | Units | Units | Rent Premium | % Rent | Renovation Costs per Unit (b) | ROI - Interior Costs | ROI - Total Costs | ||||||||||||||||||||||||||||||||||||
|
Market |
Properties |
Renovated |
Complete |
Leased |
(a) |
Increase |
Interior |
Exterior |
Total |
(c) |
(c) |
|||||||||||||||||||||||||||||||||
|
ONGOING |
||||||||||||||||||||||||||||||||||||||||||||
|
Atlanta, GA |
8 | 3,678 | 1,619 | 1,599 | $ | 226 | 16.6 | % | $ | 18,594 | $ | 2,815 | $ | 21,409 | 14.6 | % | 12.7 | % | ||||||||||||||||||||||||||
|
Dallas, TX |
7 | 1,925 | 851 | 858 | 300 | 20.7 | % | 19,651 | 2,316 | 21,967 | 18.3 | % | 16.4 | % | ||||||||||||||||||||||||||||||
|
Oklahoma City, OK |
5 | 1,430 | 688 | 681 | 183 | 18.2 | % | 17,288 | 2,204 | 19,492 | 12.7 | % | 11.2 | % | ||||||||||||||||||||||||||||||
|
Columbus, OH |
4 | 1,098 | 742 | 741 | 252 | 20.1 | % | 15,267 | 1,431 | 16,698 | 19.8 | % | 18.1 | % | ||||||||||||||||||||||||||||||
|
Denver, CO |
2 | 492 | 164 | 161 | 284 | 22.0 | % | 14,231 | 3,089 | 17,320 | 23.9 | % | 19.7 | % | ||||||||||||||||||||||||||||||
|
Raleigh-Durham, NC |
2 | 489 | 63 | 51 | 264 | 19.3 | % | 19,334 | 2,669 | 22,003 | 16.4 | % | 14.4 | % | ||||||||||||||||||||||||||||||
|
Indianapolis, IN |
2 | 460 | 19 | 25 | 254 | 17.6 | % | 19,833 | 2,783 | 22,616 | 15.4 | % | 13.5 | % | ||||||||||||||||||||||||||||||
|
Lexington, KY |
1 | 436 | 164 | 163 | 352 | 29.8 | % | 17,792 | 2,038 | 19,830 | 23.8 | % | 21.3 | % | ||||||||||||||||||||||||||||||
|
Nashville, TN |
1 | 418 | 325 | 328 | 177 | 12.9 | % | 17,378 | 1,321 | 18,699 | 12.2 | % | 11.3 | % | ||||||||||||||||||||||||||||||
|
Tampa-St. Petersburg, FL |
1 | 348 | 287 | 279 | 323 | 22.2 | % | 16,946 | 1,875 | 18,821 | 22.9 | % | 20.6 | % | ||||||||||||||||||||||||||||||
|
Charleston, SC |
1 | 274 | 38 | 41 | 287 | 16.3 | % | 19,214 | 4,562 | 23,776 | 17.9 | % | 14.5 | % | ||||||||||||||||||||||||||||||
|
Total / Weighted Average |
34 | 11,048 | 4,960 | 4,927 | $ | 246 | 18.7 | % | $ | 17,770 | $ | 2,442 | $ | 20,212 | 16.6 | % | 14.6 | % | ||||||||||||||||||||||||||
|
COMPLETED (d) |
||||||||||||||||||||||||||||||||||||||||||||
|
Memphis, TN |
3 | 1,053 | 1,012 | 1,007 | 240 | 22.8 | % | 13,324 | 916 | 14,240 | 21.6 | % | 20.2 | % | ||||||||||||||||||||||||||||||
|
Atlanta, GA |
3 | 978 | 941 | 933 | 210 | 20.3 | % | 9,166 | 1,139 | 10,305 | 27.5 | % | 24.5 | % | ||||||||||||||||||||||||||||||
|
Tampa-St. Petersburg, FL |
3 | 888 | 865 | 866 | 277 | 21.4 | % | 14,197 | 1,327 | 15,524 | 23.4 | % | 21.4 | % | ||||||||||||||||||||||||||||||
|
Columbus, OH |
3 | 763 | 720 | 717 | 205 | 22.4 | % | 10,482 | 666 | 11,148 | 23.5 | % | 22.1 | % | ||||||||||||||||||||||||||||||
|
Louisville, KY |
2 | 728 | 728 | 785 | 215 | 24.1 | % | 15,658 | 2,173 | 17,831 | 16.4 | % | 14.4 | % | ||||||||||||||||||||||||||||||
|
Raleigh-Durham, NC |
2 | 646 | 598 | 596 | 197 | 17.5 | % | 15,379 | 1,585 | 16,964 | 15.4 | % | 13.9 | % | ||||||||||||||||||||||||||||||
|
Dallas, TX |
1 | 300 | 256 | 254 | 277 | 19.1 | % | 19,670 | 2,152 | 21,822 | 16.9 | % | 15.2 | % | ||||||||||||||||||||||||||||||
|
Wilmington, NC |
1 | 288 | 288 | 287 | 77 | 7.6 | % | 8,118 | 56 | 8,174 | 11.4 | % | 11.3 | % | ||||||||||||||||||||||||||||||
|
Austin, TX |
1 | 256 | 218 | 216 | 255 | 17.6 | % | 18,924 | 1,486 | 20,410 | 16.1 | % | 15.0 | % | ||||||||||||||||||||||||||||||
|
Indianapolis, IN |
1 | 236 | 205 | 204 | 255 | 23.5 | % | 15,690 | 1,484 | 17,174 | 19.5 | % | 17.8 | % | ||||||||||||||||||||||||||||||
|
Oklahoma City, OK |
1 | 197 | 168 | 166 | 188 | 22.4 | % | 17,737 | 1,443 | 19,180 | 12.8 | % | 11.8 | % | ||||||||||||||||||||||||||||||
|
Total / Weighted Average |
21 | 6,333 | 5,999 | 6,031 | 222 | 20.8 | % | 13,373 | 1,271 | $ | 14,644 | 19.9 | % | 18.2 | % | |||||||||||||||||||||||||||||
|
Grand Total/Weighted Average |
55 | 17,381 | 10,959 | 10,958 | $ | 233 | 19.9 | % | $ | 15,357 | $ | 1,860 | $ | 17,217 | 18.2 | % | 16.2 | % | ||||||||||||||||||||||||||
|
(a) |
See the definitions section for a full description of Rent Premium. The weighted average Rent Premium including the impact of concessions was $224. |
|
(b) |
See the definitions section for a full description of Renovation Costs per Unit. |
|
(c) |
See the definitions section for a full description of ROI. ROI-Interior costs using rent premium including the impact of concessions was 17.5%. ROI-Total costs using rent premium including the impact of concessions was 15.6%. |
|
(d) |
We consider value add projects completed when over 85% of the property’s units to be renovated have been completed. We continue to renovate remaining unrenovated units as leases expire until we complete 100% of the property’s units. |
INVESTMENT AND DEVELOPMENT ACTIVITY
Dollars in thousands except per unit amounts
|
2025 ACQUISITIONS |
|
Property |
Market |
Units |
Date Acquired |
Purchase Price |
Price per Unit |
Average Rent per Unit at Acquisition |
|||||||||||||||
|
Autumn Breeze |
Indianapolis, Indiana |
280 |
2/27/2025 |
$ | 59,500 | $ | 213 | $ | 1,548 | ||||||||||||
|
3030 at Apopka |
Orlando, Florida |
240 |
7/31/2025 |
60,250 | 251 | 1,885 | |||||||||||||||
|
M2 at Millenia 700 |
Orlando, Florida |
403 |
8/14/2025 |
94,750 | 235 | 1,835 | |||||||||||||||
|
Total |
923 | $ | 214,500 | $ | 232 | $ | 1,761 | ||||||||||||||
|
2025 DISPOSITIONS |
|
Property |
Location |
Units |
Date Sold |
Sale Price |
Price per Unit |
Average Rent per Unit at Disposition |
Q1 2025 Gain on Sale (a) |
|
||||||||||||||||
|
Ridge Crossings |
Birmingham, Alabama |
720 |
2/14/2025 |
$ | 111,000 | $ | 154 | $ | 1,366 | $ | 1,496 | |||||||||||||
|
ASSETS HELD FOR SALE AS OF SEPTEMBER 30, 2025 |
|
Property |
Location |
Quarter Identified as Held for Sale |
Units |
|||
|
Bella Terra at City Center (b) |
Denver, Colorado |
Q2 2025 |
304 |
|||
|
Jamestown at St. Matthews |
Louisville, Kentucky |
Q2 2025 |
356 |
|||
|
Stonebridge Crossings |
Memphis, Tennessee |
Q2 2025 |
500 |
|||
| Total | 1,160 |
|
REAL ESTATE UNDER DEVELOPMENT |
|
Development |
Flatiron Flats (c) |
|
|
Location |
Denver, Colorado |
|
|
Planned Units |
296 |
|
|
Start Date |
4Q 2022 |
|
|
Initial Occupancy |
1Q 2025 |
|
|
Completion Date |
1Q 2025 |
|
|
Projected Stabilization date |
2Q 2026 |
|
|
Total Development Costs |
$114,400 |
|
|
% of Planned Units Delivered as of September 30, 2025 |
100% |
|
| Occupancy % as of October 27, 2025 (d) | 43.2% | |
| Leased % as of October 27, 2025 (d) | 44.9% |
| (a) | During the three months ended December 31, 2024, we recognized a loss on impairment of $20,928. | |
| (b) | During the three months ended September 30, 2025, we recognized a loss on impairment of $12,841. | |
|
(c) |
We will continue to classify this property as a development property since it is in lease-up and has not reached overall occupancy of 90%. |
|
(d) |
Leased % and occupancy % are calculated using the leased or occupied units, as applicable, divided by the total number of units. |
|
INVESTMENTS IN UNCONSOLIDATED REAL ESTATE ENTITIES |
|
Property |
Location |
Units |
Estimated Delivery Date |
Total Construction Budget |
Total Project Debt |
IRT Equity Interest in JV |
Remaining Expected IRT Investment |
Carrying Value of IRT’s Investment |
|||||||||||||||||||||
|
Metropolis at Innsbrook (a) |
Richmond, VA |
402 | — | $ | 85,883 | $ | 59,000 | 84.8 | % | $ | — | $ | - | ||||||||||||||||
|
Views of Music City II (b) |
Nashville, TN |
209 | — | 33,439 | 21,736 | 50.0 | % | — | 5,912 | ||||||||||||||||||||
|
Lakeline Station (c) |
Austin, TX |
378 |
Q3 2025 |
110,551 | 76,500 | 90.0 | % | — | 40,983 | ||||||||||||||||||||
|
The Mustang (d) |
Dallas, TX |
275 | — | 109,583 | 79,447 | 85.0 | % | — | 31,038 | ||||||||||||||||||||
|
Nexton Pine Hollow |
Charleston, SC |
324 | Q2 2027 | 78,949 | 47,191 | 90.0 | % | 12,955 | 16,032 | ||||||||||||||||||||
|
Total |
1,588 | $ | 418,405 | $ | 283,874 | $ | 12,955 | $ | 93,965 | ||||||||||||||||||||
|
(a) |
This 402-unit operating property was sold on July 21, 2025. We received $31.1 million in proceeds from the sale, comprised of a return of our initial investment of $24.5 million and equity proceeds of $6.6 million. We recognized a gain of $10.4 million from this sale. |
|
(b) |
Views of Music City phase II is an operating property. On October 9, 2025, our joint venture partner redeemed our investment in this property, comprised of a return of our initial capital of $5.9 million and a preferred return in the amount of $3.3 million. We recognized the preferred return of $3.3 million in income (loss) from unconsolidated real estate entities in October 2025. Under the terms of our joint venture agreement, we are entitled to the right of first refusal on the sale of the property. |
|
| (c) | Lakeline Station is an operating property consisting of 378 units. We have an open-ended call option that gives us the right to buy the property. |
|
(d) |
The Mustang is an operating property consisting of 275 units. We have an open-ended call option that gives us the right to buy the property. |
Subsequent Investment in Unconsolidated Real Estate Entity
On October 8, 2025, we entered into a joint venture for the development of The Approach, a to-be-built multifamily apartment project comprised of 318 units just outside of Indianapolis, Indiana. We have committed to invest an aggregate of $20.0 million in this joint venture, and, as of October 8, 2025, had funded $1.7 million on account of this commitment.
DEBT SUMMARY AS OF September 30, 2025
Dollars in thousands
|
Amount |
Weighted Average Contractual Rate |
Weighted Average Hedged Effective Rate (a) |
Type |
Weighted Average Maturity (in years) |
||||||||||||||
|
Debt: |
||||||||||||||||||
|
Unsecured revolver (b) |
$ | 206,892 | 5.0 | % | 4.8 | % |
Floating |
3.3 | ||||||||||
|
Unsecured term loans (c) |
600,000 | 5.0 | % | 4.0 | % |
Floating |
1.8 | |||||||||||
|
Secured credit facilities (d) |
584,790 | 4.2 | % | 4.4 | % |
Fixed |
3.2 | |||||||||||
|
Mortgages |
742,890 | 3.9 | % | 4.0 | % |
Fixed |
3.5 | |||||||||||
|
Unsecured notes (e) |
150,000 | 5.4 | % | 5.6 | % |
Fixed |
7.5 | |||||||||||
|
Total Principal |
2,284,572 | 4.5 | % | 4.3 | % | 3.2 | ||||||||||||
|
Loan premiums (discounts), net |
23,863 | |||||||||||||||||
|
Unamortized deferred financing costs |
(12,233 | ) | Credit Ratings: | |||||||||||||||
|
Total Consolidated Debt |
2,296,202 | Agency |
Rating |
Outlook | ||||||||||||||
|
Equity Market Capitalization |
4,016,286 | Fitch |
BBB |
Stable | ||||||||||||||
|
Total Capitalization |
6,312,488 | S&P |
BBB |
Stable | ||||||||||||||
|
(a) |
Represents the weighted average effective interest rates for the three months ended September 30, 2025, including the impact of interest rate swaps and collars, amortization of hedging costs, and deferred financing costs but excluding the impact of loan premium amortization, discount accretion, and interest capitalization. |
| (b) |
Unsecured revolver total capacity is $750,000, of which $206,892 was drawn as of September 30, 2025. The maturity date of the borrowings under the unsecured revolver is January 8, 2029. |
|
|
(c) |
Consists of a (i) $200,000 unsecured term loan with a maturity date of May 18, 2026 and a (ii) $400,000 unsecured term loan with a maturity date of January 28, 2028. |
|
(d) |
Consists of a (i) $508,824 secured credit facility, two tranches of which, in an aggregate principal amount of $468,356, have a maturity date of August 1, 2028 and the third tranche of which, in the principal amount of $40,468, has a maturity date of March 1, 2030 and a (ii) $75,966 secured credit facility with a maturity date of July 1, 2030. |
|
| (e) | Consists of (i) $75,000 aggregate principal amount of unsecured private placement notes with a maturity date of October 1, 2031 and at a fixed annual interest rate of 5.32% and (ii) $75,000 aggregate principal amount of unsecured private placement notes with a maturity date of October 1, 2034 and at a fixed annual interest rate of 5.53%. |
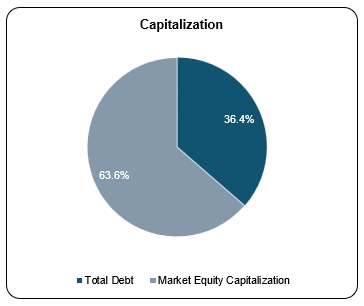 |
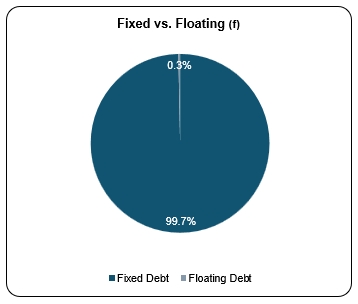 |
|
(f) |
As of September 30, 2025, we maintained the below hedges that have effectively fixed a portion of our floating rate debt. |
|
Hedges: |
Notional |
Start |
End |
Swap Rate |
Floor Rate |
Cap Rate |
||||||||||||||||
|
Swap |
$ | 150,000 |
6/17/2021 |
6/17/2026 |
2.18 | % | — | — | ||||||||||||||
|
Swap |
$ | 150,000 |
5/17/2022 |
5/17/2027 |
0.99 | % | — | — | ||||||||||||||
|
Swap |
$ | 200,000 |
3/17/2023 |
3/17/2030 |
3.39 | % | — | — | ||||||||||||||
|
Collar |
$ | 100,000 |
1/17/2024 |
1/17/2028 |
— | 1.50 | % | 2.50 | % | |||||||||||||
|
Collar |
$ | 100,000 |
11/17/2024 |
1/17/2028 |
— | 1.50 | % | 2.50 | % | |||||||||||||
|
Swap |
$ | 100,000 |
3/17/2025 |
3/17/2026 |
3.96 | % | — | — | ||||||||||||||
|
Forward starting swap |
$ | 150,000 |
6/17/2026 |
6/17/2030 |
3.26 | % | — | — | ||||||||||||||
AS OF September 30, 2025
Dollars in thousands
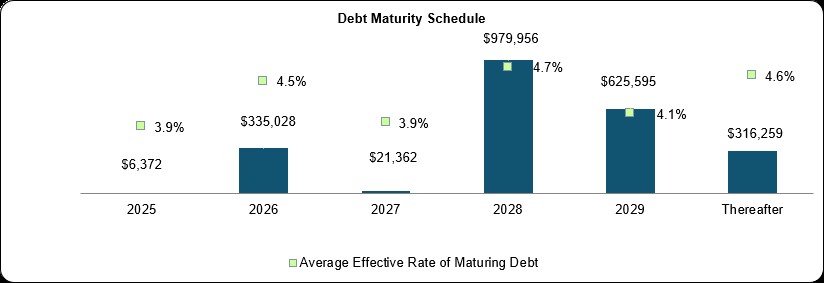
Debt Covenant Summary (a)
|
Requirement |
Actual |
Compliance |
||||
|
Consolidated leverage ratio |
≤ 60% |
30.1% |
Yes |
|||
|
Consolidated fixed charge coverage ratio |
≥ 1.5x |
3.3x |
Yes |
|||
|
Unsecured leverage ratio |
≤ 60% |
28.7% |
Yes |
Encumbered & Unencumbered Statistics (b)
|
Total Units |
% of Total |
Gross Real Estate Assets |
% of Total |
Q3 2025 NOI |
% of Total |
|||||||||||||||||||
|
Unencumbered assets |
22,064 | 65.2 | % | $ | 3,925,014 | 59.1 | % | $ | 68,614 | 65.3 | % | |||||||||||||
|
Encumbered assets |
11,754 | 34.8 | % | 2,720,841 | 40.9 | % | 36,452 | 34.7 | % | |||||||||||||||
| 33,818 | 100.0 | % | $ | 6,645,855 | 100.0 | % | $ | 105,066 | 100.0 | % | ||||||||||||||
|
(a) |
For a complete listing of all debt covenants along with definitions of each covenant calculation see the Fifth Amended, Restated and Consolidated Credit Agreement, which was filed as Exhibit 10.1 of our Form 8-K filed on January 10, 2025. |
|
(b) |
Excludes our development project Flatiron Flats. See the definitions at the end of this release. |
Average Effective Monthly Rent per Unit
Average effective rent per unit represents the average of net rent amounts, after concessions amortized over the life of the lease, divided by the average occupancy (in units) for the period presented. We believe average effective rent is a helpful measurement in evaluating average pricing. This metric, when presented, reflects the average effective rent per month.
Average Occupancy
Average occupancy represents the average occupied units for the reporting period divided by the average of total units available for rent for the reporting period.
Development Property
A development property is a property that is either currently under development or is in lease-up prior to reaching overall occupancy of 90%.
EBITDA and Adjusted EBITDA
Each of EBITDA and Adjusted EBITDA is a non-GAAP financial measure. EBITDA is defined as net income before interest expense including amortization of deferred financing costs, income tax expense, and depreciation and amortization expenses. Adjusted EBITDA is EBITDA before certain other non-cash or non-operating gains or losses related to items such as loss on impairment (gain on sale) of real estate, debt extinguishments and acquisition related debt extinguishment expenses, casualty (gains) losses and income (loss) from investments in unconsolidated real estate entities. We consider each of EBITDA and Adjusted EBITDA to be an appropriate supplemental measure of performance because it eliminates interest, income taxes, depreciation and amortization, and other non-cash or non-operating gains and losses, which permits investors to view income from operations without these non-cash or non-operating items. Our calculation of Adjusted EBITDA differs from the methodology used for calculating Adjusted EBITDA by certain other REITs and, accordingly, our Adjusted EBITDA may not be comparable to Adjusted EBITDA reported by other REITs.
Funds From Operations (“FFO”) and Core Funds From Operations (“CFFO”)
We believe that FFO and CFFO, each of which is a non-GAAP financial measure, are additional appropriate measures of the operating performance of a REIT and us in particular. We compute FFO in accordance with the standards established by the National Association of Real Estate Investment Trusts (“NAREIT”), as net income or loss allocated to common shares (computed in accordance with GAAP), excluding real estate-related depreciation and amortization expense, loss on impairment (gain on sale) of real estate and unconsolidated real estate entities, and the cumulative effect of changes in accounting principles. While our calculation of FFO is in accordance with NAREIT’s definition, it may differ from the methodology for calculating FFO utilized by other REITs and, accordingly, may not be comparable to FFO computations of such other REITs.
CFFO is a computation made by analysts and investors to measure a real estate company’s operating performance by removing the effect of items that do not reflect ongoing property operations, including depreciation and amortization of other items not included in FFO, and other non-cash or non-operating gains or losses related to items such as casualty (gains) losses, loan premium accretion and discount amortization and debt extinguishment costs from the determination of FFO.
Our calculation of CFFO may differ from the methodology used for calculating CFFO by other REITs and, accordingly, our CFFO may not be comparable to CFFO reported by other REITs. Our management utilizes FFO and CFFO as measures of our operating performance, and believe they are also useful to investors, because they facilitate an understanding of our operating performance after adjustment for certain non-cash or non-recurring items that are required by GAAP to be expensed but may not necessarily be indicative of current operating performance and our operating performance between periods. Furthermore, although FFO, CFFO and other supplemental performance measures are defined in various ways throughout the REIT industry, we believe that FFO and CFFO may provide us and our investors with an additional useful measure to compare our financial performance to certain other REITs. Neither FFO nor CFFO is equivalent to net income or cash generated from operating activities determined in accordance with GAAP. Furthermore, FFO and CFFO do not represent amounts available for management’s discretionary use because of needed capital replacement or expansion, debt service obligations or other commitments or uncertainties. Accordingly, FFO and CFFO do not measure whether cash flow is sufficient to fund all of our cash needs, including principal amortization and capital improvements. Neither FFO nor CFFO should be considered as an alternative to net income or any other GAAP measurement as an indicator of our operating performance or as an alternative to cash flow from operating, investing, and financing activities as a measure of our liquidity.
Interest Coverage
Interest coverage is a ratio computed by dividing Adjusted EBITDA by interest expense.
Net Debt
Net debt, a non-GAAP financial measure, equals total consolidated debt less cash and cash equivalents and loan premiums and discounts. The following table provides a reconciliation of total consolidated debt to net debt (dollars in thousands).
|
As of |
||||||||||||||||||||
|
September 30, 2025 |
June 30, 2025 |
March 31, 2025 |
December 31, 2024 |
September 30, 2024 |
||||||||||||||||
|
Total debt |
$ | 2,296,202 | $ | 2,249,801 | $ | 2,253,957 | $ | 2,333,683 | $ | 2,286,694 | ||||||||||
|
Less: cash and cash equivalents |
(23,290 | ) | (19,491 | ) | (29,055 | ) | (21,228 | ) | (17,611 | ) | ||||||||||
|
Less: loan discounts and premiums, net |
(23,863 | ) | (25,469 | ) | (27,454 | ) | (31,721 | ) | (33,970 | ) | ||||||||||
|
Total net debt |
$ | 2,249,049 | $ | 2,204,841 | $ | 2,197,448 | $ | 2,280,734 | $ | 2,235,113 | ||||||||||
We present net debt and net debt to Adjusted EBITDA because management believes it is a useful measure of our credit position and progress toward reducing leverage. The calculation is limited because we may not always be able to use cash to repay debt on a dollar for dollar basis.
Net Operating Income
We believe that Net Operating Income (“NOI”), a non-GAAP financial measure, is a useful measure of our operating performance. We define NOI as total property revenues less total property operating expenses, excluding interest expense, depreciation and amortization, casualty related costs and gains, property management expenses, general and administrative expenses and net gains on sale of assets.
Other REITs may use different methodologies for calculating NOI, and accordingly, our NOI may not be comparable to other REITs. We believe that this measure provides an operating perspective not immediately apparent from GAAP operating income or net income. We use NOI to evaluate our performance on a same-store and non same-store basis because NOI measures the core operations of property performance by excluding corporate level expenses and other items not related to property operating performance and captures trends in rental housing and property operating expenses. However, NOI should only be used as an alternative measure of our financial performance.
A reconciliation from GAAP net income (loss) to NOI is provided below (dollars in thousands):
|
For the Three Months Ended |
||||||||||||||||||||
|
September 30, 2025 |
June 30, 2025 |
March 31, 2025 |
December 31, 2024 |
September 30, 2024 |
||||||||||||||||
|
Net income (loss) |
$ | 6,995 | $ | 8,172 | $ | 8,526 | $ | (1,100 | ) | $ | 12,620 | |||||||||
|
Other revenue |
(250 | ) | (297 | ) | (338 | ) | (346 | ) | (275 | ) | ||||||||||
|
Property management expenses |
7,891 | 7,715 | 7,826 | 7,379 | 7,379 | |||||||||||||||
|
General and administrative expenses |
4,905 | 5,982 | 8,406 | 4,856 | 4,765 | |||||||||||||||
|
Depreciation and amortization expense |
61,735 | 59,794 | 58,725 | 57,742 | 55,261 | |||||||||||||||
|
Casualty losses (gains), net |
419 | 255 | (115 | ) | (80 | ) | 1,249 | |||||||||||||
|
Interest expense |
20,455 | 18,773 | 19,348 | 19,770 | 18,308 | |||||||||||||||
|
Loss on impairment (gain on sale) of real estate assets, net |
12,841 | — | (1,496 | ) | 20,928 | (688 | ) | |||||||||||||
|
Loss on extinguishment of debt |
— | — | 67 | 2 | — | |||||||||||||||
|
Other loss |
12 | — | 103 | — | — | |||||||||||||||
|
(Income) loss from investments in unconsolidated real estate entities |
(9,814 | ) | 562 | 590 | (2,729 | ) | 703 | |||||||||||||
|
NOI |
105,189 | 100,956 | 101,642 | 106,422 | 99,322 | |||||||||||||||
|
Less: Non same-store portfolio NOI |
9,799 | 8,489 | 8,878 | 8,778 | 6,482 | |||||||||||||||
|
Same-store portfolio NOI |
95,390 | 92,467 | 92,764 | 97,644 | 92,840 | |||||||||||||||
Non Same-Store Properties and Non Same-Store Portfolio
Properties that did not meet the definition of a same-store property as of the beginning of the previous year.
Same-Store Properties and Same-Store Portfolio
We review our same-store portfolio at the beginning of each calendar year. Properties are added into the same-store portfolio if they were owned and not a development property at the beginning of the previous year. Properties that are held for sale or have been sold are excluded from the same-store portfolio.
Rent Premium on Value Add Renovations
The rent premium reflects the per unit per month difference between the rental rate on the renovated unit excluding the impact of upfront concessions, if any, and the market rent for an unrenovated unit as of the date presented, as determined by management consistent with its customary rent-setting and evaluation procedures. We believe excluding the impact of upfront concessions from our rental rates when comparing to the market rental rates for unrenovated units makes the comparison most relevant and the resulting premium provides management with an indicator of the increased rent generated by the unit renovation.
Renovation Costs per Unit
Renovation costs per unit includes all costs to renovate the interior units and make certain exterior renovations, including clubhouses and amenities. Interior costs per unit are based on units leased. Exterior costs per unit are based on total units at the community. Excludes overhead costs to support and manage the value add program as those costs relate to the entire program and cannot be allocated to individual projects.
Return on Investment (“ROI”) on Value Add Renovations
ROI is calculated using the Rent Premium per unit per month, multiplied by 12, divided by the interior renovation costs per unit or the total renovation costs, as applicable. We use ROI on value add renovation projects to measure the profitability of a renovation project relative to other projects or relative to other uses of our capital.
Total Gross Assets
Total Gross Assets equals total assets plus accumulated depreciation and accumulated amortization, including fully depreciated or amortized real estate and real estate related assets. The following table provides a reconciliation of total assets to total gross assets (dollars in thousands).
|
As of |
||||||||||||||||||||
|
September 30, 2025 |
June 30, 2025 |
March 31, 2025 |
December 31, 2024 |
September 30, 2024 |
||||||||||||||||
|
Total assets |
$ | 6,092,592 | $ | 5,962,626 | $ | 5,983,494 | $ | 6,057,919 | $ | 5,948,204 | ||||||||||
|
Plus: accumulated depreciation (a) |
890,039 | 838,718 | 789,619 | 753,539 | 715,702 | |||||||||||||||
|
Plus: accumulated amortization |
75,395 | 72,976 | 71,001 | 70,838 | 69,958 | |||||||||||||||
|
Total gross assets |
$ | 7,058,026 | $ | 6,874,320 | $ | 6,844,114 | $ | 6,882,296 | $ | 6,733,864 | ||||||||||
|
(a) |
Includes accumulated depreciation associated with real estate held for sale, as applicable. |